1. Introduction
Due to the economic growth of the society, as the quality of livings relatively improved, the requirements and demand for security of person and public order have increased. The result of the 2019 Safe Cities Index ranking from The Economist Intelligence Unit [
1], which now includes 60 cities in the world, again has indicated a rapid gap in overall levels of safety between the fast urbanizing developing world and the stagnant developed world. Taipei city of Taiwan ranked quite high (22nd) in the index of the report of the world about safe cities. However, Taiwan’s government still faces great challenges from domestic issues [
2]. Also, Ministry of Health and Welfare has definitely explained the key to promote public safety network is how to allocate resources and to upgrade the efficacy (Ministry of Health and Welfare, 2018) [
3]. Also, according to the Ministry of the Interior, Taiwan, to guarantee citizens a safe and secure environment, as indicated in “Public Safety” of major policies. The Ministry of the Interior has continuously focused on upgrading and maintaining public order; enhancing the criminal prediction research of high-risk groups, to completely improve the efficacy of prevention. Under great pressure from these challenges, it is difficult for the Taiwanese security department to develop sustainably without concentrating resources to improve their performance. Thus, if they would like to improve themselves, analyzing the efficiency of the security department is relatively necessary. Moreover, since security forces operations represent significant spending of taxpayers’ money, effective use of these taxpayers’ money can save huge sums of money, while at the same time improving services based on existing budgets. However, the effectiveness of these expenditures is hard to estimate. A few previous studies had proposed changed management systems to improve the efficiency of security operations.
In the US, a study conducted an econometric study of police forces in 1987 [
4]. In this study, the author used a multiproduct translog function, regressing, and socioeconomic attributes to assess 256 Florida municipalities of various size in 1982 and 1983. The study found that the police force displays decreasing returns to scale. Then, Gyapong and Gyimah-Brempong [
5] estimated a similar model for the police force in 260 Michigan municipalities by applying the DEA model. This study used physical units of inputs and similar output variables, testing the efficiency assumption of these econometric models.
Some researchers have used the DEA approach to measure security performance. Published applications of DEA to police services can be discovered in Thanassoulis [
6], Carrington et al. [
7], Sun [
8], various papers by Drake and Simper (2005) [
9], and etc. These papers supply important contributions to this area and further our knowledge of police performance and the use of DEA to estimate efficiency.
The purpose of this study was to ascertain the effect of the security department of 22 counties/cities in Taiwan by using the DEA model. This research has collected the official statistics of all 22 counties/cities in Taiwan in 2016. Applying the concept of efficiency frontier to proceed classification of efficiency. Using projections of each DMU onto the efficient frontier analyzed by the chosen model to give the specific suggestion for each DMU. Applying mathematical modeling is undesirable models of DEA to evaluate the pros and cons of operation of security departments of every county/city in Taiwan. Finally, this research would become the basis for assigning resources that are insufficient for the demand, such as government funding, especially when there is a limited budget for this endeavor.
The paper is organized as follows.
Section 2 provides a literature review related to the research topic. Then the materials and methods are given in
Section 3,
Section 4 provides detailed experimental results.
Section 5 gives some discussion for the paper. Conclusions and suggestions concerning possible implementation issues and future study are provided in
Section 6.
2. Literature Review
The finding of previous studies has shown that DEA is a useful mathematical tool to assess the performance of security departments of countries over the world. We briefly outline these earlier studies in terms of their production model, sample size, and limitations.
Thanassoulis [
6] applied the CCR model to assess police forces in England and Wales for the period 1992–1993. The model used inputs including police officers, violent crimes, burglaries, and other crimes recorded; and outputs including “clear-ups” of violent crime, burglary, and other crimes recorded. The paper measured “manpower” efficiency and “clear-up” efficiency indicators in which three inputs (violent crimes, burglaries, other crimes recorded), and three outputs (clear-ups of violent crime, burglary, and other crimes recorded) were used to measure “clear-up” efficiency; one input (officers) and three outputs (violent crimes, burglaries, other crimes recorded) were used to evaluate “manpower efficiency”. The paper indicated that raising staffing levels would lead to more crimes being cleared. However, it was also found that the efficiency ratings of some forces could be based on a downgrading of the importance of output variables, often in a counter-intuitive way. Second, the CCR model used could not test whether technical and scale efficiencies existed for any other police forces.
Carrington et al. [
7] employed a two-stage procedure to examine the technical efficiency of the New South Wales (NSW) police services over two years. The first stage, input-oriented CCR, and BCC model were applied to assess the technical efficiencies. The model used five outputs (number of offenses, arrests, summons, major car accidents recorded, and kilometers traveled by police cars) and three inputs (police officers, civilian employees, and police cars). In the second stage, Tobit regression was applied to analyze eternal factor or operating environments of patrols. The paper concluded that (1) NSW police patrols could be reconstructed to achieve optimal scale, and (2) the differences in operating environments did not a significant influence on the efficiency of police patrols. The authors addressed technical and scale efficiencies for police patrols, then analyzed operating environments. However, this study also met some limitations. This paper did not constitute a discussion for use of inputs/output in the DEA model. Inefficient units and their efficient peers were not identified.
Most recently, Sun [
8] used the DEA model to evaluate the efficiency of the 14 police department Taipei City. This paper used the output-oriented DEA models in order to enhance the efficiency estimates. The analysis indicated that operating environments, as population and location indicators, have a slight influence on the efficiency of the police department. Forty-one police forces in England and Wales was conducted DEA analysis by Drake and Simper (2005) [
9]. The authors developed both cost and production models analyzed in the two-stage DEA model. This paper used four inputs: burglaries, vehicle crimes, robberies, and total budget; and two outputs: civilian days lost and aggregate offenses cleared. The study focused on the total cost of clearing reported crimes. The DEA model in this study was to measure technical efficiency, and then a regression model was applied to capture the environmental variables.
Gorman et al. [
10] applied a multiple-stage DEA model to evaluate the efficiency of state police of United States. The study used multiple inputs/outputs to assess police characteristics, technical and scale efficiency were computed for the 49 states. The outcome pointed out that most states’ police were technically efficient, but 50% were performing at less-than-optimal scale size. Rahimi et al. [
11] evaluated the efficiency of Iran’s rural traffic police efficiency with seven inputs and three output variables by using the DEA model. Conclusions were that once the environmental conditions are adjusted, Iran’s traffic police have a potential opportunity to reduce road traffic injuries.
The results of the studies assess properly the performance of the security departments and contribute to the improvement of the performance of the departments. However, a common feature of previous studies has been the use of basic models of DEA such as CCR, BBC, two-stage, and so on. These are basic models that help identify effective and ineffective DMUs that have not yet developed algorithms to calculate effective scores and identify poorer output outcomes. In conducting this study, we used the undesirable outputs model to evaluate the overall police precincts studied. At the same time, we added environmental factors (population, annual funding) based on Drake and Simper’s research [
8] on cost approach as input/output factor to assess efficiency.
Besides, DEA has already been used commonly to analyze other efficiencies of operation. Researchers have employed the DEA models to measure productivity in areas including environmental, energy policy, education, healthcare, finance, and so on. Wang et al. [
12] proposed an effective approach based on the grey and DEA model for selecting partners in the automobile industry. Wang et al. [
13] combined the resampling model and super-SBM model to gauge and forecast the relative performance of 17 economics. Yu et al. presented two models developed using integrated DEA model [
14]. This study used the slack-based measure DEA model, and the novel data-driven approach that combined failure mode and effects analysis (FMEA) and DEA. This paper employed 16 failure models at Medical Center, the U.S. Du [
15] integrated three methods—TOPSIS, DEA, and Tobit regression—to evaluate the performance, discussion quality, and efficiency from 31 provinces of Mainland China.
3. Materials and Methods
3.1. Undesirable Outputs Model
The undesirable outputs model has two variants, including the undesirable outputs model and nonseparable model. This model is different from other DEA models because bad output factors are also included. It is used widely nowadays.
The undesirable output model was proposed by Cooper et al. [
16]. This model deals with the same problem by applying a slacks-based measure of efficiency (SBM) in Tone (2001) [
17]. The SBM is non-radial and non-oriented, and utilizes input and output slacks directly in producing an efficiency measure. In this model, SBM was modified so as to account for undesirable outputs. This research used BadOutput model (BadOutput-C) since it met the general principle of the model. The model is presented as follows:
The output matrix Y was decomposed into (good matrices) as desirable output and (bad matrices) as undesirable output. With the DMU , the decomposition was denoted as .
The production possibility set was defined by
where
was the intensity vector, L was the lower bounds of
, and U was the upper bounds of
. The efficiency DMU in this frame was defined as follows.
Efficient DMU: A DMU was efficient in the bad outputs, if there was no vector ∈ P such that with at least one strict inequality.
According to the SBM in Tone (2001) [
17], the objective of the undesirable model was modified as
subject to
The vectors correspond to excesses in inputs, and correspond to bad outputs, while expresses shortages in good outputs. S1 and s2 denoted the number of elements in and , and . Let an optimal solution of the above program been .
Then Cooper et al. [
16] demonstrated that the DMU
was efficient in the presence of undesirable outputs if and only if
i.e.,
. If the DMU was inefficient, i.e.,
, it could be improved and became efficient by deleting the excesses in inputs and bad outputs and augmenting the shortfalls in good outputs by the following projection
The above fractional program could be transformed into an equivalent linear program by using Charnes—Cooper transformation (see Tone 2011 for detail [
17]). By considering the dual side of the linear program [] had the following dual program in the variable
for the constant returns to scale case, i.e. L = 0, U = ∞.
max
The dual variables and could be interpreted as the virtual prices (costs) of inputs and bad outputs, respectively, while denoted the price of good outputs.
The above dual program aims at obtaining the optimal virtual costs and prices for the DMU so that the profit did not exceed zero for every DMU and maximizes the profit for the DMU concerned. Apparently, the optimal profit was at best zero and this identifies the DMU as efficient.
In the bad-output model, Cooper et al. [
16] set weights to bad and good outputs through keyboard before running the model. If both
and
were supplied as the weights to good and bad outputs, respectively, then the model calculated the relative weights as
and
, and the objective function was modified to
The defaults were given by Cooper et al. [
16] with
and
. In accordance with the degree of emphasis on bad outputs evaluation, we can put a large
against
, and vice versa. In the bad-output model, as noted, the good outputs had the heading (O), while the bad outputs had (OBad).
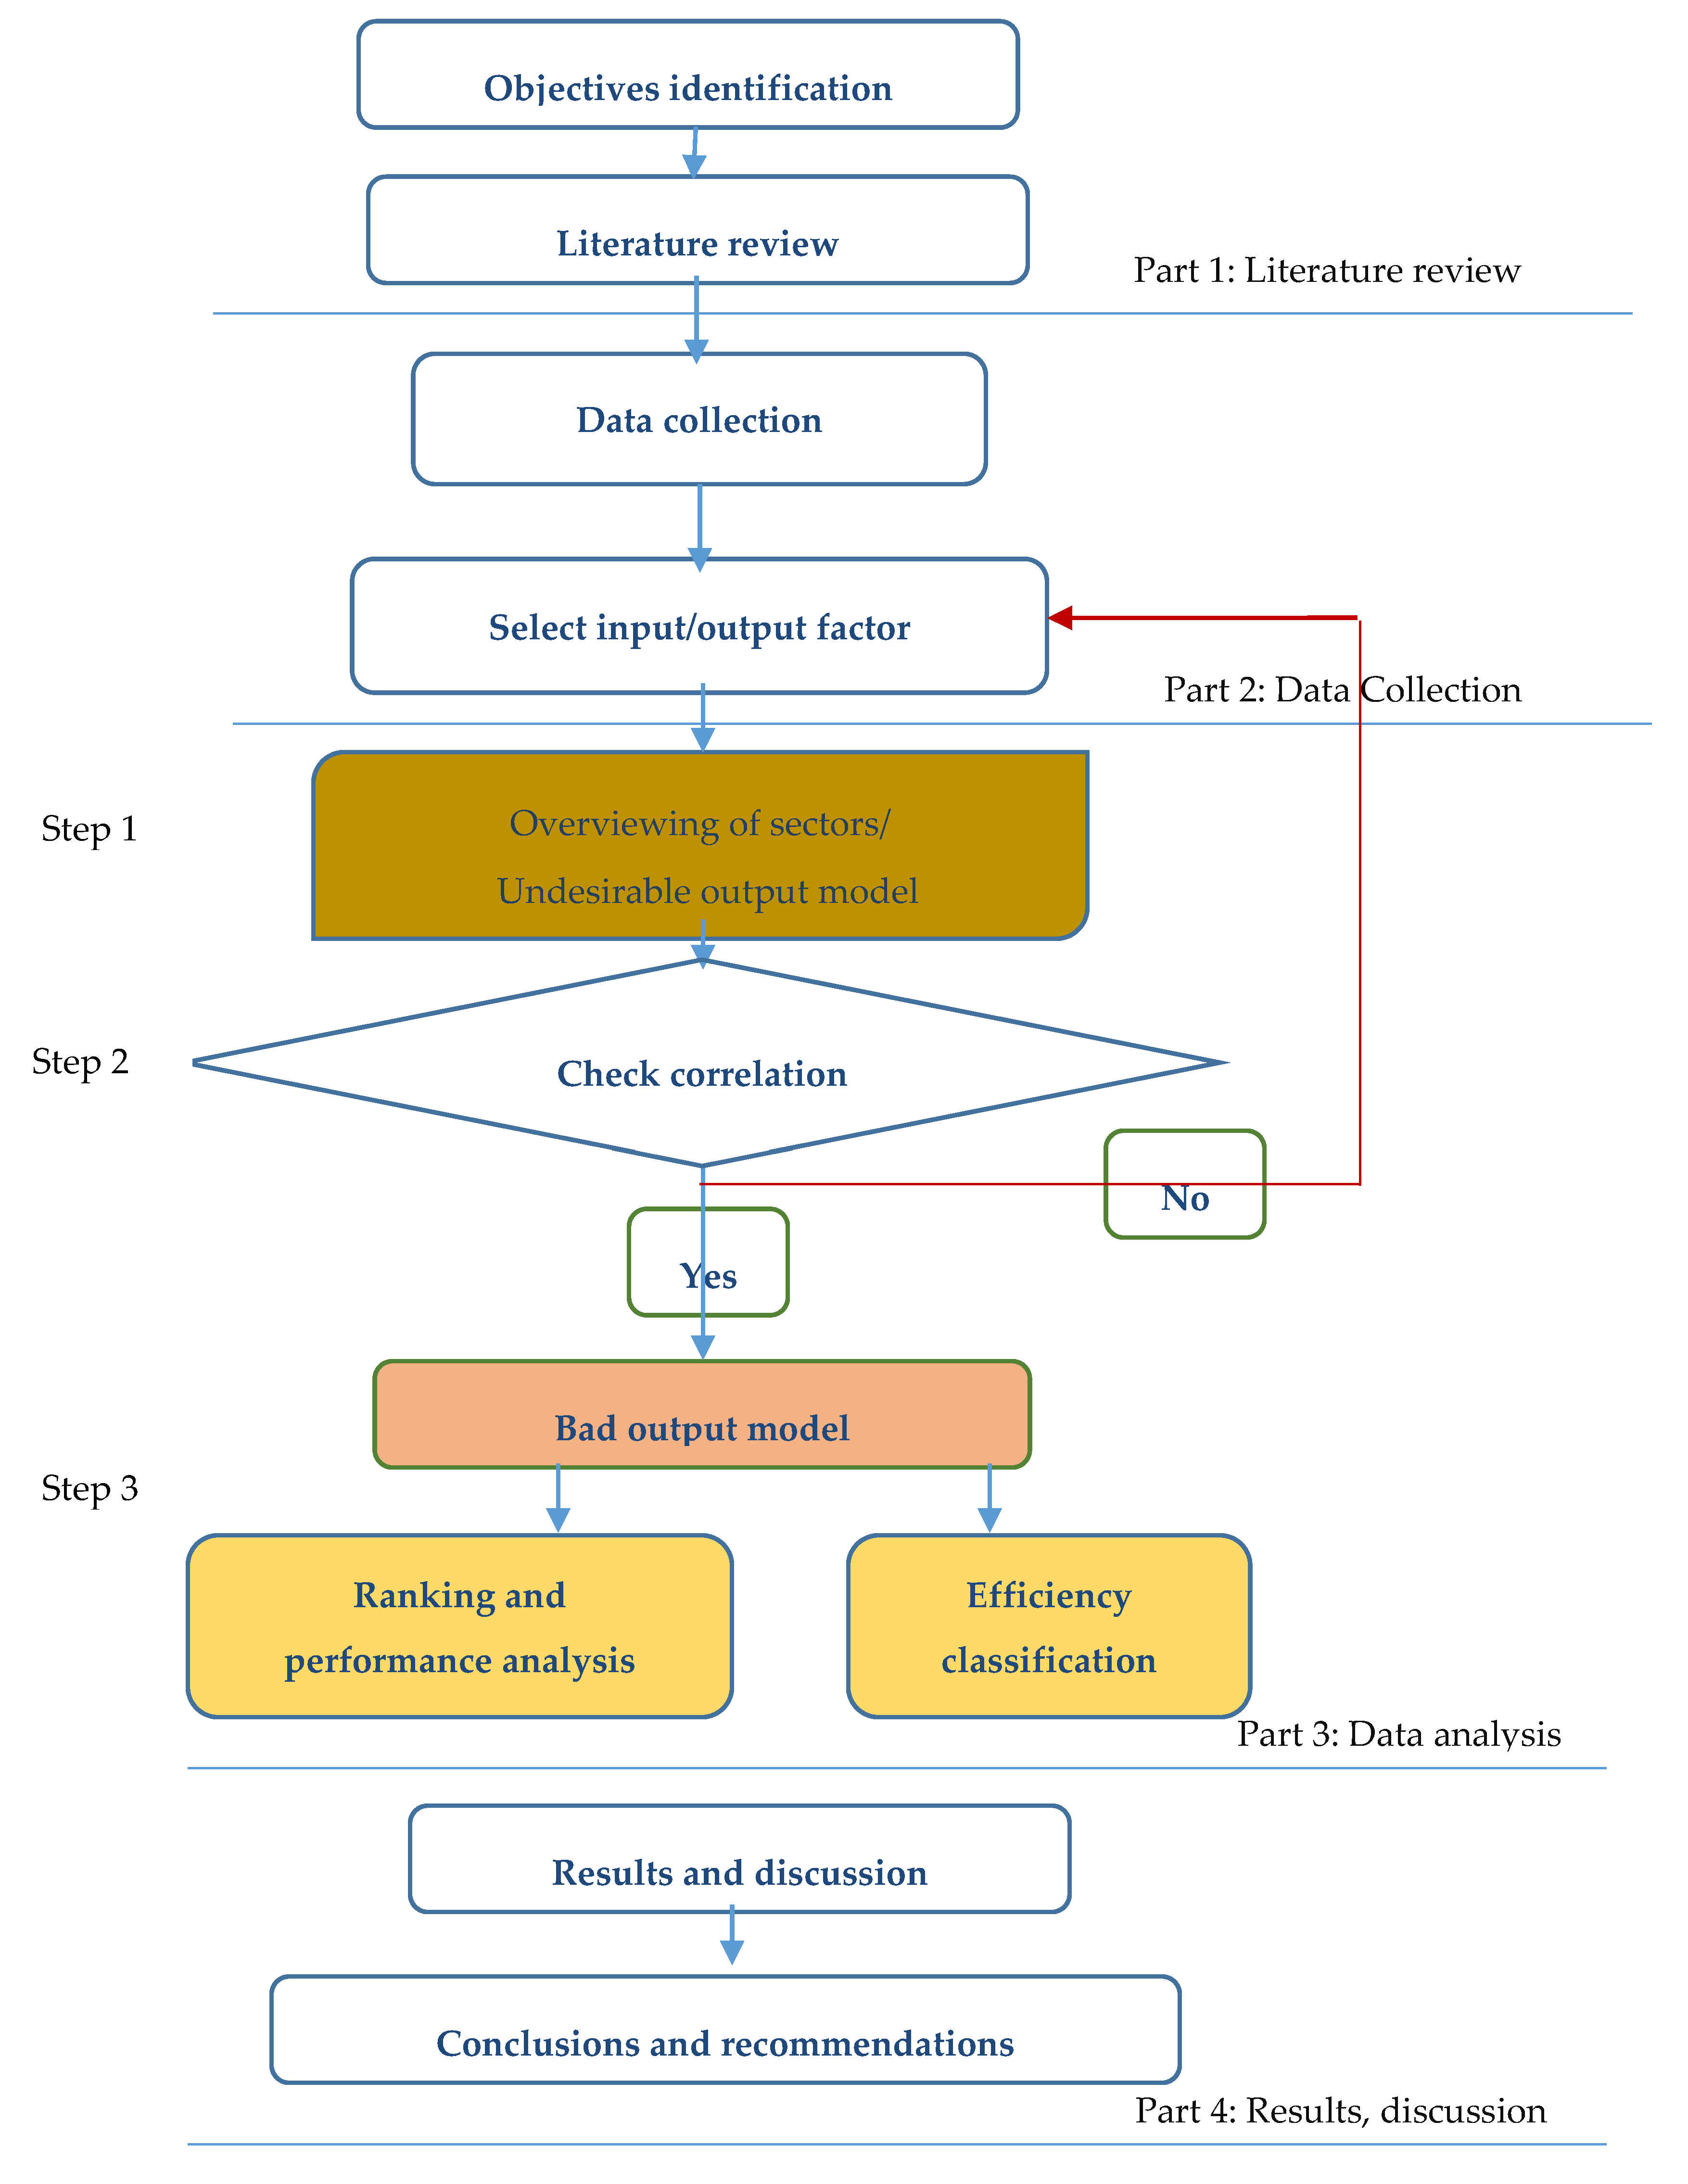
3.2. Research Process
By using related statistics from the National Statistics Website, this research uses the DEA model in order to process the evaluation of efficiency based on the actual data. The study was divided into four parts as shown in
Figure 1.
Part 1: The authors identify the research question, after that the authors learn more about the topic under investigation and review the literature related to the research problem.
Part 2: The collection of data is a critical step in providing the information needed to answer the research question. The selection of DMUs has a rule that should be considered. According to Golany and Roll [
18], the number of DMUs required by DEA should be at least two times as greater as than the total number of input and output variables. In this study, in order to analyze the efficiency of the security department in every county and city in Taiwan systematically and in detail, all 22 counties and cities are included. After that, selecting input/output variables based on the cost approach and the production approach.
Part 3: Data analysis is divided into three basic steps.
Step 1: Undesirable outputs model can help solve the problem of considering bad outputs in the research (bad output factors as both the number of crimes and suspects). Therefore, the DEA-Solver software and the undesirable outputs model is used to measure the efficiency of DMUs.
Step 2: Checking the Pearson coefficient to ensure the data is isotonic. The correlation closing to ±1 is a perfect linear relationship. If the input and output variables have a negative relationship, it will be removed. Then, Step 2 needs to be re-performed until the prerequisite is satisfied [
19].
Step 3: DEA will be analyzed based on the data which is collected in this research and an efficiency score of 243 for each DMU will result. Research results will be analyzed in two directions: efficiency classification and overall rating. In which, efficiency classification is based on the concept of efficient frontier. In the first analysis, an efficiency value of 1 will be assigned to the first grade of efficient frontier counties and cities. After eliminating the first grade of counties and cities, the rest of the DMUs will be in the second round of DEA analysis. Those counties and cities which score 1 in the second round will be considered as the second grade of efficient frontier. Meanwhile, the rest may be deduced by this analogy, until it does not fit in the Golany and Roll [
18] procedure. The total number of DMU must be twice more than the sum of input and output sectors. There are two rounds of analysis in this research; DMUs are classified into three levels while the first grade is the most efficient, and the third grade is the least efficient relatively.
Part 4: The results of this analysis are then reviewed and summarized in a manner directly related to the research problem. Based on the results, the authors give some valuable information and recommendations for decision-makers.
3.3. Establish Inputs and Output Variables
DEA, due to Charnes et al. (1978) [
20] and Banker et al. (1984) [
21], is a mathematical programming approach that envelops observed production possibilities to construct a piecewise linear frontier. They produced a data-oriented approach for measuring the performance of multiple decision-making units (DMUs) by transforming multiple inputs into outputs. DMUs could include schools, universities, bank, hospitals, power plants, etc. Of course, as with parametric approaches, inputs and outputs must be carefully chosen to attain meaningful results.
In order to adequately measure the efficiency of security forces, the selection of input and output indicators should be carefully considered. In addition to reviewing literature related to DEA method, the suitable correlation between input and output variables also been attention. Previous academic analysis (Drake and Simper, 2002; Thanassoulis, 1995) has pointed out that it is feasible to assess the relative efficiency of security forces in all worlds. However, the validity and robustness of these relative efficiency results will depend crucially on the specification of an appropriate set of inputs and outputs (outcomes). In addition, Drake and Simper [
22] emphasized that environmental/sociological factors should be incorporated directly into the relative efficiency analysis.
This research is based on cost approaches it has defined the annual cost (labor cost, general operating costs, equipment purchasing costs, and so on) from security department in each city/county and the security as input variables. Hence, annual funding is included in the study to evaluate performance based on Drake and Simper [
22], and Gyimah-Brempong [
4]. In addition, population relates to the number of crimes and suspects. The research takes population as an input factor based on Gyimah-Brempong [
4]. Furthermore, based on the previous researches, it is observed that both the number of criminal cases and suspects were considered by every magazine during evaluating the livability of every city, which showed the importance of these two factors to public safety and to reach the research purposes of this article, this research specified the number of crimes and suspects, the worse results are therefore considered bad output factors.
This research selected three input variables, including population (population of all countries and cities (unit: person)), annual funding (annual funding of police departments of all counties and cities (unit: NDT)), and the number of police (official number of policemen (unit: person)); three output variables included bad output-number of crime (offense known to the police (unit: case)), bad output-number of suspects (number of suspects (unit: person), and number of cleared cases (offenses cleared by the police (unit: case)).
4. Empirical Results
4.1. Data
Taiwan has 22 administrative districts, including 13 counties and 9 cities. Of the 22 administrative districts, there are 3 very small islets located off the main island; these islets were also included in this research in order to entirely assess the efficiency of all security departments in Taiwan. This research has collected all the data of year 2016. To accord with liability of the resource of data, it is based on the information on Statistical Information Network of R.O.C [
23]. Due to some limitations of time and ability to approach and analysis every aspect of security department, it is not possible to include all input and output factors of efficiency. The study has respectively selected three input and output factors to proceed with the evaluation of efficiency by using induction approaches to integrate the collection of related literature and data.
The names of 22 counties and cities are given in
Table 1 and the summary of statistics for input and output factor is shown in
Table 2.
4.2. Pearson Correlations
In order to conduct DEA analysis, it is necessary to make sure the relationship between input and output is positive, which implies when the input quantity goes up, the output quantity increases under same condition. This study employs a simple correlation test—Pearson correlation—to measure the strength of the linear relationship of normal distributed variables [
24].
Pearson correlation is frequently used in statistical examination to evaluate the association between two factors. It varies between −1 and +1. The coefficient of -1 represents perfect negative while +1 shows a perfect positive linear relationship. As the coefficient equals to 0, it means no linear relationship between two variables. In this research, the data of 2016 is analyzed and evaluated and the result is shown in
Table 3.
The results of correlation coefficients between input and output variables in Table show strong positive associations and comply with the precondition of the DEA model. Hence, these positive correlations also prove that the selection of input and output variables is consistent. This means those data are proper for DEA assumption and can be used for the analysis for DEA calculations.
4.3. Performance Ranking-Undesirable Outputs Model
4.3.1. Undesirable Outputs Model Analysis
In this research, the undesirable outputs (BadOutput-V) model is applied to assess the relative performances and rank 22 counties/cities in Taiwan.
Table 4 demonstrates the overall efficiency scores and rank for the 22 city/county police department analyzed according to the DEA Undesirable Outputs model. From the
Table 4, it can be seen that there are 9 DMUs operating at a highly relative efficiency of 1 during 2016, including New Taipei City, Taipei City, Yilan County, Hsinchu County, Hualien County, Keelung City, Hsinchu City, Kinmen County and Lienchiang County. In other words, the efficiency performance of these 9 DMUs is better than the rest of the 13 DMUs. Furthermore, CT17 (Penghu County) efficiency score is 0.436206. It is at the bottom of 22 cities/counties.
4.3.2. Classification of Efficiency
After the analysis in
Section 4.3.1, we can easily notice that there are nine DMUs operating efficiency of police department as 1. Firstly, the counties and cities rated 1 are considered as the first grade of efficiency frontier. After removing the first-grade counties and cities, the rest of them will be examined by assessing the efficiency of operating again to get those graded as 1 to be classified as the second grade of efficiency frontier. Meanwhile, the rest may be deduced by this analogy.
Table 5 demonstrates the efficiency scores and rank for the rest of 13 county/city security department analyzed according to the undesirable outputs model. From the table, it can be seen that there are nine DMUs operating at relative efficiency with 1, including: CT3 Taoyuan City, CT4 Taichung City, CT5 Tainan City, CT10 Changhua County, CT13 Chiayi County, CT14 Pingtung County, CT15 Taitung County, CT17 Penghu County, and CT20 Chiayi City.
As withdrawing the nine counties and cities which scored 1 in the second grade of efficiency frontier among the 13 counties and cities, the last four rivals are considered as the third grade of the efficiency frontier, including CT6 (Kaohsiung City), CT9 (Miaoli County), CT11 (Nantou County), and CT12 (Yunlin County). To integrate the above analysis, the police departments of all 22 counties and cities are classified into three groups, as we can see in
Table 6.
The counties and cities which are considered as first grade of efficiency frontier are the most effective security departments among all 22 counties and cities in Taiwan. The second-grade ones are the most efficient of the rest 13 counties and cities. However, the last four rivals were not analyzed due to the Golany and Roll procedure. The total number of DMU must be twice more than the sum of input and output sectors.
Table 6 shows the 22 countries and cities in Taiwan are classified into three grades while the first grade is the most efficient; and the third grade is the least efficient relatively.
4.4. Improving Methods of All Counties and Cities
With analysis of variance, this analysis contains projections of each DMU onto the efficient frontier analyzed by the chosen model. It can be improved and become efficient by deleting the excesses in inputs and bad outputs and augmenting the shortfalls in good outputs by the following projection.
Table 7 shows the projection of input factors. For example, such the second grade of efficiency frontier, CT3 (Taoyuan City) can reduce 25.14% of the annual expense of police departments of year 2016, from 5,928,989,000 NTD to 4,438,641,063 NTD; the number of policemen can be decreased 16.91% (615) from 3636 to 3021 people. On the other hand, if the output sectors, the number of crimes can be brought down 3.39% (688) from 20,289 to 19,601 people; the number of suspects can be reduced 11.5% (1,938 people) from 16,739 to 14,801 people. At the same time, there is no need for the number of cleared cases to change. The overall efficiency of police departments of CT3 can be substantially upgraded if all the sectors above may be improved.
Table 8 shows the projection of output factors.
However, in reality, it is indeed complicated when it comes to the factors which affect the efficiency of police departments. Therefore, it is difficult to improve by employing analysis results, for example, population is one of the most difficult factors. Not only do the police need to focus on clearing up the cases, but also directing traffic, remaining public order, etc. These are the reasons why the responsibilities of policemen are diverse and complex, resulting in the complaint of lack of staffs in local police department. Yet, it is the opposite of the outcome of this research which recommending the government to cut back the number of policemen and to simplify their duties, in order to focus on remaining public safety, and it is worth spending time on the research of coherent units of the government. In the other hand, about the output factors, continuing from ‘social safety net’, which was mentioned in the first chapter of this research, including controlling and counseling works on high-risk families, post-offense tracking and guiding, etc. The police, above all, being able to effectively lower the rate of crimes and the number of suspects, may also be one of the workable solutions for the police department to upgrade the efficiency to resolve criminal cases.
Besides, the research results have shown the weighted data score of the input/output variables. In general, the weight data scores fluctuated by variables both input and output. Overall, the ‘number of suspects’ is the most impact variable to the efficiency score of each DMU with the total score is 151.0866, largest compared to the remaining variables. Accordingly, the individual score for each DMU of this variable is also superior to other variables. Then, ‘number of crimes’ with the total score is 86.2946 and ‘number of suspects’ is the less impact variable with the total score of 29.0608.
Table 9 above has shown the total score of the weighted data.
5. Discussion
This paper has applied DEA-undesirable output model to measure the efficiencies of the security department of all of Taiwan’s administrative districts in 2016. The three outputs selected for the DEA model included the number of crimes, number of suspects, number of cleared cases; the three inputs included population, annual funding, and number of police officers. The scores for overall efficiency, efficiency score, and projection which give specific suggestions for each DMU were calculated and reported. The data of year 2016 was the latest statically data when doing this research and due to the limitation of undesirable output model can only analyze the data for the same year; therefore, this research aimed to evaluate the efficiency of police departments in 2016. Further analysis has considered efficient frontier to classify the efficiency of all police departments, to provide the government a reference for future operation strategy and resource allocation.
Our study is correlated with previous studies via the use of the DEA method to measure security forces’ performance. Despite similarities with those of the research model, the results are significantly different due to the selection of inputs, outputs, and country of study. For example, Thanassoulis [
6] used the CCR model to assess 41 police forces in England and Wales for the years 1992–1993. Carrington et al. [
7] used input-oriented CCR and BCC models to examine the technical efficiency of the New South Wales (NSW) police services in 1994–1995 with 163 police patrols. Most recently, Sun [
9] used window DEA model to measure the relative efficiency of the 14 police precincts in Taipei city, Taiwan. The use of basic models of DEA—such as CCR, BBC, two-stage, and so on—to assess performance of police departments of countries around the world at different times that help identify effective and ineffective DMUs. The results of the studies properly assess the performance of the security departments and contribute to the improvement of the performance of those departments. Our research applied undesirable output model, developed algorithms to calculate effective scores, and to rank security department of Taiwan comprehensive and effective. Research results focus on explaining, ranking efficiency of DMUs. In addition, the study goes into the classification and assessment of security departments in these three grades. One more prominent part of the research is to consider improving the effectiveness of security departments by cutting back on excess or adding a shortfall in indicators to help improve ineffective police departments. These are the main points that the manuscript focuses on. It differs from other traditional DEA models.
This study has analyzed the efficiency of security department of 22 counties and cities in Taiwan. There are nine counties and cities belong to the first grade, which scored 1 relatively, meaning that they have employed resources effectively and suitably. These nine counties and cities are New Taipei City, Taipei City, Yilan County, Hsinchu County, Hualien County, Keelung City, Hsinchu City, Kinmen County, and Lienchiang County. Among all, there are two out of three of the surrounding islands on the rank, yet the efficiency of Penghu County has scored 0.436206, which is the least efficient in the 22 counties and cities.
Based on the efficiency, the 22 counties and cities in Taiwan are classified to three levels. The first grade of efficiency frontier: New Taipei City, Taipei City, Yilan County, Hsinchu County, Hualien County, Keelung City, Hsinchu City, Kinmen County and Lienchiang County. The second level of the classification: Taoyuan City, Taichung City, Tainan City, Changhua County, Chiayi County, Pingtung County, Taitung County, Penghu County and Chiayi City. The third part of Efficiency Frontier: Kaohsiung City, Miaoli County, Nantou County and Yunlin County. It is noteworthy that, as the second biggest city with the most population in southern Taiwan, Kaohsiung City is one of those in level 3, at the bottom of all counties and cities. It is necessary for the government of Kaohsiung City to reconsider resource allocation in order to improve the efficiency of the security department.
In addition, analysis of projection, it can be improved and become efficient by reducing the excesses in inputs and bad outputs and augmenting the shortfalls in good outputs by the following projection. For example, CT6 (Kaohsiung City), which locates at the third level of classification, as input factors, the annual expense of security departments reduces 35.62% (3,413,207,188 NTD) from 9,583,466,000 NTD to 6,170,258,812 NTD; The number of policemen can be decreased 37.11% (2468 people) from 6652 to 4184 people. On the other hand, if the output sectors, the number of crimes can be brought down 4.4% (1239 people) from 28,163 to 26,924 people; the number of suspects can be reduced 32.06% (9210 people) from 28,725 to 19,515 people. At the same time, there is no need for the number of cleared cases to change. The overall efficiency of security departments of CT6 can be substantially upgraded if all the sectors above may be improved.
6. Conclusions and Future Directions
In general, there are three orientations of the contribution of this research. First, the authors have been very successful in applying mathematical models to assess the national safety performance of Taiwan. They found that the development of the police department is one of the major factors to influence public security and livability, this research has evaluated the police departments in Taiwan objectively and comprehensively. Therefore, the mathematical model-DEA model was used to measure the relative efficiencies of the police forces of all the administrative districts of Taiwan. DMUs were determined optimally through a mathematical formulation such that the score efficiency.
By clearly defining the research topic, the authors realize that the undesirable output model is an effective method to measure the performance of the security department. This is an outstanding DEA model that can help evaluate the effectiveness of DMUs using bad indicators. Examples include emissions assessment, crime assessment, debt assessment, so on. In this study, the bad indicators were given into the study including the number of crimes and the number of suspects. In addition, in order to differentiate the efficiency of all police departments accurately and speedily, this study has used the concept of application of efficient frontier to evaluate the police departments in Taiwan. This study will be the initial research to extend this model into other areas of research.
The undesirable output model can assess the performance of DMUs and propose a plan to improve the inputs/outputs of inefficient DMUs based on real data. This function is difficult to achieve with similar models in statistics, for example, stochastic frontier analysis, SPSS, Tobit, etc. Efficiency scores of DMUs are subject to change, they depend on the choice of data variations, and DMUs as well as on the choice of model for assessing DMUs. Moreover, there are various factors influencing the performance of the security forces. As a result, input and output variables can be expanded to comprehensively evaluate police departments’ operation. In order to extensively and accurately analyze their operation, it is recommended that future studies collect more years of data for analysis.
Besides, although this paper shows that the multiple methods approach is the optimal choice to evaluate and compare the performance of police departments, this paper only focuses on quantitative models, and the results reveal the relative performance. The authors will do more research external environmental factors, choice of variables, and how combining some other models could be a good research direction in the future. These will help in the assessment of efficiency becoming more accurate and complete.
The main contribution of this study is focused on using mathematical tools to provide an evaluation of the efficiency of Taiwan’s police departments based on public databases. The research results may help to improve police department efficiency and move toward more sustainable security environment development. The findings in this study are reliable data to provide policymakers to improve bad input/output indicators. The analysis of ‘projection’ provides a workable reference on policy management and practical suggestions in resource allocation for the government.


