Article

Supply Chain with Customer-Based Two-Level Credit Policies under an Imperfect Quality Environment

1
Department of Operational Research, Faculty of Mathematical Sciences, New Academic Block, University of Delhi, Delhi 110007, India
2
Department of Industrial & Management Engineering, Hanyang University, Ansan, Gyeonggi-do 15588, South Korea
*
Author to whom correspondence should be addressed.
Mathematics 2018, 6(12), 299; https://doi.org/10.3390/math6120299
Submission received: 8 November 2018 / Revised: 23 November 2018 / Accepted: 25 November 2018 / Published: 3 December 2018

Abstract

:
The present model develops a three-echelon supply chain, in which the manufacturer offers full permissible delay to the whole seller, while the latter, in turn, adopts distinct trade credit policies for his subsequent downstream retailers. The type of credit policy being offered to the retailers is decided on the basis of their past profiles. Hence, the whole seller puts forth full and partial permissible delays to his old and new retailers respectively. This study considers bad debts from the portion of new retailers who fail to make up for the delayed part of the partial payment. The analysis shows that it is beneficial for the whole seller to make shorter contracts, particularly with new retailers, along with the fetching of a higher fraction of initial purchase cost from them. In addition to the above-described scenario, the lot received by the whole seller from the manufacturer is not perfect, and it contains some defects for which he employs an inspection process before selling the items to the retailers. In order to make the study more realistic, Type-I, as well as Type-II misclassification errors, and the case of out-of-stock are considered. The impact of Type-I error has been found to be crucial in the study. The present paper determines the optimal policy for the whole seller by maximizing the expected total profit per unit time. For the optimality of the solution, theoretical results are provided. Finally, a numerical example and a sensitivity analysis are done to validate the model.

1. Introduction and Literature Overview

In recent years, credit financing has become one of the most desirable/important parts for most organizations. In order to sustain oneself in the competitive market, everyone has to look for the possibility of strengthening their financial assets so that the organization does not face a financial crisis while making/delivering goods to their customers. Most of the big firms/organizations have adopted a culture of trade credit or a bank loan to overcome the lack of financial assets. Nowadays, it is often seen that both manufacturers and whole sellers are offering partial trade credit policies to their end-users. The majority of the recent studies have looked into the downstream partial trade credit financing as a strategy to reduce risks by depositing a collateral amount at the beginning of the purchase, and then providing a complete permissible delay on the remaining amount. With changing market trends and increasing competition, it is indeed profitable for any whole seller to adopt a blend of both full and partial trade credit strategies, instead of treating all retailers as equivalent or providing partially permissible delay to them. However, the nature of policy may change with the type of retailers arriving at the whole seller’s doorstep, depending upon the loyalty of end user. Generally, it is observed in real life that retailers act differently towards the terms and conditions of various payment options, discounts, sales, promotion strategies, etc. With regard to this, the whole seller can face some non-payment risks on the remaining amount of partial permissible delays by some retailers. For the financial benefits, as well as for the reduction of non-payment risks, this study provides a balanced promotional strategy to the whole seller, with the bifurcation of all the retailers, first into old and new types, by looking at the past records at his end. Furthermore, it turns out that sometimes all of the new retailers may not be capable/ interested in completing their respective partial payments, due to the whole seller. Thus, it is practical enough to further categorize new retailers into good and bad types. Good retailers are those who pay both immediate and delayed parts of the partially permissible delay, while bad ones are those who pay only the immediate part and fail to return the delayed part payment to the whole seller. The failure of making delayed partial payments from a proportion of new retailers is referred to as bad debts in the model. So, in total, the retailers have been bifurcated twice in the present research. Such a dual bifurcation of retailers into an old and new category and then new retailers into the good and bad category has not gained much attention in past research. Furthermore, the firms have to take appropriate quality control measures, in order to satisfy today’s discerning consumers. Conventionally, it was presumed that the lots received by any whole seller/retailer were all perfect, and so there was no inspection processes involved. However, the production process may be faulty many times at the manufacturer’s end, and produce some defectives. Therefore, it becomes inevitable for the whole seller to inspect the entire lot before selling it to the retailers. Nevertheless, it is found that because of unavoidable human errors, the inspection process is imperfect and leads to Type-I as well as Type-II misclassification errors. Type-I misclassification error is the scrapping of perfect items, while Type-II misclassification error is the sale of defectives by mistake. As a result of Type-II misclassification errors, the wrongly inspected defectives, when passed on to the retailers, lead to sales return. As the demand is satisfied through perfect items only, if the count of inspected perfect items becomes less than the demand during the inspection process, then shortages are bound to occur. Hence, the model considers fully backlogged shortages. This rational combination of problems features defective items, faulty inspection procedures, Type-I as well as Type-II errors, sales returns, and distinct trade credit policy through the dual bifurcation of customers, along with shortages that are encountered by numerous retail sectors that face such kind of problem sets, such as the textile industry, multi-brand retail stores like Shoppers Stop, Lifestyle, and so on. Therefore, the main objective of this study is to provide a simple formulation for firms who have been targeting vital spheres such as supreme standards of quality, promotional tools, effective inventory management, team building, etc.

Literature Overview

This section discusses the previous work done in the research area of inventory, considering both trade credit and the presence of imperfect quality items. This helps in throwing light upon the research contribution of the study and the existing literature.
Full and partial trade credit policy: In today’s ever-evolving business world, it is crucial for the supply chain players to adopt the best policies for maximizing their overall profit. Trade credit is nowadays a widely accepted strategy to stimulate the manufacturer’s/whole seller’s demand, and boost their respective sales. It not only gives the whole seller an opportunity to delay the payment process until the credit limit, but it benefits him in terms of earning interest on the revenue fetched from sales. In the literature of this subject, Haley and Higgins [1] were the first to develop the concept of trade credit in the economic order quantity (EOQ) model. Further, Goyal [2], Davis, and Gaither [3], and Aggarwal and Jaggi [4], and their references, made significant contributions in elaborating the concept of one-stage trade credit. Soon after, it was found to be equally favorable for the lower members of the supply chain, to offer the permissible delay, to some extent. Many vital contributors related to two-stage trade credit financing were made, namely Teng et al. [5], Su et al. [6], Jaggi et al. [7], and their references. All of the above-mentioned work dealt with optimal order quantity with the permissible delay in payments, assuming that the supplier offered the retailer only a fully permissible delay in payments. However, it is more viable to assume that the supplier would offer the retailer a partially permissible delay in payments to avoid financial risks. Considering the two-stage partial downstream trade credit policy, Huang and Hsu [8] expanded Huang’s [9] model where the retailer received a full trade credit by the supplier, but offered only a partial credit period to his subsequent downstream customers. To bring the existing research of trade credit policy closer to pragmatism, Teng [10], and Jaggi and Verma [11] investigated the retailer’s optimal ordering policies by offering distinct trade credits to their respective customers. The former offered full and partial trade credit to his good and bad customers, while the later differentiated their customers on the basis of the old and the new. However, they did not regard any bad debts as a loss to the retailer that may occurr due to the default risks attached in offering partial trade credit policy. Furthermore, Jaggi et al. [12], Jaggi [13], Taleizadeh et al. [14], and Giri and Sharma [15] contributed by formulating an economic ordering model under two-stage trade credit financing. Besides these, some recent works related to credit/default risks in permissible delay policy contributed a lot in the literature, those of Shi and Zhang [16], Tiwari et al. [17], Wu and Chan [18], Chen and Teng [19], Shah [20], Sarkar and Saren [21], Wu et al. [22], Mahata and De [23], and Wu et al. [24]. Although the use of downstream partial trade credit policy was gaining attention among academia to reduce the threats related to credit-risk customers, none of them had classified the end retailers into four categories, firstly as old and new and later as good and bad types, to further look upon bad debts as a direct loss to the whole seller, which is the main focus of this study.
Imperfect quality and screening errors: In the traditional EOQ or economic production quantity (EPQ) models, the assumption of perfect-quality items in the lot received by the whole seller/retailer was taken as being permanent. Soon, this hypothesis was violated, as it did not seem to be realistic enough for carrying out future research. In view of this, several researchers devoted a great amount of effort to develop EOQ/EPQ models for defective items, viz., Porteus [25], Cárdenas-Barrón et al. [26], Lee and Rosenblatt [27], and Zhang and Gerchak [28]. Soon after, Salameh and Jaber [29] extended the traditional EOQ/EPQ model by accounting for imperfect quality items when using the conventional formulae. That paper considered the issue that poor-quality items were sold as a single batch by the end of the 100% screening process. Further extensions of Salameh and Jaber’s [29] paper were given by Cárdenas-Barrón [30], Goyal and Cárdenas-Barrón [31], Papachristos and Konstantaras [32], and many others. Moreover, Maddah and Jaber [33] rectified a flaw in an EOQ model characterized by a random fraction of imperfect quality and a screening process. Due to unavoidable human errors in the inspection process, it becomes valid to presume Type-I and Type-II errors in the inspection process. In this direction, the first few researchers who came up with human errors in the inspection planning were Rauf et al. [34], Sarkar and Saren [35], and Duffua and Khan [36]. In recent years, Khan et al. [37] and Sett et al. [38] threw light on the inspection errors, and constructed models by considering imperfect quality without and with the occurrence of shortages, respectively. Recently, Hsu and Hsu [39] developed an EOQ model for imperfect quality items, along with screening errors and fully backlogged shortages and sales returns.
Imperfect quality along with trade credit:It is economical to incorporate permissible delays when considering the defectives in the study, as it helps to elevate the profit margins. This has been realized by many researchers, as they have collaborated imperfect quality, the screening process, and one/two-stage trade credit policies in their work. Some of the important contributions in this field are those of Zhou et al. [40], Khanra et al. [41], Khanna et al. [42], Palanivel and Uthayakumar [43], Taleizadeh et al. [44], and Khanna et al. [45]. None of the previous studies that worked on trade credit along with imperfect quality, imperfect inspection, and shortages had presumed the dual bifurcation of customers, i.e., firstly into old and new types (on the basis of past records), and secondly, the new ones into good and bad types (on the basis of partial payment fulfillment) at the whole seller’s end, in a three-echelon supply chain. Table 1 demonstrates the important research gap, and highlights the contributions to the existing literature.
Contribution: The proposed model can be viewed as a better reflection of today’s business scenario for many retail industries. The single type of customer bifurcation (viz., either old and new, or good and bad) has gained some attention by a few researchers, but the present paper highlights the importance of dual customer bifurcation in a two-stage trade credit scenario under imperfect quality and imperfect inspection circumstances. In the current study, both upstream full and downstream, both full and partial types of trade credit policies, are incorporated in a three-level supply chain (manufacturer–whole seller–retailers). The type of trade credit policy is decided on the basis of the past profile of the retailers by the whole seller. Henceforth, the whole seller puts forth full and partial trade credit policies to his old and new retailers, respectively. It is assumed that all of the end retailers are not credit-worthy, and thus, one can incorporate bad debts at this juncture, a concept that has been left unaccounted by many researchers. The model tries to highlight the practical losses that occur many times due to bad debts, by bringing undue charges on the whole seller. Bad debts arise from the portion of new retailers that fail to make up for the remaining part of the partial permissible delay, and are defined as the uncollectible accounts that occur as a result of the customer being unable to fulfill their obligation to pay an outstanding debt, due to bankruptcy or other financial problems. This expense is the cost of a business having the inability to collect its debts. These are the lost customers, and it is reasonable to assume that the same bad customers/debtors never return to the cycle, and they are predicted to have changed their supplier (for fear of legal punishments and heavy penalties). Henceforth, it is intuitive to assume that bad debtors always arise as fresh faces to the whole seller, and this is why it is inevitable for him to face such losses in every cycle. Each time the cycle is repeated, there is a whole lot of new customers, out of whom some fail out to settle the delayed payment part, and their rough percentage is known by using past data. As a result, the customers have been practically bifurcated dually in the model. Another important aspect of this study is derived by assuming that the lot received from the manufacturer contains a certain percentage of defective items, which are dealt by a careful inspection process at the whole seller’s end. Errors in inspection are usually ignored by many researchers in their study. Hence, Type-I and Type-II errors are further added into the system. For maintaining quality standards, demand is satisfied by perfect items only. In order to avoid shortages during the inspection process, the rate of inspection is set as being greater than the demand rate. The main purpose of combining this kind of scenario involving lot-sizing modeling with defective items, and inspection with a trade credit model, is to give the benefit of the doubt to the whole seller under the presence of imperfect quality items received from him. Some common causes of the presence of defectives in the received lot can be wear and tear in transit when large quantities are under consideration, mishandling of products, manufacturing defects, etc. In today’s competitive environment, as the supply chain gets bigger, it becomes difficult for the players to work for their individual benefits. Hence, sellers who deal with quantities in bulk tend to offer permissible delays to their subsequent members, in order to facilitate demand. To compensate the losses incurred due to actual defectives and inspection errors, trade credit is looked upon as an opportunity to raise revenue. Though these two areas are distinct, they are definitely among the practical challenges faced by many non-manufacturing firms, which has motivated the move converge these two parameters in the model. Finally, the model presumes the occurrence of all the aforementioned factors, along with planned backorders, to fill the gap between EOQ and realism.
The remaining paper is planned in the following manner: in Section 2, construction of the analytical model is elaborated with the help of assumptions, notation, and mathematical formulation; In Section 3, a solution methodology is provided to reach the optimal solution, with the help of two lemmas; Section 4 explains the solution procedure to search the optimal case out of all situations of the trade credit policy; Section 5 validates the theoretical results with the help of a numerical process, and presents thorough managerial insights with the help of a sensitivity analysis; finally, Section 6 concludes the paper by providing a conclusion and model limitations, along with future research directions.

2. Analytical Model

2.1. Assumptions

The proposed model is based on the following assumptions.
(1)
The replenishment rate is finite. The lot received by the whole seller contains a certain proportion of defectives. The inspection process is imperfect and leads to Type-I and Type-II errors. The inspection rate is higher than the demand rate.
(2)
The demand rate is constant, uniform, and deterministic. The demand is satisfied with perfect items only. The time period is infinite, and the lead time is negligible.
(3)
In the upstream supply chain, a full trade credit policy is offered to the whole seller by the manufacturer. In the downstream supply chain, full trade credit is provided to all old retailers, while partial trade credit is given to all new retailers by the whole seller.
(4)
New retailers are categorized into good and bad types, based on their paying/not paying of complete dues on time, respectively. Bad debts are obtained by the fraction of new retailers who fail to pay for the delayed part of the partial trade credit.
(5)
Shortages are allowed, and they are fully backlogged.

2.2. Problem Description

The present study deals with a three-layer supply chain where there is a presence of defectives (α%) in the whole seller’s lot (y) received from the manufacturer. The defect percentage (α) is a random variable with a known probability distribution function, taken as f(α). To deal with the existing imperfect quality items, and to provide customers with perfect items only, the whole seller conducts an inspection process of the entire lot, with the rate of inspection being greater than the demand rate, to avoid shortages during the inspection process. In order to compensate for some of the costs/losses incurred during quality control, the whole seller intends to gear up for some promotional techniques, and hence prefers to offer distinct trade credit to his subsequent retailers, according to past records/data. The current model is analyzed by offering full trade credit via upstream, i.e., the whole seller receives full trade credit from the manufacturer with the credit limit (M). However, in downstream, the whole seller offers full and partial trade credit policies to the proportion of old retailers (K) and new retailers (1 − K), respectively, with a credit limit (N). Amongst the new retailers (1 − K), good and bad types of new retailers arise, with proportions (R) and (1 − R) respectively, where (R) is estimated by using past data. All of the new retailers have to make a payment on (δ) units to the whole seller at the time of purchase of the product, and rest of the payment is supposed to be made at (N), where (δ) is the fraction of the selling price (s). However, in practice, it turns out that some new retailers (1 − R)(1 − K) are unable to return for the settlement of the account at (N) with the whole seller. As a result, the whole seller earns interest at the rate of (Ie) on (δ) units of every purchase made by all the new retailers. However, the interest on (1 − δ) units is earned by the whole seller at the rate of (Ie), through the proportions of (1 − δ)(R)(1 − K) only. Resultantly, there is an additional interest charge at the rate of (Ip) on the whole seller because of bad debts, i.e., (1 − δ)(1 − R)(1 − K), as the inventory sold to them remains unpaid until the time inventory becomes zero (T’). At the time of the settlement of his account with the manufacturer at (M), the whole seller pays for all of his purchases at price (c), and incurs a cost at the rate of (Ip) for the items in stock, and for the sold items that are as yet unpaid by the proportions of both old and new retailers until (M).
The above-described sequence of trade credit in the present inventory cycle is shown in Figure 1.

2.3. Mathematical Modeling

In this segment, a mathematical model befitting the above-described problem and its assumptions has been formulated. In this inventory model, the whole seller receives a batch of size y from the manufacturer, comprising of some defectives. The inventory at the whole seller’s place begins to deplete through perfect items only, whereas the defectives keep accumulating until the end of the screening procedure, as shown in Figure 2.
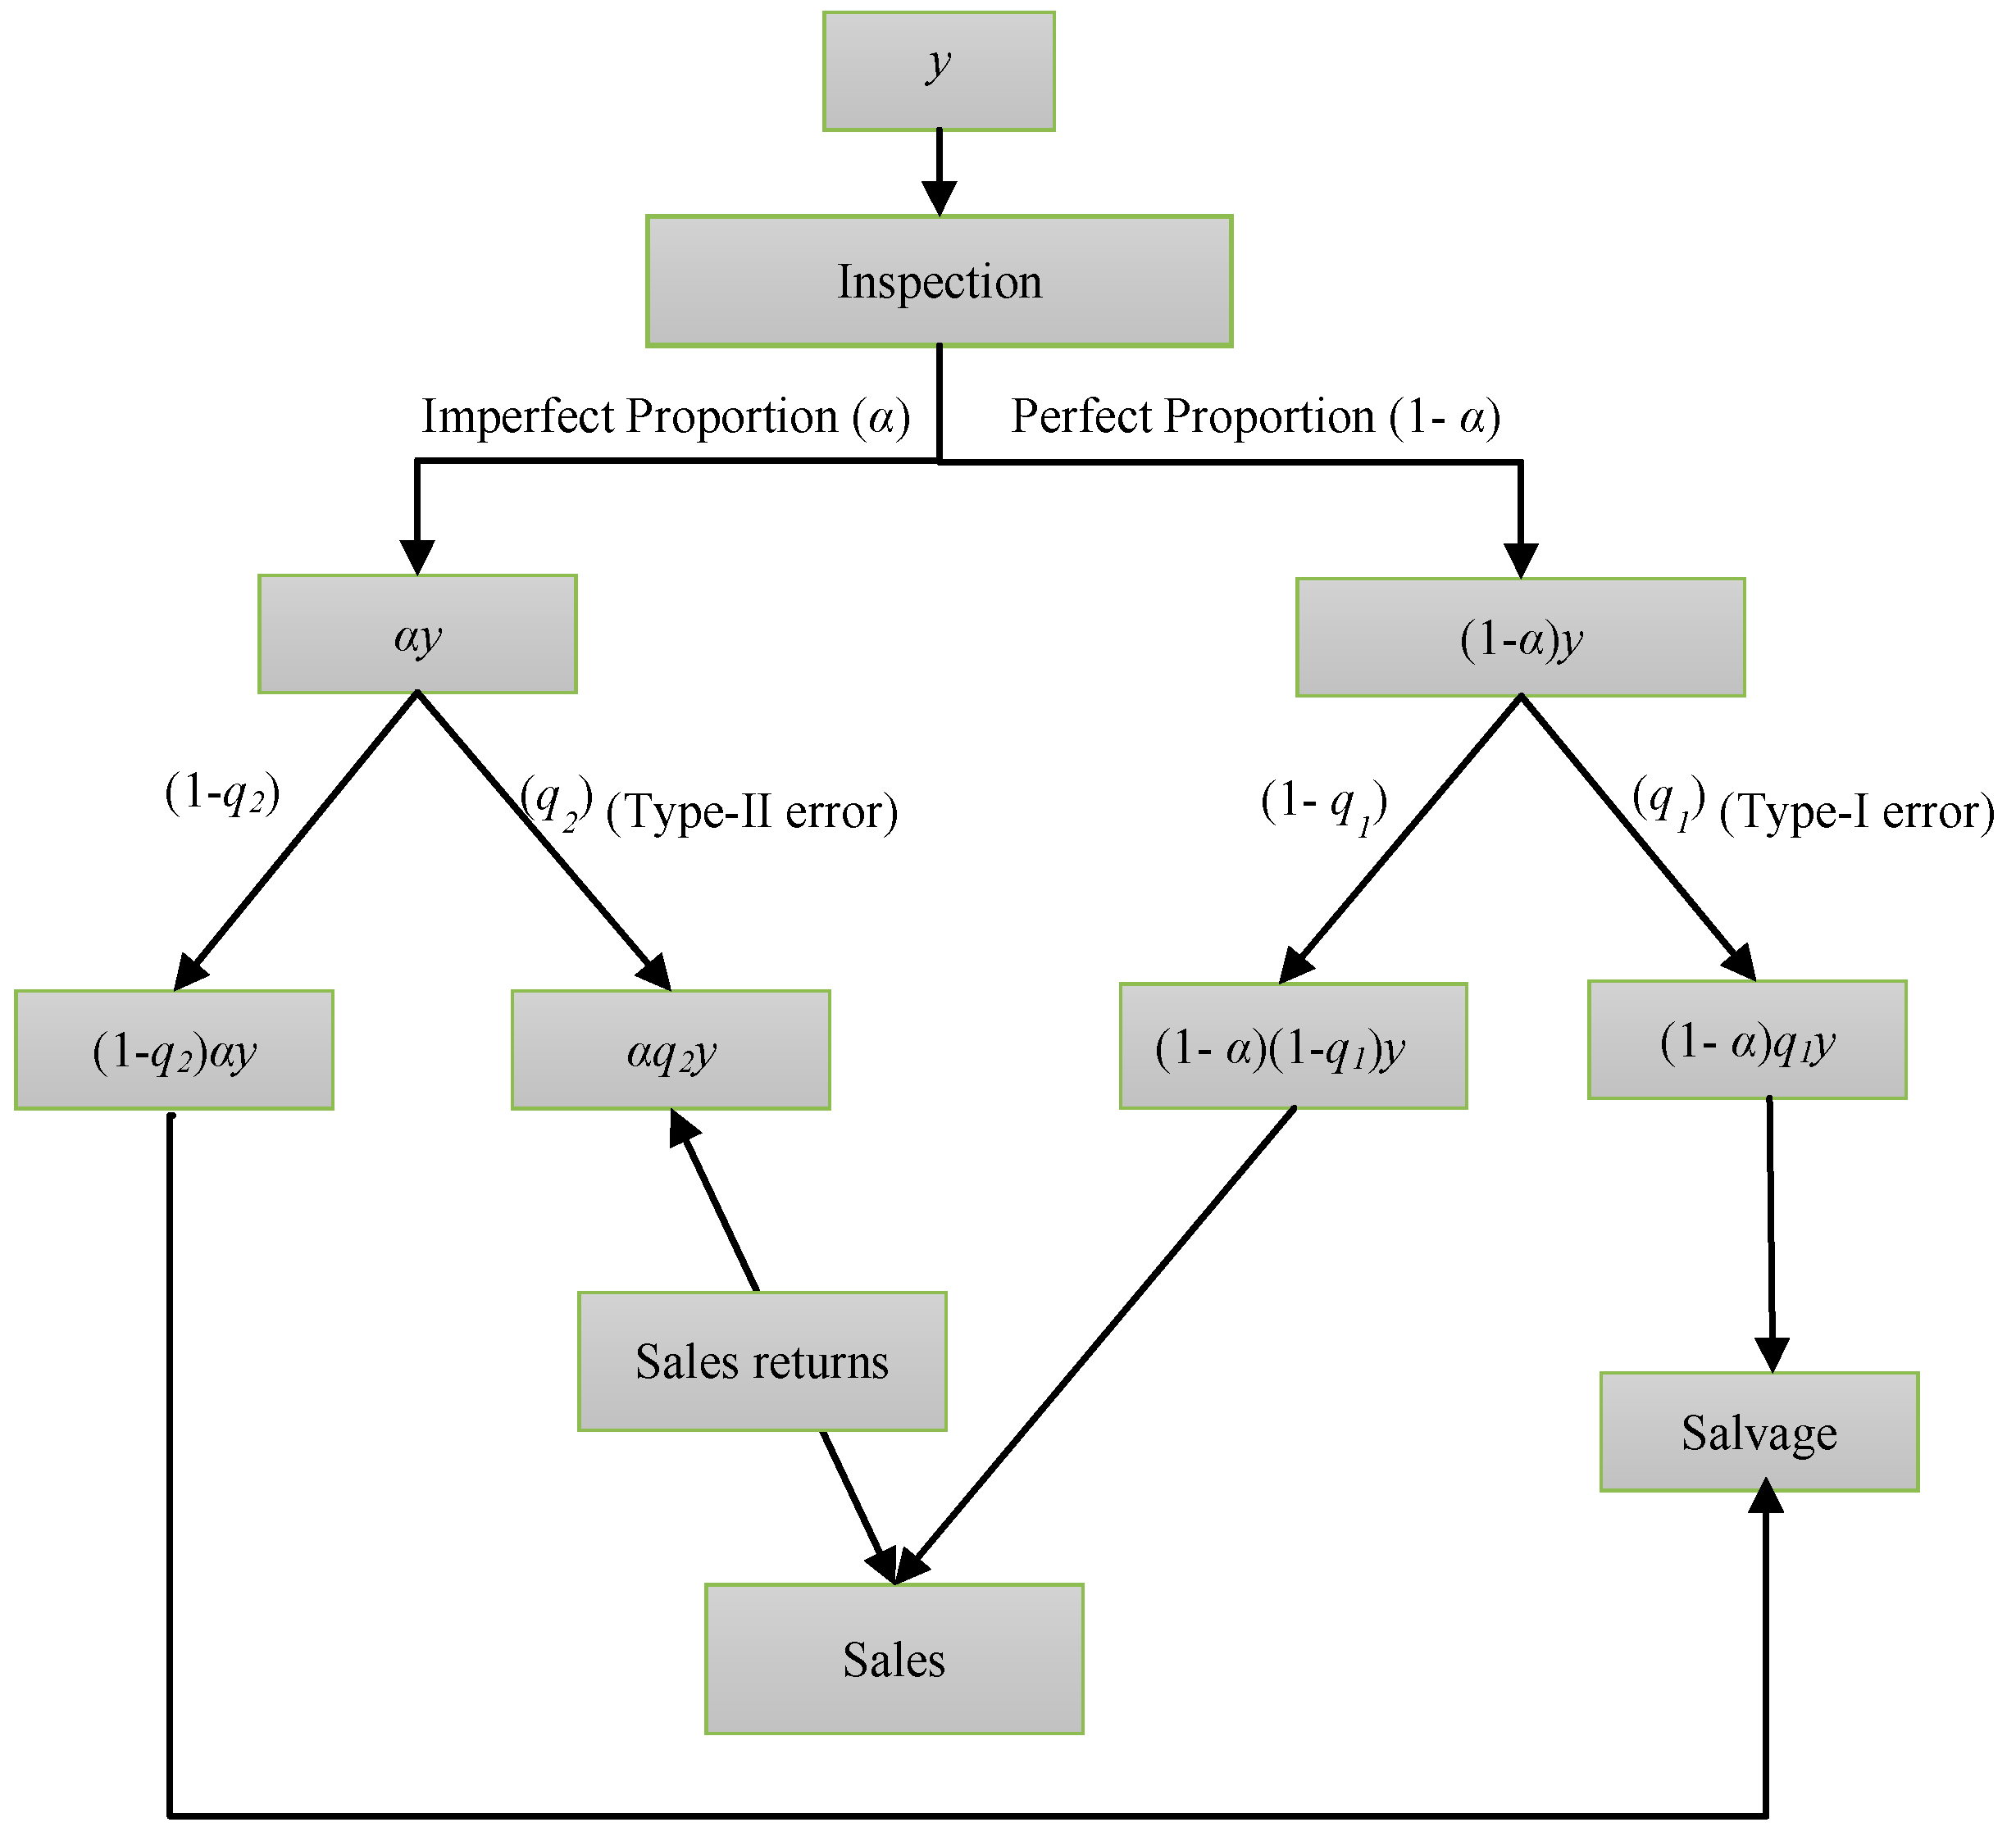
At the beginning of the cycle, the inspection and sale of perfect items start simultaneously at the whole seller’s side. However, due to some errors committed by the inspector, there is the occurrence of Type-I and Type-II errors, with their respective proportions being q1 = Pr(items screened as defects | non-defective items) and q2 = Pr(items not screened as defects | defective items)(0 < q1 < q2 < 1), following the probability density function of f(q1) and f(q2), respectively. It is assumed that (q1) and (q2) are independent of defect proportions (α). All of the items involving inspection errors are estimated inter-dependently by (q1), (q2), and (y). The flow of events is illustrated in Figure 3.
As explained from Figure 3, the demand D is satisfied through perfect items only, i.e., α q 2 y + ( 1 α ) ( 1 q 1 ) y . The B items that are intended to eliminate the backorders in each cycle are filled at the rate of [ α q 2 + ( 1 α ) ( 1 q 1 ) ] λ D . Let the proportion of perfect items be denoted as P.
Therefore ,   P = α q 2 + ( 1 α ) ( 1 q 1 ) .
Since P is a combination of random variables viz. α, q1, q2, P is a random variable.
E [ P ] = E [ α ] E [ q 2 ] + ( 1 E [ α ] ) ( 1 [ q 1 ] ) ,
where E[.] is the expected value operator.
Cycle length (T) = total number of perfect items sold/demand rate, i.e.:
T = α q 2 y + ( 1 α ) ( 1 q 1 ) y D = P y D ,
E [ T ] = E [ P ] y D .
i.e.:
E [ T ] = { E [ α ] E [ q 2 ] + ( 1 E [ α ] ) ( 1 E [ q 1 ] ) } y D .
On account of a Type-I error, the whole seller rejects a fraction (1 − α)q1y of perfect items (1 − α)y, while as a result of a Type-II error, he accepts a fraction (αq2y) of the total defectives (αy) by mistake. Due to quality dissatisfaction by the sale of defective items, the fraction (αq2y) re-enters the system continuously, similar to demand, until the end of inspection process (t3), and it is held in the inventory for a complete cycle length (T). It is assumed that all of the sales returns (αq2y), referred as (B2), are not replaced with perfect items, but are refunded fully. Thus, the total items to be salvaged immediately after the inspection process at a reduced price (v) are ((1 − q2)αy + (1 − α)q1y), and these are referred to as (B1) in the study. In total, the imperfect inspection process leaves (1 − q2)αy and (1 − α)(1 − q1)αy as the actual defectives and non-defectives, respectively. The final outcome of the perfect items ready for sale after the assimilation of inspection errors is ((1 − α)(1 − q1)y + αq2y).
So ,   the   total   items   salvaged   are   B 1 = α ( 1 q 2 ) y + ( 1 α ) q 1 y .
And ,   the   total   sales   returns   are   B 2 = α q 2 y .
The perfect items coming out of the inspection process are first used to satisfy the demand at the rate of ((1 − α)(1 − q1) + αq2)λ. Then, the remaining perfect items are used to satisfy the shortages. During the time t1, all the shortages are completely eliminated from the inventory cycle, as detailed below:
t 1 = B [ α q 2 + ( 1 α ) ( 1 q 1 ) ] λ D = B P λ D .
Since, it is beneficial for the whole seller to allow a certain amount of shortage as these to help with cutting down inventory-holding costs to a significant level, time period t2 is assigned to gather shortages, which are assumed to be fully backlogged in the model in the following manner:
t 2 = B D .
In order to compete in the imperfect quality environment, it becomes essential to inspect the entire lot before reaching out in the mainstream. Thus, the inspection time is calculated as below:
t 3 = y λ .
After the end of the inspection process, the inventory level gradually decreases only due to demand (D), and reaches zero at time (T1).
Thus ,   T = T 1 + t 2 .
i . e . ,   T 1 = T t 2 = P y B D ,
Therefore ,   T 1 = z D + t 3 .
The value of z can be obtained by equating Equations (10), (12), and (13) as follows:
z = y ( P D λ ) B .

2.3.1. Relevant Costs

Various cost components taken into account are:
(i)
Setup cost, which includes the fixed cost per cycle, i.e.:
S C = A .
(ii)
Purchase cost which includes variable cost per cycle, i.e.:
P C = c y .
(iii)
Inspection cost, which includes the cost of inspections per cycle, i.e.:
I C = i y .
(iv)
Type-I error cost, which includes the cost of rejecting a perfect item, i.e.:
E C 1 = c r ( 1 α ) q 1 y .
(v)
Type-II error cost, which includes the cost of accepting an imperfect item, i.e.:
E C 2 = c a α q 2 y .
(vi)
The inventory holding cost is the cost of carrying all non-defectives and defective items, plus the items returned from the market, i.e.:
H C = h { 1 2 ( 2 y ( B + D t 1 ) ) t 1 + 1 2 ( y ( B + D t 1 ) + z + B 1 ) ( t 3 t 1 ) + 1 2 z ( T t 3 ) + 1 2 B 2 T } .
(vii)
Backordering cost is the cost of the total shortages that have occurred, i.e.:
B C = 1 2 c B B ( t 1 + t 2 )
Therefore, by using Equations (15)–(21), the total cost per cycle is given by:
Total cost (T.C.) = SC + PC + IC + EC1 + EC2 + HC + BC
= A + y [ c + i + c r ( 1 α ) q 1 + c a α q 2 ] + y { h B P λ D h B 2 λ ( 1 + D P λ D ) h B 2 λ h B 2 ( P λ D ) h B 2 ( P λ D ) ( P D λ ) h B [ α ( 1 q 2 ) + ( 1 α ) q 1 ] 2 ( P λ D ) h B D ( P D λ ) } + y 2 { h 1 2 λ + h 1 2 λ ( P D λ ) + h 1 2 λ [ α ( 1 q 2 ) + ( 1 α ) q 1 ] + h 1 2 D ( P D λ ) 2 + h α q 2 P 2 D } + B 2 { h 1 2 ( P λ D ) ( 1 + D P λ D ) + h 1 P λ D + h D 2 ( P λ D ) 2 + h 1 2 D } + 1 2 c B B 2 ( 1 P λ D + 1 D )

2.3.2. Sales Revenue

The total sales revenue consists of four parts:
(i)
The sales from sorted perfect items is:
R 1 = s [ α q 2 y + ( 1 α ) ( 1 q 1 ) y ] .
(ii)
Revenue loss from sales return:
R 2 = s α q 2 y .
(iii)
Revenue loss from bad debts:
R 3 = [ s ( 1 δ ) ] [ ( 1 α ) ( 1 q 1 ) ] [ ( 1 R ) ( 1 K ) ] y .
(iv)
Sales from total scrap items:
R 4 = v ( B 1 + B 2 ) = v [ α ( 1 q 2 ) y + ( 1 α ) q 1 y + α q 2 y ] .
Therefore, by using Equations (24)–(27), the total sales revenue per cycle is given by:
Total revenue (T.R.) = R1 + R2 + R3 +R4
= s ( 1 α ) ( 1 q 1 ) y s ( 1 δ ) ( 1 R ) ( 1 K ) ( 1 α ) ( 1 q 1 ) y + v [ α ( 1 q 2 ) y + ( 1 α ) q 1 y + α q 2 y ] .

2.3.3. Expected Total Profit per Unit Time

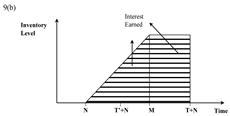
In the present model, two-stage trade credit policies are used differently via the upstream and downstream supply chains. The whole seller receives a credit period M from the manufacturer, and offers a credit period N to his subsequent downstream retailers. By offering full trade credit to all his old retailers, the whole seller starts earning interest from N up to M. Since, partial trade credit is given to all new retailers, therefore, the whole seller fetches a fraction of the purchase amount initially (i.e., immediate payment), and earns interest from time 0 to M. The remaining part (i.e., delayed payment) is paid at time N by good retailers only. From the bad credit retailers, the whole seller does not receive any delayed payment, and funds the amount from his own pocket. Hence, in addition to the unsold inventory, the whole seller finances a portion of the sold inventory (i.e., bad debts) from M to T.
Thus, depending upon the value of M, N, and T, eight different cases arise. The interest earned and paid is calculated distinctly for old and new retailers. For new retailers, immediate and delayed payment parts have been presented:
Case (i) M ≤ N ≤T’ ≤ TCase (v) N ≤ t3 + N ≤ M ≤ T + N
Case (ii) T ≤ M ≤ NCase (vi) N ≤ T ≤ M ≤ T + N ≤ T + N
Case (iii) N ≤ M ≤ t1 ≤ t1 + N ≤ T + NCase (vii) N ≤ T + N ≤ M ≤ T + N
Case (iv) N ≤ t1 + N ≤ M ≤ t3 + N ≤ T + NCase (viii) N ≤ T’ + N ≤ T + N ≤ M
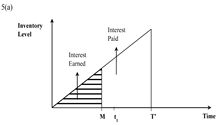
Case (i) MNT’T
This is the case of the smallest credit period when the first payment is still due from the retailers towards the whole seller. However, there is little interest that is earned from the initial payments made by all of the new retailers. Hence, the whole seller arranges the finances for the whole inventory to pay to the manufacturer at the time of settlement of his account (See Table 2).
Subcase 1: Interest earned and interest paid from the portion of old retailers (K)
The credit period M lies before the first payment N, so that there is no interest earned, while interest is paid on the entire inventory for the portion of old retailers.
Interest   earned   ( I e 11 ) = 0
Interest   payable   ( I p 11 ) = 1 2 c I p K [ P y D M ( P λ D ) M ] ( T M ) + 1 2 c I p K D T 2 + c I p K D T ( N M ) + 1 2 c I p K ( P λ D ) t 1 2 + c I p K B ( N M )
Part 1: Immediate payment (δ)
The whole seller starts accumulating revenue from time 0 by the initial payment that is made by all of the new retailers, and he earns interest till M. The interest is paid by him into the inventory for the fraction of the initial price unsold to the portion of new retailers.
Interest   earned   ( I e 12 ) = 1 2 δ p I e ( 1 K ) D M 2 + 1 2 δ p I e ( 1 K ) ( P λ D ) M 2 .
Interest   payable   ( I p 12 ) = 1 2 δ c I p ( 1 K ) [ P y D M ( P λ D ) M ] ( T M )
Part 2: Delayed payment (1 − δ)
Since the first payment remains due by the new retailers, the whole seller funds the full inventory on the remaining fraction of the selling price. Here, the whole seller is not earning any interest:
Interest   earned   from   good   retailers   ( I e 13 ) = 0
Interest   payable   due   to   bad   debts   ( I p 13 )
Interest   payable   on   the   unsold   inventory ( I p 14 ) = 1 2 ( 1 δ ) c I p ( 1 K ) [ P y D M ( P λ D ) M ] ( T M ) + 1 2 ( 1 δ ) c I p ( 1 K ) D T 2 + ( 1 δ ) c I p ( 1 K ) D T ( N M ) + 1 2 ( 1 δ ) c I p ( 1 K ) ( P λ D ) t 1 2 + ( 1 δ ) c I p ( 1 K ) B ( N M )
Furthermore, there is additional interest paid on the salvage items in the present Case (i), for the period (M, t3 + N).
Interest   payable   on   salvage   items   ( I p 15 ) = c I p [ α y + ( 1 α ) q 1 y ] ( t 3 + N M )
Total   Profit   T . P . 1 = T . R . T . C . + I e 11 + I e 12 + I e 13 I p 11 I p 12 I p 13 I p 14 I p 15
i . e . , T . P . 1 = y G 1 y 2 G 2 + B G 3 B 2 G 4 + y B G 5 + G 6
where G 1 , , G 6 is expanded in Appendix A.
As G 1 , G 2 , , G 6 comprise of terms of random variables, viz., α , q 1 , q 2 , therefore, by using the Maddah and Jaber [33] approach, one can obtain the expected value of the total profit per unit time:
E [ Z 1 ( y , B ) ] = { E [ G 1 ] E [ P ] D E [ G 2 ] E [ P ] D y + E [ G 3 ] E [ P ] D B y E [ G 4 ] E [ P ] D B 2 y + E [ G 5 ] E [ P ] D B + E [ G 6 ] E [ P ] D y }
where E [ G 1 ] is elaborated in Appendix B, and likewise other expectations can be derived.
Case (ii) TMN
In this case, interest is earned from the immediate part of the partial payment only. The remaining inventory, which includes both defectives and perfect items, is sold to old and new retailers. However, he takes a loan to finance this stock (see Table 2).
Subcase 2: Interest earned and interest paid from the portion of old retailers (K)
From the portion of old retailers, the whole seller finances the complete stock. Since M lies before the first payment time N, so there is additional interest that is paid on both, viz., the entire inventory, and shortages for the period (M, N) and (M, t3 + N), respectively.
Interest   earned   ( I e 21 ) = 0
Interest   payable   ( I p 21 ) = 1 2 c I p K D T 2 + c I p K D T ( N M ) + 1 2 c I p K ( P λ D ) t 1 2 + c I p K B ( t 1 + N M )
Subcase 3: Interest earned and interest paid from the portion of new retailers (1 − K)
From the proportion of new retailers, there is interest earned on the immediate payment part only. Funds are arranged to make the payment for the unsold inventory for the fraction of remaining selling price from the new retailers.
Part 1: Immediate payment (δ)
From the initial partial payment made by all the new retailers, the whole seller earns interest on the revenue generated from sales up to M. There is extra interest that is gained on an entire lot of inventory and shortages for lengths (MT’) and (Mt1), respectively.
Interest   earned   ( I e 22 ) = 1 2 δ s I e ( 1 K ) D T 2 + δ s I e ( 1 K ) D T ( M T ) + 1 2 δ s I e ( 1 K ) ( P λ D ) t 1 2 + δ s I e ( 1 K ) B ( M t 1 )
Interest   payable   ( I p 22 ) = 0
Part 2: Delayed payment (1 − δ)
From the delayed payment, there is no interest earned, since the first payment has not been made by any retailer until M. The whole seller has to finance the complete lot by the time of settlement of his account with the manufacturer.
Interest   earned   from   good   retailers   ( I e 23 ) = 0
Interest   payable   due   to   bad   debts   ( I p 23 ) = 0
Interest   payable   on   the   unsold   inventory ( I p 24 ) = 1 2 ( 1 δ ) c I p ( 1 K ) D T 2 + ( 1 δ ) c I p ( 1 K ) D T ( N M ) + 1 2 ( 1 δ ) c I p ( 1 K ) ( P λ D ) t 1 2 + ( 1 δ ) c I p ( 1 K ) B ( t 1 + N M )
Furthermore, there is additional interest that is paid on the salvage items in the present Case (ii), for the period (M, t3 + N).
Interest   payable   on   salvage   items ( I p 25 ) = c I p [ α y + ( 1 α ) q 1 y ] ( t 3 + N M )
Total   Profit   T . P . 2 = T . R . T . C . + I e 21 + I e 22 + I e 23 I p 21 I p 22 I p 23 I p 24 I p 25
i . e . ,   T . P . 2 = y G 7 y 2 G 8 + B G 9 B 2 G 10 + y B G 11 + G 12 .
where G 7 , , G 12 is expanded in Appendix A.
As G 7 , , G 12 comprise of terms of random variables, viz., α , q 1 , q 2 , therefore, by using the Maddah and Jaber [33] approach, one can obtain the expected value of the total profit per unit time:
E [ Z 2 ( y , B ) ] = { E [ G 7 ] E [ P ] D E [ G 8 ] E [ P ] D y + E [ G 9 ] E [ P ] D B y E [ G 10 ] E [ P ] D B 2 y + E [ G 11 ] E [ P ] D B + E [ G 12 ] E [ P ] D y }
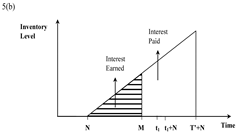
Case (iii) NMt1t1 + NT + N
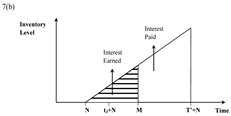
In this case, the whole seller earns interest from the sales that are drawn from both old and new (good only) retailers, whose payments commence from N onwards. Thus, there is interest earned from all the new retailers by the initial payment that is made for the period (0, M). There is additional interest paid by the whole seller, due to the portion of bad debts apart from the unsold inventory and salvage items (see Table 2).
Subcase 4: Interest earned and interest paid from the portion of old retailers (K)
The whole seller earns interest from old retailers as per demand consumption and shortage backordering for the time period N to M. Since all the credit sales are not realized until M, the whole seller pays interest on the unsold inventory for the fraction of old retailers.
Interest   earned   ( I e 31 ) = 1 2 s I e K D ( M N ) 2 + 1 2 s I e K ( P λ D ) ( M N ) 2 .
Interest   payable ( I p 31 ) = 1 2 c I p K [ P y D ( M N ) ( P λ D ) ( M N ) ] ( T + N M ) .
Subcase 5: Interest earned and interest paid from the portion of new retailers (1 − K)
In contrast to the previous sub case, the whole seller pays interest in three subparts from the fraction of new retailers. However, he earns interest from both the immediate and delayed parts of the partial payments.
Part 1: Immediate payment (δ)
From the initial partial payment made by all the new retailers, the whole seller earns interest for the period (0, M), as per demand and shortage fulfillment. He pays interest on the unsold inventory for the fraction of the initial price paid by all the new retailers from time M to T’.
Interest   earned   ( I e 32 ) = 1 2 δ s I e ( 1 K ) D M 2 + 1 2 δ s I e ( 1 K ) ( P λ D ) M 2 .
Interest   payable   ( I p 32 ) = 1 2 δ c I p ( 1 K ) [ P y D M ( P λ D ) M ] ( T M )
Part 2: Delayed payment (1 − δ)
From the delayed payment, the interest-earning period for the whole seller starts from N up to M, as he begins to receive his first payment at N by the good retailers only. Interest is payable on the unsold items in stock for the remaining fraction of the price by the portion of new retailers for the time M to T’ + N, and for the inventory sold to bad retailers.
Interest   earned   from   good   retailers ( I e 33 ) = 1 2 ( 1 δ ) s I e R ( 1 K ) D ( M N ) 2 + 1 2 ( 1 δ ) s I e R ( 1 K ) ( P λ D ) ( M N ) 2
Interest   payable   due   to   bad   debts ( I p 33 ) = 1 2 ( 1 δ ) c I p ( 1 R ) ( 1 K ) D ( M N ) 2 + 1 2 ( 1 δ ) c I p ( 1 R ) ( 1 K ) ( P λ D ) ( M N ) 2
Interest   payable   on   the   unsold   inventory ( I p 34 ) = 1 2 ( 1 δ ) c I p ( 1 K ) [ P y D ( M N ) ( P λ D ) ( M N ) ] ( T + N M )
Furthermore, there is additional interest paid on the salvage items in Case (iii) for the period (M, t3 + N).
Interest   payable   on   salvage   items   ( I p 35 ) = c I p [ α y + ( 1 α ) q 1 y ] ( t 3 + N M ) .
Total   Profit   T . P . 3 = T . R . T . C . + I e 31 + I e 32 + I e 33 I p 31 I p 32 I p 33 I p 34 I p 35
i . e . ,   T . P . 3 = y G 13 y 2 G 14 + B G 15 B 2 G 16 + y B G 17 + G 18 .
where G 13 , , G 18 is expanded in Appendix A.
As G 13 , , G 18 comprise of terms of random variables viz. α , q 1 , q 2 , therefore, by using the Maddah and Jabber [33] approach, one can obtain the expected value of the total profit per unit time:
E [ Z 3 ( y , B ) ] = { E [ G 13 ] E [ P ] D E [ G 14 ] E [ P ] D y + E [ G 15 ] E [ P ] D B y E [ G 16 ] E [ P ] D B 2 y + E [ G 17 ] E [ P ] D B + E [ G 18 ] E [ P ] D y } .
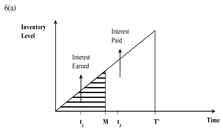
Case (iv) Nt1 + NMt3 + NT + N
In addition to the interest earned and paid as in the previous Case (iii), the whole seller not only earns interest on the demand and shortage backorder, but thus on a complete lot of shortages, since it is fully eliminated by the time of settlement of the account. Interest is paid on the unsold inventory and salvage items, and thus on the inventory sold to bad credit retailers (see Table 2).
Subcase 6: Interest earned and interest paid from the portion of old retailers (K)
The whole seller earns interest from old retailers as per the sales, through demand and shortage satisfaction for the time period N to M, and on a complete lot of shortages from t1 + N to M. Since all of the items are not sold until M, the whole seller pays interest on the unsold inventory for the fraction of old retailers.
Interest   earned   ( I e 41 ) = 1 2 s I e K D ( M N ) 2 + 1 2 s I e K ( P λ D ) t 1 2 + s I e K B ( M t 1 N ) .
Interest   payable   ( I p 41 ) = 1 2 c I p K [ P y D ( M N ) B ] ( T + N M ) .
Subcase 7: Interest earned and interest paid from the portion of new retailers (1 − K)
In this sub case, the whole seller pays interest in three subparts from the fraction of new retailers. He also earns interest from both the immediate and delayed parts of the partial payments made.
Part 1: Immediate payment (δ)
From the initial partial payment made by all of the new retailers, the whole seller earns interest on the revenue generated from sales through demand and shortage fulfillment, up to M. Further, he pays interest on the unsold inventory for the fraction of the initial price that is made by all the new retailers from period (M, T’), excluding the shortages, as these are completely eliminated and compensated by t1 + N.
Interest   earned   ( I e 42 ) = 1 2 δ s I e ( 1 K ) D M 2 + 1 2 δ s I e ( 1 K ) ( P λ D ) t 1 2 + δ s I e ( 1 K ) B ( M t 1 ) .
Interest   payable   ( I p 42 ) = 1 2 δ c I p ( 1 K ) ( P y D M B ) ( T M ) .
Part 2: Delayed payment (1 − δ)
From the delayed payment, the whole seller starts earning interest on the demand satisfied by good retailers, only from time N to M. Since shortages have been met at t1 + N, there is additional interest that is generated from them. Finances are arranged for the unsold inventory, and thus for the items sold to bad credit customers.
Interest   earned   from   good   retailers ( I e 43 ) = 1 2 ( 1 δ ) s I e R ( 1 K ) D ( M N ) 2 + 1 2 ( 1 δ ) s I e R ( 1 K ) ( P λ D ) t 1 2 + ( 1 δ ) s I e R ( 1 K ) B ( M t 1 N )
Interest   payable   due   to   bad   debts ( I p 43 ) = 1 2 ( 1 δ ) c I p ( 1 R ) ( 1 K ) D ( M N ) 2 + 1 2 ( 1 δ ) c I p ( 1 R ) ( 1 K ) ( P λ D ) t 1 2 + ( 1 δ ) c I p ( 1 R ) ( 1 K ) B ( M t 1 N )
Interest   payable   on   the   unsold   inventory ( I p 14 ) ( I p 44 ) = 1 2 ( 1 δ ) c I p ( 1 K ) [ P y D ( M N ) B ] ( T + N M )
Furthermore, there is additional interest paid on the salvage items in this Case (iv) for the period (M, t3 + N).
Interest   payable   on   salvage   items ( I p 45 ) = c I p [ α y + ( 1 α ) q 1 y ] ( t 3 + N M ) .
Total   Profit   T . P . 4 = T . R . T . C . + I e 41 + I e 42 + I e 43 I p 41 I p 42 I p 43 I p 44 I p 45
Therefore , T . P . 4 = y G 19 y 2 G 20 + B G 21 B 2 G 22 + y B G 23 + G 24 .
where G 19 , , G 24 is expanded in Appendix A.
As G 19 , , G 24 comprise of terms of random variables, viz., α , q 1 , q 2 , therefore, by using the Maddah and Jaber [33] approach, we obtain the expected value of the total profit per unit time:
E [ Z 4 ( y , B ) ] = { E [ G 19 ] E [ P ] D E [ G 20 ] E [ P ] D y + E [ G 21 ] E [ P ] D B y E [ G 22 ] E [ P ] D B 2 y + E [ G 23 ] E [ P ] D B + E [ G 24 ] E [ P ] D y } .
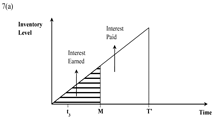
Case (v) Nt3 + NMT’ + N
In this case, all of the expressions coincide with that of the previous case, except for the value of the salvage items. Here, interest is earned on a lot of scrap items instead of paying (see Table 2).
Subcase 8: Interest earned and interest paid from the portion of old retailers (K)
Here, the whole seller earns interest from the sales acquired from old retailers as per demand as well as shortages till M. Interest is paid on the unsold inventory after time point M. So, the results are similar to those discussed in subcase 6.
Interest   earned   ( I e 51 ) = I e 41
Interest   payable   ( I p 51 ) = I p 41
Subcase 9: Interest earned and interest paid from the portion of new retailers (1 − K)
Here, the whole seller earns interest from the portion of good retailers only while pays undue interest because of the bad debtors assumed in the model. There is also interest charged on the unsold items in the inventory as discussed in subcase 7.
Part 1: Immediate payment (δ)
Interest   earned   ( I e 52 ) = I e 42
Interest   payable   ( I p 52 ) = I p 42
Part 2: Delayed payment (1 − δ)
Interest   earned   from   good   retailers ( I e 53 ) = I e 43
Interest   payable   due   to   bad   debts ( I p 53 ) = I p 43
Interest   payable   on   the   unsold   inventory ( I p 54 ) = I p 44
In the present Case (v), there is interest earned on the salvage items for the period (t3 + N, M).
Interest   earned   on   salvage   items ( I e 54 ) = v I e [ α y + ( 1 α ) q 1 y ] ( M t 3 N )
Total   Profit   T . P . 5 = T . R . T . C . + I e 51 + I e 52 + I e 53 I p 51 I p 52 I p 53 I p 54 I p 55
Thus ,   T . P . 5 = y G 25 y 2 G 26 + B G 27 B 2 G 28 + y B G 29 + G 30 .
where G 24 , , G 30 is expanded in Appendix A.
As G 24 , , G 30 comprise of the terms of random variables, viz., α , q 1 , q 2 , therefore, by using the Maddah and Jaber [33] approach, the expected value of the total profit per unit time is as follows:
E [ Z 5 ( y , B ) ] = { E [ G 25 ] E [ P ] D E [ G 26 ] E [ P ] D y + E [ G 27 ] E [ P ] D B y E [ G 28 ] E [ P ] D B 2 y + E [ G 29 ] E [ P ] D B + E [ G 30 ] E [ P ] D y }
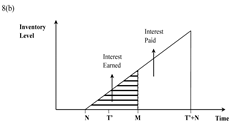
Case (vi) NT’MT’ + NT + N
In this case, the whole seller earns interest, not only from the current demand, but thus by the demand that is backordered from both old and new retailers. Interest is earned on the whole amount of shortages and salvage items. On the other hand, interest is paid on the unsold inventory, and thus on a fraction of the sold inventory due to bad debts. The difference from the previous cases lies in the calculations of the immediate part (see Table 2).
Subcase 10: Interest earned and interest paid from the portion of old retailers (K)
The whole seller earns interest on the average sales revenue that is received during the period (N, M) through demand and shortage satisfaction. After time t1 + N, interest is earned on the full shortage level up to M. Since all of the items are not sold till M, the whole seller finances the unsold inventory for the fraction of the old retailers.
Interest   earned ( I e 61 ) = 1 2 s I e K D ( M N ) 2 + 1 2 s I e K ( P λ D ) t 1 2 + s I e K B ( M t 1 N ) .
Interest   payable ( I p 61 ) = 1 2 c I p K [ P y D ( M N ) B ] ( T + N M ) .
Subcase 11: Interest earned and interest paid from the portion of new retailers (1 − K)
In this sub case, apart from the unsold inventory, the whole seller pays interest only in the delayed part, and not in the immediate part. However, he earns interest on both the shortages and demand in the immediate and delayed parts of the partial payments made.
Part 1: Immediate payment (δ)
There is no item remaining in the stock in this part of the partially permissible delay. So, no interest is paid, while interest is earned on the full inventory, along with the shortages on the fraction of the initial price that is paid by all of the new retailers until credit limit M.
Interest   earned ( I e 62 ) = 1 2 δ I e s ( 1 K ) D T 2 + δ s I e ( 1 K ) D T ( M T ) + 1 2 δ s I e ( 1 K ) ( P λ D ) t 1 2 + δ s I e ( 1 K ) B ( M t 1 ) .
Interest   payable ( I p 62 ) = 0 .
Part 2: Delayed payment (1 − δ)
The whole seller earns interest on the demand that is satisfied by good retailers, only from time N to M from the delayed payment. Again, there is additional interest that is generated from shortages, since these have been fully met by t1 + N. The unsold inventory is financed, along with the items sold to bad credit customers from the whole seller’s own pocket.
Interest   earned   from   good   retailers ( I e 63 ) = 1 2 ( 1 δ ) s I e R ( 1 K ) D ( M N ) 2 + 1 2 ( 1 δ ) s I e R ( 1 K ) ( P λ D ) t 1 2 + ( 1 δ ) s I e R ( 1 K ) B ( M t 1 N )
Interest   payable   due   to   bad   debts ( I p 63 ) = 1 2 ( 1 δ ) c I p ( 1 R ) ( 1 K ) D ( M N ) 2 + 1 2 ( 1 δ ) c I p ( 1 R ) ( 1 K ) ( P λ D ) t 1 2 + ( 1 δ ) c I p ( 1 R ) ( 1 K ) B ( M t 1 N )
Interest   payable   on   the   unsold   inventory ( I p 64 ) = 1 2 ( 1 δ ) c I p ( 1 K ) [ P y D ( M N ) B ] ( T + N M ) .
Furthermore, there is additional interest earned on the salvage items in Case (vi) for the period (t3 + N, M).
Interest   earned   on   salvage   items ( I e 64 ) = v I e [ α y + ( 1 α ) q 1 y ] ( M t 3 N ) .
Total   Profit   T . P . 6 = T . R . T . C . + I e 61 + I e 62 + I e 63 + I e 64 I p 61 I p 62 I p 63 I p 64
Hence ,   T . P .6 = y G 31 y 2 G 32 + B G 33 B 2 G 34 + y B G 35 + G 36 .
where G 31 , , G 36 is expanded in Appendix A.
As G 31 , , G 36 comprise of terms of random variables, viz., α , q 1 , q 2 , therefore, by using Maddah and Jaber [33] approach, one can get the expected value of total profit per unit time:
E [ Z 6 ( y , B ) ] = { E [ G 31 ] E [ P ] D E [ G 32 ] E [ P ] D y + E [ G 33 ] E [ P ] D B y E [ G 34 ] E [ P ] D B 2 y + E [ G 35 ] E [ P ] D B + E [ G 36 ] E [ P ] D y } .
Case (vii) NT’ + NMT + N
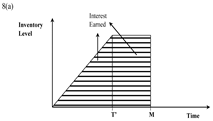
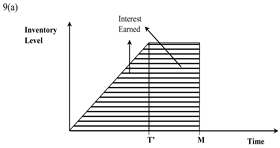
This is the case of the largest credit period, where the entire inventory level becomes zero before the credit limit M. Thus, in this scenario, there is no interest that is paid by the whole seller, except for some bad debts. Interest is earned on the sales that are consumed by demand and shortages. Further, there is additional interest earned on the backordered lot of shortages for (M − t3N) length of time, and on the complete lot for the time period (T’ + N,M) (see Table 2).
Subcase 12: Interest earned and interest paid from the portion of old retailers (K)
The whole seller earns interest on average sales revenue for the period (0, T’), and on full sales revenue for a length of (M − T’ − N) from the portion of the old retailers. Since all of the items are exhausted by M, there is no interest paid.
Interest   earned   ( I e 71 ) = 1 2 s I e K D T 2 + s I e K D T ( M T N ) + 1 2 s I e K ( P λ D ) t 1 2 + s I e K B ( M t 1 N ) .
Interest   payable ( I p 71 ) = 0
Subcase 13: Interest earned and interest paid from the portion of new retailers (1 − K)
Interest is not paid because of zero leftover stock in both parts of the partially permissible delay. However, some interest is still paid on the sold and unfinanced inventory in the delayed part, due to bad retailers.
Part 1: Immediate payment (δ)
Interest is earned on the whole lot and on shortages by the fraction of instant payment made by all of the new retailers. Since there is no inventory left in stock, no interest is paid by the whole seller.
Interest   earned   ( I e 72 ) = 1 2 δ s I e ( 1 K ) D T 2 + δ s I e ( 1 K ) D T ( M T ) + 1 2 δ s I e ( 1 K ) ( P λ D ) t 1 2 + δ s I e ( 1 K ) B ( M t 1 ) .
Interest   payable ( I p 72 ) = 0
Part 2: Delayed payment (1 − δ)
From the delayed payment, interest is earned on revenue generated from sales up to M on the remaining partial payment made by good retailers only. There is additional interest earned on the full inventory and on all of the shortages. However, there is some interest paid on the remaining payment from the proportion of bad credit retailers.
Interest   earned   from   good   retailers ( I e 73 ) = 1 2 ( 1 δ ) s I e R ( 1 K ) D T 2 + ( 1 δ ) s I e R ( 1 K ) D T ( M T N ) + 1 2 ( 1 δ ) s I e R ( 1 K ) ( P λ D ) t 1 2 + ( 1 δ ) s I e R ( 1 K ) B ( M t 1 N )
Interest   payable   due   to   bad   debts ( I p 73 ) = 1 2 ( 1 δ ) c I p ( 1 R ) ( 1 K ) D T 2 + ( 1 δ ) c I p ( 1 R ) ( 1 K ) D T ( M T N ) + 1 2 ( 1 δ ) c I p ( 1 R ) ( 1 K ) ( P λ D ) t 1 2 + ( 1 δ ) c I p ( 1 R ) ( 1 K ) B ( M t 1 N )
Interest   payable   on   the   unsold   inventory ( I p 74 ) = 0
Furthermore, there is additional interest that is earned on the salvage items in Case (vii) for the period (t3 + N, M).
Interest   earned   on   salvage   items ( I e 74 ) = v I e [ α y + ( 1 α ) q 1 y ] ( M t 3 N ) .
Total   Profit   T . P . 7 = T . R . T . C . + I e 71 + I e 72 + I e 73 + I e 74 I p 71 I p 72 I p 73 I p 74
Thus ,   T . P . 7 = y G 37 y 2 G 38 + B G 39 B 2 G 40 + y B G 41 + G 42 .
where G 37 , , G 42 is expanded in Appendix A.
As G 37 , , G 42 comprise of terms of random variables, viz., α , q 1 , q 2 , therefore, by using the Maddah and Jaber [33] approach, one can obtain the expected value of the total profit per unit time:
E [ Z 7 ( y , B ) ] = { E [ G 37 ] E [ P ] D E [ G 38 ] E [ P ] D y + E [ G 39 ] E [ P ] D B y E [ G 40 ] E [ P ] D B 2 y + E [ G 41 ] E [ P ] D B + E [ G 42 ] E [ P ] D y } .
Case (viii) NT’ + NT + NM
The present case completely overlaps with the previous Case (vii). This case does not count. Thus, in total, there exist even distinct cases for obtaining the whole seller’s expected total profit per unit time, viz.:
E [ Z j ( y , B ) ] = { E [ Z 1 ( y , B ) ]   when   M N T T E [ Z 2 ( y , B ) ]   when   T M N E [ Z 3 ( y , B ) ]   when   N M t 1 t 1 + N T + N E [ Z 4 ( y , B ) ]   when   N t 1 + N M t 3 + N T + N E [ Z 5 ( y , B ) ]   when   N t 3 + N M T + N T + N E [ Z 6 ( y , B ) ]   when   N T M T + N T + N E [ Z 7 ( y , B ) ]   when   N T + N M T + N

3. Theoretical Results for Optimality

The whole seller intends to maximize his expected total profit per unit time by jointly optimizing the replenishment quantity and the backorder level. In this section, the optimality of the objective function is established in the form of two lemmas. Here, optimality is shown for Case (i) only, and likewise, the optimality for other six cases can be derived by substituting the values of Gi’s in respective cases.
Lemma 1.
The function of whole seller’s expected total profit per unit time is concave.
Proof. 
To prove the global concavity of the expected profit function, the following two second-order sufficient conditions of global optimality must be satisfied for all seven cases:
( 2 E [ Z j ( y , B ) ] y 2 ) 0 ; ( 2 E [ Z j ( y , B ) ] B 2 ) 0 and for   j . ( 2 E [ Z j ( y , B ) ] y B ) 2 ( 2 E [ Z j ( y , B ) ] y 2 ) ( 2 E [ Z j ( y , B ) ] B 2 ) 0
 □
Case (i) MNT’T
By taking a first-order partial derivative of E [ Z 1 ( y , B ) ] with respect to y and B, one can obtain:
y E [ Z 1 ( y , B ) ] = E [ G 2 ] E [ P ] D E [ G 3 ] E [ P ] D B y 2 + E [ G 4 ] E [ P ] D B 2 y 2 E [ G 6 ] E [ P ] D y 2 .
B E [ Z 1 ( y , B ) ] = E [ G 3 ] E [ P ] D y 2 E [ G 4 ] E [ P ] D B y + E [ G 5 ] E [ P ] D .
By taking a second-order partial derivative of E [ Z 1 ( y , B ) ] with respect to y and B, one can obtain:
2 y 2 E [ Z 1 ( y , B ) ] = E [ G 3 ] E [ P ] 2 D B y 3 E [ G 4 ] E [ P ] 2 D B 2 y 3 + E [ G 6 ] E [ P ] 2 D y 3 .
2 B 2 E [ Z 1 ( y , B ) ] = 2 E [ G 4 ] E [ P ] D y .
Again ,   2 y B E [ Z 1 ( y , B ) ] = E [ G 3 ] E [ P ] D y 2 + E [ G 4 ] E [ P ] 2 D B y 2 .
Therefore, by using Equations (108)–(110) it is obtained that:
( 2 y B E [ Z 1 ( y , B ) ] ) 2 ( 2 y 2 E [ Z 1 ( y , B ) ] ) ( 2 B 2 E [ Z 1 ( y , B ) ] ) = E 2 [ G 3 ] E 2 [ P ] D 2 y 4 E [ G 6 ] E [ G 4 ] E 2 [ P ] 4 D 2 y 4 .
The sufficient conditions of concavity are derived in Appendix C:
Lemma 2.
The optimal solution (y*, B*) that maximizes the whole seller’s expected total profit per unit time for Case (i) is written as:
y * = { 1 2 ( h + c B ) ( 1 { E [ α ] E [ q 2 ] + ( 1 E [ α ] ) ( 1 E [ q 1 ] ) } λ D + 1 D ) + 1 2 D c I p [ 1 δ ( 1 K ) ] + 1 2 1 { E [ α ] E [ q 2 ] + ( 1 E [ α ] ) ( 1 E [ q 1 ] ) } λ D c I p [ 1 δ ( 1 K ) ] } B 2 { c I p [ 1 δ ( 1 K ) ] ( N M ) 1 2 D c I p { E [ α ] E [ q 2 ] + ( 1 E [ α ] ) ( 1 E [ q 1 ] ) } λ M } B { { E [ α ] E [ q 2 ] + ( 1 E [ α ] ) ( 1 E [ q 1 ] ) } ( 1 δ ) c I p K λ M 2 + 1 2 { E [ α ] E [ q 2 ] + ( 1 E [ α ] ) ( 1 E [ q 1 ] ) } δ p I e ( 1 K ) λ M 2 c I p [ 1 δ ( 1 K ) ] B ( N M ) + 1 2 { E [ α ] E [ q 2 ] + ( 1 E [ α ] ) ( 1 E [ q 1 ] ) } δ c I p ( 1 K ) y M + ( 1 2 δ ) { E [ α ] E [ q 2 ] + ( 1 E [ α ] ) ( 1 E [ q 1 ] ) } c I p λ M 2 A } { { h 1 2 λ + h 1 2 λ ( { E [ α ] E [ q 2 ] + ( 1 E [ α ] ) ( 1 E [ q 1 ] ) } D λ ) + h 1 2 λ [ E [ α ] ( 1 E [ q 2 ] ) + ( 1 E [ α ] ) E [ q 1 ] ] + h 1 2 D ( { E [ α ] E [ q 2 ] + ( 1 E [ α ] ) ( 1 E [ q 1 ] ) } D λ ) 2 + h E [ α ] E [ q 2 ] 2 D { E [ α ] E [ q 2 ] + ( 1 E [ α ] ) ( 1 E [ q 1 ] ) } } + 1 D c I p { E [ α ] E [ q 2 ] + ( 1 E [ α ] ) ( 1 E [ q 1 ] ) } 2 1 2 D δ c I p ( 1 K ) { E [ α ] E [ q 2 ] + ( 1 E [ α ] ) ( 1 E [ q 1 ] ) } 2 + c I p 1 λ { E [ α ] + ( 1 E [ α ] ) E [ q 1 ] } }
B * = { c I p [ 1 δ ( 1 K ) ] ( N M ) 1 2 D c I p { E [ α ] E [ q 2 ] + ( 1 E [ α ] ) ( 1 E [ q 1 ] ) } λ M } + { h 2 ( 1 { E [ α ] E [ q 2 ] + ( 1 E [ α ] ) ( 1 E [ q 1 ] ) } ) { E [ α ] E [ q 2 ] + ( 1 E [ α ] ) ( 1 E [ q 1 ] ) } λ D h 2 { E [ α ] ( 1 E [ q 2 ] ) + ( 1 E [ α ] ) E [ q 1 ] } { E [ α ] E [ q 2 ] + ( 1 E [ α ] ) ( 1 E [ q 1 ] ) } λ D h 1 D ( { E [ α ] E [ q 2 ] + ( 1 E [ α ] ) ( 1 E [ q 1 ] ) } D λ ) + 1 2 D c I p { E [ α ] E [ q 2 ] + ( 1 E [ α ] ) ( 1 E [ q 1 ] ) } + ( 1 δ ) c I p ( 1 K ) { E [ α ] E [ q 2 ] + ( 1 E [ α ] ) ( 1 E [ q 1 ] ) } D } y { ( h + c B ) ( 1 { E [ α ] E [ q 2 ] + ( 1 E [ α ] ) ( 1 E [ q 1 ] ) } λ D + 1 D ) + 1 D c I p [ 1 δ ( 1 K ) ] + 1 { E [ α ] E [ q 2 ] + ( 1 E [ α ] ) ( 1 E [ q 1 ] ) } λ D c I p [ 1 δ ( 1 K ) ] }
Proof. 
To determine the optimal values of y and B,say y*and B*, which maximize the function of E [ Z 1 ( y , B ) ] , the first-order necessary condition of optimality must be satisfied:
y E [ Z 1 ( y , B ) ] = 0   and   B E [ Z 1 ( y , B ) ] = 0 .
On setting Equation (106) to be equal to zero, one can get:
y * = { 1 2 ( h + c B ) ( 1 { E [ α ] E [ q 2 ] + ( 1 E [ α ] ) ( 1 E [ q 1 ] ) } λ D + 1 D ) + 1 2 D c I p [ 1 δ ( 1 K ) ] + 1 2 1 { E [ α ] E [ q 2 ] + ( 1 E [ α ] ) ( 1 E [ q 1 ] ) } λ D c I p [ 1 δ ( 1 K ) ] } B 2 { c I p [ 1 δ ( 1 K ) ] ( N M ) 1 2 D c I p { E [ α ] E [ q 2 ] + ( 1 E [ α ] ) ( 1 E [ q 1 ] ) } λ M } B { { E [ α ] E [ q 2 ] + ( 1 E [ α ] ) ( 1 E [ q 1 ] ) } ( 1 δ ) c I p K λ M 2 + 1 2 { E [ α ] E [ q 2 ] + ( 1 E [ α ] ) ( 1 E [ q 1 ] ) } δ p I e ( 1 K ) λ M 2 c I p [ 1 δ ( 1 K ) ] B ( N M ) + 1 2 { E [ α ] E [ q 2 ] + ( 1 E [ α ] ) ( 1 E [ q 1 ] ) } δ c I p ( 1 K ) y M + ( 1 2 δ ) { E [ α ] E [ q 2 ] + ( 1 E [ α ] ) ( 1 E [ q 1 ] ) } c I p λ M 2 A } { { h 1 2 λ + h 1 2 λ ( { E [ α ] E [ q 2 ] + ( 1 E [ α ] ) ( 1 E [ q 1 ] ) } D λ ) + h 1 2 λ [ E [ α ] ( 1 E [ q 2 ] ) + ( 1 E [ α ] ) E [ q 1 ] ] + h 1 2 D ( { E [ α ] E [ q 2 ] + ( 1 E [ α ] ) ( 1 E [ q 1 ] ) } D λ ) 2 + h E [ α ] E [ q 2 ] 2 D { E [ α ] E [ q 2 ] + ( 1 E [ α ] ) ( 1 E [ q 1 ] ) } } + 1 D c I p { E [ α ] E [ q 2 ] + ( 1 E [ α ] ) ( 1 E [ q 1 ] ) } 2 1 2 D δ c I p ( 1 K ) { E [ α ] E [ q 2 ] + ( 1 E [ α ] ) ( 1 E [ q 1 ] ) } 2 + c I p 1 λ { E [ α ] + ( 1 E [ α ] ) E [ q 1 ] } }
On setting Equation (107) to be equal to zero, one can find:
B * = { c I p [ 1 δ ( 1 K ) ] ( N M ) 1 2 D c I p { E [ α ] E [ q 2 ] + ( 1 E [ α ] ) ( 1 E [ q 1 ] ) } λ M } + { h 2 ( 1 { E [ α ] E [ q 2 ] + ( 1 E [ α ] ) ( 1 E [ q 1 ] ) } ) { E [ α ] E [ q 2 ] + ( 1 E [ α ] ) ( 1 E [ q 1 ] ) } λ D h 2 { E [ α ] ( 1 E [ q 2 ] ) + ( 1 E [ α ] ) E [ q 1 ] } { E [ α ] E [ q 2 ] + ( 1 E [ α ] ) ( 1 E [ q 1 ] ) } λ D h 1 D ( { E [ α ] E [ q 2 ] + ( 1 E [ α ] ) ( 1 E [ q 1 ] ) } D λ ) + 1 2 D c I p { E [ α ] E [ q 2 ] + ( 1 E [ α ] ) ( 1 E [ q 1 ] ) } + ( 1 δ ) c I p ( 1 K ) { E [ α ] E [ q 2 ] + ( 1 E [ α ] ) ( 1 E [ q 1 ] ) } D } y { ( h + c B ) ( 1 { E [ α ] E [ q 2 ] + ( 1 E [ α ] ) ( 1 E [ q 1 ] ) } λ D + 1 D ) + 1 D c I p [ 1 δ ( 1 K ) ] + 1 { E [ α ] E [ q 2 ] + ( 1 E [ α ] ) ( 1 E [ q 1 ] ) } λ D c I p [ 1 δ ( 1 K ) ] }
Hence, y* and B*, are the optimal values of y and B. Therefore, the global optimality of y*, B* is achieved for Case (i). □

4. Solution Procedure

In order to find whole seller’s optimal ordering policy that maximizes the expected total profit per unit time, the following procedure is proposed:
Step 0:
Input all parameters.
Step 1:
Determine the optimal values of y*, B* for Case (i) from Equations (114) and (115), respectively. Using y*, calculate the corresponding value of t3* and T* from Equations (3) and (10), respectively. If M ≤ N ≤ T’≤ T, then calculate E[Z1(y, B)] from Equation (39), and go to Step 8,otherwise go to Step 2.
Step 2:
Determine the optimal values of y*, B* for Case (ii) by substituting the particular values of Gi’s (i = 7,…,12) in Equations (114) and (115), respectively. Using y*, calculate the corresponding value of t3* and T* from Equations (10) and (3), respectively. If T ≤ M ≤ N, then calculate E[Z2(y, B)] from Equation (50) and go to Step 8; else, go to Step 3.
Step 3:
Determine the optimal values of y*, B* for Case (iii) by substituting the particular values of Gi’s (i= 13,…,18) in Equations (114) and (115), respectively. Using y*, calculate the corresponding value of t3* and T* from Equations (10) and (3), respectively. If N ≤ M ≤ t1≤ t1 + NT + N, then calculate E[Z3(y, B)] from Equation (61) and go to Step 8; else, go to Step 4.
Step 4:
Determine the optimal values of y*, B* for Case (iv) by substituting the particular values of Gi’s (i =19,…,24) in Equations (114) and (115), respectively. Using y*, calculate the corresponding value of t3* and T* from Equations (10) and (3), respectively. If N ≤ t1 + NMt3 + NT + N, then calculate E[Z4(y, B)] from Equation (72) and go to Step 8; else, go to Step 5.
Step 5:
Determine the optimal values of y*, B* for Case (v) by substituting the particular values of Gi’s (i = 25,…,30) in Equations (114) and (115), respectively. Using y*, calculate the corresponding value of t3* and T* from Equations (10) and (3), respectively. If Nt3 + NMT’ + NT + N, then calculate E[Z5(y, B)] from Equation (83) and go to Step 8; else, go to Step 6.
Step 6:
Determine the optimal values of y*, B* for Case (vi) by substituting the particular values of Gi’s (i = 31,…,36) in Equations (114) and (115), respectively. Using y*, calculate the corresponding value of t3* and T* from Equations (10) and (3), respectively. If N ≤ T’ ≤ M ≤ T’+N ≤ T+N, then calculate E[Z6(y, B)] from Equation (94) and go to Step 8; else, go to Step 7.
Step 7:
Determine the optimal values of y*, B* for Case (vii) by substituting the particular values of Gi’s (i = 37,…,42) in Equations (114) and (115), respectively. Using y*, calculate the corresponding value of t3* and T* from Equations (10) and (3), respectively. If N ≤ T’+N ≤ M ≤ T+N, then calculate E[Z7(y, B)] from Equation (105) and go to Step 8.
Step 8:
Procedure terminates.

5. Numerical Analysis

This subsection validates the developed model with the help of a numerical analysis. The optimal order quantity (y*), the optimal backorder quantity (B*), and the expected profit per unit time E*[Z(y, B)] are found out for a given set of parameters as detailed out in Table 3 and Table 4.

5.1. Numerical Experiments

5.2. Sensitivity Analysis

To analyze the changes in the values of the parameters, sensitivity analysis has been performed to study the variations. For simplicity of analysis, deterministic values of α, q1, and q2 are used instead of the expected ones. The effect of changes in the main parameters α, q1, q2and the parameters δ, K, R, M, and N are observed on the optimal order quantity y*, optimal backorder quantity B*, optimal cycle length T*, optimal total profit per unit time Z*(y, B), optimal total revenue per unit time (T.R.U.*), and optimal total cost per unit time (T.C.U.*). Results have been summarized in Table 5, Table 6, Table 7 and Table 8.
The following observations have been derived from Table 5, Table 6, Table 7 and Table 8.
  • As exhibited from Table 5, the optimal values of the order quantity (y*), the backorder level (B*), the cycle length (T*), and the expected value of the total profit per unit time (Z*(y, B)) show a decreasing trend, while the values of the total revenue per unit time and the total cost per unit time increase with the defect proportion (α). The only portion of the revenue being increased with a rise in the number of defectives is from the sale of the scrap items. However, the total cost majorly increases, due to the holding cost and the sales returns cost. With the increased count of the defectives in the system, the demand decreases, due to the frustration in retailers dealing with the faulty items, resulting in the loss of orders and shortages.
  • From Table 6, it is observed that with an increase in the proportion of Type-I errors (q1), the optimal values of backorder level (B*), cycle length (T*), and the expected value of total profit per unit time (Z*(y, B)) show declining trends, while the order quantity (y*) increases along with total revenue and total cost values. The Type-I error causes a direct financial loss to the whole seller as his inspection team discards some perfect items at a reduced price, leading to a fall in profit values and cycle length. The increase in the sale of salvage items majorly contributes to raising the revenue. In order to satisfy the demand with perfect items, the whole seller needs to order more; hence, the purchase cost, inspection cost, Type-1 error cost, and holding costs increases with the rise in the value of (y)*. Further, with a higher number of orders, there is a lessening of shortages as the demand can now be satisfied in a better way.
  • It is clear from Table 7 that with an increment in the proportion of Type-II errors (q2), the optimal values of order quantity (y*), cycle length (T*), and expected value of the total profit per unit time (Z*(y, B)), and the total revenue exhibit a declining nature, while the optimal backorder level (B*), and total cost values show a rise. The Type-II error causes a penalty and goodwill loss to the whole seller by the sale of some defectives to the retailers, resulting in sales returns. Because of these defect returns, there is an addition to the inventory of the system, leading to increase in holding cost and Type-II error cost. Owing to frustration and quality dissatisfaction, the retailers may not be willing to purchase more, so a decrement is observed in the values of (y)*, and thus in the total profit of the system. Due to the lack of purchases made, there is an increase in backorder level, i.e., (B)*.
Observations from Table 8:
  • With the increase in the proportion of initial payments (δ), there is a lowering of order quantity (y*), while there is increase in the optimal values of the expected total profit per unit time (Z*(y, B)), backorder level (B*), cycle length (T*), and total cost. An increase in the initial partial payment leads to a reduction in the number of retailers who are interested in bulk purchases, majorly due to the discount/credit offered. With lesser demand come fewer orders and a shortening of the cycle length. However, due to an elevation in the fraction of initial payments, it becomes more profitable for the whole seller, as he can now generate extra revenue by keeping the additional amounts in an interest-bearing account.
  • With a growth in the proportion of old retailers (K), the optimal values of order quantity (y*) and cycle length (T*) decrease, while the optimal values of the expected total profit per unit time (Z*(y, B)), and backorder level (B*) show increasing behaviors. With the higher value of (K), the whole seller is able to offer full permissible delays to a greater number of retailers, resulting in his increased profit values. However, since the y* values are found to decrease, this implies that the whole seller cannot rely on old retailers fully to achieve maximum possible sales, but should focus on promoting new retailers simultaneously.
  • It is evident that an enhancement in the proportion of good retailers (R) increases the optimal values of the expected total profit per unit time (Z*(y, B)), backorder level (B*), and total cost, while reducing the optimal values of order quantity (y*) and cycle length (T*) slightly. With an increasing number of good retailers, who make complete partial payments, the whole seller is able to minimize his losses that directly occur due to bad debts, and hence, his profit values rise. The order quantity and cycle length reveal a marginal decreasing trend, owing to the fact that the whole seller is interested in ordering less but more frequently to achieve the target sales.
  • Upon increasing the whole seller’s credit period (M), the optimal values of the expected total profit per unit time (Z*(y, B)), backorder level (B*), and total cost increase, while the optimal values of order quantity (y*) and cycle length (T*) decrease. With the increase of the whole seller’s credit limit, he is able to put the revenue generated through sales into an interest-bearing account for a longer duration, and hence boost up his profit values considerably. However, with a reduction in the order quantity, there will be higher number of customers waiting for delivery, i.e., there is an increase in backorder levels.
  • The higher credit limit of retailers (N), the less are the optimal values of the expected total profit per unit time (Z*(y, B)), backorder level (B*), cycle length (T*), order quantity (y*), and total cost. When the first payment to the whole seller is delayed, he is unable to put revenue into his account for a longer period, thus affecting his profit values negatively. With larger N, the major source of revenue generation comes from the immediate payments by all the new retailers. The whole seller experiences a reduction in the order quantity to avoid a larger risk being attached to the bad credit retailers who do not pay the remaining part of the partially permissible delay at N.

6. Summary

6.1. Managerial Insights

The study helps the whole seller to make the best decision by providing some useful managerial insights on how to deal with different types of retailers arriving at his doorstep, in a cost-effective and less compromising manner. Firstly, the model is able to prove that a combination of full and partial trade credit is beneficial for managers, to elevate their profit margins, and to attract new retailers, respectively. This is quite intuitive, as the whole seller can start to accumulate revenue on sales and earn interest on them before the settlement of his account with the manufacturer. In view of this, the whole seller should choose such a manufacturer who agrees on the greater length of delayed periods. On the contrary, he should try to make an agreement with shorter credit limits with his fellow retailers, to maximize his expected profit units. To make the best use of the trade credit policy, the whole seller prefers to order less, but with higher frequency. This way, it becomes cost-effective for the whole seller, as the inventory holding cost is diminished by the fast replenishment of the items. In order to make better use of the partial trade credit policy via downstream ends, it is beneficial for him to raise the level of backorders, on account of the initial amount that is received from the partially permissible delay. However, the overall cost of the system is observed to increase, due to the presence of bad credit retailers in the study, as these bring extra interest charges on the whole seller on the sold yet unpaid inventory. Furthermore, the analysis of various defect-related factors indicates that a higher number of defectives has an adverse effect on the entire cost of the system, as it leads to an additional increase in the cost of misclassifications during the inspection process. The screening errors that are considered in the study are of great importance, and it is proven here that a Type-I error has a higher impact on the supply chain cost than a Type-II error. This difference comes from the fact the former leads to the erroneous scrapping of perfect items, resulting in an increase of the optimal order quantity, and a decrease of backorders, along with a huge decrease in the profit values, while the latter reflects the opposite trends on these optimal values, with a marginal decrease in profit values. On a wider perspective, managers should keep looking into the sources of imperfections, as their reduction/elimination can boost the demand and the profit values substantially and simultaneously reduce the proportion of misclassifications.

6.2. Concluding Remarks

The present paper analyzes the impact of the dual bifurcation of retailers in a three-layer supply chain (manufacturer-whole seller-retailer) under a two-stage trade-credit policy, along with quality control measures. Owing to a stable and trustworthy relationship with the manufacturer, the whole seller receives a full permissible delay by the manufacturer, while he in turn offers distinct types of trade credit policies to his fellow retailers. To be closer to reality, the whole seller first categorizes all of the retailers approaching him into old and new types, using past record/data. Then, according to the fulfillment of payments by new retailers, he calls them good or bad. Due to this dual bifurcation, the retailer is able to avoid various financial and reputation-related risks by giving partial trade credit policies to all of the new retailers, and secondly, he is able to raise the revenue by offering full trade credit to all of the old retailers. Bad debts play an extensive role in the model, as these bring undue interest charges on the whole seller. Such a practical scenario had not gained much importance in the past. Other common aspects that are integrated into the model are related to quality and its control measures. The lot received by the whole seller contains some defectives and goes through 100% inspection process before reaching the retailers. Type-I and Type-II errors are incorporated to make the model more realistic. By considering all of the aforementioned factors in the study, the present model provides the managers with a more pragmatic model that has wide applicability, especially in many retail industries. Based on the different situations that may occur in a trade credit scenario, closed-form solutions for all the seven cases have been obtained mathematically. An algorithm has been used to determine the optimal order quantity and the optimal backorder quantity. The paper concludes by providing an extensive sensitivity for various key parameters over the decision variables to derive many useful managerial insights.

6.3. Future Research and Limitations

The model is limited to a static inventory model, where cycles are eventually repeated, and bad debtors are not penalized in later periods. Hence, they receive partial trade credit policy in all successive cycles. However, there can be a more practical dynamic model where the bad debtors either do not receive any trade credit at all, or they receive only a reduced trade credit volume. In this way, the bad debtors would have a higher effect on the strategy, which will be closer to trade credit financing in practice. As the model majorly focuses on different forms of permissible delays at the whole seller’s end, it will be more justifiable if the credit period is linked to the order quantity, or if the demand function is taken as credit-dependent rather than constant or both. The whole seller’s problem with large orders and limited storage space can be solved by two ware housings. Further, to obtain better accuracy in the results, it will be relevant to incorporate inflation and the time-value of money in the study.

Author Contributions

Conceptualization, visualization, A.K. (Aditi Khanna).; methodology, formal analysis, data curation, software, writing—original draft preparation, A.K. (Aakanksha Kishore); investigation, writing—review and editing, project administration, funding acquisition, B.S.; validation, resources, supervision, C.K.J.

Funding

This research received no external funding.

Conflicts of Interest

The authors declare no conflict of interest.

Nomenclature

The following nomenclature is used throughout the paper development.
Index
jnumber of cases (j=1, 2, 3, 4, 5, 6, 7)
Parameters
Ddemand rate in units per unit time (units/time)
λinspection rate in units per unit time, λ > D
Aproportion of imperfect items (a random variable with known probability density function)
q1proportion of Type-I imperfection errors (a random variable with known probability density function)
q2proportion of Type-II imperfection errors (a random variable with known probability density function)
E(.)expected value operator
E(θ)expected value of θ
Asetup cost for each cycle ($/setup)
cpurchase cost per item ($/item)
iinspection cost per item ($/item)
sselling price ($/item)
vsalvage cost (<s) ($/item)
crcost of committing a Type-I error ($/item)
cacost of committing a Type-II error ($/item)
cBbackordering cost per unit per unit time ($/item)
Hholding cost per unit time per unit time ($/unit/unit time)
δfraction of the purchase cost made at the initial time of the credit period
Kpercentage of old retailers (estimated from the past data)
Rpercentage of good retailers (estimated from the past data)
Mcredit period offered by the manufacturer to the whole seller to settle his accounts (time unit)
Ncredit period offered by the whole seller to the retailers to settle his accounts (time unit)
Ieinterest earned per unit per unit time ($/unit/unit time)
Ipinterest paid per unit per unit time ($/unit/unit time)
f(α)probability density function of defective items
f(q1)probability density function of Type-I error
f(q2)probability density function of Type-II error
Independent Decision variables
ywhole seller’s order lot size for each cycle (units)
Bwhole seller’s backorder size for each cycle (units)
Dependent Decision variables
Tcycle length
T.C.U.whole seller’s total cost per unit time
T.R.U.whole seller’s total revenue per unit time
T.P. jwhole seller’s total profit for j
Zj(y, B)whole seller’s total profit per unit time for j
E[Zj(y,B)]whole seller’s expected total profit per unit time for j

Appendix A

G 1 = s ( 1 α ) ( 1 q 1 ) s ( 1 δ ) ( 1 R ) ( 1 K ) ( 1 α ) ( 1 q 1 ) + v [ α ( 1 q 2 ) + ( 1 α ) q 1 + α q 2 ] c i c r ( 1 α ) q 1 c a α q 2 1 2 D c I p K P 2 λ M 1 2 c I p K P M c I p K P ( N M ) + 1 2 D δ c I p ( 1 K ) P 2 λ M ( 1 δ ) c I p ( 1 K ) P ( N M ) + 1 2 D ( 1 δ ) c I p ( 1 K ) P 2 λ M + 1 2 ( 1 δ ) c I p ( 1 K ) P M c I p [ α + ( 1 α ) q 1 ] ( N M )
G 2 = { h 1 2 λ + h 1 2 λ ( P D λ ) + h 1 2 λ [ α ( 1 q 2 ) + ( 1 α ) q 1 ] + h 1 2 D ( P D λ ) 2 + h α q 2 P 2 D } + 1 D c I p K P 2 + 1 2 D δ c I p ( 1 K ) P 2 + 1 D ( 1 δ ) c I p ( 1 K ) P 2 + c I p 1 λ { α + ( 1 α ) q 1 }
G 3 = c I p K ( N M ) 1 2 D c I p K P λ M 1 2 D δ c I p ( 1 K ) P λ M 1 2 D ( 1 δ ) c I p ( 1 K ) P λ M + ( 1 δ ) c I p ( 1 K ) ( N M )
G 4 = { h 1 2 ( P λ D ) ( 1 + D P λ D ) + h 1 P λ D + h D 2 ( P λ D ) 2 + h 1 2 D } 1 2 c B ( 1 P λ D + 1 D ) + 1 2 D c I p K + 1 2 ( P λ D ) c I p K + 1 2 D ( 1 δ ) c I p ( 1 K ) + 1 2 ( P λ D ) ( 1 δ ) c I p ( 1 K )
G 5 = h 1 P λ D h 1 2 λ ( 1 + D P λ D ) h 1 2 λ h 1 2 ( P λ D ) h 1 2 ( P λ D ) ( P D λ ) h { α ( 1 q 2 ) + ( 1 α ) q 1 } 2 ( P λ D ) h 1 D ( P D λ ) c I p K P D + c I p K P D + 1 2 D c I p K P + 1 2 D δ c I p ( 1 K ) P + 1 2 D ( 1 δ ) c I p ( 1 K ) P + ( 1 δ ) c I p ( 1 K ) P D
G 6 = 1 2 δ p I e ( 1 K ) D M 2 1 2 c I p K P λ M 2 + 1 2 δ p I e ( 1 K ) ( P λ D ) M 2 c I p K B ( N M ) + 1 2 δ c I p ( 1 K ) ( P y P λ M ) M + 1 2 ( 1 δ ) c I p ( 1 K ) P λ M 2 ( 1 δ ) c I p ( 1 K ) B ( N M ) A
G 7 = s ( 1 α ) ( 1 q 1 ) s ( 1 δ ) ( 1 R ) ( 1 K ) ( 1 α ) ( 1 q 1 ) + v [ α ( 1 q 2 ) + ( 1 α ) q 1 + α q 2 ] c i c r ( 1 α ) q 1 c a α q 2 + δ s I e ( 1 K ) P M c I p K P ( N M ) ( 1 δ ) c I p ( 1 K ) P ( N M ) c I p { α + ( 1 α ) q 1 } ( N M )
G 8 = { h 1 2 λ + h 1 2 λ ( P D λ ) + h 1 2 λ [ α ( 1 q 2 ) + ( 1 α ) q 1 ] + h 1 2 D ( P D λ ) 2 + h α q 2 P 2 D } { P 2 2 D δ s I e ( 1 K ) P 2 D δ s I e ( 1 K ) P 2 2 D c I p K 1 2 D ( 1 δ ) c I p ( 1 K ) P 2 c I p [ α + ( 1 α ) q 1 ] λ }
G 9 = δ s I e ( 1 K ) M + δ s I e ( 1 K ) M + c I p K ( N M ) c I p K ( N M ) + ( 1 δ ) c I p ( 1 K ) ( N M ) ( 1 δ ) c I p ( 1 K ) ( N M )
G 10 = { h 1 2 ( P λ D ) ( 1 + D P λ D ) + h 1 P λ D + h D 2 ( P λ D ) 2 + h 1 2 D } + 1 2 c B B 2 ( 1 P λ D + 1 D ) [ 1 2 D δ s I e ( 1 K ) 1 D δ s I e ( 1 K ) + 1 2 ( P λ D ) δ s I e ( 1 K ) 1 ( P λ D ) δ s I e ( 1 K ) 1 2 D c I p K 1 2 ( P λ D ) c I p K 1 ( P λ D ) c I p K 1 2 D ( 1 δ ) c I p ( 1 K ) 1 2 ( P λ D ) ( 1 δ ) c I p ( 1 K ) ]
G 11 = h 1 P λ D h 1 2 λ ( 1 + D P λ D ) h 1 2 λ h 1 2 ( P λ D ) h 1 2 ( P λ D ) ( P D λ ) h { α ( 1 q 2 ) + ( 1 α ) q 1 } 2 ( P λ D ) h 1 D ( P D λ ) δ p I e ( 1 K ) P D + δ p I e ( 1 K ) 2 P D + c I p K P D + ( 1 δ ) c I p ( 1 K ) P D
G 12 = A .
G 13 = s ( 1 α ) ( 1 q 1 ) s ( 1 δ ) ( 1 R ) ( 1 K ) ( 1 α ) ( 1 q 1 ) + v [ α ( 1 q 2 ) + ( 1 α ) q 1 + α q 2 ] c i c r ( 1 α ) q 1 c a α q 2 + 1 2 c I p K P ( M N ) + 1 2 D c I p P 2 λ ( M N ) + 1 2 D δ c I p ( 1 K ) P 2 λ M
G 14 = { h 1 2 λ + h 1 2 λ ( P D λ ) + h 1 2 λ [ α ( 1 q 2 ) + ( 1 α ) q 1 ] + h 1 2 D ( P D λ ) 2 + h α q 2 P 2 D } { 1 2 D c I p P 2 1 2 D δ c I p ( 1 K ) P 2 1 2 D ( 1 δ ) c I p ( 1 K ) P 2 }
G 15 = 1 2 D c I p P λ ( M N ) 1 2 D δ c I p ( 1 K ) P λ M 1 2 D ( 1 δ ) c I p ( 1 K ) P λ ( M N ) .
G 16 = { h 1 2 ( P λ D ) ( 1 + D P λ D ) + h 1 P λ D + h D 2 ( P λ D ) 2 + h 1 2 D } 1 2 c B ( 1 P λ D + 1 D ) .
G 17 = h 1 P λ D h 1 2 λ ( 1 + D P λ D ) h 1 2 λ h 1 2 ( P λ D ) h 1 2 ( P λ D ) ( P D λ ) h { α ( 1 q 2 ) + ( 1 α ) q 1 } 2 ( P λ D ) h 1 D ( P D λ ) + 1 2 D c I p P + 1 2 D δ c I p ( 1 K ) P + 1 2 D ( 1 δ ) c I p ( 1 K ) P
G 18 = 1 2 s I e K D ( M N ) 2 + 1 2 s I e K ( P λ D ) ( M N ) 2 + 1 2 δ s I e ( 1 K ) D M 2 + 1 2 δ s I e ( 1 K ) ( P λ D ) M 2 + 1 2 ( 1 δ ) s I e R ( 1 K ) D ( M N ) 2 + 1 2 ( 1 δ ) s I e R ( 1 K ) ( P λ D ) ( M N ) 2 1 2 ( 1 δ ) c I p ( 1 R ) ( 1 K ) D ( M N ) 2 1 2 ( 1 δ ) c I p ( 1 R ) ( 1 K ) ( P λ D ) ( M N ) 2 1 2 c I p K P λ ( M N ) 2 1 2 δ c I p ( 1 K ) P λ M 2 1 2 ( 1 δ ) c I p ( 1 K ) P λ ( M N ) 2 A
G 19 = s ( 1 α ) ( 1 q 1 ) s ( 1 δ ) ( 1 R ) ( 1 K ) ( 1 α ) ( 1 q 1 ) + v [ α ( 1 q 2 ) + ( 1 α ) q 1 + α q 2 ] c i c r ( 1 α ) q 1 c a α q 2 + 1 2 c I p K ( M N ) P + 1 2 c I p K P ( M N ) + 1 2 δ c I p ( 1 K ) M P + 1 2 δ c I p ( 1 K ) M P + 1 2 ( 1 δ ) c I p ( 1 K ) ( M N ) P + 1 2 ( 1 δ ) c I p ( 1 K ) ( M N ) P c I p [ α + ( 1 α ) q 1 ] ( N M )
G 20 = { h 1 2 λ + h 1 2 λ ( P D λ ) + h 1 2 λ [ α ( 1 q 2 ) + ( 1 α ) q 1 ] + h 1 2 D ( P D λ ) 2 + h α q 2 P 2 D } { 1 2 D c I p K P 2 1 2 D δ c I p ( 1 K ) P 2 1 2 D ( 1 δ ) c I p ( 1 K ) P 2 c I p [ α + ( 1 α ) q 1 ] 1 λ }
G 21 = s I e K ( M N ) + δ s I e ( 1 K ) M + ( 1 δ ) s I e R ( 1 K ) ( M N ) 1 2 c I p K ( M N ) 1 2 c I p K ( M N ) + 1 2 δ c I p ( 1 K ) M 1 2 δ c I p ( 1 K ) M ( 1 δ ) c I p ( 1 R ) ( 1 K ) ( M N ) 1 2 ( 1 δ ) c I p ( 1 K ) ( M N ) 1 2 ( 1 δ ) c I p ( 1 K ) ( M N )
G 22 = { h 1 2 ( P λ D ) ( 1 + D P λ D ) + h 1 P λ D + h D 2 ( P λ D ) 2 + h 1 2 D } 1 2 c B ( 1 P λ D + 1 D ) { 1 2 ( P λ D ) s I e K p I e K 1 ( P λ D ) + 1 2 ( P λ D ) δ s I e ( 1 K ) δ s I e ( 1 K ) 1 ( P λ D ) + 1 2 ( P λ D ) ( 1 δ ) s I e R ( 1 K ) + ( 1 δ ) s I e R ( 1 K ) 1 ( P λ D ) 1 2 D c I p K 1 2 D δ c I p ( 1 K ) 1 2 ( P λ D ) ( 1 δ ) c I p ( 1 R ) ( 1 K ) ( 1 δ ) c I p ( 1 R ) ( 1 K ) 1 ( P λ D ) 1 2 D ( 1 δ ) c I p ( 1 K ) }
G 23 = h 1 P λ D h 1 2 λ ( 1 + D P λ D ) h 1 2 λ h 1 2 ( P λ D ) h 1 2 ( P λ D ) ( P D λ ) h [ α ( 1 q 2 ) + ( 1 α ) q 1 ] 2 ( P λ D ) h 1 D ( P D λ ) + 1 2 D c I p K P + 1 2 D c I p K P 1 2 D δ c I p ( 1 K ) P + 1 2 D δ c I p ( 1 K ) P + 1 2 D δ c I p ( 1 K ) P 1 2 D ( 1 δ ) c I p ( 1 K ) P + 1 2 D ( 1 δ ) c I p ( 1 K ) P { 1 2 D c I p K P 2 1 2 D δ c I p ( 1 K ) P 2 1 2 D ( 1 δ ) c I p ( 1 K ) P 2 c I p [ α + ( 1 α ) q 1 ] 1 λ }
G 24 = 1 2 s I e K D ( M N ) 2 + 1 2 δ s I e ( 1 K ) D M 2 + 1 2 ( 1 δ ) s I e R ( 1 K ) D ( M N ) 2 1 2 ( 1 δ ) c I p ( 1 R ) ( 1 K ) D ( M N ) 2 1 2 ( 1 δ ) c I p ( 1 K ) D ( M N ) 2 1 2 δ c I p ( 1 K ) D M 2 1 2 c I p K D ( M N ) 2 A
G 25 = s ( 1 α ) ( 1 q 1 ) s ( 1 δ ) ( 1 R ) ( 1 K ) ( 1 α ) ( 1 q 1 ) + v [ α ( 1 q 2 ) + ( 1 α ) q 1 + α q 2 ] c i c r ( 1 α ) q 1 c a α q 2 + 1 2 c I p K ( M N ) P + 1 2 c I p K P ( M N ) + 1 2 δ c I p ( 1 K ) M P + 1 2 δ c I p ( 1 K ) M P + 1 2 ( 1 δ ) c I p ( 1 K ) ( M N ) P + 1 2 ( 1 δ ) c I p ( 1 K ) ( M N ) P + v I e [ α + ( 1 α ) q 1 ] ( N M )
G 26 = { h 1 2 λ + h 1 2 λ ( P D λ ) + h 1 2 λ [ α ( 1 q 2 ) + ( 1 α ) q 1 ] + h 1 2 D ( P D λ ) 2 + h α q 2 P 2 D } { 1 2 D c I p K P 2 1 2 D δ c I p ( 1 K ) P 2 1 2 D ( 1 δ ) c I p ( 1 K ) P 2 c I p [ α + ( 1 α ) q 1 ] 1 λ }
G 27 = s I e K ( M N ) + δ s I e ( 1 K ) M + ( 1 δ ) s I e R ( 1 K ) ( M N ) 1 2 c I p K ( M N ) 1 2 c I p K ( M N ) + 1 2 δ c I p ( 1 K ) M 1 2 δ c I p ( 1 K ) M ( 1 δ ) c I p ( 1 R ) ( 1 K ) ( M N ) 1 2 ( 1 δ ) c I p ( 1 K ) ( M N ) 1 2 ( 1 δ ) c I p ( 1 K ) ( M N )
G 28 = { h 1 2 ( P λ D ) ( 1 + D P λ D ) + h 1 P λ D + h D 2 ( P λ D ) 2 + h 1 2 D } 1 2 c B ( 1 P λ D + 1 D ) { 1 2 ( P λ D ) s I e K p I e K 1 ( P λ D ) + 1 2 ( P λ D ) δ s I e ( 1 K ) δ s I e ( 1 K ) 1 ( P λ D ) + 1 2 ( P λ D ) ( 1 δ ) s I e R ( 1 K ) + ( 1 δ ) s I e R ( 1 K ) 1 ( P λ D ) 1 2 D c I p K 1 2 D δ c I p ( 1 K ) 1 2 ( P λ D ) ( 1 δ ) c I p ( 1 R ) ( 1 K ) ( 1 δ ) c I p ( 1 R ) ( 1 K ) 1 ( P λ D ) 1 2 D ( 1 δ ) c I p ( 1 K ) }
G 29 = h 1 P λ D h 1 2 λ ( 1 + D P λ D ) h 1 2 λ h 1 2 ( P λ D ) h 1 2 ( P λ D ) ( P D λ ) h [ α ( 1 q 2 ) + ( 1 α ) q 1 ] 2 ( P λ D ) h 1 D ( P D λ ) + 1 2 D c I p K P + 1 2 D c I p K P 1 2 D δ c I p ( 1 K ) P + 1 2 D δ c I p ( 1 K ) P + 1 2 D δ c I p ( 1 K ) P 1 2 D ( 1 δ ) c I p ( 1 K ) P + 1 2 D ( 1 δ ) c I p ( 1 K ) P { 1 2 D c I p K P 2 1 2 D δ c I p ( 1 K ) P 2 1 2 D ( 1 δ ) c I p ( 1 K ) P 2 c I p [ α + ( 1 α ) q 1 ] 1 λ }
G 30 = 1 2 s I e K D ( M N ) 2 + 1 2 δ s I e ( 1 K ) D M 2 + 1 2 ( 1 δ ) s I e R ( 1 K ) D ( M N ) 2 1 2 ( 1 δ ) c I p ( 1 R ) ( 1 K ) D ( M N ) 2 1 2 ( 1 δ ) c I p ( 1 K ) D ( M N ) 2 1 2 δ c I p ( 1 K ) D M 2 1 2 c I p K D ( M N ) 2 A
G 31 = s ( 1 α ) ( 1 q 1 ) s ( 1 δ ) ( 1 R ) ( 1 K ) ( 1 α ) ( 1 q 1 ) + v [ α ( 1 q 2 ) + ( 1 α ) q 1 + α q 2 ] c i c r ( 1 α ) q 1 c a α q 2 δ s I e ( 1 K ) P M + v I e [ α + ( 1 α ) q 1 ] ( M N ) + 1 2 c I p K P ( M N ) 1 2 c I p K ( M N ) P + 1 2 ( 1 δ ) c I p ( 1 K ) P ( M N ) 1 2 ( 1 δ ) c I p ( 1 K ) P ( M N )
G 32 = { h 1 2 λ + h 1 2 λ ( P D λ ) + h 1 2 λ [ α ( 1 q 2 ) + ( 1 α ) q 1 ] + h 1 2 D ( P D λ ) 2 + h α q 2 P 2 D } { 1 2 D δ s I e ( 1 K ) P 2 1 D δ s I e ( 1 K ) M P 2 v I e [ α + ( 1 α ) q 1 ] λ 1 2 D c I p K P 2 1 2 D ( 1 δ ) c I p ( 1 K ) P 2 }
G 33 = s I e K ( M N ) δ s I e ( 1 K ) M + δ s I e ( 1 K ) M + ( 1 δ ) s I e R ( 1 K ) ( M N ) 1 2 c I p K ( M N ) + 1 2 c I p K ( M N ) ( 1 δ ) c I p ( 1 R ) ( 1 K ) ( M N ) 1 2 ( 1 δ ) c I p ( 1 K ) ( M N ) 1 2 ( 1 δ ) c I p ( 1 K ) ( M N )
G 34 = { h 1 2 ( P λ D ) ( 1 + D P λ D ) + h 1 P λ D + h D 2 ( P λ D ) 2 + h 1 2 D } 1 2 c B ( 1 P λ D + 1 D ) { 1 2 s I e K 1 ( P λ D ) s I e K 1 ( P λ D ) + 1 2 D δ s I e ( 1 K ) 1 D δ s I e ( 1 K ) M + 1 2 ( P λ D ) δ s I e ( 1 K ) 1 ( P λ D ) δ s I e ( 1 K ) + 1 2 ( P λ D ) ( 1 δ ) s I e R ( 1 K ) 1 ( P λ D ) ( 1 δ ) s I e R ( 1 K ) 1 2 D c I p K 1 2 ( P λ D ) ( 1 δ ) c I p ( 1 R ) ( 1 K ) 1 ( P λ D ) ( 1 δ ) c I p ( 1 R ) ( 1 K ) 1 2 D ( 1 δ ) c I p ( 1 K ) }
G 35 = h 1 P λ D h 1 2 λ ( 1 + D P λ D ) h 1 2 λ h 1 2 ( P λ D ) h 1 2 ( P λ D ) ( P D λ ) h [ α ( 1 q 2 ) + ( 1 α ) q 1 ] 2 ( P λ D ) h 1 D ( P D λ ) 1 D δ s I e ( 1 K ) 2 D δ s I e ( 1 K ) M P + 1 2 D c I p K P + 1 2 D c I p K P + 1 2 D ( 1 δ ) c I p ( 1 K ) P + 1 2 D ( 1 δ ) c I p ( 1 K ) P
G 36 = 1 2 s I e K D ( M N ) 2 + 1 2 ( 1 δ ) s I e R ( 1 K ) D ( M N ) 2 1 2 ( 1 δ ) c I p ( 1 R ) ( 1 K ) D ( M N ) 2 1 2 c I p K D ( M N ) 2 1 2 ( 1 δ ) c I p ( 1 K ) D ( M N ) 2 A
G 37 = s ( 1 α ) ( 1 q 1 ) s ( 1 δ ) ( 1 R ) ( 1 K ) ( 1 α ) ( 1 q 1 ) + v [ α ( 1 q 2 ) + ( 1 α ) q 1 + α q 2 ] c i c r ( 1 α ) q 1 c a α q 2 + s I e K P ( M N ) + δ s I e ( 1 K ) P M + ( 1 δ ) s I e R ( 1 K ) P ( M N ) + v I e [ α + ( 1 α ) q 1 ] ( M N ) ( 1 δ ) c I p ( 1 R ) ( 1 K ) P ( M N )
G 38 = { h 1 2 λ + h 1 2 λ ( P D λ ) + h 1 2 λ [ α ( 1 q 2 ) + ( 1 α ) q 1 ] + h 1 2 D ( P D λ ) 2 + h α q 2 P 2 D } { 1 2 D s I e K P 2 1 2 D δ s I e ( 1 K ) P 2 1 2 D ( 1 δ ) s I e R ( 1 K ) P 2 v I e [ α + ( 1 α ) q 1 ] λ + 1 2 D ( 1 δ ) c I p ( 1 R ) ( 1 K ) P 2 }
G 39 = s I e K ( M N ) + s I e K ( M N ) δ s I e ( 1 K ) M + δ s I e ( 1 K ) M ( 1 δ ) s I e R ( 1 K ) ( M N ) + ( 1 δ ) s I e R ( 1 K ) ( M N ) + ( 1 δ ) c I p ( 1 R ) ( 1 K ) ( M N ) ( 1 δ ) c I p ( 1 R ) ( 1 K ) ( M N )
G 40 = { h 1 2 ( P λ D ) ( 1 + D P λ D ) + h 1 P λ D + h D 2 ( P λ D ) 2 + h 1 2 D } 1 2 c B ( 1 P λ D + 1 D ) { 1 2 D s I e K 1 2 ( P λ D ) s I e K 1 2 D δ s I e ( 1 K ) 1 2 ( P λ D ) δ s I e ( 1 K ) 1 2 D ( 1 δ ) s I e R ( 1 K ) 1 2 ( P λ D ) ( 1 δ ) s I e R ( 1 K ) + 1 2 D ( 1 δ ) c I p ( 1 R ) ( 1 K ) + 1 2 ( P λ D ) ( 1 δ ) c I p ( 1 R ) ( 1 K ) }
G 41 = h 1 P λ D h 1 2 λ ( 1 + D P λ D ) h 1 2 λ h 1 2 ( P λ D ) h 1 2 ( P λ D ) ( P D λ ) h [ α ( 1 q 2 ) + ( 1 α ) q 1 ] 2 ( P λ D ) h 1 D ( P D λ ) 1 D s I e K P + 1 D δ s I e ( 1 K ) P + 1 D ( 1 δ ) s I e R ( 1 K ) P 1 D ( 1 δ ) c I p ( 1 R ) ( 1 K ) P
G 42 = A .

Appendix B

The expected value of all of the Gi’s (i = 1,2,3,…, 42) are calculated in the following manner, e.g.:
E [ G 1 ] = s ( 1 E [ α ] ) ( 1 E [ q 1 ] ) s ( 1 δ ) ( 1 R ) ( 1 K ) ( 1 E [ α ] ) ( 1 E [ q 1 ] ) + v { E [ α ] ( 1 E [ q 2 ] ) + ( 1 E [ α ] ) E [ q 1 ] + E [ α ] E [ q 2 ] } c i c r ( 1 E [ α ] ) E [ q 1 ] c a E [ α ] E [ q 2 ] 1 2 D c I p K P 2 λ M 1 2 c I p K P M c I p K P ( N M ) + 1 2 D δ c I p ( 1 K ) P 2 λ M ( 1 δ ) c I p ( 1 K ) P ( N M ) + 1 2 D ( 1 δ ) c I p ( 1 K ) P 2 λ M + 1 2 ( 1 δ ) c I p ( 1 K ) P M c I p { E [ α ] + ( 1 E [ α ] ) E [ q 1 ] } ( N M )
Similarly, the expected values can be calculated for all of the remaining Gi’s (i = 2,3,4,…, 42).

Appendix C

Case (i) MNT’ ≤ T
C 1 :   Proof   of   first   sufficient   condition   of   concavity . To   Prove :   2 y 2 E [ Z 1 ( y , B ) ] 0 where 2 y 2 E [ Z 1 ( y , B ) ] = 2 D { E [ α ] E [ q 2 ] + ( 1 E [ α ] ) ( 1 E [ q 1 ] ) } y 3 { { E [ α ] E [ q 2 ] + ( 1 E [ α ] ) ( 1 E [ q 1 ] ) } { 1 2 δ p I e ( 1 K ) λ M 2 c I p { λ M B 2 D 1 2 δ ( 1 K ) y M ( ( 1 δ ) K + 1 2 δ ) λ M 2 + [ 1 δ ( 1 K ) ] 2 ( 1 { E [ α ] E [ q 2 ] + ( 1 E [ α ] ) ( 1 E [ q 1 ] ) } λ D + 1 D ) } } + 1 2 ( h + c B ) B 2 ( 1 { E [ α ] E [ q 2 ] + ( 1 E [ α ] ) ( 1 E [ q 1 ] ) } λ D + 1 D ) A } 0
Proof :   As   0 K , R , δ , E [ α ] , E [ q 1 ] , E [ q 2 ] 1 , the   following   inequalities   hold   true : ( 1 K ) 0 ;   ( 1 R ) 0 ;   ( 1 δ ) 0 ;   ( 1 E [ α ] ) 0 ;   ( 1 E [ q 1 ] ) 0 ; ( 1 E [ q 1 ] ) 0 ; { E [ α ] E [ q 2 ] + ( 1 E [ α ] ) ( 1 E [ q 1 ] ) } 0 ;
The   first   condition   of   concavity   holds   true   under   the   condition   of : 1 2 δ p I e ( 1 K ) λ M 2 + 1 2 ( h + c B ) B 2 ( 1 { E [ α ] E [ q 2 ] + ( 1 E [ α ] ) ( 1 E [ q 1 ] ) } λ D + 1 D )
c I p { λ M B 2 D 1 2 δ ( 1 K ) y M ( ( 1 δ ) K + 1 2 δ ) λ M 2 + [ 1 δ ( 1 K ) ] 2 ( 1 { E [ α ] E [ q 2 ] + ( 1 E [ α ] ) ( 1 E [ q 1 ] ) } λ D + 1 D ) } + A
C 2 :   Proof   of   sec ond   sufficient   condition   of   concavity . To   Prove :   2 B 2 E [ Z 1 ( y , B ) ] 0 where   2 B 2 E [ Z 1 ( y , B ) ] = D { E [ α ] E [ q 2 ] + ( 1 E [ α ] ) ( 1 E [ q 1 ] ) } y { ( h + c B c I p [ 1 δ ( 1 K ) ] ) ( 1 { E [ α ] E [ q 2 ] + ( 1 E [ α ] ) ( 1 E [ q 1 ] ) } λ D + 1 D ) }
Proof :   As   0 K , δ , E [ α ] , E [ q 1 ] , E [ q 2 ] 1 , the   following   inequalities   hold   true : ( 1 K ) 0 ;   ( 1 δ ) 0 ;   ( 1 E [ α ] ) 0 ;   ( 1 E [ q 1 ] ) 0 ; ( 1 E [ q 1 ] ) 0 ; { E [ α ] E [ q 2 ] + ( 1 E [ α ] ) ( 1 E [ q 1 ] ) } 0 ; The   second   condition   of   concavity   holds   true   under   the   condition   of : h + c B c I p [ 1 δ ( 1 K ) ]
C 3 :   Proof   of   third   sufficient   condition   of   concavity . To   Prove : ( 2 y B E [ Z 1 ( y , B ) ] ) 2 ( 2 y 2 E [ Z 1 ( y , B ) ] ) ( 2 B 2 E [ Z 1 ( y , B ) ] ) 0 where ( 2 y B E [ Z 1 ( y , B ) ] ) 2 ( 2 y 2 E [ Z 1 ( y , B ) ] ) ( 2 B 2 E [ Z 1 ( y , B ) ] ) = 1 { E [ α ] E [ q 2 ] + ( 1 E [ α ] ) ( 1 E [ q 1 ] ) } 2 D 2 y 4 { { c I p [ 1 δ ( 1 K ) ] ( N M ) 1 2 D c I p { E [ α ] E [ q 2 ] + ( 1 E [ α ] ) ( 1 E [ q 1 ] ) } λ M } 2 { ( h + c B ) 2 ( 1 { E [ α ] E [ q 2 ] + ( 1 E [ α ] ) ( 1 E [ q 1 ] ) } λ D + 1 D ) 2 + ( c I p D ) 2 [ 1 δ ( 1 K ) ] 2 + 1 { { E [ α ] E [ q 2 ] + ( 1 E [ α ] ) ( 1 E [ q 1 ] ) } λ D } 2 ( c I p ) 2 [ 1 δ ( 1 K ) ] 2 } }
Proof :   As   0 K , δ , E [ α ] , E [ q 1 ] , E [ q 2 ] 1 , the   following   inequalities   hold   true : ( 1 K ) 0 ;   ( 1 δ ) 0 ;   ( 1 E [ α ] ) 0 ;   ( 1 E [ q 1 ] ) 0 ; ( 1 E [ q 1 ] ) 0 ; { E [ α ] E [ q 2 ] + ( 1 E [ α ] ) ( 1 E [ q 1 ] ) } 0 ;
Thus ,   the   third   condition   of   concavity   holds   true   under   the   condition   of : { c I p [ 1 δ ( 1 K ) ] ( N M ) 1 2 D c I p { E [ α ] E [ q 2 ] + ( 1 E [ α ] ) ( 1 E [ q 1 ] ) } λ M } 2 { ( h + c B ) 2 ( 1 { E [ α ] E [ q 2 ] + ( 1 E [ α ] ) ( 1 E [ q 1 ] ) } λ D + 1 D ) 2 + ( c I p D ) 2 [ 1 δ ( 1 K ) ] 2 + 1 { { E [ α ] E [ q 2 ] + ( 1 E [ α ] ) ( 1 E [ q 1 ] ) } λ D } 2 ( c I p ) 2 [ 1 δ ( 1 K ) ] 2 }

References

  1. Haley, C.W.; Higgins, R.C. Inventory policy and trade credit financing. Manag. Sci. 1973, 20, 464–471. [Google Scholar] [CrossRef]
  2. Goyal, S.K. Economic order quantity under conditions of permissible delay in payments. J. Oper. Res. Soc. 1985, 36, 335–338. [Google Scholar] [CrossRef]
  3. Davis, R.A.; Gaither, N. Optimal ordering policies under conditions of extended payment privileges. Manag. Sci. 1985, 31, 499–509. [Google Scholar] [CrossRef]
  4. Aggarwal, S.P.; Jaggi, C.K. Ordering policies of deteriorating items under permissible delay in payments. J. Oper. Res. Soc. 1995, 46, 658–662. [Google Scholar] [CrossRef]
  5. Teng, J.T.; Chang, C.T.; Chern, M.S.; Chan, Y.L. Retailer’s optimal ordering policies with trade credit financing. Int. J. Syst. Sci. 2007, 38, 269–278. [Google Scholar] [CrossRef]
  6. Su, C.H.; Ouyang, L.Y.; Ho, C.H.; Chang, C.T. Retailer’s inventory policy and supplier’s delivery policy under two-level trade credit strategy. Asia-Pac. J. Oper. Res. 2007, 24, 613–630. [Google Scholar] [CrossRef]
  7. Jaggi, C.K.; Goyal, S.K.; Goel, S.K. Retailer’s optimal replenishment decisions with credit-linked demand under permissible delay in payments. Eur. J. Oper. Res. 2008, 190, 130–135. [Google Scholar] [CrossRef]
  8. Huang, Y.F.; Hsu, K.H. An EOQ model under retailer partial trade credit policy in supply chain. Int. J. Prod. Econ. 2008, 112, 655–664. [Google Scholar] [CrossRef]
  9. Huang, Y.F. Retailer’s inventory policy under supplier’s partial trade credit policy. J. Oper. Res. Soc. Jpn. 2005, 48, 173–182. [Google Scholar] [CrossRef]
  10. Teng, J.T. Optimal ordering policies for a retailer who offers distinct trade credits to its good and bad credit customers. Int. J. Prod. Econ. 2009, 119, 415–423. [Google Scholar] [CrossRef]
  11. Jaggi, C.K.; Verma, M. Ordering policies under supplier-retailer partial trade credit financing. Opsearch 2010, 47, 293–310. [Google Scholar] [CrossRef]
  12. Jaggi, C.K.; Verma, M.; Kausar, A. Customer based two stage credit policies in a supply chain. In Proceedings of the 2011 International Conference on Industrial Engineering and Operations Management, Kuala Lumpur, Malaysia, 22–24 January 2011. [Google Scholar]
  13. Jaggi, C.K.; Aggarwal, K.K.; Verma, M. Optimal retailer’s ordering policies under two-stage partial trade credit financing in a supply chain. Int. J. Ind. Syst. Eng. 2012, 10, 277–299. [Google Scholar] [CrossRef]
  14. Taleizadeh, A.A.; Pentico, D.W.; Jabalameli, M.S.; Aryanezhad, M. An EOQ model with partial delayed payment and partial back ordering. Omega 2013, 41, 354–368. [Google Scholar] [CrossRef]
  15. Giri, B.C.; Sharma, S. Optimal ordering policy for an inventory system with linearly increasing demand and allowable shortages under two levels trade credit financing. Oper. Res. 2016, 16, 25–50. [Google Scholar] [CrossRef]
  16. Shi, X.; Zhang, S. An incentive-compatible solution for trade credit term incorporating default risk. Eur. J. Oper. Res. 2010, 206, 178–196. [Google Scholar] [CrossRef]
  17. Tiwari, S.; Ahmed, W.; Sarkar, B. Multi-item sustainable green production system under trade-credit and partial backordering. J. Clean. Prod. 2018, 204, 82–95. [Google Scholar] [CrossRef]
  18. Wu, J.; Chan, Y.L. Lot-sizing policies for deteriorating items with expiration dates and partial trade credit to credit-risk customers. Int. J. Prod. Econ. 2014, 155, 292–301. [Google Scholar] [CrossRef]
  19. Chen, S.C.; Teng, J.T. Inventory and credit decisions for time-varying deteriorating items with up-stream and down-stream trade credit financing by discounted cash flow analysis. Eur. J. Oper. Res. 2015, 243, 566–575. [Google Scholar] [CrossRef]
  20. Shah, N.H. Retailer’s replenishment and credit policies for deteriorating inventory under credit period-dependent demand and bad-debt loss. TOP 2015, 23, 298–312. [Google Scholar] [CrossRef]
  21. Sarkar, B.; Saren, S. Partial trade-credit policy of retailer with exponentially deteriorating items. Int. J. App. Comput. Math. 2015, 1, 343–368. [Google Scholar] [CrossRef]
  22. Wu, J.; Al-Khateeb, F.B.; Teng, J.T.; Cárdenas-Barrón, L.E. Inventory models for deteriorating items with maximum lifetime under downstream partial trade credits to credit-risk customers by discounted cash-flow analysis. Int. J. Prod. Econ. 2016, 171, 105–115. [Google Scholar] [CrossRef]
  23. Mahata, G.C.; De, S.K. Supply chain inventory model for deteriorating items with maximum lifetime and partial trade credit to credit-risk customers. Int. J. Manag. Sci. Eng. Manag. 2017, 12, 21–32. [Google Scholar] [CrossRef]
  24. Wu, C.; Zhao, Q.; Xi, M. A retailer-supplier supply chain model with trade credit default risk in a supplier-Stackelberg game. Comput. Ind. Eng. 2017, 112, 568–575. [Google Scholar] [CrossRef]
  25. Porteus, E.L. Optimal lot sizing, process quality improvement and setup cost reduction. Oper. Res. 1986, 34, 137–144. [Google Scholar] [CrossRef]
  26. Cárdenas-Barrón, L.E.; Sarkar, B.; Treviño-Garza, G. Easy and improved algorithms to joint determination of the replenishment lot size and number of shipments for an EPQ model with rework. Math. Comput. Appl. 2013, 18, 3138–3151. [Google Scholar] [CrossRef]
  27. Lee, H.L.; Rosenblatt, M.J. Simultaneous determination of production cycle and inspection schedules in a production system. Manag. Sci. 1987, 33, 1125–1136. [Google Scholar] [CrossRef]
  28. Zhang, X.; Gerchak, Y. Joint lot sizing and inspection policy in an EOQ model with random yield. IIE Trans. 1990, 22, 41–47. [Google Scholar] [CrossRef]
  29. Salameh, M.K.; Jaber, M.Y. Economic production quantity model for items with imperfect quality. Int. J. Prod. Econ. 2000, 64, 59–64. [Google Scholar] [CrossRef]
  30. Cárdenas-Barrón, L.E. Observation on: Economic production quantity model for items with imperfect quality. Int. J. Prod. Econ. 2000, 67, 201. [Google Scholar] [CrossRef]
  31. Goyal, S.K.; Cárdenas-Barrón, L.E. Note on: Economic production quantity model for items with imperfect quality—A practical approach. Int. J. Prod. Econ. 2002, 77, 85–87. [Google Scholar] [CrossRef]
  32. Papachristos, S.; Konstantaras, I. Economic ordering quantity models for items with imperfect quality. Int. J. Prod. Econ. 2006, 100, 148–154. [Google Scholar] [CrossRef]
  33. Maddah, B.; Jaber, M.Y. Economic order quantity for items with imperfect quality: Revisited. Int. J. Prod. Econ. 2008, 112, 808–815. [Google Scholar] [CrossRef]
  34. Raouf, A.; Jain, J.K.; Sathe, P.T. A cost-minimization model for multi characteristic component inspection. AIIE Trans. 1983, 15, 187–194. [Google Scholar]
  35. Sarkar, B.; Saren, S. Product inspection policy for an imperfect production system with inspection errors and warranty cost. Eur. J. Oper. Res. 2016, 248, 263–271. [Google Scholar] [CrossRef]
  36. Duffuaa, S.O.; Khan, M. Impact of inspection errors on the performance measures of a general repeat inspection plan. Int. J. Prod. Res. 2005, 43, 4945–4967. [Google Scholar] [CrossRef]
  37. Khan, M.; Jaber, M.Y.; Bonney, M. An economic order quantity (EOQ) for items with imperfect quality and inspection errors. Int. J. Prod. Econ. 2011, 133, 113–118. [Google Scholar] [CrossRef]
  38. Sett, B.; Sarkar, S.; Sarkar, B. Optimal buffer inventory and inspection errors in an imperfect production system with regular preventive maintenance. Int. J. Adv. Manuf. Technol. 2017, 90, 545–560. [Google Scholar] [CrossRef]
  39. Hsu, J.T.; Hsu, L.F. An EOQ model with imperfect quality items, inspection errors, shortage back ordering, and sales returns. Int. J. Prod. Econ. 2013, 143, 162–170. [Google Scholar] [CrossRef]
  40. Zhou, Y.; Chen, C.; Li, C.; Zhong, Y. A synergic economic order quantity model with trade credit, shortages, imperfect quality and inspection errors. Appl. Math. Model. 2016, 40, 1012–1028. [Google Scholar] [CrossRef]
  41. Khanra, S.; Mandal, B.; Sarkar, B. An inventory model with time dependent demand and shortages under trade credit policy. Econ. Mod. 2013, 35, 349–355. [Google Scholar] [CrossRef]
  42. Khanna, A.; Kishore, A.; Jaggi, C. Impact of inflation and trade credit policy in an inventory model for imperfect quality items with allowable shortages. Control Cybern. 2016, 45, 37–82. [Google Scholar]
  43. Palanivel, M.; Uthayakumar, R. An inventory model with imperfect items, stock dependent demand and permissible delay in payments under inflation. RAIRO-Oper. Res. 2016, 50, 473–489. [Google Scholar] [CrossRef]
  44. Taleizadeh, A.A.; Lashgari, M.; Akram, R.; Heydari, J. Imperfect economic production quantity model with upstream trade credit periods linked to raw material order quantity and downstream trade credit periods. Appl. Math. Model. 2016, 40, 8777–8793. [Google Scholar] [CrossRef]
  45. Khanna, A.; Kishore, A.; Jaggi, C. Strategic production modeling for defective items with imperfect inspection process, rework, and sales return under two-level trade credit. Int. J. Ind. Eng. Comput. 2017, 8, 85–118. [Google Scholar] [CrossRef]
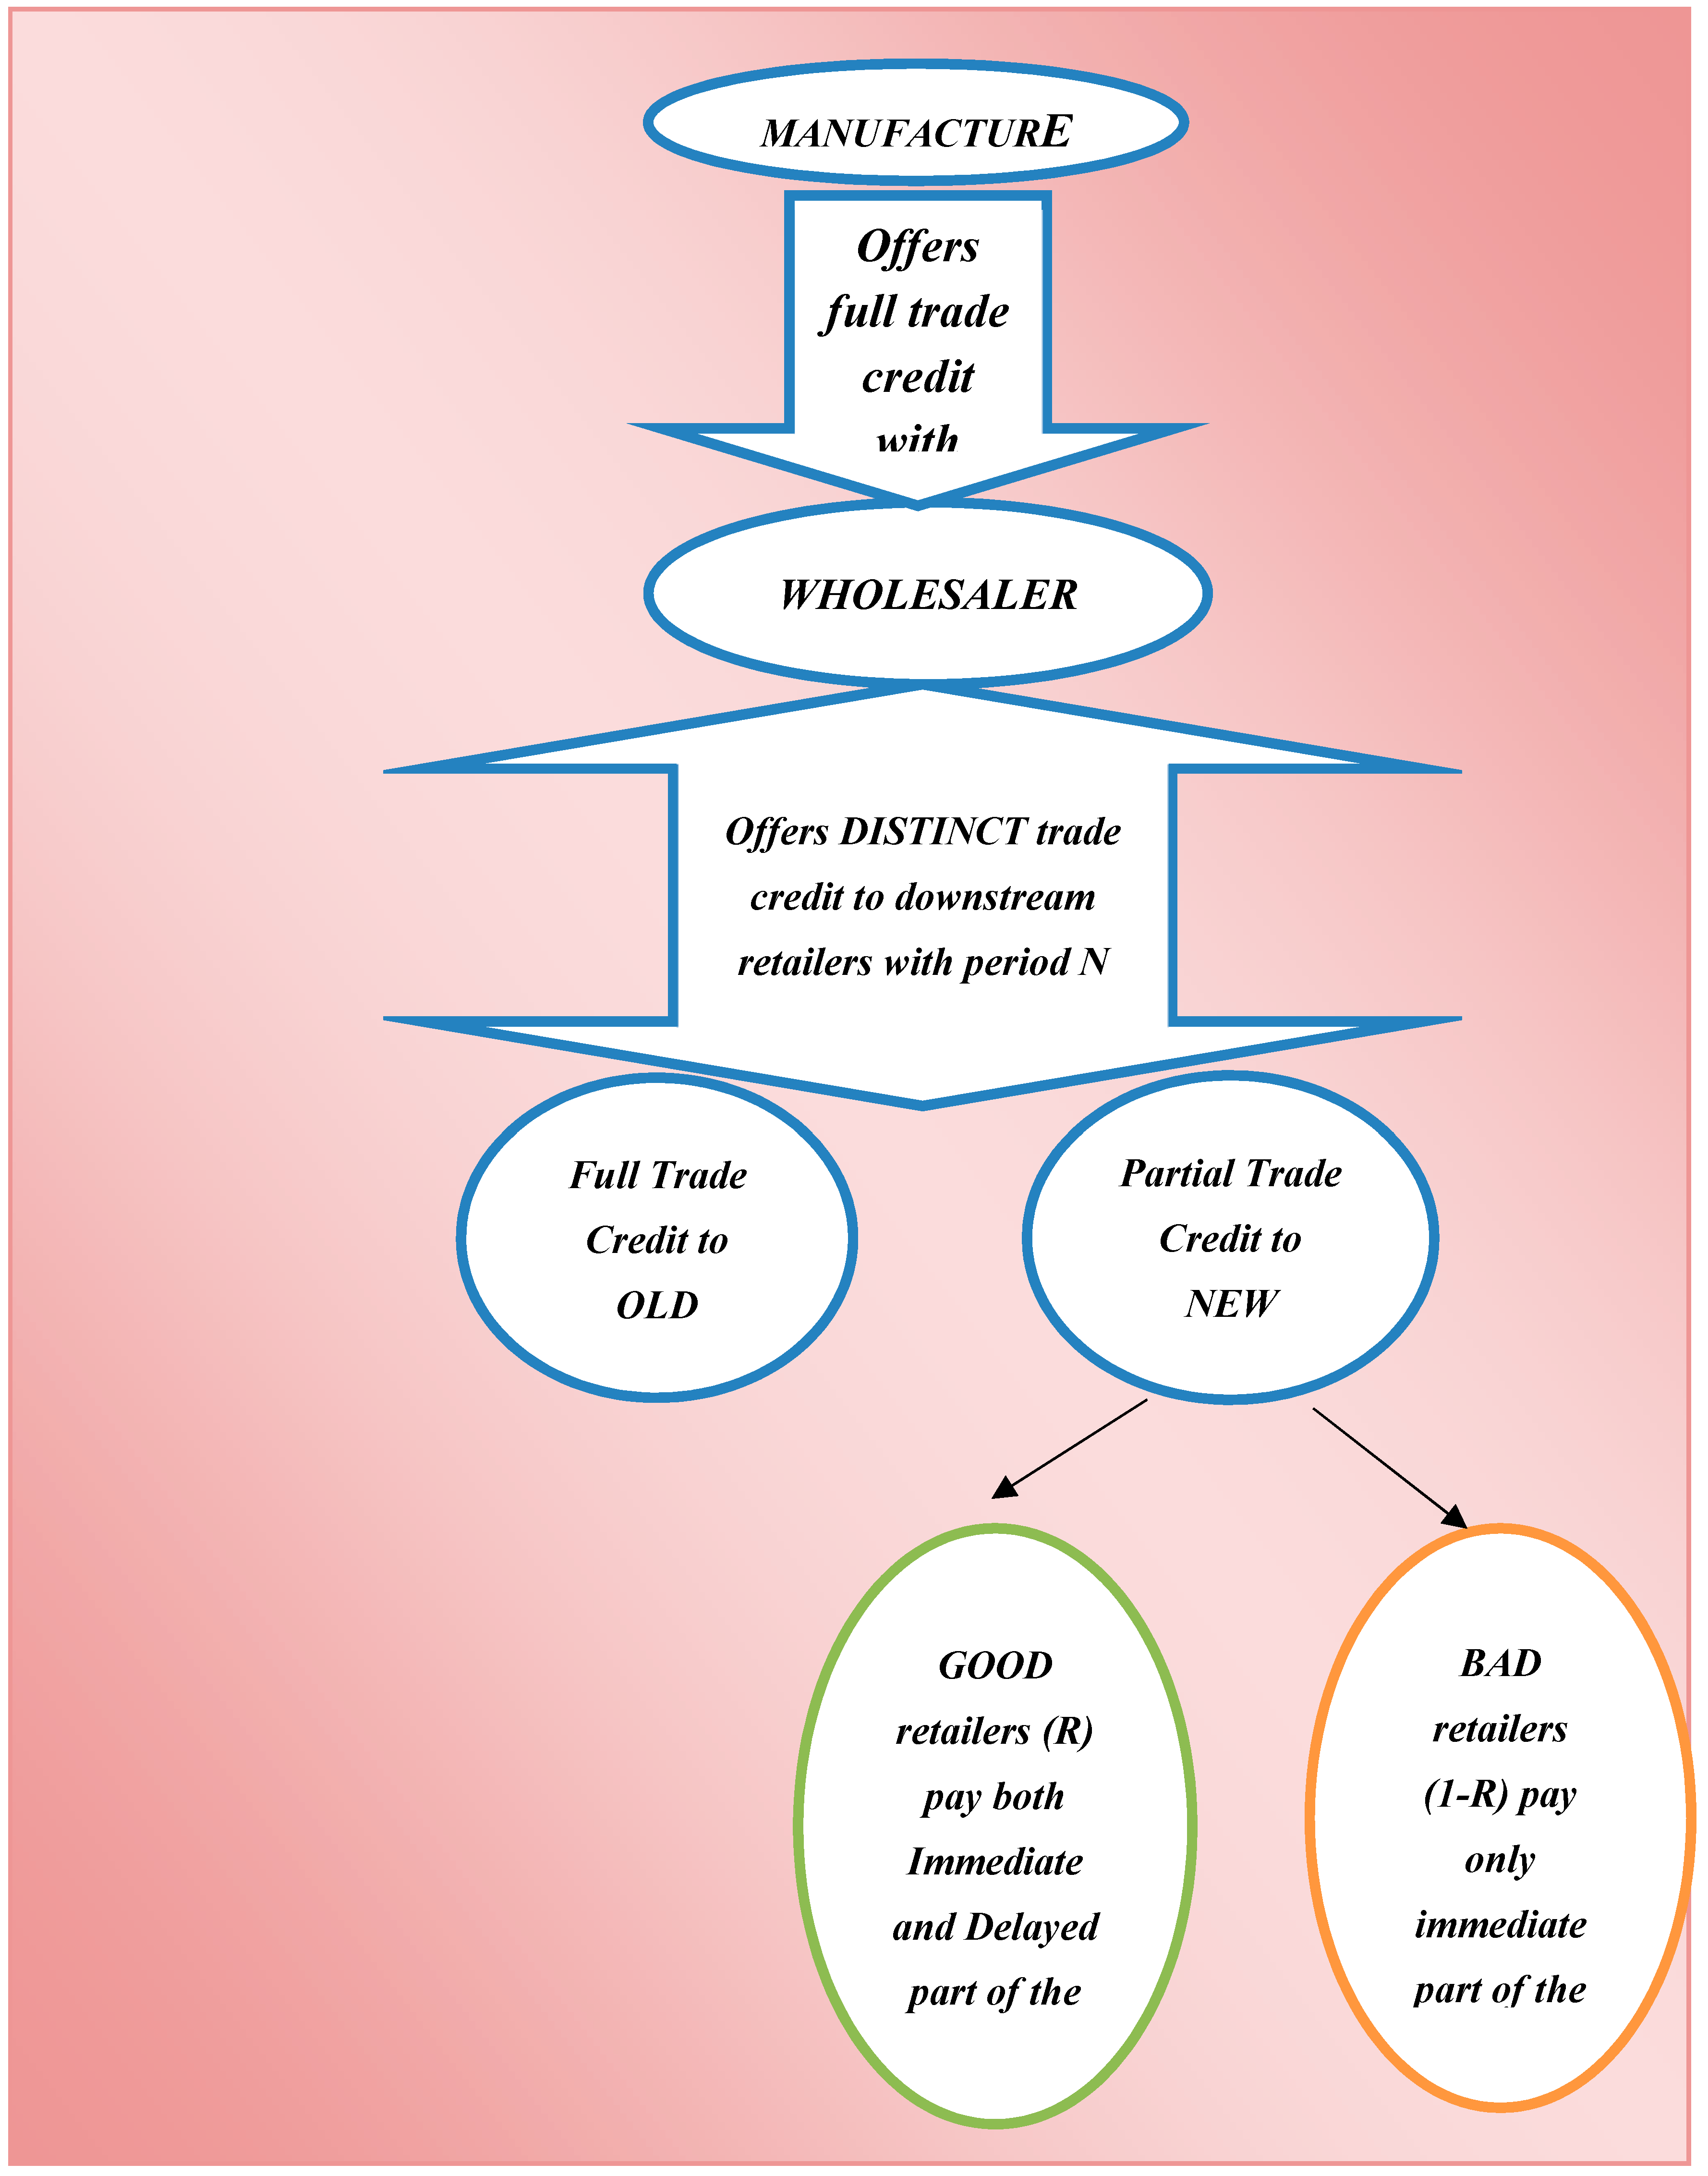
Figure 1. Sequence of permissible delay in the inventory cycle.
Mathematics 06 00299 g001
Figure 2. Inventory behavior of the system.
Mathematics 06 00299 g002
Figure 3. Flowchart of events in the inventory cycle.
Mathematics 06 00299 g003
Table 1. Comparison of major attributes of some previous work with current model.
Author(s)Imperfect QualityScreening ErrorsCredit PolicyBifurcation of CustomerBad DebtsShortagesOptimality
UpstreamDownstreamOld and NewGood and Bad
Teng [10]NoNoYes (Full)Yes (Distinct)NoYesNoNoClosed-form
Jaggiand Verma [11]NoNoYes (Partial)Yes (Partial)NoNoNoNoMathematical
Jaggi et al. [12]NoNoYes (Full)Yes (Distinct)YesNoNoNoClosed-form
Jaggi et al. [13]NoNoYes (Partial)Yes (Partial)NoNoNoNoAlgebraic
Hsu and Hsu [39]YesYesNoNoNoNoNoYesClosed-form
Taleizadeh et. al. [14]NoNoYes (Partial)NoNoNoNoYesClosed-form
Wu and Chan [18]NoNoYes (Full)Yes (Partial)NoNoNoNoMathematical
Chang et. al. [41]YesYesNoYes (Full)NoNoNoNoMathematical
Palanivel and Uthayakumar [43]YesNoYes (Full)NoNoNoNoNoGraphical
Taleizadeh et. al. [44]YesNoYes (Full)Yes (Full)NoNoNoYesMathematical
Sarkar and Saren [21]NoNoYes (Full)Yes (Partial)NoNoNoNoMathematical
Zhou et. al. [40]YesYesYes (Full)NoNoNoNoYesClosed-form
Mahata and De [23]NoNoYes (Full)Yes (Partial)NoNoNoNoMathematical
Khanna et al. [45]YesYesYes (Full)Yes (Full)NoNoNoNoMathematical
This paperYesYesYes (Full)Yes (Partial)YesYesYesYesClosed-form
Table 2. Different cases of trade credit based on different values of M, N and T.
CasesImmediate Payment PartDelayed Payment Part
Case (i)
MNT’T
Mathematics 06 00299 i001 Mathematics 06 00299 i002
Case (ii)
TMN
Mathematics 06 00299 i003 Mathematics 06 00299 i004
Case (iii)
NMt1t1 + NT + N
Mathematics 06 00299 i005 Mathematics 06 00299 i006
Case (iv)
Nt1 + NMt3 + NT + N
Mathematics 06 00299 i007 Mathematics 06 00299 i008
Case (v)
Nt3 + NMT + N
Mathematics 06 00299 i009 Mathematics 06 00299 i010
Case (vi)
NTMT + NT + N
Mathematics 06 00299 i011 Mathematics 06 00299 i012
Case (vii)
NT’ + NMT + N
Mathematics 06 00299 i013 Mathematics 06 00299 i014
Table 3. Numerical data from the Teng [10] model.
DescriptionSymbolValueUnits
Set-up costA12$/cycle
Purchase costC0.5$/unit
Selling prices1$/unit
Holding costh0.2$/unit/year
Interest earnedIe0.1$/year
Interest paidIp0.08$/year
Table 4. Other parameters for the numerical example.
DescriptionSymbolValueUnits
Defect proportionαU~(0.5,0.15)-
Type-1 error proportionq1U~(0.1,0.3)-
Type-1 error proportionq2U~(0.1,0.3)-
Probability density functionf(α)1/(0.15–0.5)-
Probability density functionf(q1)1/(0.3–0.1)-
Probability density functionf(q2)1/(0.3–0.1)-
Demand rateD5000units/year
Inspection rateλ8500units/year
Inspection costi0.15$/unit
Salvage costv0.35$/unit
Type-I error costcr0.05$/unit
Type-II error costca0.1$/unit
Backorder costcB0.2$/unit/year
Fraction of the purchase amountδ20%
Fraction of old retailersK40%
Fraction of good retailersR70%
Whole seller’s credit limitM40days
Retailer’s credit limitN10days
Table 5. Optimal values.
DescriptionSymbolValueUnits
Order sizey*709.47units/cycle
Backorder quantityB*66.81units/cycle
Expected total profit per unit timeE[Z*(y, B)]663.26$/year
Cycle lengthT*45.78days
Table 6. Impact of α on an optimal replenishment policy.
q1 00.010.020.030.04
y*708.79708.93709.47710.60712.65
B*90.0179.2866.8151.8433.03
T*46.6746.2145.7845.3945.05
Z*(y,B)705.98684.81663.26641.35619.11
TRU*4464.524484.024503.904524.224544.94
R1639.32633.08627.17621.77617.15
R2−1.41−1.42−1.42−1.42−1.42
R3−91.85−90.96−90.10−89.33−88.66
R424.8027.0529.3031.5833.92
TCU*3773.673814.063855.103896.733938.81
SC-12.0012.0012.0012.0012.00
PC354.39354.47354.73355.29356.32
IC106.31106.34106.42106.58106.89
EC100.320.630.951.28
EC2-0.140.140.140.140.14
HC9.209.289.359.429.46
BC0.460.370.260.160.06
Table 7. Impact of q1 on an optimal replenishment policy.
q1 00.010.020.030.04
y*708.79708.93709.47710.60712.65
B*90.0179.2866.8151.8433.03
T*46.6746.2145.7845.3945.05
Z*(y,B)705.98684.81663.26641.35619.11
TRU*4464.524484.024503.904524.224544.94
R1639.32633.08627.17621.77617.15
R2−1.41−1.42−1.42−1.42−1.42
R3−91.85−90.96−90.10−89.33−88.66
R424.8027.0529.3031.5833.92
TCU*3773.673814.063855.103896.733938.81
SC-12.0012.0012.0012.0012.00
PC354.39354.47354.73355.29356.32
IC106.31106.34106.42106.58106.89
EC100.320.630.951.28
EC2-0.140.140.140.140.14
HC9.209.289.359.429.46
BC0.460.370.260.160.06
Table 8. Impact of q2 on an optimal replenishment policy.
q2 00.020.030.040.05
y*712.66709.47707.90706.34704.80
B*63.8266.8168.2569.6571.02
T*45.8945.7845.7345.6845.64
Z*(y,B)666.57663.26661.61659.97658.33
TRU*4514.134503.904498.824493.754488.68
R1628.56627.17626.49625.82625.16
R20.00−1.42−2.12−2.83−3.52
R3−90.5190.10−89.91−89.71−89.52
R429.4329.3029.2429.1729.11
TCU*3861.813855.103851.763848.413845.08
SC-12.0012.0012.0012.0012.00
PC356.33354.74353.95353.17352.40
IC106.90106.42106.19105.95105.72
EC10.640.640.640.640.63
EC20.000.140.210.280.35
HC9.379.369.369.359.35
BC0.240.270.280.290.30