Article

Interactive Plants: Multisensory Visual-Tactile Interaction Enhances Emotional Experience

by
Takashi Yamauchi
1,*,
Jinsil Hwaryoung Seo
2 and
Annie Sungkajun
2
1
Department of Psychological and Brain Sciences, Texas A&M University, College Station, TX 77845, USA
2
Department of Visualization, Texas A&M University, College Station, TX 77845, USA
*
Author to whom correspondence should be addressed.
Mathematics 2018, 6(11), 225; https://doi.org/10.3390/math6110225
Submission received: 23 July 2018 / Revised: 11 October 2018 / Accepted: 24 October 2018 / Published: 29 October 2018
(This article belongs to the Special Issue Human-Computer Interaction: New Horizons)

Abstract

:
Using a multisensory interface system, we examined how people’s emotional experiences change as their tactile sense (touching a plant) was augmented with visual sense (“seeing” their touch). Our system (the Interactive Plant system) senses the electrical capacitance of the human body and visualizes users’ tactile information on a flat screen (when the touch is gentle, the program draws small and thin roots around the pot; when the touch is more harsh or abrupt, big and thick roots are displayed). We contrasted this multimodal combination (touch + vision) with a unimodal interface (touch only or watch only) and measured the impact of the multimodal interaction on participants’ emotion. We found significant emotional gains in the multimodal interaction. Participants’ self-reported positive affect, joviality, attentiveness and self-assurance increased dramatically in multimodal interaction relative to unimodal interaction; participants’ electrodermal activity (EDA) increased in the multimodal condition, suggesting that our plant-based multisensory visual-tactile interaction raised arousal. We suggest that plant-based tactile interfaces are advantageous for emotion generation because haptic perception is by nature embodied and emotional.

1. Introduction

Sensory experience, seeing, hearing, touching, smelling and tasting, is intricately connected to emotion. Sensory organs, such as the eye, receive data (e.g., electromagnetic energy) and turn them to information (e.g., color). One critical aspect of this transformation is that the information that the sensory organs produce is mainly emotional. It guides the organism to engage in avoid- or approach-action [1]. When a menacing predator is near-by, the system sends a negative sign; when a prey is detected, the system sends a positive sign. In this manner, our sensory experience is intertwined with emotion.
Sensory engagements are the very foundation of our experience. Among many different sensory experiences, haptic perception is immediate, direct and private [2,3]. Skin and muscle mechanoreceptors and thermoreceptors are distributed all over the body surface, enabling perception of texture, forces, motion, vibration and temperature [4]. Due to this unique nature of haptic perception, touch-based interfaces have flourished in the last 20 years to enhance user engagement in museums, exhibitions and heritage sites [5,6,7].
Despite the growing popularity in tactile interfaces, their utility is not well understood [8]. Combining different sensory experiences such as smell and touch into visual sense does not always produce an intended effect [9]. To what extent does multisensory experience (tactile + visual) elevate or undermine emotion? What emotion (e.g., valence, arousal or other emotions) is influenced most by multisensory integration?
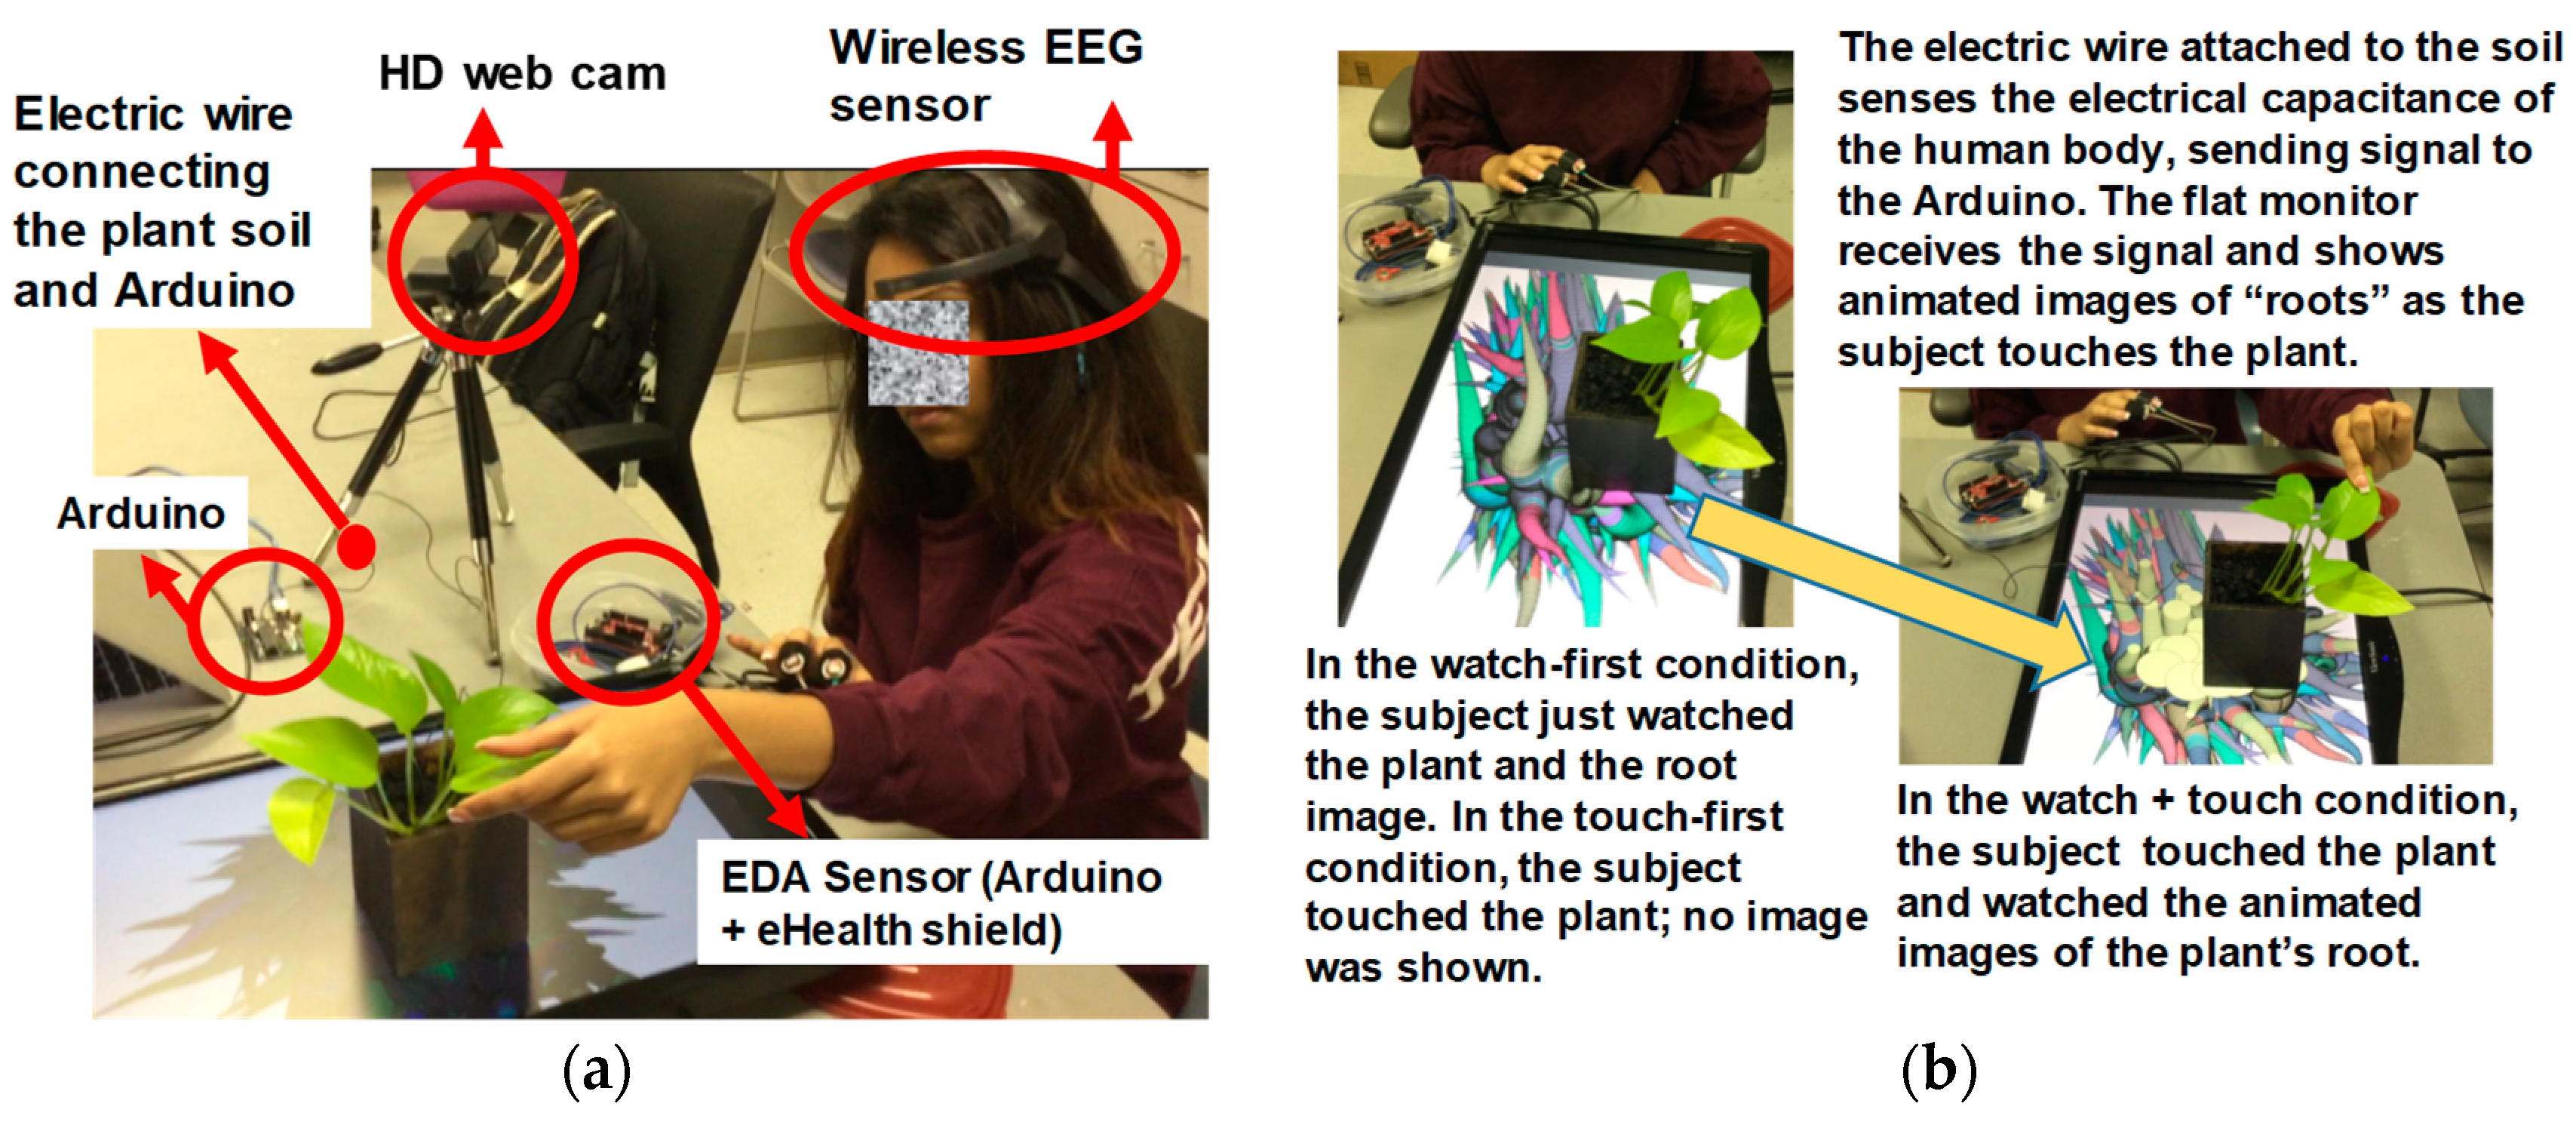
To address these questions, we developed a multisensory apparatus (i.e., Interactive Plant) that converts tactile information into visual information (Figure 1). As a person touches a plant, our system senses changes in the electrical capacitance of her body and converts her tactile sense to animated images, allowing her to “see” her touch real time.

Background and Related Work

The recent surge in touch-based interface design stems from the development of capacitive sensing technology—sensor technology that measures capacitance change. Capacitance refers to the ability to store charges in an electric field. Capacitance between two or more conductors changes due to touch, proximity or deformation of the conductive materials. Touchscreens and touchpads on mobile phones, laptops and tablets make use of capacitive sensing technology [10].
Many objects, such as aluminum foil, copper wires and the human body, allow the flow of electrical current. These conductive objects are thus equipped with sensing capability. Physiological sensors such as electromyography, electrocardiogram and galvanic skin sensors all track capacitive change in muscles and skin [11]. Because proper coating can make nonconductive objects conductive, sensing capability can be imbued to everyday objects including couches [12], bath tubs [13], beds [14], chairs [15], tables [16] and rooms for interactive art installation [17].
Recently, capacitive sensing technology has been extended to human-plant interactions [17]. A number of interactive plants have been developed for an urban festival and park and museum installations [18,19]. For example, Fasnacht and colleagues introduced a large-scale installation of interactive plant system. In their system, colored light emanates from the bottom of the plants as pedestrians touch the plants. Interactive plant systems are also developed to support emotional well-being of people as well as plants. For example, EmotiPlant displays the plant’s health state (e.g., the plants’ stress levels due to overwatering), when touched [20]. The system helps older adults to interact with plants. Park and colleagues [21] applied an interactive plant system for computer game design, using interactive plants as an input interface for game control. The system detects different kinds of touching such as tapping, patting and gentle pinching and sends signals for computer games. The researchers demonstrated that their interactive plant system is effective for controlling anxiety.
Despite this growing popularity in touch-based interfaces in general and capacitive sensing technology in particular, few systematic research studies have been conducted for the emotional impact of touch-based multimodal interfaces.
The pioneering work by Obrist and colleagues [22,23] have shown that, using ultrasonic tactile stimulation technology, people are remarkably consistent in interpreting and generating emotions. The researchers demonstrated that particular haptic patterns—e.g., circular tactile motions on the palm created by ultrasonic “mid-air” non-touch stimulation—are effective in enhancing arousal for museum visitors and curators experiencing art [6]. In other studies, Sakr et al. [24] showed that multimodal digital augmentation (using iPad) enhances students’ emotional engagement in history learning (World War II experiences). For example, one digital stimulus titled “Guns on the Common,” Sakr et al. showed students an image of WWII soldiers training to use guns. While viewing the picture, students also engaged in bodily interactions—pointing and gesture, which resulted in considerable excitement in students, suggesting that multimodal mobile augmentation using iPad is effective in enhancing students’ emotional engagement in history learning.
What is unclear is the emotional impact of touch-based interfaces in a multisensory and multimodal environment, especially when interacting with everyday objects such as plants. Unimodal touch-based interfaces are known to be effective and multimodal interaction using olfaction [25] and gestures [24] enhance emotional engagement. But how about touch-infused multisensory experience? Remarkably this question has been rarely investigated. It is implicitly assumed that multimodal experience is a simple sum of unimodal experiences. As Obrist and colleagues cogently argue, this assumption is misguided. Augmenting touch in regular audio-visual presentation at times causes confusion and exhaustion (e.g., Iron Man 3) [9]. This example underscores the significance of studying multisensory and multimodal experience and interactive plant systems in particular.
In this observation in mind, here we focused on emotional experience of the Interactive Plant and investigated to what extent multisensory experience (tactile + visual) would enhance or undermine emotion using various behavioral and physiological measures. In particular, we investigated how people’s emotional experiences change as their tactile sense (touching the plant) was augmented with visual sense (“seeing” their touch).
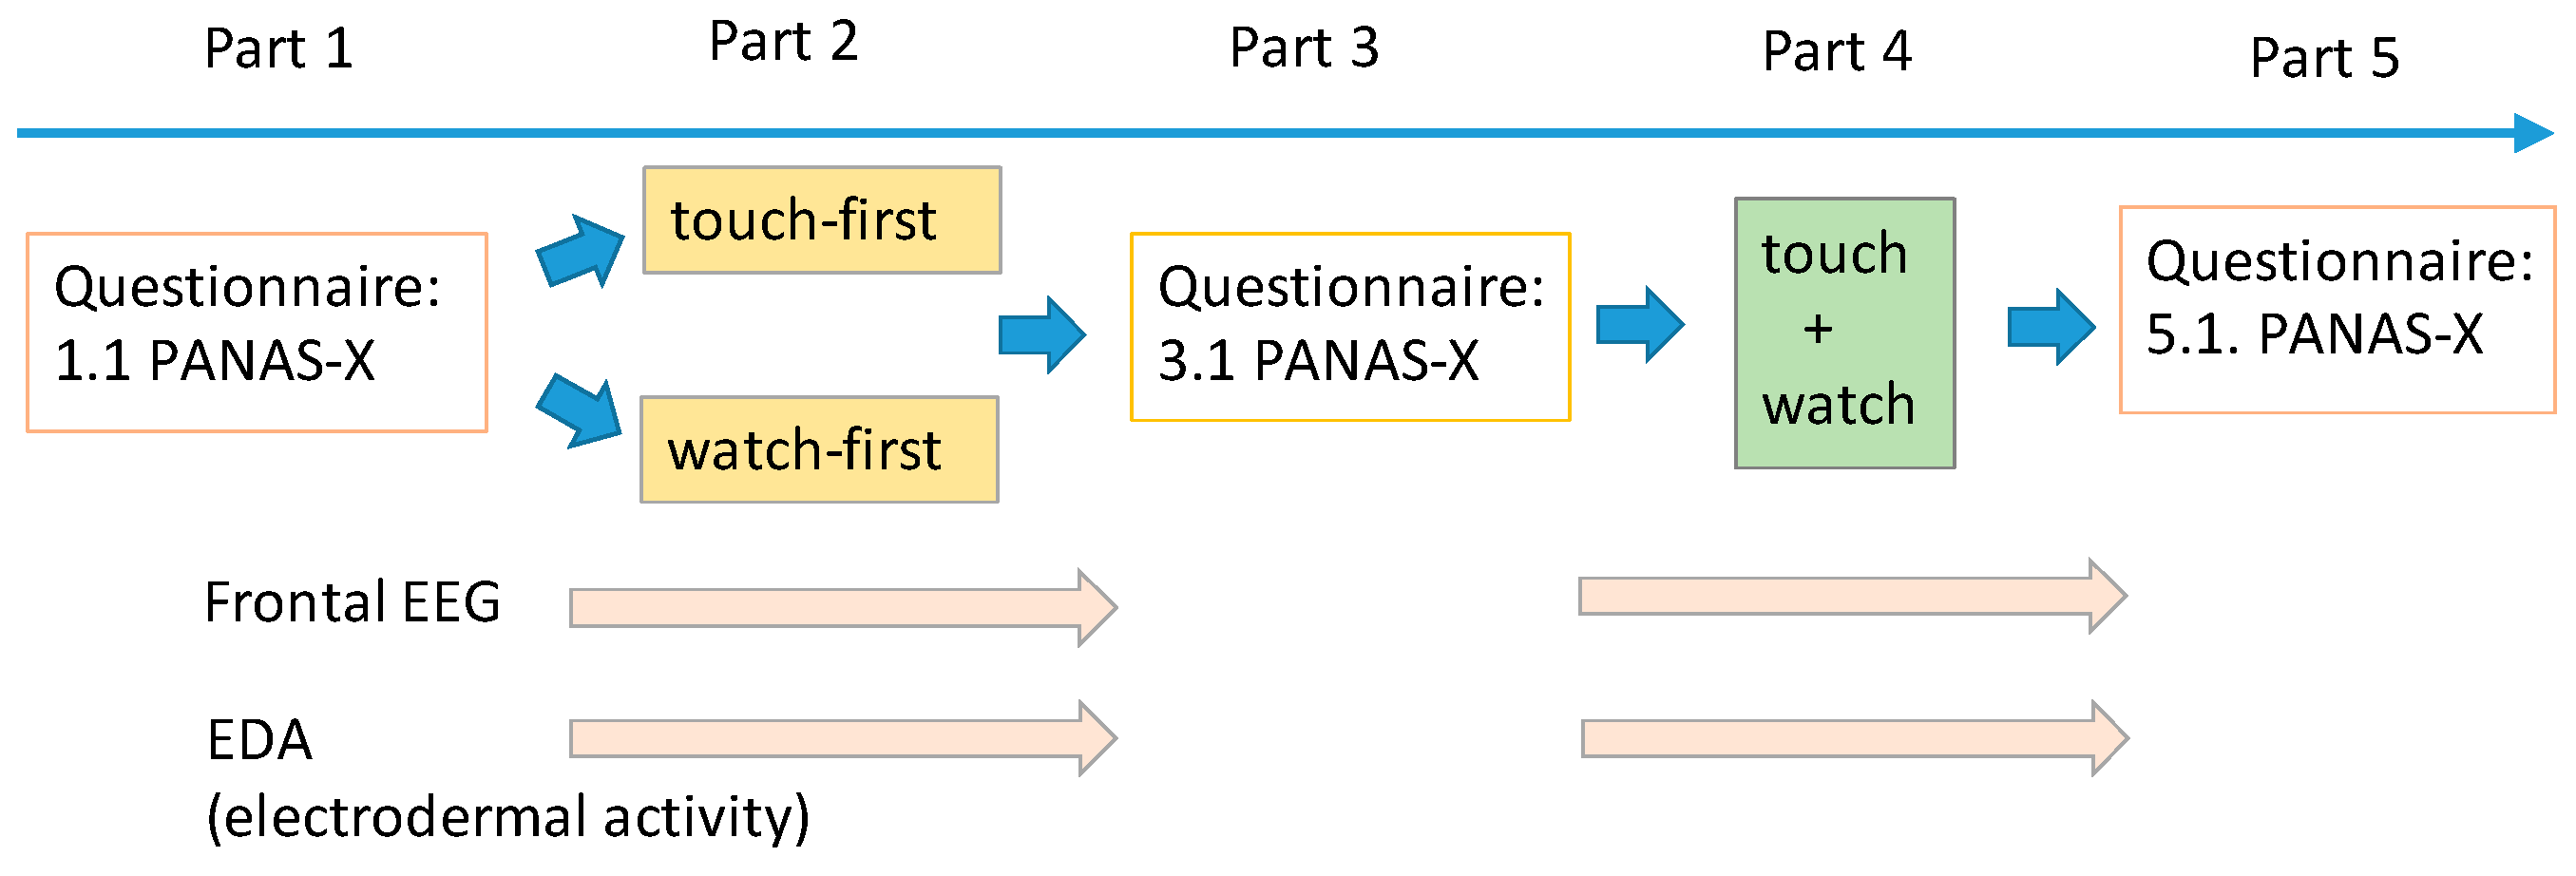
The experiment consisted of five parts (Figure 2). In Parts 1, 3 and 5, participants indicated their emotional states using a questionnaire (Positive Negative Affect Schedule Extended—PANAS-X) [26]. In Part 2, we divided participants into two groups (touch-first, watch-first) and let them touch or watch the plant for 1 min freely (unimodal condition). Later in Part 4 participants interacted with the same plant for one minute in a multimodal fashion (multimodal condition); as participants caressed or petted the plant, an Arduino circuit sensed the qualities of touch and sent the information to our custom-made visualization program, which drew real time animated roots on the screen, creating virtually visualized haptic sense. To scrutinize participants’ emotional reaction, we measured their physiological responses (EDA: electrodermal activity and EEG: electroencephalogram) in Parts 2 and 4.

2. Materials and Methods

2.1. Participants

A total of 41 Texas A&M 1st- or 2nd-year undergraduate students (female n = 28; male n = 13) who enrolled in an introductory psychology course participated in the experiment for course credit. They were randomly assigned to one of two conditions—touch-first (n = 21) or watch-first (n = 20). This study was carried out in accordance with the recommendations of Texas A&M University Institutional Review Board. The protocol was approved by the Texas A&M University Institutional Review Board.

2.2. Procedure

The experiment consisted of 5 parts—Parts 1–5 (Figure 2). In Part 1, all participants answered a questionnaire (Positive and Negative Affect Schedule Extended: PANAS-X) [26]. In Part 2, participants were assigned randomly to the touch-first or watch-first condition. In the touch-first condition, participants just touched the plant for 1 min. In the watch-first condition, participants watched the plant together with its illustrated images shown on the flat screen for 1 min. In Part 3, all participants answered PANAS-X to indicate their emotions. In Part 4, all participants touched and watched the plant for 1 min. Animated images were shown on the flat screen as they touched and watched the plant. In Part 5, Participants indicated their emotional experience with PANAS-X. During Part 2 and Part 4, participants electroencephalography (EEG) and electrodermal activity (EDA) were collected. We also video-recorded participants’ facial expressions to monitor their activity for security purpose.

2.3. Apparatus and Materials

2.3.1. Apparatus

The Interactive Plant System. The Interactive Plant system consisted of a capacitive sensor (regular electric wire), a microprocessor (Arduino Uno), a flat screen monitor (‘24’ ViewSonic VA2431WM) and a pothos plant in a pot (Figure 1). The flat screen monitor was arranged horizontally and the plant was placed on the monitor. The plant was indirectly connected to the Arduino circuit through an electric wire, which was placed inside the soil. The Arduino circuit senses the qualities of touch when the plant is being caressed or petted. The Arduino “CapacitiveSensor library” turns the Arduino pins into a capacitive sensor, which can sense the electrical capacitance of the human body. The sensor data from the Arduino circuit is sent to a custom Processing application via a serial communication protocol and activates our custom-made visualization program on the monitor. The program draws animated roots on the screen responding to the intensity of human touch. When the touch is gentle, the program draws small and thin roots around the pot. When the touch is more harsh or abrupt, big and thick roots are displayed. If a user holds the plant for more than a few seconds, the color of the root system changes one another.
Electrodermal activity. In Parts 2 and 4, we measured participants’ electrodermal activity. Electrodermal activity refers to the changes in electrical resistance and electrical potential on the skin (electrodermal resistance and electrodermal potential). We measured electrodermal activity of individual participants with two disposable pre-gelled EDA electrodes (Biopack EDA Electrode 100/PK—EL 507) attached to the middle and index fingers of their non-dominant hands (two electrodes were placed on volar surfaces of distal phalanges). The electrode has an Ag/AgCl contact (a diameter of 11millimeter) and was pre-gelled with isotonic gel (0.5% chloride salt). Data acquisition was controlled by the e-health Sensor Platform V2.0, which has been developed by the open hardware division of Libelium (http://www.libelium.com/). We employed a sample rate of 30 Hz.
Emotional arousal is known to influence the autonomic nervous system (a high arousal state elevates the electrical conductance of the skin) and the autonomic nervous system controls sweat and blood flow on the skin, which influence the conductance of the skin.
Electroencephalogram (EEG). To assess participants’ attentional states, we applied electroencephalogram (EEG). For EEG data acquisition, we used Neurosky MindWave Mobile (http://neurosky.com/). A single dry electrode was put at a left-forehead position (targeted at Fp1) and a reference electrode was attached to the left earlobe. The EEG signal was amplified 8000× using Neurosky’s proprietary program ThinkGearTM. The signals were passed by low and high pass filters to preserve signals in the 1–50 Hz range. After correcting for possible aliasing, these signals were sampled at 512 Hz. The EEG signal was then sent to the computer by BlueTooth (Kinivo BTD-400 Bluetooth USB Adapter, Kinivo, USA) and was recorded and saved by our custom program.
Neurosky MindWave Mobile is compatible to medical EEG devices. Johnstone et al. [27] compared Neurosky MindWave Mobile to a research-grade EEG system (Nuamps, Neuroscan, Compumedics, Melbourne Australia) and showed that power spectra collected from the two systems were well correlated (r’s > 0.80 at F3 and F7 locations, r’s > 0.70 at Fp1). Hemington and Reynolds [28] also employed the system to test children with Fetal Alcohol Spectrum Disorder (FASD) and found different frontal EEG activities in children with FASD and normal controls. Yamauchi et al. [29] also found that this device is applicable in an interactive learning environment.
We collected participants’ EEG signals primarily to monitor their attentional states.

2.3.2. Emotion Measures

We assessed participants’ emotions with the questionnaire (PANAS-X) and electrodermal activity (EDA). To monitor participants’ attentional states (e.g., high/low alert) we also measured participants’ brain activity using a wireless electroencephalogram (EEG) system. The PANAS-X was administered in Parts 3 and 5 and EDA and EEG were collected in Parts 2 and 4. In all measures, the impact of multisensory experience (visual + tactile) in Part 4 was analyzed with respect to that of unimodal experience (touch-first or watch-first) in Part 2.
PANAS-X. The Positive and Negative Affect Schedule-Extended (PANAS-X) [26] measures affective states with smaller granularity (e.g., fear, sadness, surprise, joviality, self-assurance, attentiveness and hostility) as well as two general categories of positive and negative affects. The questionnaire consists of 60 emotional words and phrases (e.g., cheerful, sluggish, relaxed); participants read each item (“Cheerful”) and then indicated to what extent they had felt that way while they were interacting with the plant. We administered the PANAS-X with our custom-made software (written in C#), in which participants were presented with each question one at a time on the computer screen and indicated their response by clicking one of the five radio buttons labeled as 1 = very slightly/not at all to 5 = extremely.
This questionnaire assumes that human emotions are hierarchically organized: high-level categories, positive and negative affects, correspond to valence and the lower-level categories (e.g., joviality, attentiveness, self-assurance, fear, hostility) represents specific contents of valence [4]. Panksepp and Watt [30] indicate that emotions are layered in the evolution of brain-mind development. In this measure, we focused on two broad categories of positive affect and negative affect along with their eight sub-categories—joviality, self-assurance, attentiveness, fear, sadness, hostility, fatigue and surprise. These sub-categories of emotion were selected because they are relevant to the current study. The emotions such as guilt and shame were not analyzed for this reason.
Electrodermal activity (EDA). In addition to the questionnaire, we also measured participants’ electrodermal activities in Parts 2 and 4. We identified phasic skin conductance responses (SCR) during the interactive sessions (Parts 2 and 4) with two electrodes attached to the middle and index fingers of participants’ non-dominant hands (two electrodes were placed on volar surfaces of distal phalanges). We assessed frequency and amplitudes of skin conductance responses in absence of identifiable eliciting stimuli (NR-SCRs). To quantify the amplitude and frequency of NR-SCRs, we applied the Ledalab’s (http://www.ledalab.de/) Discrete Decomposition Analysis method. The Ledalab, which offers a Matlab-based skin conductance data analysis platform, employs a deconvolution-based decomposition method and helps separate tonic and phasic skin conductance data.
Electroencephalogram (EEG). To process electrophysiological signals, we employed Neurosky’s proprietary algorithm ThinkGearTM, which applies standard FFT (Fast Fourier Transform) on the filtered signal and produces commonly recognized eight EEG powers: delta (0.5–2.75 Hz), theta (3.5–6.75 Hz), low-alpha (7.5–9.25 Hz), high-alpha (10–11.75 Hz), low-beta (13–16.75 Hz), high-beta (18–29.75 Hz), low-gamma (31–39 Hz) and mid gamma (41–49.75 Hz) together with proprietary eSenseTM attention and meditation meters, which were computed with a wide spectrum of brain waves in both time and frequency domains. The attention meter, which measures attentiveness of the user, is said to have more emphasis on the beta wave. The meter value is reported on a relative scale of 1–100. Our data analysis focused on the attention meter and alpha, theta and beta band powers, which have been shown to be related to mental workload [31].

2.3.3. Dependent Measures and Design

The experiment had a 2 (modality; unimodal, multimodal) × 2 (task; touch-first, watch-first) × 2 (gender; female, male) factorial design. For all our data analysis, we applied 2 (modality; unimodal, multimodal) × 2 (task; touch-first, watch-first) × 2 (gender; female, male) Analysis of Variance (ANOVA) and resultant ANOVA tables are presented in Appendix A.

3. Results

We report the impact of the multisensory experience on emotion with participants’ self-report (PANAS-X) first, followed by EDA and EEG. Overall, we found that multimodal interaction (visual + touch) significantly enhanced participants’ positive effects but had little influence on negative effects.
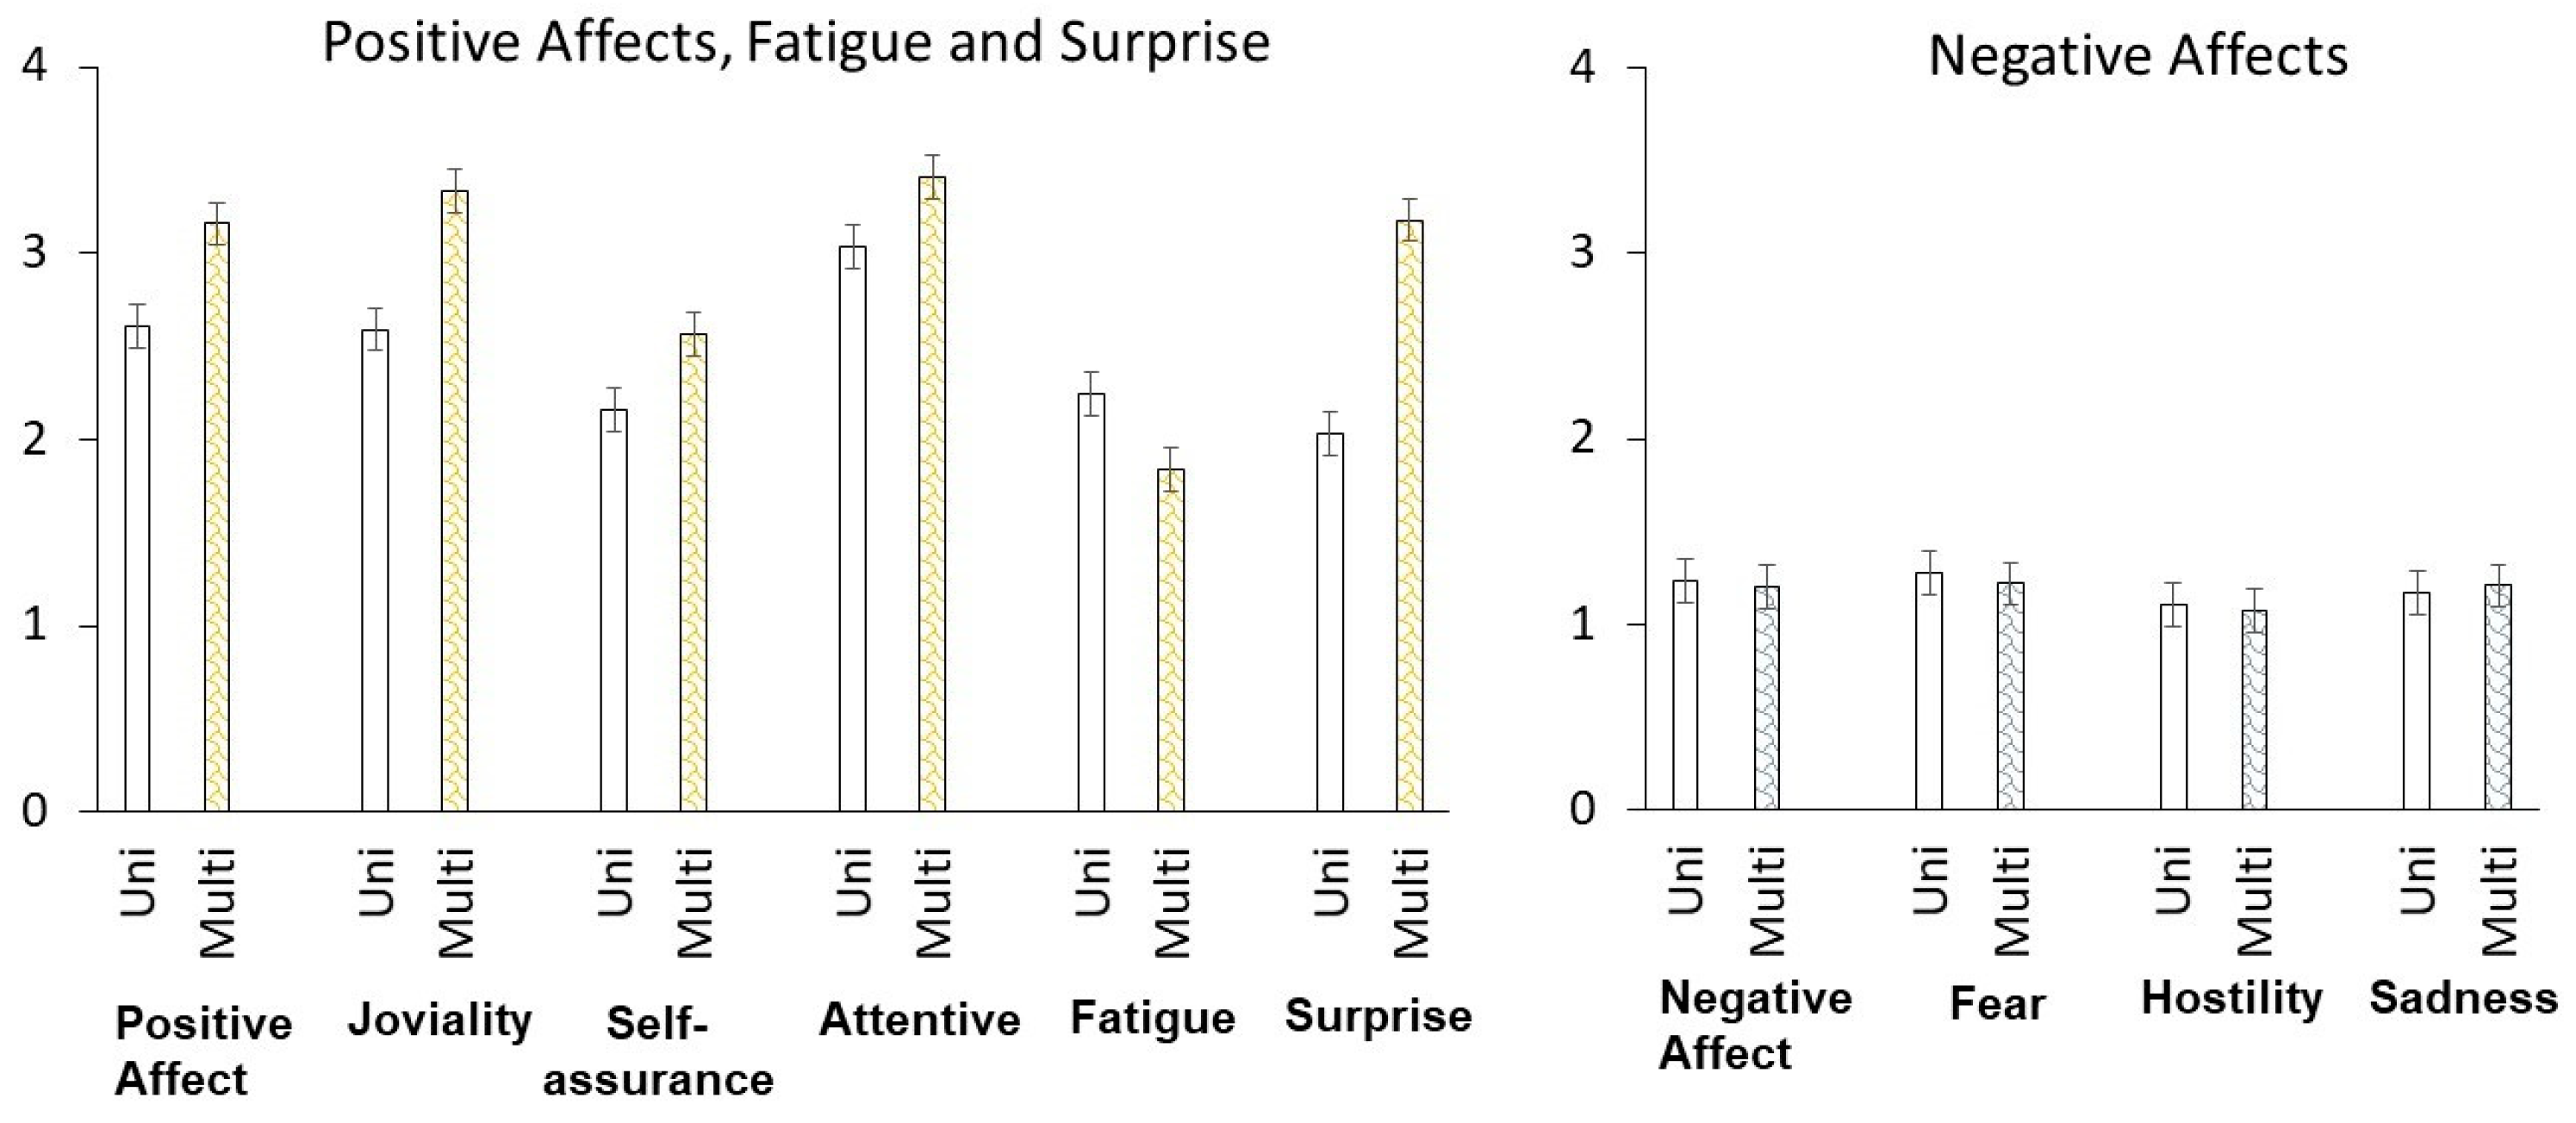
Questionnaire (PANAS-X). As compared to the unimodal interaction, the multimodal interaction (touch + vision) clearly boosted participants’ positive affect, joviality, self-assurance and attentiveness; positive affect, F(1, 37) = 15.42, MSE = 0.38, p < 0.001, η2p = 0.29; joviality, F(1, 37) = 20.41, MSE = 0.19, p < 0.001, η2p = 0.36; self-assurance, F(1, 37) = 23.43, MSM = 0.15, p < 0.001, η2p = 0.39; attentiveness, F(1, 37) = 4.92, MSE = 0.33, p < 0.05, η2p = 0.12. The multimodal interaction did not influence negative affect, fear, hostility and sadness; F’s < 1.0; the multimodal interaction resulted in a significant increase in surprise; F(1, 37) = 32.48, MSE = 0.59, p < 0.001, η2p = 0.47 and a reduction of fatigue; F(1, 37) = 6.64, MSE = 0.30, p < 0.05, η2p = 0.15. In all measures, we found no evidence for interaction between modality (unimodal vs. multimodal) and task (touch-first, watch-first); similarly, we found no interaction between modality (unimodal vs. multimodal) and gender; for all measures, F’s < 2.47, p’s > 0.12 (Figure 3).
These results suggest that the multimodal interaction enhanced positive affects but not negative affects. The emotional impact of modality was substantial in both male and female participants and it was present regardless of the initial task (touch-first or watch-first).
EDA (electrodermal activity). As suggested in References [32,33], we report the amplitude and the frequency of skin conductance responses (SCRs). To identify an individual SCR, we applied the decomposition algorithm developed by Benedek and Kaernbach [33]. The algorithm has been implemented in a Matlab toolbox (Ledalab; http://www.ledalab.de/). To preprocess the EDA data, we applied Ledalab’s adaptive smoothing algorithm first and then discrete deconvolution, which identified time-stamped occurrences and amplitudes of SCRs for individual participants. For each participant, we calculated mean and total SCR amplitudes and its frequency. For the frequency analysis, we counted the number of identified SCR for each participant. To calculate total SCR amplitudes, we summed amplitudes of identified SCR for each participant and to calculate mean SCR amplitudes, for each participant, we divided total SCR amplitudes by SCR frequency. The data from 4 participants were lost due to data acquisition error (their EDA data were not recorded). Thus, the data from 37 were analyzed.
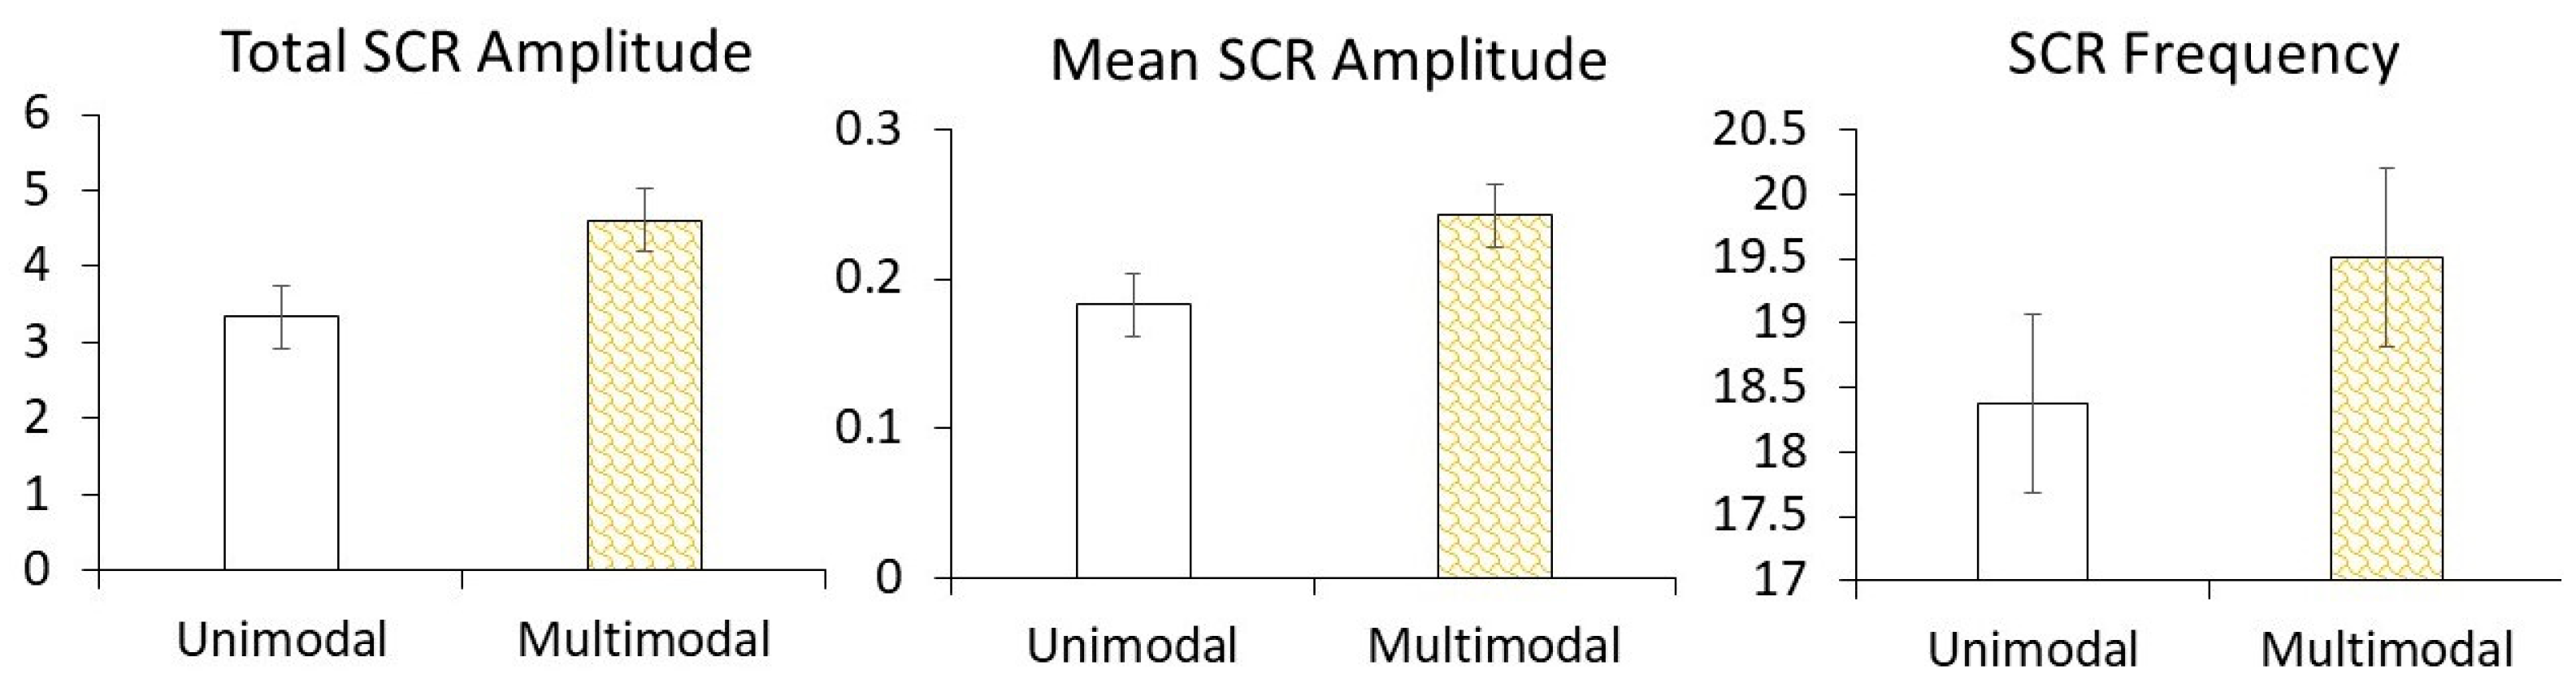
Consistent with the questionnaire data (PANAS-X), we found that total and mean SCR amplitudes were significantly larger in the multimodal condition than in the unimodal condition; total SCR amplitude, F(1, 33) = 5.78, MSE = 5.15, p < 0.05, η2p = 0.15; mean SCR amplitude, F(1, 33) = 4.64, MSE = 1.46, p < 0.05, η2p = 0.15. For SCR frequency, the difference between the unimodal condition and the multimodal condition was marginally significant; F(1, 33) = 3.76, MSE = 8.23, p =0.06, η2p = 0.15. Modality interacted neither with gender nor with task; F’s < 1.72, p > 0.19 (Figure 4).
These results suggest that, consistent with the questionnaire data, the multimodal interaction created high emotional arousal.
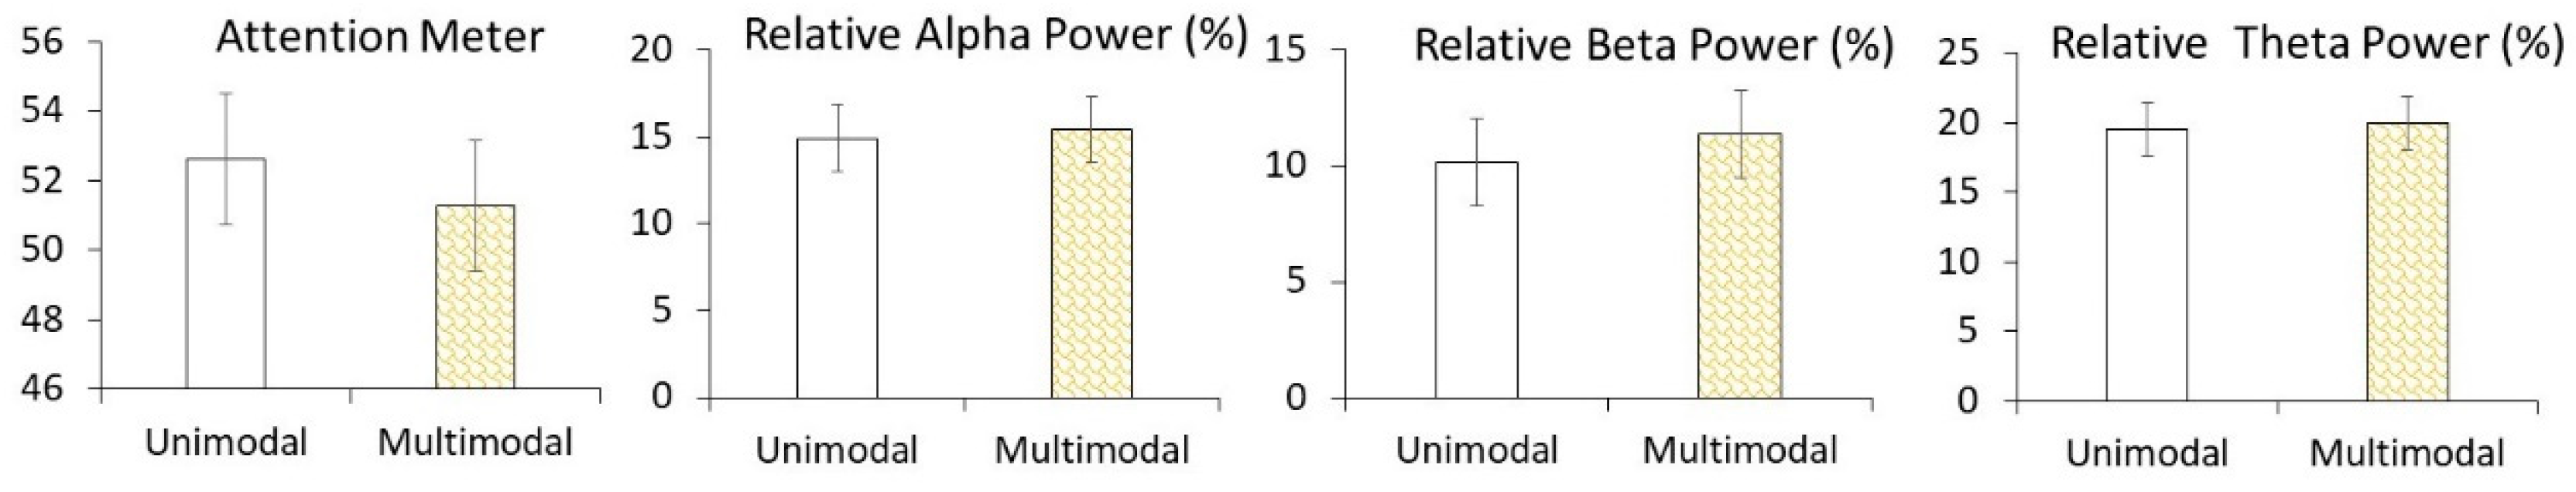
EEG (electroencephalography). In our EEG analysis, we examined powers of 8 spectral bands and attention meter, which were collected in Parts 2 and 4 every second (1 Hz). For all band signals, we calculated relative band powers following the procedure adopted by Johnstone et al. [27]; we summed the powers of all eight bands—delta (0.5–2.75 Hz), theta (3.5–6.75 Hz), low-alpha (7.5–9.25 Hz), high-alpha (10–11.75 Hz), low-beta (13–16.75 Hz), high-beta (18–29.75 Hz), low-gamma (31–39 Hz) and mid gamma (41–49.75 Hz)—and then divided the power for each band by the total, which was expressed as a percentage. Here, we focused on attention meter and relative alpha, beta and theta band powers, which are known to be related to mental workload [31]. None of these comparisons showed statistical significance; for all main effect of modality, F’s < 1.0, suggesting that the enhanced positive emotion created in the multisensory interaction was unlikely due to boosted attention (Figure 5).

4. Discussion

Summary. Visualizing touch clearly enhanced participants’ emotions. When visual and tactile senses were integrated (participants could “see” animated images of their touch), participants found the interactive experience more fun, assuring and attentive. They felt less fatigued and more surprising. Participants’ emotional arousal, as measured by their skin conductance response, also showed a significant increase in the multimodal condition than in the unimodal condition. The multisensory combination did not make participants more fearful or hostile. In contrast, the multimodal interaction gave virtually no adverse effect. Negative emotions, such as fear, sadness and hostility were unaffected. Taken together, our results suggest that our Interactive Plant system was effective in enhancing participants’ emotional experience.
One may argue that the within-subjects design we employed for this experiment might have caused an order effect. That is, participants find multimodal interaction (visual + touch) more engaging and fun than unimodal interaction simply because the multimodal interaction was given later in the experiment, rather than earlier. This scenario is very unlikely because, as a vast majority of psychological studies demonstrate, people’s engagement level most likely declines later in the experiment rather than improves [34]. People’s task engagement is closely related to the cognitive resources (attention and working memory) available to them. Their cognitive resources have a limited capacity and decline with continued use (habituation, mental fatigue). Thus, the level of engagement is generally high earlier in the experiment than later. Thus, our design (i.e., the multimodal condition is presented after the unimodal condition) is most likely to weaken, rather than boost, the level of engagement (i.e., multimodal interaction is emotionally more engaging). In other words, our within-subjects design, rather than promotes the findings, it counteracts the findings. Despite this adverse condition, our result shows that multimodal plant-based interaction was even stronger, revealing the robustness of our findings.
Implications. Using capacitive sensing technology, Poupyrev et al. [18] developed one of the first interactive plant systems. Since then, several other systems have been developed to study people’s engagement in a large-scale installation [19], gaming [21] and eco-feedback [35]. Our interactive plant system is a direct extension of these predecessors. Our system differs from the previous work in several points. To our knowledge, this study is one of the first systematic studies that assess the impact of interactive plant systems on emotion using both self-report measures as well as physiological measures (EDA). Although past research examined the impact of interactive plants on emotional engagement (e.g., Park), these studies only examined self-report. We show that the interactive plant system is effective on both behavioral level and physiological level (EDA), providing a strong endorsement of touch-based sensing technology as applied to plants in particular.
Why is the touch-based multimodal interface effective in boosting emotional engagement? The modern psychological constructionist model of emotion posits that emotion emerges from continuous conceptualization (meaning making) of core affect—bodily sensations of feeling good/bad and high/low arousal—in a given situation. It is a continuous and dynamic process of situational meaning making [36,37]. In this framework, the brain is more like a Bayesian inference meaning-making machine, in which it anticipates sensory inputs (likelihood) to constrain priors to generate posterior inference. Sensory inputs not only come from the external environment (exteroceptive sensations) but also from one’s body (heart rate, inflammation, muscle contraction). A variety of emotions we experience are “constructed” from a domain general mechanism of conceptualization (meaning making) [36,37,38,39,40]. In this regard, sensory engagements are the very foundation of our experiences and meaning-making [2]. Haptic sense is special in this process as it occurs in the entire body surface. We attribute the advantage of touch-based interfaces to the special nature of haptic perception and suggest that interactive plants systems are particularly suited to evoke the constructive nature of emotion.
Limitations and future directions. We are not certain how our finding can be generalized to other multimodal interfaces. The enhanced emotions in our plant system could simply be due to the fact that plants are natural and tangible. Other objects such as tables or desks may not elicit the same effect. It is also possible that our finding could be just due to a side effect of “surprise.” A surprising presentation of depicting “touch” might have created arousal, which in turn resulted in boosting positive emotions. It is also not clear how long the emotional impact would last. With repeated uses of the multimodal interfaces, novelty may fade and the emotional advantage of the plant-based multisensory interaction may disappear. In the current experiment, we find that negative emotions were less affected by the multimodal-multisensory interaction. It is unknown whether this lack of influence can be extended beyond our particular experimental condition. Future research should shed light on these issues.
We chose this plant-based interface because pothos plants are natural and easily available. The results we obtained are very much subject to the choice of the interface. If we used, for example, a teddy bear or a tennis ball as interfaces, we might have obtained different results. Whether we can extend the current finding to other interfaces should be addressed in a future study.
The interactive plant system developed here was designed to enhance emotional experience of people. Raising emotional experience is important for people with emotional disorders such as depression, anxiety and stress. Our system is accessible and relatively inexpensive; it can be employed for older adults who live in a nursery home, as well as young children with autism spectrum and Asperger’s syndrome. Although our interactive plant system is not intended to enhance learning per se, the system could be extended to early mathematics education, such as learning basic concepts of numbers, as our multimodal system is likely to help generate vivid, tangible and direct emotional experience. In future research, we would like to explore these areas.

5. Conclusions

Multisensory-multimodal interfaces are useful because they supplement limitations inherent in human working memory and attention. Multimodal-multisensory interfaces are natural and efficient because they are congruent with the embodied nature of information processing [2]. We suggest that our plant-based multimodal-multisensory interfaces are also conducive for rich emotional experience. Our multimodal-multisensory interface design is simple and straightforward. Our interfaces consist of a microprocessor (Arduino Uno), electric wire, Arduino library and a flat monitor. This simple configuration can be extended and applied in many other situations with little additional costs. Given that this multimodal-multisensory interface design is advantageous for emotion making, we suggest that developers of multimodal-multisensory interfaces pay more attention to the emotional impact of multimodal-multisensory interaction.

Author Contributions

Conceptualization, T.Y., J.H.S. and A.S.; Methodology, T.Y., J.H.S. and A.S.; Software, T.Y., J.H.S. and A.S.; Validation, T.Y.; Formal Analysis, T.Y.; Investigation, T.Y., J.H.S. and A.S.; Resources, T.Y. and J.H.S.; Data Curation, T.Y.; Writing-Original Draft Preparation, T.Y.; Writing-Review & Editing, T.Y. and A.S.; Visualization, T.Y., J.H.S. and A.S.; Supervision, T.Y. and J.H.S.; Project Administration, A.S.

Acknowledgments

The authors would like to thank Lara Andres for her administrative and technical support.

Conflicts of Interest

The authors declare no conflict of interest.

Appendix A

This appendix presents ANOVA tables obtained from 2 (modality; unimodal, multimodal) × 2 (task; touch-first, watch-first) × 2 (gender; female, male) Analysis of Variance (ANOVA).

Appendix A.1. PANAS-X

Table A1. Positive Affect.
Within-Subjects Effects
SSdfMSFpη2p
modality5.81815.81815.415<0.0010.294
modality × gender1.44711.4473.8330.0580.094
modality × task1.55811.5584.1270.0490.100
modality × gender × task0.20810.2080.5500.4630.015
Residual13.963370.377
Between-Subjects Effects
SSdfMSFpη2p
gender0.17610.1760.1230.7280.003
task3.32913.3292.3320.1350.059
gender × task4.84714.8473.3950.0730.084
Residual52.826371.428
Note: Type III Sum of Squares: SS = Sum of Squares; df = degree of freedom; MS = Mean Square; F = F value, p = p value; η2p = partial eta squared.
Table A2. Joviality.
Within-Subjects Effects
SSdfMSFpη2p
modality3.90613.90620.410<0.0010.356
modality × gender0.10410.1040.5420.4660.014
modality × task0.16210.1620.8450.3640.022
modality × gender × task0.13110.1310.6840.4130.018
Residual7.080370.191
Between-Subjects Effects
SSdfMSFpη2p
gender0.45410.4540.4490.5070.012
task2.60912.6092.5790.1170.065
gender × task4.48114.4814.4300.0420.107
Residual37.426371.012
Note: Type III Sum of Squares: SS = Sum of Squares; df = degree of freedom; MS = Mean Square; F = F value, p = p value; η2p = partial eta squared.
Table A3. Self-assurance.
Within-Subjects Effects
SSdfMSFpη2p
modality3.47513.47523.346<0.0010.387
modality × gender0.06810.0680.4580.5030.012
modality × task4.52 × 10−4 14.52 × 10−40.0030.9560.000
modality × gender × task0.28510.2851.9180.1740.049
Residual5.507370.149
Between-Subjects Effects
SSdfMSFpη2p
gender9.06419.0646.0740.0180.141
task2.03512.0351.3640.2500.036
gender × task7.56717.5675.0710.0300.121
Residual55.208371.492
Note: Type III Sum of Squares: SS = Sum of Squares; df = degree of freedom; MS = Mean Square; F = F value, p = p value; η2p = partial eta squared.
Table A4. Attentiveness.
Within-Subjects Effects
SSdfMSFpη2p
modality1.64211.6424.9260.0330.117
modality × gender0.01010.0100.0300.8640.001
modality × task0.01110.0110.0320.8600.001
modality × gender × task0.34110.3411.0240.3180.027
Residual12.330370.333
Between-Subjects Effects
SSdfMSFpη2p
gender0.02411.1931.1630.2880.030
task0.01912.1092.0560.1600.053
gender × task0.00113.2073.1260.0850.078
Residual0.025371.026
Note: Type III Sum of Squares: SS = Sum of Squares; df = degree of freedom; MS = Mean Square; F = F value, p = p value; η2p = partial eta squared.
Table A5. Negative Affect.
Within-Subjects Effects
SSdfMSFpη2p
modality0.02410.0240.4790.4930.013
modality × gender0.01910.0190.3850.5390.010
modality × task0.00110.0010.0240.8780.001
modality × gender × task0.02510.0250.5080.4810.014
Residual1.822370.049
Between-Subjects Effects
SSdfMSFpη2p
gender0.16610.1660.7550.3900.020
task0.11210.1120.5070.4810.014
gender × task0.45110.4512.0480.1610.052
Residual8.151370.220
Note: Type III Sum of Squares: SS = Sum of Squares; df = degree of freedom; MS = Mean Square; F = F value, p = p value; η2p = partial eta squared.
Table A6. Fear.
Table A6. Fear.
Within-Subjects Effects
SSdfMSFpη2p
modality0.06710.0670.0670.0670.019
modality × gender0.00310.0030.0030.0030.001
modality × task5.012 × 10−415.012 × 10−45.012 × 10−45.012 × 10−40.000
modality × gender × task1.653 × 10−511.653 × 10−51.653 × 10−51.653 × 10−50.000
Residual3.518370.095
Between-Subjects Effects
SSdfMSFpη2p
gender0.03310.0330.1170.7350.003
task0.04910.0490.1710.6810.005
gender × task0.86910.8693.0280.0900.076
Residual10.624370.287
Note: Type III Sum of Squares: SS = Sum of Squares; df = degree of freedom; MS = Mean Square; F = F value, p = p value; η2p = partial eta squared.
Table A7. Fear.
Table A7. Fear.
Within-Subjects Effects
SSdfMSFpη2p
modality0.06710.0670.0670.0670.019
modality × gender0.00310.0030.0030.0030.001
modality × task5.012 × 10−415.012 × 10−45.012 × 10−45.012 × 10−40.000
modality × gender × task1.653 × 10−511.653 × 10−51.653 × 10−51.653 × 10−50.000
Residual3.518370.095
Between-Subjects Effects
SSdfMSFpη2p
gender0.03310.0330.1170.7350.003
task0.04910.0490.1710.6810.005
gender × task0.86910.8693.0280.0900.076
Residual10.624370.287
Note: Type III Sum of Squares: SS = Sum of Squares; df = degree of freedom; MS = Mean Square; F = F value, p = p value; η2p = partial eta squared.
Table A8. Hostility.
Within-Subjects Effects
SSdfMSFpη2p
modality2.840 × 10−412.840 × 10−40.0080.9290.000
modality × gender0.04010.0401.1310.2950.030
modality × task0.06210.0621.7610.1930.045
modality × gender × task0.05110.0511.4520.2360.038
Residual1.310371.310
Between-Subjects Effects
SSdfMSFpη2p
gender0.70710.7078.1830.0070.181
task0.21510.2152.4870.1230.063
gender × task0.25810.2582.9830.0920.075
Residual3.195370.086
Note: Type III Sum of Squares: SS = Sum of Squares; df = degree of freedom; MS = Mean Square; F = F value, p = p value; η2p = partial eta squared.
Table A9. Sadness.
Table A9. Sadness.
Within-Subjects Effects
SSdfMSFpη2p
modality0.02910.0290.8260.3690.022
modality × gender0.01410.0140.3810.5410.010
modality × task0.00510.0050.1480.7030.004
modality × gender × task0.04610.0461.3040.2610.034
Residual1.316370.036
Between-Subjects Effects
SSdfMSFpη2p
gender0.67110.6712.2930.1380.058
task5.399 × 10−715.399 × 10−71.845 × 10−60.9990.000
gender × task0.34010.3401.1630.2880.030
Residual10.829370.293
Note: Type III Sum of Squares: SS = Sum of Squares; df = degree of freedom; MS = Mean Square; F = F value, p = p value; η2p = partial eta squared.
Table A10. Fatigue.
Table A10. Fatigue.
Within-Subjects Effects
SSdfMSFpη2p
modality2.01112.0116.6360.0140.152
modality × gender0.23410.2340.7720.3850.020
modality × task0.74910.7492.4710.1250.063
modality × gender × task0.00510.0050.0160.9010.000
Residual11.214370.303
Between-Subjects Effects
SSdfMSFpη2p
gender0.08010.0800.0660.7990.002
task2.81112.8112.3060.1370.059
gender × task2.62812.6282.1560.1500.055
Residual45.099371.219
Note: Type III Sum of Squares: SS = Sum of Squares; df = degree of freedom; MS = Mean Square; F = F value, p = p value; η2p = partial eta squared.
Table A11. Surprise.
Within-Subjects Effects
SSdfMSFpη2p
modality19.125119.12532.478<0.0010.467
modality × gender0.18910.1890.3200.5750.009
modality × task0.07310.0730.1240.7270.003
modality × gender × task0.00210.0020.0030.9580.000
Residual21.788370.589
Between-Subjects Effects
SSdfMSFpη2p
gender0.03210.0320.0260.8720.001
task5.11615.1164.2340.0470.103
gender × task10.581110.5818.7580.0050.191
Residual44.704371.208
Note: Type III Sum of Squares: SS = Sum of Squares; df = degree of freedom; MS = Mean Square; F = F value, p = p value; η2p = partial eta squared.

Appendix A.2. Electrodermal activity (EDA)

Table A12. Total SCR Amplitude.
Within-Subjects Effects
SSdfMSFpη2p
modality29.737129.7375.7780.0220.149
modality × gender2.79612.7960.5430.4660.016
modality × task0.10710.1070.0210.8860.001
modality × gender × task11.324111.3242.2000.1470.063
Residual169.828335.146
Between-Subjects Effects
SSdfMSFpη2p
gender0.12210.1220.0160.9010.000
task0.03310.0330.0040.9480.000
gender × task8.18818.1881.0570.3110.031
Residual255.528337.743
Note: Type III Sum of Squares: SS = Sum of Squares; df = degree of freedom; MS = Mean Square; F = F value, p = p value; η2p = partial eta squared.
Table A13. Mean SCR Amplitude.
Within-Subjects Effects
SSdfMSFpη2p
modality0.06010.0604.6370.0390.123
modality × gender7.983 × 10−417.983 × 10−40.0620.8050.002
modality × task9.665 × 10−419.665 × 10−40.0750.7860.002
modality × gender × task0.01910.0191.4620.2350.042
Residual0.426330.013
Between-Subjects Effects
SSdfMSFpη2p
gender7.405 × 10−517.405 × 10−50.0030.9540.000
task2.317 × 10−512.317 × 10−50.0010.9740.000
gender × task0.00810.0080.3690.5480.011
Residual0.715330.022
Note: Type III Sum of Squares: SS = Sum of Squares; df = degree of freedom; MS = Mean Square; F = F value, p = p value; η2p = partial eta squared.
Table A14. SCR Frequency.
Within-Subjects Effects
SSdfMSFpη2p
modality30.960 10.0604.6370.0390.123
modality × gender14.122 17.983 × 10−40.0620.8050.002
modality × task1.643 19.665 × 10−40.0750.7860.002
modality × gender × task0.014 10.0191.4620.2350.042
Residual271.486 330.013
Between-Subjects Effects
SSdfMSFpη2p
gender3.40413.4040.1160.7350.004
task0.28510.2850.0100.9220.000
gender × task21.275121.2750.7270.4000.022
Residual965.0953329.245
Note: Type III Sum of Squares: SS = Sum of Squares; df = degree of freedom; MS = Mean Square; F = F value, p = p value; η2p = partial eta squared.

Appendix A.3. Electroencephalography (EEG)

Table A15. Attention Meter.
Within-Subjects Effects
SSdfMSFpη2p
modality30.63130.630.0920.7630.002
modality × gender101.461101.460.3060.5830.008
modality × task170.221170.220.5140.4780.014
modality × gender × task243.111243.110.7340.3970.019
Residual12,253.3337331.17
Between-Subjects Effects
SSdfMSFpη2p
gender42.415142.4150.1000.7540.003
task0.33910.3397.977 × 10−40.9780.000
gender × task20.147120.1470.0470.8290.001
Residual15,706.81837424.509
Note: Type III Sum of Squares: SS = Sum of Squares; df = degree of freedom; MS = Mean Square; F = F value, p = p value; η2p = partial eta squared.
Table A16. Relative Alpha.
Within-Subjects Effects
SSdfMSFpη2p
modality0.06210.0620.0040.9510.000
modality × gender5.34515.3450.3240.5720.009
modality × task2.03312.0330.1230.7270.003
modality × gender × task12.520112.5200.7600.3890.020
Residual609.6863716.478
Between-Subjects Effects
SSdfMSFpη2p
gender0.90610.9060.0230.8800.001
task6.97316.9730.1790.6750.005
gender × task140.1871140.1873.5910.0660.088
Residual1444.2593739.034
Note: Type III Sum of Squares: SS = Sum of Squares; df = degree of freedom; MS = Mean Square; F = F value, p = p value; η2p = partial eta squared.
Table A17. Relative Beta.
Within-Subjects Effects
SSdfMSFpη2p
modality0.43310.4330.0330.8570.001
modality × gender35.289135.2892.7020.1090.068
modality × task16.717116.7171.2800.2650.033
modality × gender × task49.587149.5873.7970.0590.093
Residual483.2163713.060
Between-Subjects Effects
SSdfMSFpη2p
gender112.211112.212.7940.1030.070
task42.30142.301.0530.3110.028
gender × task103.401103.402.5750.1170.065
Residual1485.903740.16
Note: Type III Sum of Squares: SS = Sum of Squares; df = degree of freedom; MS = Mean Square; F = F value, p = p value; η2p = partial eta squared.
Table A18. Relative Theta.
Within-Subjects Effects
SSdfMSFpη2p
modality7.17417.1740.4560.5040.012
modality × gender0.00710.0074.334 × 10−40.9840.000
modality × task1.20711.2070.0770.7830.002
modality × gender × task9.89019.8900.6290.4330.017
Residual582.0693715.732
Between-Subjects Effects
SSdfMSFpη2p
gender35.71135.711.3590.2510.035
task49.92149.921.9000.1760.049
gender × task39.02139.021.4850.2310.039
Residual972.053726.27
Note: Type III Sum of Squares: SS = Sum of Squares; df = degree of freedom; MS = Mean Square; F = F value, p = p value; η2p = partial eta squared.

References

  1. Elliot, A.J.; Eder, A.B.; Harmon-Jones, E. Approach–avoidance motivation and emotion: Convergence and divergence. Emot. Rev. 2013, 5, 308–311. [Google Scholar] [CrossRef]
  2. Lupton, D. Feeling your data: Touch and making sense of personal digital data. New Media Soc. 2017, 19, 1599–1614. [Google Scholar] [CrossRef]
  3. Lenay, C. “It’s So Touching”: Emotional Value in Distal Contact. Int. J. Des. 2010, 4, 15–25. [Google Scholar]
  4. MacLean, K.E.; Schneider, O.S.; Seifi, H. Multisensory haptic interactions: Understanding the sense and designing for it. In The Handbook of Multimodal-Multisensor Interfaces: Foundations, User Modeling, and Common Modality Combinations; Oviatt, S., Schuller, B., Cohen, P., Sonntag, D., Potamianos, G., Eds.; Morgan & Claypool: San Rafael, CA, USA, 2017; Volume 1, ISBN 9781970001648. [Google Scholar]
  5. Petrelli, D.; O’Brien, S.; Phone, V.S. Tangible in museums: A comparative study. In Proceedings of the 2018 CHI Conference on Human Factors in Computing Systems, Montreal, QC, Canada, 21–26 April 2018; ACM: New York, NY, USA, 2018; pp. 112–134. [Google Scholar]
  6. Taylor, R.; Bowers, J.; Nissen, B.; Wood, G.; Chaudhry, Q.; Wright, P.; Bruce, L.; Glynn, S.; Mallinson, H.; Bearpark, R. Making Magic: Designing for Open Interactions in Museum Settings. In Proceedings of the 2015 ACM SIGCHI Conference on Creativity and Cognition (C&C ’15), Glasgow, UK, 22–25 June 2015; ACM: New York, NY, USA, 2015; pp. 313–322.
  7. Vi, C.T.; Ablart, D.; Gatti, E.; Velasco, C.; Obrist, M. Not just seeing, but also feeling art: Mid-air haptic experiences integrated in a multisensory art exhibition. Int. J. Hum.-Comput. Stud. 2017, 108, 1–14. [Google Scholar] [CrossRef]
  8. Obrist, M.; Velasco, C.; Vi, C.T.; Ranasinghe, N.; Israr, A.; Cheok, A.D.; Vi, C.T.; Spence, C.; Ranasinghe, N.; Gopalakrishnakone, P. Touch, taste, & smell user interfaces: The future of multisensory HCI. In Proceedings of the 2016 CHI Conference Extended Abstracts on Human Factors in Computing Systems, San Jose, CA, USA, 7–12 May 2016; ACM: New York, NY, USA, 2016; pp. 3285–3292. [Google Scholar]
  9. Obrist, M.; Gatto, E.; Maggioni, E.; Vi, C.T. Multisensory experiences in HCI. IEEE Multimedia 2017, 24, 9–13. [Google Scholar] [CrossRef]
  10. Grosse-Puppendahl, T.; Holz, C.; Cohn, G.; Wimmer, R.; Bechtold, O.; Hodges, S.; Reynolds, M.S.; Smith, J.R. Finding common ground: A survey of capacitive sensing in human-computer interaction. In Proceedings of the 2017 CHI Conference on Human Factors in Computing Systems, Denver, CO, USA, 6–11 May 2017; ACM: New York, NY, USA, 2017; pp. 3293–3315. [Google Scholar]
  11. Cacioppo, J.T.; Tassinary, L.G.; Berntson, G.G. Handbook of Psychophysiology, 4th ed.; Cambridge University Press: Cambridge, UK, 2016; ISBN 9781316727782. [Google Scholar]
  12. Kivikunnas, S.; Strömmer, E.; Korkalainen, M.; Heikkilä, T.; Haverinen, M. Sensing sofa and its ubiquitous use. In Proceedings of the 2010 International Conference on Information and Communication Technology Convergence (ICTC), Jeju, Korea, 17–19 November 2010; pp. 559–562. [Google Scholar]
  13. Hirai, S.; Sakakibara, Y.; Hayashi, H. Enabling interactive bathroom entertainment using embedded touch sensors in the bathtub. In Advances in Computer Entertainment, Proceedings of the 10th International Conference, ACE 2013, Boekelo, The Netherlands, 12–15 November 2013; Springer: Cham, Switzerland, 2013; pp. 544–547. [Google Scholar]
  14. Djakow, M.; Braun, A.; Marinc, A. Movibed-sleep analysis using capacitive sensors. In Proceedings of the International Conference on Universal Access in Human-Computer Interaction, Heraklion, Greece, 22–27 June 2014; pp. 171–181. [Google Scholar]
  15. Knight, H.; Lee, J.-K.; Ma, H. Chair alarm for patient fall prevention based on gesture recognition and interactivity. In Proceedings of the 30th Annual International Conference of the IEEE Engineering in Medicine and Biology Society (EMBS), Vancouver, BC, Canada, 20–25 August 2008; pp. 3698–3701. [Google Scholar]
  16. Hoang Huy, N.H.; Hettiarachchi, G.; Lee, Y.; Krishna Balan, R. Small scale deployment of seat occupancy detectors. In Proceedings of the 3rd International on Workshop on Physical Analytics, Singapore, 26 June 2016; pp. 25–30. [Google Scholar]
  17. Buechley, L.; Mellis, D.; Perner-Wilson, H.; Lovell, E.; Kaufmann, B. Living wall: Programmable wallpaper for interactive spaces. In Proceedings of the 18th ACM international conference on Multimedia, Firenze, Italy, 25–29 October 2010; pp. 1401–1402. [Google Scholar]
  18. Poupyrev, I.; Schoessler, P.; Loh, J.; Sato, M. Botanicus interacticus: Interactive plants technology. In Proceedings of the ACM SIGGRAPH 2012 Emerging Technologies, Los Angeles, CA, USA, 5–9 August 2012; p. 4. [Google Scholar]
  19. Fastnacht, T.; Fischer, P.T.; Hornecker, E.; Zierold, S.; Aispuro, A.O.; Marschall, J. The hedonic value of sonnengarten: Touching plants to trigger light. In Proceedings of the 16th International Conference on Mobile and Ubiquitous Multimedia, Stuttgart, Germany, 26–29 November 2017; pp. 507–514. [Google Scholar]
  20. Angelini, L.; Caparrotta, S.; Khaled, O.A.; Mugellini, E. Emotiplant: Human-plant interaction for older adults. In Proceedings of the TEI’16: Tenth International Conference on Tangible, Embedded, and Embodied Interaction, Eindhoven, The Netherlands, 14–17 February 2016; pp. 373–379. [Google Scholar]
  21. Park, T.; Hu, T.; Huh, J. Plant-based games for anxiety reduction. In Proceedings of the 2016 Annual Symposium on Computer-Human Interaction in Play, Austin, TX, USA, 16–19 October 2016; pp. 199–204. [Google Scholar]
  22. Obrist, M.; Seah, S.A.; Subramanian, S. Talking about tactile experiences. In Proceedings of the SIGCHI Conference on Human Factors in Computing Systems, Paris, France, 27 April–2 May 2013; pp. 1659–1668. [Google Scholar]
  23. Obrist, M.; Subramanian, S.; Gatti, E.; Long, B.; Carter, T. Emotions mediated through mid-air haptics. In Proceedings of the 33rd Annual ACM Conference on Human Factors in Computing Systems, Seoul, Korea, 18–23 April 2015; pp. 2053–2062. [Google Scholar]
  24. Sakr, M.; Jewitt, C.; Price, S. Mobile experiences of historical place: A multimodal analysis of emotional engagement. J. Learn. Sci. 2016, 25, 51–92. [Google Scholar] [CrossRef]
  25. Murray, N.; Lee, B.; Qiao, Y.; Muntean, G.-M. Olfaction-enhanced multimedia: A survey of application domains, displays, and research challenges. ACM Comput. Surv. (CSUR) 2016, 48, 56. [Google Scholar] [CrossRef]
  26. Watson, D.; Clark, L.A. The PANAS-X: Manual for the Positive and Negative Affect Schedule-Expanded Form; The University of Iowa’s Institutional Repository, Department of Psychological & Brain Sciences Publications: Iowa City, IA, USA, 1999. [Google Scholar]
  27. Johnstone, S.J.; Blackman, R.; Bruggemann, J.M. EEG from a single-channel dry-sensor recording device. Clin. EEG Neurosci. 2012, 43, 112–120. [Google Scholar] [CrossRef] [PubMed]
  28. Hemington, K.S.; Reynolds, J.N. Electroencephalographic correlates of working memory deficits in children with Fetal Alcohol Spectrum Disorder using a single-electrode pair recording device. Clin. Neurophysiol. 2014, 125, 2364–2371. [Google Scholar] [CrossRef] [PubMed]
  29. Yamauchi, T.; Bowman, C.; Xiao, K.; Mueen, A. Dynamic time warping: A single dry electrode EEG study in a self-paced learning task. In Proceedings of the International Conference on Affective Computing and Intelligent Interaction (ACII 2015), IEEE Computing Society, Xi’an, China, 21–24 September 2015; pp. 55–62. [Google Scholar] [CrossRef]
  30. Panksepp, J.; Watt, D. What is basic about basic emotions? Lasting lessons from affective neuroscience. Emot. Rev. 2011, 3, 387–396. [Google Scholar] [CrossRef]
  31. Young, M.S.; Brookhuis, K.A.; Wickens, C.D.; Hancock, P.A. State of science: Mental workload in ergonomics. Ergonomics 2015, 58, 1–17. [Google Scholar] [CrossRef] [PubMed]
  32. Society for Psychophysiological Research Ad Hoc Committee on Electrodermal Measures. Publication recommendations for electrodermal measurements. Psychophysiology 2012, 49, 1017–1034. [Google Scholar] [CrossRef] [PubMed] [Green Version]
  33. Benedek, M.; Kaernbach, C. Decomposition of skin conductance data by means of nonnegative deconvolution. Psychophysiology 2010, 47, 647–658. [Google Scholar] [CrossRef] [PubMed]
  34. Wickens, C.D.; Hollands, J.G.; Banbury, S.; Parasuraman, R. Engineering Psychology & Human Performance; Psychology Press: New York, NY, USA; London, UK, 2015. [Google Scholar]
  35. Hammerschmidt, J.; Hermann, T.; Walender, A.; Krömker, N. InfoPlant: Multimodal augmentation of plants for enhanced human-computer interaction. In Proceedings of the 2015 6th IEEE International Conference on Cognitive Infocommunications (CogInfoCom), Gyor, Hungary, 19–21 October 2015; pp. 511–516. [Google Scholar]
  36. Lindquist, K.A. Emotions emerge from more basic psychological ingredients: A modern psychological constructionist model. Emot. Rev. 2013, 5, 356–368. [Google Scholar] [CrossRef]
  37. Barrett, L.F. The conceptual act theory: A précis. Emot. Rev. 2014, 6, 292–297. [Google Scholar] [CrossRef]
  38. Clark, A. Whatever next? Predictive brains, situated agents, and the future of cognitive science. Behav. Brain Sci. 2013, 36, 181–204. [Google Scholar] [CrossRef] [PubMed] [Green Version]
  39. Yamauchi, T. Finding abstract commonalties of category members. J. Exp. Theor. Artif. Intell. 2009, 21, 155–180. [Google Scholar] [CrossRef]
  40. Yamauchi, T.; Xiao, K. Reading emotion from mouse cursor motions: Affective computing approach. Cogn. Sci. 2018, 42, 771–819. [Google Scholar] [CrossRef] [PubMed]
Figure 1. A depiction of the Interactive Plant system. (a) The Interactive Plant system consists of a pothos plant sitting on a flat screen, an electric wire and an Arduino microprocessor. The electric wire, which is placed in the soil, catches tactile signals on the plant and sends them to the Arduino microprocessor. Participants’ electrodermal activity and brain wave (EEG) are also measured. (b) In the watch-first condition, participants just watched the plant and screen. In the touch-first condition, participants touched the plant. The flat screen was turned off in this condition and participants did not see any animated images of the plant. In the watch + touch condition, participants touched the plant and watched the animated images of the plant on the screen. The image changed real time as participants touched the plant.
Mathematics 06 00225 g001
Figure 2. A schematic illustration of the experimental design. The experiment consisted of 5 parts. In Part 1, all participants answered a questionnaire (PANAS-X). In Part 2, participants were assigned randomly to the touch-first or watch-first condition (unimodal condition). In Part 3, all participants answered PANAS-X to indicate their emotions. In Part 4, all participants touched and watched the plant for 1 min (multimodal condition). Animated images were shown on the flat screen as they touch and watch the plant. In Part 5, Participants indicated their emotional experience with PANAS-X. During Part 2 and Part 4, participants’ brain activity (EEG) and skin conductance (electrodermal activity) were measured.
Mathematics 06 00225 g002
Figure 3. Mean PANAS-X rating scores (1–5 Likert scale; 1 = very slightly/not at all; 5 = extremely) in the unimodal and multimodal conditions. Error bars represent two standard error units and the Y-axis corresponds to participants’ self-reported emotion ratings assessed in the PANAS-X.
Mathematics 06 00225 g003
Figure 4. SCR (skin conductance responses) in the unimodal and multimodal conditions. Error bars represent two standard error units.
Mathematics 06 00225 g004
Figure 5. Mean EEG responses obtained in the unimodal and multimodal conditions. Error bars represent two standard error units.
Mathematics 06 00225 g005

