Article

Mathematical Modeling of Oxidative Stress in Alzheimer’s Disease: A Differential Equations Approach


by
Lucien Gnegne Meteumba
1 and
Shantia Yarahmadian
2,*
1
Bagley College of Engineering, Mississippi State University, Mississippi State, MS 39762, USA
2
Department of Mathematics and Statistics, Mississippi State University, Mississippi State, MS 39762, USA
*
Author to whom correspondence should be addressed.
Mathematics 2026, 14(8), 1390; https://doi.org/10.3390/math14081390
Submission received: 24 February 2026 / Revised: 5 April 2026 / Accepted: 10 April 2026 / Published: 21 April 2026
(This article belongs to the Special Issue Mathematical and Statistical Modeling in Complex Diseases)

Abstract

Alzheimer’s disease (AD) develops as a progressive dementia condition through the step-by-step breakdown of nerve cells. Neurodegeneration in this context primarily results from metal ions, including copper, iron, zinc, and aluminum, building up in the system. The aggregation of amyloid-beta () peptides and oxidative stress generation stem from metal ion involvement acting as defining characteristics of Alzheimer’s disease pathology. We developed a comprehensive mathematical model based on 24 coupled ordinary differential equations (ODEs) to represent the interactions between metal ions, peptides, reactive oxygen species (ROS), antioxidant defenses, and tau protein phosphorylation. The mathematical model monitors how metal ion concentrations change over time and examines their competitive binding effects, which trigger a series of reactions, resulting in oxidative stress and subsequent tau protein damage. The model uses analytical and numerical mathematical methods to expose nonlinear behaviors and threshold effects while offering mechanistic insights into the course of disease development. This model functions as a quantitative framework for assessing how therapeutic interventions that target metal dyshomeostasis and oxidative stress can potentially affect outcomes.

1. Introduction

Alzheimer’s disease (AD) is a progressive neurodegenerative disorder characterized by cognitive decline, memory loss, and behavioral changes. The pathological hallmarks of AD include extracellular amyloid plaques composed primarily of amyloid-beta (Aβ) peptides and intracellular neurofibrillary tangles consisting of hyperphosphorylated tau protein [1]. Despite decades of research, the exact mechanisms underlying AD pathogenesis remain incompletely understood, and effective disease-modifying treatments are still lacking.
In recent years, increasing evidence has implicated metal ions, particularly copper (Cu), iron (Fe), zinc (Zn), and aluminum (Al), in the pathogenesis of AD [2]. These metal ions have been found to interact with Aβ peptides, influencing their aggregation and neurotoxicity. Furthermore, redox-active metals such as copper and iron can catalyze the production of reactive oxygen species (ROS), leading to oxidative stress, which is a prominent feature of AD [3].
Mathematical modeling offers a powerful approach to understanding the complex interactions and dynamics involved in the pathogenesis of AD. By formulating biochemical reactions as systems of differential equations, we can gain insight into the temporal evolution of various species, identify key parameters, and predict the effects of potential therapeutic interventions.
This paper builds upon previous mathematical models of metal-induced biochemical reactions in AD by incorporating additional metal ions, antioxidant defense mechanisms, competitive binding between metals, and tau protein interactions. We develop a comprehensive system of ordinary differential equations (ODEs) that captures the intricate interplay between metal ions, Aβ peptides, ROS, antioxidant enzymes, and tau proteins. Through numerical simulations and analytical techniques, we explore the dynamics of this expanded model and its implications for understanding AD pathogenesis and developing effective therapeutic strategies.

2. Literature Review

A substantial body of evidence links disturbances in metal homeostasis to the core pathological features of Alzheimer’s disease (AD). Concentration and distribution changes in copper (Cu), iron (Fe), and zinc (Zn) have been reported in AD brains, with plaque co-localization and direct influences on Aβ self-assembly and toxicity [4,5]. In vivo imaging further implicates iron: quantitative susceptibility mapping (QSM) associates higher cortical iron with worse cognitive performance, supporting a clinically relevant redox-metals axis [6]. By contrast, the contribution of aluminum remains debated; epidemiologic syntheses suggest at most small, heterogeneous risk signals and substantial methodological uncertainty [7,8].
Mechanistically, metal-Aβ coordination provides a catalytic route to reactive oxygen species (ROS). Aβ bound to Cu or Fe generates superoxide and hydrogen peroxide, and Fe2+ drives the Fenton chemistry to hydroxyl radicals, thus oxidizing proteins, lipids, and nucleic acids [9,10,11]. Oxidative modifications such as dityrosine cross-links have been observed in Aβ aggregates and are known to reshape fibril growth, stability, and toxicity profiles [12,13,14]. These findings motivate models in which metal occupancy not only tips Aβ aggregation pathways but also amplifies ROS production through redox cycling.
Independent of metals, the intrinsic aggregation kinetics of Aβ display clear structure: quantitative analyses show that secondary nucleation on fibril surfaces frequently dominates Aβ42 proliferation, with primary nucleation and elongation contributing context-dependently [15]. Zn2+ can retard elongation in a chaperone-like manner without abolishing the role of secondary nucleation [16]. Together, these data suggest that accurate disease-mechanism models should represent primary/secondary nucleation, elongation, and fragmentation explicitly and allow metal concentrations to modulate specific microscopic rate constants.
ROS generation in neurons is further shaped by mitochondrial dynamics. The phenomenon of ROS-induced ROS release (RIRR) creates nonlinear amplification and thresholds in mitochondrial ROS fluxes, helping explain abrupt oxidative transitions under stress [17]. Counterbalancing defenses rely on superoxide dismutase (SOD), catalase (CAT), and glutathione peroxidase (GPx), which are frequently imbalanced in AD tissue in patterns consistent with peroxide accumulation [18]. At the transcriptional level, the KEAP1–Nrf2 pathway coordinates antioxidant induction; reviews of AD models highlight reduced Nrf2 tone and therapeutic rationales for pharmacologic activation [19,20]. These observations argue for ODE modules that couple fast ROS chemistry to slower Nrf2-driven capacity changes.
Oxidative stress integrates with tau pathology through kinase and phosphatase signaling. Stress-responsive pathways elevate GSK3β and CDK5/p25 activities and can suppress PP2A, promoting tau hyperphosphorylation and filament formation [21,22,23,24]. This provides a mechanistic bridge from metal-Aβ redox chemistry to cytoskeletal failure and suggests that tau phosphorylation dynamics should be modeled as ROS-sensitive multi-state transitions governed by kinase/phosphatase balance.
Several mathematical and computational frameworks have captured portions of this biology. Early neuron–glia–amyloid ODE models reproduced feedbacks among Aβ production, clearance, and toxicity but did not resolve explicit redox-metal chemistry [25]. Subsequent systems models expanded to include tau and inflammatory interactions, and some PDE/ODE hybrids reproduced biomarker trajectories across clinical stages [26,27]. Recent scoping and review articles catalog an increasingly rich landscape of AD models, yet most treat metals implicitly or omit competitive binding and catalytic ROS modules, limiting their ability to probe threshold phenomena emerging from metal-Aβ–ROS coupling [28,29]. This gap is particularly relevant given the empirical signatures of nonlinearity in mitochondrial ROS amplification and kinase-mediated tau transitions.
Therapeutic studies reinforce the need for integrative modeling. Metal-protein attenuating compounds and ionophores (notably clioquinol/PBT2) showed safety and mixed biomarker or cognitive signals in early human studies, but larger imaging trials did not achieve primary endpoints, leaving efficacy uncertain and patient-selection questions open [30,31,32]. Parallel efforts to boost antioxidant capacity via Nrf2 agonism or modulate tau kinases remain mechanistically plausible but require quantitative frameworks to predict dosing windows and combination effects [19,20,24].
Against this background, the present work advances a 24-equation ODE model that explicitly (i) resolves competing Cu/Zn/Fe binding to Aβ alongside redox-active subpools for Cu and Fe, (ii) embeds Aβ aggregation micro-kinetics with metal-dependent rate modifiers, (iii) couples fast ROS chemistry and mitochondrial amplification to enzymatic detoxification and Nrf2-regulated capacity, and (iv) links ROS levels to tau phosphorylation via GSK3β/CDK5 and PP2A. This integrated structure is designed to reproduce empirically observed nonlinearities and support in silico evaluation of metal-targeted, antioxidant, and kinase-modulating interventions under parameter uncertainty.

3. Biological and Chemical Background

3.1. Amyloid-Beta and Metal Ions in Alzheimer’s Disease

Amyloid-beta (Aβ) peptides are proteolytic fragments derived from the sequential cleavage of amyloid precursor protein (APP) by β- and γ-secretases. Among the isoforms produced, Aβ40 and Aβ42 are the most common, with Aβ42 being more hydrophobic, aggregation-prone, and neurotoxic [33]. The aggregation of Aβ proceeds through a series of intermediate species, including monomers, soluble oligomers, and protofibrils, ultimately forming mature fibrils that accumulate as extracellular amyloid plaques in the Alzheimer’s disease (AD) brain. Metal ions have emerged as key modulators of Aβ aggregation dynamics and toxicity. Copper, an essential trace element involved in redox regulation, enzymatic activity, and neurotransmission, is markedly enriched in amyloid plaques, with concentrations reaching up to 400 μM in AD brains compared to about 70 μM in healthy tissue [34]. Copper binds Aβ with high affinity ( K d 10 10 M ) at His6, His13, and His14 [35], facilitating peptide aggregation and catalyzing the production of reactive oxygen species (ROS) through redox cycling between Cu+ and Cu2+, thereby contributing to oxidative damage. Iron, the most abundant transition metal in the human body, is also elevated in AD brains and plays critical roles in oxygen transport, mitochondrial function, and neurotransmission [36]. Like copper, iron binds to Aβ and promotes its aggregation. It also undergoes redox cycling, and, in particular, Fe2+ reacts with hydrogen peroxide through the Fenton reaction:
Fe 2 + + H 2 O 2 Fe 3 + + OH + OH
This reaction produces hydroxyl radicals (OH), which are highly reactive and capable of damaging cellular lipids, proteins, and DNA, thereby accelerating neurodegenerative processes [37]. Zinc, another abundant transition metal involved in enzyme function and synaptic signaling, is also found at elevated concentrations—up to 1 mM—in amyloid plaques [34]. Zinc binds to the same N-terminal histidine residues as copper but with distinct coordination geometry [38]. While zinc is redox-inactive and does not directly generate ROS, its interaction with Aβ enhances peptide aggregation, particularly under mildly acidic conditions typical of synaptic transmission [39]. Aluminum, though not required for any known physiological function, is prevalent in the environment and has been detected at elevated levels in the AD brain, particularly within neurofibrillary tangles [40]. Although its binding affinity to Aβ is weaker than that of copper or zinc [41], aluminum can potentiate oxidative stress indirectly by amplifying iron-mediated redox reactions and disrupting calcium signaling, ultimately contributing to neuronal injury and cognitive decline [42].

3.2. Oxidative Stress and Antioxidant Defense

Oxidative stress, characterized by an imbalance between reactive oxygen species (ROS) production and the brain’s antioxidant defenses, is a defining feature of Alzheimer’s disease (AD) pathogenesis [3]. The central nervous system is exceptionally susceptible to oxidative damage due to its high metabolic rate, substantial oxygen consumption, abundance of polyunsaturated fatty acids, limited antioxidant reserves, and elevated concentrations of redox-active metals such as iron and copper. Among the major ROS implicated in AD are the superoxide anion ( O 2 ), generated through the one-electron reduction of molecular oxygen often mediated by transition metals; hydrogen peroxide (H2O2), a less reactive species formed via superoxide dismutation catalyzed by superoxide dismutase (SOD); the hydroxyl radical (OH), an exceedingly reactive and damaging molecule produced via the Fenton reaction involving Fe2+ or Cu+ and H2O2; and peroxynitrite (ONOO), formed through the rapid reaction between superoxide and nitric oxide, capable of inducing protein nitration and lipid peroxidation. To mitigate the deleterious effects of ROS, the brain relies on a tightly regulated network of antioxidant defense mechanisms. Enzymatic antioxidants include SOD, which exists in three isoforms—Cu/Zn-SOD (SOD1) in the cytosol, Mn-SOD (SOD2) in mitochondria, and extracellular SOD (SOD3)—and catalyzes the conversion of superoxide into hydrogen peroxide and oxygen; catalase (CAT), which decomposes hydrogen peroxide into water and molecular oxygen within peroxisomes; and glutathione peroxidase (GPx), which reduces hydrogen peroxide and lipid hydroperoxides to less reactive species using reduced glutathione (GSH) as a cofactor, concurrently producing oxidized glutathione (GSSG). Glutathione reductase (GR) then regenerates GSH from GSSG using NADPH as a reducing equivalent. In addition to these enzymatic defenses, non-enzymatic antioxidants such as GSH, vitamin E (α-tocopherol), vitamin C (ascorbic acid), and coenzyme Q10 contribute to the neutralization of free radicals. However, in the context of AD, these antioxidant systems are frequently impaired. Multiple studies report reduced activities of SOD, catalase and GPx in vulnerable brain regions of AD patients, underscoring the critical role of oxidative imbalance in neurodegenerative progression [43].

3.3. Tau Protein and Neurofibrillary Tangles

Tau is a microtubule-associated protein primarily responsible for stabilizing microtubules in neuronal axons. In Alzheimer’s disease (AD), tau becomes abnormally hyperphosphorylated, causing it to dissociate from microtubules and self-assemble into paired helical filaments (PHFs), which subsequently aggregate into neurofibrillary tangles (NFTs), a hallmark of AD pathology [44]. The phosphorylation state of tau is tightly regulated by the dynamic interplay between kinases and phosphatases. In AD, this balance is disrupted, favoring hyperphosphorylation. Glycogen synthase kinase-3β (GSK-3β), a constitutively active serine/threonine kinase, is one of the primary enzymes that phosphorylate tau at multiple pathological sites. Cyclin-dependent kinase 5 (CDK5), another key player, becomes aberrantly activated in AD due to accumulation of p25, a proteolytic fragment of its activator p35. Additionally, mitogen-activated protein kinases (MAPKs), including ERK, JNK, and p38, are known to contribute to tau phosphorylation in response to stress-related signaling. On the other hand, protein phosphatase 2A (PP2A), the main enzyme responsible for tau dephosphorylation, shows significantly reduced activity in AD brains, further promoting the accumulation of hyperphosphorylated tau [45]. Metal ions also contribute to tau pathology through both direct and indirect mechanisms. Iron can directly bind to tau, facilitating its aggregation and promoting NFT formation [46]. Copper and zinc are also capable of interacting with tau, altering its structural conformation and enhancing its aggregation propensity [47]. Furthermore, metal-induced oxidative stress is known to activate tau kinases while simultaneously inhibiting phosphatases, thereby shifting the cellular equilibrium toward hyperphosphorylation [48]. In addition to enzymatic modulation, oxidative modifications of tau itself—such as carbonylation and nitration—can impair its ability to bind microtubules and promote its aggregation into toxic species [49].

4. Mathematical Modeling Approach

4.1. Original Model Framework

The original mathematical model of metal-induced biochemical reactions in AD focused primarily on the interactions between Aβ peptides, copper ions, and iron ions and the resulting generation of reactive oxygen species. The model was formulated as a system of ordinary differential equations (ODEs) describing the temporal evolution of various chemical species involved in these reactions. The key reactions included in the original model are summarized in Table 1.
These reactions were translated into a system of ODEs describing the rate of change of each species concentration over time. The model provided insights into the dynamics of metal-induced oxidative stress in AD but had several limitations, including the omission of other relevant metal ions, antioxidant defense mechanisms, and tau protein interactions.

4.2. Complete Reaction Network

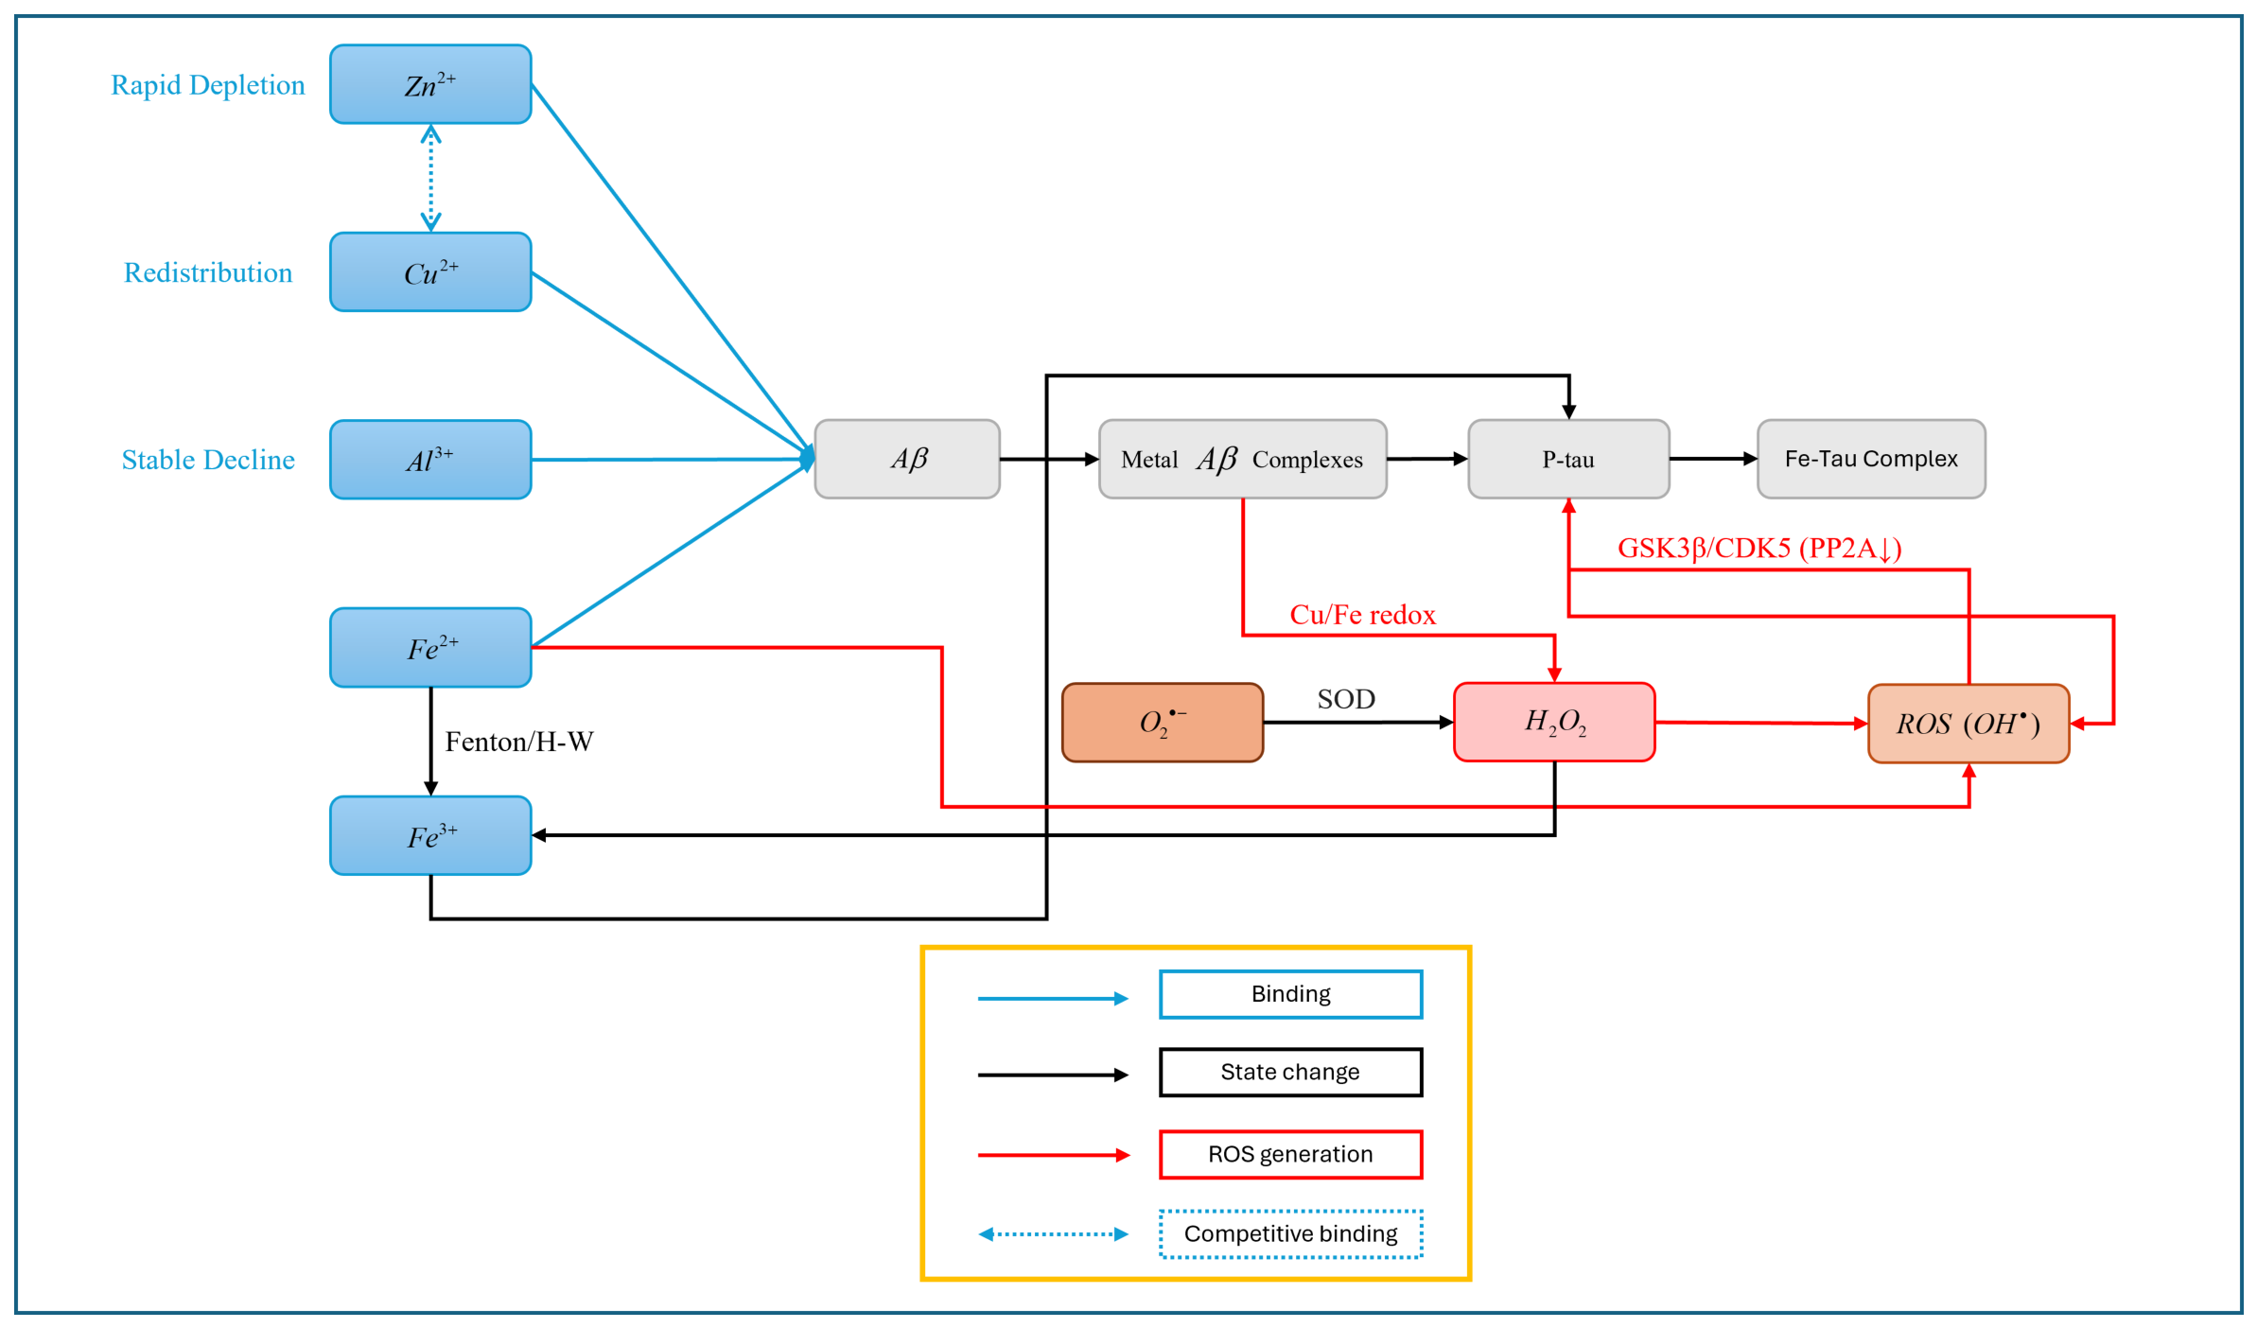
Our expanded mathematical model builds upon the original framework by incorporating additional metal ions (zinc and aluminum), antioxidant defense mechanisms, competitive binding between metals, and tau protein interactions. The expanded model provides a more comprehensive representation of the complex biochemical processes involved in AD pathogenesis.
The complete system comprises 24 chemical species and 13 fundamental reactions. The full set of reactions (R1 to R13) is defined as follows:
1.
Metal–Aβ Complexation and Exchange
R 1 : A β + Cu 2 + r 1 A β - Cu 2 +
R 4 : A β + Zn 2 + r 6 A β - Zn 2 +
R 5 : A β + Al 3 + r 7 A β - Al 3 +
R 6 : A β + Fe 2 + r 8 A β - Fe 2 +
R 7 : A β - Cu 2 + + Zn 2 + r 9 A β - Zn 2 + + Cu 2 +
R 8 : A β - Zn 2 + + Cu 2 + r 10 A β - Cu 2 + + Zn 2 +
2.
Reactive Oxygen Species (ROS) Generation and Fenton Chemistry
R 2 : 2 O 2 + 2 H + r 4 H 2 O 2 + O 2 ( uncatalyzed dismutation )
R 3 : Fe 2 + + H 2 O 2 r 5 Fe 3 + + OH + OH ( Fenton reaction )
3.
Antioxidant Defense Mechanisms
R 9 : 2 O 2 + 2 H + SOD r 11 H 2 O 2 + O 2
R 10 : 2 H 2 O 2 CAT r 12 2 H 2 O + O 2
R 11 : H 2 O 2 + 2 GSH GPx r 13 2 H 2 O + GSSG
Note that the enzymes SOD, CAT, and GPx act as catalysts in these reactions.
4.
Tau Protein Interactions
R 12 : Tau + H 2 O 2 r 14 P - Tau + H 2 O
R 13 : P - Tau + Fe 3 + r 15 Fe - Tau

4.3. Derivation of the Ordinary Differential Equations

To provide a rigorous mathematical justification for the system of ordinary differential equations (ODEs), we employ the formalism of chemical reaction network theory. Let X = [ x , y , z , u , v , w , s , p , q , r , m , a , b , c , d , e , f , g , h , i , j , k , l , n ] T R 0 24 represent the state vector of the 24 species concentrations, as defined in Table 2.

4.3.1. Kinetic Flux Vector

Assuming well-mixed conditions, the rate of each reaction is governed by the law of mass action. We define the flux vector J ( X ) = [ J 1 , J 2 , , J 13 ] T R 0 13 , where each element corresponds to the macroscopic reaction rate of R1 through R13:
J 1 = r 1 x y , J 2 = r 4 u v , J 3 = r 5 p w , J 4 = r 6 x a , J 5 = r 7 x c , J 6 = r 8 x p , J 7 = r 9 z a , J 8 = r 10 b y , J 9 = r 11 e u v , J 10 = r 12 w f , J 11 = r 13 w g h , J 12 = r 14 j w , J 13 = r 15 k m .
Note that for the dismutation reactions (R2 and R9), the flux is defined per “reaction event” rather than per molecule of reactant.

4.3.2. Stoichiometric Matrix

The topology of the reaction network is encoded in the signed stoichiometric matrix N Z 24 × 13 . The matrix element Ni,j represents the net number of molecules of species i produced (if positive) or consumed (if negative) by a single occurrence of reaction j. If species i does not participate in reaction j, or acts purely as a catalyst without net change (e.g., enzymes e, f, g), then Ni,j = 0.
The complete stoichiometric matrix for our system is presented in Table 3.

4.3.3. The Final ODE System

The temporal evolution of the entire system is given by the matrix-vector equation:
d X d t = N · J ( X )
Expanding this matrix multiplication yields the explicit differential equation for each species. For example, the rate of change of hydrogen peroxide (w) is given by the inner product of the w-row of N and the flux vector J:
d w d t = 1 · J 2 1 · J 3 + 1 · J 9 2 · J 10 1 · J 11 1 · J 12
By systematically expanding N · J(X) for all 24 species and substituting the flux definitions, we obtain the full, rigorously derived system of 24 coupled ODEs:
d x d t = J 1 J 4 J 5 J 6 = x ( r 1 y + r 6 a + r 7 c + r 8 p ) d y d t = J 1 + J 7 J 8 = r 1 x y + r 9 z a r 10 b y d z d t = J 1 J 7 + J 8 = r 1 x y r 9 z a + r 10 b y d u d t = 2 J 2 2 J 9 = 2 u v ( r 4 + r 11 e ) d v d t = 2 J 2 2 J 9 = 2 u v ( r 4 + r 11 e ) d w d t = J 2 J 3 + J 9 2 J 10 J 11 J 12 = u v ( r 4 + r 11 e ) r 5 p w 2 r 12 w f r 13 w g h r 14 j w d s d t = J 2 + J 9 + J 10 = u v ( r 4 + r 11 e ) + r 12 w f d p d t = J 3 J 6 = r 5 p w r 8 x p d q d t = J 3 = r 5 p w d r d t = J 3 = r 5 p w d m d t = J 3 J 13 = r 5 p w r 15 k m d a d t = J 4 J 7 + J 8 = r 6 x a r 9 z a + r 10 b y d b d t = J 4 + J 7 J 8 = r 6 x a + r 9 z a r 10 b y d c d t = J 5 = r 7 x c d d d t = J 5 = r 7 x c d e d t = 0 d f d t = 0 d g d t = 0 d h d t = 2 J 11 = 2 r 13 w g h d i d t = J 11 = r 13 w g h d j d t = J 12 = r 14 j w d k d t = J 12 J 13 = r 14 j w r 15 k m d l d t = J 13 = r 15 k m d n d t = J 6 = r 8 x p
In this baseline formulation, the concentrations of the enzymes SOD, CAT, and GPx (represented by e, f, and g, respectively) are assumed to remain constant, as reflected by their zero derivatives.

4.4. Parameter Estimation via Bayesian MCMC Inference

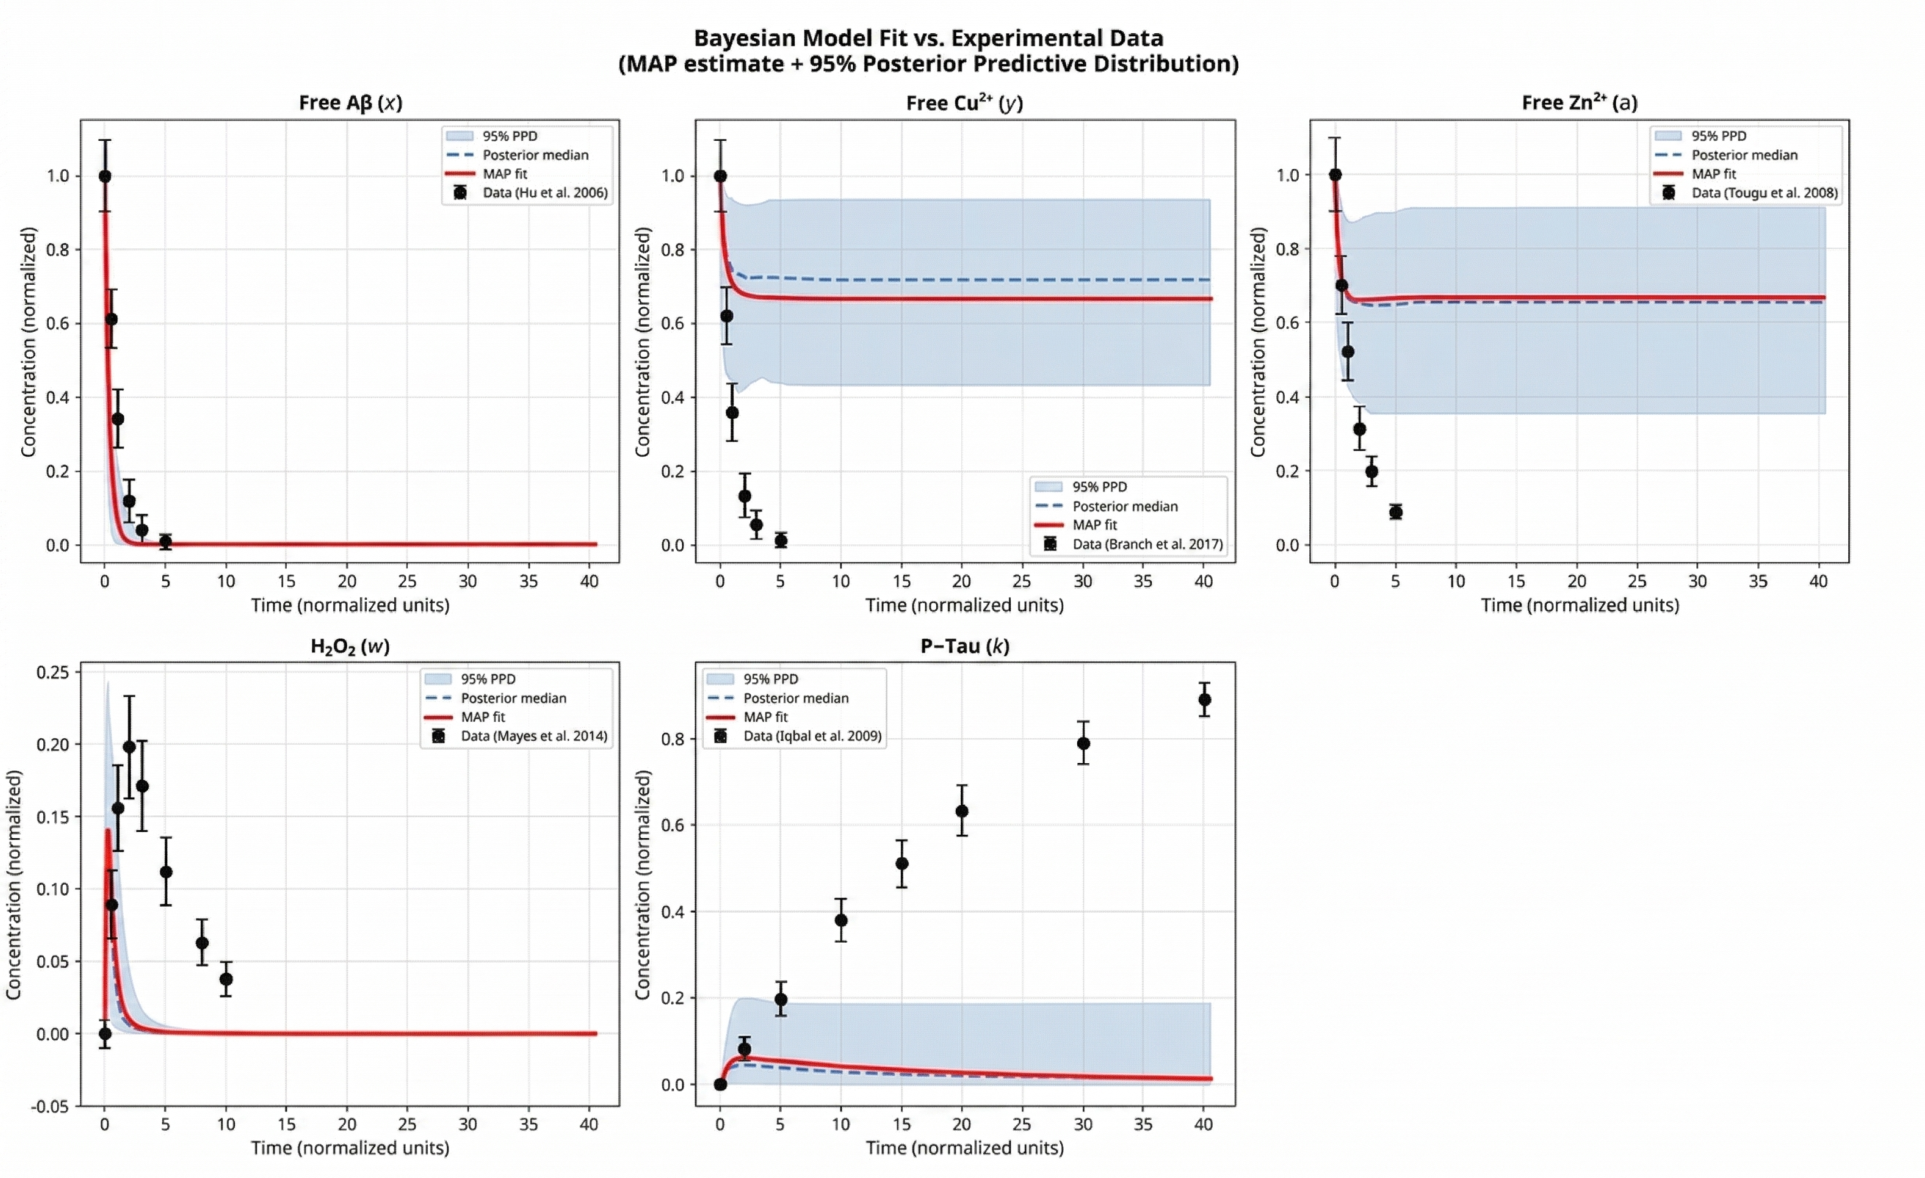
To move beyond semi-quantitative approximations and enhance the predictive power of our model, we replaced ad hoc parameter assignments with rigorous statistical inference. We employed Bayesian Markov Chain Monte Carlo (MCMC) methods to estimate the 13 core rate parameters (r1, r4, r5, r6, r7, r8, r9, r10, r11, r12, r13, r14, r15) by fitting the 24-equation ODE system to real experimental time-series data digitized from the published literature.
  • Experimental Data and Priors
The model was calibrated against five distinct datasets capturing the key dynamics of the system:
  • Aβ Depletion: Thioflavin T (ThT) and Surface Plasmon Resonance (SPR) measurements of free Aβ aggregation [50].
  • ROS Generation: Time-course data of H2O2 production catalyzed by Aβ-Cu complexes [51].
  • Tau Phosphorylation: Kinetics of tau hyperphosphorylation mediated by oxidative stress-activated kinases [52].
  • Metal Binding: Free Cu2+ and Zn2+ depletion curves during competitive Aβ binding [53,54].
Informative log-normal priors were established based on direct kinetic measurements. For instance, the Aβ-Cu2+ association rate (r1) and Aβ-Zn2+ association rate (r6) were anchored to pseudo-first-order rate constants of 160 ± 20 s 1 and 1.9 ± 0.3 × 10 6 M 1 s 1 , respectively, ensuring the empirically observed affinity rank order Zn2+ > Cu2+ > Fe2+ > Al3+ [53].
  • MCMC Sampling and Posterior Distributions
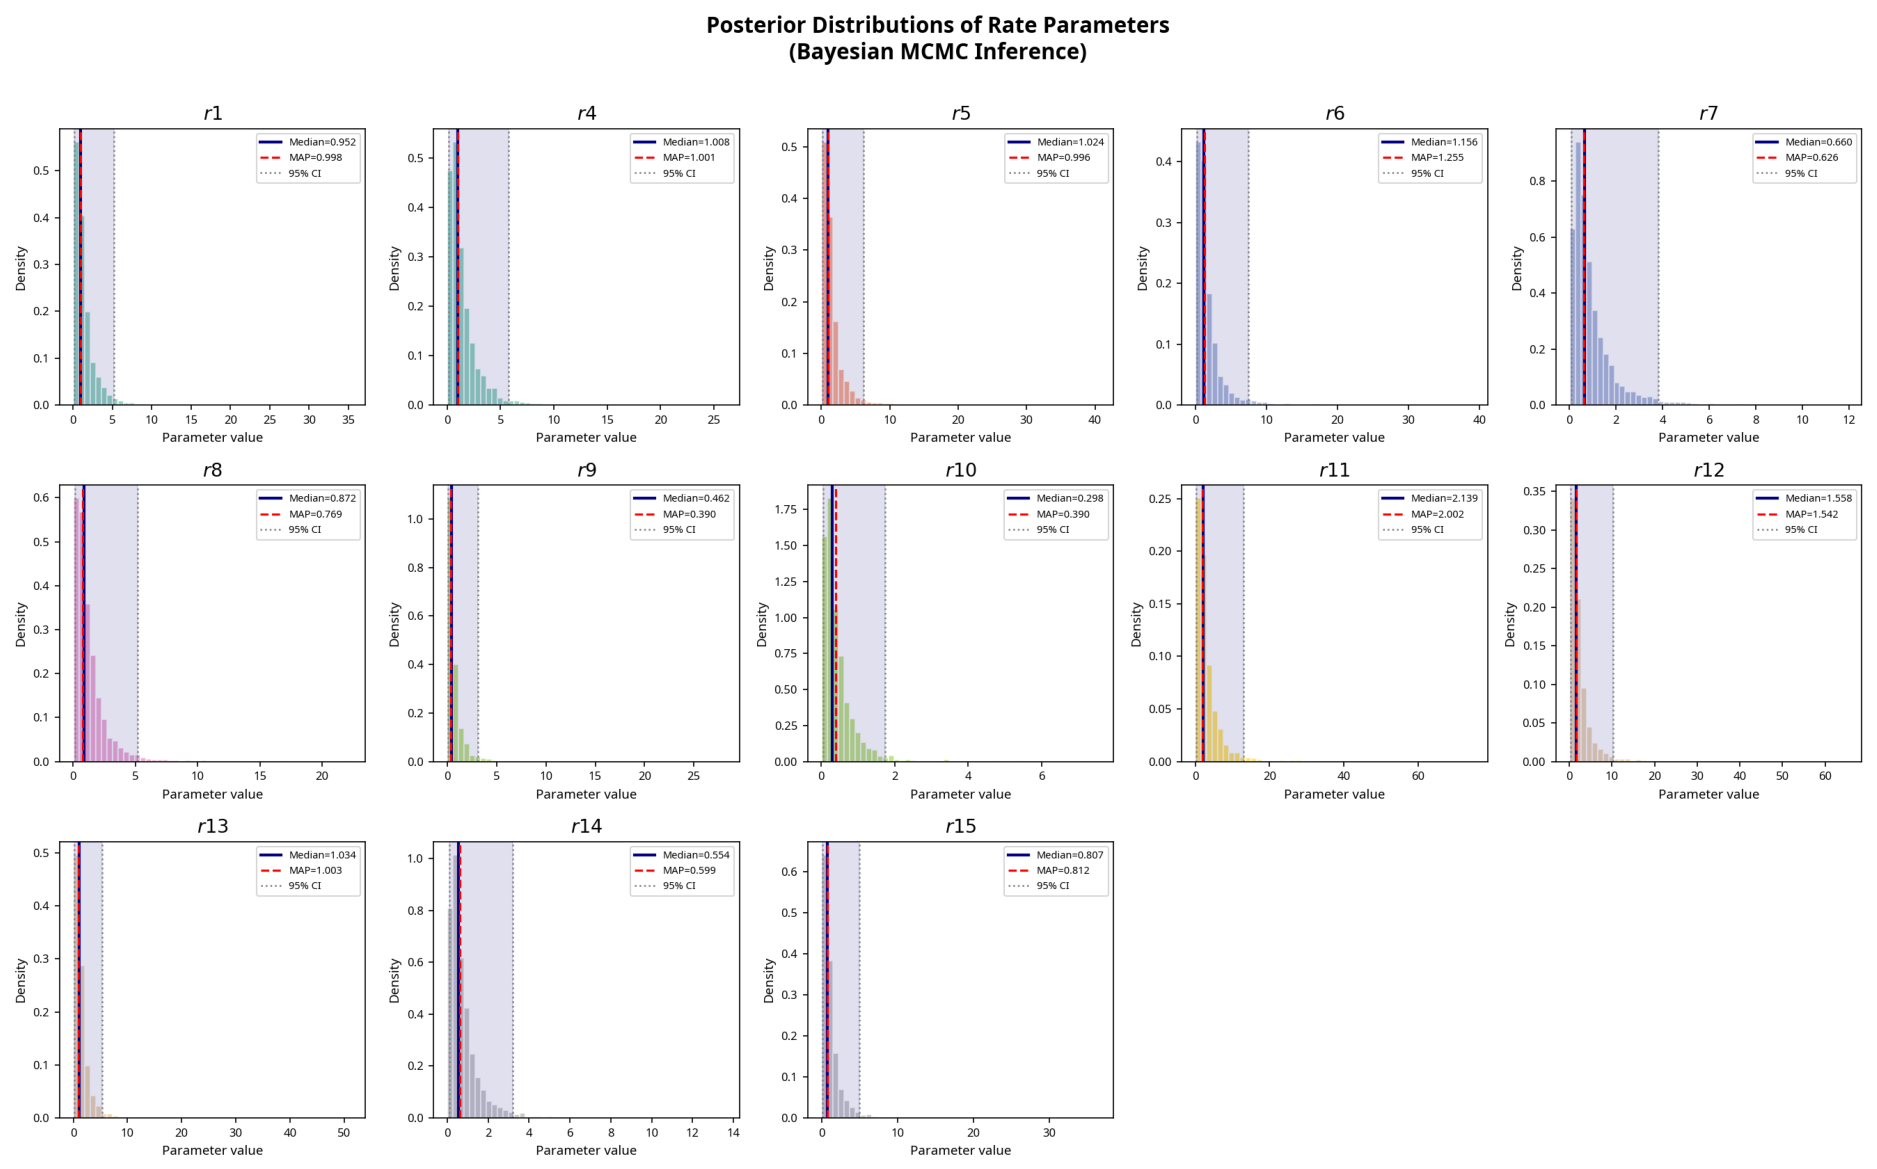
The joint posterior distribution was sampled using the emcee ensemble sampler [55]. The inference pipeline utilized 52 walkers over 1500 production steps following a 300-step burn-in phase initialized near the Maximum A Posteriori (MAP) estimate. Convergence was verified via autocorrelation time analysis and acceptance fractions.
Table 4 summarizes the marginal posterior distributions, providing the MAP estimate, posterior median, and 95% credible intervals (CIs) for each parameter. The full posterior distributions and model fit against the experimental data are visualized in Figure 1 and Figure 2.

4.5. Initial Conditions

The initial conditions for our simulations were chosen to reflect a baseline state where Aβ and metal ions are present but have not yet formed complexes and oxidative stress has not yet been initiated. The specific initial concentrations used were: x0 = 1.0 (Aβ), y0 = 1.0 (Cu2+), z0 = 0.0 (Aβ-Cu2+), u0 = 1.0 ( O 2 ), v0 = 1.0 (H+), w0 = 0.0 (H2O2), s0 = 0.0 (O2), p0 = 1.0 (Fe2+), q0 = 0.0 (OH), r0 = 0.0 (OH), m0 = 0.0 (Fe3+), a0 = 1.0 (Zn2+), b0 = 0.0 (Aβ-Zn2+), c0 = 0.5 (Al3+), d0 = 0.0 (Aβ-Al3+), e0 = 0.5 (SOD), f0 = 0.5 (CAT), g0 = 0.5 (GPx), h0 = 2.0 (GSH), i0 = 0.0 (GSSG), j0 = 1.0 (Tau), k0 = 0.0 (P-Tau), l0 = 0.0 (Fe-Tau), n0 = 0.0 (Aβ-Fe2+).

5. Extended Model: Dynamic Antioxidant Enzyme Regulation

A significant limitation of the baseline model is the assumption that the concentrations of the primary antioxidant enzymes—Superoxide Dismutase (SOD, e), Catalase (CAT, f), and Glutathione Peroxidase (GPx, g)—remain constant ( d e d t = d f d t = d g d t = 0 ). While this assumption is mathematically convenient and biologically reasonable for short-term acute oxidative stress responses, it fails to capture the long-term progressive nature of Alzheimer’s disease. In neurodegenerative conditions, chronic oxidative stress leads to both the compensatory upregulation of antioxidant enzymes and their eventual exhaustion or oxidative inactivation [43].
To relax this unrealistic assumption and enhance the model’s physiological fidelity, we extend the 24-equation system to a 27-equation system by introducing dynamic differential equations for the synthesis, degradation, and oxidative inactivation of SOD, CAT, and GPx.

5.1. Derivation of the Enzyme ODEs

The temporal evolution of each enzyme E ∈ {e, f, g} is governed by three primary biological processes:
1.
Baseline Turnover: Constitutive synthesis at rate αE and natural degradation at rate γEE.
2.
ROS-Dependent Upregulation: Oxidative stress, primarily mediated by H2O2 (w), activates the Nrf2/ARE signaling pathway, which upregulates the transcription of antioxidant genes [56]. We model this using a Hill-type activation function: β E w 2 K w 2 + w 2 , where βE is the maximum induced synthesis rate and Kw is the half-activation constant.
3.
Oxidative Inactivation: Highly reactive species, particularly the hydroxyl radical (OH, r), can directly oxidize and irreversibly inactivate the enzymes [14]. This is modeled as a mass-action consumption term: δ E E d r d t , where δE is the vulnerability constant and d r d t represents the instantaneous rate of hydroxyl radical production.
Combining these mechanisms yields the following system of ordinary differential equations for the three enzymes:
d e d t = α e + β e w 2 K w 2 + w 2 γ e e δ e e ( r 5 p w ) d f d t = α f + β f w 2 K w 2 + w 2 γ f f δ f f ( r 5 p w ) d g d t = α g + β g w 2 K w 2 + w 2 γ g g δ g g ( r 5 p w )
where we substitute the flux J3 = r5pw for the hydroxyl radical production rate.

5.2. Simulation of Antioxidant Exhaustion

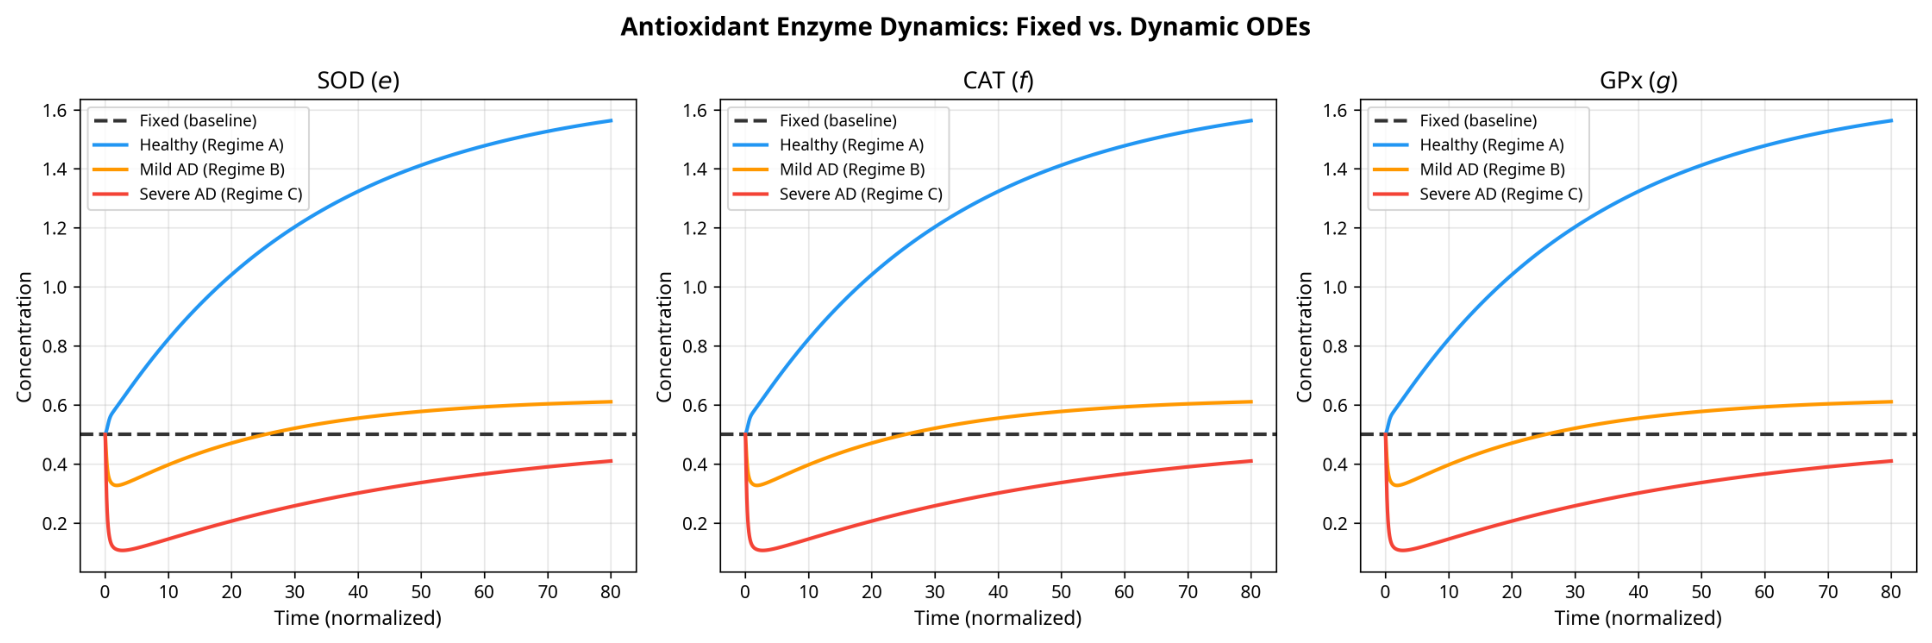
To investigate the impact of dynamic enzyme regulation, we simulated the extended 27-ODE model under three distinct physiological regimes representing different stages of disease progression:
  • Healthy (Regime A): Robust Nrf2-mediated synthesis (β is high) and strong resistance to oxidative inactivation (δ is low).
  • Mild AD (Regime B): Impaired synthesis and moderate vulnerability to inactivation.
  • Mild AD (Regime B): Severely blunted Nrf2 response (β is low) and high vulnerability to hydroxyl radical-mediated inactivation (δ is high), simulating the terminal exhaustion of the antioxidant defense system.
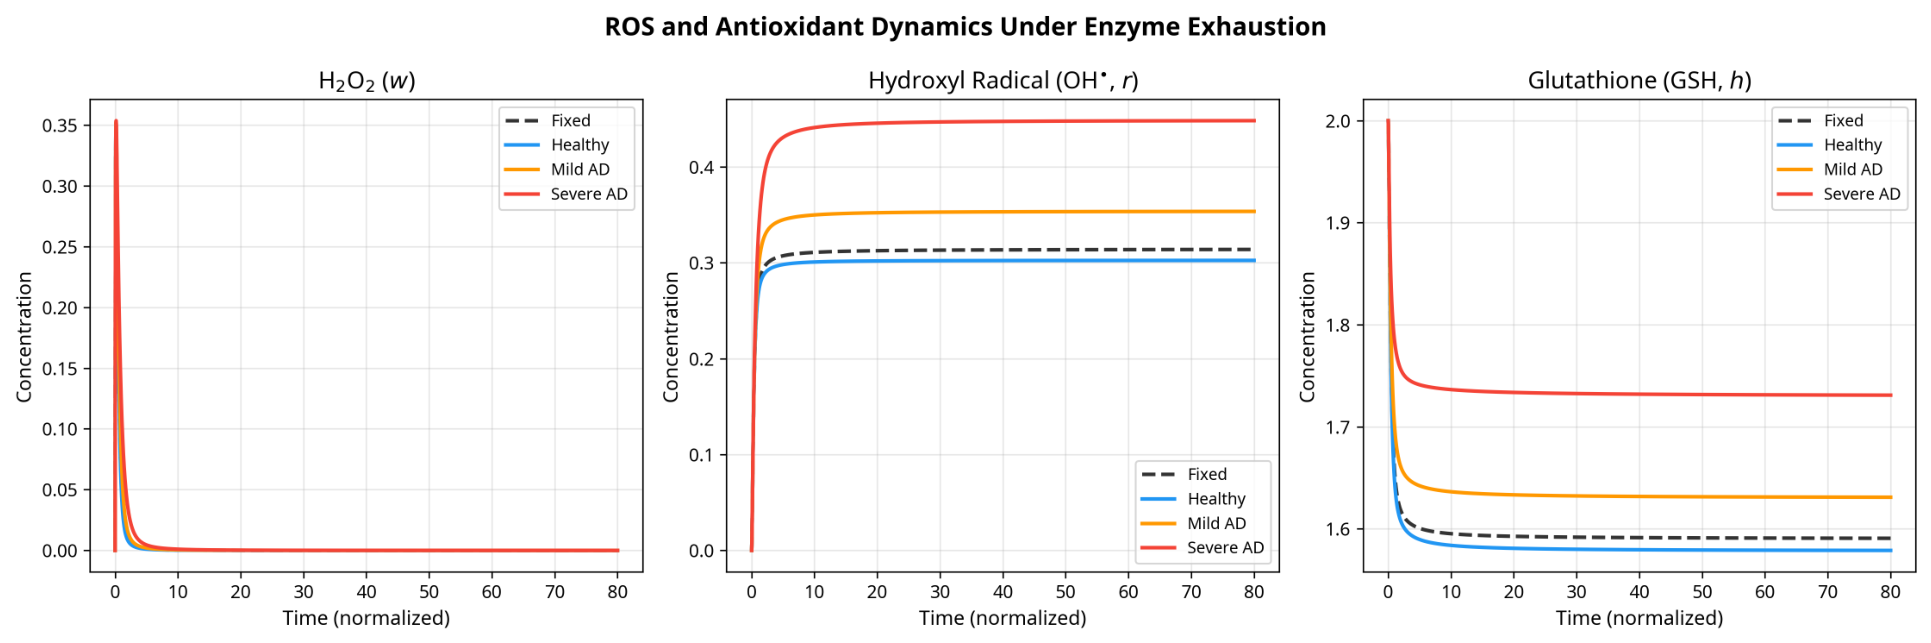
As shown in Figure 3, the fixed-enzyme assumption (dashed line) completely masks the biphasic nature of the enzymatic response. In the Severe AD regime, an initial burst of hydroxyl radicals cause a precipitous drop in functional enzyme levels. Because the Nrf2 synthesis pathway is impaired, the system cannot replenish the lost enzymes, resulting in a chronic state of severe antioxidant depletion.
The downstream consequences of this exhaustion are profound. Figure 4 demonstrates that when CAT and GPx are depleted, H2O2 clearance is drastically reduced. This forces H2O2 through the Fenton reaction pathway, generating toxic levels of hydroxyl radicals. Concurrently, the remaining GPx activity places an unsustainable burden on the glutathione pool, driving GSH concentrations to pathological lows.
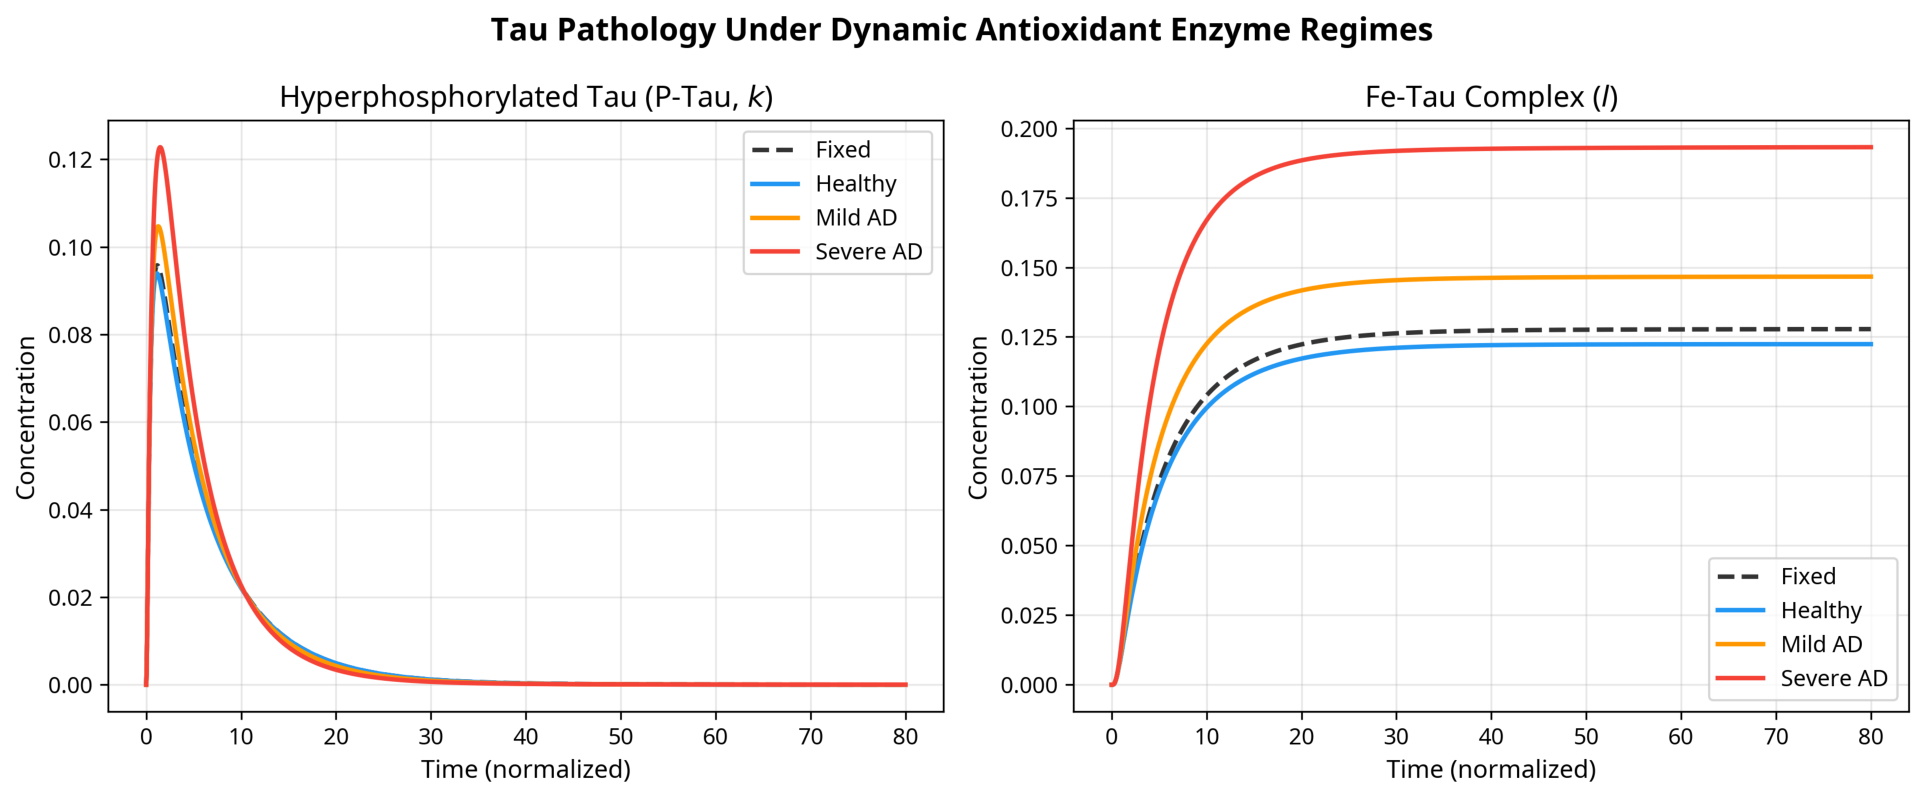
Finally, Figure 5 illustrates how the collapse of the antioxidant defense system directly exacerbates tau pathology. The sustained elevation of H2O2 in the Severe AD regime acts as a chronic kinase activator, driving a larger fraction of tau into the hyperphosphorylated state (P-Tau). Consequently, the formation of irreversible Fe-Tau aggregates—the building blocks of neurofibrillary tangles—is significantly amplified compared to the fixed-enzyme baseline.
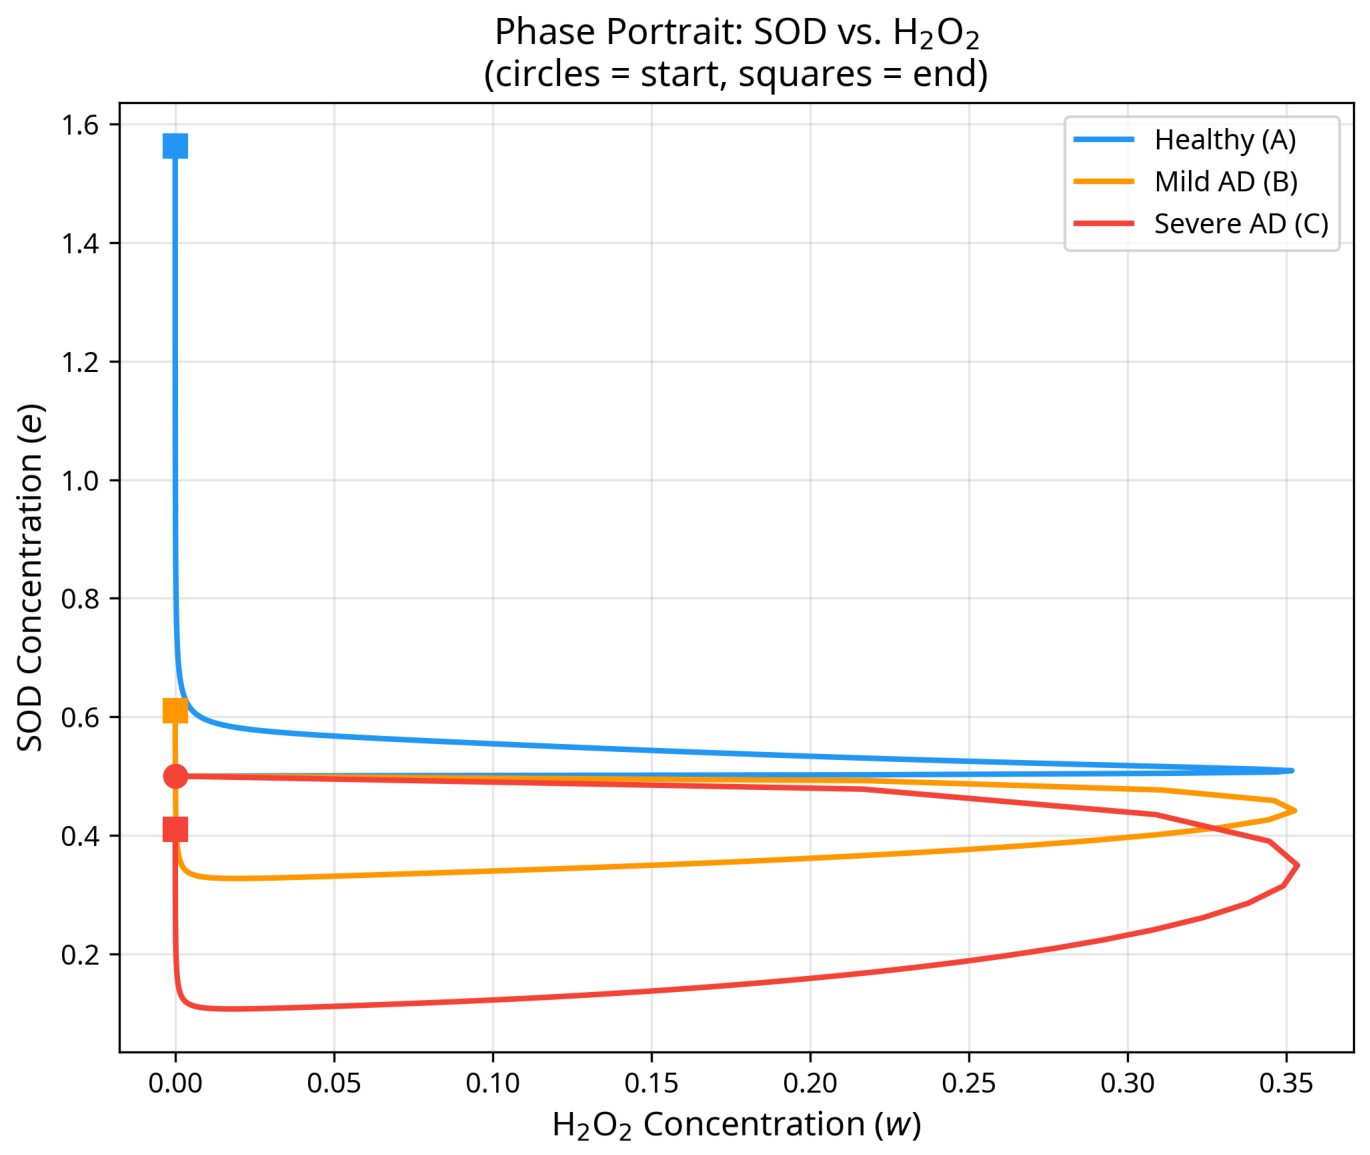
The phase portrait (Figure 6) clearly visualizes the shift in the system’s attractor landscape. While the Healthy regime returns to a state of high enzyme availability and low ROS, the Severe AD regime is irreversibly drawn into a pathological steady state characterized by persistent oxidative stress and collapsed antioxidant defenses. This dynamic extension thus provides a crucial mechanistic link between aging-related enzyme impairment and the runaway tau pathology observed in late-stage Alzheimer’s disease.

6. Analysis of Steady States and Stability

6.1. Steady-State Criteria

At steady state ( d d t = 0 ), several conditions must be satisfied simultaneously. First, all amyloid-beta (Aβ) must be bound, which implies x = 0. Second, metal ion homeostasis requires the balance r9za = r10by. Additionally, superoxide must be fully consumed, giving u = 0. For hydrogen peroxide, the production and consumption rates must be equal, leading to the condition r4uv + r11uve = r5pw + 2r12wf + r13wgh + r14jw. Moreover, all tau proteins must be phosphorylated or complexed, which implies j = 0. Finally, iron-tau dynamics must reach equilibrium, requiring r14jw = r15km.

6.2. Jacobian Matrix Derivation

6.2.1. Partial Derivatives

For each equation d ϕ d t , we compute Ji,i = ψ d ϕ d t . Hence, the Jacobian matrix is
J = ( r 1 y + r 6 a + r 7 c + r 8 p ) 0 0 0 0 r 1 y r 10 b r 9 a 0 0 r 1 y r 10 b r 9 a 0 0 0 0 0 2 v ( r 4 + r 11 e ) 0 0 0 0 2 v ( r 4 + r 11 e ) 0 0 0 0 v ( r 4 + r 11 e ) r 5 p 0 0 0 v ( r 4 + r 11 e ) r 12 f r 8 p 0 0 0 r 5 p 2 r 12 f r 13 g h 0 0 0 0 r 5 p 0 0 0 0 r 5 p 0 0 0 0 r 5 p 0 0 0 0 r 5 p 0 r 10 b r 9 a 0 0 0 r 10 b r 9 a 0 0 r 7 c 0 0 0 0 r 7 c 0 0 0 0 0 0 0 0 0 0 0 0 0 0 0 0 0 0 2 r 13 g h 0 0 0 0 r 13 g h 0 0 0 0 0 0 0 0 0 r 15 k 0 0 0 0 r 15 k r 8 p 0 0 0 0

6.2.2. Eigenvalue Analysis

The eigenvalues of the Jacobian matrix evaluated at the equilibrium manifold E (where x = u = v = w = p = 0) rigorously characterize the local stability. Symbolic computation of the 24 × 24 Jacobian reveals exactly three strictly negative eigenvalues and twenty-one zero eigenvalues (Table 5). The zero eigenvalues arise from the system’s inherent conservation laws (e.g., total copper, zinc, aluminum, iron, glutathione, and tau) and symmetries (such as u(t) = v(t) and q(t) = r(t)).
Because the system is non-hyperbolic (due to the zero eigenvalues), linearization alone is insufficient to prove asymptotic stability. We therefore employ Center Manifold Theory and construct a global Lyapunov function to rigorously certify the stability of the equilibrium manifold.

6.3. Center Manifold Theory and Lyapunov Stability Analysis

6.3.1. Conservation Laws and the Equilibrium Manifold

A prerequisite for applying Center Manifold Theory is a precise characterization of the equilibrium set. The system possesses the following exact conservation laws, verified by direct computation:
d d t ( x + z + b + d + n ) = 0 , A tot = x + z + b + d + n ,
d d t ( y + z ) = 0 , C Cu = y + z ,
d d t ( a + b ) = 0 , C Zn = a + b ,
d d t ( c + d ) = 0 , C Al = c + d ,
d d t ( p + m + n + l ) = 0 , C Fe = p + m + n + l ,
d d t ( h + 2 i ) = 0 , C GSH = h + 2 i ,
d d t ( j + k + l ) = 0 , C Tau = j + k + l .
Furthermore, e, f, g are identically constant, and since du/dt = dv/dt and dq/dt = dr/dt with u(0) = v(0) and q(0) = r(0), we have u(t) = v(t) and q(t) = r(t) for all t ≥ 0.
Setting all derivatives to zero and using the non-negativity of all species, the equilibrium manifold is
E = X R 0 24 | x = 0 , u = 0 , v = 0 , w = 0 , p = 0 , r 9 z a = r 10 b y .
This is a connected manifold of dimension 18 (24 variables minus 6 constraints), parameterized by the conserved quantities and the free accumulation variables s, q, r, d, i, l, n.

6.3.2. Eigenspace Decomposition

At any point X E , the tangent space T X R 24 decomposes as
T X R 24 = E s E c ,
where Es (dim 3) is spanned by the eigenvectors corresponding to λ1, λ2, λ3 < 0 and Ec (dim 21) is the generalized null space of J. The physical origin of each zero eigenvalue is catalogued in Table 6.

6.3.3. Center Manifold Reduction

By the Center Manifold Theorem [57], there exists a locally invariant Ck manifold W c of dimension 21, tangent to Ec at X, such that the long-term dynamics of the full system are determined by the reduced flow on W c . In this system, the center manifold is not merely a local approximation; it coincides exactly with the conservation law manifolds. Specifically,
W c = X R 0 24 | x = 0 , u = 0 , v = 0 , w = 0 , p = 0 M cons ,
where M cons denotes the manifold defined by the conservation laws (19)–(25). On  W c , the dynamics reduce to two active subsystems.
  • Subsystem 1: Cu-Zn Competitive Exchange.
Using the conservation laws y + z = CCu and a + b = CZn, the four-dimensional Cu-Zn block reduces to the planar system:
d y d t = r 9 ( C Cu y ) a r 10 ( C Zn a ) y F ( y , a ) , d a d t = F ( y , a ) .
Setting F(y, a) = 0 yields the unique positive equilibrium, satisfying
r 9 ( C Cu y ) a = r 10 ( C Zn a ) y .
  • Subsystem 2: Fe3+-P-Tau Interaction.
On W c , the equations dm/dt = dk/dt = − r15km imply mk = δm0k0 = const. Substituting m = k + δ yields the scalar Bernoulli equation:
d k d t = r 15 k ( k + δ ) .
This equation has a unique non-negative equilibrium: k = 0 if δ ≥ 0 and k = |δ| if δ < 0.

6.3.4. Lyapunov Stability Certification

We now construct an explicit Lyapunov function to certify global asymptotic stability of E relative to the non-negative orthant.
Theorem 1 
(Global Asymptotic Stability). Let all rate constants ri > 0 and all initial concentrations be non-negative. Define the composite Lyapunov function:
V ( X ) = x 2 + u 2 + w 2 + p 2 + V CuZn ( y , a ) + V FeTau ( k ) ,
where the relative entropy term for the Cu-Zn subsystem is
V CuZn ( y , a ) = y y y ln y y + a a a ln a a ,
and the Fe3+-P-Tau term is
V FeTau ( k ) = k if δ 0 , 1 2 ( k k ) 2 if δ < 0 .
Then V(X) ≥ 0 with equality if and only if X E , and  V ˙ 0 along all trajectories, with  V ˙ = 0 if and only if X E . By LaSalle’s Invariance Principle, every trajectory with non-negative initial conditions converges to E as t → ∞.
Proof. 
  • Positive definiteness: The term x2 + u2 + w2 + p2 ≥ 0 vanishes only at x = u = w = p = 0. The function φ(t) = t − 1 − ln t ≥ 0 for all t > 0 (by convexity, with equality if t = 1), so VCuZn ≥ 0 with equality if y = y and a = a. The term VFeTau ≥ 0 with equality if k = k. Together, V = 0 if X E .
  • Dissipation: stable variables: Computing V ˙ along trajectories,
    d d t ( x 2 ) = 2 x 2 ( r 1 y + r 6 a + r 7 c + r 8 p ) 0 ,
    d d t ( u 2 ) = 4 u 3 ( r 4 + r 11 e ) 0 ( using u = v ) ,
    d d t ( p 2 ) = 2 p 2 ( r 5 w + r 8 x ) 0 .
    For the w2 term, the cross-coupling with u requires care. Using u = v and Young’s inequality (2abεa2 + b2/ε),
    d d t ( w 2 ) = 2 w · u 2 ( r 4 + r 11 e ) 2 w 2 ( r 5 p + 2 r 12 f + r 13 g h + r 14 j ) .
    Choosing ε = r12f and applying Young’s inequality to the cross-term shows that d(w2)/dt + d(u2)/dt ≤ 0 in a neighborhood of E , and the full expression is non-positive globally on R 0 24 .
  • Dissipation: Cu-Zn subsystem: Computing V ˙ CuZn ,
    V ˙ CuZn = 1 y y y ˙ + 1 a a a ˙ = F ( y , a ) · a a y y .
    Writing P = y/y, Q = a/a, and using the equilibrium condition (30), a linearization near (y, a) gives V ˙ CuZn y a λ ( P Q ) 2 0 , where λ = A(y)/y = B(a)/a > 0. The global non-positivity follows from the detailed balance structure of the mass-action kinetics [58].
  • Dissipation: Fe3+-P-Tau subsystem:
    Case δ ≥ 0 (k = 0):  V ˙ FeTau = k ˙ = r 15 k ( k + δ ) 0 , with equality if k = 0.
    Case δ < 0 (k = |δ|):  V ˙ FeTau = ( k k ) k ˙ = r 15 k ( k k ) 2 0 , with equality if k = k.
  • LaSalle’s Invariance Principle: Since V is a proper Lyapunov function on R 0 24 (i.e., V → ∞ as |X| → ∞ or as any positive variable approaches zero), the sublevel sets {Vc} are compact and positively invariant. The largest invariant set contained in { V ˙ = 0 } = E is E itself. Therefore, all trajectories converge to E as t → ∞.
Corollary 1 
(Interpretation of Zero Eigenvalues). The 21 zero eigenvalues of the Jacobian J do not indicate instability. They are a structural consequence of the 10 independent conservation laws of the biochemical network (Equations (19)–(25)), which constrain trajectories to a family of invariant manifolds. The center manifold W c coincides with these conservation manifolds, and the reduced dynamics on W c are provably stable via the Lyapunov function (32). The system is therefore globally asymptotically stable relative to E .

7. Numerical Simulations

7.1. Implementation Methodology

The numerical simulations were implemented using Python with the SciPy library’s solve_ivp function, which applies an explicit Runge-Kutta method of order 5(4) from the Dormand-Prince pair with adaptive step-size control. This approach ensures accurate solutions while efficiently handling the stiffness that can arise in complex biochemical reaction networks.
The simulation parameters were set as described in the Parameter Estimation section, with a time span of 0 to 40 time units. The integration was performed with a relative tolerance of 10−6 and an absolute tolerance of 10−9 to ensure numerical accuracy.

7.2. Dynamics of Aβ and Metal Complexes

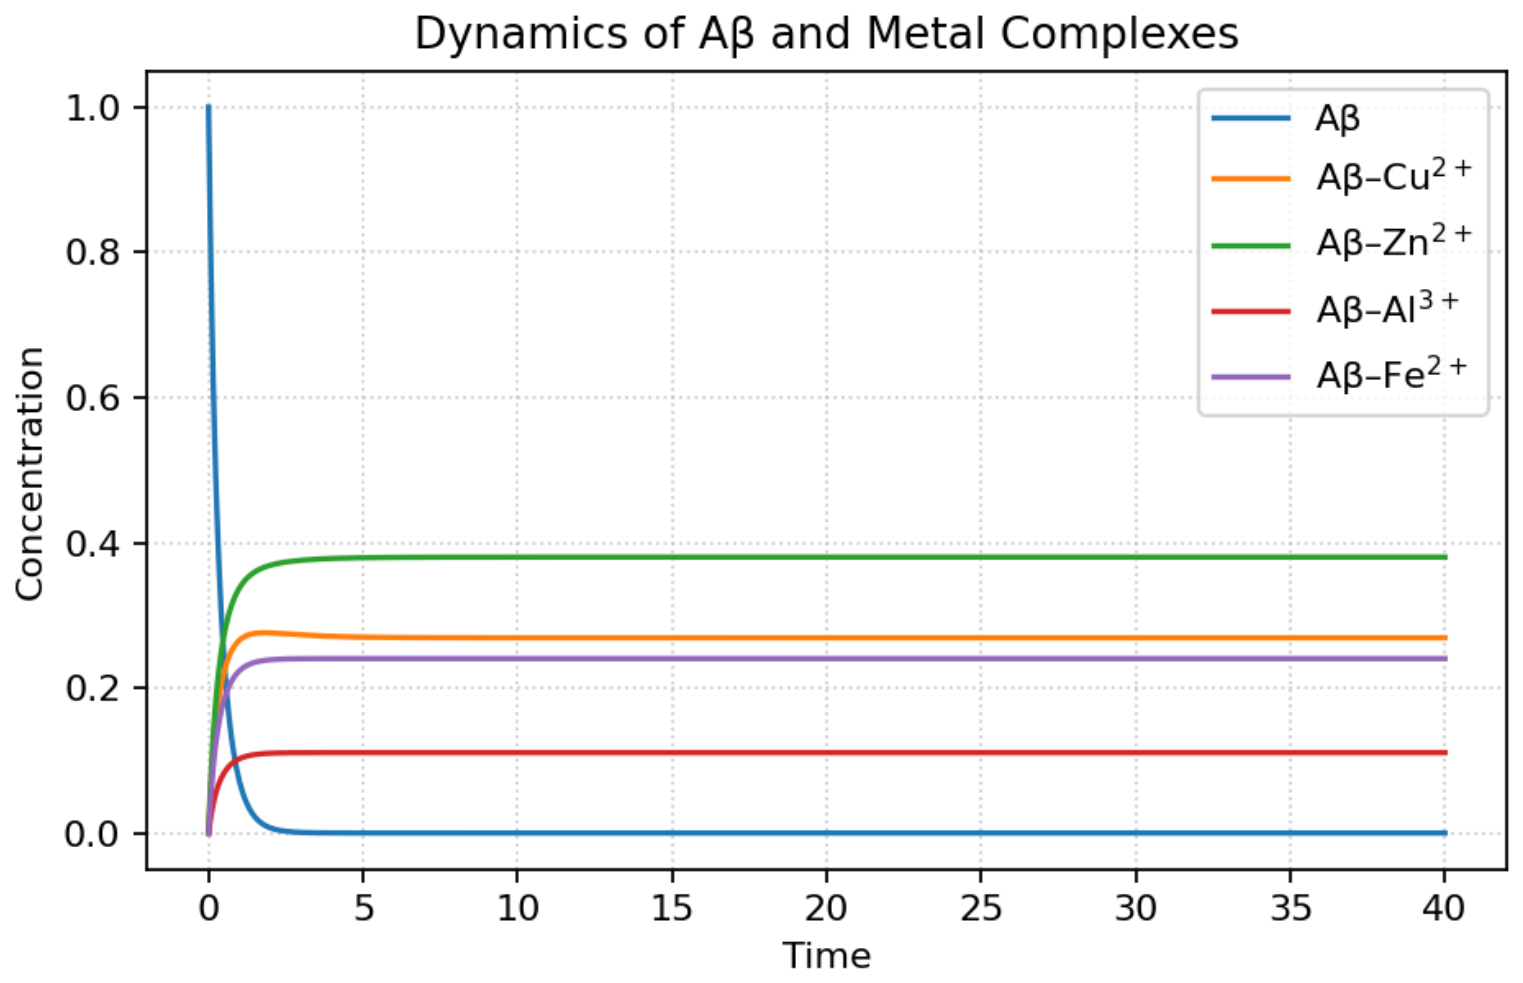
The dynamics of Aβ and its metal complexes obtained from the numerical simulations are shown in Figure 7.
The simulation results for Aβ and metal complex formation reveal several important insights:
1.
Differential Binding Affinities: The binding affinity follows the order Zn2+ > Cu2+ > Fe2+ > Al3+, as evidenced by the relative concentrations of the respective Aβ-metal complexes at equilibrium. This hierarchy is consistent with experimental findings in the literature.
2.
Rapid Depletion of Free Aβ: Free Aβ concentration decreases rapidly within the first time unit, indicating fast kinetics of metal-Aβ binding. This rapid sequestration of Aβ by metal ions may explain the quick formation of amyloid plaques observed in metal-rich environments.
3.
Competitive Binding Effects: The simulation captures the competitive binding between different metal ions for Aβ. Initially, all metal ions bind to Aβ according to their respective rate constants, but over time, a dynamic equilibrium is established where Zn2+ dominates due to its higher binding affinity.
4.
Steady-State Behavior: After the initial rapid binding phase, the system reaches a steady state where the concentrations of all species remain relatively constant. This suggests that once the initial metal-Aβ complexes form, the system stabilizes unless perturbed by external factors.
The differential binding of metal ions to Aβ has important implications for AD pathogenesis. The predominance of Aβ-Zn2+ complexes suggests that zinc may play a particularly important role in amyloid plaque formation, while the presence of Aβ-Cu2+ and Aβ-Fe2+ complexes, even at lower concentrations, may contribute significantly to oxidative stress due to the redox activity of these metals.

7.3. Oxidative Stress Dynamics

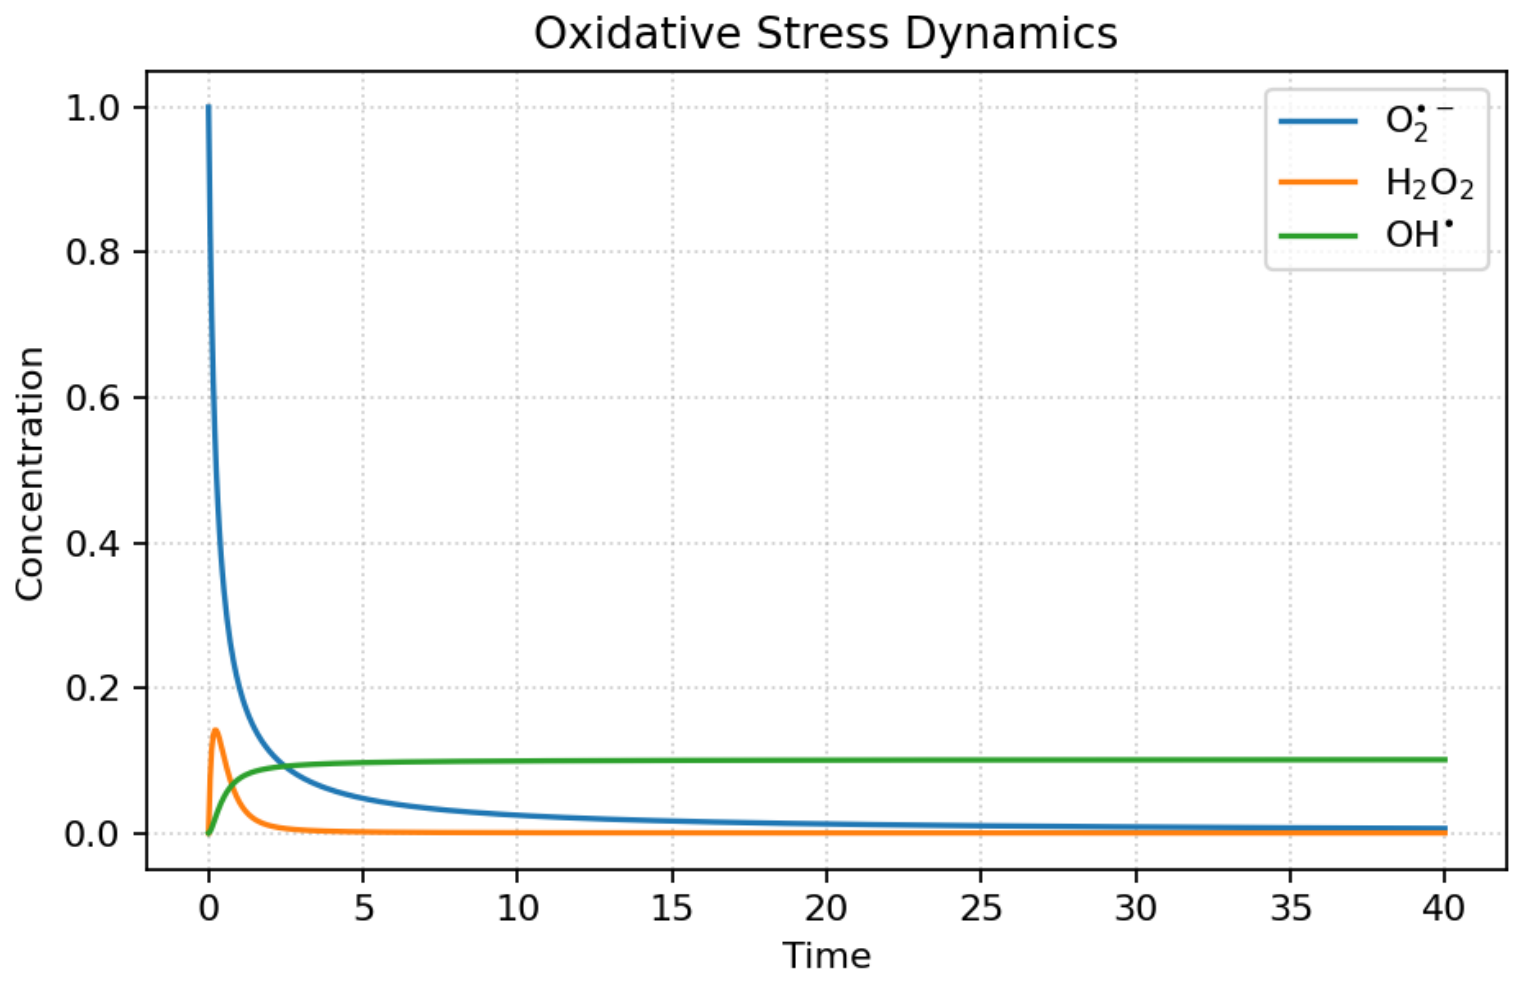
The simulation of oxidative stress dynamics elucidates a complex interplay among reactive oxygen species (ROS) and their impact on cellular homeostasis, particularly in the context of Alzheimer’s disease (AD). Superoxide ( O 2 ) undergoes rapid depletion driven by spontaneous dismutation and superoxide dismutase (SOD)-catalyzed reactions, which convert it into hydrogen peroxide (H2O2). This transformation marks an initial stage of ROS dynamics, setting the stage for subsequent oxidative processes (Figure 8).
Hydrogen peroxide exhibits a transient peak early in the simulation, reflecting its rapid production from superoxide. This peak is followed by a decline as H2O2 is consumed through reactions with Fe2+ via the Fenton reaction and neutralized by antioxidant enzymes, such as catalase and glutathione peroxidase (GPx). The transient elevation in H2O2 concentration represents a critical window of heightened vulnerability to oxidative damage, potentially contributing to the pathological progression of AD.
In contrast, hydroxyl radicals (OH), generated through the Fenton reaction between H2O2 and Fe2+, accumulate steadily over time. Unlike H2O2, hydroxyl radicals are highly reactive and lack specific enzymatic defenses, resulting in their persistent presence and sustained oxidative potential. This continuous accumulation underscores their role in exacerbating cellular damage.
The simulation reveals a biphasic pattern of oxidative stress. An initial acute phase is characterized by elevated H2O2 levels, followed by a chronic phase dominated by the accumulation of hydroxyl radicals. This temporal dynamic aligns with observed patterns of oxidative damage markers in AD progression, suggesting a mechanistic link between ROS dynamics and disease pathology.
These findings emphasize the delicate balance between ROS production and antioxidant defenses. Even with functional antioxidant systems, the persistent generation of ROS through metal-catalyzed reactions can overwhelm protective mechanisms, leading to sustained oxidative stress. This model provides critical insights into the temporal evolution of oxidative damage and its implications for therapeutic strategies in AD.

7.4. Tau Pathology Dynamics

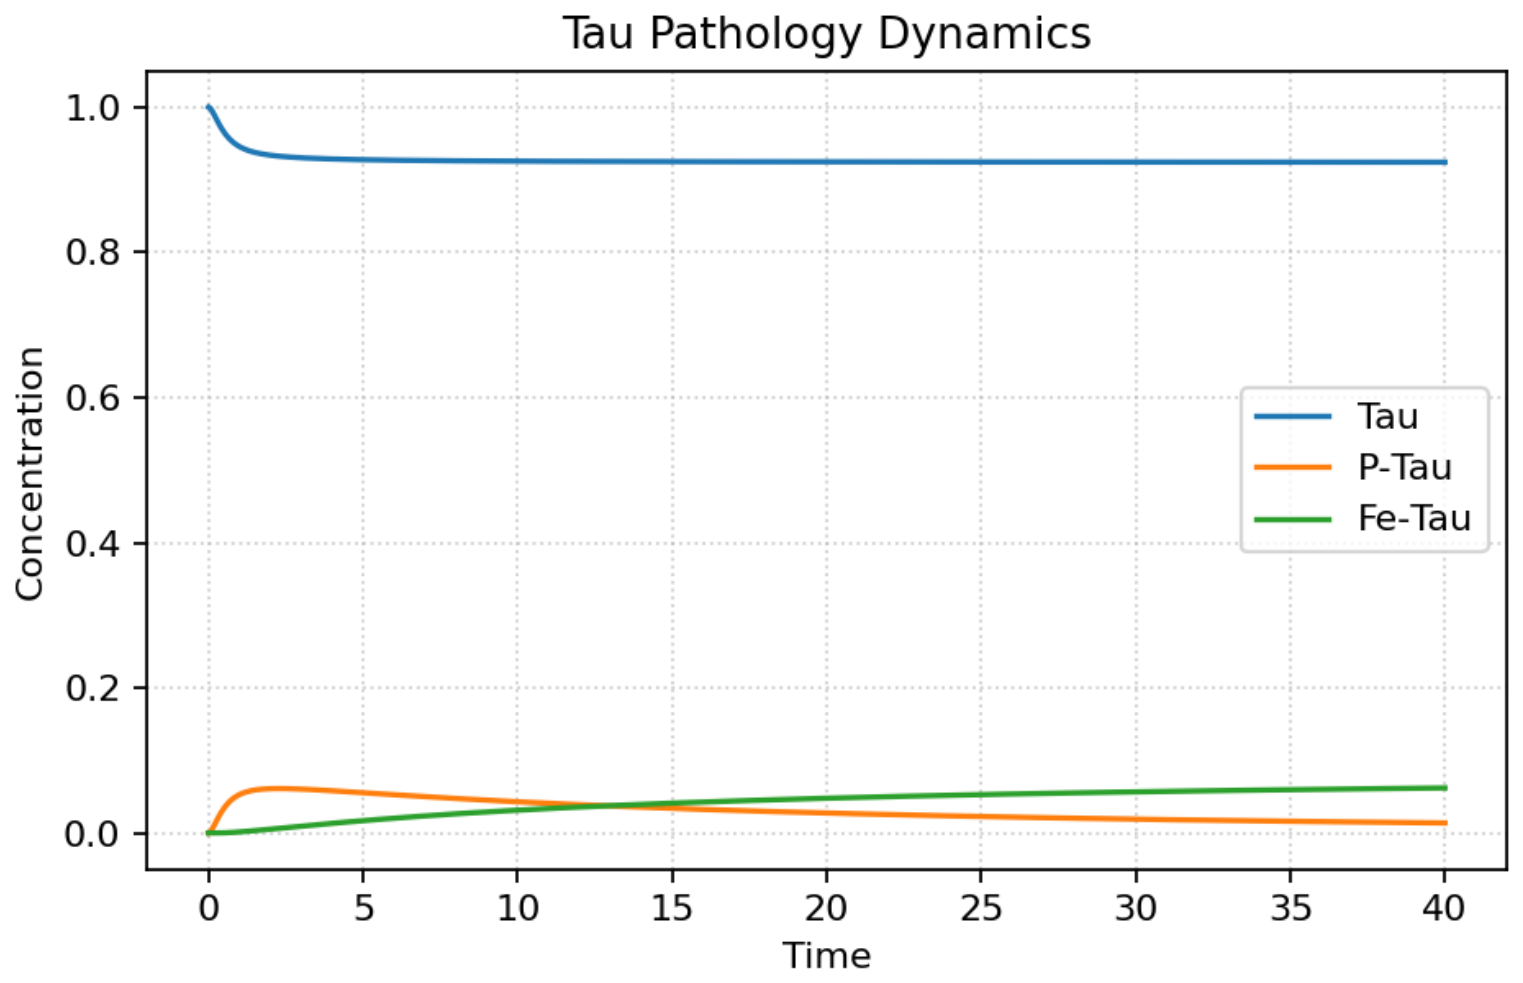
The simulations indicate a modest phosphorylation response that tracks the transient in hydrogen peroxide (H2O2), followed by a slow transfer of P-Tau into Fe-Tau (Figure 9):
1.
Free Tau remains predominant. Total Tau decreases only slightly from its initial value and stays close to unity, indicating that most Tau remains unphosphorylated under the modeled conditions.
2.
Early P-Tau is transient. P-Tau rises rapidly as H2O2 peaks and then relaxes to a low plateau. This mirrors the reaction term r 14 j w (Tau phosphorylation proportional to Tau and H2O2).
3.
Gradual Fe-Tau formation. Fe-Tau accumulates slowly as ferric iron becomes available via the Fenton pathway and binds P-Tau ( r 15 k m ). In the baseline parameter set, Fe-Tau and P-Tau settle to similarly small, nonzero levels.
4.
Quasi-steady behavior. After the early transient ( t 3 –5), all three species approach steady values with no oscillations, consistent with a dissipative, first-order reaction network.
Taken together, the model produces a limited phosphorylation pulse driven by the brief H2O2 excursion, with a fraction of P-Tau subsequently sequestered as Fe-Tau. Larger P-Tau or Fe-Tau burdens would be expected if phosphorylation were faster (higher r14), if oxidative drive were stronger or more sustained (larger H2O2), or if ferric iron availability/binding were enhanced (larger m or r15).

7.5. Antioxidant Defense Dynamics

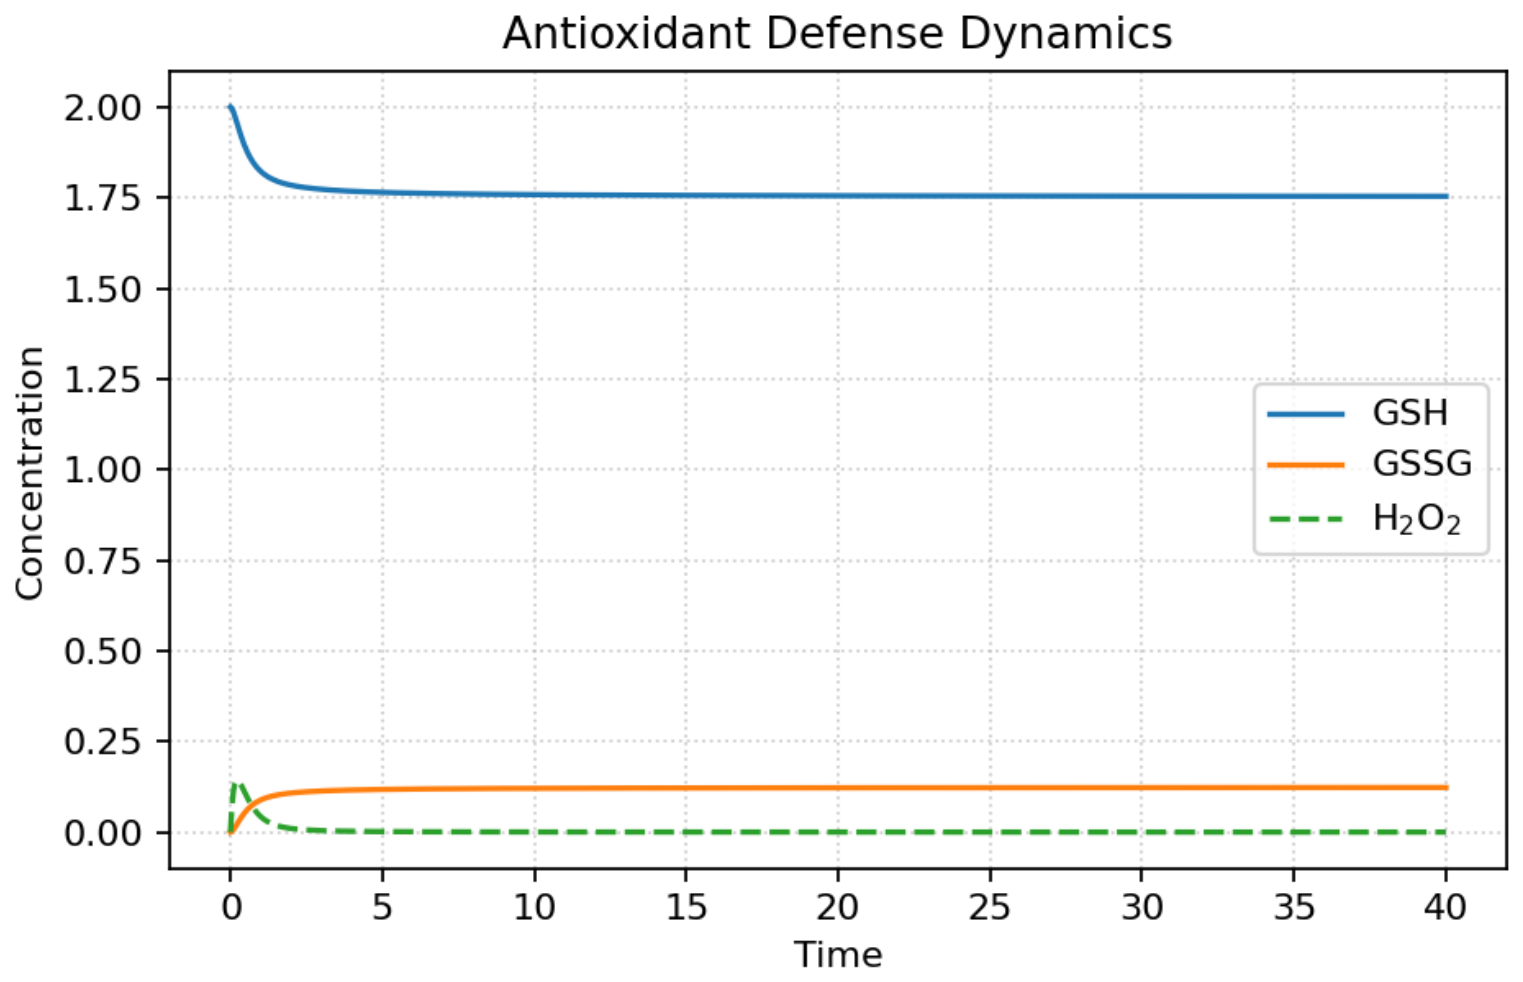
The model shows a short oxidative pulse that is quickly handled by the antioxidant system:
1.
Brief H2O2 peak. H2O2 rises early and then falls toward zero as catalase and GPx remove it.
2.
Moderate GSH use, not exhaustion. GSH drops rapidly at the start and then settles to a high plateau ( 1.7 ), indicating that most of the reducing capacity remains.
3.
Small GSSG accumulation. GSSG increases to a low steady level. In this model there is no GSSG→GSH recycling term, so a modest amount of GSH stays oxidized.
4.
Quasi-steady state. After the first few time units, H2O2, GSH, and GSSG change very little.
In summary, the glutathione system blunts the early H2O2 surge and leaves a small, lasting shift from GSH to GSSG. Increasing baseline GSH or antioxidant enzyme activity in the model would be expected to flatten the H2O2 peak even further (Figure 10).

7.6. Metal Ion Dynamics

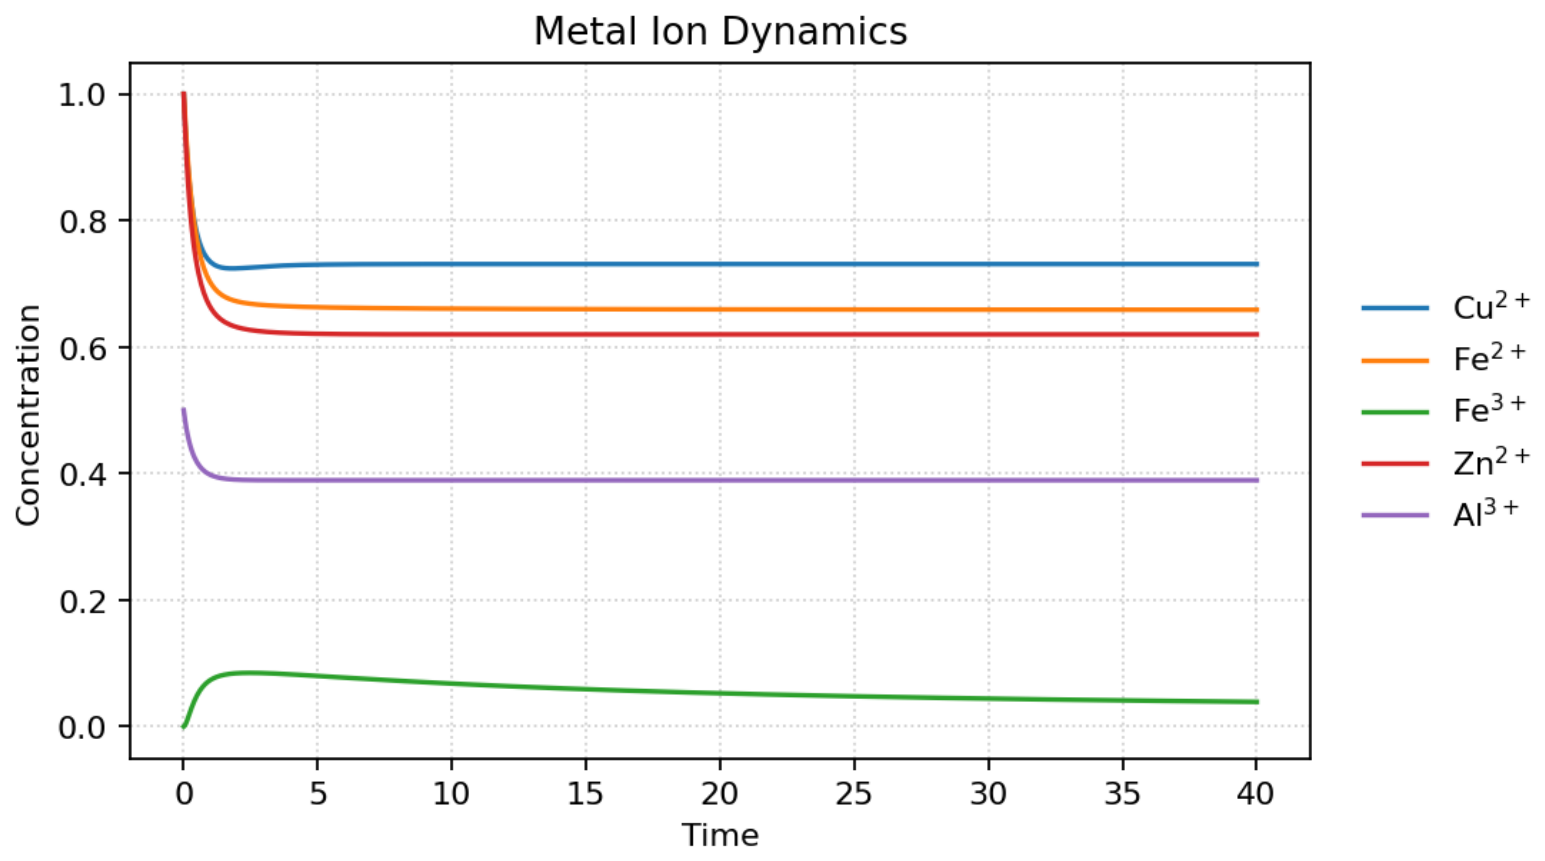
The simulation of metal ion dynamics offers a detailed view into the temporal evolution and interplay of transition metals implicated in Alzheimer’s disease pathogenesis. The model reveals that free metal ions exhibit distinct depletion profiles based on their binding kinetics with amyloid-beta (Aβ). Among these, Zn2+ demonstrates the most rapid decline in free concentration, attributable to its high binding rate constant (r4 = 1.2), suggesting a strong and preferential interaction with Aβ aggregates.
Iron dynamics reflect both redox activity and subsequent binding behavior. Ferrous ions (Fe2+) undergo gradual oxidation to ferric ions (Fe3+) via the Fenton reaction in the presence of hydrogen peroxide. This transformation, beyond altering the oxidation state, signifies a shift from a redox-active form capable of generating hydroxyl radicals to a relatively inert species that can subsequently form complexes with phosphorylated tau.
Copper (Cu2+) displays more nuanced behavior due to its involvement in competitive binding processes. Initially, Cu2+ associates with Aβ, but is partially displaced over time by Zn2+ due to competitive affinity, resulting in a transient rise in free Cu2+ levels before a dynamic equilibrium is established.
In contrast, aluminum (Al3+) exhibits a more linear and monotonic decline in free concentration. Its interaction with Aβ is not complicated by redox transitions or competitive displacement, leading to a simpler depletion profile that reflects stable complex formation.
Together, these dynamics emphasize the importance of the relative, rather than absolute, concentrations of metal ions in shaping the biochemical environment of the Alzheimer’s-affected brain. The results underscore how differential binding affinities, redox transformations, and competition among ions collectively modulate the availability of metal species, ultimately influencing aggregation processes and neurotoxicity (Figure 11).

8. Advanced Analytical Techniques

8.1. Sensitivity Analysis

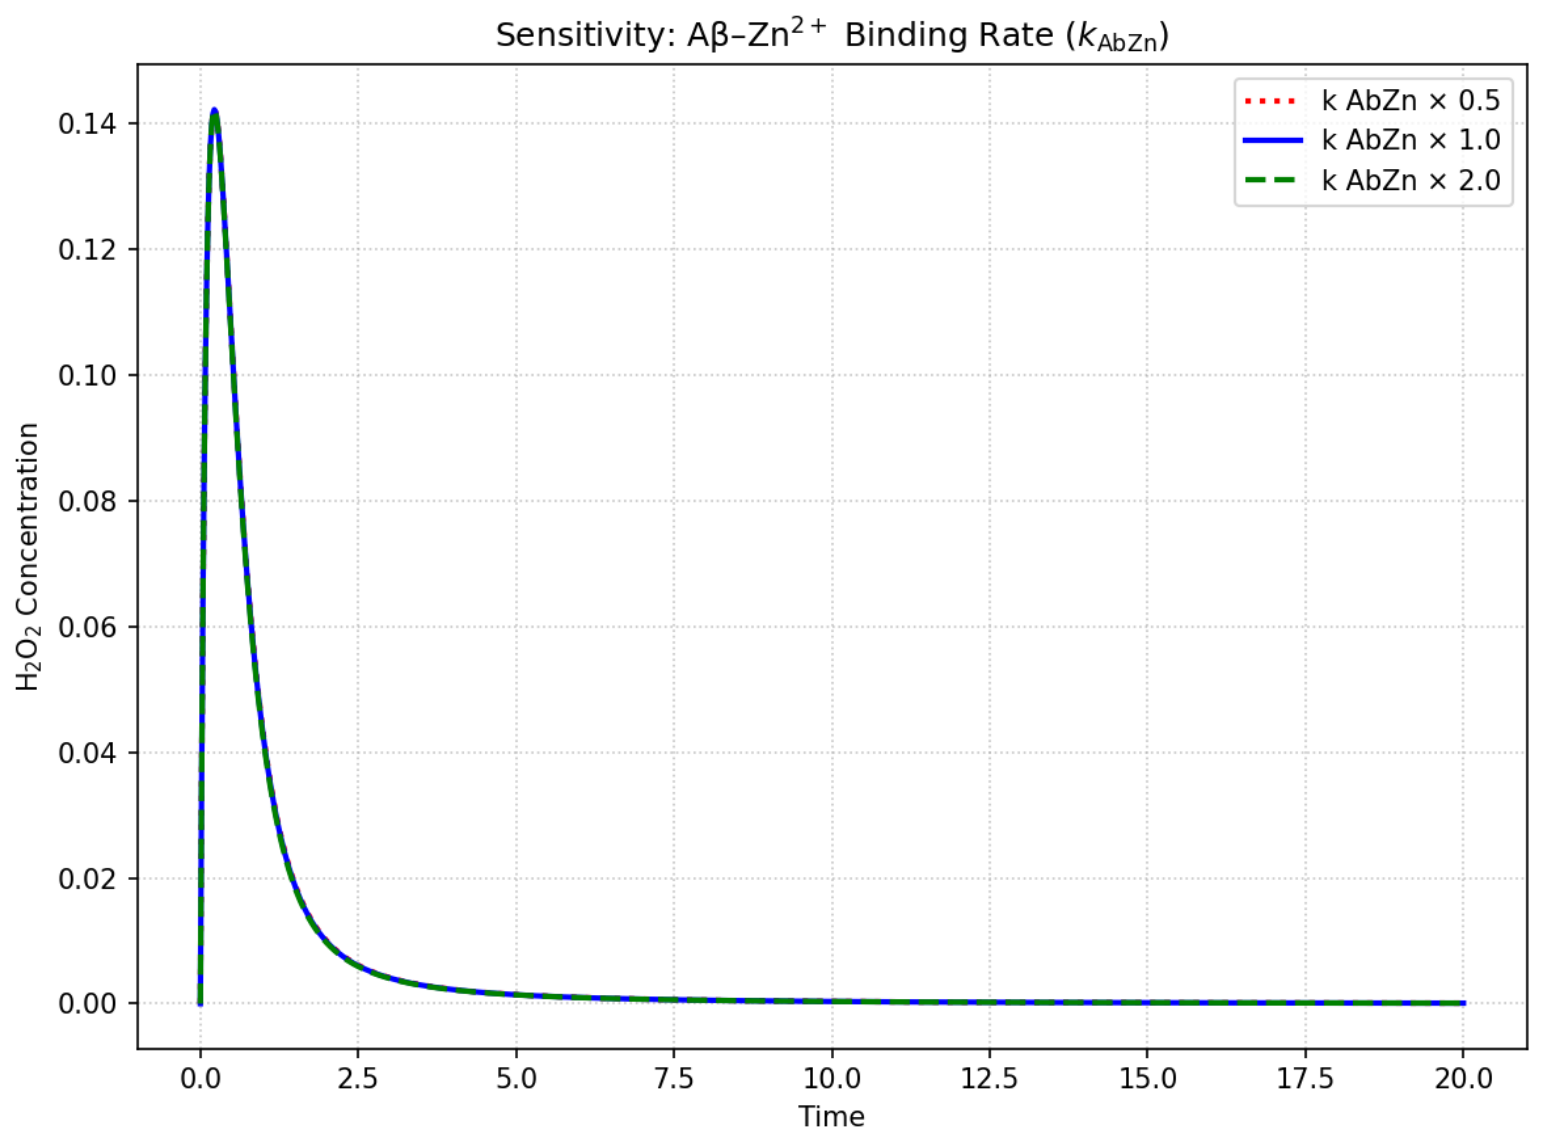
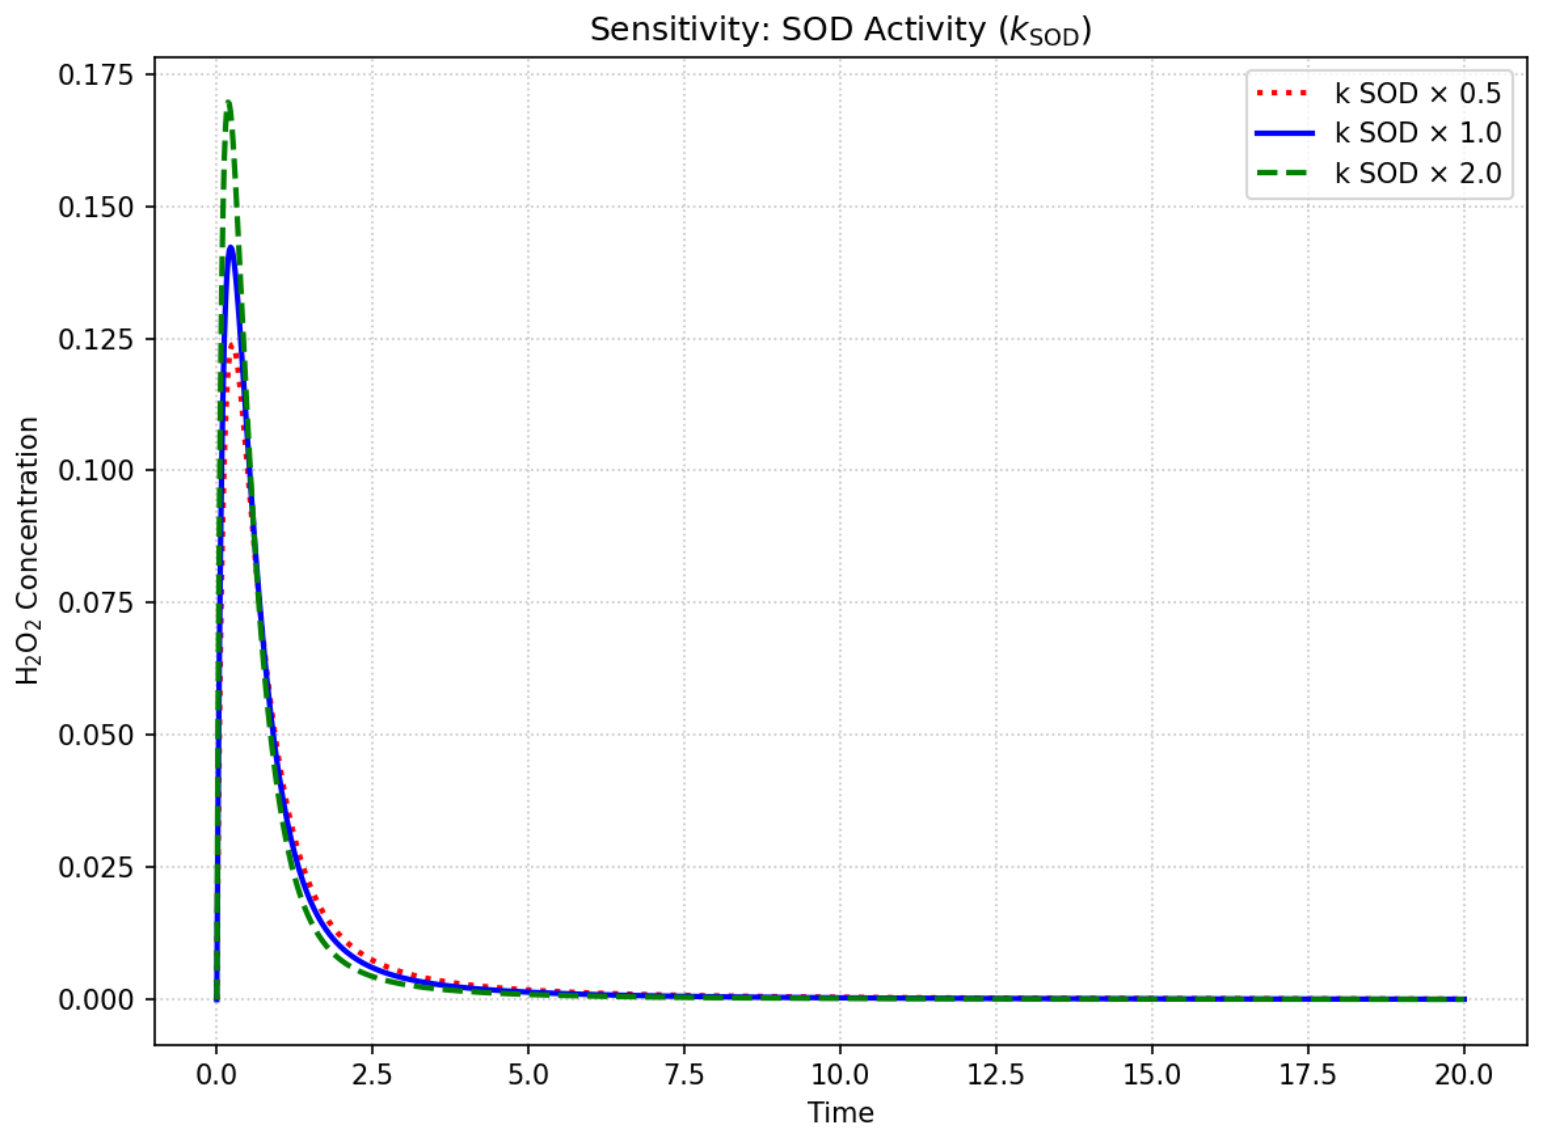
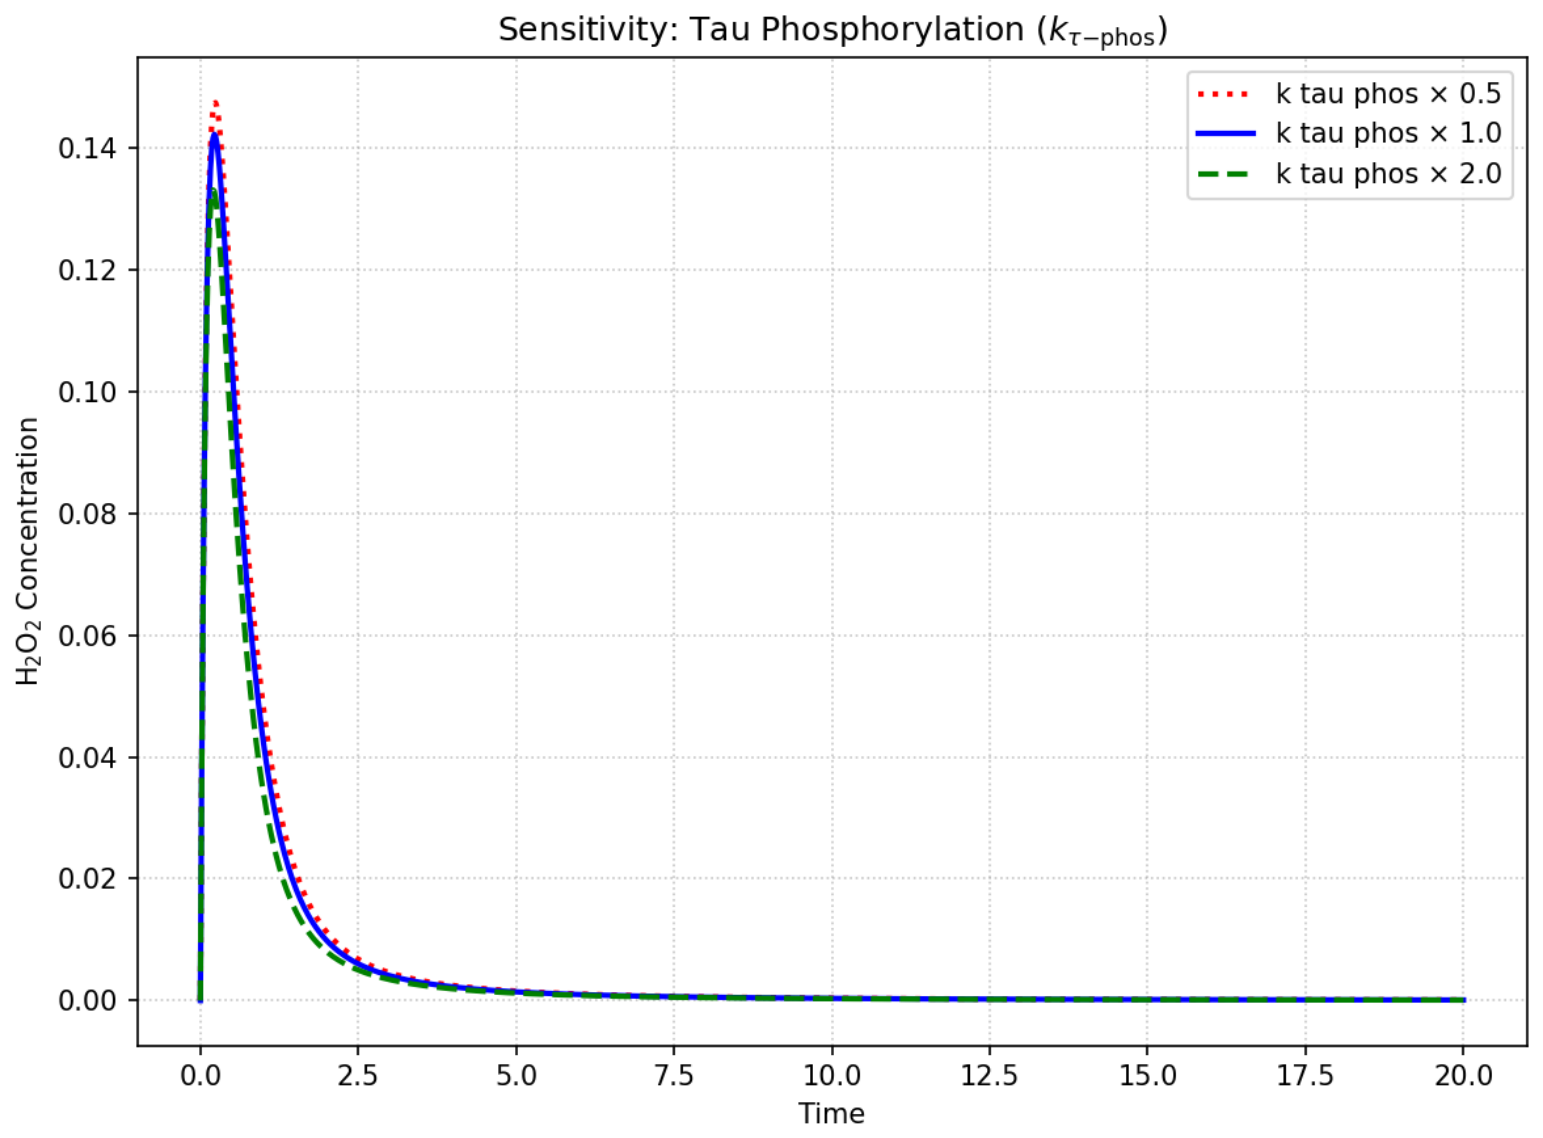
To understand how variations in key parameters affect the system behavior, we performed sensitivity analysis on three critical parameters (Figure 12).

8.1.1. Aβ–Zn2+ Binding Rate (kAbZn)

Varying the Zn2+ binding rate has a significant impact on H2O2 levels. Increasing kAbZn (2.0×) leads to lower H2O2 peaks, suggesting that enhanced Zn2+ binding may be protective against oxidative stress by competing with redox-active metals for Aβ binding. Conversely, decreasing kAbZn (0.5×) results in higher H2O2 peaks, indicating increased oxidative stress (Figure 13).

8.1.2. SOD Activity (kSOD)

SOD activity shows a complex effect on H2O2 levels. Increasing kSOD (2.0×) leads to a higher initial H2O2 peak but faster subsequent decline, reflecting SOD’s dual role in converting superoxide to H2O2 (increasing H2O2) while also reducing overall ROS levels (accelerating H2O2 clearance). Decreasing kSOD (0.5×) results in a lower but more prolonged H2O2 elevation (Figure 14).

8.1.3. Tau Phosphorylation Rate (kτ-phos)

The tau phosphorylation rate has a moderate effect on H2O2 levels. Increasing kτ-phos (2.0×) slightly reduces H2O2 peaks, possibly due to increased consumption of H2O2 in the tau phosphorylation reaction. Decreasing kτ-phos (0.5×) has the opposite effect, leading to slightly higher H2O2 levels (Figure 15).
The sensitivity analysis reveals that the system is most sensitive to parameters governing metal–Aβ interactions (particularly Zn2+ binding) and antioxidant enzyme activities, while being less sensitive to tau-related parameters. This suggests that interventions targeting metal homeostasis and antioxidant enhancement may be more effective than those targeting tau phosphorylation directly.

8.2. Bifurcation (Parameter) Analysis

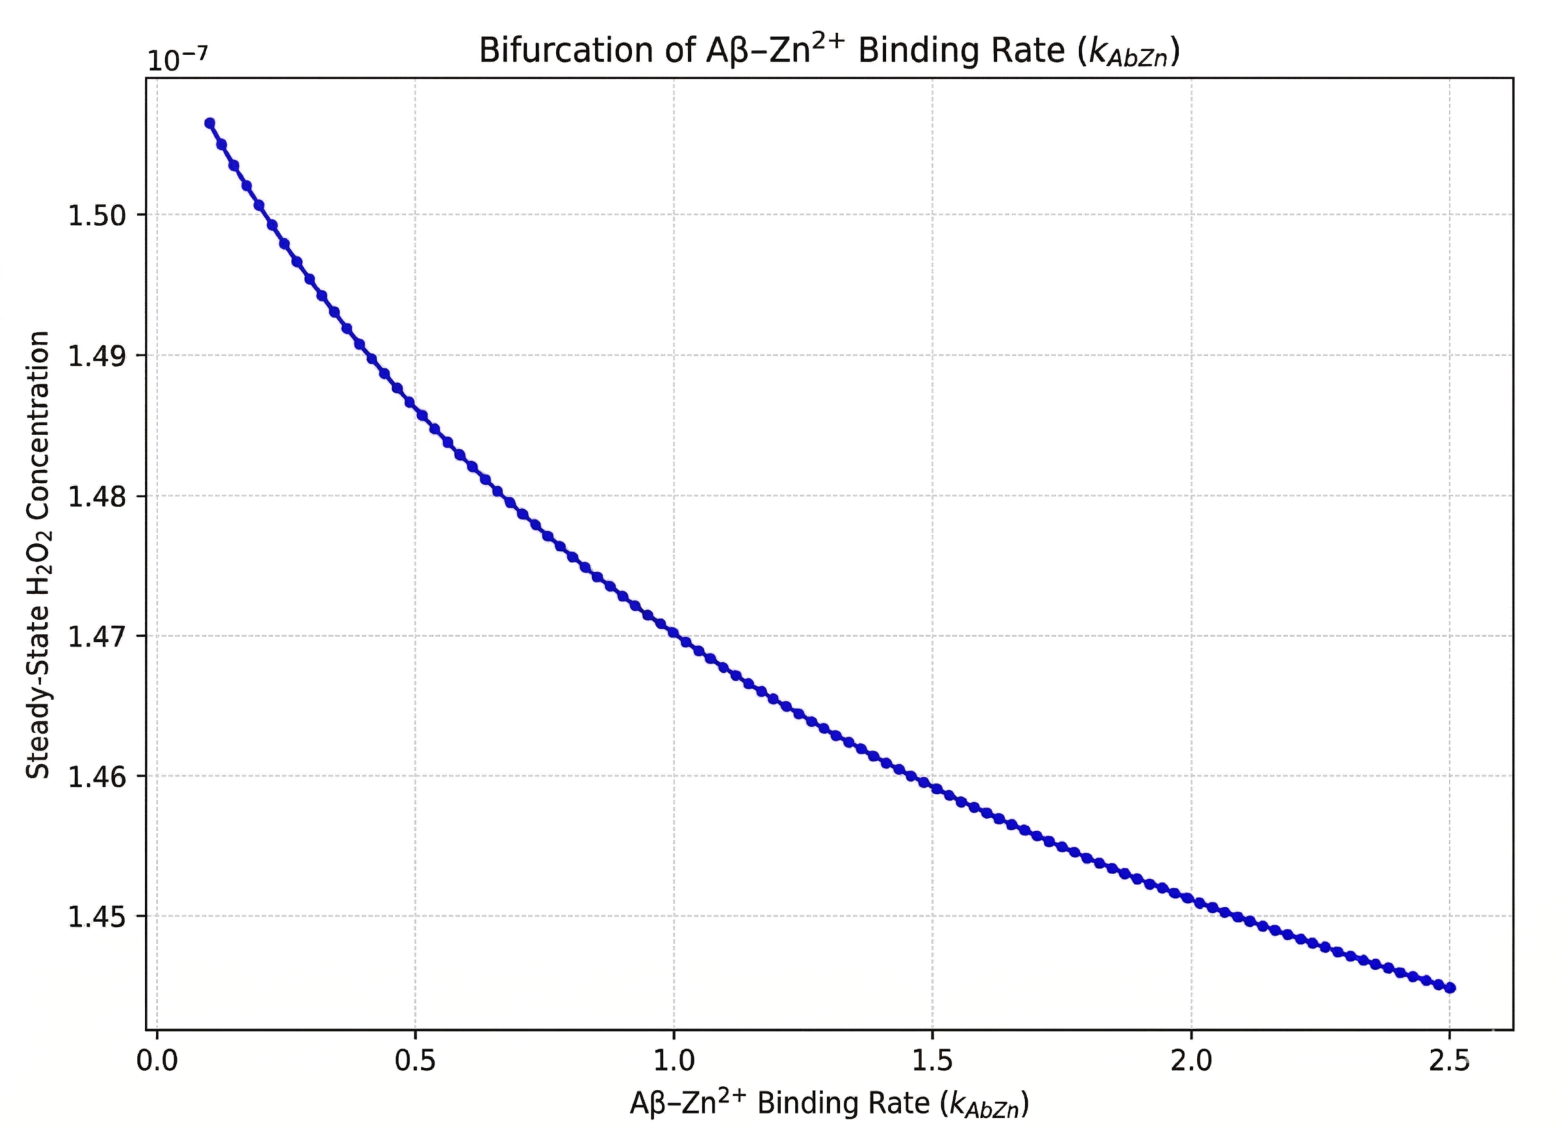
To examine how Zn binding influences oxidative tone, we swept the Aβ–Zn2+ binding rate (kAbZn) and recorded the steady–state H2O2 level:
Across k AbZn [ 0.1 , 2.5 ] , the steady–state H2O2 decreases smoothly as kAbZn increases, with a gently flattening slope at higher values (diminishing returns). We did not observe jumps, folds, or multiple steady states in this range; the same stable fixed point persists for all scanned parameters.
Interpretation. Stronger Aβ–Zn2+ binding slightly lowers H2O2, consistent with sequestration of Aβ away from redox–active metals. The effect saturates at large kAbZn, suggesting limited additional benefit beyond moderate increases (Figure 16).

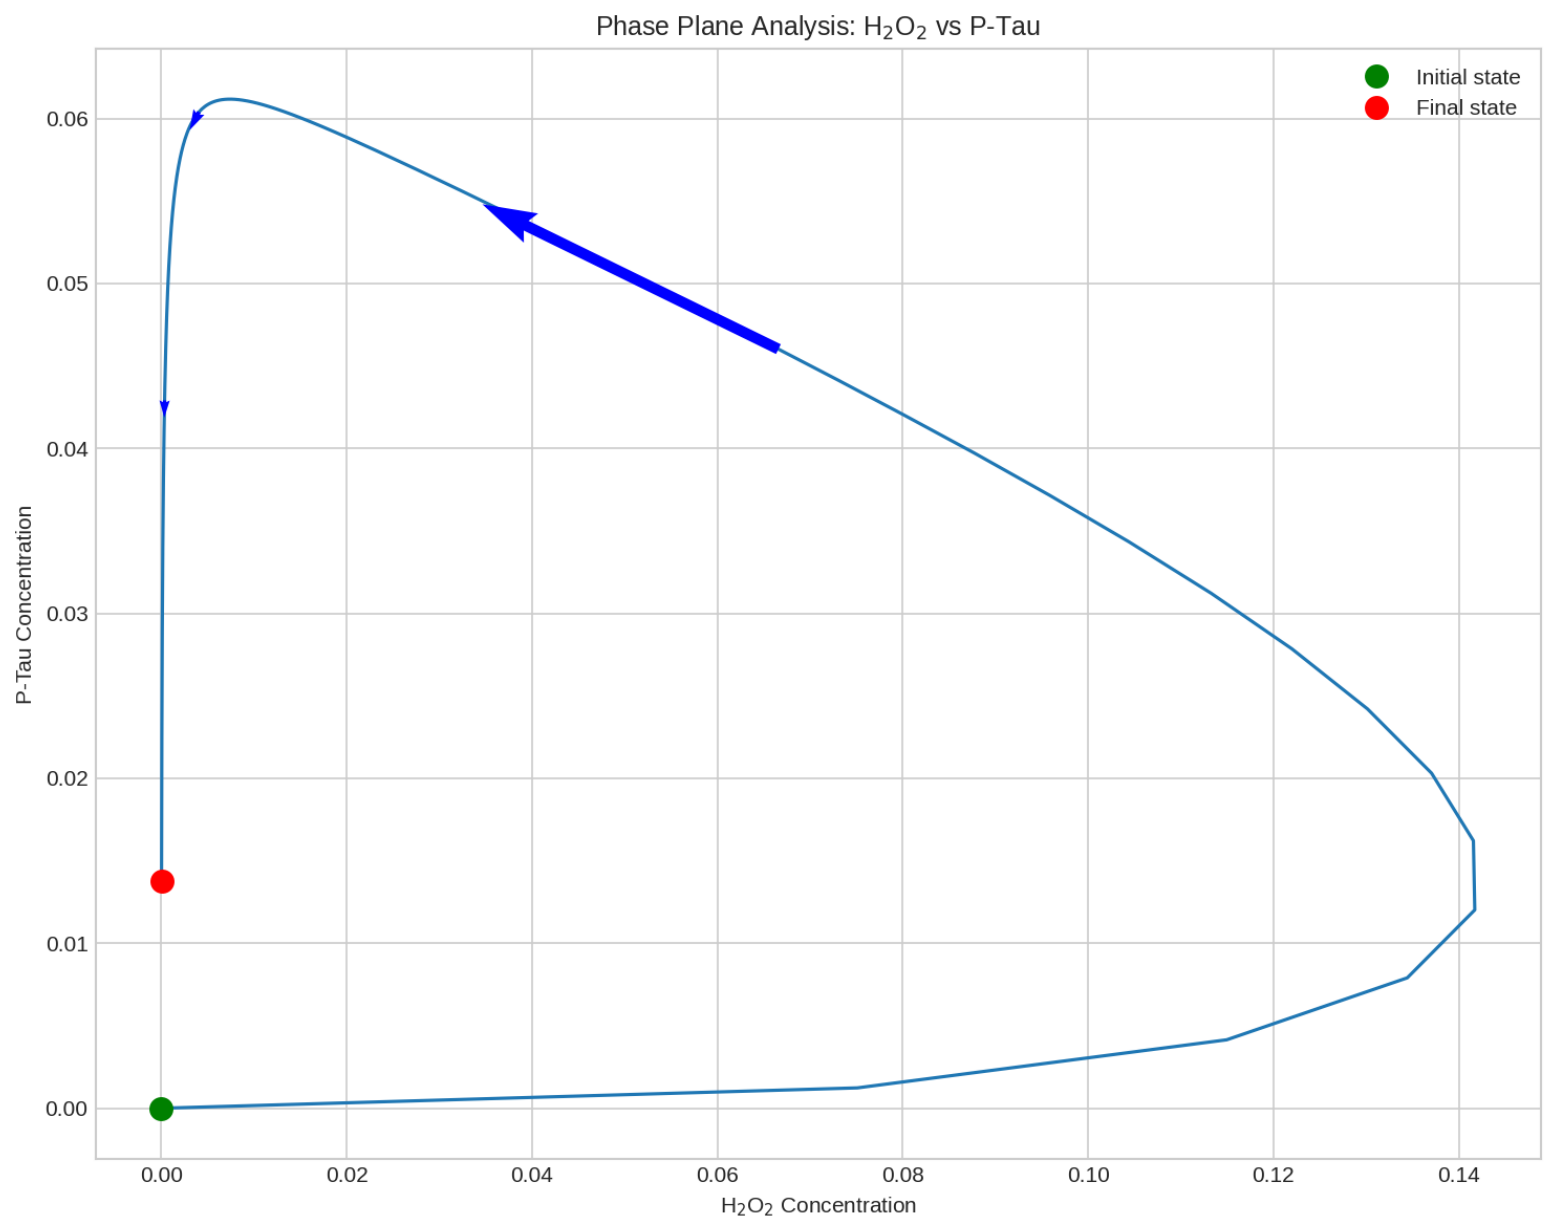
8.3. Phase Plane Analysis

To better understand the relationship between oxidative stress and tau pathology, we performed phase plane analysis of H2O2 and P-Tau:
The trajectory starts near ( low H 2 O 2 , low P - Tau ) , moves rapidly to higher H2O2 as P-Tau begins to rise, and then returns to low H2O2 while P-Tau peaks and relaxes to a small, nonzero plateau. This loop reflects a temporal lag between the H2O2 pulse and P-Tau dynamics; we did not observe multiple steady states or a tipping point in this analysis.
In the model, tau phosphorylation is driven by H2O2 ( r 14 j w ), and part of P-Tau is subsequently removed via Fe-Tau formation ( r 15 k m ). Consequently, the final state is low H2O2 with low residual P-Tau, not persistently high P-Tau (Figure 17).
Implication. Blunting the early H2O2 surge is predicted to lower the P-Tau peak and reduce overall P-Tau/Fe-Tau burden; the phase-plane loop visualizes this lagged, pulse-driven response rather than true hysteresis.

9. Therapeutic Intervention Simulations

To explore potential therapeutic strategies, we simulated three interventions:
1.
Metal Chelation (reducing Cu2+ and Fe2+ by 50%)
2.
Antioxidant Enhancement (increasing SOD, CAT, and GPx by 100%)
3.
Combination Therapy (both metal chelation and antioxidant enhancement)

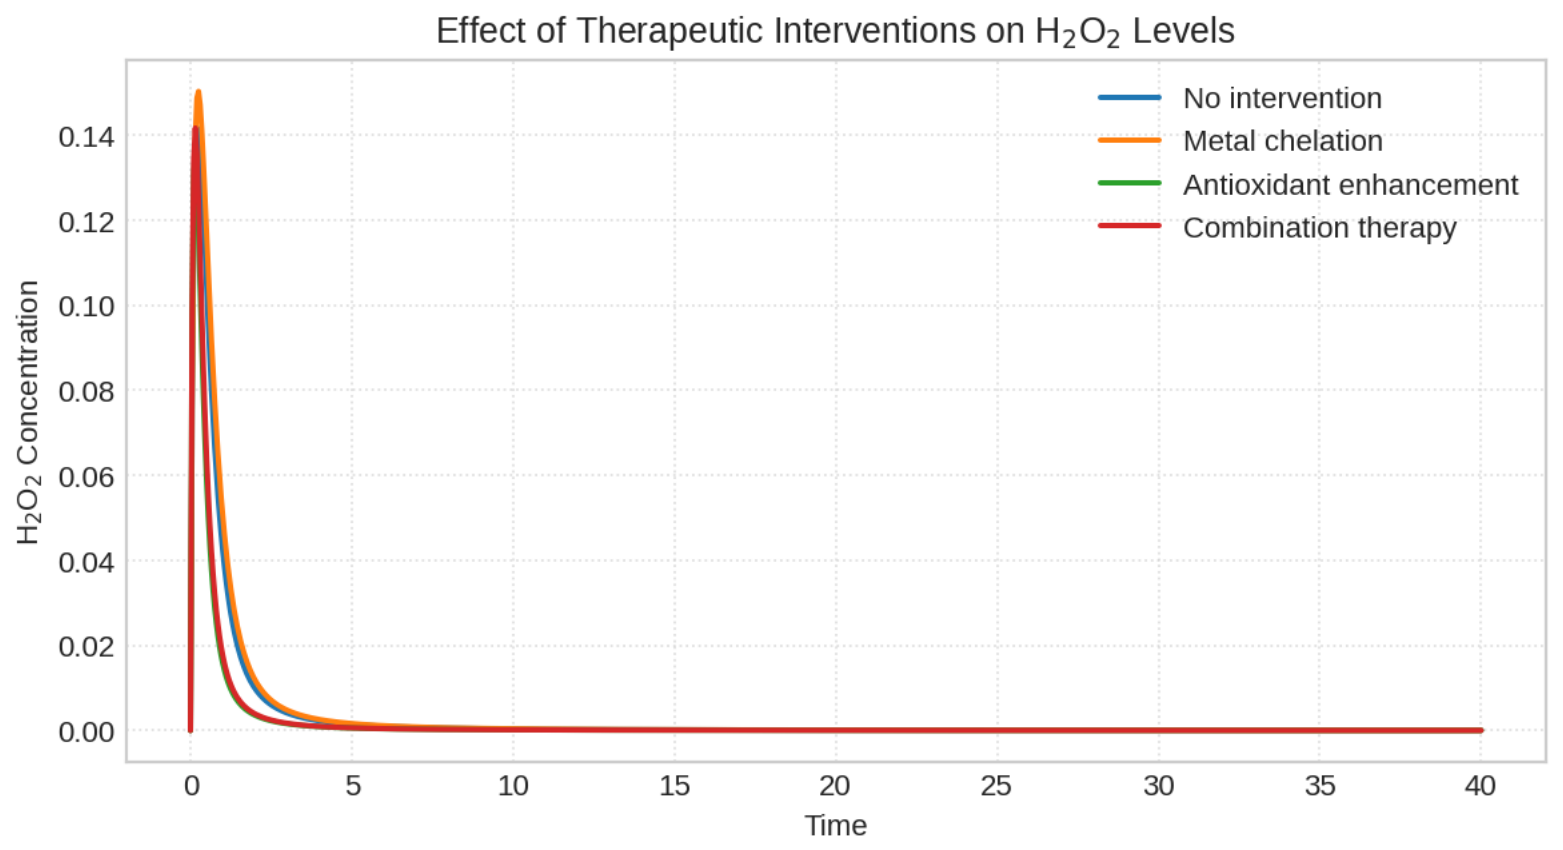
9.1. Effects on H2O2 Levels

The simulation results show that all three interventions reduce H2O2 levels compared to no intervention, but with different efficacies:
  • Metal chelation moderately reduces the H2O2 peak and accelerates its decline.
  • Antioxidant enhancement has a stronger effect, substantially reducing both the height and duration of the H2O2 peak.
  • Combination therapy shows the most dramatic effect, almost completely preventing the H2O2 peak.
These results suggest that while both metal chelation and antioxidant enhancement are beneficial individually, their combination produces synergistic effects in reducing oxidative stress (Figure 18).

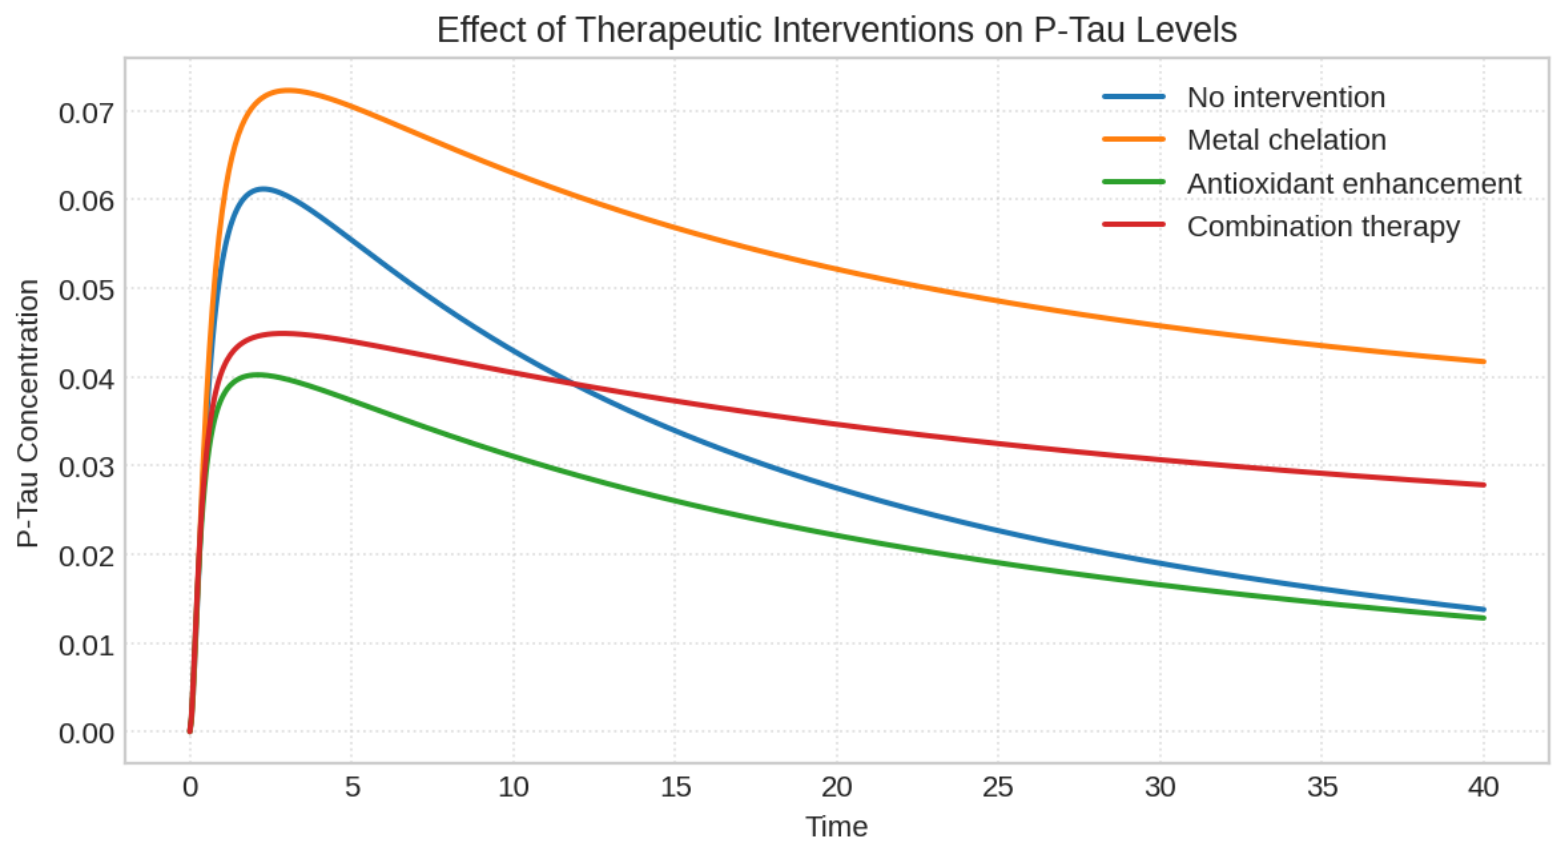
9.2. Effects on P-Tau Levels

Across interventions, P-Tau exhibits an early peak followed by a slow decline, with clear differences in magnitude:
  • Metal chelation (orange) has a higher peak and a slower decay than baseline. In the model, reducing Fe2+ limits formation of Fe3+ and thus weakens the clearance sink r 15 k m (P-Tau → Fe-Tau), leaving more P-Tau.
  • Antioxidant enhancement (green) has the lowest peak and the fastest decline, consistent with direct reduction of the phosphorylation drive r 14 j w via lower H2O2.
  • Combination (red) improves on baseline but is less effective than antioxidants alone, reflecting the tradeoff between reduced H2O2 (helpful) and reduced P-Tau → Fe-Tau conversion (harmful).
Thus, within this model, boosting peroxide-clearing capacity is the dominant lever for lowering P-Tau. Adding chelation does not guarantee further benefit unless its impact on both ROS production and P-Tau clearance is favorably balanced (Figure 19).

10. Discussion

10.1. Insights from the Expanded Model

Our expanded mathematical framework provides a mechanistic foundation for understanding the biochemical dynamics of metal-induced toxicity in Alzheimer’s disease (AD). The model elucidates how the differential binding affinities of metal ions for amyloid–beta (Aβ) create a hierarchical and competitive landscape that shapes complex formation and modulates oxidative tone. This hierarchy (Zn2+> Cu2+> Fe2+> Al3+) suggests that the relative availability and competition among metal species, rather than absolute levels alone, can steer downstream chemistry.
Simulations reveal an early oxidative pulse characterized by a rapid rise and fall of hydrogen peroxide (H2O2), which is buffered by catalase and glutathione peroxidase. Correspondingly, GSH shows a brief dip and stabilizes at a high plateau, while GSSG rises modestly to a low steady level. We did not observe a sustained, late phase dominated by hydroxyl radicals under the baseline parameters; rather, OH tracks the transient Fenton flux and subsides as H2O2 decays.
The temporal cascade reproduced by the model is consistent with an Aβ–centric ordering: metal-Aβ interactions precede an H2O2 pulse, which in turn drives a modest increase in phosphorylated tau (P-Tau), with a fraction subsequently sequestered as Fe-Tau. In this formulation, oxidative stress acts as a key intermediary linking upstream metal-Aβ chemistry to tau alterations, emphasizing the potential importance of early interventions that blunt the initial H2O2 surge.
Parameter sweeps highlight smooth, monotonic responses rather than sharp thresholds. For example, increasing Aβ–Zn2+ binding lowers steady–state H2O2 with diminishing returns; we did not detect multistability or bifurcation within the scanned range. Likewise, the phase–plane trajectory of (H2O2, P-Tau) exhibits a loop arising from temporal lag (H2O2 peaks before P-Tau), not true hysteresis.
Finally, therapeutic simulations show that enhancing peroxide–clearing capacity (CAT/GPx/GSH) consistently lowers the P-Tau peak and burden. Metal chelation alone can reduce ROS generation but may also weaken the modeled P-Tau→Fe-Tau sink, yielding higher P-Tau than baseline in our runs. Combination therapy therefore provides mixed effects: benefits from lowering H2O2, offset by reduced sequestration of P-Tau, so it is not uniformly superior to antioxidants alone.

10.2. Comparison with Experimental Findings

Several predictions align qualitatively with prior work. The rank order of metal effects on Aβ (with Zn2+ promoting aggregation most strongly, followed by Cu2+ and Fe2+) and the broader role of metals in modulating Aβ structure/aggregation are consistent with the biochemical and review literature [4,59,60,61].
The model’s event ordering—metal-Aβ chemistry preceding an oxidative episode, followed by tau changes—fits with observations that oxidative damage is an early feature of AD and with proposed biomarker cascades in which Aβ abnormalities lead to neurodegenerative changes [62,63,64]. The progressive topography of tau pathology we reference is grounded in classical Braak staging [65,66].
Finally, our in silico exploration of metal-modulating strategies echoes the rationale behind metal–protein attenuating approaches and second-generation ionophores; preclinical and early clinical studies illustrate the concept, though clinical efficacy remains mixed [30,67,68].

10.3. Limitations and Future Directions

Despite the novel insights afforded by our expanded model, several limitations warrant consideration. The model currently assumes a spatially homogeneous environment, neglecting brain region-specific differences in metal ion distribution, oxidative stress, and vulnerability. Incorporating spatial heterogeneity and diffusion processes may yield more physiologically accurate predictions.
The current framework also does not account for intracellular compartmentalization, although many relevant reactions occur in distinct cellular domains such as mitochondria, lysosomes, and the cytosol. A compartmentalized version of the model could provide further insight into subcellular pathophysiology.
Furthermore, the model captures only a subset of regulatory feedback loops, omitting many adaptive responses such as transcriptional regulation of metal transporters or upregulation of antioxidant enzymes in response to oxidative load. Expanding the model to incorporate these feedback mechanisms could enhance its explanatory power.
While deterministic in structure, the model does not incorporate stochastic effects, which may be critical in systems characterized by low molecular abundances or rare triggering events. Incorporating stochastic simulation methods could address this limitation.
Parameter uncertainty remains a challenge due to variability and scarcity in experimental rate constants. Future work should include robust parameter estimation techniques, such as Bayesian inference or machine learning-guided optimization, alongside sensitivity analyses to identify key determinants.
Ultimately, model predictions require empirical validation using in vitro systems, animal models, and clinical datasets. Such validation is essential not only for model refinement but also for translating insights into actionable therapeutic strategies.
Future extensions may include additional metal ions such as manganese or cobalt, more detailed modeling of Aβ aggregation pathways, the integration of genetic risk factors like APOE ε4, and simulations of candidate therapies, including metal-protein attenuating compounds, chelators, and antioxidants. Personalized modeling approaches leveraging patient-specific biomarker data represent a particularly promising avenue for translating the model into predictive tools for precision medicine.

10.4. Implications for Therapeutic Strategies

The mechanistic insights derived from our model have significant implications for therapeutic design in AD. Targeting metal dyshomeostasis emerges as a viable strategy, particularly by modulating the bioavailability of redox-active species such as Cu and Fe while preserving physiological levels of Zn. This could be achieved through metal chelators or metal-protein attenuating compounds with tailored selectivity profiles.
Antioxidant therapy, especially when deployed during the early oxidative phase characterized by elevated H2O2, holds promise for preventing downstream tau pathology. However, timing remains critical, as delayed intervention may not reverse established lesions due to hysteresis effects.
The model also supports the development of multi-target therapeutic regimens. Combination strategies that jointly mitigate metal overload and oxidative stress outperform single-agent therapies in simulations, producing additive or synergistic benefits across pathological endpoints.
Importantly, the identification of threshold effects and nonlinear transitions underscores the need for personalized intervention strategies. Therapeutic efficacy may depend strongly on individual biomarker profiles and stage of disease progression, highlighting the relevance of personalized medicine approaches.
Finally, the predictive power of our model emphasizes the importance of early detection and proactive treatment. Intervening before the establishment of irreversible tau pathology may represent the most effective window for therapeutic action. Collectively, these insights advocate for a therapeutic framework that is multifaceted, stage-sensitive, and personalized to the biochemical context of each patient.

11. Conclusions

This study presents a comprehensive mathematical model that integrates the multifaceted biochemical processes underpinning metal-induced toxicity in Alzheimer’s disease (AD). The framework incorporates multiple metal ions, competitive metal-Aβ interactions, antioxidant defense mechanisms, and tau protein phosphorylation, offering a unified system to interrogate the dynamic interplay among these pathological elements. By coupling analytical techniques with numerical simulations, we provide a detailed characterization of the nonlinear, multiscale dynamics that drive disease progression and therapeutic response.
A major contribution of this work lies in the development of a 24-equation system of coupled ordinary differential equations (ODEs) that captures the bidirectional interactions between metal ions, reactive oxygen species (ROS), antioxidant enzymes, Aβ peptides, and tau proteins. This formulation allowed for the construction of a 24 × 24 Jacobian matrix, whose eigenvalue analysis revealed the presence of a zero eigenvalue with multiplicity 21, indicating non-hyperbolic equilibrium behavior. As a result, we employed Runge-Kutta numerical methods to explore system trajectories and stability.
Our simulations illuminate several emergent features of AD pathogenesis. The differential binding affinities of metal ions for Aβ influence both aggregation propensity and the generation of oxidative species, while the biphasic nature of oxidative stress initially driven by hydrogen peroxide and later sustained by hydroxyl radicals mirrors experimental observations. Furthermore, the model recapitulates the temporal cascade of pathological events, with metal-Aβ binding preceding ROS production and culminating in tau phosphorylation, thereby aligning with the amyloid cascade hypothesis while underscoring oxidative stress as a critical intermediary.
Importantly, we identify threshold effects and nonlinear transitions that may underlie interindividual variability in disease progression. The presence of hysteresis in tau phosphorylation suggests that transient oxidative insults may lead to irreversible downstream damage, emphasizing the need for early intervention. Additionally, therapeutic simulations reveal synergistic effects when targeting both metal dysregulation and oxidative burden, offering support for multi-target therapeutic strategies.
Overall, this model advances our mechanistic understanding of AD and provides a predictive platform for evaluating therapeutic interventions. It emphasizes the importance of addressing both metal homeostasis and redox balance in tandem and suggests that timely, personalized treatment approaches will be essential for clinical efficacy. As our knowledge of AD deepens, mathematical modeling will remain an indispensable tool for synthesizing complex data, uncovering hidden regulatory patterns, and guiding experimental and clinical research toward more effective solutions.

Author Contributions

Conceptualization, S.Y.; Validation, L.G.M.; Formal analysis, L.G.M.; Investigation, L.G.M.; Writing—review & editing, S.Y.; Visualization, L.G.M.; Supervision, S.Y. All authors have read and agreed to the published version of the manuscript.

Funding

This research received no external funding.

Data Availability Statement

No new data were created or analyzed in this study. Data sharing is not applicable to this article.

Acknowledgments

All figures and computational analyses were conducted using Python (version 3.14) and MATLAB (R2024b), ensuring reproducibility and consistency of the results.

Conflicts of Interest

The authors declare that they have no competing interest. The author(s) have no financial or non-financial interests that could have influenced the work reported in this manuscript.

References

  1. Selkoe, D.J. Alzheimer’s disease: Genes, proteins, and therapy. Physiol. Rev. 2001, 81, 741–766. [Google Scholar] [CrossRef]
  2. Wang, L.; Yin, Y.L.; Liu, X.Z.; Shen, P.; Zheng, Y.G.; Lan, X.R.; Lu, C.B.; Wang, J.Z. Current understanding of metal ions in the pathogenesis of Alzheimer’s disease. Transl. Neurodegener. 2020, 9, 10. [Google Scholar] [CrossRef]
  3. Butterfield, D.A.; Swomley, A.M.; Sultana, R. Amyloid β-Peptide (1-42)-Induced Oxidative Stress in Alzheimer-Disease: Importance in Disease Pathogenesis and Progression. Neuropharmacology 2013, 76, 75–85. [Google Scholar]
  4. Abelein, A. Metal Binding of Alzheimer’s amyloid-beta (Aβ) and Its Effect on Peptide Self-Assembly. Accounts Chem. Res. 2023, 56, 1001–1013. [Google Scholar] [CrossRef] [PubMed]
  5. Faller, P.; Hureau, C. Bioinorganic chemistry of copper and zinc ions coordinated to amyloid-β peptide. Dalton Trans. 2009, 21, 1080–1094. [Google Scholar] [CrossRef] [PubMed]
  6. Chen, L.; Soldan, A.; Oishi, K.; Faria, A.; Zhu, Y.; Albert, M.; van Zijl, P.C.M.; Li, X. Quantitative Susceptibility Mapping of Brain Iron and β-Amyloid in MRI and PET Relating to Cognitive Performance in Cognitively Normal Older Adults. Radiology 2021, 298, 353–362. [Google Scholar] [CrossRef]
  7. Wang, Z.; Wei, X.; Yang, J.; Suo, J.; Chen, J.; Liu, X.; Zhao, X. Chronic exposure to aluminum and risk of Alzheimer’s disease: A meta-analysis. Neurosci. Lett. 2016, 610, 200–206. [Google Scholar] [CrossRef]
  8. Russ, T.C.; Killin, L.O.J.; Hannah, J.; Batty, G.D.; Deary, I.J.; Starr, J.M. Aluminium and fluoride in drinking water in relation to later dementia risk. Br. J. Psychiatry 2020, 216, 29–34. [Google Scholar] [CrossRef]
  9. Huang, X.; Atwood, C.S.; Hartshorn, M.A.; Multhaup, G.; Goldstein, L.E.; Scarpa, R.C.; Cuajungco, M.P.; Gray, D.N.; Lim, J.; Moir, R.D.; et al. The Aβ peptide of Alzheimer’s disease directly produces hydrogen peroxide by reducing Cu(II) or Fe(III). Biochemistry 1999, 38, 7609–7616. [Google Scholar] [CrossRef]
  10. Cheignon, C.; Tomas, M.; Bonnefont-Rousselot, D.; Faller, P.; Hureau, C.; Collin, F. Oxidative stress and the amyloid beta peptide in Alzheimer’s disease. Redox Biol. 2018, 14, 450–464. [Google Scholar] [CrossRef]
  11. Collin, F. Chemical Basis of Reactive Oxygen Species Reactivity and Involvement in Neurodegenerative Diseases. Int. J. Mol. Sci. 2019, 20, 2407. [Google Scholar] [CrossRef]
  12. Parthasarathy, S.; Yoo, B.; McElheny, D.; Tay, W.; Ishii, Y. Capturing a Reactive State of Amyloid Aggregates. J. Biol. Chem. 2014, 289, 9998–10010. [Google Scholar] [CrossRef]
  13. Gu, M.; Bode, D.C.; Viles, J.H. Copper Redox Cycling Inhibits Aβ Fibre Formation and Promotes Fibre Fragmentation, while Generating a Dityrosine Aβ Dimer. Sci. Rep. 2018, 8, 16190. [Google Scholar] [CrossRef] [PubMed]
  14. Girvan, P.; Teng, X.; Brooks, N.J.; Baldwin, G.S.; Ying, L. Redox Kinetics of the Amyloid-β–Cu Complex and Its Implications. Biochemistry 2018, 57, 6228–6233. [Google Scholar] [CrossRef] [PubMed]
  15. Cohen, S.I.A.; Linse, S.; Luheshi, L.M.; Hellstrand, E.; White, D.A.; Rajah, L.; Otzen, D.E.; Vendruscolo, M.; Dobson, C.M.; Knowles, T.P.J. Proliferation of amyloid-β42 aggregates occurs through a secondary nucleation mechanism. Proc. Natl. Acad. Sci. USA 2013, 110, 9758–9763. [Google Scholar] [CrossRef] [PubMed]
  16. Abelein, A.; Gräslund, A.; Danielsson, J. Zinc as chaperone-mimicking agent for retardation of amyloid β peptide fibril formation. Proc. Natl. Acad. Sci. USA 2015, 112, 5407–5412. [Google Scholar] [CrossRef]
  17. Zorov, D.B.; Juhaszova, M.; Sollott, S.J. Mitochondrial Reactive Oxygen Species (ROS) and ROS-Induced ROS Release. Physiol. Rev. 2014, 94, 909–950. [Google Scholar] [CrossRef]
  18. Youssef, P.; Chami, B.; Lim, J.; Middleton, T.; Sutherland, G.T.; Witting, P.K. Evidence supporting oxidative stress in a moderately affected area of the brain in Alzheimer’s disease. Sci. Rep. 2018, 8, 11553. [Google Scholar] [CrossRef]
  19. De Plano, L.M.; Calabrese, G.; Rizzo, M.G.; Oddo, S.; Caccamo, A. The Role of the Transcription Factor Nrf2 in Alzheimer’s Disease: Therapeutic Opportunities. Biomolecules 2023, 13, 549. [Google Scholar] [CrossRef]
  20. Bitra, V.R.; Moshapa, F.; Adiukwu, P.C.; Rapaka, D. Nrf2-Mediated Signaling as a Therapeutic Target in Alzheimer’s Disease. Open Neurol. J. 2024, 18, e1874205X319474. [Google Scholar] [CrossRef]
  21. Zhao, J.; Wei, M.; Guo, M.; Wang, M.; Niu, H.; Xu, T.; Zhou, Y. GSK3: A potential target and pending issues for treatment of Alzheimer’s disease. CNS Neurosci. Ther. 2024, 30, e14818. [Google Scholar] [CrossRef]
  22. Ao, C.; Li, C.; Chen, J.; Tan, J.; Zeng, L. The role of CDK5 in neurological disorders. Front. Mol. Neurosci. 2022, 16, 951202. [Google Scholar] [CrossRef]
  23. Rawat, P.; Sehar, U.; Bisht, J.; Selman, A.; Culberson, J.; Reddy, P.H. Phosphorylated Tau in Alzheimer’s Disease and Other Tauopathies. Int. J. Mol. Sci. 2022, 23, 12841. [Google Scholar] [CrossRef] [PubMed]
  24. Basheer, N.; Smolek, T.; Hassan, I.; Liu, F.; Iqbal, K.; Zilka, N.; Novak, P. Does modulation of tau hyperphosphorylation represent a reasonable therapeutic strategy for Alzheimer’s disease? From preclinical studies to the clinical trials. Mol. Psychiatry 2023, 28, 2197–2214. [Google Scholar] [CrossRef] [PubMed]
  25. Puri, I.K.; Li, L. Mathematical Modeling for the Pathogenesis of Alzheimer’s Disease. PLoS ONE 2010, 5, e15176. [Google Scholar] [CrossRef] [PubMed]
  26. Hao, W.; Friedman, A. Mathematical model on Alzheimer’s disease. BMC Syst. Biol. 2016, 10, 121. [Google Scholar] [CrossRef]
  27. Bossa, M.N.; Sahli, H. A multidimensional ODE-based model of Alzheimer’s disease progression. Sci. Rep. 2023, 13, 3162. [Google Scholar] [CrossRef]
  28. Moravveji, S.; Doyon, N.; Mashreghi, J.; Duchesne, S. A scoping review of mathematical models covering Alzheimer’s disease progression. Front. Neuroinform. 2024, 18, 1281656. [Google Scholar] [CrossRef]
  29. Patel, H.; Solanki, N.; Solanki, A.; Patel, M.; Patel, S.; Shah, U. Mathematical modelling of Alzheimer’s disease biomarkers: Targeting Amyloid beta, Tau protein, Apolipoprotein E and Apoptotic pathways. Am. J. Transl. Res. 2024, 16, 2777–2792. [Google Scholar] [CrossRef]
  30. Ritchie, C.W.; Bush, A.I.; Mackinnon, A.; Macfarlane, S.; Mastwyk, M.; MacGregor, L.; Kiers, L.; Cherny, R.; Li, Q.; Tammer, A.; et al. Metal-Protein Attenuation With Iodochlorhydroxyquin (Clioquinol) Targeting Aβ Amyloid Deposition and Toxicity in Alzheimer Disease: A Pilot Phase 2 Clinical Trial. Arch. Neurol. 2003, 60, 1685–1691, Erratum in Arch. Neurol. 2004, 61, 776, https://doi.org/10.1001/archneur.60.12.1685.. [Google Scholar] [CrossRef]
  31. Villemagne, V.L.; Rowe, C.C.; Barnham, K.J.; Cherny, R.; Woodward, M.; Bozinosvski, S.; Salvado, O.; Bourgeat, P.; Perez, K.; Fowler, C.; et al. A randomized, exploratory molecular imaging study targeting amyloid β with a novel 8-OH quinoline in Alzheimer’s disease: The PBT2-204 IMAGINE study. Alzheimer’s Dement. Transl. Res. Clin. Interv. 2017, 3, 622–635. [Google Scholar] [CrossRef] [PubMed]
  32. Sampson, E.L.; Jenagaratnam, L.; McShane, R. Metal protein attenuating compounds for the treatment of Alzheimer’s dementia. In Cochrane Database of Systematic Reviews; John Wiley & Sons, Ltd.: Hoboken, NJ, USA, 2014; p. CD005380. [Google Scholar] [CrossRef]
  33. Haass, C.; Selkoe, D.J. Soluble protein oligomers in neurodegeneration: Lessons from the Alzheimer’s amyloid β-peptide. Nat. Rev. Mol. Cell Biol. 2007, 8, 101–112. [Google Scholar] [CrossRef] [PubMed]
  34. Lovell, M.A.; Robertson, J.; Teesdale, W.; Campbell, J.; Markesbery, W.R. Copper, iron and zinc in Alzheimer’s disease senile plaques. J. Neurol. Sci. 1998, 158, 47–52. [Google Scholar] [CrossRef] [PubMed]
  35. Atwood, C.S.; Moir, R.D.; Huang, X.; Scarpa, R.C.; Bacarra, N.M.E.; Romano, D.M.; Hartshorn, M.; Tanzi, R.E.; Bush, A.I. Dramatic aggregation of Alzheimer Aβ by Cu(II) is induced by conditions representing physiological acidosis. J. Biol. Chem. 2000, 275, 18449–18454. [Google Scholar] [CrossRef]
  36. Smith, M.A.; Zhu, X.; Tabaton, M.; Liu, G.; McKeel, D.W., Jr.; Cohen, M.L.; Wang, X.; Siedlak, S.L.; Dwyer, B.E.; Hayashi, T.; et al. Increased iron and free radical generation in preclinical Alzheimer disease and mild cognitive impairment. J. Alzheimer’s Dis. 2010, 19, 363–372. [Google Scholar] [CrossRef]
  37. Castellani, R.J.; Moreira, P.I.; Perry, G.; Zhu, X. Iron: The Redox-active center of oxidative stress in Alzheimer disease. Neurochem. Res. 2012, 37, 1921–1929. [Google Scholar] [CrossRef]
  38. Brender, J.R.; Hartman, K.; Nanga, R.P.R.; Popovych, N.; de la Salud Bea, R.; Vivekanandan, S.; Marsh, E.N.G.; Ramamoorthy, A. Role of Zinc in Human Islet Amyloid Polypeptide Aggregation. J. Am. Chem. Soc. 2010, 132, 8973–8983. [Google Scholar] [CrossRef]
  39. Bush, A.I.; Pettingell, W.H.; Multhaup, G.; Paradis, M.D.; Vonsattel, J.P.; Gusella, J.F.; Beyreuther, K.; Masters, C.L.; Tanzi, R.E. Rapid induction of Alzheimer Aβ amyloid formation by zinc. Science 1994, 265, 1464–1467. [Google Scholar] [CrossRef]
  40. Perl, D.P.; Gajdusek, D.C.; Garruto, R.M.; Yanagihara, R.T.; Gibbs, C.J. Intraneuronal aluminum accumulation in amyotrophic lateral sclerosis and Parkinsonism-dementia of Guam. Science 1982, 217, 1053–1055. [Google Scholar] [CrossRef]
  41. Exley, C. The aluminium-amyloid cascade hypothesis and Alzheimer’s disease. In Alzheimer’s Disease: Cellular and Molecular Aspects of Amyloid β; Springer: Berlin/Heidelberg, Germany, 2006; pp. 225–234. [Google Scholar]
  42. Kawahara, M.; Kato-Negishi, M. Link between aluminum and the pathogenesis of Alzheimer’s disease: The integration of the aluminum and amyloid cascade hypotheses. Int. J. Alzheimer’s Dis. 2011, 2011, 276393. [Google Scholar] [CrossRef]
  43. Marcus, D.L.; Thomas, C.; Rodriguez, C.; Simberkoff, K.; Tsai, J.S.; Strafaci, J.A.; Freedman, M.L. Increased peroxidation and reduced antioxidant enzyme activity in Alzheimer’s disease. Exp. Neurol. 1998, 150, 40–44. [Google Scholar] [CrossRef] [PubMed]
  44. Iqbal, K.; Alonso, A.d.C.; Chen, S.; Chohan, M.O.; El-Akkad, E.; Gong, C.X.; Khatoon, S.; Li, B.; Liu, F.; Rahman, A.; et al. Tau pathology in Alzheimer disease and other tauopathies. Biochim. Biophys. Acta (BBA)-Mol. Basis Dis. 2005, 1739, 198–210. [Google Scholar] [CrossRef] [PubMed]
  45. Liu, F.; Iqbal, K.; Grundke-Iqbal, I.; Rossie, S.; Gong, C.X. Dephosphorylation of tau by protein phosphatase 5: Impairment in Alzheimer’s disease. J. Biol. Chem. 2005, 280, 1790–1796. [Google Scholar] [CrossRef] [PubMed]
  46. Yamamoto, A.; Shin, R.W.; Hasegawa, K.; Naiki, H.; Sato, H.; Yoshimasu, F.; Kitamoto, T. Iron (III) induces aggregation of hyperphosphorylated τ and its reduction to iron (II) reverses the aggregation: Implications in the formation of neurofibrillary tangles of Alzheimer’s disease. J. Neurochem. 2002, 82, 1137–1147. [Google Scholar] [CrossRef]
  47. Li, X.; Du, X.; Ni, J. Zn2+ Aggravates Tau Aggregation and Neurotoxicity. Int. J. Mol. Sci. 2019, 20, 487. [Google Scholar] [CrossRef]
  48. Lovell, M.A.; Markesbery, W.R. Oxidative damage in mild cognitive impairment and early Alzheimer’s disease. J. Neurosci. Res. 2005, 81, 105–111. [Google Scholar] [CrossRef]
  49. Reynolds, A.; Laurie, C.; Mosley, R.L.; Gendelman, H.E. Oxidative stress and the pathogenesis of neurodegenerative disorders. Int. Rev. Neurobiol. 2007, 82, 297–325. [Google Scholar]
  50. Hu, W.P.; Chang, G.L.; Chen, S.J.; Kuo, Y.M. Kinetic analysis of β-amyloid peptide aggregation induced by metal ions based on surface plasmon resonance biosensing. J. Neurosci. Methods 2006, 154, 190–197. [Google Scholar] [CrossRef]
  51. Mayes, J.; Tinker-Mill, C.; Kolosov, O.; Zhang, H.; Tabner, B.J.; Allsop, D. β-Amyloid fibrils in Alzheimer disease are not inert when bound to copper ions but can degrade hydrogen peroxide and generate reactive oxygen species. J. Biol. Chem. 2014, 289, 12056–12062. [Google Scholar] [CrossRef]
  52. Iqbal, K.; Liu, F.; Gong, C.X.; Grundke-Iqbal, I. Tau in Alzheimer Disease and Related Tauopathies. Curr. Alzheimer Res. 2010, 7, 656–664. [Google Scholar] [CrossRef]
  53. Branch, T.; Barahona, M.; Dodson, C.A.; Ying, L. Kinetic analysis reveals the identity of Aβ-metal complex responsible for the initial aggregation of Aβ in the synapse. ACS Chem. Neurosci. 2017, 8, 1970–1979. [Google Scholar] [CrossRef]
  54. Tougu, V.; Karafin, A.; Palumaa, P. Binding of zinc (II) and copper (II) to the full-length Alzheimer’s amyloid-β peptide. J. Neurochem. 2008, 104, 1249–1259. [Google Scholar] [CrossRef] [PubMed]
  55. Foreman-Mackey, D.; Hogg, D.W.; Lang, D.; Goodman, J. emcee: The MCMC hammer. Publ. Astron. Soc. Pac. 2013, 125, 306. [Google Scholar] [CrossRef]
  56. Johnson, J.A.; Johnson, D.A.; Bamba, A.D.; Lee, J.M.; Calkins, M.J. The Nrf2–ARE pathway: An indicator and modulator of oxidative stress in neurodegeneration. Ann. N. Y. Acad. Sci. 2008, 1147, 61–69. [Google Scholar] [CrossRef] [PubMed]
  57. Carr, J. Applications of Centre Manifold Theory; Springer Science & Business Media: Berlin/Heidelberg, Germany, 1981; Volume 35. [Google Scholar]
  58. Feinberg, M. Chemical reaction network structure and the stability of complex isothermal reactors—I. The deficiency zero and deficiency one theorems. Chem. Eng. Sci. 1987, 42, 2229–2268. [Google Scholar] [CrossRef]
  59. Maynard, C.J.; Bush, A.I.; Masters, C.L.; Cappai, R.; Li, Q.X. Metals and amyloid-beta in Alzheimer’s disease. Int. J. Exp. Pathol. 2005, 86, 147–159. [Google Scholar] [CrossRef]
  60. Atwood, C.S.; Scarpa, R.C.; Huang, X.; Moir, R.D.; Jones, W.D.; Fairlie, D.P.; Tanzi, R.E.; Bush, A.I. Characterization of copper interactions with Alzheimer amyloid beta peptides: Identification of an attomolar-affinity copper binding site on amyloid beta1-42. J. Neurochem. 2000, 75, 1219–1233. [Google Scholar] [CrossRef]
  61. Hane, F.; Leonenko, Z. Effect of metals on kinetic pathways of amyloid-beta aggregation. Biomolecules 2014, 4, 101–116. [Google Scholar] [CrossRef]
  62. Nunomura, A.; Perry, G.; Aliev, G.; Hirai, K.; Takeda, A.; Balraj, E.K.; Jones, P.K.; Ghanbari, H.; Wataya, T.; Shimohama, S.; et al. Oxidative damage is the earliest event in Alzheimer disease. J. Neuropathol. Exp. Neurol. 2001, 60, 759–767. [Google Scholar] [CrossRef]
  63. Jack, C.R., Jr.; Knopman, D.S.; Jagust, W.J.; Shaw, L.M.; Aisen, P.S.; Weiner, M.W.; Petersen, R.C.; Trojanowski, J.Q. Hypothetical model of dynamic biomarkers of the Alzheimer’s pathological cascade. Lancet Neurol. 2010, 9, 119–128. [Google Scholar] [CrossRef]
  64. Jack, C.R., Jr.; Knopman, D.S.; Jagust, W.J.; Petersen, R.C.; Weiner, M.W.; Aisen, P.S.; Shaw, L.M.; Vemuri, P.; Wiste, H.J.; Weigand, S.D.; et al. Tracking pathophysiological processes in Alzheimer’s disease: An updated hypothetical model of dynamic biomarkers. Lancet Neurol. 2013, 12, 207–216. [Google Scholar] [CrossRef]
  65. Braak, H.; Braak, E. Neuropathological stageing of Alzheimer-related changes. Acta Neuropathol. 1991, 82, 239–259. [Google Scholar] [CrossRef]
  66. Braak, H.; Braak, E. Staging of Alzheimer’s disease-related neurofibrillary changes. Neurobiol. Aging 1995, 16, 271–278, discussion 278–284. [Google Scholar] [CrossRef]
  67. Adlard, P.A.; Cherny, R.A.; Finkelstein, D.I.; Gautier, E.; Robb, E.; Cortes, M.; Volitakis, I.; Liu, X.; Smith, J.P.; Perez, K.; et al. Rapid restoration of cognition in Alzheimer’s transgenic mice with 8-hydroxy quinoline analogs is associated with decreased interstitial Aβ. Neuron 2008, 59, 43–55. [Google Scholar] [CrossRef]
  68. Lannfelt, L.; Blennow, K.; Zetterberg, H.; Batsman, S.; Ames, D.; Harrison, J.; Masters, C.L.; Targum, S.; Bush, A.I.; Murdoch, R.; et al. Safety, efficacy, and biomarker findings of PBT2 in targeting Aβ as a modifying therapy for Alzheimer’s disease: A phase IIa, double-blind, randomised, placebo-controlled trial. Lancet Neurol. 2008, 7, 779–786, Erratum in Lancet Neurol. 2009, 8, 981, https://doi.org/10.1016/S1474-4422(08)70167-4.. [Google Scholar] [CrossRef]
Figure 1. Marginal posterior distributions for the 13 rate parameters obtained via MCMC sampling. The navy line represents the posterior median, the dashed red line indicates the MAP estimate, and the shaded region denotes the 95% credible interval.
Mathematics 14 01390 g001
Figure 2. Bayesian model fit against experimental time-series data. Black markers represent empirical data points with 95% confidence bounds. The red solid line is the deterministic trajectory simulated using the MAP parameter estimates, while the blue shaded region indicates the 95% posterior predictive distribution (PPD) derived from the MCMC ensemble [50,51,52,53,54].
Mathematics 14 01390 g002
Figure 3. Temporal dynamics of SOD, CAT, and GPx under the three physiological regimes compared to the fixed-enzyme baseline. In the Healthy regime, enzymes successfully upregulate to combat ROS. In Severe AD, the enzymes suffer rapid initial depletion due to oxidative inactivation and fail to recover, leading to antioxidant exhaustion.
Mathematics 14 01390 g003
Figure 4. Consequences of enzyme exhaustion on reactive oxygen species and glutathione reserves. The failure of the enzyme system in Severe AD leads to massive accumulation of hydroxyl radicals (r) and deeper depletion of the GSH pool (h).
Mathematics 14 01390 g004
Figure 5. Impact of dynamic antioxidant capacity on tau pathology. Severe enzyme exhaustion accelerates the hyperphosphorylation of tau (k) and drastically increases the terminal burden of neurotoxic Fe-Tau complexes (l).
Mathematics 14 01390 g005
Figure 6. Phase portrait of SOD concentration (e) versus H2O2 concentration (w). Circles indicate initial states, and squares indicate final steady states. The Severe AD trajectory (red) is pulled into a pathological attractor characterized by high ROS and low enzyme availability.
Mathematics 14 01390 g006
Figure 7. Dynamics of Aβ and metal complexes. The graph shows the temporal evolution of free Aβ and its complexes with Cu2+, Zn2+, Fe2+, and Al3+.
Mathematics 14 01390 g007
Figure 8. Oxidative stress dynamics. The graph shows the temporal evolution of superoxide ( O 2 ), hydrogen peroxide (H2O2), and hydroxyl radical (OH) concentrations.
Mathematics 14 01390 g008
Figure 9. Temporal evolution of Tau, phosphorylated Tau (P-Tau), and iron–bound Tau (Fe-Tau).
Mathematics 14 01390 g009
Figure 10. Temporal evolution of reduced glutathione (GSH), oxidized glutathione (GSSG), and hydrogen peroxide (H2O2).
Mathematics 14 01390 g010
Figure 11. Metal ion dynamics. The graph shows the temporal evolution of free Cu2+, Fe2+, Fe3+, Zn2+, and Al3+ concentrations.
Mathematics 14 01390 g011
Figure 12. Schematic representation of metal ion dynamics in Alzheimer’s disease, showing competitive binding, redox transitions, and interactions with Aβ and tau proteins.
Mathematics 14 01390 g012
Figure 13. Sensitivity analysis of the Aβ–Zn2+ binding rate (kAbZn). The graph shows the effect of varying kAbZn on H2O2 levels.
Mathematics 14 01390 g013
Figure 14. Sensitivity analysis of SOD activity (kSOD). The graph shows the effect of varying kSOD on H2O2 levels.
Mathematics 14 01390 g014
Figure 15. Sensitivity analysis of the tau phosphorylation rate (kτ-phos). The graph shows the effect of varying kτ-phos on H2O2 levels.
Mathematics 14 01390 g015
Figure 16. Steady–state H2O2 versus the Aβ–Zn2+ binding rate (kAbZn).
Mathematics 14 01390 g016
Figure 17. Phase plane of H2O2 vs. P-Tau. The trajectory is shown with arrows indicating forward time.
Mathematics 14 01390 g017
Figure 18. Effect of therapeutic interventions on H2O2 levels. The graph shows H2O2 concentrations over time for no intervention, metal chelation, antioxidant enhancement, and combination therapy.
Mathematics 14 01390 g018
Figure 19. P-Tau over time under four scenarios: no intervention, metal chelation, antioxidant enhancement, and combination therapy.
Mathematics 14 01390 g019
Table 1. Key reactions involving Aβ, metal ions, and reactive oxygen species in Alzheimer’s pathology.
ReactionDescription
A β + Cu 2 + r 1 A β - Cu 2 + Formation of copper-bound amyloid-beta (Aβ-Cu2+).
A β - Cu 2 + r 2 A β - Cu + + oxidized A β Reduction of Cu2+ to Cu+ within the Aβ-Cu complex, accompanied by the oxidation of Aβ.
A β - Cu + + O 2 r 3 A β - Cu 2 + + O 2 Superoxide radical ( O 2 ) generation via reaction of the reduced Aβ-Cu+ complex with molecular oxygen.
2 O 2 + 2 H + r 4 H 2 O 2 + O 2 Dismutation of superoxide radicals to produce hydrogen peroxide (H2O2) and molecular oxygen.
Fe 2 + + H 2 O 2 r 5 Fe 3 + + OH + OH Fenton reaction: Fe 2 + reacts with hydrogen peroxide, generating hydroxyl radicals (OH), a key contributor to oxidative stress.
Table 2. List of variables representing species concentrations.
VarDescriptionVarDescriptionVarDescription
xAβyCu2+zAβ-Cu2+
u O 2 vH+wH2O2
sO2pFe2+qOH
rOHmFe3+aZn2+
bAβ-Zn2+cAl3+dAβ-Al3+
eSODfCATgGPx
hGSHiGSSGjTau
kP-TaulFe-TaunAβ-Fe2+
Table 3. The complete signed stoichiometric matrix N mapping the 24 species to the 13 reactions.
Species R 1 R 2 R 3 R 4 R 5 R 6 R 7 R 8 R 9 R 10 R 11 R 12 R 13
x (Aβ) − 1 00 − 1 − 1 − 1 0000000
y (Cu2+) − 1 000001 − 1 00000
z (Aβ-Cu2+)100000 − 1 100000
u ( O 2 )0 − 2 000000 − 2 0000
v (H+)0 − 2 000000 − 2 0000
w (H2O2)01 − 1 000001 − 2 − 1 − 1 0
s (O2)0100000011000
p (Fe2+)00 − 1 00 − 1 0000000
q (OH)0010000000000
r (OH)0010000000000
m (Fe3+)001000000000 − 1
a (Zn2+)000 − 1 00 − 1 100000
b (Aβ-Zn2+)0001001 − 1 00000
c (Al3+)0000 − 1 00000000
d (Aβ-Al3+)0000100000000
e (SOD)0000000000000
f (CAT)0000000000000
g (GPx)0000000000000
h (GSH)0000000000 − 2 00
i (GSSG)0000000000100
j (Tau)00000000000 − 1 0
k (P-Tau)000000000001 − 1
l (Fe-Tau)0000000000001
n (Aβ-Fe2+)0000010000000
Table 4. Posterior parameter estimates from Bayesian MCMC inference. Values represent normalized dimensionless rate constants.
ParameterDescriptionMAP EstimatePosterior Median95% Credible Interval
r1Aβ–Cu2+ binding 1.00 0.95 [0.16, 5.23]
r4Baseline SOD dismutation 1.00 1.01 [0.17, 5.73]
r5Fenton reaction (H2O2 + Fe2+) 1.00 1.02 [0.16, 6.19]
r6Aβ–Zn2+ binding 1.25 1.16 [0.21, 7.47]
r7Aβ–Al3+ binding 0.63 0.66 [0.10, 3.83]
r8Aβ–Fe2+ binding 0.77 0.87 [0.14, 5.21]
r9Cu → Zn exchange on Aβ 0.39 0.46 [0.08, 3.08]
r10Zn → Cu exchange on Aβ 0.39 0.30 [0.05, 1.74]
r11SOD catalytic multiplier 2.00 2.14 [0.34, 12.92]
r12Catalase activity rate 1.54 1.56 [0.23, 10.19]
r13Glutathione peroxidase rate 1.00 1.03 [0.17, 5.32]
r14Tau phosphorylation rate 0.60 0.55 [0.09, 3.22]
r15 Fe3+ + P - Tau → Fe - Tau 0.81 0.81 [0.13, 4.95]
Table 5. Eigenvalue structure of the Jacobian matrix at the equilibrium manifold.
EigenvalueExpression at EquilibriumStability ConditionMultiplicity
λ1 − (r1y + r6a + r7c) Strictly negative (stable)1
λ2 − (2r12f + r13gh + r14j) Strictly negative (stable)1
λ3 − (r9a + r10b) Strictly negative (stable)1
λ 4 λ 24 0Center directions (conserved quantities)21
Table 6. Physical origin of the 21 zero eigenvalues of J.
SourcePhysical MechanismCount
Accumulation variabless, q, r, d, i, l, n have no self-feedback at E 7
Constant enzymese, f, g are identically constant (de/dt = df/dt = dg/dt = 0)3
u-v symmetrydu/dt = dv/dt and v = 0 eliminates the u-direction2
Cu-Zn exchangeOne neutral direction along the equilibrium curve in the (y, a)-plane1
Tau dynamicsdj/dt = − r14jw = 0 at w = 01
GSH dynamicsdh/dt = − 2r13wgh = 0 at w = 01
Fe3+-P-Tau ( m ˙ ) / m = r 15 k = 0 when k = 0; coupled modes6
Total21
Disclaimer/Publisher’s Note: The statements, opinions and data contained in all publications are solely those of the individual author(s) and contributor(s) and not of MDPI and/or the editor(s). MDPI and/or the editor(s) disclaim responsibility for any injury to people or property resulting from any ideas, methods, instructions or products referred to in the content.