1. Introduction
Scalar-on-function regression (SoFR) is a fundamental approach for modeling the relationship between a scalar response and functional covariates [
1,
2]. Since functional covariates are inherently infinite-dimensional, dimension reduction is required before regression analysis can be conducted. Common approaches include a priori basis expansions, such as B-splines or Fourier bases [
3], and functional principal component analysis (FPCA), which decomposes the covariance structure of functional covariates and summarizes the dominant modes of variation through a finite set of functional principal component (FPC) scores [
4,
5]. By projecting functional covariates onto a finite-dimensional basis or FPC space, SoFR can be reformulated as a regression of the scalar response on the corresponding basis coefficients or FPC scores. However, in many practical applications, functional covariates are observed with measurement error arising from instrument noise or other sources. In such cases, the observed functional variables serve only as surrogates for the underlying latent processes. Naively performing regression based on these contaminated observations, or even presmoothing the functional covariates, may result in biased estimation and misleading inference [
6]. Therefore, properly accounting for measurement error is essential for valid estimation and reliable inference in SoFR.
Measurement error in multivariate regression has been well studied [
7]. However, its extension to SoFR remains challenging. On the one hand, SoFR typically assumes that measurement error in the functional covariates is white noise [
8,
9]. In practice, however, measurement error in functional covariates is often a stochastic process. This discrepancy between the assumption and the reality may lead to biased estimation. On the other hand, although some studies have accounted for more complex measurement error structures, additional assumptions are usually required to ensure model identifiability. For example, Ref. [
10] proposed a simulation-extrapolation approach (SIMEX) for SoFR with correlated measurement errors in functional covariates under parametric assumptions on the covariance structure. Ref. [
11] studied SoFR with a more general correlation structure of measurement error by assuming that the ratio of measurement error variance to model error variance is known. Instrumental variables have also been used to provide additional information to ensure identifiability in SoFR with measurement error [
6,
12,
13]. Nevertheless, these approaches rely on specific assumptions or supplementary information to achieve identifiability, which may pose practical challenges depending on the data structure.
In this paper, we consider scalar-on-function regression models in which functional covariates are observed through replicated measurements. Such a setting naturally arises in applications where the same underlying process is measured repeatedly using different instruments or models. For example, meteorological variables such as precipitation or temperature are often obtained from multiple forecast models or observation systems, each providing a noisy surrogate of the true environmental process. The availability of replicated functional measurements provides additional information that can be exploited to disentangle the latent functional signal from measurement error, offering a principled approach to address identifiability issues that commonly arise in functional measurement error models. Building on this setting, we develop a likelihood-based scalar-on-function regression framework that explicitly incorporates replicated functional covariates. In linear or multivariate measurement error models with replicated observations, likelihood-based estimation has been studied [
14,
15,
16]. However, there has been limited work on functional regression models with replicated observations. Recently, Ref. [
17] studied a partially functional quantile regression with measurement errors in functional covariates. They used replicated observations to estimate and identify the covariance functions of both the latent functional covariate and the measurement error, and then applied SIMEX to estimate the regression parameters. Ref. [
18] similarly estimated the covariance function of the functional measurement error using repeated surrogate measurements before adjusting for bias due to measurement error in functional quantile regression models. In this work, our aim is to jointly estimate the regression parameters as well as the covariance structures of the measurement error and the true functional covariate. This distinguishes our work from previously proposed two-stage approaches.
Our approach makes the following contributions. First, by treating replicated functional measurements as surrogates of an underlying latent functional process, we formulate a measurement error model that is identifiable without requiring prior knowledge of the measurement error variance. This distinguishes our framework from existing approaches that rely on external error information or instrumental variables. Second, we project both the latent functional covariates and their noisy replicates onto a common FPCA basis, thereby reducing the infinite-dimensional regression problem to a finite-dimensional hierarchical linear measurement error model while preserving the dominant functional structure. Third, we propose an expectation-maximization (EM) algorithm for parameter estimation, in which the latent FPC scores are treated as unobserved variables. This estimation strategy enables joint inference on regression coefficients and measurement error components, extending repeated measurement ideas from multivariate regression to the SoFR setting.
The remainder of this paper is organized as follows.
Section 2 introduces the SoFR model with replicated functional covariates, and presents the FPCA-based representation and the estimation procedure.
Section 3 reports simulation studies assessing finite-sample performance.
Section 4 illustrates the proposed methodology through an application to the prediction of crop yield using meteorological data.
Section 5 concludes with a discussion of potential extensions.
3. Simulation Study
To assess the impact of measurement error in functional covariates on scalar-on-function regression, the latent functional predictors are represented using two orthonormal basis functions,
, defined on the interval
and evaluated at 51 equally spaced grid points. The corresponding FPC scores
are independently generated from a bivariate normal distribution with mean zero and covariance matrix
. To emulate functional measurement error,
noisy replications are generated for each trajectory by adding independent Gaussian perturbations
to the true component scores. The resulting functional observations take the form
In addition to the functional predictors, two independent scalar covariates
are generated from a standard bivariate normal distribution. The scalar response is specified as
with
,
,
, and
. The primary parameters of interest are the regression coefficients
and the slope function
.
After generating
(
), we apply four estimation methods: the naive simple regression, the adjusted estimator, the SIMEX estimator, and the proposed EM-based bias-corrected FPCR estimator. For each method, we record the empirical bias and root mean squared error (RMSE) of
, together with the integrated square error (ISE) of
, based on 1000 Monte Carlo replications. Results are reported for two sample sizes (
and
) and two levels of measurement error characterized by the signal-to-noise ratio (SNR). The medium-measurement error scenario corresponds to
, while the high-error scenario corresponds to
. In the medium-error scenario, the SNR is:
,
, while in the high-error scenario, the SNR is:
,
. We note that these values of
are only used for parameter generation and are not assumed known, while
is estimated from the replicated functional measurements as described in
Section 2.4.
Table 1 summarizes the estimation results in the medium-measurement error scenario. The simple regression exhibits noticeable attenuation bias in the estimation of both regression coefficients and the slope function, and this bias does not decrease with increasing sample size. As expected, all three correction methods lead to clear improvements over the simple regression, indicating the importance of accounting for measurement error in functional covariates. Under this setting, the adjusted estimator and the EM-based estimator perform similarly. Both methods substantially reduce bias and RMSE for the regression coefficients and yield much smaller ISEs for the slope function. Their performance improves as the sample size increases. The SIMEX estimator also improves upon the simple regression, but it remains less accurate than the other two correction methods, particularly when the sample size is large.
Table 2 lists the results in the high-measurement error scenario. As the level of measurement error increases, the differences among the correction methods become more evident. Although the adjusted estimator continues to reduce bias relative to the simple regression and SIMEX, its estimation accuracy deteriorates compared to the EM-based estimator. In contrast, the EM-based estimator achieves smaller bias and RMSE for the regression coefficients and lower ISEs for the slope function across both sample sizes. These improvements become more pronounced as the sample size increases. Overall, the results suggest that although the adjusted and EM-based estimators perform comparably under moderate measurement error, the EM-based maximum likelihood approach provides more reliable estimation when measurement error is severe.
Under the EM algorithm, we also evaluate the estimation of measurement error variances in both of the two error scenarios. Under the medium-error scenario, the RMSE decreases from approximately for to for , while the MAD decreases from to . Under the high-error scenario, the RMSE decreases from about to , and the MAD from to , indicating substantial improvement in estimation precision with increasing sample size.
In
Section 2.2, we discussed the relationship between bias and the number of repeated measurements
q in accordance with Equation (
9). To further examine this relationship, we examine the estimation performance for
under the high-measurement-error scenario, with
,
and signal-to-noise ratio of
. For each value of
q, 1000 Monte Carlo simulations are performed.
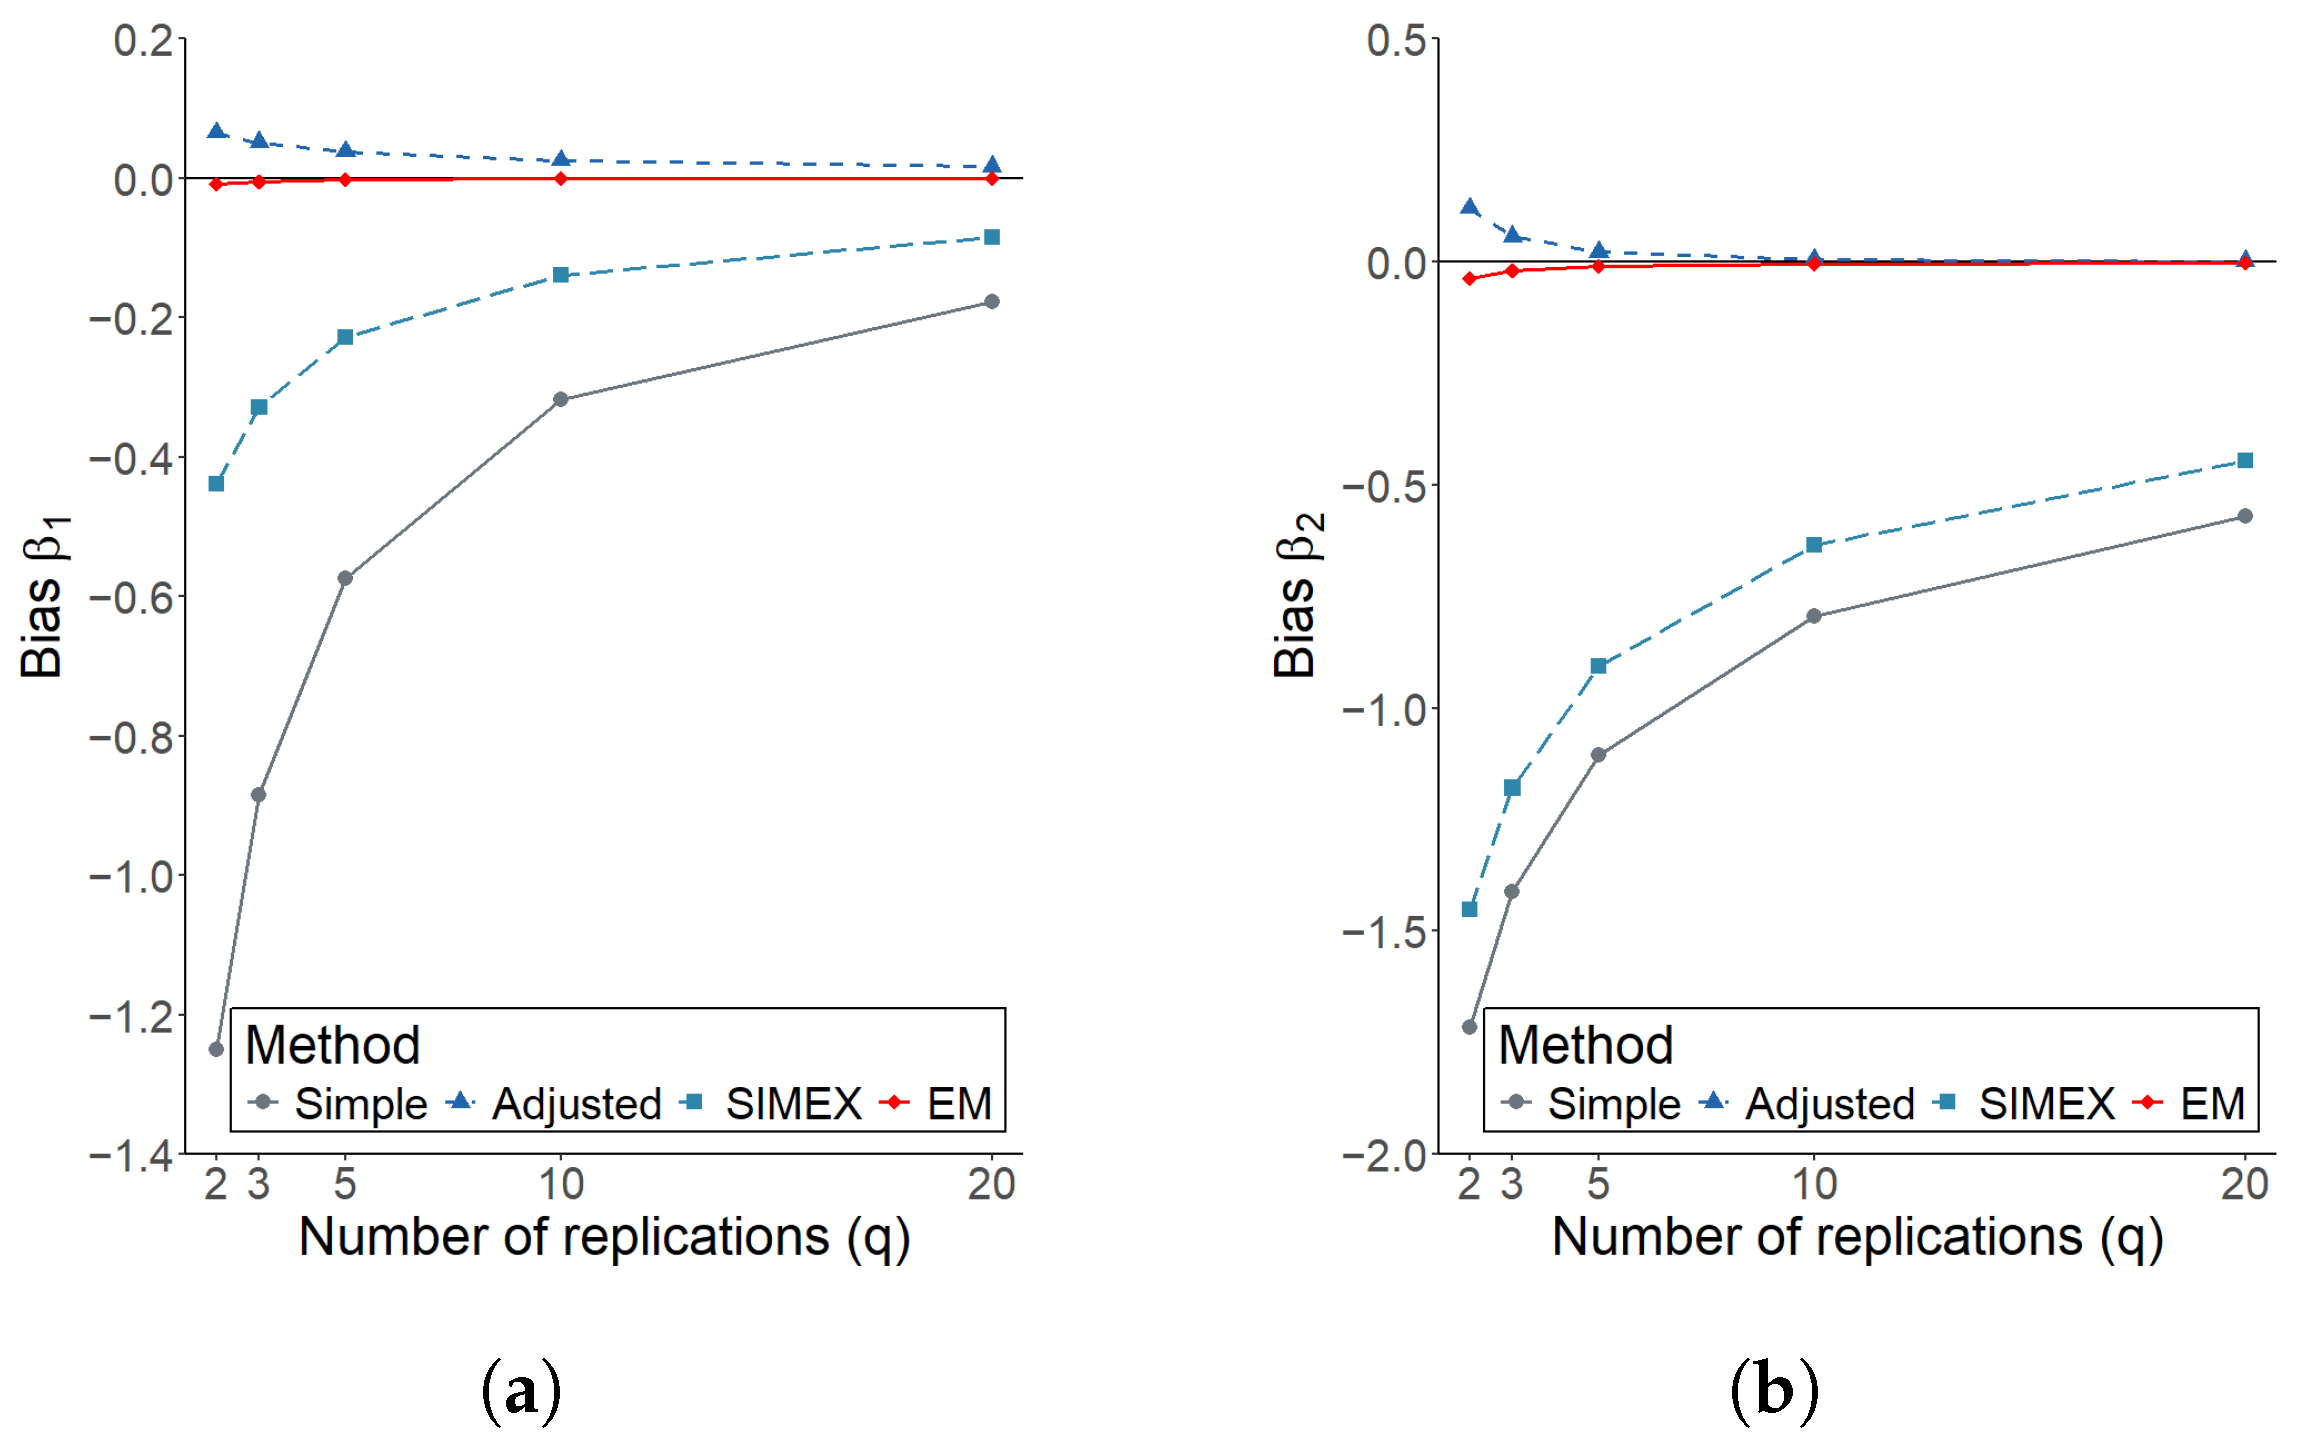
Figure 1 summarizes the estimation bias of the four methods for the parameters
and
across different numbers of replicates
q. It shows that Simple and SIMEX estimators exhibit noticeable bias that persists or slightly increases with more replicates, while Adjusted quickly becomes unbiased and EM remains near-zero across all
q.
We further focus on the relationship between the number of replicates
q and estimation accuracy.
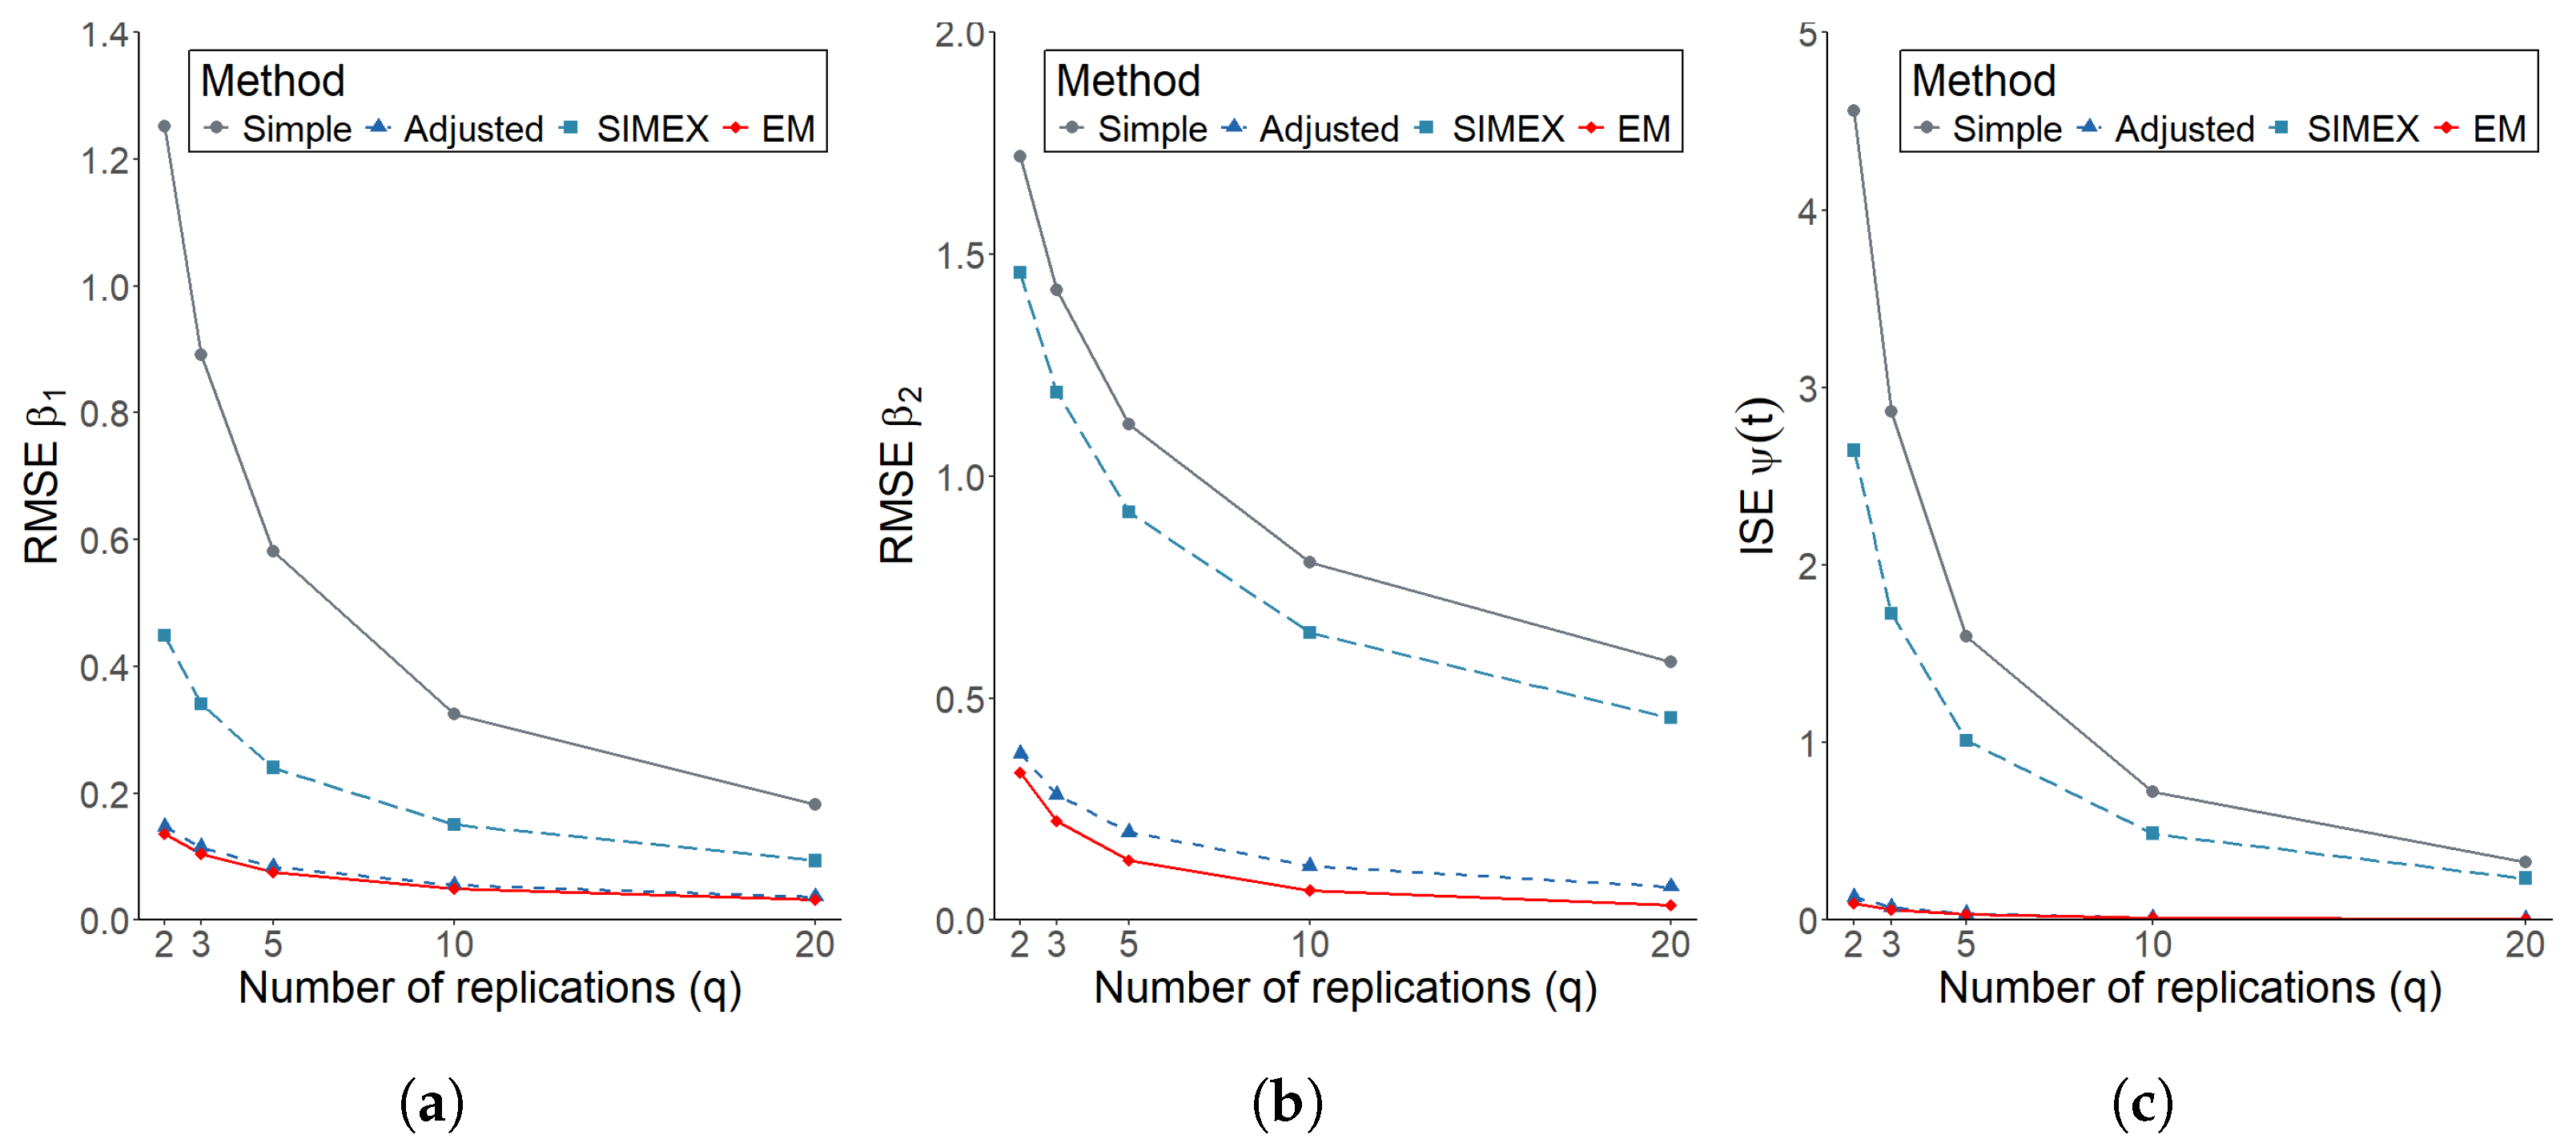
Figure 2 present the RMSE of
and
and the ISE of the slope function
across varying
q, showing that estimation errors decrease with more replicates for all methods. Simple exhibits the highest errors, SIMEX is intermediate, Adjusted is low, and EM consistently achieves the lowest errors and is least sensitive to
q.
It is interesting to note that while our model is developed under the normality assumption for the latent FPC scores, in practice the data may exhibit heavy tails or other deviations from normality. To investigate the impact of such deviations on model performance, we consider two alternative distributional scenarios that preserve the original marginal variances. For the heavy-tailed scenario,
are generated from a bivariate Student’s
t distribution with 5 degrees of freedom. The scale is chosen according to the standard variance relationship for a
t-distribution:
where
denotes the corresponding diagonal entry of
.
For the skewed scenario,
are generated from a centered chi-squared distribution with 8 degrees of freedom, scaled to preserve the original variances
.
Table 3 reports estimation results under heavy-tailed and skewed distributions based on
observations and high measurement error:
,
.
Across the two distributional scenarios in
Table 3, the overall patterns are similar to those observed under the normal case. The Simple and SIMEX methods remain sensitive to distributional deviations, leading to noticeable estimation deterioration. The Adjusted method shows lower bias, but its performance is still consistently inferior to that of the EM approach. In contrast, the EM-based estimator demonstrates greater overall stability, with consistently lower RMSE and MAD, as well as improved performance for
and the slope function
. Although the EM method exhibits slightly larger bias under heavy-tailed and skewed distributions compared with the normality assumption, its stability and bias-correction performance remain superior to those of the other methods.
4. Application to Crop Yield Prediction
Crop yield is strongly influenced by meteorological conditions, especially precipitation and temperature during the growing season. Annual crop yields differ significantly in climatic environments [
19]. Reliable yield prediction based on meteorological information is therefore of practical importance for agricultural management, including irrigation planning and crop management decisions. In this section, we illustrate the proposed methodology by analyzing annual soybean yield in Illinois, one of the major soybean-producing states in the United States, over the period 2001–2020. The annual yield is treated as a scalar response. Monthly precipitation is treated as a functional covariate subject to measurement error. Daily temperature variables are restricted to the crop growing season and summarized into annual indices, including the temperatures of the growing season and cumulative optimal temperature days (COD), following established practices in crop–climate modeling [
20,
21].
To ensure the validity of standard linear and functional modeling assumptions, we examined the annual soybean yield and key climate variables for approximate normality. Variables exhibiting moderate skewness or heavy tails were log-transformed to improve normality, while variables already close to normal were kept on their original scale. We employ the Shapiro–Wilk test, which indicates that the processed variables are approximately Gaussian, with most p-values above 0.05. This preprocessing supports the application of Gaussian-based FPCA and linear regression procedures.
Subsequently, we determine the truncation level of the functional principal component expansion. Based on preliminary experiments, we found that retaining six principal components provided better predictive performance for the target variable y while also capturing approximately 98.6% of the total variability in the precipitation curves. Accordingly, following the cumulative proportion of variance explained (PVE) criterion, we retain the first six FPCs for subsequent analysis.
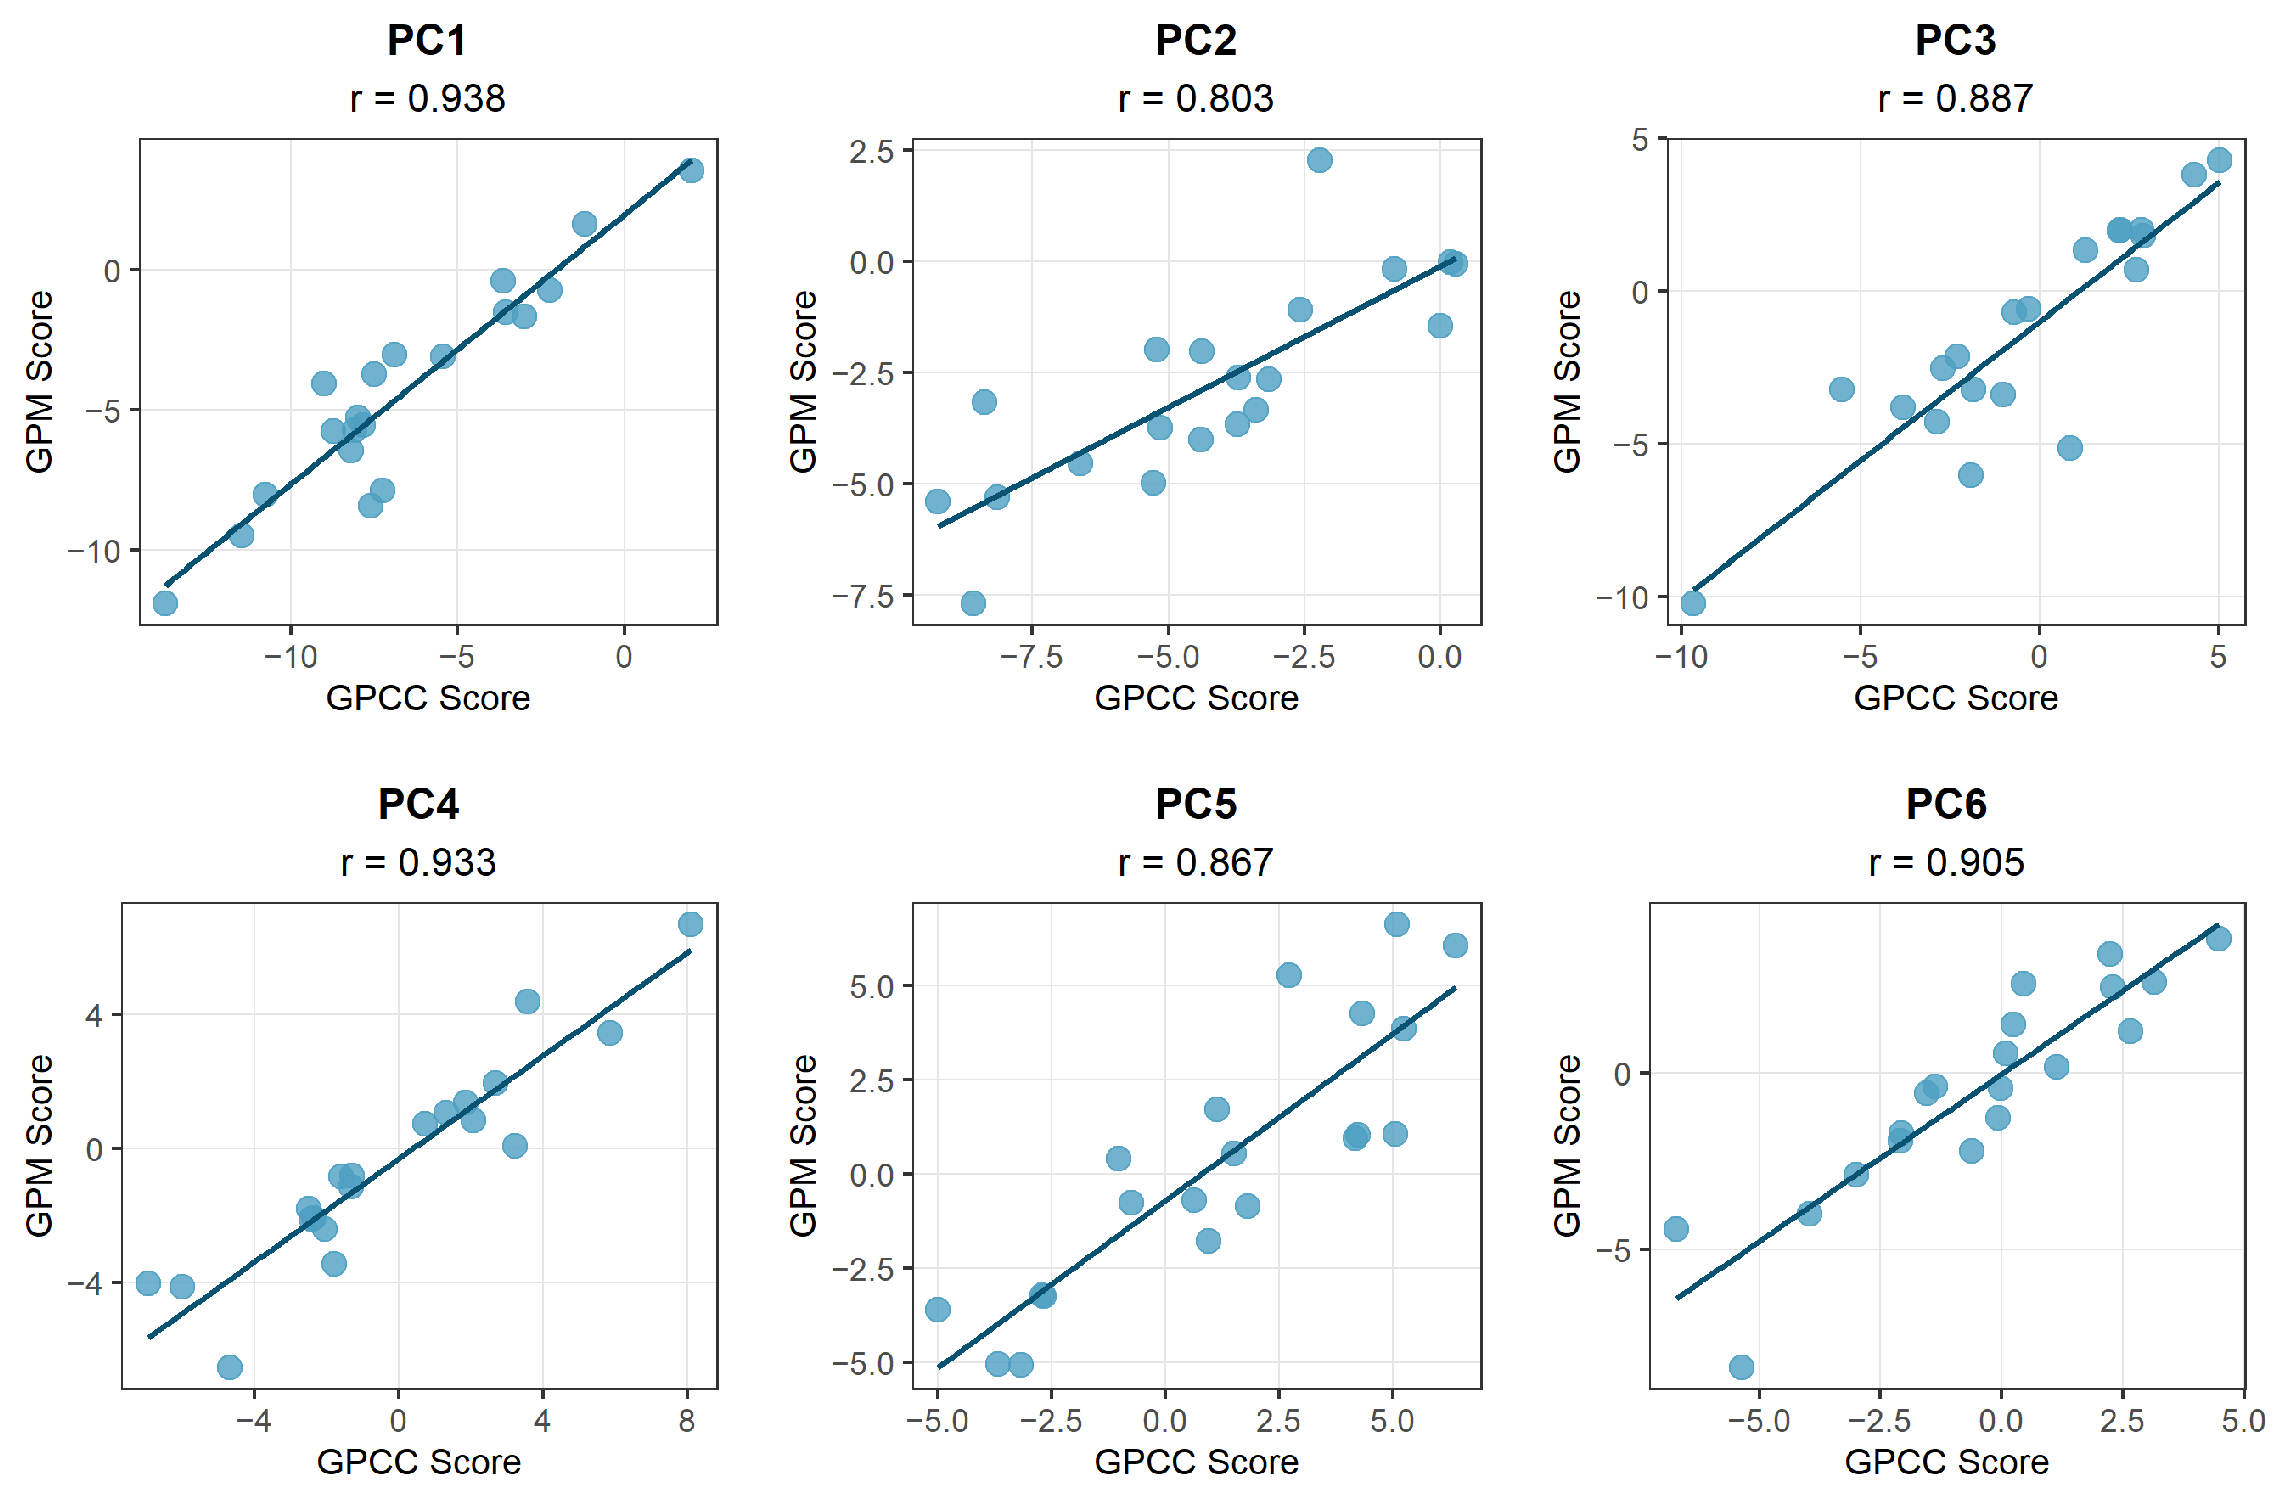
Building upon the selected functional principal component representation, we then examine whether precipitation measurements from the GPM and GPCC datasets can be regarded as repeated measurements of the same latent process. Given that the two datasets arise from different measurement mechanisms, empirical comparison shows that their discrepancies are substantially larger than typical sampling variability, indicating the presence of non-negligible measurement error. At the same time, strong correlations are observed between the corresponding FPC scores derived from the two sources (
Figure 3), suggesting that both datasets capture the same underlying precipitation dynamics. These findings support treating precipitation from GPM and GPCC as replicated measurements within the proposed modeling framework.
The SoFR model was trained using the first seventeen years of data, while the most recent three years were reserved for testing. Yield forecasts were produced using the three proposed error-correction approaches and compared with a simple regression benchmark to evaluate their performance in accounting for measurement error. Due to missing observations in certain regions, the analysis focused on a subset of high-quality counties in Illinois, accounting for a total soybean production of 3346 kilotons per year. Based on this subset, precipitation, temperature, and other covariates were aggregated to the state level according to the Illinois boundary defined by the National Transportation Atlas Database (NTAD), yielding a coherent set of state-level predictors. The prediction performance is summarized in
Table 4, with bias expressed in kilotons.
Across both training and test periods, the simple regression model exhibits substantial prediction error, highlighting the impact of ignoring measurement error in precipitation. Bias-corrected methods achieve consistent improvements. Among them, the EM-based approach attains the lowest RMSE and the smallest overall prediction error, indicating superior stability. In particular, its test-set MAE reaches 120.86 kilotons, which is approximately 3.6% of total soybean production, demonstrating that the proposed model yields practically meaningful gains in predictive precision.
Against this backdrop, the EM-based estimated regression coefficients for Illinois are reported below:
where
–
denote the six FPCA scores, and
–
represent the annual maximum temperature, minimum temperature, and COD, respectively. The regression coefficients corresponding to the first six FPCs are
,
, with convergence achieved in 10 iterations.
To further examine the temporal contribution of precipitation to crop yield, we performed a functional data analysis using the GPCC precipitation curves, guided by the EM-based linear regression results.
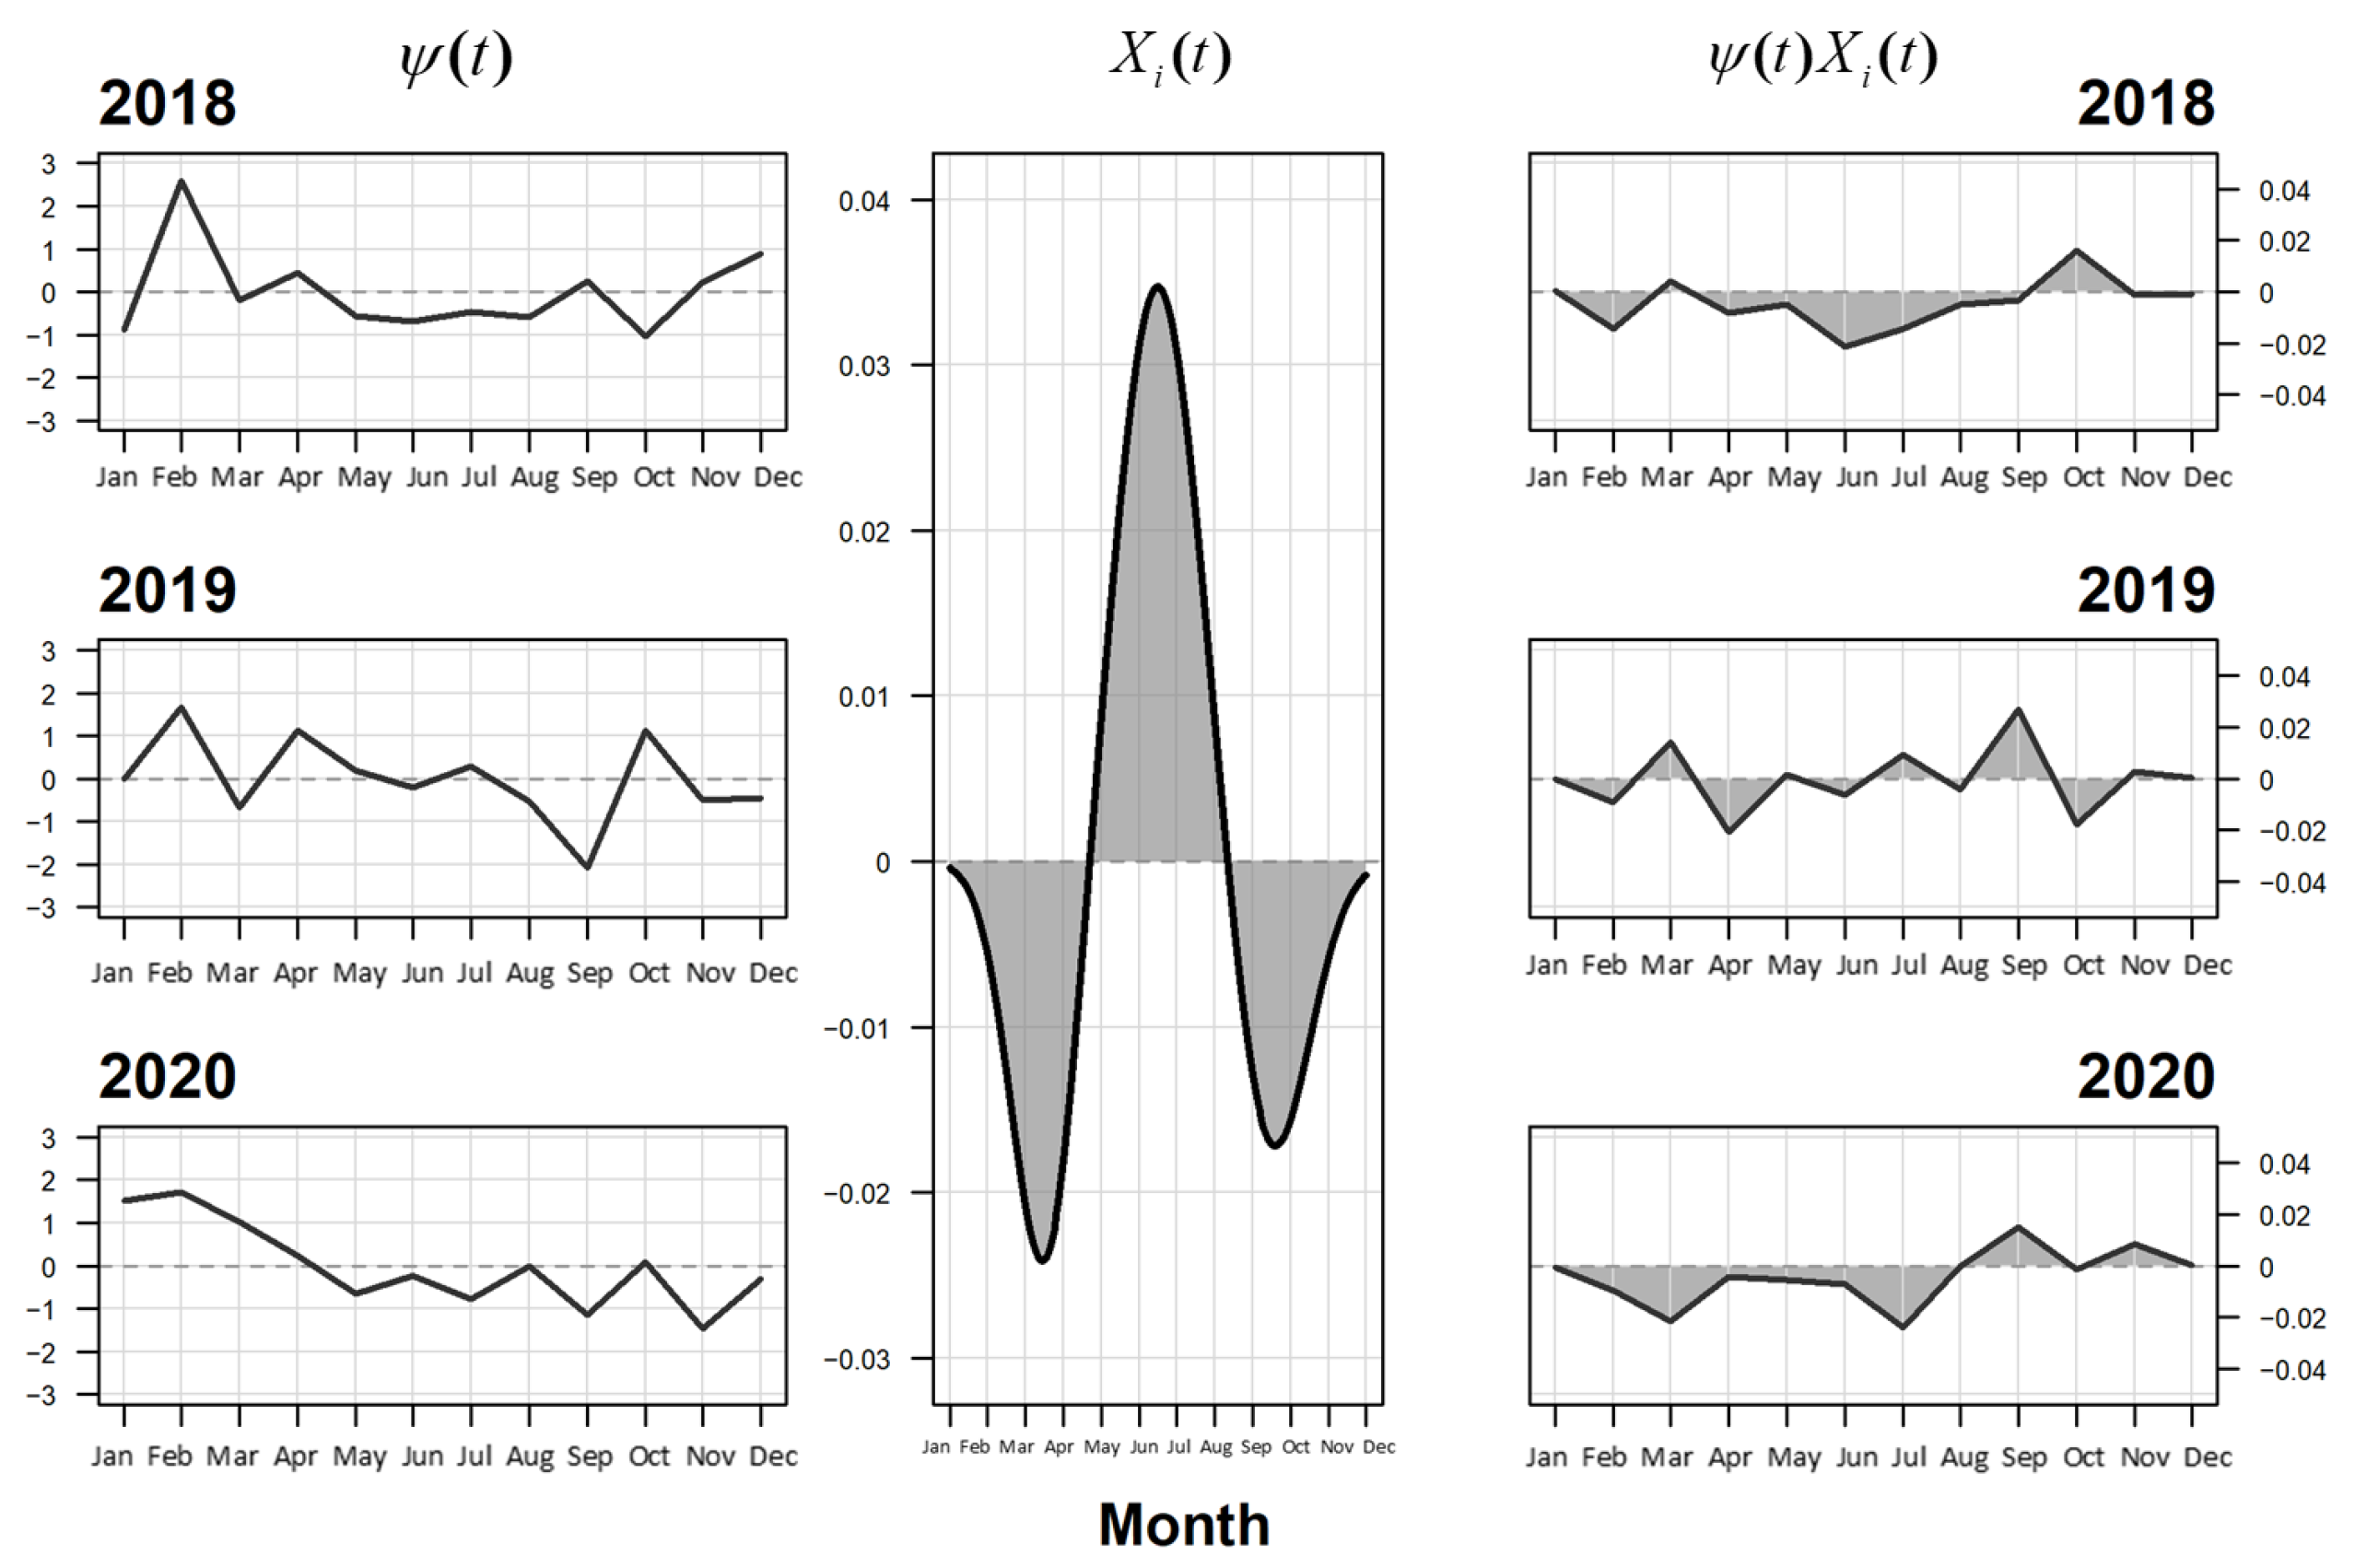
Figure 4 displays the estimated coefficient function
and its interaction with observed precipitation trajectories over three test years. The coefficient function reveals a clear seasonal pattern: precipitation during key growth months (June–July) contributes positively to yield, whereas precipitation in early spring (March–April) and late autumn (September–October) has a negative association. The integral of the product
over time provides a quantitative summary of the net annual effect, reflecting the balance between these opposing seasonal influences.
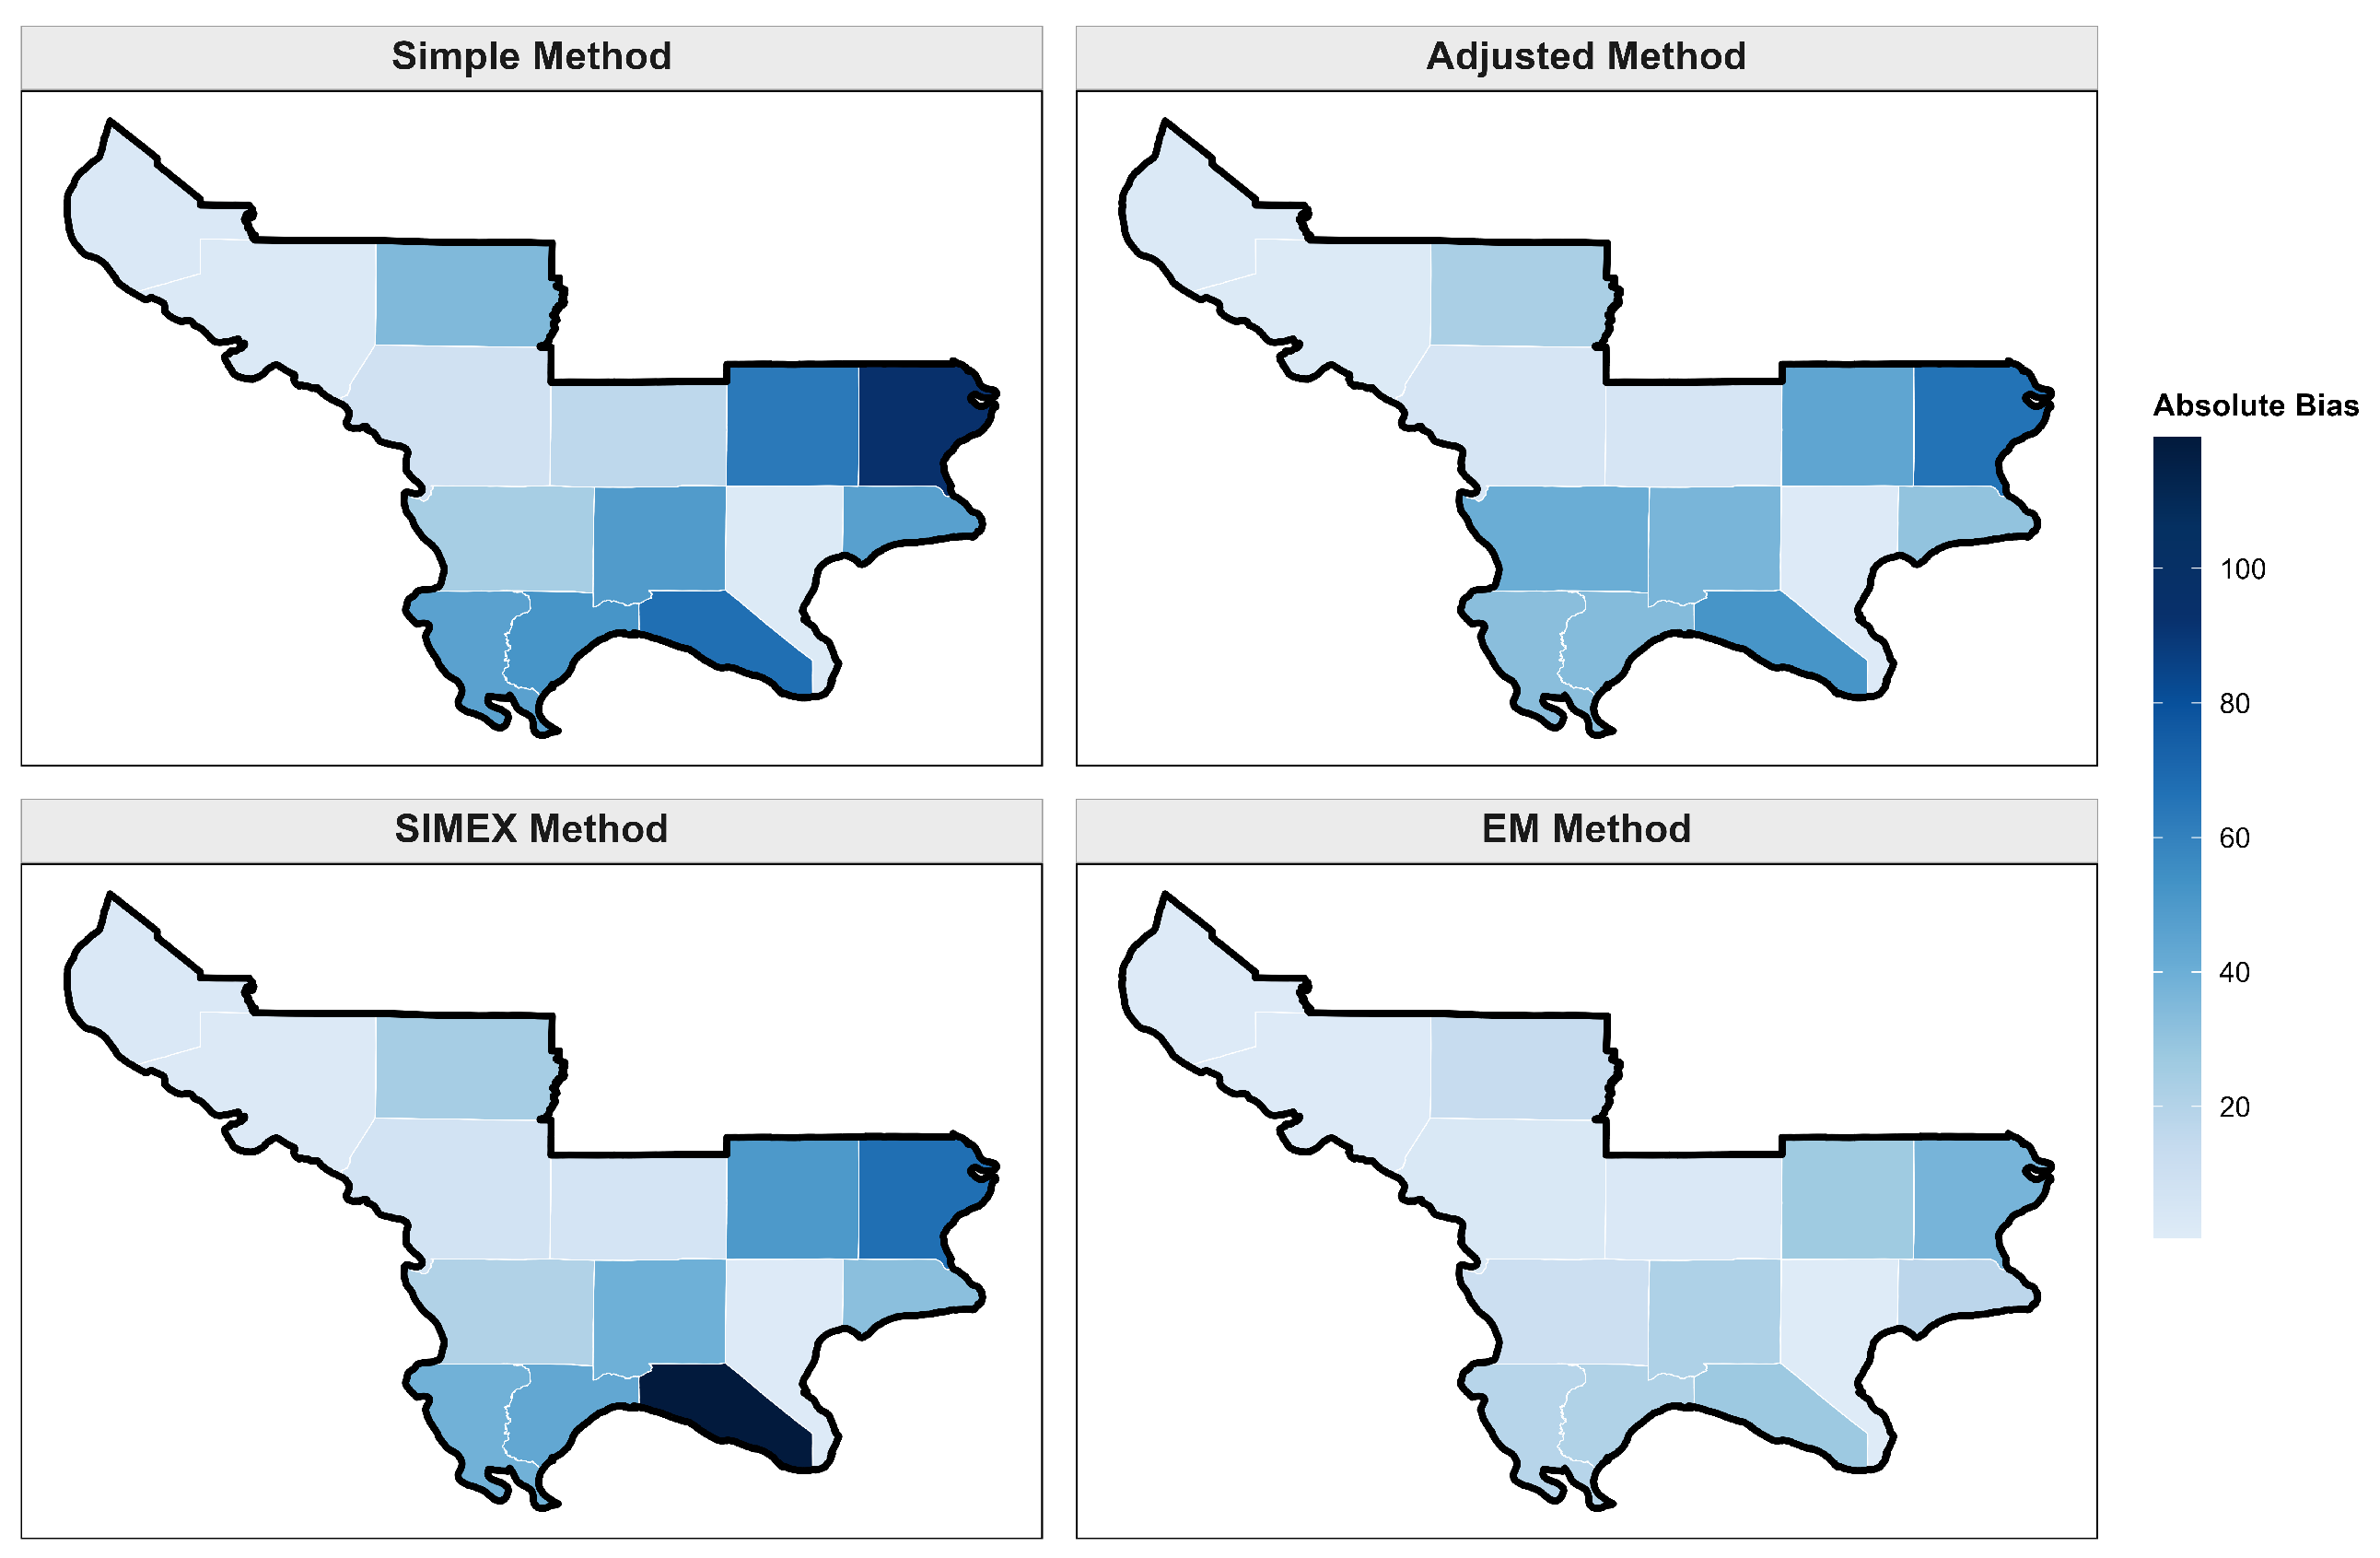
Finally, to assess the scalability on finer spatial scales, we extended the analysis to the county level by fitting the model separately to each soybean-producing county in Illinois. County boundaries were defined based on the National Transportation Atlas Database (NTAD), which provides standardized and consistent geographic delineations across the United States. The resulting absolute prediction biases for the four methods are shown in
Figure 5. Compared with alternative methods, the EM approach consistently exhibits smaller and more stable biases across counties, whereas competing models display pronounced errors in specific regions. This pattern further illustrates the effectiveness of the proposed model and its parameter estimation when applied at finer spatial resolutions.
5. Conclusions
We study scalar-on-function regression in the presence of measurement error in functional covariates. We model the observed functional measurements as replicated surrogates of an underlying latent process contaminated by measurement error. The availability of replicated measurements plays a central role in the proposed framework, as it allows the measurement error variance to be estimated jointly with other model parameters, eliminating the non-identifiability that typically arises in functional measurement error models. By projecting both the latent functional predictors and their surrogate replicates onto a common FPCA basis, the original infinite-dimensional problem is reduced to a finite-dimensional linear measurement error model. Estimation is carried out using a likelihood-based approach in which latent FPCA scores are treated as unobserved variables, and the EM algorithm is employed to obtain bias-corrected estimates. Moreover, the FPCA-based projection not only reduces the original infinite-dimensional problem to a tractable finite-dimensional setting, but also facilitates theoretical analysis of the proposed estimator. Specifically, after projecting the functional model onto the FPC score space in Model
4, the resulting multivariate regression framework allows us to establish that the estimators are consistent and asymptotically normal under standard regularity conditions.
Simulation studies demonstrate that explicitly accounting for measurement error leads to substantial improvements over simple regression, adjusted regression, and SIMEX, particularly when the magnitude of measurement error is non-negligible. The proposed model is illustrated through an application to annual soybean production in Illinois, where meteorological variables are used as predictors. The empirical results show that the proposed approach achieves higher predictive accuracy than several commonly used measurement error correction methods, highlighting the value of the modeling and estimation strategy in a real-world setting.
A key step in the proposed method is the use of FPCA on the surrogate process to obtain a low-dimensional representation of the functional covariate. This reduction relies on the approximation that the measurement error primarily affects the projected scores, while the leading projection directions remain approximately stable. Equivalently, it assumes that the covariance contribution of the measurement error can be reasonably accommodated within the retained principal eigenspace of the surrogate process. This approximation is not unconditional. When the measurement error is substantial, the eigenspace extracted from the surrogate process may differ substantially from that of the latent process. In such situations, the score-level measurement error formulation may become inaccurate, and the resulting estimator of the slope function may suffer from structural bias. Importantly, this type of deviation cannot in general be removed simply by increasing the truncation level. The proposed method is therefore most appropriate in applications where the leading eigenspace of the surrogate process is not severely distorted by measurement error so that the main effect of the error can be represented through perturbations of the FPC scores. In such cases, the method provides a practically convenient and computationally tractable way to incorporate functional measurement error into SoFR under replicated observations. When replicated measurements are available, the adequacy of this approximation can also be assessed empirically. Specifically, let
Then the covariance function of the surrogate process can be estimated by
and the covariance function of the measurement error process can be estimated by
This yields the estimator
for the covariance function of the latent process. One may then compare the leading eigenspace of
with that obtained directly from
. A close agreement between the two provides empirical support for the FPCA-based reduction used in the proposed method, whereas a substantial discrepancy suggests that the score-level approximation may be questionable and that approaches based on explicit covariance decontamination may be preferable. A related covariance decomposition based on replicated measurements is also used in the implementation of [
17]. Moreover, similar to ordinary PCA, FPCA may be sensitive to outlying observations, as extreme values in the functional measurements can disproportionately influence the estimated FPCs [
22]. Developing robust FPCA methods or incorporating outlier detection strategies to mitigate this issue remains an important direction for future research. It is also worth noting that the model assumes a diagonal covariance structure for the measurement errors of the latent FPC scores. This simplification may ignore residual correlations among the errors across different FPC scores, which could slightly affect estimation if such correlations are substantial. Future work may extend the model to supervised functional regression under measurement error, where the response variable guides the learning process to jointly estimate the FPCs of the latent functional covariates and the functional regression coefficients.