1. Introduction
Bitcoin mining has evolved into an increasingly energy-intensive activity with important environmental and policy implications. However, empirical evidence on the evolution of total electricity consumption and its distribution across countries remains limited. Recent studies report large and uncertain estimates of Bitcoin’s power demand and highlight serious climate and pollution concerns [
1,
2]. Most existing studies focus on aggregate consumption or provide static snapshots of mining locations, without examining global energy demand trends alongside the geographical distribution of mining [
3,
4]. As a result, concerns have been raised about the sustainability of the computational mining protocol, the risk of mining becoming too centralized, and the unequal environmental and regulatory impacts across countries. Decentralization is the absence of pronounced geographic concentration in a small number of countries and therefore implies a reduced vulnerability to country-level shocks. It helps reduce exposure to regulatory and energy shocks, making the geographic distribution of mining activity important for network stability.
Bitcoin’s energy and environmental impacts have recently attracted considerable attention, and a growing literature on this subject has emerged. Many studies quantify energy demand, assess environmental impacts, and examine the role of regulatory frameworks. Bitcoin mining’s energy use is examined by relating the network’s total computing power to assumptions about the efficiency of mining hardware [
3,
5,
6]. A positive cointegrating relationship between crypto-currency hashrate and energy consumption has been identified using vector error-correction models [
7], further highlighting the close connection between mining activity and energy demand. Comparisons of energy use and environmental footprints across nine different crypto-currency projects reveal large differences in electricity consumption, mainly driven by their consensus mechanisms [
8].
Recent studies quantify global and country-level carbon footprints, while analysis is increasingly extended to water and land use impacts [
1,
9,
10]. Life-cycle emissions and renewable integration potential are examined in [
11,
12]. In [
13], the effect of Bitcoin emissions on climate and global warming is discussed and a potential increased warming of more than 2 °C due to Bitcoin emissions is noted. A more recent study suggests that the global carbon footprint of Bitcoin mining is rising rapidly, due to electricity use during mining but also by emissions associated with the production of mining hardware [
14]. Finally, policy-focused studies examine how environmental and energy regulations influence mining incentives and operational conditions [
15,
16].
Beyond energy use and environmental impacts, several studies examine the geography of Bitcoin mining, focusing on mining location, spatial concentration, and relocation of mining hubs. The interest lies in determining how mining capacity is distributed geographically and how it responds to economic, infrastructural, and regulatory conditions. Various geospatial studies suggest a strong concentration of Bitcoin mining in regions with abundant and low-cost electricity, especially after China’s 2021 ban [
4,
17]. Zook and McCanless [
18] point out the spatial disparity of digital infrastructures with emphasis on the role of geographic and institutional drivers in the development of blockchain activity. The urban and regional dynamics of crypto-mining are examined in De Falco [
19], where the importance of local infrastructure and energy systems is highlighted. The analysis of the geopolitical dynamics of mining activity and its concentration in the Global East underlines the significance of the energy availability, legacy systems, and political networks in it [
20]. Aramonte et al. [
21] analyze concentration in crypto-currency markets using inequality metrics, such as the Gini coefficient and the Nakamoto index, and document a high degree of concentration in both market activity and network control. Although there is a growing interest in the geographical spread of Bitcoin mining, formal econometric evidence on its dynamic evolution and long-run convergence across countries remains relatively limited.
Bitcoin electricity consumption is usually analyzed without considering any geographic information [
6,
7], and mining locations are mapped using cross-sectional geospatial data [
4]. As a result, hashrate distribution is typically examined through static snapshots that do not capture how mining activity evolves over time. In this study, we examine both the long-run trend in aggregate Bitcoin electricity consumption and the cross-country dynamics of mining activity. Annual electricity estimates from 2010 to 2025 are used to quantify the overall mining demand. Additionally, monthly country-level hashrate shares (September 2019–January 2022) help us understand the changing geography of mining activity. Both sample periods include two major shocks: the 2020 Bitcoin halving and the 2021 China mining ban, allowing us to evaluate how the mining landscape adjusted after these events. The selected sample period is particularly informative, as it captures these exogenous shocks, which significantly affected mining profitability and triggered a large-scale geographic reallocation of mining activity.
A trend analysis is employed for total electricity consumption, assessing its long-run growth. Country-level hashrate shares are then studied using different complementary methods. Country-level permutation entropy captures temporal complexity. Cross-sectional Theil index and cross-sectional symbolic entropy quantify heterogeneity and decentralization in the global mining network. Further, we investigate the evolution of cross-country dispersion in mining intensity over time using -convergence analysis. Finally, stochastic convergence is examined based on panel unit root tests, while the Phillips–Sul methodology is utilized to explore potential common transition paths.
We examine decentralization through complementary dimensions: temporal stability via predictability of country-level mining trajectories, spatial concentration quantifying monthly inequality across countries and convergence trends that reflect the evolution toward equal relative shares. Bitcoin mining behaves like a highly mobile digital capital that relocates geographically in response to changes in electricity prices, regulatory conditions, and infrastructure availability. In this setting, convergence in mining shares reflects the gradual adjustment of mining capacity across locations as miners respond to differences in energy costs and/or other policy decisions. Decentralization reflects the way economic and policy factors shape the global allocation of mining activity.
The idea of decentralization in Bitcoin mining is directly connected with the design principles of the Bitcoin network. It represents the basic features of blockchain systems, including resistance to censorship and a reliable validation process. When mining operations are spread out over several locations, the network becomes less dependent on a particular region, therefore less susceptible to deliberate regulatory or political interventions. Consequently, the decentralization is of great importance in making the Bitcoin network stable and resilient in the long term.
Bitcoin mining is analyzed in terms of its demanding energy use and its global geographic spread. We examine the geographic distribution of Bitcoin mining and its evolution over time, bridging the gap between total electricity consumption and the spatial distribution of mining activity. For this, we employ trend analysis, estimate heterogeneity indicators and apply convergence techniques. Our study provides new evidence on mining decentralization, the resilience of the network’s spatial structure, and countries’ relative long-run positions in the global mining network. In particular, results suggest transitional decentralization characterized by mean-reverting dynamics and declining dispersion, although persistent core–periphery asymmetries in long-run mining shares remain.
Section 2 presents the data and the methodology used. The empirical findings are presented in
Section 3. We discuss the findings and the implications in
Section 4. Finally,
Section 5 summarizes the study and gives directions for future research.
2. Data and Methodology
This section describes the sample data and the econometric methods used in our study. The datasets were provided by the Cambridge Centre for Alternative Finance. The applied methodologies include trend analysis, heterogeneity measures, and convergence tests.
2.1. Data
Two datasets are obtained from the Cambridge Centre for Alternative Finance (CCAF) and are licensed under CC BY–NC–SA 4.0, providing complementary perspectives on the evolution of the mining network.
Annual total electricity consumption estimates are sourced from the Cambridge Bitcoin Electricity Consumption Index (CBECI) for the period 2010 to 2025 (up to 14 October 2025). The daily annualized TWh values are provided under three hardware efficiency scenarios: central (GUESS), lower-bound (MIN), and upper-bound (MAX). These data reflect the overall growth in global mining demand.
A monthly panel of global Bitcoin hashrate shares for 105 countries covers the period September 2019–January 2022 (29 months, 3045 observations). Country-level hashrate shares capture the geographic distribution of mining activity. Due to data availability, this panel does not fully cover the sample period of the electricity consumption series. However, after 2022, data availability and reporting methodologies changed substantially, while the increasing use of VPNs and intermediary mining pools has made country-level attribution less reliable. Hashrate may be recorded based on the location of servers or pools rather than the physical location of mining operations, leading to potential misclassification. While this issue does not affect the estimation sample, it may imply that the measured degree of decentralization represents a lower bound, as informal or mobile mining activity may be under-recorded, leading to a potential underestimation of the true degree of geographic dispersion.
2.2. Methodology
The methodology used in our analysis is described below. First, we examine electricity consumption trends and then analyze the dynamics of hashrate distribution using entropy-based measures and convergence tests. In particular, we adopt a dual framework that allows us to jointly capture distributional structure (static inequality) and adjustment dynamics (convergence), which are typically examined separately in the literature, thereby providing a more comprehensive perspective on the evolution of mining decentralization.
To examine the geographic structure of Bitcoin mining activity, we structure the analysis along two complementary dimensions. We capture the static distributional properties of mining activity across countries by assessing the cross-sectional distribution at each point in time. The Theil Index and cross-sectional Shannon entropy quantify the degree of concentration, inequality, and disorder in the global mining landscape, allowing us to assess whether mining activity is highly centralized or relatively dispersed.
To analyze the dynamic adjustment of mining activity, we employ methods that capture convergence patterns and stochastic dynamics over time. -convergence examines the evolution of cross-sectional dispersion. Stochastic convergence is based on a dynamic panel framework using country-level relative deviations. The Phillips–Sul convergence methodology identifies global or club convergence and heterogeneous transitional dynamics. Finally, country-level permutation entropy provides complementary insights into the stochastic structure and predictability of mining activity.
2.2.1. Electricity Trends
We analyze the long-run evolution of Bitcoin’s electricity consumption using annual estimates from CBECI covering the period 2010–2025, where 2025 is only partially observed (up to 14 October 2025). Annual electricity consumption is constructed by converting daily annualized values into daily energy use and aggregating over each calendar year:
where
denotes the daily annualized CBECI estimate. For 2025, observed daily consumption is summed through the last available date, and the remaining days are projected using the mean observed daily rate. The central analysis is based on the CBECI ‘GUESS’ scenario, while the corresponding MIN and MAX scenarios are used to construct uncertainty bounds, where MIN assumes highest hardware efficiency and MAX assumes lowest hardware efficiency.
In the early years of the sample, electricity consumption is close to zero, while later, its rapid expansion is observed. We estimate a log-linear time-trend model to capture proportional growth dynamics:
where
denotes annual electricity consumption and
t is a linear time index. To capture more flexible long-run dynamics and possible persistence in deviations from trend, we also estimate a linear time-trend model with autoregressive disturbances:
Both specifications are estimated using ordinary least squares and standard diagnostic tests are performed to assess model fit and residual behavior. We also produce simple projections for 2026 based on each trend specification.
The data series comprises 16 annual observations, which is relatively small for econometric analysis. However, it spans the full history of Bitcoin mining activity. Although the small sample size may limit the statistical power of the tests, the analysis still provides an informative picture of the growth path of mining.
2.2.2. Heterogeneity Measures
We employ several heterogeneity measures to capture different dimensions of complexity and inequality in the global Bitcoin mining network. These measures quantify both the uneven geographic distribution of mining activity and the temporal volatility of national mining shares. Specifically, we quantify the country-level temporal complexity using permutation entropy, cross-sectional concentration using the Theil index, and cross-sectional decentralization using a symbolic entropy measure. Together, they provide a comprehensive view of decentralization and structural change in global hashrate distribution.
The inequality and entropy measures are computed directly on the original hashrate shares. These metrics are scale-invariant by construction and properly handle zero and near-zero mining activity.
Permutation Entropy
Permutation Entropy (PE) is an information measure based on the relative frequencies of ordinal patterns in the time series [
22]. PE is fundamentally a time series complexity measure; therefore, it is used to quantify the temporal complexity of mining activity for each country. We compute PE for each national hashrate series. Given an embedding dimension
m and time delay
, each series is mapped into sequences of ranked values, and the associated probability distribution over the
possible orderings is constructed. Permutation entropy is defined as
where
denotes the relative frequency of a given ordinal pattern (permutation) in the time series. We normalize PE in order to be within the
interval, by dividing
H with
. Higher PE values indicate greater temporal irregularity and lower predictability in a country’s mining activity over time.
To handle ties, we add a small Gaussian perturbation (
) to each observation before computing ordinal patterns. This ensures that all values are unique. This is a standard procedure in ordinal analysis that prevents the occurrence of undefined patterns [
22].
Theil Index
To measure the degree of cross-country concentration in Bitcoin mining activity, we utilize the Theil index, a widely used inequality metric derived from information theory [
23]. Let
denote country
i’s share of global hashrate at time
t, with
and
N countries. The Theil index is defined as
It is equal to zero under perfect equality and increases with concentration. It is scale-invariant and decomposable, and therefore provides a transparent measure of mining centralization at each point in time. In this context, it summarizes the extent to which global hashrate share is disproportionately concentrated in a small number of countries, complementing convergence tests that focus on dynamic adjustment.
Cross-Sectional Symbolic Entropy
A normalized Shannon entropy [
24] over three hashrate categories is proposed as a simple cross-sectional decentralization indicator for Bitcoin mining. The resulting cross-sectional symbolic entropy (CSE) is designed to quantify the cross-sectional concentration of Bitcoin mining activity based on discrete hashrate categories. At each time
t, countries are classified into three groups according to their share of global hashrate: high (hashrate share at least 5% of the global total), medium (between 1% and 5% of global capacity), and low (below 1%). These thresholds are selected to provide an economically meaningful partition of mining activity and are motivated by concentration concepts used in industry reporting (e.g., CCAF) and in the decentralization literature [
25].
The three categories are encoded as symbols
N,
M, and
L and provide a symbolic representation of the cross-sectional distribution in each month. Let
,
, and
denote the fractions of countries in each category at time
t. The symbolic entropy is defined as
where the sum runs over the three symbols
and we normalize it by its maximum value
to obtain
so that
. We use base-2 logarithms so that entropy is measured in bits, although the normalization by
makes CSE invariant to the log base choice. High CSE values imply a more even distribution of hashrate across the three groups, whereas lower values reflect stronger concentration in the high-share category. CSE summarizes how evenly countries are distributed across the high, medium, and low hashrate categories and therefore provides a simple and robust measure of cross-sectional decentralization.
2.2.3. Convergence
The evolution of cross-country differences in Bitcoin mining activity is examined using three complementary convergence approaches. To avoid zero values of the share data
, we construct adjusted shares as
This adjustment is negligible and does not affect the underlying dynamics, but improves numerical stability in subsequent logarithmic transformations and convergence estimation [
26,
27]. The cross-sectional mean share is approximately
; therefore, the offset represents roughly 1% of the average magnitude and is much smaller than the typical variation among non-zero shares. Because the same constant is applied uniformly across countries and over time, it does not distort relative dynamics but instead regularizes observations that are zero or extremely close to zero.
Country hashrate shares are compositional (), so part of the observed dispersion dynamics could in principle reflect the adding-up constraint. This concern is mitigated in our framework because stochastic convergence is evaluated using relative log deviations, the inequality and entropy measures display consistent decentralization patterns, and the Phillips–Sul transition paths exhibit substantial early heterogeneity prior to gradual compression. Therefore, the detected convergence patterns reflect genuine relative adjustments across countries rather than a mechanical consequence of the unit-sum constraint.
First, we assess -convergence by examining the evolution of cross-sectional dispersion in hashrate shares, and thereby quantify the overall reduction in inequality among countries.
Before estimating stochastic convergence, we test for cross-sectional dependence using Pesaran’s CD test [
28]. To account for common global shocks, we employ a two-way fixed-effects model, based on the rationale of stochastic convergence literature [
29,
30].
While stochastic convergence captures average mean-reverting dynamics, it does not preclude heterogeneous long-run paths across countries. Therefore, we implement the Phillips–Sul club convergence test [
31], which groups countries following similar long-run paths and tests for common equilibria, capturing heterogeneous convergence dynamics and potential formation of convergence clubs.
-Convergence
To assess whether cross-country dispersion in mining activity declines over time, we employ
-convergence. Specifically, we study the evolution of the cross-sectional standard deviation of adjusted hashrate shares
. To test for
-convergence, we estimate the linear trend:
A negative and statistically significant indicates convergence in hashrate shares across countries.
As a complementary robustness check, we also compute the coefficient of variation at each time
t:
where
denotes the cross-sectional mean of the shares. The coefficient of variation provides a scale-adjusted measure of dispersion, ensuring that the assessment of convergence is not mechanically influenced by changes in the overall scale of the Bitcoin network. A negative time trend of
can offer additional evidence of relative convergence.
Stochastic Convergence
To examine whether cross-country differences in Bitcoin mining shares are mean-reverting, a stochastic convergence framework based on country-specific relative deviations is employed. We construct relative log deviations from adjusted shares
:
where
is the cross-sectional mean of adjusted shares at time
t. Under stochastic convergence, the relative deviations
should be stationary.
Before estimating the dynamic specification, we test for cross-sectional dependence using Pesaran’s CD test [
28]. The test is applied to the residuals from the auxiliary pooled regression:
where
denotes the disturbance term. The null hypothesis is
, against the alternative of cross-sectional dependence. Rejection of
indicates the presence of common shocks affecting multiple countries simultaneously.
To account for both country-specific heterogeneity and common global shocks, we estimate the two-way fixed-effects model:
where
captures country fixed-effects,
captures time fixed-effects, and
is an idiosyncratic error term. The inclusion of time fixed-effects is essential, as global developments in the Bitcoin network may induce common shocks across countries. Stochastic convergence is evaluated by testing the null hypothesis (
) of a unit root (
) against the alternative of mean reversion (
). A value of
implies that shocks to mining shares are transitory, indicating long-run convergence in the geographic distribution of Bitcoin mining activity. Given that the time dimension of our panel is
, the within-group estimator is expected to be subject to a small downward bias. However, as
, this bias becomes sufficiently small, and the estimator provides a reliable assessment of convergence dynamics. To ensure the validity of our inferences, we employ Driscoll–Kraay robust standard errors [
32], which are resilient to cross-sectional dependence and temporal autocorrelation.
In contrast to classical fixed-T panel unit root tests such as Harris–Tzavalis and Karavias–Tzavalis [
29,
30], our dynamic two-way fixed-effect model explicitly accommodates the strong cross-sectional dependence inherent in global Bitcoin mining shares through the inclusion of time fixed-effects and Driscoll–Kraay robust inference. Given the highly interconnected nature of mining activity across countries, this framework provides a more flexible and economically interpretable assessment of stochastic convergence dynamics. Although dynamic fixed-effects models may exhibit Nickell bias in short panels, the length of our sample (
) and the relatively large cross-sectional dimension likely mitigate this concern, so the estimated persistence parameter can be interpreted as a reasonable approximation of the underlying adjustment dynamics.
Club Convergence
To study heterogeneous long-run patterns in country-level Bitcoin mining, we use the Phillips–Sul (PS) log-t and club convergence methodology [
31]. Due to the high concentration and right-skewness of Bitcoin hashrate shares, we employ log-adjusted shares in the analysis. This transformation reduces the sensitivity of the PS test to extreme values and improves the stability of the cross-sectional variance, thereby better capturing relative transition dynamics across countries. Without this adjustment, the strong influence of major mining hubs may mask more subtle heterogeneity and potentially the presence of convergence clubs.
For each country, we define the relative transition parameter based on the log-adjusted shares
:
The parameter
captures how a country’s mining power deviates from the global cross-sectional average at any given time. Convergence is assessed by the log-t regression
where
is the cross-sectional variance of the relative transition parameter and
is the variance in the initial period.
The null hypothesis of overall convergence is , which implies that all units in the panel converge to a common steady-state, with the alternative the case of divergence (). We reject if the calculated statistic is less than the critical value of .
Rejection of the null motivates the search for convergence clubs. The PS club convergence algorithm then groups countries with similar long-run transition paths. Within this framework, each identified club satisfies the criterion. The point estimate of the speed of convergence, , provides further insights into the nature of the transition. Positive values indicate strong or ‘absolute’ convergence, where units within the club are moving closer together at a rapid pace. Negative values () do not necessarily imply divergence if the t-statistic remains above the threshold. Instead, it signifies weak or relative convergence, where the units follow a similar path but at a slower pace, or their relative transition paths are narrowing asymptotically but with limited speed.
Furthermore, following the refinement suggested by [
33], we apply a club merging algorithm to prevent over-specification. The initial clustering procedure may partition the data into an excessive number of groups. The merging process iteratively tests whether adjacent clubs can be combined into a single group without violating the convergence criterion (
). This ensures that the final club structure is both statistically robust and economically parsimonious. The alternative merging method of [
34] is further used as a robustness check. In our implementation, we take the final period as the reference date and trim the first 20% of observations (
) to reduce the influence of early-period volatility and focus on the long-run transition dynamics.
To characterize heterogeneity within each converging group, we compute country-specific long-run relative positions as
where
is the number of periods in the final subsample. The estimated
represents each country’s equilibrium position within the converging panel.
3. Empirical Findings
This section presents the main results from electricity trend analysis and hashrate distribution dynamics across 105 countries.
3.1. Aggregate Electricity Trends
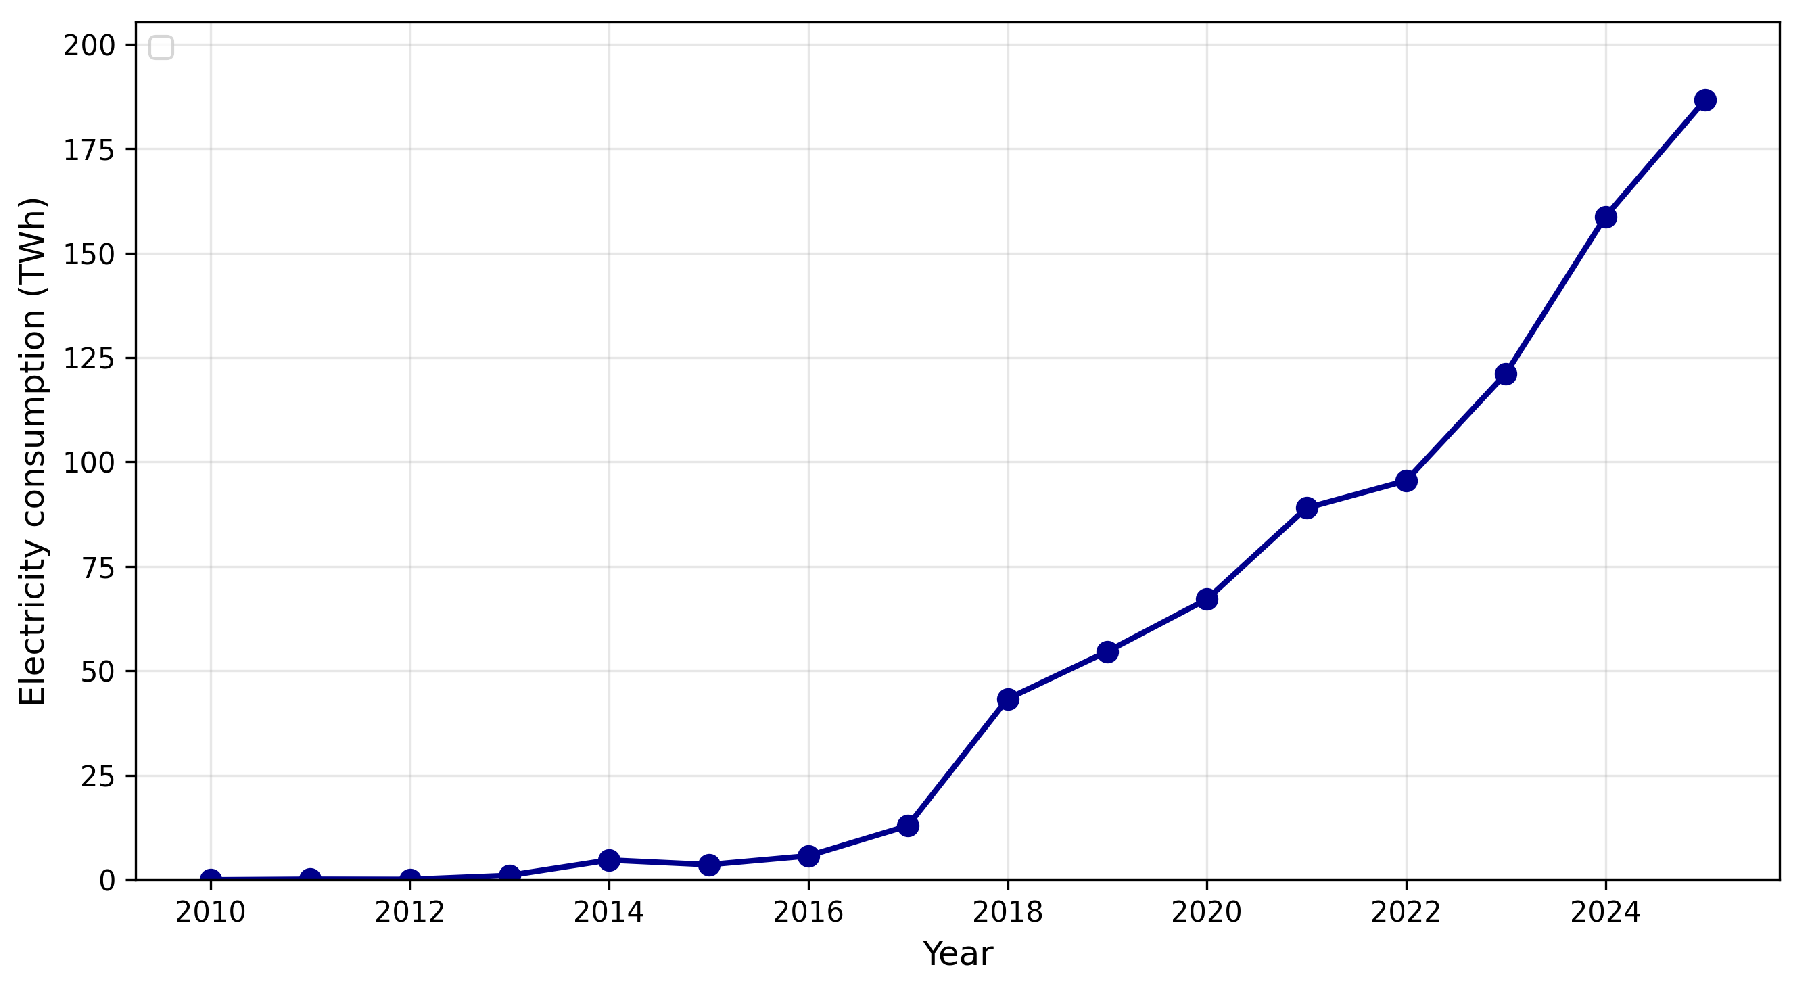
We first construct annual totals of Bitcoin electricity consumption using the CBECI daily ’annualised GUESS’ series. Each daily value (TWh/year) is converted to TWh/day, summed over observed days in 2025, and extrapolated to the full year using the mean daily consumption, yielding an annual total of about 186.6 TWh. To characterize uncertainty, we repeat the same calculation for the CBECI MIN and MAX series, which assume very efficient and very inefficient mining hardware, respectively. The resulting 2025 estimate shows wide uncertainty taking values between roughly 94 and 391 TWh due to the structural uncertainty about the global composition of mining hardware, as well as the extrapolation of partial-year data and short-term fluctuations in mining activity.
This uncertainty interval is very broad, providing a reliable indication of the range of potential annual electricity consumption, while also reflecting seasonal or short-term fluctuations that our estimate from partial-year data may have ignored. The sources of uncertainty mainly affect the level of estimated electricity consumption, but the observed shift from exponential to a more moderate growth remains robust across scenarios. Importantly, the mean-daily extrapolation for 2025 should be viewed as a conditional projection rather than a precise point estimate. Therefore, the transition from exponential to more moderate growth should be interpreted as a stylized pattern rather than a precisely estimated structural break.
Figure 1 displays the annual electricity consumption for the period 2010–2025. Early years appear to exhibit exponential growth, while this growth has slowed in more recent years, with annual increases becoming more moderate conditional on the central estimate and subject to substantial uncertainty.
Table 1 reports estimates from a log-linear (exponential) trend and a linear trend with AR(1) errors. The log-linear model gives a large and highly significant time coefficient (0.637,
), explains about 82% of the variation, while reflecting the strong proportional growth observed over the full sample. Although this model describes Bitcoin’s early development well, it would imply unrealistically large predictions for future consumption (around 1685 TWh), as it assumes the continuation of exponential growth without accounting for economic, technological, and regulatory constraints that limit mining activity and energy use.
On the other hand, the linear AR(1) specification describes better the later part of the sample. The estimated trend is about 12.38 TWh per year; it is positive and significant (). The estimated AR(1) coefficient is around 0.9 and indicates strong persistence in deviations from trend. This model achieves a slightly better fit () and implies a simple extrapolation for 2026 of about 180 TWh, which is consistent with recent observations. This global expansion of electricity consumption for mining provides the economic background for changes in the geographic distribution of mining activity.
3.2. Cross-Country Hashrate Distribution
After documenting the rapid rise in global electricity demand, the spatial distribution of mining activity is assessed.
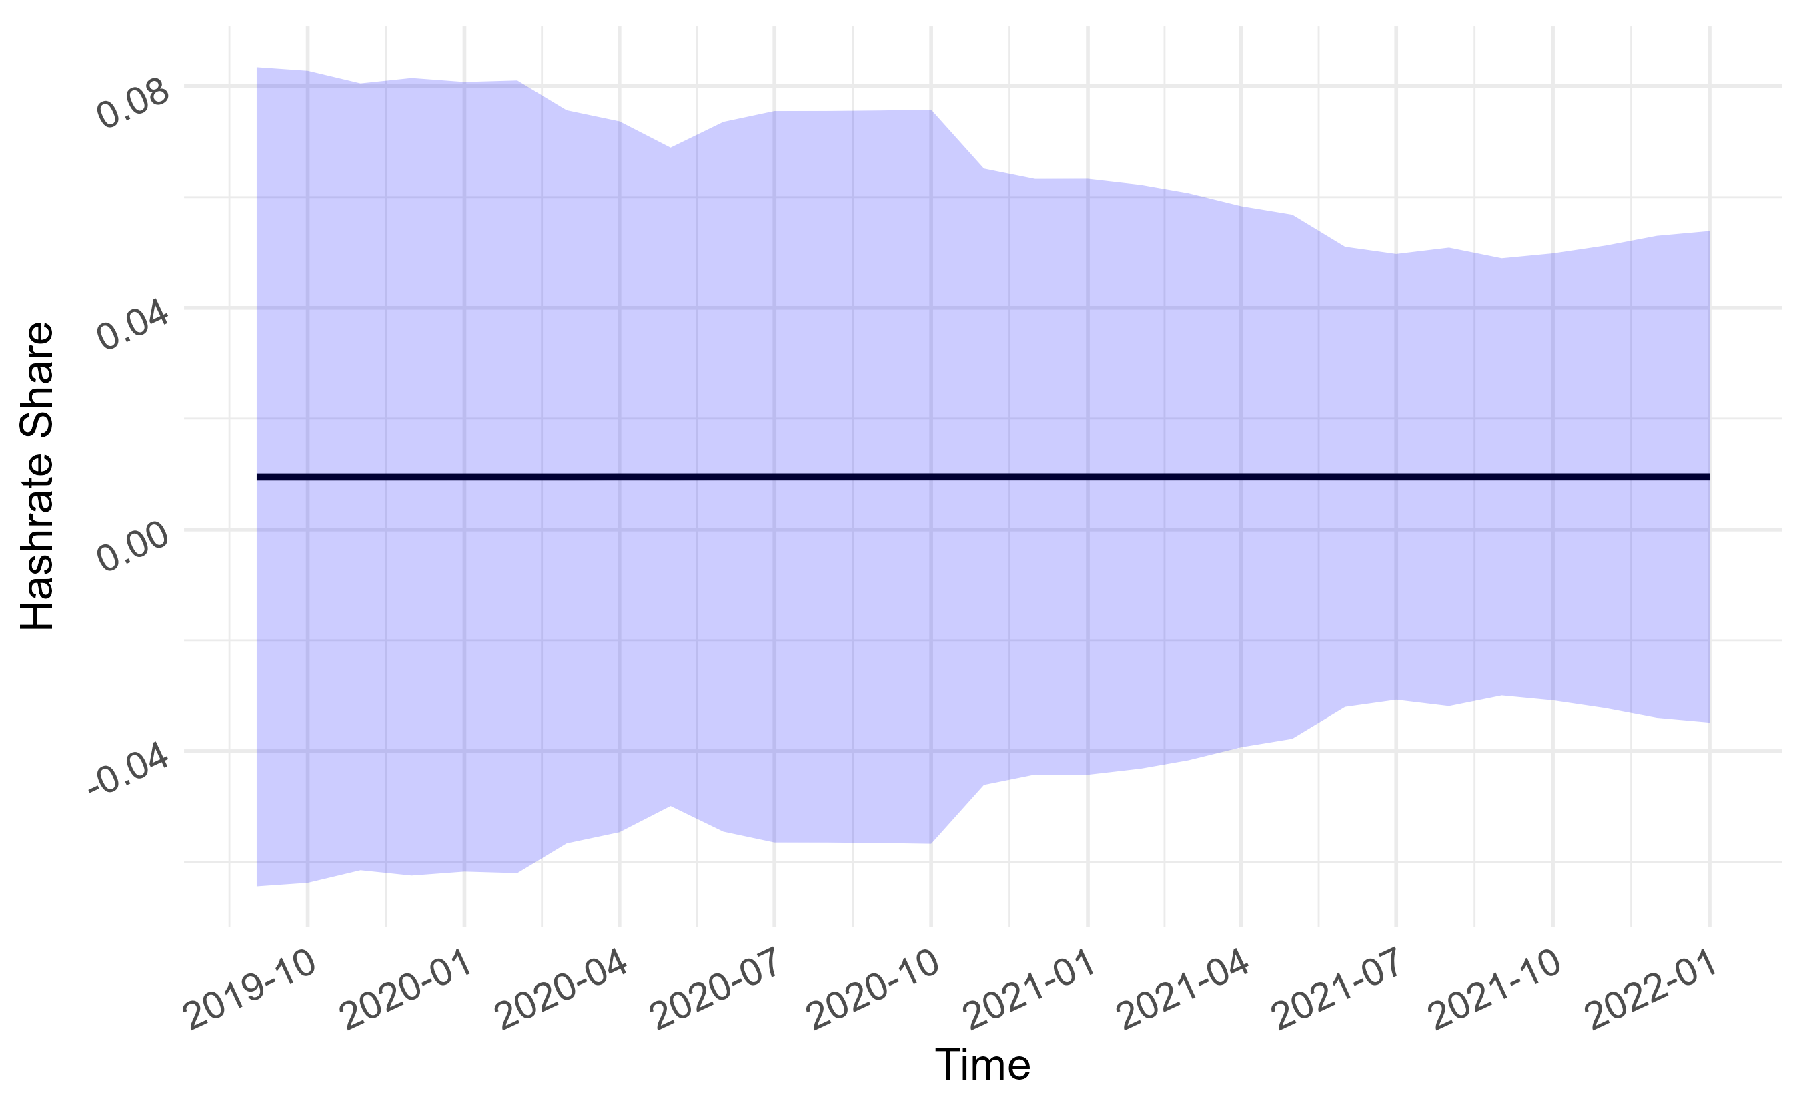
Table 2 presents the summary statistics for monthly (raw) Bitcoin hashrate shares for 105 countries (September 2019–January 2022). The mean share stayed constant at approximately 0.0095, as expected from normalization (1/105 ≈ 0.00952). The cross-sectional standard deviation (
) systematically decreased from 0.074 to 0.044 during this period. The max shares significantly decreased from 0.755 to 0.378 by the end of the period, while the min shares remained near zero. The dominant mining regions seem to have lost relative power. The distribution of hashrate shares remains strongly right-skewed and leptokurtic (heavy-tailed) over time. Skewness declines from approximately 10 to slightly above 6 and kurtosis declined from above 100 to slightly over 51. Therefore, a mild decentralization over time is implied. A few countries still dominate, but the intensity of this concentration has eased.
Figure 2 displays the mean country Bitcoin hashrate share (black line) with its ±1 standard deviation band (blue shading) for 105 countries from September 2019 to January 2022. The mean stays close to ≈0.0095 due to normalization (global total = 1). The standard deviation band narrows visibly from 0.074 (September 2019) to 0.044 (January 2022), suggesting declining cross-country inequality.
3.3. Heterogeneity Indices Results
Below, the heterogeneity indices results are presented. These quantify temporal complexity for each country and inequality patterns across the global mining distribution.
3.3.1. Country-Level Permutation Entropy
The permutation entropy (PE) provides a compact summary of how stable or erratic each country’s Bitcoin mining share is over time. For 105 countries over 29 months, we estimate the normalized PE setting, the embedding dimension , and the delay . The parameters are selected in order to balance reliable pattern estimation (3! = 6 ordinal patterns) with the short length of the monthly series (29 observations), avoiding sparsity that would arise with higher values of m. The choice of focuses on consecutive monthly changes, which is natural for mining activity and consistent with common applications of permutation entropy in financial and crypto-currency time series.
Given the relatively short length of the monthly series, permutation entropy estimates may be affected by finite-sample bias, potentially biasing the estimates upward toward higher apparent disorder. Results should therefore be interpreted as qualitative indicators of instability rather than precise entropy levels. However, the consistently high entropy values across all countries provide robust evidence of substantial temporal instability in the geographic distribution of mining activity.
Results indicate that the distribution of the series is heavily skewed toward high disorder. The majority of the countries (68 countries, 65%) exhibit very high disorder (PE ≥ 0.9), indicating highly unpredictable mining dynamics. High disorder is observed in 33 countries (31%), with estimated PE between 0.8 and 0.9. These countries have a stochastic behavior with some temporal patterns. Only four countries have PE between 0.7 and 0.8 (Kuwait 0.702, USA 0.718, Italy 0.777, Hungary 0.754), displaying a moderate disorder. All country-level PE estimated are higher than 0.7, suggesting unstable and unpredictable mining dynamics.
As a simple robustness check, normalized PE is also computed using alternative embedding dimensions. For , PE values lie in the range 0.81–1.00, reflecting the limited discriminatory power of the low-dimensional embedding. For , PE values range from approximately 0.61 to 0.99, while the overall pattern of high temporal disorder across countries remains unchanged. Thus, provides an optimal trade-off between capturing temporal complexity and avoiding finite-sample bias.
The high temporal disorder in country-level shares points to a highly dynamic mining landscape. Mining activity appears to shift frequently across countries rather than remaining concentrated in a small number of locations. Sun et al. [
4] find that miners tend to move to areas with abundant and cheap energy, but the mining distribution can easily change due to economic and regulatory shocks, such as China’s 2021 mining ban.
Due to the small sample size, the high PE values should be interpreted as relative indicators of temporal instability rather than as precise estimated entropy values. High PE values (such as PE ) suggest mining activity is more irregular and less predictable, reflecting greater vulnerability to short-term economic or regulatory shocks and an increased risk of adjustment. On the other hand, moderately lower values (for instance, PE ranging from 0.7 to 0.8) indicate a degree of consistency in timing patterns and relatively stable operations, which supports more predictable conditions for policy-making and investment planning. Countries with higher disorder may experience more frequent shifts in hashrate, while those with lower entropy play a more steady role in the global network.
In economic terms, higher entropy implies greater exposure to short-term shocks and relocation dynamics, whereas lower entropy reflects more persistent mining presence and lower adjustment volatility. Countries with relatively lower entropy (e.g., the USA) may reflect more stable regulatory environments and more established mining infrastructure, leading to more persistent mining activity over time. In contrast, higher entropy values may be associated with more volatile relocation dynamics in response to changing economic or policy conditions. However, given the relatively short time dimension of the data, such interpretations should be treated with caution.
Overall, these findings imply partial decentralization since the high PE estimations indicate that countries do not maintain their positions permanently. This interpretation is consistent with Lin et al. [
25], as they show that mining activity responds strongly to policy and economic changes that affect profitability and network stability.
3.3.2. Cross-Sectional Theil Index
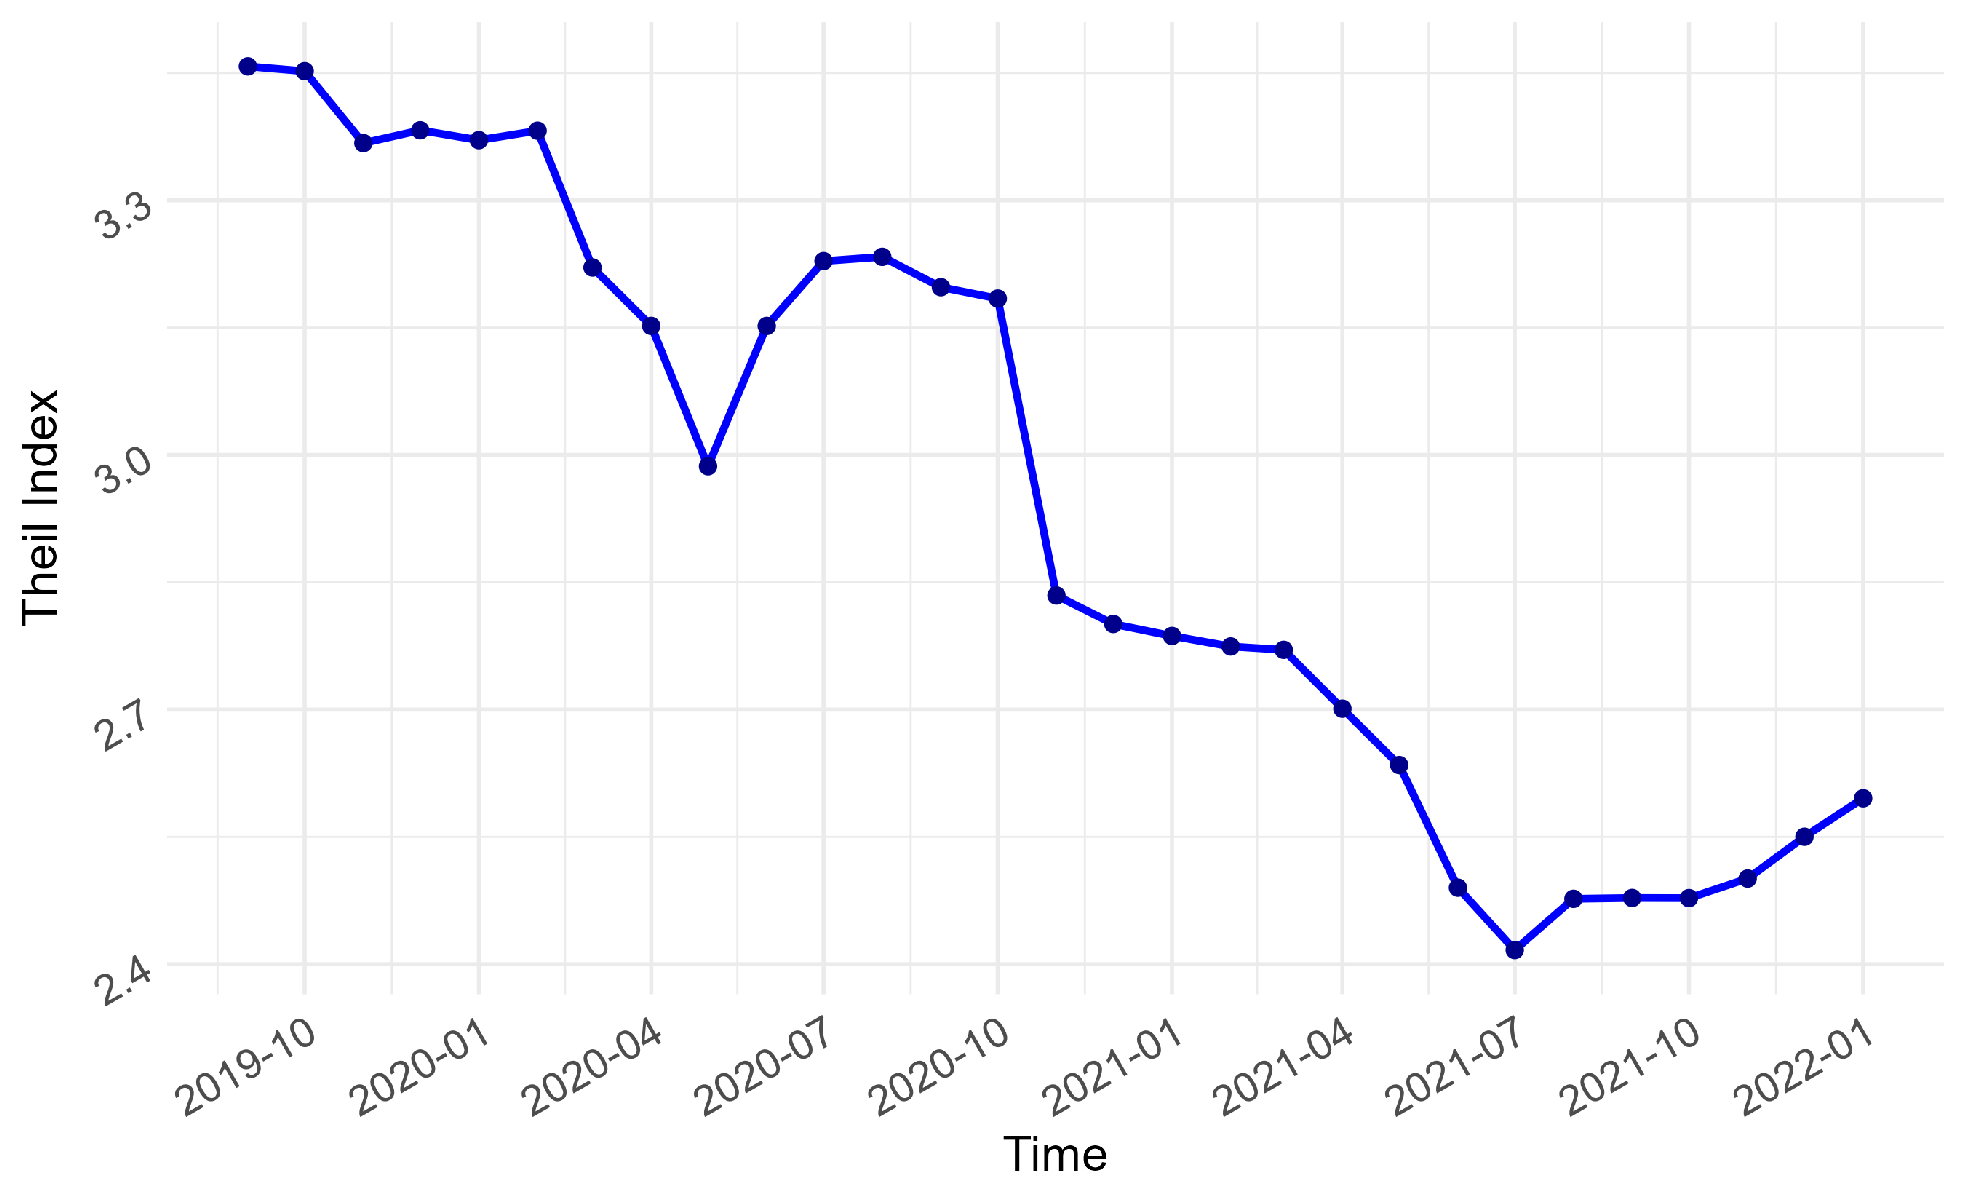
The Theil index is estimated cross-sectionally in order to capture inequality in global hashrate shares. Its average is 2.93, which suggests substantial concentration, while a significant shift in how mining power is distributed is revealed. The Theil index is above 3 at the beginning of the examined period, but declines and takes values around 2.5 at the beginning of 2022 (
Figure 3). This decrease suggests that Bitcoin mining has spread to more countries during these 29 months. This geographic spread is further supported by the raw standard deviation, which also decreases from 0.074 to 0.044. Although this reflects partial decentralization in regard to China’s dominance, a Theil value of 2.5 shows that mining is still concentrated in a few key regions. In other words, even though dominant countries may have lost part of their share, most countries contribute little or only modestly to the global hashrate.
3.3.3. Cross-Sectional Symbolic Entropy
Cross-sectional symbolic entropy (CSE) is also used to quantify decentralization patterns. Each month, countries are classified according to their hashrate share as high (≥5% of global share), medium (1–5%), or low (<1%) and the proportion of countries in each category is used for the computation of CSE. Higher values correspond to a more even distribution across groups, while lower ones indicate stronger concentration in a few countries.
The estimated CSE values range from 0.23 to 0.37 over time. Entropy rises when inequality declines and falls when concentration intensifies. The inverse relationship reflects the fact that entropy increases as mining shares become more evenly distributed and decreases when activity becomes more concentrated. This symbolic approach confirms our previous findings. Although there has been a partial shift in mining power, participation is still far from uniform across the globe.
As a robustness check, an alternative threshold definition is also considered, i.e., high ≥ 10%, medium 2–10%, low < 2%. While stricter thresholds naturally lead to lower entropy levels, reflecting a higher degree of concentration, the temporal dynamics and overall patterns remain highly consistent across specifications. This robustness reflects the highly skewed distribution of mining shares, where relative country positions remain stable despite changes in categorical classifications.
3.4. Convergence Analysis
To test whether cross-country differences in Bitcoin mining shares are narrowing over time, we apply three complementary approaches: -convergence, stochastic convergence, and Phillips–Sul club convergence analysis.
3.4.1. -Convergence Results
We test
-convergence in Bitcoin mining activity using the dispersion of adjusted shares (
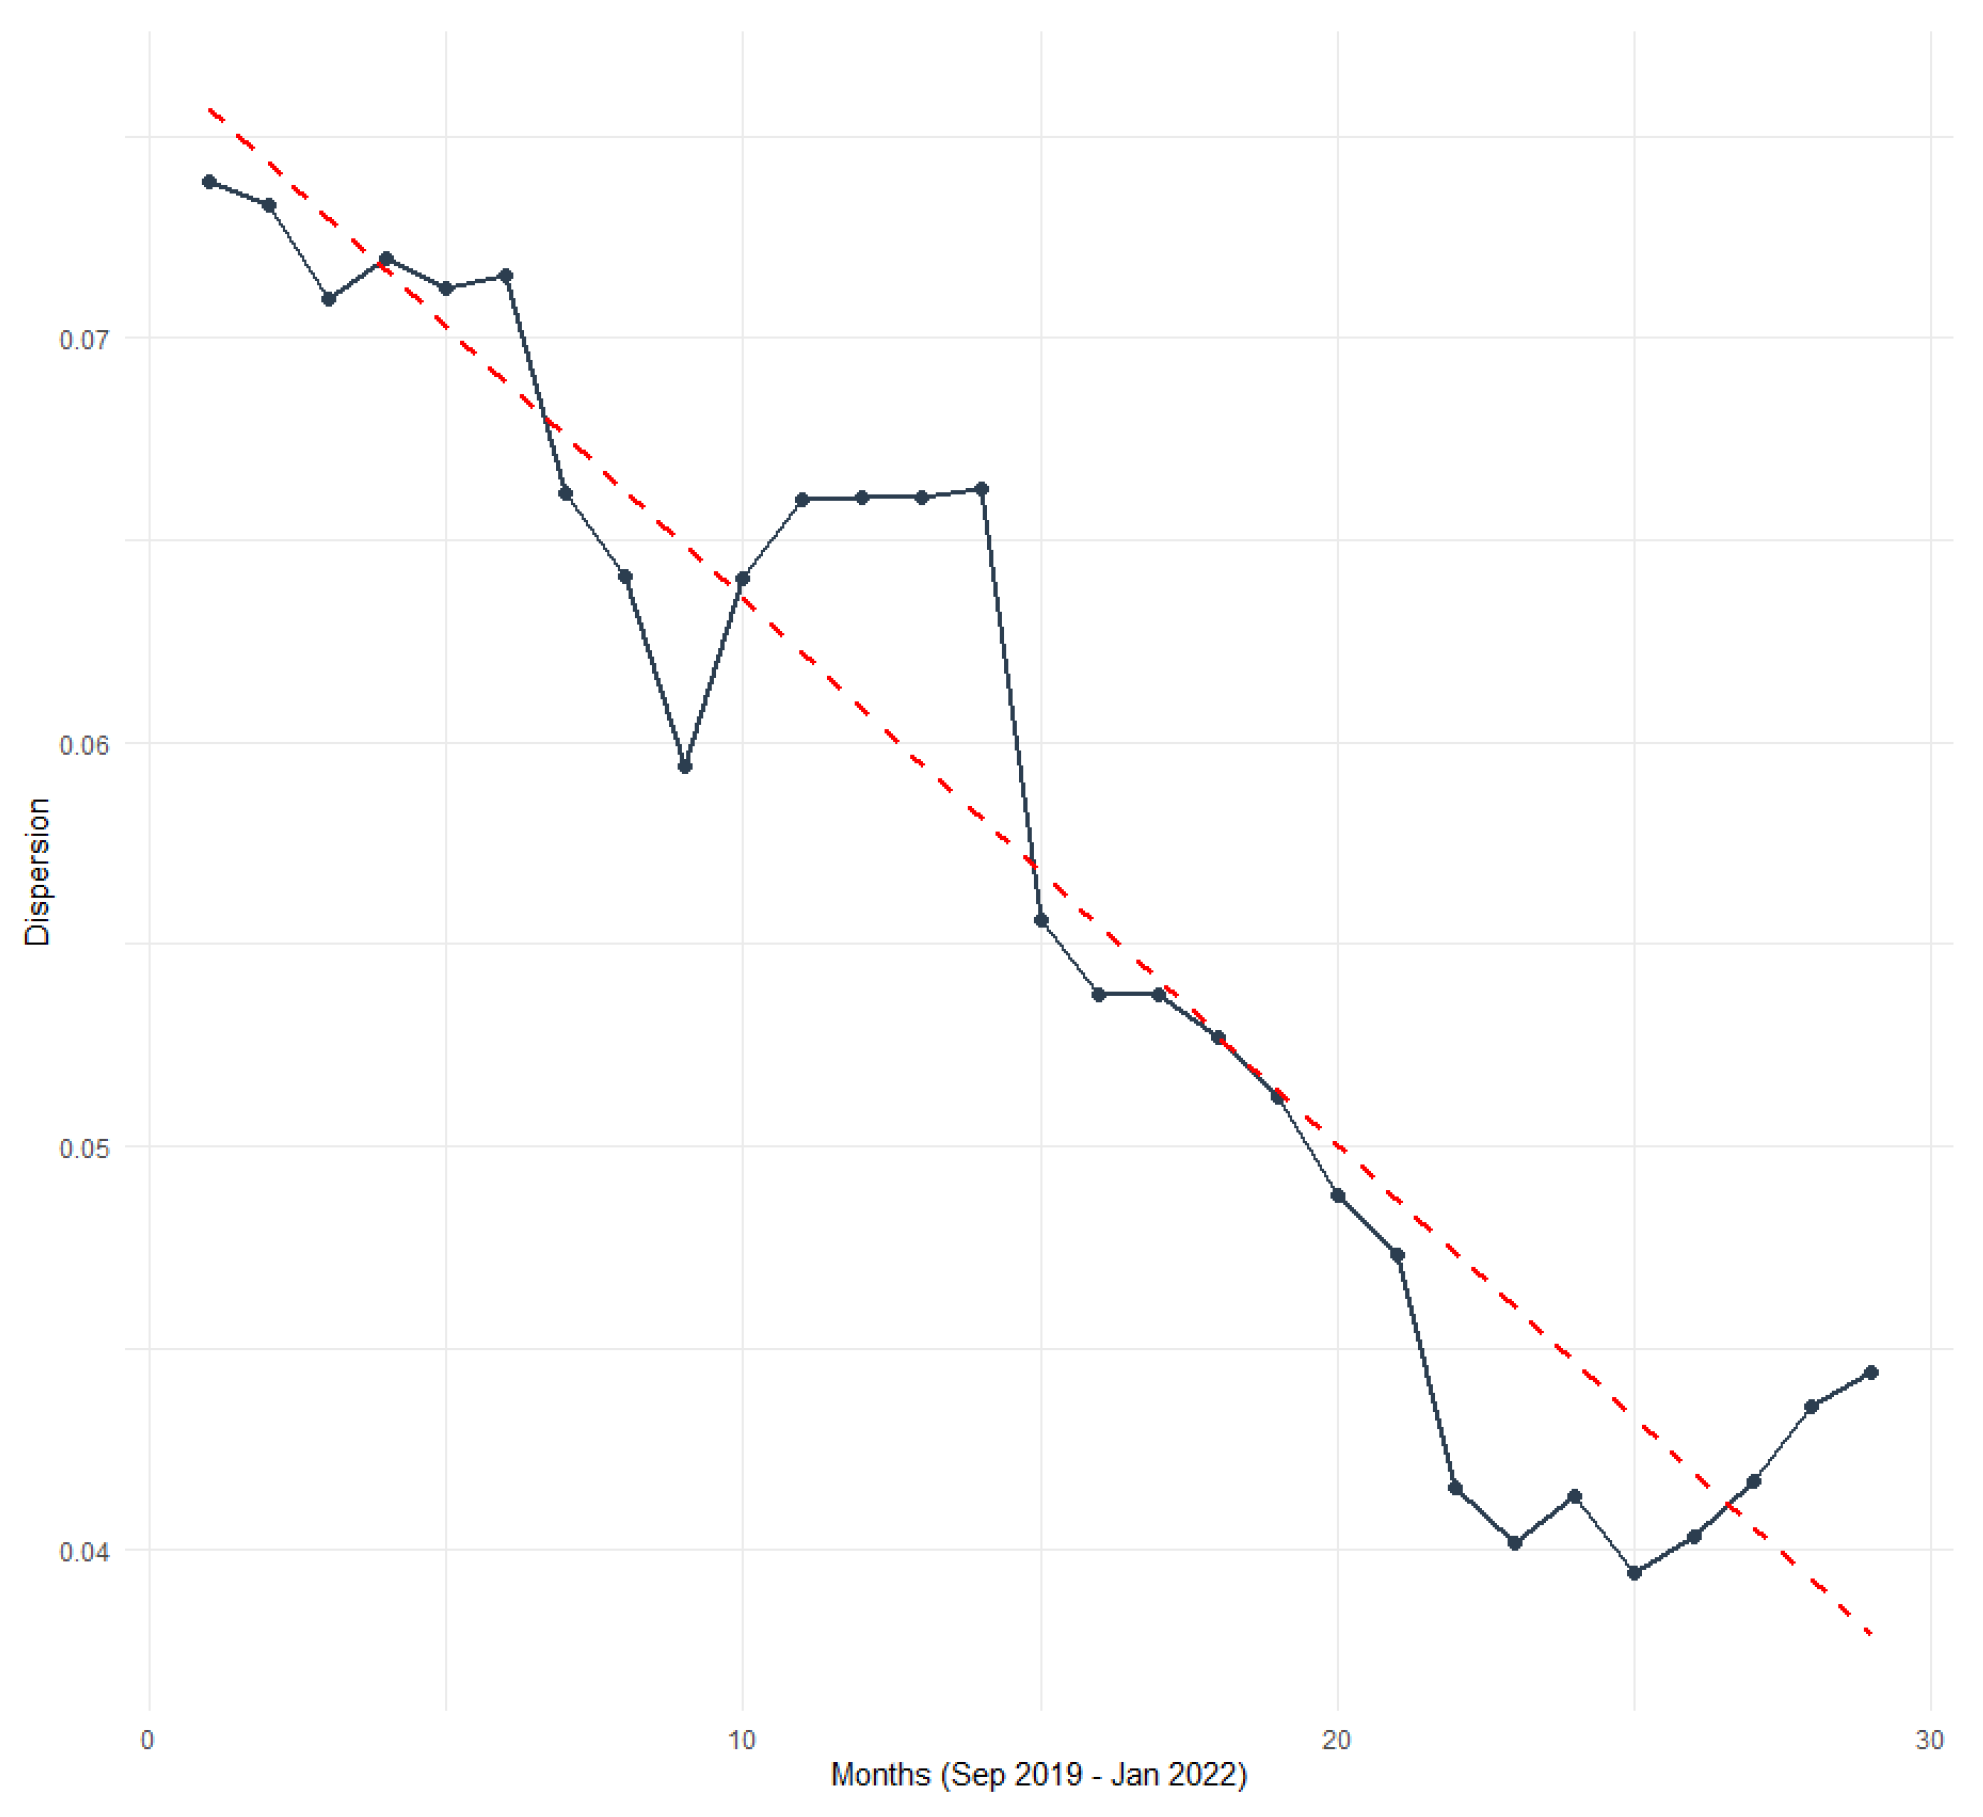
). The estimated time trend for the cross-sectional standard deviation (dispersion) is negative and statistically significant. Specifically, the coefficient of the time trend is
(
,
), with a high
of (0.909), indicating a pronounced and systematic decline in the dispersion across countries. Although the magnitude of the coefficient is small, it provides clear evidence of
-convergence, as cross-country differences in mining shares declined steadily over the sample (
Figure 4).
This finding is further confirmed when using the coefficient of variation (CV) as a scale-invariant measure of relative dispersion. A negative () and statistically significant () time trend is again obtained, and a high goodness-of-fit too (). Overall, the results suggest that the geographic distribution of mining activity became progressively more decentralized and balanced over the sample period, even though significant heterogeneity across countries remains.
3.4.2. Stochastic Convergence Results
We begin our analysis by testing for cross-sectional dependence (CD) in our panel. Given that mining shares are inherently linked, we expect significant cross-sectional correlation across nations. The Pesaran CD test strongly rejects the null hypothesis of cross-sectional independence ().
To account for this dependence and ensure reliable inference, we estimate a two-way fixed-effects model with Driscoll–Kraay robust standard errors. The estimated persistence parameter on the lagged relative share () is (SE = 0.0539). The coefficient is highly statistically significant (), indicating clear evidence of mean reversion and rejecting the hypothesis of divergence.
The model has a high explanatory power (within ). The estimated magnitude of implies that deviations of a country’s mining share from the global mean are transitory, with a speed of adjustment of approximately 20.4% per month. To further quantify the adjustment process, we compute the half-life of shocks, defined as the time required for a deviation to decline by 50%: (). Half of any idiosyncratic shock to a country’s hashrate share is absorbed by the global market within approximately 3 months ( months), suggesting a rapid adjustment process, especially when compared to many macroeconomic variables, where shocks typically persist for much longer periods. This reflects the high mobility and flexibility of Bitcoin mining activity.
Mean-reverting dynamics in countries’ relative mining shares are found by the stochastic convergence analysis. This does not necessarily imply uniform adjustment across all nations. In practice, structural factors such as electricity costs, regulatory environments, and infrastructure differences may lead to heterogeneous transition paths. Consequently, even in the presence of overall mean reversion, countries may converge toward different steady-state levels rather than a single common equilibrium. To account for this, we apply the Phillips–Sul club convergence analysis to look for groups of countries that move toward their own long-run targets.
At this point, we should note that the stochastic convergence specification is based on relative log deviations, which removes the common adding-up constraint of shares. Therefore, these findings mitigate concerns that the observed convergence is purely mechanical.
3.4.3. Club Convergence Results
The Phillips–Sul (PS) club convergence test is applied to the adjusted shares () in order to further investigate the convergence dynamics within our panel of 105 countries. The PS clustering algorithm is implemented across the recommended range of trimming parameters .
The results are consistent with global convergence. Specifically, the PS test identifies a single convergence club for all examined trimming values (see
Table 3). The null hypothesis of overall convergence cannot be rejected, as the computed
t-statistic exceeds the critical value of
at the 5% significance level. The results are consistent with convergence of the full country panel toward a common long-run path, i.e., convergence in relative transition paths rather than convergence to identical levels. Given the relatively short time dimension of the sample, these findings should be interpreted as evidence of transitional convergence dynamics rather than definitive long-run equilibrium convergence.
In addition, the estimated convergence coefficient () is positive across all trimming specifications and becomes statistically stronger as the trimming parameter increases. Although the magnitude of varies with , it consistently lies within the interval , implying slow but stable convergence in relative mining shares. Given the relatively short time dimension (), we further examine the small-sample stability of the Phillips–Sul procedure over a wider range of trimming parameters (trims between 0.16 and 0.35), obtaining consistent convergence results.
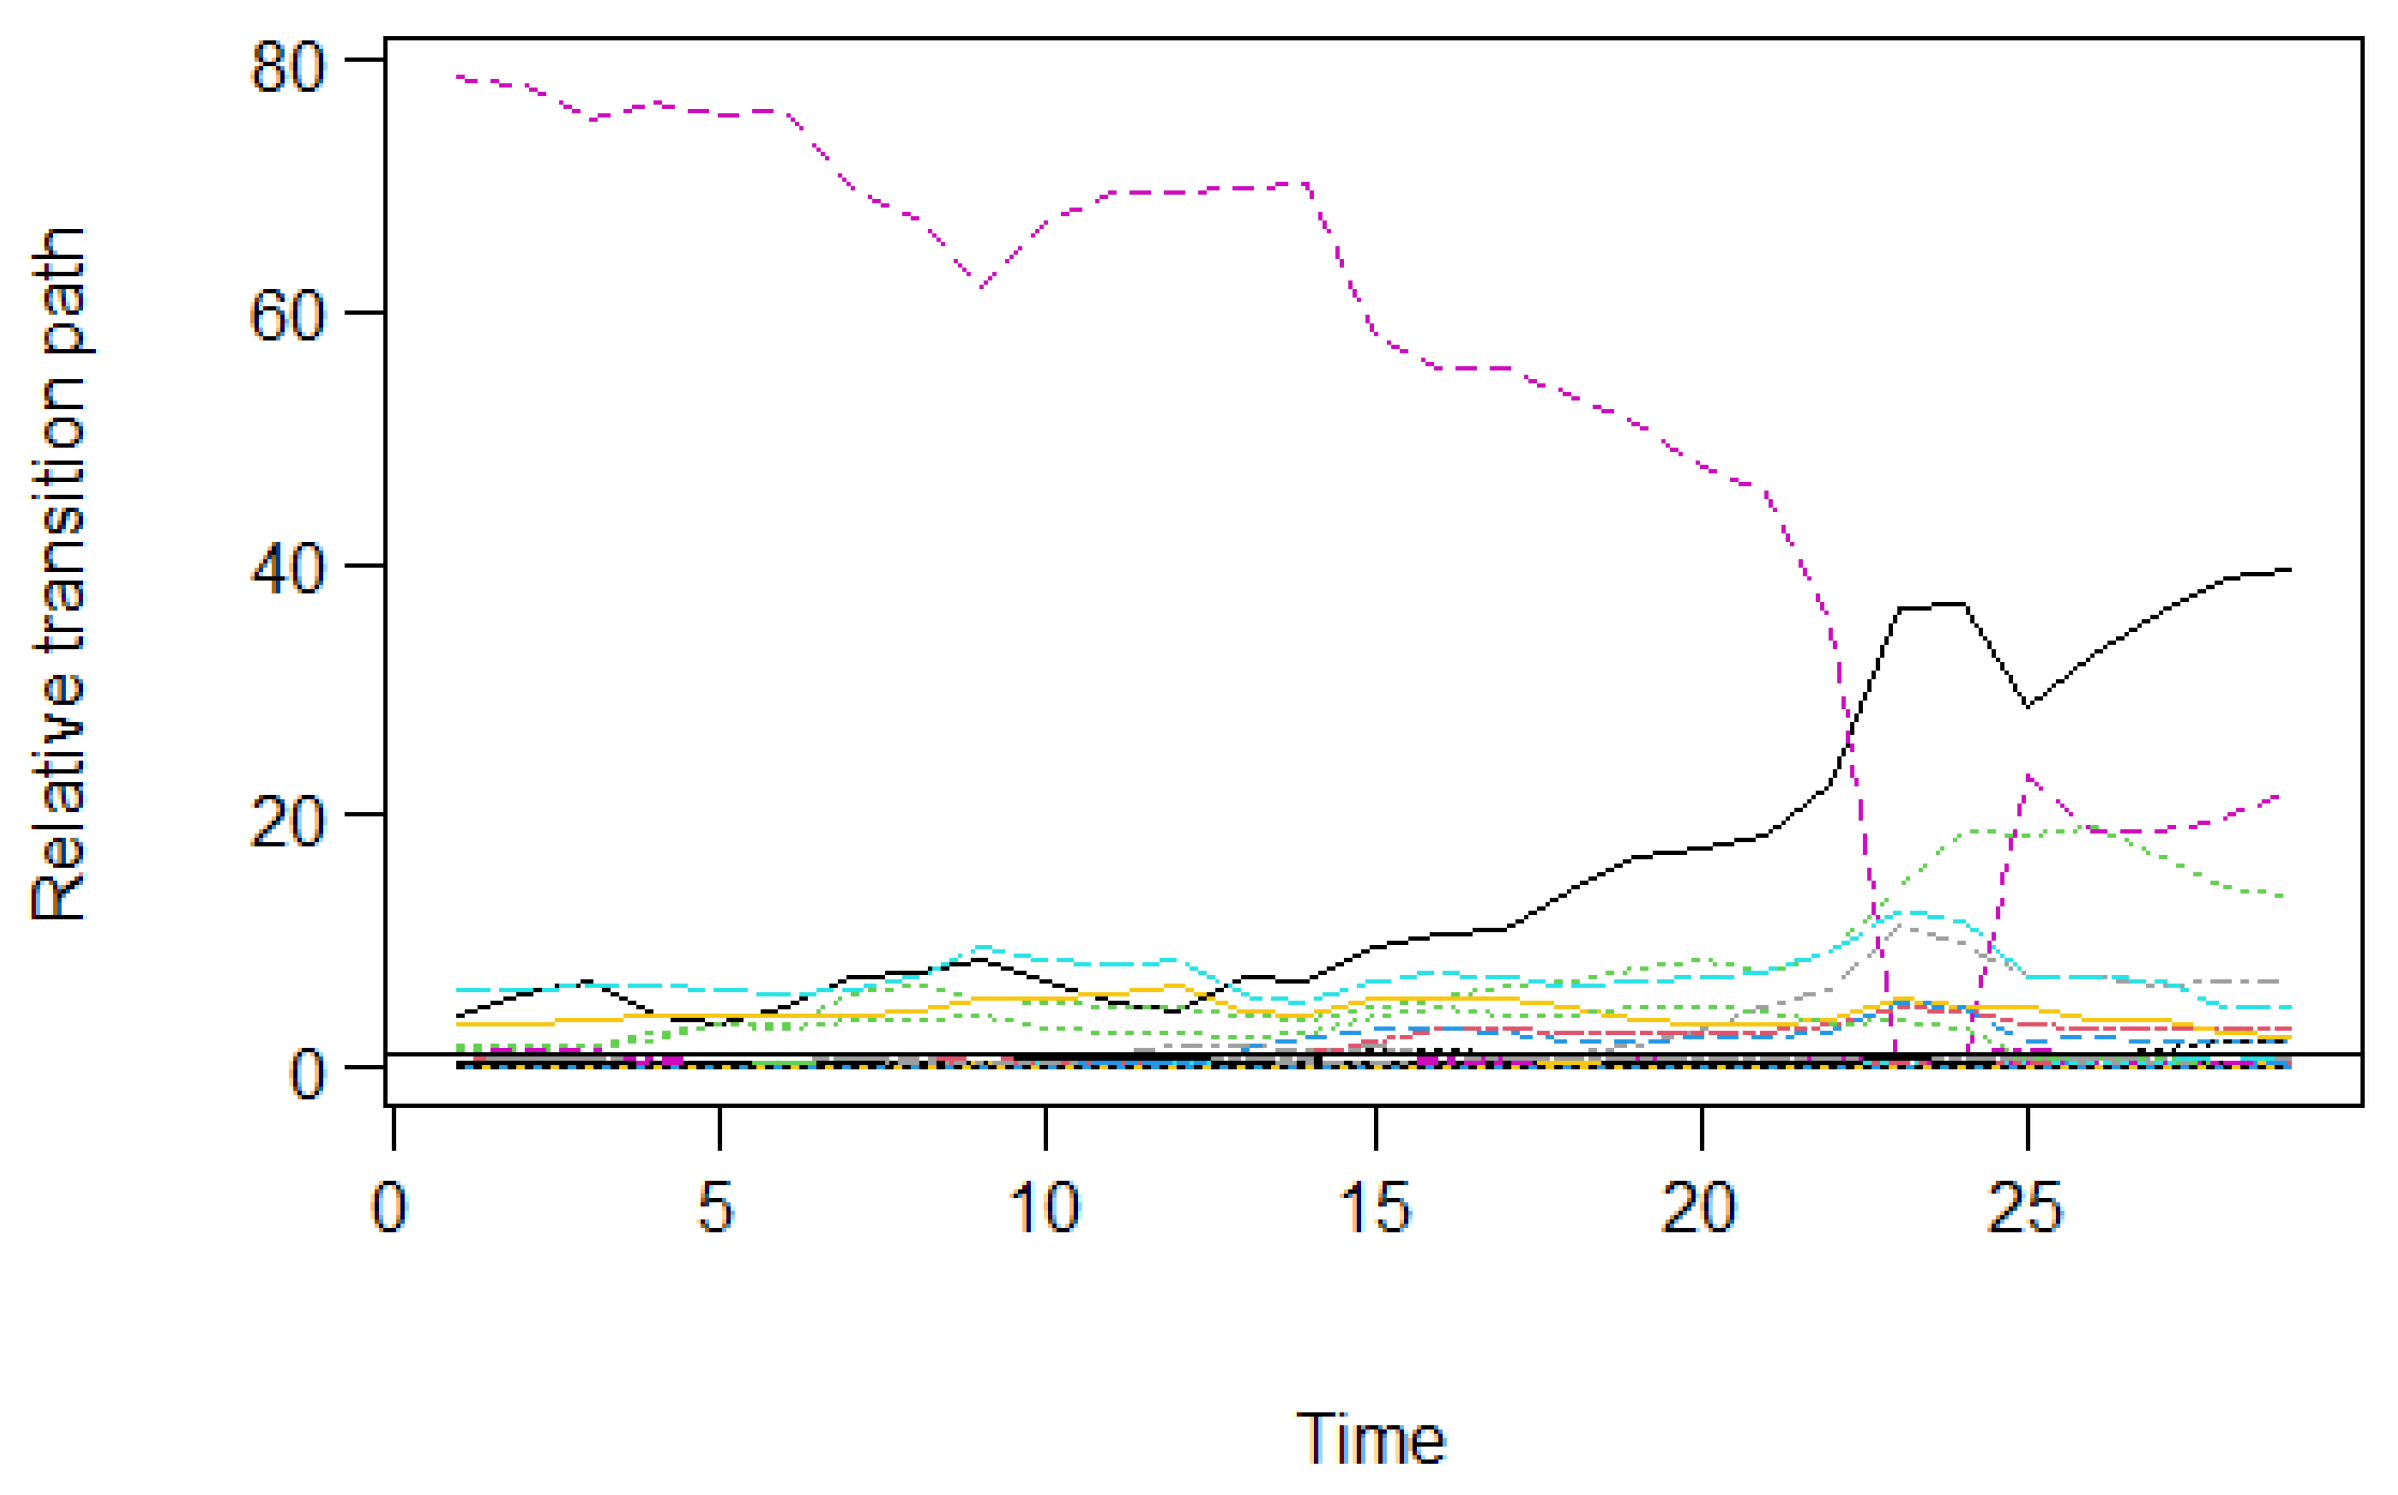
The plot of the relative transition paths (
) illustrates the statistical evidence of convergence in a single club (
Figure 5). The sample initially exhibits substantial heterogeneity, with several countries located far from the panel average. Over time, however, relative positions seem to converge toward the unity line. The remaining fluctuations toward the end of the sample are consistent with short-run volatility and idiosyncratic shocks and with the moderate estimated speed of convergence.
The Phillips–Sul transition parameter is defined in terms of positive relative levels. Accordingly, we avoid applying a logarithmic transformation within the ratio, as this may distort transition paths when the data are bounded shares. The convergence results remain robust to alternative positive rescalings of the shares, such as or mapping the shares to the interval .
3.5. Heterogeneity in Long-Run Mining Positions
Although the PS test indicates a single global convergence club, the estimated long-run relative positions () reveal meaningful heterogeneity within the converging panel. The distribution of is strongly right-skewed, implying an asymmetric convergence process. Convergence above the club average is suggested for values of , whereas below it. A small number of countries seem to account for a disproportionately large share of global hashrate capacity, while most countries remain near the lower tail.
Considering only the 6 first months of the sample, 5.7% of countries are above the panel average (), highlighting the high concentration of mining activity in a few hubs. At the end of the sample period (6 last months), 10.5% of the countries exhibit . Thus, a limited number of countries move toward the leading group. The dominance of a few major mining hubs is supported by the fact that nearly 90% of the countries remain below the panel average. These results help explain the relatively slow convergence speed.
The obtained leading mining countries from the end of the sample period remain unchanged under different specifications (15% and 20% of the sample), supporting the robustness of the findings and pointing to a persistent structural reallocation rather than a temporary fluctuation.
Table 4 reports the ten dominant mining countries at the start and end of the sample period, the long-run relative positions, and the corresponding standard deviation.
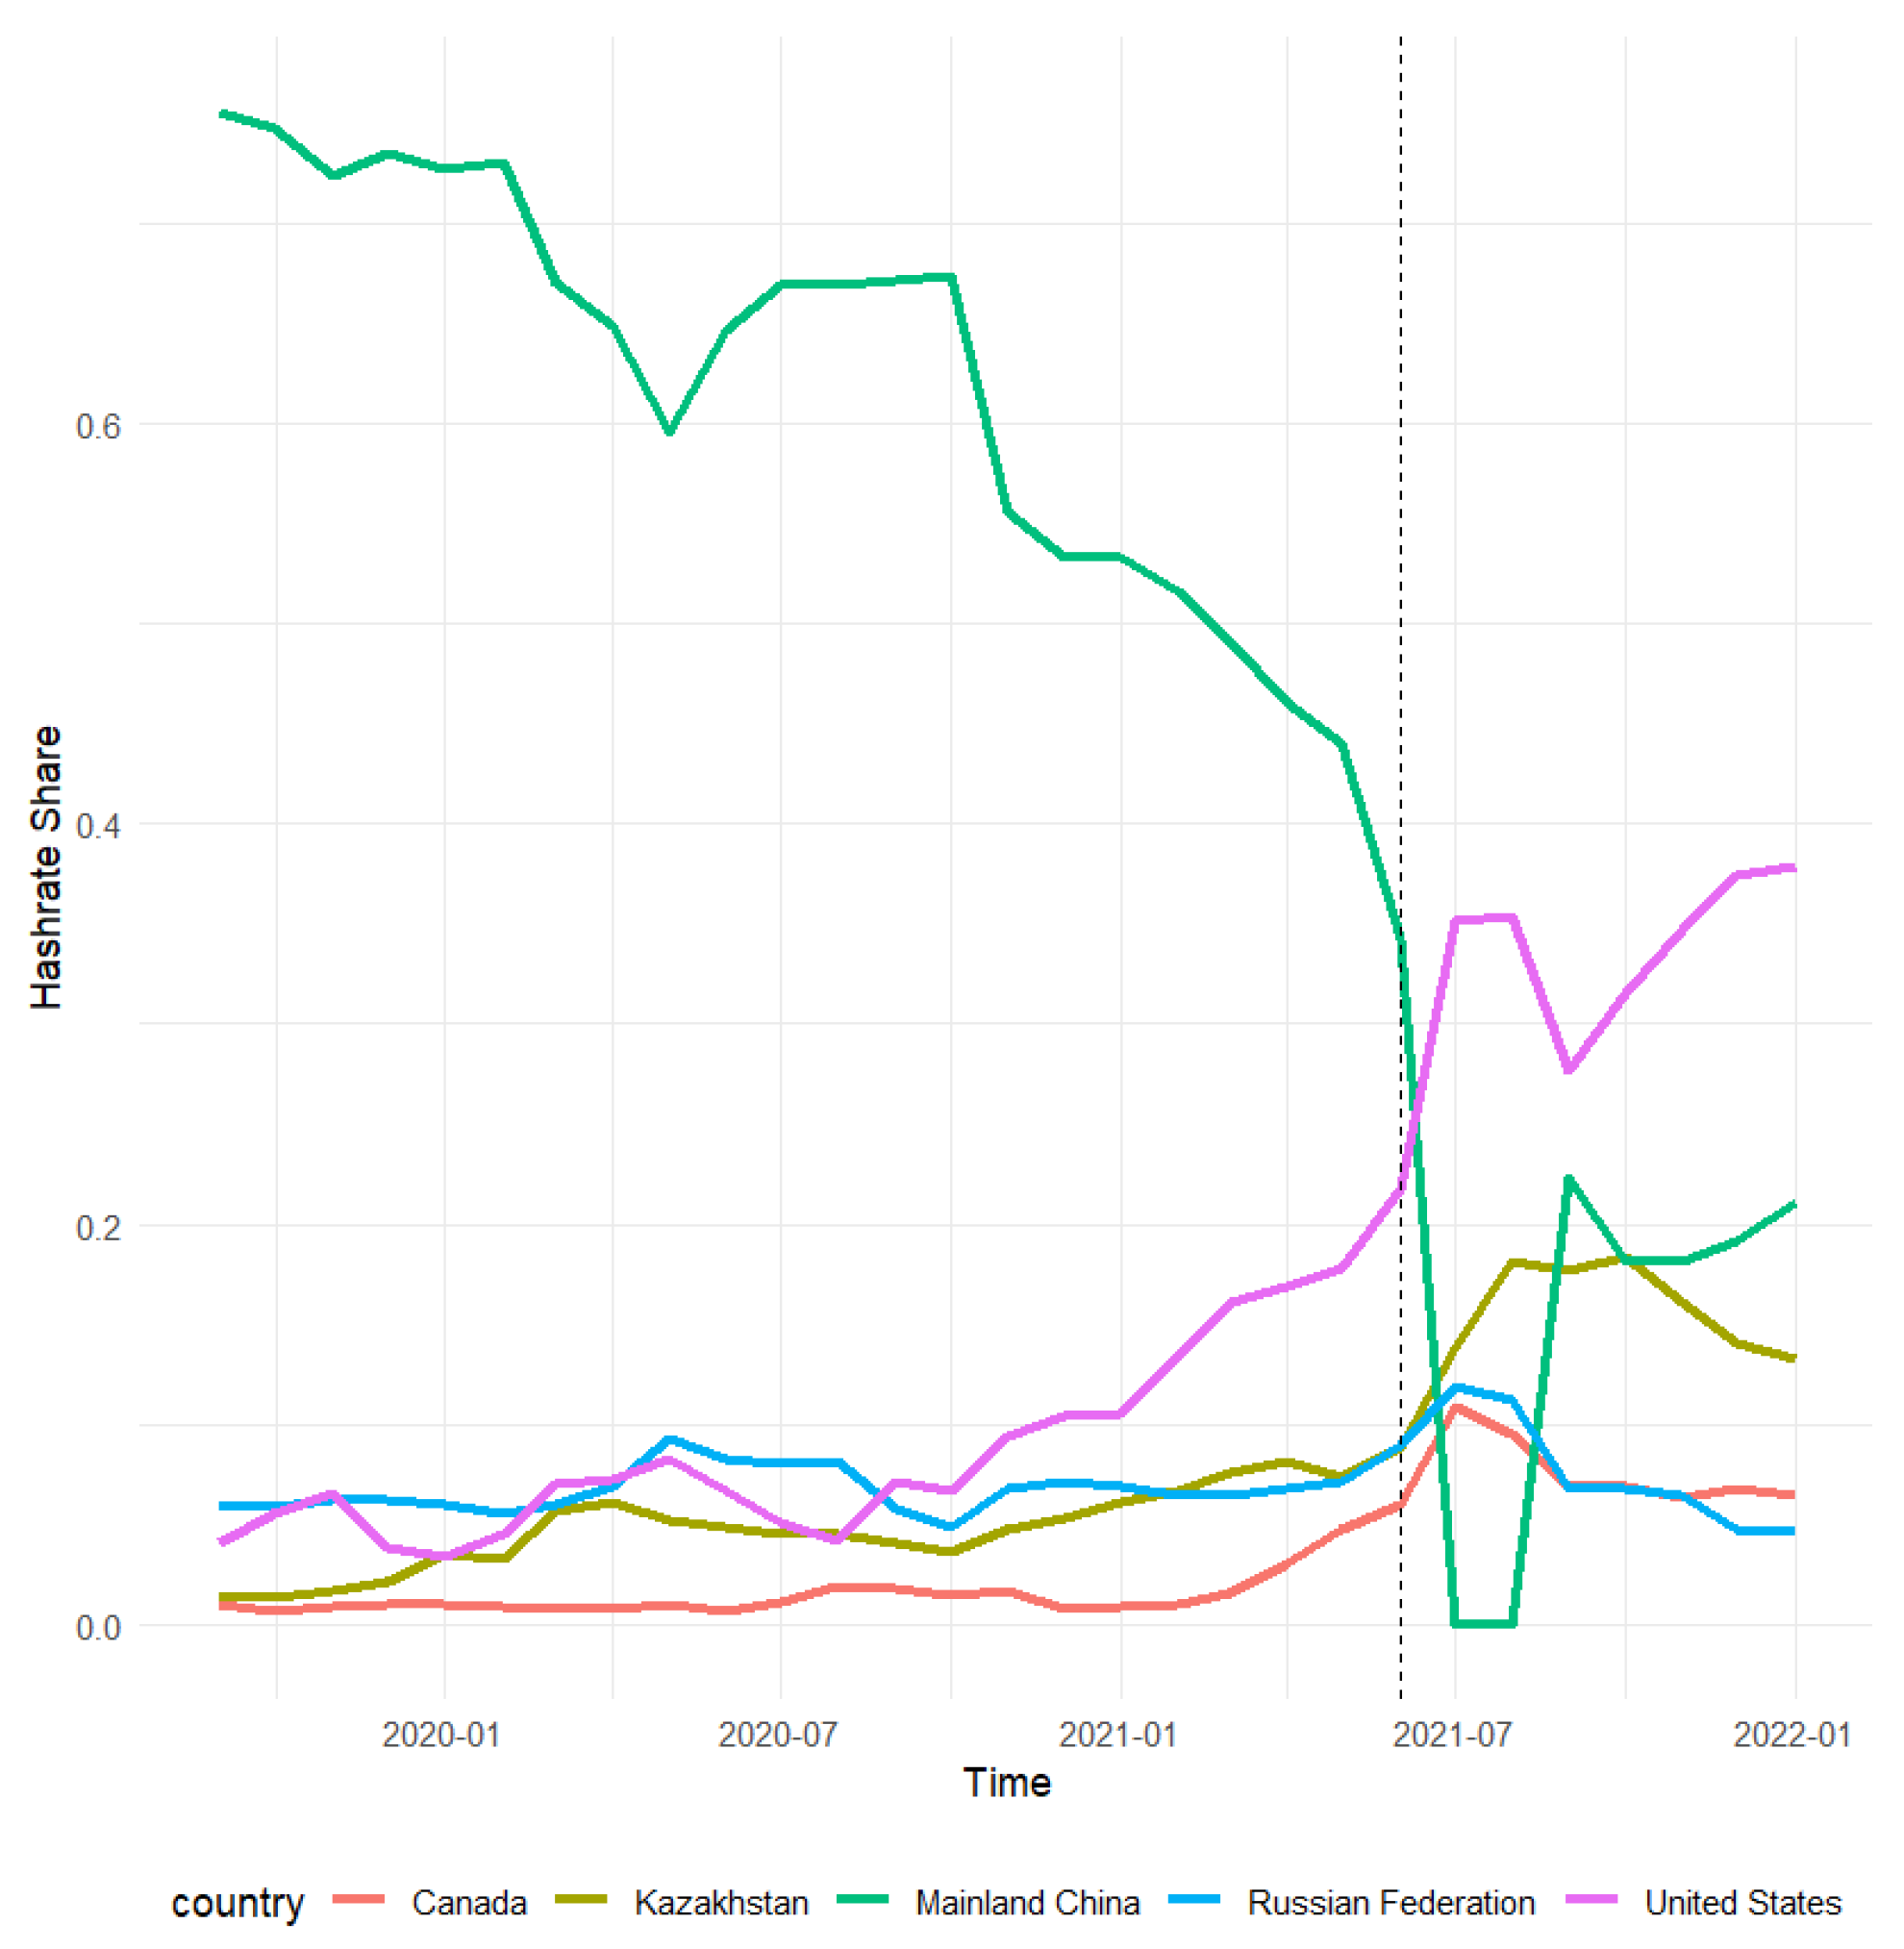
Figure 6 illustrates the evolution of hashrate shares for the five leading mining countries, as identified in the final period. The figure highlights the sharp decline in China’s share following the 2021 mining ban and the rapid rise of the United States, along with a broader redistribution of mining activity across countries.
4. Discussion
The growth in total Bitcoin electricity consumption over the past decade is important for explaining the observed geographic reallocation of mining activity. During the examined period, mining hardware improved substantially and China’s 2021 ban triggered a large-scale relocation of miners, with the United States emerging as the leading mining country, followed by China and Kazakhstan. This redistribution of hashrate illustrates the highly adaptive and geographically mobile nature of the Bitcoin mining industry. China’s mining ban seems to have accelerated the geographic redistribution of mining activity, since the decline in dispersion and the mean-reverting dynamics indicate that relocation forces were already present in the mining network.
The declining Theil index, as well as the -convergence analysis, clearly show the gradual reduction in mining dispersion. In addition, stochastic convergence points to mean-reverting dynamics in relative mining shares. Finally, a single convergence club is identified by the Phillips–Sul analysis, which suggests that countries follow similar adjustment dynamics over time, even though differences in their relative mining shares persist. This distinction explains how convergence can coexist with the persistent heterogeneity observed in long-run mining shares. This is consistent with the high mobility of mining capital, as reflected in the short estimated half-life ( months). Bitcoin mining activity responds quickly to changes in economic conditions, energy costs, and regulatory environments, allowing mining capacity to move easily across countries. These results point to a dynamic market structure in which emerging mining hubs partially narrow the gap with established leaders. The consistently high permutation entropy further supports the highly dynamic nature of Bitcoin mining.
The observed core–periphery structure is in agreement with the tendency of miners to locate in regions with abundant and low-cost energy resources [
4,
35]. Energy availability, pricing, and infrastructure affect the long-run position of each country and explain the differences between dominant and peripheral hubs [
36]. In this sense, Bitcoin mining illustrates the geography of digital infrastructure, where computational activity relocates globally in response to energy market conditions.
The dominance of a few major hubs is obvious from the estimated long-run positions of the countries.
Table 4 further illustrates that the leadership of China has transitioned to the United States. After the 2021 regulatory shock of the mining ban, China remains a dominant hub but exhibits large fluctuations (
) in response to policy shocks [
37], while most peripheral countries contribute very little to the global hashrate capacity. Our results are consistent with the geographic patterns reported by CCAF [
38].
The persistent core–periphery differences are due to the differences of countries regarding their infrastructure, since mining profitability depends on reliable infrastructure and economies of scale [
39,
40]. Restrictive national policies may redirect mining activity to new locations but will not reduce it globally. Therefore, policies based solely on prohibitions may have limited long-term effectiveness. More effective policy approaches may involve energy-market mechanisms, including electricity market design, carbon pricing, and incentives that encourage the use of renewable and low-carbon energy sources in major mining hubs, such as in the United States and Kazakhstan. Bitcoin mining can act as a flexible electricity load, helping to stabilize energy systems by utilizing excess renewable power and reducing demand when required. This adaptability supports the integration of renewables and enhances the financial viability of renewable energy investments [
41,
42,
43]. Conversely, in smaller or emerging mining hubs, policies should prioritize attracting mining operations by offering consistent regulations and access to affordable energy sources [
44]. Continued monitoring is important in peripheral locations, where regulatory or cost shocks could trigger sudden reallocations of hashrate.
The volatility of mining activity implies that electricity systems hosting large mining operations may face sudden changes in demand, creating challenges for grid management and longer-term energy planning [
1,
41]. The high mobility and variability of mining activity illustrate the importance of coordination between energy policy and digital infrastructure. At the same time, the concentration of mining activity in a few countries can also impose significant local costs. Evidence from Upstate New York shows that crypto-mining increased annual electricity bills by about USD 88 for the average household and USD 168 for small businesses [
45].
Our findings have broader theoretical implications regarding digital capital mobility. Compared to the usual energy-intensive industries, which are usually limited in terms of their infrastructure and high relocations costs, Bitcoin mining is more flexible as the equipment can be moved anywhere. This flexibility enables it to reposition operations rapidly in reaction to any energy price changes, regulation or policy incentives. This is reflected in the quick readjustment period which we obtained. Consequently, industries based on digital infrastructure benefit from global connectivity and also localized advantages. This means that the spatial organization of digital production is increasingly shaped by economic and regulatory environments in different regions, not by physical limitations.
5. Conclusions
The key findings of this study indicate clear changes in Bitcoin mining, both in energy consumption and geographic distribution. Electricity consumption has increased overtime, but at a gradually declining growth rate. Moreover, mining is now spread across more locations. Utilizing entropy and convergence measures, we evaluate the evolution of mining capacity and reveal that the mining activity changes very rapidly across countries. Also, there are still core–periphery asymmetries that are persistent, which implies that mining is concentrated in a few countries. The partial decentralization implies that while systemic resilience improves, the persistence of dominant hubs maintains exposure to geographically concentrated regulatory and energy shocks. Finally, the panel applied in this research is particularly informative, as it captures the geographic distribution of mining activity before the increasing use of VPNs and intermediary pools that led to a less reliable country-level attribution.
Our findings suggest that there is partial decentralization in Bitcoin mining and vulnerabilities in the mining network still exist. The mining network is sensitive to shocks affecting dominant hubs, while the core–periphery structure increases exposure to regulatory interventions, energy shocks, and coordinated policy actions.
The policy implications of mining decentralization differ across types of economies. For dominant mining hubs, such as large-scale hosting countries with substantial installed capacity, policy priorities primarily concern grid stability, energy market integration, and the management of peak electricity demand. In these cases, mechanisms such as demand-response programs, dynamic pricing, and integration with renewable energy sources are particularly relevant. In contrast, for smaller or peripheral economies, where mining activity is more volatile and often opportunistic, policy considerations focus on regulatory clarity, risk management, and the avoidance of excessive dependence on short-term mining inflows. These economies may benefit more from targeted regulatory frameworks and cautious integration strategies, rather than large-scale infrastructure commitments.
Monitoring the mining activity in dominant hubs is essential, as policy changes in these locations may have disproportionate global effects. Sudden relocations of mining activity can be mitigated by more stable regulatory frameworks. High geographic dispersion can be encouraged by stable access to energy and reduced entry barriers, which would diminish concentration risks. These suggestions aim to strengthen network resilience by addressing the structural asymmetries that persist.
We use complementary methods to study the distribution and evolution of the global Bitcoin mining network. The Theil index measures the monthly cross-sectional inequality in the distribution of mining shares. Another intuitive measure of distributional dynamics is the proposed cross-sectional symbolic entropy (CSE). The -convergence analysis captures the evolution of dispersion over time, while the Phillips–Sul framework assesses the dynamic convergence of transition paths. Our results consistently point to increasing decentralization, although important structural differences across countries persist. However, given the relatively short time dimension of the panel, the identified convergence patterns should be interpreted as transitional adjustments in the geographic allocation of mining activity, rather than evidence of a fully established long-run steady-state equilibrium. The econometric and entropy-based techniques have been combined, which offers a complementary approach to analyzing the mining landscape, allowing us to assess both the evolution of concentration and dispersion, and the stochastic and structural dynamics of geographic decentralization.
Two major events are included within our sample period: the 2020 Bitcoin halving and China’s ban. Our analysis does not require the detection or formal modeling of structural breaks, but knowing these events helps explain the economic shocks that lead to persistent country-specific changes. The Bitcoin halving changed profitability conditions across countries, creating persistent local differences. China’s ban triggered a large-scale hashrate relocation, in which a few hubs absorbed most of the capacity, while peripheral economies remained more volatile. For policymakers, understanding the pace of adjustment and the effects of such structural shocks is crucial for anticipating future reallocations of global hash power.
This study contributes to the literature on cryptocurrency, energy economics, and economic geography in several ways. The study introduces a novel empirical framework that combines entropy measures with convergence analysis to assess mining decentralization. It also provides evidence of changing energy consumption patterns alongside gradual geographic decentralization. Finally, it highlights the persistence of core–periphery asymmetries despite global convergence in mining activity with broader implications for cryptocurrency.
The main limitation of this study is the relatively small sample size of the datasets. The electricity consumption series, though, covers the full history of Bitcoin mining. However, early observations may overweight initial growth dynamics and lead to upward-biased trend estimates, particularly under exponential specifications. Each method has different sensitivity on the limited time dimension of the panel. Permutation entropy estimates may be affected by upward finite-sample bias, but results are qualitatively interpreted, while robustness checks support the main findings. In contrast, the Theil index and cross-sectional symbolic entropy are computed at each point in time and are not directly affected by the time dimension of the panel. The -convergence analysis is also based on cross-sectional dispersion, and the estimated trend remains informative for . For stochastic convergence, potential small-sample bias is addressed within the dynamic panel framework and taken into account in the interpretation of results. The Phillips–Sul procedure is the most sensitive to the short time dimension and results are interpreted with caution, i.e., are viewed as reflecting transitional convergence dynamics rather than definitive long-run equilibrium behavior, although the main findings remain robust across alternative trimming parameters and data rescalings. Further, hashrate shares are bounded in the interval and are inherently interdependent, i.e., a decline in one country’s share implies a gain elsewhere. Possible concerns related to the adding-up constraint are mitigated by the mean-reverting results based on relative log-deviations.
Future research could investigate the causal determinants of long-run mining positions (
), for example, using discrete-choice or panel econometric frameworks with country-level fundamentals such as electricity prices, GDP, internet penetration, and renewable capacity. Panel approaches, including fixed-effects or instrumental variable methods, could account for heterogeneity and potential endogeneity in key drivers such as energy costs and regulation. Extending the convergence analysis beyond 2022 would require alternative hashrate estimates that better capture the role of VPNs and mining pools. Additional questions include the relationship between mining decentralization and market dynamics, as well as the environmental implications of mining relocation across energy regimes, particularly in light of the growing dominance of a few hubs, such as the United States, which now accounts for roughly 40% of global hashrate [
46].