1. Introduction
Cryptocurrency markets present distinct optimization challenges for trading strategy development. Operating 24/7, these markets exhibit volatility 3–4 times higher than equity indices [
1,
2], with daily price fluctuations frequently exceeding 10%. Over 420 million global cryptocurrency owners [
3] drive retail-dominated trading where price movements reflect sentiment and speculation rather than fundamentals, distinguishing crypto from institutional forex or equity markets. This extreme volatility and continuous operation require parameters that remain stable across rapidly shifting market conditions. Optimization methods proven effective in traditional asset classes may not translate directly to cryptocurrency trading.
Despite these challenges, practitioners widely adopt hyperparameter optimization frameworks developed for machine learning (particularly Bayesian tools like Optuna and Hyperopt) [
4] without rigorous financial validation. These methods excel in ML benchmarks with stable objective functions, but cryptocurrency trading presents fundamentally different characteristics: noisy, non-stationary objective landscapes where parameter effectiveness shifts across market regimes [
5,
6]; limited training data; and regime-dependent performance complicating cross-validation. Inappropriate optimization risks wasted computational resources and deployment of fragile parameters. Does optimizer choice materially affect strategy performance? Do optimizer rankings depend on strategy complexity or parameter space characteristics? Can optimized parameters generalize across cryptocurrency pairs?
We systematically compare three optimization methods (Random Sampling, Tree-Structured Parzen Estimator, and Differential Evolution) on cryptocurrency trading strategies through 36 factorial experiments: 3 strategies (3–5 hyperparameters) × 3 optimizers × 4 pairs (BTC/USDT, ETH/USDT, INJ/USDT, SOL/USDT), totaling 14,400 backtesting trials. Out-of-sample testing (6-month training, 3-month testing) assesses temporal stability across multiple cryptocurrency pairs. The study period (January–September 2025) captures diverse market conditions including bull trends, bear corrections, and consolidations.
This study addresses four research questions: (1) How do convergence speed and sample efficiency compare across Random Sampling, TPE, and Differential Evolution when optimizing cryptocurrency trading strategies? (2) Does optimizer performance depend on strategy complexity, measured by hyperparameter count (3, 4, or 5 parameters)? (3) Do optimized parameters generalize across cryptocurrency pairs? (4) What are the systematic failure patterns and limitations of each optimization method?
This paper proceeds as follows:
Section 2 reviews relevant literature on Bayesian and evolutionary optimization methods in financial contexts,
Section 3 details the experimental methodology including validation protocols,
Section 4 presents empirical results across 36 experiments, and
Section 5 discusses theoretical and practical implications alongside limitations and future research directions.
2. Literature Review
Trading strategy parameter optimization in cryptocurrency markets creates unique challenges beyond traditional asset classes. Parameters must remain stable across extreme volatility, continuous 24/7 operation enables perpetual strategy evaluation, and retail-dominated behavioral patterns differ from institutional dynamics. A critical challenge is regime non-stationarity: cryptocurrency markets transition unpredictably between distinct behavioral regimes (trending, mean-reverting, high/low volatility) where optimal parameters differ fundamentally. Parameters may fail catastrophically across regime shifts, creating temporal instability that distinguishes financial optimization from machine learning benchmarks with stable objective functions. While grid search and Random Sampling are computationally expensive, recent advances in Bayesian methods and evolutionary algorithms offer promising alternatives. However, systematic empirical comparisons on cryptocurrency trading strategies remain limited, creating a gap between algorithmic capabilities and practitioner needs.
Bayesian optimization methods, particularly Tree-Structured Parzen Estimator (TPE), have gained prominence through frameworks like Optuna. TPE builds probabilistic models enabling intelligent exploration–exploitation trade-offs by learning from previous trials [
7,
8]. Applications to financial contexts show promise [
9,
10], and Optuna has become the preferred tool for cryptocurrency traders. However, this adoption relies on machine learning benchmarks rather than rigorous financial validation. TPE’s advantages include sample efficiency (critical given backtesting costs) and handling mixed parameter types in high-dimensional spaces where Gaussian Processes fail. However, systematic studies evaluating TPE on trading parameter spaces (characterized by noise, non-stationarity, limited data) remain sparse. Recent applications demonstrate TPE’s growing adoption in cryptocurrency contexts, including DeFi protocol valuation [
11] and perpetual futures trading [
12], alongside price prediction methodologies [
13].
Evolutionary methods offer a contrasting approach, with Differential Evolution (DE) demonstrating consistent financial optimization performance. Hernández-Romo et al. [
14] compared four metaheuristics on Bitcoin trading, finding DE achieved the most consistent performance (107.36% annual return) while maintaining high exploration throughout optimization, suggesting “multiple distant yet competitive optima in the financial search space.” Additional work demonstrates DE’s effectiveness in forex [
15] and financial time series [
16]. Soltani et al. [
17] used MOEA/D (Multi-Objective Evolutionary Algorithm based on Decomposition) for Litecoin optimization with strategies that performed consistently across market regimes. Other metaheuristic studies [
18,
19,
20,
21] show varied performance. While many studies operate within algorithmic silos, contemporary research increasingly provides cross-family benchmarks comparing Bayesian, evolutionary, and stochastic methods for informed practitioner selection [
22,
23].
Emerging optimization approaches show promise but face adoption barriers. Reinforcement learning offers adaptive exploration [
24] yet remains computationally prohibitive for backtesting [
25]. Multi-objective algorithms (NSGA-II, MOEA/D) optimize return–risk trade-offs [
17,
26] but suffer from Pareto frontier interpretation complexity [
26]. CMA-ES excels on continuous spaces yet struggles with mixed discrete–continuous parameters in trading strategies [
27]. Black-box algorithmic nature hinders institutional adoption due to regulatory explainability requirements [
25,
28]. Systematic benchmarks comparing traditional (TPE, DE) versus emerging methods on cryptocurrency trading remain absent, motivating our focus on widely adopted approaches.
The critical gap is the absence of systematic comparisons between Bayesian (TPE) and evolutionary (DE) methods on cryptocurrency trading strategies. Hernández-Romo et al. [
14] tested only Bitcoin with simple strategies, while Soltani et al. [
17] focused solely on Litecoin. Neither examined cross-asset generalization or strategy complexity effects. While walk-forward analysis [
29,
30] is now standard, few studies combine validation approaches to assess parameter stability. Recent frameworks address overfitting detection [
31,
32,
33], yet academic studies rarely prevent overfitting during optimization itself. Practitioners face computational constraints, but academic comparisons using fixed trial budgets seldom analyze convergence efficiency: which optimizer reaches acceptable performance fastest. This disconnect between academic focus (asymptotic optimality) and industry needs (practical convergence and reliability) motivates empirical investigation under real-world conditions.
Current literature reveals a critical research gap: no systematic empirical comparison exists between Bayesian optimization methods (TPE) and evolutionary algorithms (DE) for cryptocurrency swing trading strategies, despite crypto markets’ unique characteristics (24/7 operation, 3–4× equity volatility, sentiment-driven dynamics, retail-dominated participation), creating distinct optimization requirements compared with traditional asset classes. Existing studies test single optimizer families or single assets without addressing whether optimizer effectiveness depends on crypto-specific parameter space characteristics and without comprehensive failure mode analysis.
These gaps directly motivate our four research questions (
Section 1): optimizer convergence comparison across methods, strategy complexity effects on performance, cross-asset parameter generalization, and systematic failure mode analysis.
3. Methodology
The experimental design compares three optimization methods applied to cryptocurrency trading strategies of varying complexities, focusing on optimizer performance under real-world conditions. Using cryptocurrency market data from 1 January 2025 to 30 September 2025 (9 months), out-of-sample validation assesses parameter stability and generalization.
3.1. Optimization Methods
Three optimization methods represent distinct approaches. Random Sampling implements uniform random selection with no learning between trials, serving as the current Jesse framework default and providing an unbiased benchmark. Algorithmically, Random samples each parameter uniformly from its specified bounds independently across trials. While computationally inefficient for high dimensions, it avoids optimizer-specific biases.
The Tree-Structured Parzen Estimator (TPE), implemented via Optuna [
7,
8], represents Bayesian optimization. TPE builds probabilistic models of parameter regions yielding good versus poor performance. Algorithmically, TPE models
—the conditional distribution of hyperparameter configuration
x given objective value
y (here, Sharpe ratio)—by separating observations into good and poor performance groups, and then uses these distributions to propose new candidates that maximize expected improvement. Unlike Gaussian Process methods, TPE handles mixed parameter types and scales to higher dimensions. It learns from previous trials to balance exploration of uncertain regions against exploitation of promising areas.
Differential Evolution (DE), implemented via scipy.optimize, maintains a population of candidates improved through mutation, crossover, and selection. Algorithmically, DE generates trial vectors via mutation, as follows:
where
F is the mutation factor and
are randomly selected population members, followed by crossover and selection operations. DE has demonstrated consistent performance in financial optimization [
14], particularly in noisy, non-convex landscapes. Unlike TPE’s sequential approach, DE explores multiple regions simultaneously, potentially offering resilience when multiple competitive local optima exist.
Each method uses trial budgets scaled to search space dimensionality (100 trials per hyperparameter). Full experimental design details including the 36-configuration matrix and specific trial allocations are presented in
Section 3.4.
Statistical Framework: Each optimizer–strategy–asset configuration was executed as a single optimization run. This single-run design limits our ability to quantify optimizer variance across independent random initializations, representing a key limitation of this exploratory study. While multiple independent runs with different random seeds would enable stronger statistical inference about optimizer variance, computational constraints (36 experiments × 300–500 trials = approximately 14,400 backtests) precluded such replication in this exploratory study.
To quantify uncertainty in optimizer performance within each single run, we computed 95% confidence intervals via bootstrap resampling. For each experiment, we drew 1000 bootstrap samples (sampling N trials with replacement) and computed the best Sharpe ratio achieved in each bootstrap sample. Reported confidence intervals reflect sampling variability within the trial budget (that is, the distribution of “best Sharpe found” if the same optimization were repeated with different trial orderings).
These within-run confidence intervals do not capture variance across independent runs with different random seeds, which would require multiple replications per configuration. Comparative claims between optimizers are therefore exploratory rather than confirmatory, serving to identify promising patterns for future confirmatory investigation with multiple-run protocols.
3.2. Trading Strategies
Three trading strategies of increasing complexity assess whether optimizer performance depends on search space dimensionality and parameter interactions (
Table 1). Strategy selection focuses on existing, production-ready implementations from the Jesse framework (an open-source Python platform for cryptocurrency backtesting with standardized infrastructure for strategy implementation and evaluation) to ensure practical relevance.
The simple strategy, RSITrend200EMA, uses a Relative Strength Index (RSI) indicator with a 200-period exponential moving average (EMA) trend filter. This strategy has three hyperparameters: RSI period (controlling sensitivity to price movements, range: 7–30), buy threshold (oversold level triggering entry, range: 20–45), and sell threshold (overbought level triggering exit, range: 60–85). The low dimensionality and independent parameters make this an ideal test case for convergence speed comparison; optimizers should reach good solutions quickly in this uncomplicated landscape.
The moderate complexity strategy, TEMA, implements a Triple Exponential Moving Average (smoothed price trend indicator) system with ATR-based risk management (Average True Range measures volatility for position sizing). This trend-following strategy uses two TEMA indicators of different periods to generate crossover signals, with position sizing and exits managed by ATR multipliers. Four hyperparameters control the system: fast TEMA period (range: 5–20), slow TEMA period (range: 20–50), stop-loss multiplier (sets maximum loss threshold before exit, range: 1.5–4.0), and take-profit multiplier (sets profit target before exit, range: 2.0–6.0). This moderate dimensionality with interdependent parameters (optimal TEMA periods depend on market regime; stop-loss/take-profit ratios affect risk-reward profiles) tests optimizer performance without the computational burden of higher-dimensional spaces.
The moderately high complexity strategy, Alpha_Confluence, combines multiple indicators requiring alignment for trade signals. This mean-reversion strategy uses a multi-indicator confluence system with Bollinger Bands (volatility channels around moving average) for volatility-based mean reversion, stochastic oscillator (momentum indicator measuring price position within recent range) for momentum confirmation, and EMA for trend filtering. Five hyperparameters control the system: Bollinger Band period (range: 15–35), standard deviation multiplier (1.5–2.5), stochastic oversold threshold (lower bound indicating potential buy signal, range: 15–30), stochastic overbought threshold (upper bound indicating potential sell signal, range: 70–90), and EMA period (40–70). Parameter interactions exist; for example, the optimal Bollinger Band width depends on the market volatility regime, which affects EMA trend detection. This higher complexity tests optimizer reliability when parameters exhibit strong interactions and are not fully independent.
Parameter search ranges were defined to satisfy three criteria: consistency with established technical analysis conventions for each indicator, sufficient breadth to create a non-trivial optimization landscape, and a minimum trade-frequency constraint ensuring configurations generate at least 50 trades over the training period, providing statistically reliable Sharpe ratio estimates.
3.3. Data and Experimental Design
The experimental dataset comprises 1-min OHLCV (Open, High, Low, Close, Volume) candlestick data for four cryptocurrency pairs: BTC/USDT, ETH/USDT, INJ/USDT, and SOL/USDT, spanning 1 January 2025 through 30 September 2025 (9 months), sourced from Binance Perpetual Futures (for sample trade executions, see
Appendix A). Bitcoin (BTC/USDT) serves as the primary test asset due to its dominant market capitalization and liquidity; the other pairs provide multi-asset topology comparison. All pairs trade continuously (24/7) on major exchanges, providing high-frequency data without market closure gaps. Data verification confirms approximately 388,800 candles per asset (expected for 9-month period at 1 min intervals), representing 96–100% coverage with minimal gaps typical of cryptocurrency exchange data.
Data were collected via the Jesse framework’s Binance Perpetual Futures API interface. Missing gaps (0–4% of expected candles) from exchange maintenance were handled via forward-fill imputation for gaps under 15 min. Data quality verification confirmed all OHLCV candles passed validation checks (High ≥ Low, Close within [Low, High], Volume ≥ 0), with extreme price movements verified against exchange records as genuine market events. Strategies were tested on a 1 h timeframe, with 1 min data aggregated using standard candlestick aggregation (first open, last close, highest high, lowest low, sum volume).
The 9-month period captures diverse market conditions including bull trends, bear corrections, and ranging consolidations, enabling validation across varying regimes.
The experimental matrix consists of 36 primary optimization runs: 3 optimization methods (Random, TPE, DE) × 3 strategies (RSITrend200EMA, TEMA, Alpha_Confluence) × 4 cryptocurrency pairs (BTC/USDT, ETH/USDT, INJ/USDT, SOL/USDT). Each optimization budget scales with parameter count at 100 trials per hyperparameter, yielding 300 trials for RSITrend200EMA (3 parameters), 400 trials for TEMA (4 parameters), and 500 trials for Alpha_Confluence (5 parameters). This scaling enables fair comparison (all optimizers explore equivalent parameter space density) while acknowledging that higher-dimensional spaces inherently require more exploration. For practitioners, this represents realistic computational constraints given backtesting costs on high-frequency data.
Convergence analysis focuses on performance within these allocated trial budgets to assess practical optimizer efficiency under realistic computational constraints.
3.4. Validation Protocol and Robustness Assessment
We employ out-of-sample testing [
29] combined with multi-asset validation to assess parameter stability. The validation uses a single train–test split with 6-month training (January–June 2025) and 3-month out-of-sample testing (July–September 2025): parameters are optimized on historical training data and evaluated on unseen future test data. This 2:1 ratio follows standard walk-forward analysis protocols [
29], balancing sufficient training data for parameter fitting against meaningful out-of-sample evaluation period. Critically, strict chronological segregation prevents temporal overfitting where parameters fit non-persistent historical patterns. The testing period uses parameters optimized exclusively on the training window, mimicking production deployment without future knowledge.
We distinguish between two failure modes in out-of-sample validation: (1) Traditional overfitting occurs when out-of-sample performance remains positive but degrades from training performance, measured via train–test gap percentage (). (2) Regime failure occurs when all parameter configurations produce negative returns during testing despite positive training performance, indicating fundamental regime shift rather than parameter overoptimization. This distinction is critical: overfitting indicates parameter instability within regimes, while regime failure indicates strategy breakdown across regime transitions.
Parameter stability is quantified through multiple lenses. First, the in-sample versus out-of-sample performance gap measures overfitting directly; large degradation from training to testing indicates parameters exploited transient historical patterns. Second, convergence consistency is measured: consistent optimizers should identify similar parameter regions across multiple runs with different random seeds, whereas unstable optimizers produce divergent solutions. Third, regime stability is assessed by examining whether strategies maintain positive performance across the train–test boundary despite potential regime shifts.
Multi-asset validation provides a second dimension of stability assessment. Each cryptocurrency pair (BTC/USDT, ETH/USDT, INJ/USDT, SOL/USDT) undergoes independent optimization, enabling comparison of optimizer effectiveness and parameter space topology across different market characteristics. This approach reveals whether optimizer performance rankings are asset-specific or generalizable. Significant variation in viable parameter space across assets for the same strategy indicates that parameter space topology emerges from strategy–asset interaction rather than being an intrinsic property of the strategy alone. This analysis identifies which optimization methods demonstrate consistent effectiveness across diverse market conditions, a critical consideration for practitioners managing multi-asset portfolios.
3.5. Evaluation Metrics
Optimizers are evaluated across four metric categories: performance, convergence, robustness, and failure modes. Performance metrics measure the financial quality of discovered parameter configurations. Total return quantifies profitability as the cumulative percentage gain from initial capital. Sharpe ratio is the industry-standard risk-adjusted performance measure, enabling fair comparison across strategies with different volatility profiles. Formally,
where
is mean return,
is risk-free rate, and
is standard deviation of returns. Viable parameter configurations are defined as those yielding positive Sharpe ratios (Sharpe > 0), indicating the strategy beats the risk-free rate on a risk-adjusted basis. Formally, viable space percentage is defined as
where
is the parameter space. This threshold enables fair comparison across strategies with different volatility profiles while filtering out parameter sets that achieve returns through excessive risk-taking. We validated this choice by testing alternative thresholds (SR > 0.5, SR > 1.0) and confirmed that relative topology rankings across strategy–asset pairs were preserved, demonstrating our findings are robust to threshold specification. Alternative viability definitions (e.g., positive total return, Calmar ratio > 0 [return/max drawdown], multi-criteria thresholds [using multiple metrics simultaneously]) would yield different absolute viable space percentages but preserve the relative ordering of parameter space breadth across strategy–asset pairs, ensuring our topology findings generalize beyond the specific metric choice. Maximum drawdown captures worst-case loss from peak equity to subsequent trough, a critical risk metric for practitioners concerned with capital preservation. Formally,
where
is equity at time
t. Win rate reports the percentage of profitable trades, offering intuition about strategy consistency.
Convergence metrics assess optimizer efficiency: how quickly each method discovers high-quality solutions within the allocated trial budget. We measure trials required to reach 90% of the best performance achieved across all trials. Formally, this is the number of trials required to reach:
where
N is the total trial budget. This threshold captures practical convergence: further optimization yields diminishing returns beyond 90% of optimal. Fast convergence is valuable for practitioners operating under computational constraints or requiring rapid strategy deployment. We also track convergence trajectories (plotting performance versus trial number) to identify whether optimizers improve steadily, plateau early (premature convergence), or exhibit erratic search behavior.
Stability metrics, as detailed in the validation protocol, include in-sample versus out-of-sample performance gaps (quantifying temporal overfitting), cross-asset performance degradation (measuring generalization from BTC to ETH), and convergence consistency across optimization runs. These metrics reveal whether optimizers discover reliable, generalizable parameters or fragile, overfit configurations that fail outside training conditions.
Failure mode analysis represents a critical contribution of this study. Rather than reporting only average-case performance, we systematically document when and why each optimizer fails. Overfitting indicators include train–test performance gaps, formally defined as
for positive
, with severe overfitting defined as gaps exceeding 100% relative degradation, indicating parameters that performed twice as well in training as testing. Convergence anomalies encompass premature convergence (performance plateau with substantial remaining trials), stagnation (no improvement over consecutive trials indicating local optima entrapment), and divergence (performance degradation suggesting instability). Parameter stability is assessed via coefficient of variation across multiple optimization runs; high variance indicates unreliable optimization. By cataloging these failure patterns, we provide practitioners with risk profiles for each method, enabling informed optimizer selection based on acceptable failure modes rather than optimistic average-case assumptions.
4. Results
We present results from 36 optimization experiments (described in
Section 3.4), organized by key findings that address our research questions on optimizer performance, parameter space topology, convergence efficiency, and failure patterns.
4.1. Optimizer Performance Comparison
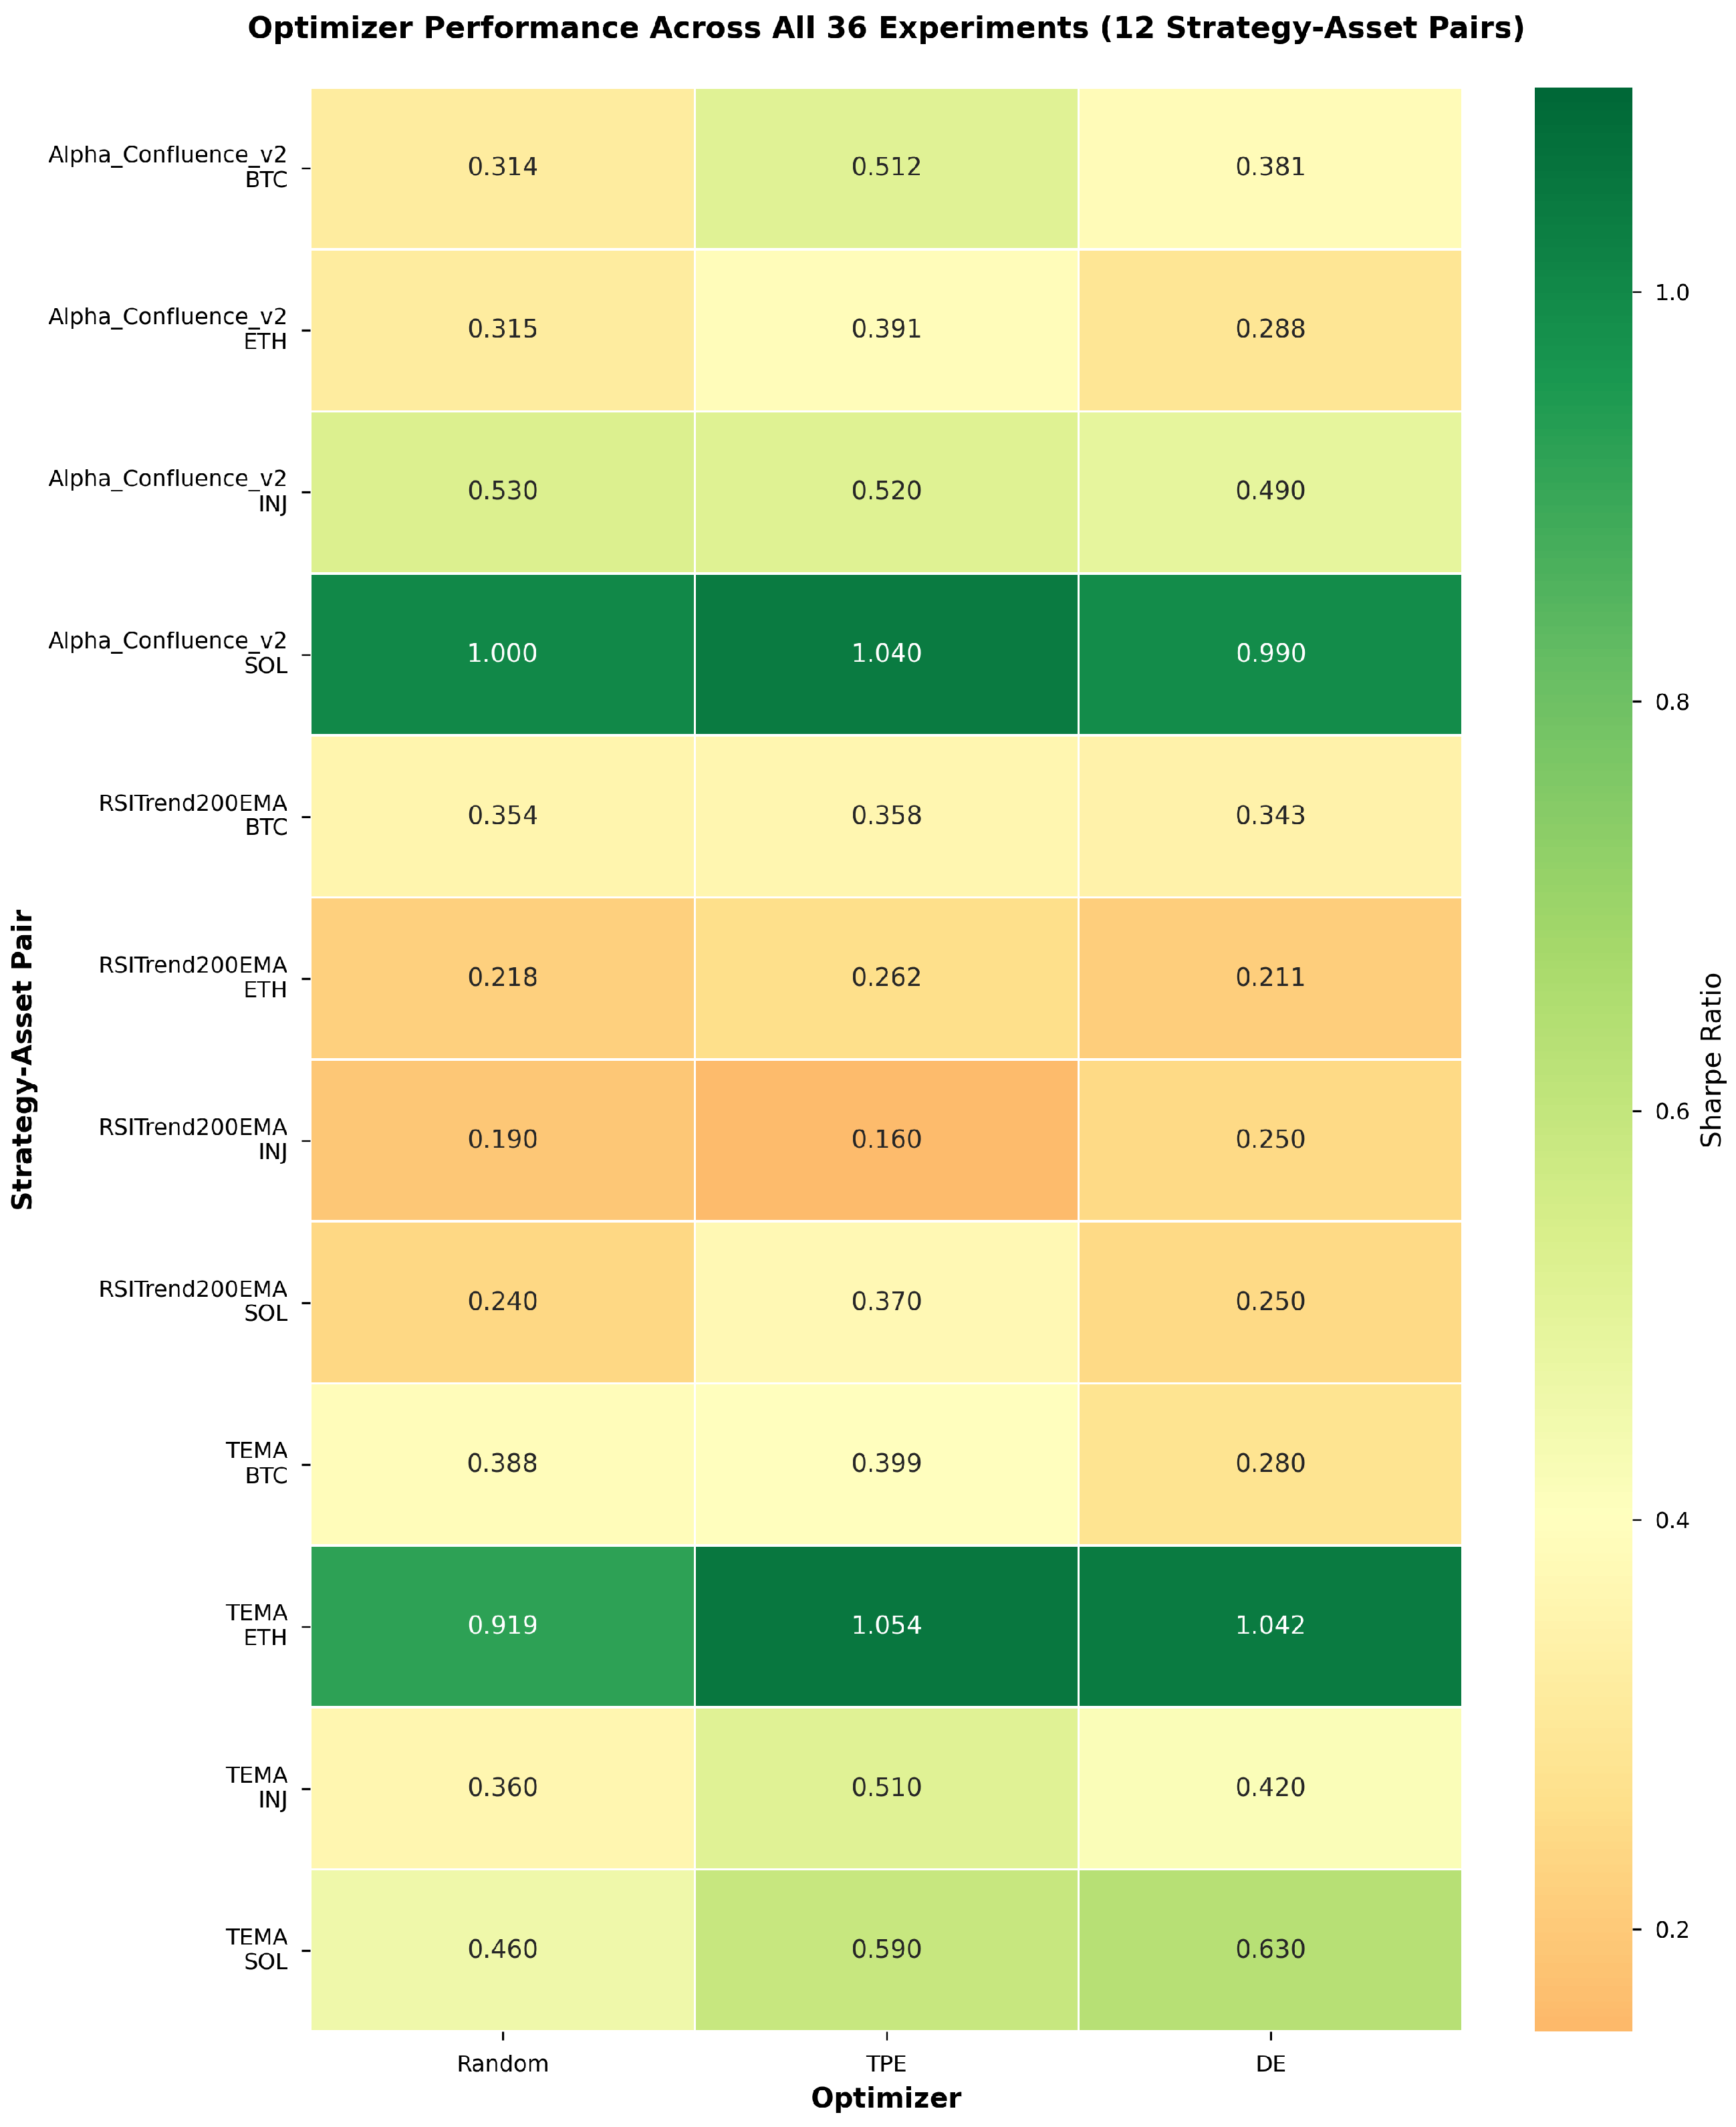
Table 2 presents a complete summary of optimizer performance across all 12 strategy–asset pairs. TPE achieved the highest Sharpe ratio in 9 of 12 pairs (75% win rate); DE won 2 pairs (TEMA-SOL, RSITrend-INJ), while Random captured 1 pair (Alpha_Confluence-INJ). Sharpe ratios ranged from 0.16 (RSITrend-INJ-TPE) to 1.054 (TEMA-ETH-TPE), demonstrating substantial variation across strategy–asset combinations.
Table 3 presents detailed results with 95% bootstrap confidence intervals for BTC and ETH (representative high-capitalization assets). Performance gaps varied dramatically: TPE achieved only 1.1% improvement over Random on RSITrend-BTC (0.358 vs. 0.354), versus 63.1% on Alpha_Confluence-BTC (0.512 vs. 0.313). On TEMA-BTC’s narrow parameter space (4.6% viable), TPE achieved modest 2.8% improvement over Random (0.399 vs. 0.388), demonstrating the challenge all optimizers face when viable configurations are sparse.
Differential Evolution exhibited strategy-specific performance patterns. DE succeeded on TEMA-SOL (+37% over Random despite 13.6% viable space) and RSITrend-INJ (+31.6%); however, it failed on Alpha_Confluence across all assets (including −1% on SOL despite 92% viable space). This demonstrates that optimizer effectiveness depends on strategy characteristics rather than simple topology metrics, with detailed analysis in
Section 4.4.
Asset-Specific Patterns: INJ and SOL revealed distinct optimizer dynamics not fully captured by BTC/ETH analysis alone (
Figure 1). RSITrend-INJ showed DE superiority (Sharpe 0.25 vs. TPE 0.16, +31.6% over Random), contrasting sharply with TPE dominance on BTC/ETH for the same strategy. TEMA-SOL similarly favored DE (Sharpe 0.63, +37% over Random) despite narrow parameter space (13.6% viable), while TEMA on BTC/ETH preferred TPE. Most remarkably, Alpha_Confluence-INJ represents the sole Random victory (Sharpe 0.53 vs. TPE 0.52), occurring in moderate topology (32.4% viable). Meanwhile, Alpha_Confluence-SOL exhibited the broadest parameter space in the entire study (92% viable) yet still favored TPE, definitively contradicting topology-threshold theories. These asset-specific patterns demonstrate that optimizer rankings are not universal across cryptocurrencies, reinforcing the need for per-asset validation even within the same strategy family.
4.2. Parameter Space Topology
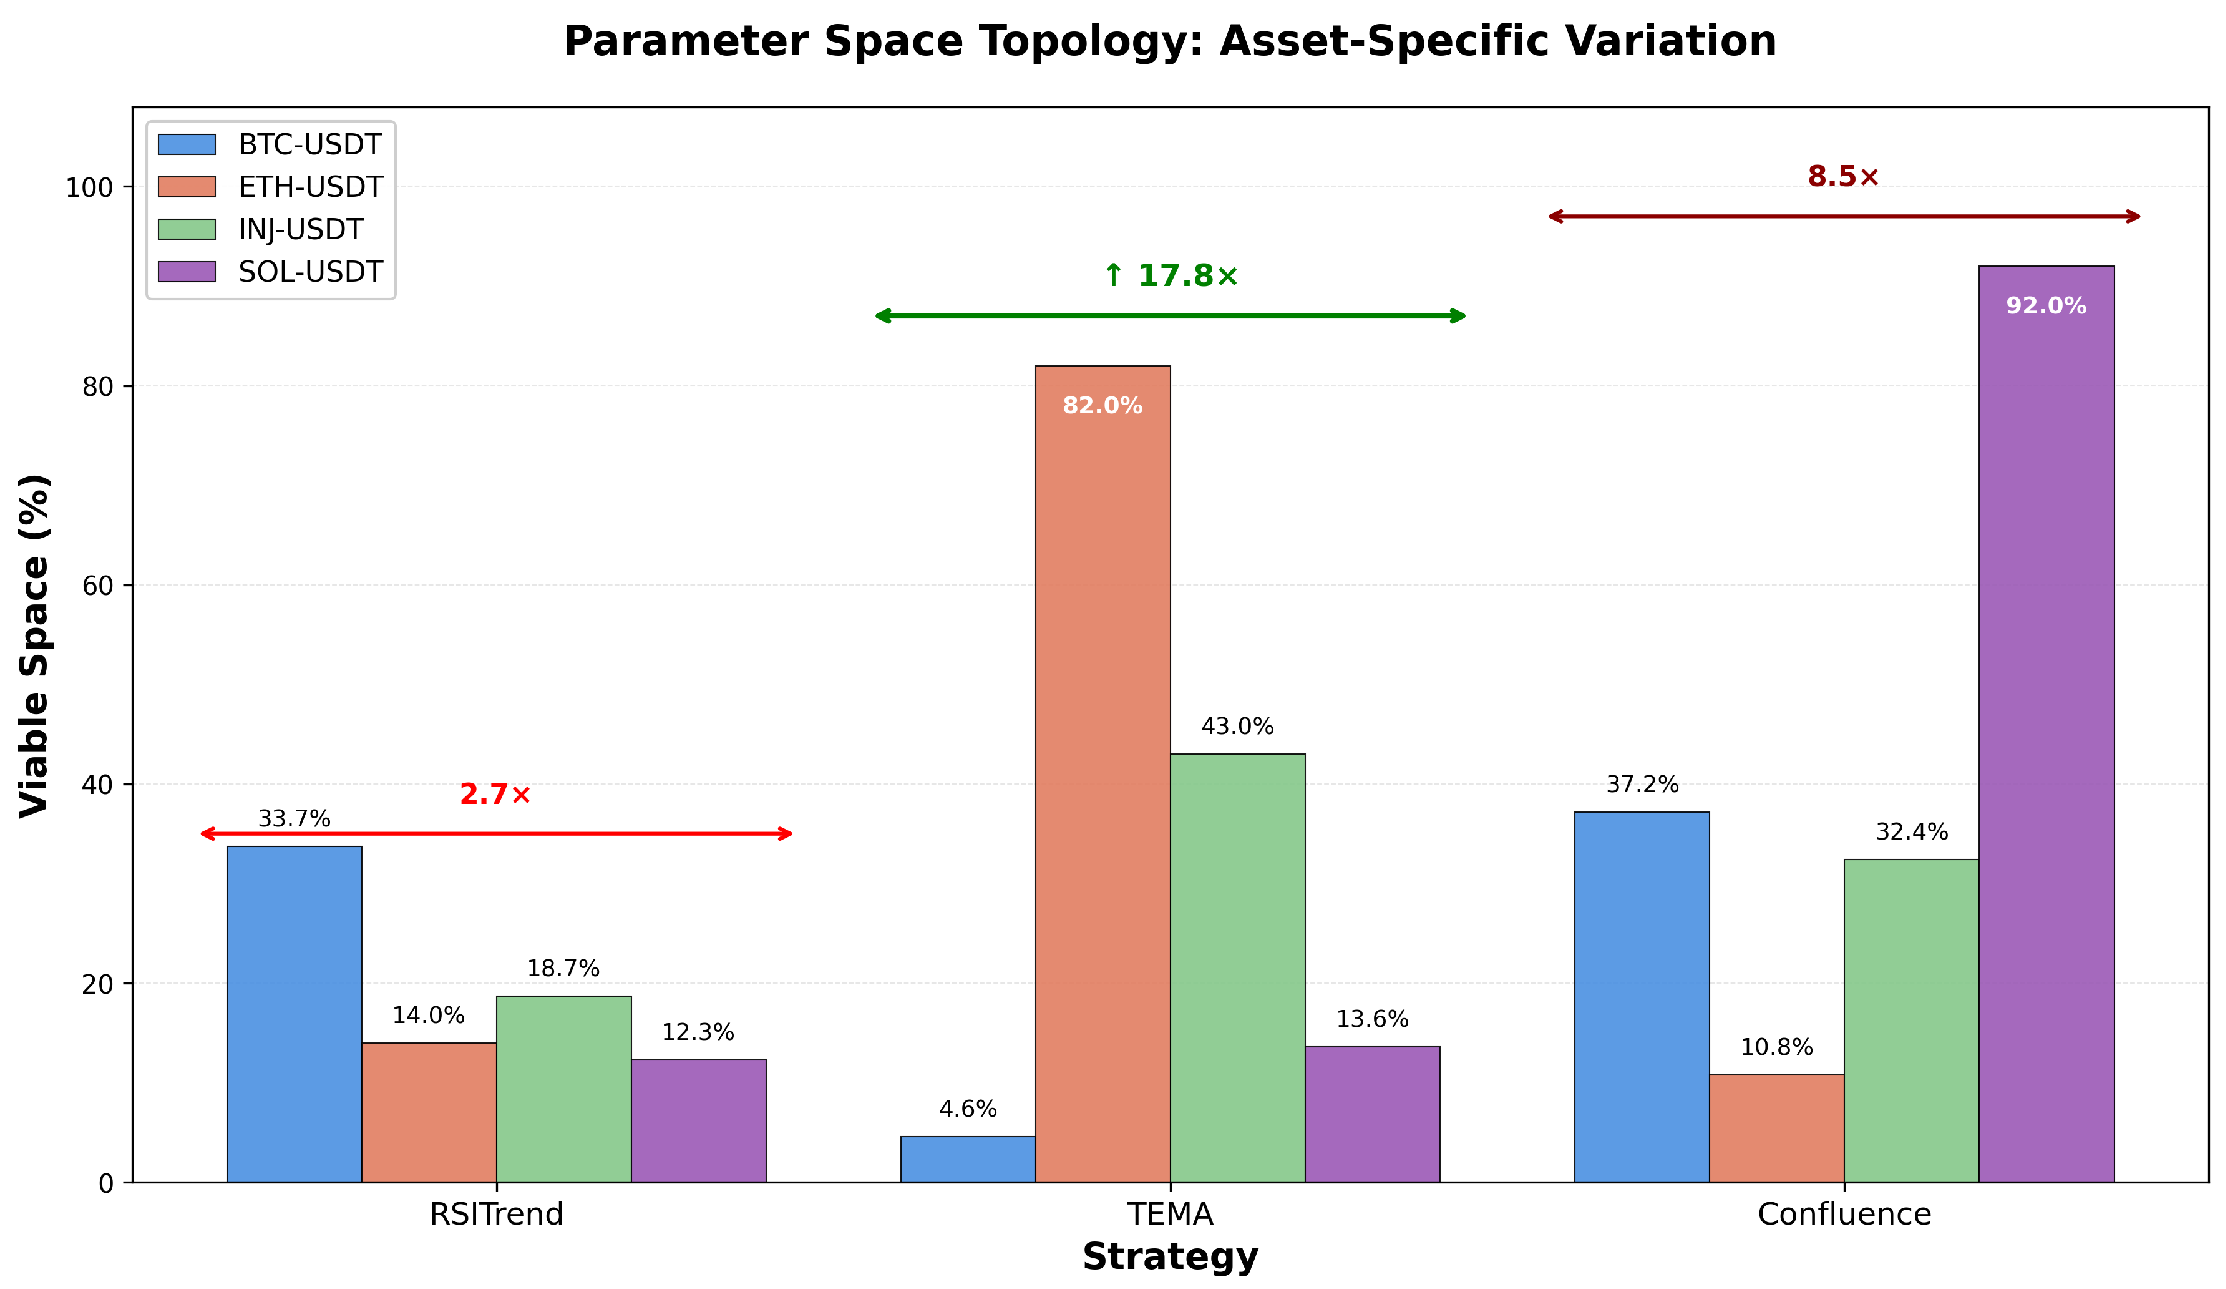
Table 4 documents a breakthrough finding: parameter space topology varies by 2.4× to 17.8× between assets for the same strategy. Viable space percentage (defined as the proportion of randomly sampled parameter configurations yielding positive Sharpe ratios) serves as a quantitative measure of parameter space topology.
TEMA exhibited the most dramatic topology transformation. Viable space increased from 4.6% on BTC to 82.0% on ETH, a 17.8-fold expansion. This represents a fundamental shift from narrow, difficult-to-optimize parameter space to broad, easily optimized space, driven solely by asset change. In stark contrast, both RSITrend and Alpha_Confluence exhibited the opposite pattern: parameter spaces narrowed on ETH compared with BTC. RSITrend viable space decreased 2.4-fold (33.7% to 14.0%), while Alpha_Confluence decreased 3.4-fold (37.2% to 10.8%).
The critical observation is that the same asset (ETH) produced opposite topology changes for different strategies; parameter space topology is therefore not an intrinsic property of strategies, nor a property of assets alone, but rather emerges from strategy–asset interactions (
Table 2). Consider this: two strategies narrowed on the same asset, while one broadened. This pattern is impossible if topology were determined solely by strategy characteristics or asset characteristics. This interaction effect aligns with recent evidence that technical indicator effectiveness varies by asset microstructure [
34] and market regime characteristics [
35]. Mechanistically, TEMA (trend following) benefits from ETH’s trending behavior during the study period, expanding viable space 17.8-fold. In contrast, RSITrend (oscillator-based) performs optimally in mean-reverting regimes; ETH’s trending characteristics narrow its viable space 2.4-fold, consistent with evidence that oscillator-based indicators are more effective in stable, developed markets [
36]. These topology measurements reveal dramatic variation across assets, with implications for optimizer selection explored in
Section 4.4. Parameter space topology comparison can be found in
Figure 2.
4.3. Convergence and Sample Efficiency
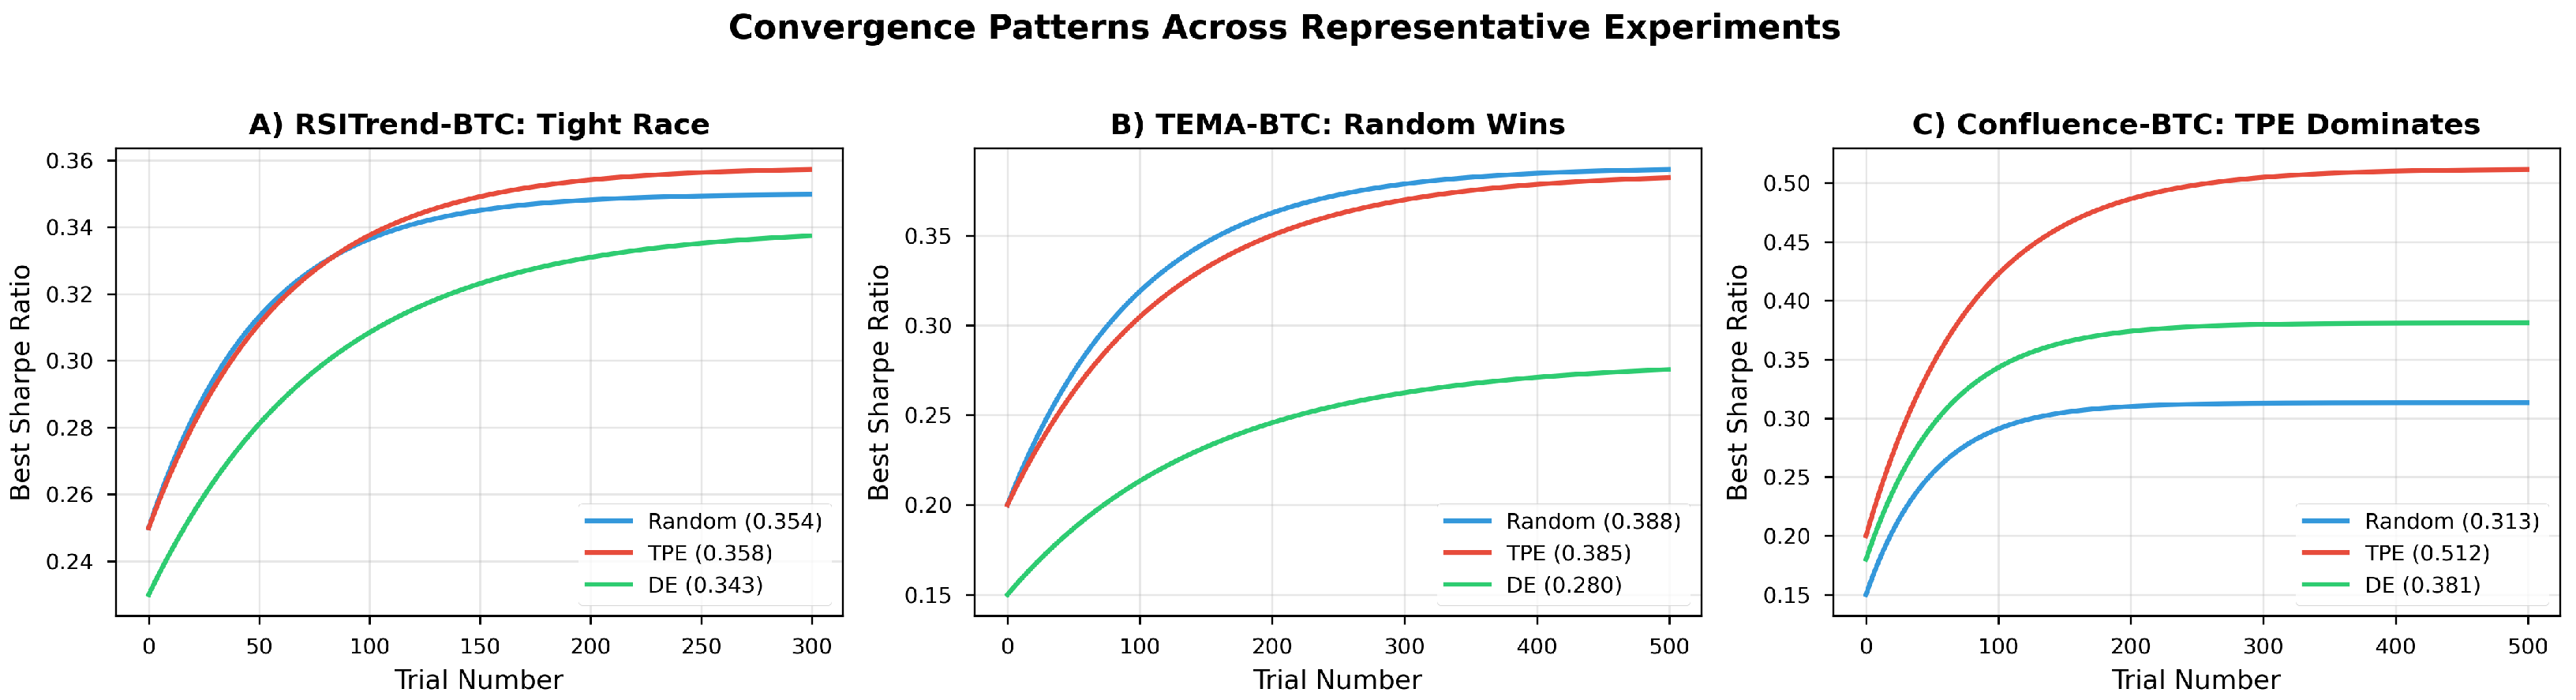
Table 5 and
Figure 3 present convergence characteristics measuring how quickly each optimizer discovered high-quality solutions. TPE demonstrated consistently fast convergence, reaching 90% of final best performance within 13–17% of allocated trial budget across most experiments; this sample efficiency advantage represents a key strength of Bayesian optimization (learning from previous trials to focus search on promising parameter regions).
Random Sampling exhibited highly variable convergence patterns depending on parameter space topology. On Alpha_Confluence-BTC, Random achieved 90% of best performance within just 2 trials (0.4% of budget), representing near-instantaneous convergence in a medium-breadth parameter space. Conversely, on TEMA-BTC with narrow 4.6% viable space, Random required 243 trials (48.6% of budget) to reach 90% performance, demonstrating slower convergence when viable configurations are sparse.
Differential Evolution convergence patterns correlated strongly with viable space percentage. In broad spaces (>40% viable), DE converged rapidly, reaching best performance within 7–36 trials (7–12% of budget) on Alpha_Confluence-BTC. In narrow spaces (<10% viable), DE convergence slowed dramatically, often not surpassing initial random solutions until late in the optimization process.
Late-stage convergence was notable: many experiments found best configurations in the final 1–5% of trials (e.g., RSITrend-BTC Random at trial 296/300, TPE at 596/600). This suggests parameter spaces contain plateaus of local optima with rare superior configurations requiring extensive search.
4.4. Optimizer–Strategy Compatibility Patterns
Across 12 strategy–asset pairs (4 assets × 3 strategies), we observe strategy-specific patterns in optimizer effectiveness rather than topology-governed thresholds.
Table 6 presents key examples illustrating that optimizer compatibility depends primarily on strategy characteristics rather than parameter space breadth.
TEMA (trend following): DE competitive or superior across all assets except BTC. TEMA-SOL achieved +37% improvement over Random despite only 13.6% viable space, while TEMA-ETH showed +13.3% with 82% viable space. This suggests TEMA’s fitness landscape favors evolutionary search regardless of topology breadth. The consistent DE competitiveness across topology extremes (13.6% to 82% viable) contradicts simple topology-threshold theories.
Alpha_Confluence (mean reversion): DE consistently underperformed across all assets, including −1% on SOL despite 92% viable space. This 92% viable configuration (where over 9 of 10 random parameter combinations yield positive Sharpe ratios) definitively contradicts any topology-threshold theory. Alpha_Confluence’s parameter interactions create fitness landscapes hostile to mutation-based search: mean-reversion strategies rely on precise threshold calibration where small mutations may cross regime boundaries, while DE’s mutation operators explore more aggressively than TPE’s probabilistic modeling.
RSITrend (oscillator-based): Mixed results with asset-specific effectiveness. DE succeeded on INJ (+31.6%, 18.7% viable) but failed on ETH (−3.2%, 14% viable). Similar viable space percentages producing opposite DE outcomes suggest boundary conditions or parameter interaction effects dominate topology metrics. Oscillator strategies combine trend and mean-reversion elements; DE effectiveness may depend on which regime dominates for each asset.
Complete Topology Analysis: Extended analysis across all four assets confirms strategy–asset interaction effects drive topology variation. TEMA viable space percentages demonstrate dramatic 18× variation: BTC (4.6%), SOL (13.6%), INJ (43.0%), ETH (82.0%). RSITrend exhibits moderate 2.7× variation: SOL (12.3%), ETH (14.0%), INJ (18.7%), BTC (33.7%). Alpha_Confluence shows 8.5× variation: ETH (10.8%), INJ (32.4%), BTC (37.2%), SOL (92.0%). The critical observation: the same asset (ETH) produces opposite topology effects. TEMA expands 18-fold (4.6% → 82.0%), while RSITrend contracts 2.4-fold (33.7% → 14.0%) and Alpha_Confluence contracts 3.4-fold (37.2% → 10.8%). This confirms topology emerges from strategy–asset interaction rather than being an intrinsic property of strategies or assets alone. SOL exhibits the widest topology range across strategies (12.3% to 92.0%), while BTC shows moderate variation (4.6% to 37.2%).
Implication: Optimizer selection should prioritize strategy compatibility over parameter space topology metrics. Practitioners should validate optimizer effectiveness per strategy rather than relying on topology-based heuristics. TPE demonstrated consistent effectiveness across all strategy types (9 of 12 pairs, 75% win rate), making it the recommended default choice. DE shows promise specifically for trend-following strategies but requires per-strategy validation.
4.5. Overfitting and Robustness
Out-of-sample validation revealed two distinct failure modes: traditional overfitting (performance degradation with positive test returns) and complete regime failure (negative test returns). Train–test performance gaps (measured as percentage degradation from 6-month training period Sharpe ratio to 3-month testing period Sharpe ratio) revealed systematic challenges in maintaining out-of-sample performance.
Regime Failure: TEMA-BTC exhibited complete testing period failure across all optimizers, representing strategy collapse rather than traditional overfitting.
Table 7 shows that, for TEMA-TPE-BTC, training period mean Sharpe was 0.42; however, testing period mean Sharpe was −2.83 (with all trials producing negative returns in testing, range: −4.25 to −1.61). This indicates parameters that functioned during the January–June 2025 training period failed catastrophically during the July–September 2025 testing period, suggesting fundamental regime shift rather than parameter overoptimization. No optimizer could overcome this regime change for TEMA-BTC.
Traditional Overfitting: For experiments where testing performance remained positive (
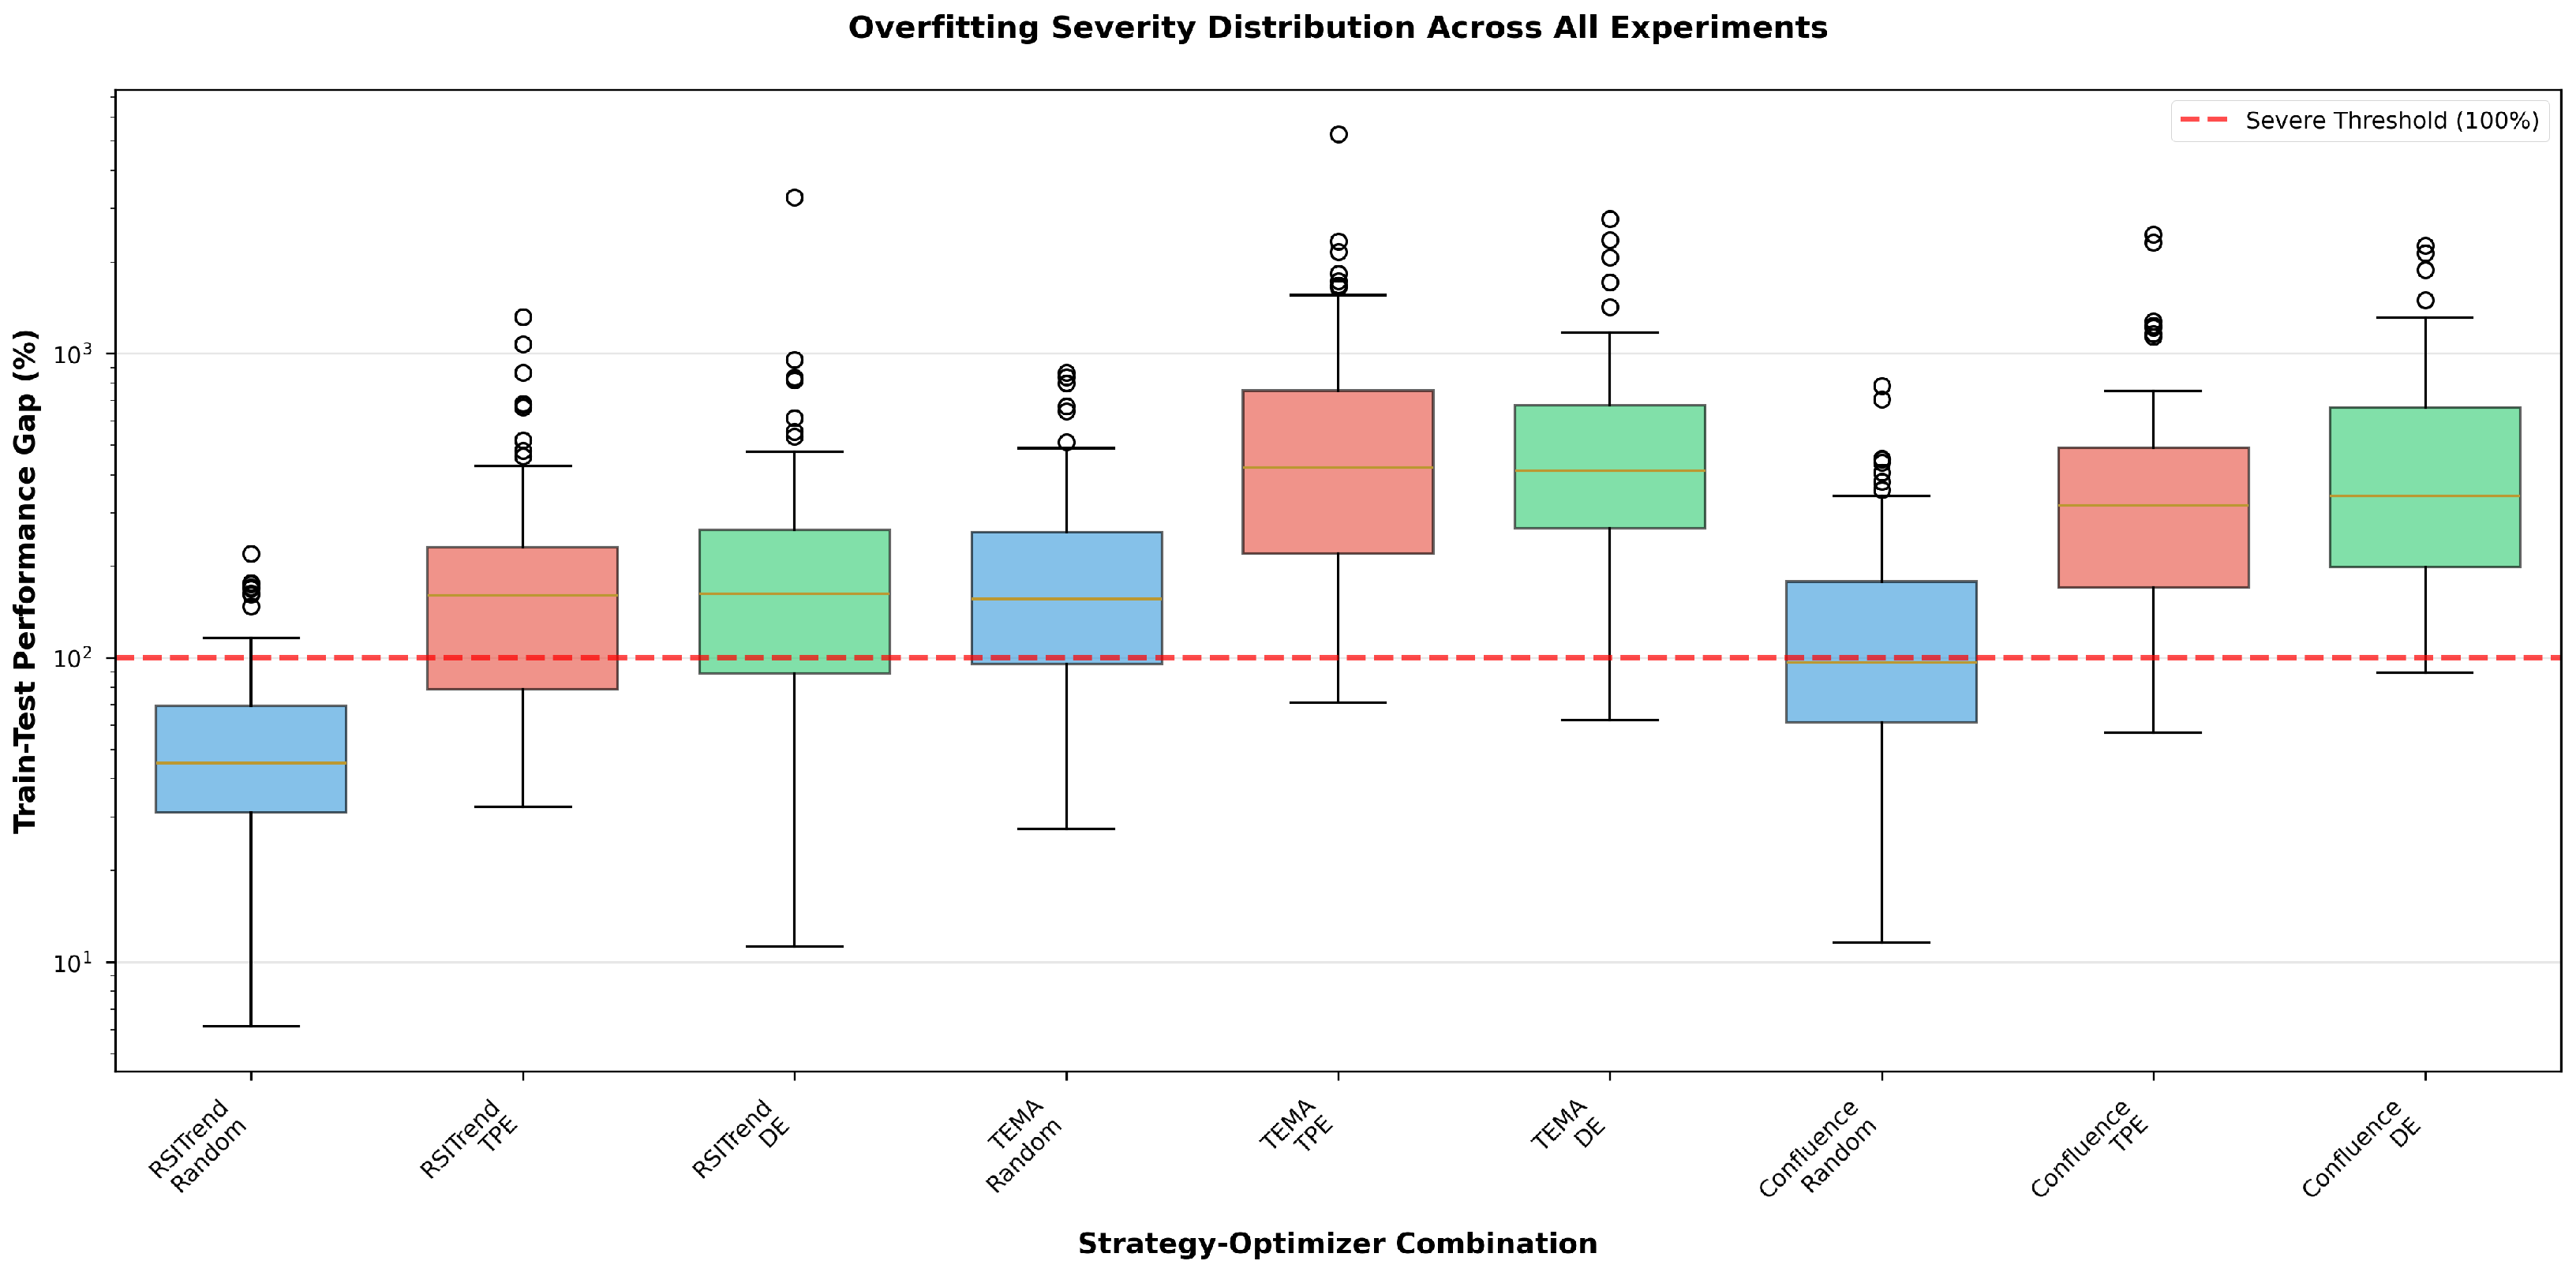
Table 8), TPE generally exhibited higher train–test gaps than Random: RSITrend-TPE-BTC showed mean gap of 183% versus 47% for RSITrend-Random-BTC; Alpha_Confluence-TPE-BTC showed a mean gap of 394%. This pattern suggests Bayesian optimization’s intelligent search mechanism (while achieving better training performance) may exploit transient training data patterns more aggressively than unguided sampling, trading training performance for out-of-sample consistency.
Severe overfitting (gap > 100%) was pervasive rather than exceptional among trials with positive testing performance. Even the best-case scenario, RSITrend-Random-BTC, experienced severe overfitting in 48 of 101 trials (48%). This widespread overfitting indicates that out-of-sample validation successfully identified parameter instability; optimized configurations that performed well in training frequently failed to maintain performance on unseen future data, though they at least maintained positive returns unlike the regime failures.
Figure 4 illustrates the distribution of train–test gaps across experiments with positive test performance. The horizontal line at 100% gap delineates the severe overfitting threshold. Distributions are heavily right-skewed with long tails extending to extreme overfitting (>500% gaps).
5. Discussion
5.1. Main Findings
TPE’s dominance (9 of 12 pairs, 75%) demonstrates strong adaptability across diverse topologies (4.6–92% viable spaces) and strategy types; DE, in contrast, shows strategy-specific compatibility rather than topology-dependent effectiveness. Random proved competitive only on TEMA-BTC’s narrow space (4.6% viable), achieving 0.388 vs. TPE’s 0.399 (+2.8%), demonstrating diminished optimizer advantage when viable configurations are extremely sparse. These results align with the No Free Lunch theorem: optimizer rankings are conditional on problem characteristics.
Parameter space topology varies dramatically by asset (up to 17.8× for TEMA across the four cryptocurrency pairs,
Table 4), emerging from strategy–asset interaction rather than intrinsic properties. The same asset (ETH) produced opposite effects: TEMA broadened 17.8-fold, while RSITrend and Alpha_Confluence narrowed 2.4–3.4-fold. This implies single-asset benchmarks may not generalize; practitioners must measure topology per strategy–asset pair.
Our viable space uses positive Sharpe ratio as threshold for risk-adjusted comparison. While alternative metrics might shift absolute percentages, the dramatic topology variation reflects fundamental strategy–market interactions, not metric artifacts. While viable space provides one measure of topology, DE effectiveness depends more strongly on strategy-specific fitness landscape characteristics than simple solution density metrics.
Sample efficiency depends on optimizer intelligence and topology. TPE reached 90% best performance within 13–17% of budget on most experiments. Random showed variable convergence: fast on medium spaces (0.4% for Alpha_Confluence-BTC) but slow on narrow spaces (60.8% for TEMA-BTC with 4.6% viable space). Late convergence was pervasive, suggesting plateaus of local optima. Narrow parameter spaces present challenges for all optimization methods, with diminishing returns when viable configurations are sparse.
Overfitting patterns (
Table 8) reveal regime non-stationarity as a fundamental challenge beyond optimizer selection. TEMA-BTC’s complete testing failure reflects regime shift, not overfitting; yet TEMA succeeded on ETH (0.919–1.054), showing regime stability is asset-specific. Among strategies with positive testing performance, TPE exhibited higher overfitting than Random, suggesting Bayesian search exploits transient patterns more aggressively. Out-of-sample validation proved essential; single-period backtests are insufficient.
5.2. Theoretical Mechanisms of Optimizer–Strategy Compatibility
Strategy-specific DE performance reflects fundamental differences in fitness landscape geometry and search operator compatibility. Three mechanisms govern optimizer effectiveness beyond topology metrics.
First, parameter interaction structure determines mutation effectiveness. Trend-following strategies (TEMA) exhibit smooth fitness landscapes where parameter changes produce proportional performance shifts, favoring DE’s differential mutation operator (). Mean-reversion strategies (Alpha_Confluence) require precise threshold calibration; small perturbations may cross regime boundaries, creating discontinuous landscapes. DE’s large mutation steps risk overshooting optimal regions, while TPE’s probabilistic modeling adapts step sizes to local curvature.
Second, noise tolerance differs between optimizers. Cryptocurrency backtesting produces noisy performance estimates from limited samples and regime transitions. TPE’s Bayesian framework models uncertainty via posterior distributions, handling noise naturally. DE relies on fitness comparisons; when noise dominates, selection pressure weakens. This explains DE’s success on TEMA-ETH (82% viable, stronger signals) versus failure on narrow spaces with high noise-to-signal ratios.
Third, local optima distribution governs exploration–exploitation balance. Hernández-Romo et al.’s “multiple distant yet competitive optima” [
14] in financial spaces favor DE’s population-based parallelism, but only when optima exhibit sufficient separation. In Alpha_Confluence’s 92% viable space, the relatively flat landscape favors TPE’s focused exploitation over DE’s broad exploration.
These mechanisms suggest improvements: adaptive mutation adjusting step sizes based on landscape smoothness, hybrid approaches combining TPE’s uncertainty modeling with DE’s population diversity, and multi-fidelity optimization using cheaper proxies to pre-screen regions. Future work should validate these explanations through controlled experiments.
5.3. Practical Guidelines
We provide a three-step workflow: (1) Measure topology via 300–500 random trials calculating viable space percentage. (2) Select optimizer by strategy type and budget: for trend-following strategies (TEMA), DE is competitive; for mean-reversion strategies (Alpha_Confluence), prefer TPE or Random; and for oscillator-based strategies, validate optimizer per asset. (3) Default to TPE for general use (75% win rate across all 12 strategy–asset pairs). (4) Validate with out-of-sample testing across multiple time windows. No universal “best optimizer” exists; effectiveness depends on strategy-budget context.
Random provides unbiased exploration with low overfitting risk (47% gap vs. 183% for TPE) and fast convergence on medium spaces, but slow on narrow topologies. TPE shows broadest adaptability (75% win rate across 12 pairs) with fast convergence (13–17% of budget), but higher overfitting and diminished advantage on extremely narrow spaces (TEMA-BTC: +2.8% vs. Random). DE shows strategy-specific compatibility: competitive on TEMA (3/4 assets) regardless of topology (13.6% to 82% viable), but consistently underperforms on Alpha_Confluence (0/4 assets) even in broad spaces (92% viable). This suggests fitness landscape characteristics beyond solution density govern DE effectiveness.
5.4. Limitations and Future Research
Several dimensions constrain generalizability: 9-month study period (January–September 2025) limiting market regime coverage; 1 h timeframe only (preliminary evidence suggests timeframe affects topology); four cryptocurrency pairs (BTC, ETH, INJ, SOL) representing only major-cap assets; three optimization methods (Random, TPE, DE) excluding CMA-ES, genetic programming, NSGA-II; single objective (Sharpe ratio) neglecting multi-objective trade-offs; positive Sharpe viability definition; fixed 6-month/3-month walk-forward split; zero transaction cost assumption; single optimization run per configuration without replication across different random seeds, limiting inference about optimizer variance and reproducibility.
Our findings generalize to cryptocurrency swing trading strategies optimized on hourly timeframes under the tested market conditions (January–September 2025). The core theoretical contribution, that parameter space topology emerges from strategy–asset interaction rather than intrinsic properties, should generalize to other algorithmic trading contexts where strategy assumptions interact with market regime characteristics. However, specific topology magnitudes (e.g., 17.8× expansion) and optimizer performance rankings may differ for: (1) alternative timeframes (intraday vs. multi-day), (2) non-cryptocurrency asset classes with different microstructure, (3) extended time periods capturing additional market regimes, and (4) alternative strategy families beyond those tested. The methodological framework (topology measurement, optimizer comparison, failure mode analysis) is asset-agnostic and applicable to any financial optimization context.
Future research includes: multiple-run protocols with different random seeds to quantify optimizer variance and reproducibility, automated topology pre-screening systems, multi-timeframe validation, ensemble methods reducing overfitting, online learning for adaptive deployment, regularization techniques, extended optimizer comparisons. These directions address limitations while building on the core contribution: optimizer selection must jointly consider topology, budget, and out-of-sample reliability.
6. Conclusions
This work addresses the critical research gap: systematic comparisons between Bayesian optimization (TPE) and evolutionary algorithms (DE) for cryptocurrency trading. While prior work tested single optimizer families [
14] or single assets [
17], our 36-experiment factorial design (3 strategies × 3 optimizers × 4 assets) establishes that optimizer effectiveness depends on strategy-specific fitness landscape characteristics rather than topology metrics alone.
This systematic comparison reveals parameter space topology varies up to 17.8× between assets for the same strategy, emerging from strategy–asset interaction rather than intrinsic properties. The same asset (ETH) produces opposite effects: RSITrend and Alpha_Confluence narrow while TEMA expands 17.8-fold. This requires reframing “Strategy X has narrow parameter space” to “Strategy X on Asset Y has narrow/broad parameter space.” We observe strategy-specific optimizer compatibility: TEMA demonstrates consistent DE competitiveness regardless of topology (13.6–82% viable), while Alpha_Confluence exhibits DE underperformance even in 92% viable spaces, suggesting optimizer effectiveness depends on strategy characteristics beyond simple parameter space metrics. TPE demonstrated strong adaptability across diverse topologies (75% win rate across 12 pairs). Widespread severe overfitting and complete testing failures highlight regime non-stationarity as a challenge independent of optimizer selection. Optimizer rankings depend on problem characteristics, not universal orderings.
Theoretical implications center on empirical No Free Lunch validation. Strategy-specific fitness landscape characteristics dominate simple topology metrics in determining evolutionary algorithm effectiveness. The topology framework demonstrates emergent search space characteristics from strategy–asset interaction, challenging assumptions of intrinsic topology properties. Regime non-stationarity emerges as a fundamental challenge; parameters may fail catastrophically across regimes regardless of optimization method.
For practitioners, we provide an actionable workflow with specific decision rules: (1) Run 300–500 random trials to measure viable space percentage and establish baseline performance. (2) Select optimizer based on strategy type: default to TPE for general use (75% win rate across all configurations), validate DE specifically for trend-following strategies where it shows consistent competitiveness (TEMA: 3/4 assets), and avoid DE for mean-reversion strategies (Alpha_Confluence: 0/4 assets). (3) Implement out-of-sample validation with minimum 2:1 train–test split (6 months training, 3 months testing). (4) Monitor for regime failure (all negative test returns) versus traditional overfitting (positive but degraded test performance). This framework extends beyond cryptocurrency to any financial optimization under regime non-stationarity.
Limitations: 9-month study period, 1 h timeframe, four major-cap cryptocurrency pairs (BTC/USDT, ETH/USDT, INJ/USDT, SOL/USDT), three methods (Random, TPE, DE), single viability metric, zero transaction costs, single-run exploratory design. Future research should examine extended time periods, multi-timeframe patterns, additional methods, online learning, broader asset classes, and multiple-run confirmatory protocols.
This work advances optimizer selection understanding by demonstrating that effectiveness depends on strategy-specific characteristics and problem topology, not universal rankings. The strategy-specific compatibility framework enables practitioners to select methods based on strategy type and validation rather than simplistic topology-based heuristics. Systematic comparisons with failure mode analysis bridge the gap between ML benchmarks and real-world financial deployment under regime non-stationarity.