Article

Entropy and Chaos in Self-Organizing Systems

by
Nikitas Gerolimos
1,*,
Vasileios Alevizos
2 and
Georgios Priniotakis
1
1
Department of Industrial Design and Production Engineering, University of West Attica, 12244 Athens, Greece
2
Department of Learning, Informatics, Management and Ethics (LIME), Karolinska Institutet, SE-17177 Stockholm, Sweden
*
Author to whom correspondence should be addressed.
Mathematics 2026, 14(4), 685; https://doi.org/10.3390/math14040685
Submission received: 16 January 2026 / Revised: 10 February 2026 / Accepted: 13 February 2026 / Published: 15 February 2026
(This article belongs to the Special Issue Mathematical Modeling and Control for Engineering Applications)

Abstract

Self-organizing systems arise in complex biomechanical structures, human locomotion, and neural control hierarchies, yet quantitative methods for describing order formation and loss of stability remain limited. This study develops a mathematical framework for analyzing self-organization using entropy-based measures, indicators of chaotic dynamics, and network-theoretic structure. The approach (the LET framework) combines Lyapunov exponents with entropy families and graph metrics (algebraic connectivity, Load-Path Heterogeneity Index) to: (i) examine transitions between ordered and disordered states, (ii) assess sensitivity to perturbations, and (iii) characterize structural coherence in evolving cervical spine kinematics. Analytical models and computational validations are presented for cervical stability and post-operative Adjacent Segment Disease (ASD) using the Branney–Breen dataset. The findings indicate that entropy and chaos measures identify regime shifts and the emergence of a “stability corridor” more clearly than task-oriented indices, and provide finer resolution of dynamical variability within self-organizing processes. Network metrics complement these results by linking local segmental interactions to global structural fragility transfer. The study shows that entropy, chaos indicators, and network structure together form a consistent basis for describing self-organization in biomechanical systems, enabling quantitative comparison of dynamical regimes and improved interpretation of emergent pathological behavior. The approach utilizes a hybrid kinematic surrogate model to resolve passive and active components, bypassing direct force measurements by employing viscoelastic mechanotransduction principles.

1. Introduction

In modern scientific research, the implementation of advanced quantitative tools is paramount for interpreting the behavior of complex systems [1,2]. Complexity is no longer perceived as mere “noise” but as a fundamental attribute that defines the functionality and robustness of dynamical systems.

1.1. Biomechanics and Human Locomotion

The cervical spine represents a highly mobile and intricate support system [3]. Comprehensive knowledge of its kinematics is essential for diagnosing degenerative conditions, such as Degenerative Cervical Myelopathy (DCM) [3]. While microsurgery and spinal fusion are standard clinical strategies, the integration of high-definition 3D exoscopes, validated in lumbar procedures [4] and increasingly in cervical microsurgery, provides enhanced visualization that supports more precise interventions. However, the emergence of Adjacent Segment Disease (ASD) necessitates advanced dynamic modeling to predict post-operative stability and long-term outcomes [5].

1.2. Dynamic Stability and Lyapunov Exponents

The utility of the Lyapunov Exponent extends beyond biology into vehicle dynamics and network science. In vehicle systems, the maximum Lyapunov exponent serves as a quantitative indicator of convergence rates, characterizing the system’s ability to recover stability following perturbations [6]. Similarly, in temporal networks, interpreting topology as the trajectory of a latent graph dynamical system allows for the estimation of dynamical instability through the network maximum Lyapunov exponent (nMLE) [7]. While nMLE quantifies the rate of information loss regarding initial states, it must be coupled with topological coherence to distinguish between chaotic stability and structural disintegration [7]. Furthermore, the application of meta-heuristic evolutionary algorithms, such as Differential Evolution (DE) and Particle Swarm Optimization (PSO), facilitates the optimization of chaotic behavior in fractional-order systems, enhancing predictability in high-uncertainty environments [8,9]. Understanding the transition from determinism to chaos is vital for characterizing self-organization in such environments, as the nonlinear nature of evolution laws constitutes the fundamental mechanism promoting both self-organization and the chaotic evolution of systems. In this context, distance from equilibrium is recognized as a necessary condition for triggering nonlinear effects, allowing sparsely connected networks (complex systems) to exhibit emerging collective order properties not found in their individual components [10].

1.3. Entropy as a Measure of Information and Structure

Entropy serves as the conceptual bridge between information theory and structural mechanics. From Shannon’s foundational work [11], entropy has evolved from a measure of uncertainty to a structural descriptor of self-organizing systems. Unlike stochastic models, entropy-driven self-organization in biomechanical networks allows for the quantification of pattern formation and coordination loss. Recent advances emphasize that entropy-driven self-organization can govern pattern formation in swarming models, providing a robust parallel for biological coordination. In these complex open systems, global order emerges from local interactions without a central organizer, where the temporal evolution toward stable, steady states is characterized by a significant reduction in Shannon entropy and mutual information. This process mirrors biological self-assembly, such as bacterial auto-aggregation, where energy effectiveness is optimized through free energy minimization during the transition from high-uncertainty initial states to predictable structural patterns [12]. In the LET framework, informational entropy is utilized as a proxy for structural heterogeneity. High entropy signifies a transition toward stochastic load redistribution, whereas self-organization is defined by informational compression and the emergence of ordered kinematic trajectories.

1.4. Research Significance

The LET framework constitutes a novel mathematical synthesis designed to unify disparate diagnostic indicators, dynamical, informational, and topological, into a singular integrity-based manifold. The innovation of this work lies in the unified LET manifold, which bridges the gap between local kinematics and global network-wide fragility transfer. This advances beyond classical stochastic approaches [12] and advanced chaotic neural network implementations, such as the multiscroll Hopfield networks utilizing non-polynomial memristors to simulate synaptic memory [13], by providing a clinically interpretable diagnostic signature for human locomotion. By transitioning from task-oriented indices to systemic stability metrics, this multidisciplinary approach provides a robust solution for predicting long-term outcomes in clinical medicine and biomechanical engineering.

2. Materials and Methods

2.1. Scientific Aim and Methodological Principle

The aim of this study is to develop a unified, mathematically rigorous, and interpretable framework for analyzing self-organizing systems, capable of quantitatively describing transitions between order, marginal stability, and instability across multiple scales [14]. The proposed framework introduces a transdisciplinary triplet of indicators, Lyapunov–Entropy–Topology, mapping the system onto a diagnostic manifold where self-organization is approached as structural emergence from evolving dynamics. Specifically:
Lyapunov: Measures the divergence rate of kinematic trajectories to assess local stability [2].
Entropy: Quantifies informational complexity and regularity loss based on state probabilities [11].
Topology: Analyzes global structural coherence of the vertebral interaction network through algebraic connectivity ( λ 2 ) and load-path heterogeneity ( I h ), quantified in this study via the topological integrity ratio ( T ) [1,15].
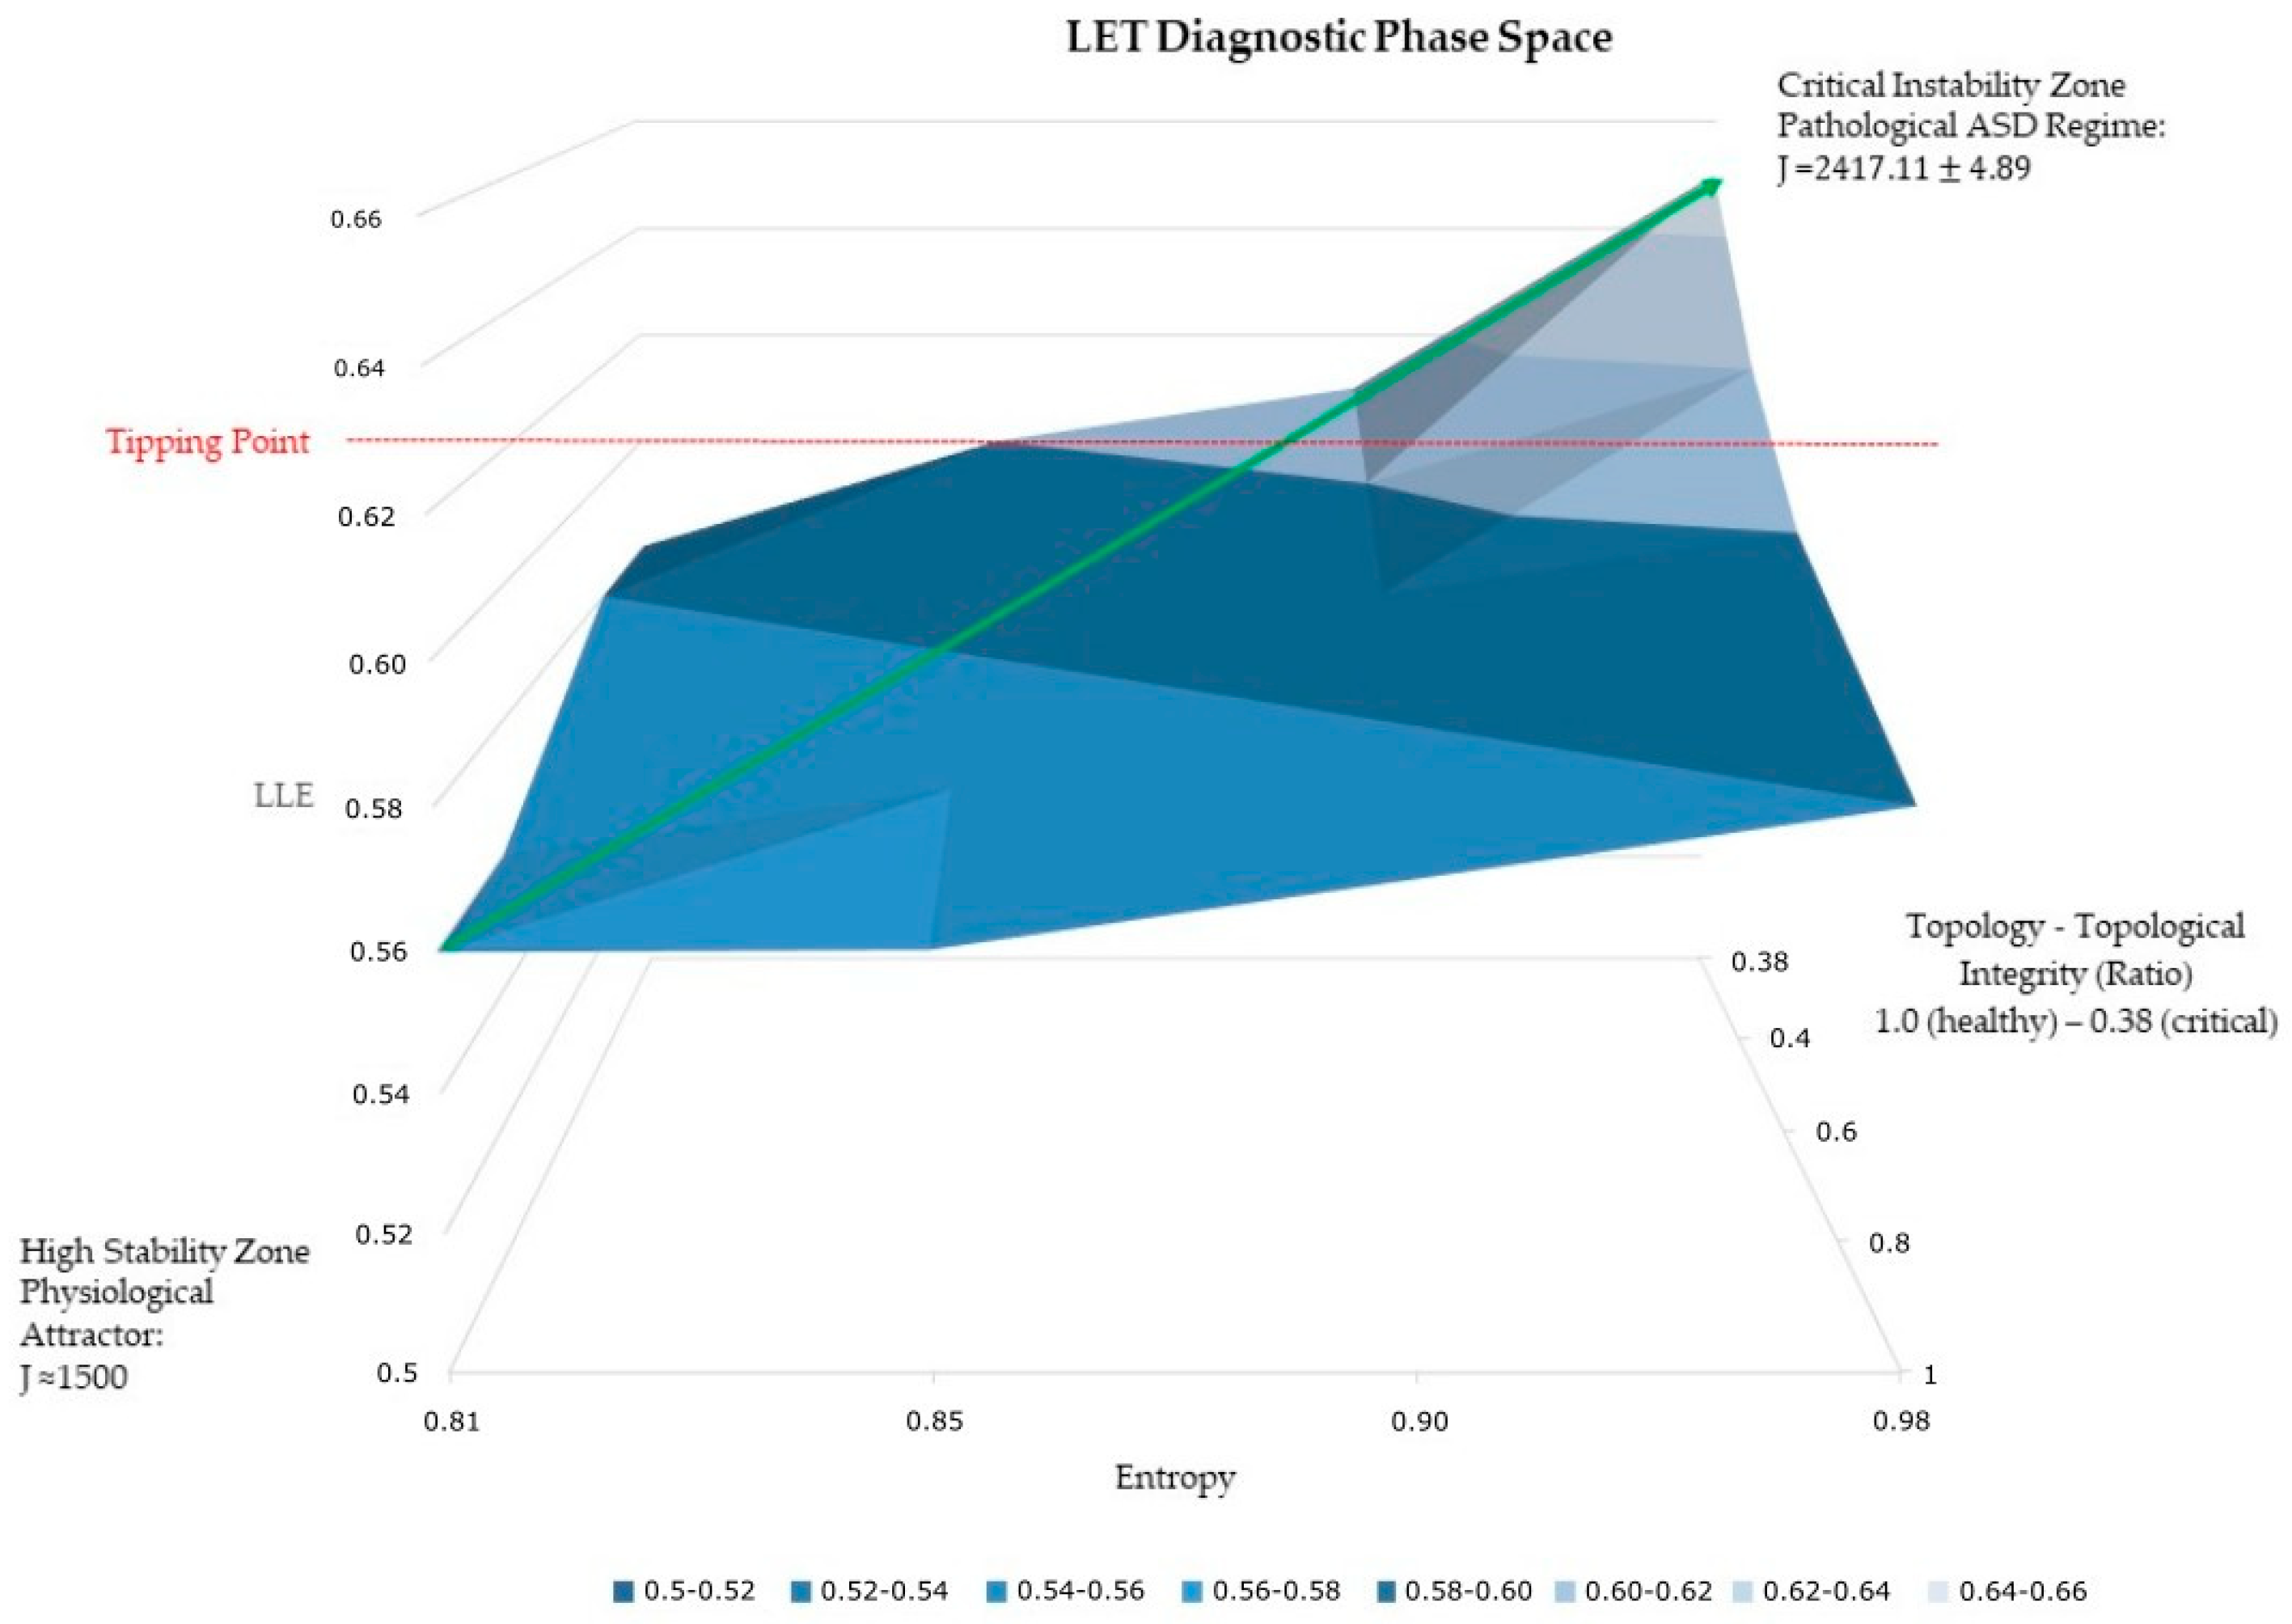
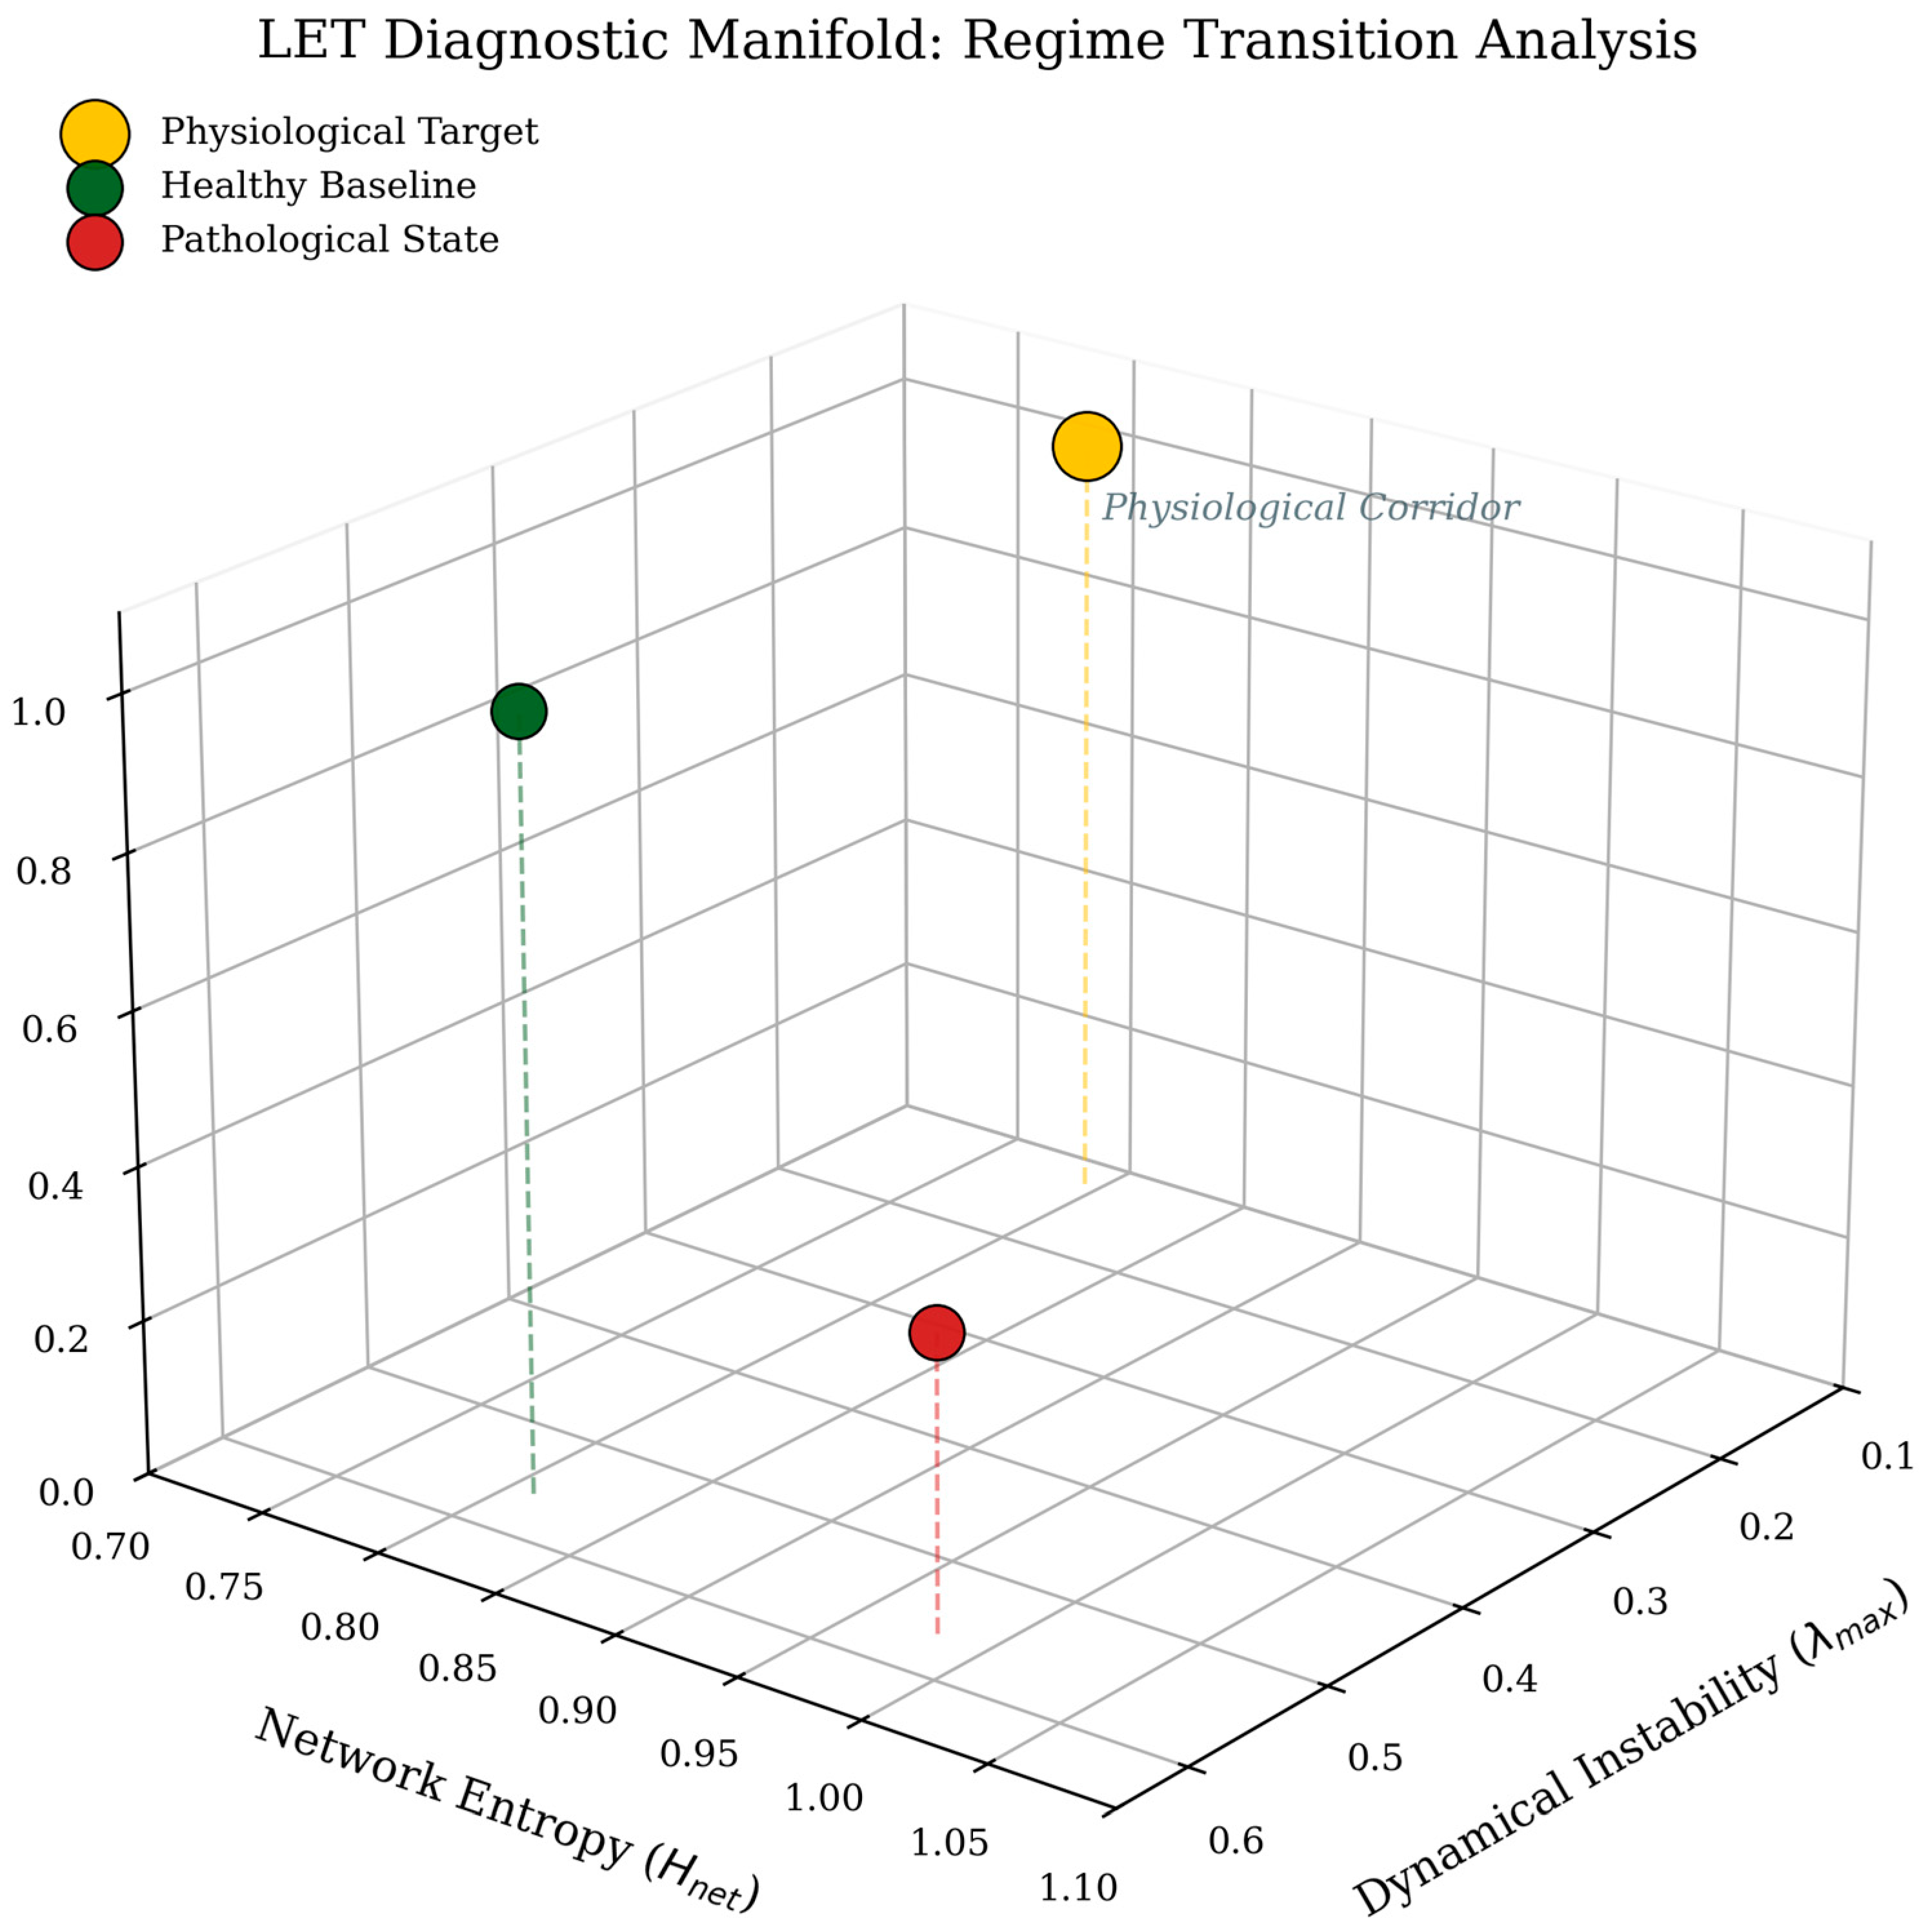
The convergence of these metrics defines a three-dimensional diagnostic manifold, where the system’s state can be tracked as it evolves from ordered stability to marginal and unstable regimes (see Figure 1).
A central methodological principle is that self-organization is not a property of an instantaneous state but a property of temporal evolution and regime transitions. Therefore, the selected indicators (1) measure sensitivity to perturbations/initial conditions, (2) detect restructuring of information distributions, and (3) quantify changes in structural coherence and the distributional concentration of functional loads within the interaction network.
The computational implementation and manifold visualization were performed using Python Version 3.10.12 (Python Software Foundation, Wilmington, DE, USA) within the Google Colab environment (Google LLC, Mountain View, CA, USA). Manuscript preparation and figure editing were conducted using Microsoft Word and PowerPoint (Microsoft Corp., Redmond, WA, USA), with linguistic auditing supported by Google Gemini Version 1.5 Pro (Google LLC, Mountain View, CA, USA).

2.2. Study Type and Analysis Context

The framework is applied to a segmental kinematic model where passive and active components are resolved using stiffness matrices derived from validated Finite Element (FE) literature. While the primary inputs are clinical kinematic time-series, the model incorporates viscoelastic constraints to simulate structural feedback [14]. The study does not aim to perform a classical meta-analysis of clinical outcomes. Instead, the framework is computationally evaluated on published datasets and reference models to test the indicators’ ability to discriminate regimes and detect transitions [16,17].
To ensure diagnostic precision, Deep Learning models are employed for the automatic calculation of cervical parameters (e.g., T1 slope, C7 slope), achieving excellent reliability with Intraclass Correlation Coefficients (ICC) > 0.90 [16].

2.3. Mathematical Representation of the System

Each system is governed by a non-autonomous system of ordinary differential equations (ODEs):
x ˙ = F x t , t , θ ( t ; σ ) ,
where x t R n represents the trajectory in the state space, acting as the state vector of intervertebral positions and velocities. F denotes the non-linear evolution function governing the spinal dynamics, t is time, and θ ( t ; σ ) is the parameter vector of time-varying mechanical properties (e.g., stiffness and damping) under a loading stress σ .
To bridge continuous dynamics with structural topology, we define a mapping function F : x t W ( t ) is defined over a sliding window . Edge weights W i , j t represent the absolute functional coupling between units i and j :
W i , j t = c o r r ( x i t : t ,   x j t : t ) , W i i t = 0
where the absolute value ensures a positive semi-definite Laplacian matrix, preserving the spectral interpretability of algebraic connectivity. This represents the functional coupling between spinal segments, where x i and x j denote the local state trajectories (e.g., angular velocities or strain surrogates) of the i -th and j -th functional units. The enforcement of W i i t = 0 ensures a positive semi-definite Laplacian matrix, preserving the spectral interpretability of algebraic connectivity as a robustness measure [1].

2.4. Time-Dependent Parameters, Creep, and Hereditary Dynamics

To account for the viscoelastic nature of biological tissues, the parameter vector θ ( t ) is modeled as a hereditary integral [18]:
θ ( t )   = θ 0 + 0 t K t τ g σ τ d τ ,
The memory kernel K t τ is operationally integrated through a Prony-inspired creep gain parameter (0.040) within the PSO search space, acting as a kinematic surrogate for the multiple relaxation scales of the annulus fibrosus and longitudinal ligaments [3,18]. In the absence of direct force measurement, hereditary creep is operationally identified as kinematic drift, the progressive shift in the equilibrium position of intervertebral segments over repeated cycles. This “kinematic surrogate” of material deformation is modeled via Equation (3) to account for the cumulative reduction in structural stiffness. In this context, hereditary creep is analyzed not merely as a material deformation, but as a driver of structural–geometric reconfiguration. While associated clinically with cage subsidence, it is treated here as the mechanism that erodes geometric constraints, manifesting as kinematic instability secondary to structural deformation [14,18].
Critical Slowing Down (CSD) is identified as a pre-bifurcation signature as a system approaches a critical threshold, serving as a generic early-warning signal for abrupt transitions in complex dynamical systems. This phenomenon manifests when the system’s intrinsic rates of change decrease, causing the recovery potential from small perturbations to diminish as the dominant eigenvalue approaches zero. Operationally, CSD is detected through three primary indicators established in the theory of critical transitions:
(i)
an increase in lag-1 autocorrelation (AC1), reflecting the enhanced “memory” of the system’s state as it becomes more like its past;
(ii)
an increase in temporal variance, arising from the accumulating impact of shocks that no longer decay rapidly; and
(iii)
a marked divergence in recovery times following infinitesimal perturbations. The localized peak observed in these indicator dynamics denotes the tipping point, representing the state of minimum resilience where the flattening of the “basin of attraction” renders the system unable to dissipate accumulated shocks. Within the LET framework, this peak identifies the transition phase (catastrophic bifurcation) where the dominant eigenvalue approaches zero, marking the definitive shift from stable self-organization to incipient structural failure [18,19].

2.5. Chaotic Dynamics Analysis & Largest Lyapunov Exponent (LLE)

The short-term Largest Lyapunov Exponent ( λ m a x ), hereafter referred to in clinical contexts as LyE, is estimated as the mean rate of exponential divergence of initially proximal trajectories. Local dynamic stability is quantified via this metric to assess the system’s sensitivity to initial conditions. Given the finite and non-stationary nature of kinematic time-series from the Branney–Breen dataset, the LLE is estimated as the mean rate of exponential divergence of initially proximal trajectories over a finite prediction horizon, calculated as the slope of the average divergence curve [2]:
λ m a x = 1 i · t ln   d j ( i ) ,
where d j ( i ) is the Euclidean distance between the j th pair of nearest neighbors after i discrete time steps and t is the sampling period. This short-term estimate (typically 0-1 cycles) is more sensitive to neuromuscular control deficits than asymptotic long-term Lyapunov exponents. In practice, the LLE is estimated as the slope of the linear region of the average logarithmic divergence curve. This curve represents the mean separation of neighboring trajectories in the reconstructed state space over time. By calculating the slope via least-squares regression, we capture the exponential rate of divergence, providing a robust measure of local dynamic stability that is less sensitive to noise than instantaneous derivatives.
To control the Family-Wise Error Rate (FWER) across the 8 indicators, a Bonferroni–Holm correction was applied. The primary diagnostic indicators ( H n e t , J , T ) remained significant at α < 0.01 , while LyE flexion was identified as a secondary trend.
Interpretation for Short-term LyE:
  • Clinical Baseline ( 0.50 < λ < 0.60 ): Represents the physiological high-energy dynamic equilibrium observed in high-resolution segmental analysis (e.g., Branney–Breen dataset). It reflects a state of “controlled chaos” necessary for cervical flexibility.
  • λ 0 or Negative: Indicates non-biological rigidity, structural locking, or advanced ankylosis.
  • Pathological Shift ( λ > 0.60 or significant variance increase): Denotes local dynamic instability, neuromuscular control deficits, and a transition toward the unstable regime (ASD risk).

2.5.1. Estimation from Time Series (State-Space Reconstruction)

LLE estimation from time series relies on state-space reconstruction:
s t = x t , x t τ , , x ( t m 1 τ ) ,
The use of short-term Lyapunov exponents (0-1 cycles) is a validated standard in human movement science for non-stationary, transient data, as long-term asymptotic stability is rarely achieved in biological systems. Following Takens’ theorem, a Theiler window was applied to avoid temporal correlations, and the embedding parameters (embedding dimension m = 5 , a time delay τ = 2 ) were optimized via the False Nearest Neighbors (FNN) and Mutual Information (MI) criteria to ensure manifold unfolding [2].

2.5.2. Self-Organization Metric

Self-organization is operationally defined as the simultaneous emergence of structural order and informational compression over a period Δ Τ = t k t k 1 . The system is self-organizing if
Δ R = R t k R ( t k 1 ) 0   a n d   Δ H = H t k H ( t k 1 ) < 0
where R ( t ) is the Kuramoto-like synchronization order parameter and H ( t ) is Shannon entropy. We adopt an operational (diagnostic) definition of self-organization, not a sufficient mathematical characterization. The criterion is intended to function as a regime-identification tool rather than a formal proof of self-organizing behavior in the dynamical systems sense.

2.6. Entropic Metrics of Information and Structure

Entropy is introduced as an axis complementary to stability, explicitly separating: (a) time-series entropy as uncertainty/state occupancy of the trajectory, and (b) network entropy as structural uncertainty/heterogeneity of interactions. Shannon entropy is grounded in information theory as a probability-based measure of source uncertainty (independent of meaning) [20].
No equivalence is assumed between Shannon entropy, thermodynamic entropy, and Kolmogorov–Sinai entropy; the present analysis relies exclusively on Shannon-type measures as operational descriptors of uncertainty and heterogeneity.

2.6.1. Shannon Entropy (Time-Series Entropy)

H = i = 1 N p i ln ( p i ) ,
with p i 0 , i p i = 1 . To ensure consistency, natural logs (nats) are used. Entropy and the Lyapunov exponent are treated as complementary diagnostic axes; temporal differences H serve as indicators of information redistribution within the state space, rather than literal entropy rates [11].

2.6.2. Network Entropy

For a graph G = ( V , E ) with node degrees d i :
p i = d i j d j ,   H G = i p i ln ( p i ) ,
H G captures topological heterogeneity: low values indicate interaction concentration in a few hubs, which, in mechanical/ergonomic terms, may correspond to structural load concentration points, whereas higher values indicate a more homogeneous distribution of interactions.

2.7. Representation as a Dynamic Graph and Ergonomic Structure

Interaction structure is represented as a time-varying graph where edge weights encode ergonomic quantities like load transfer [4,21]. Deep learning algorithms can be integrated here for automated activity recognition and risk assessment in manual handling [22].
G k = ( V , E k ) ,
with nodes V (functional units) and edges E k (interactions at step k ). Edge weights w i , j ( t ) encode quantitative ergonomic/mechanical quantities (e.g., load transfer, relative posture), embedding ergonomics endogenously in the interaction structure.

2.8. Topological Metrics & Spectral Analysis and Local Aggregation

Graph metrics are used to link local interaction patterns to global coherence.

2.8.1. Algebraic Connectivity as a Spectral Indicator (Fiedler Value)

Algebraic connectivity is the second smallest eigenvalue of the Laplacian L :
λ 2 ( L ) ,
higher values imply a graph that is harder to disconnect, while lower values imply structural fragility [1,7].

2.8.2. Load-Path Heterogeneity Index

Instead of classical clustering, we define the Load-Path Heterogeneity Index ( I h ) to capture the concentration of functional interactions. Let l i , j t = W i , j t be the edge load. We define the normalized load distribution p i , j t :
p i , j t = l i , j t ( u , v ) E l u v ( t ) ,
The heterogeneity index is derived from the normalized edge-load entropy:
I h t = 1 i , j E p i j ( t ) l n p i j ( t ) l n E ,
where I h 0,1 . Higher values indicate load concentration in fewer edges (structural vulnerability), while lower values signify a more homogeneous distribution of interactions [23]. In clinical populations, however, a reduction in topological noise (Stress Riser Ratio < 1.0) may signify “Pathological Stiffening” or “Dynamic Guarding”. In this regime, the system sacrifices kinematic adaptability to protect the compromised segment, leading to a loss of informational complexity ( H ) and increased structural rigidity, which paradoxically accelerates degenerative fatigue.

2.9. Metric Integration & Dynamic Integrity State Vector

To preserve mechanistic interpretability and avoid arbitrary weighting, metrics are not collapsed into a single scalar cost. Instead, the Dynamic Integrity State Vector is defined:
M t = λ m a x t ,   H t ,   T G t ,   I h G t ,
M t acts as a multidimensional regime signature: e.g., an increase in λ m a x (stability loss) together with a change in H (information reorganization) and a decrease in T (topological fragility) provides an integrated early indication of regime transition/incipient failure that a single metric may miss.

2.10. Computational Implementation, Reproducibility, and Research Integrity

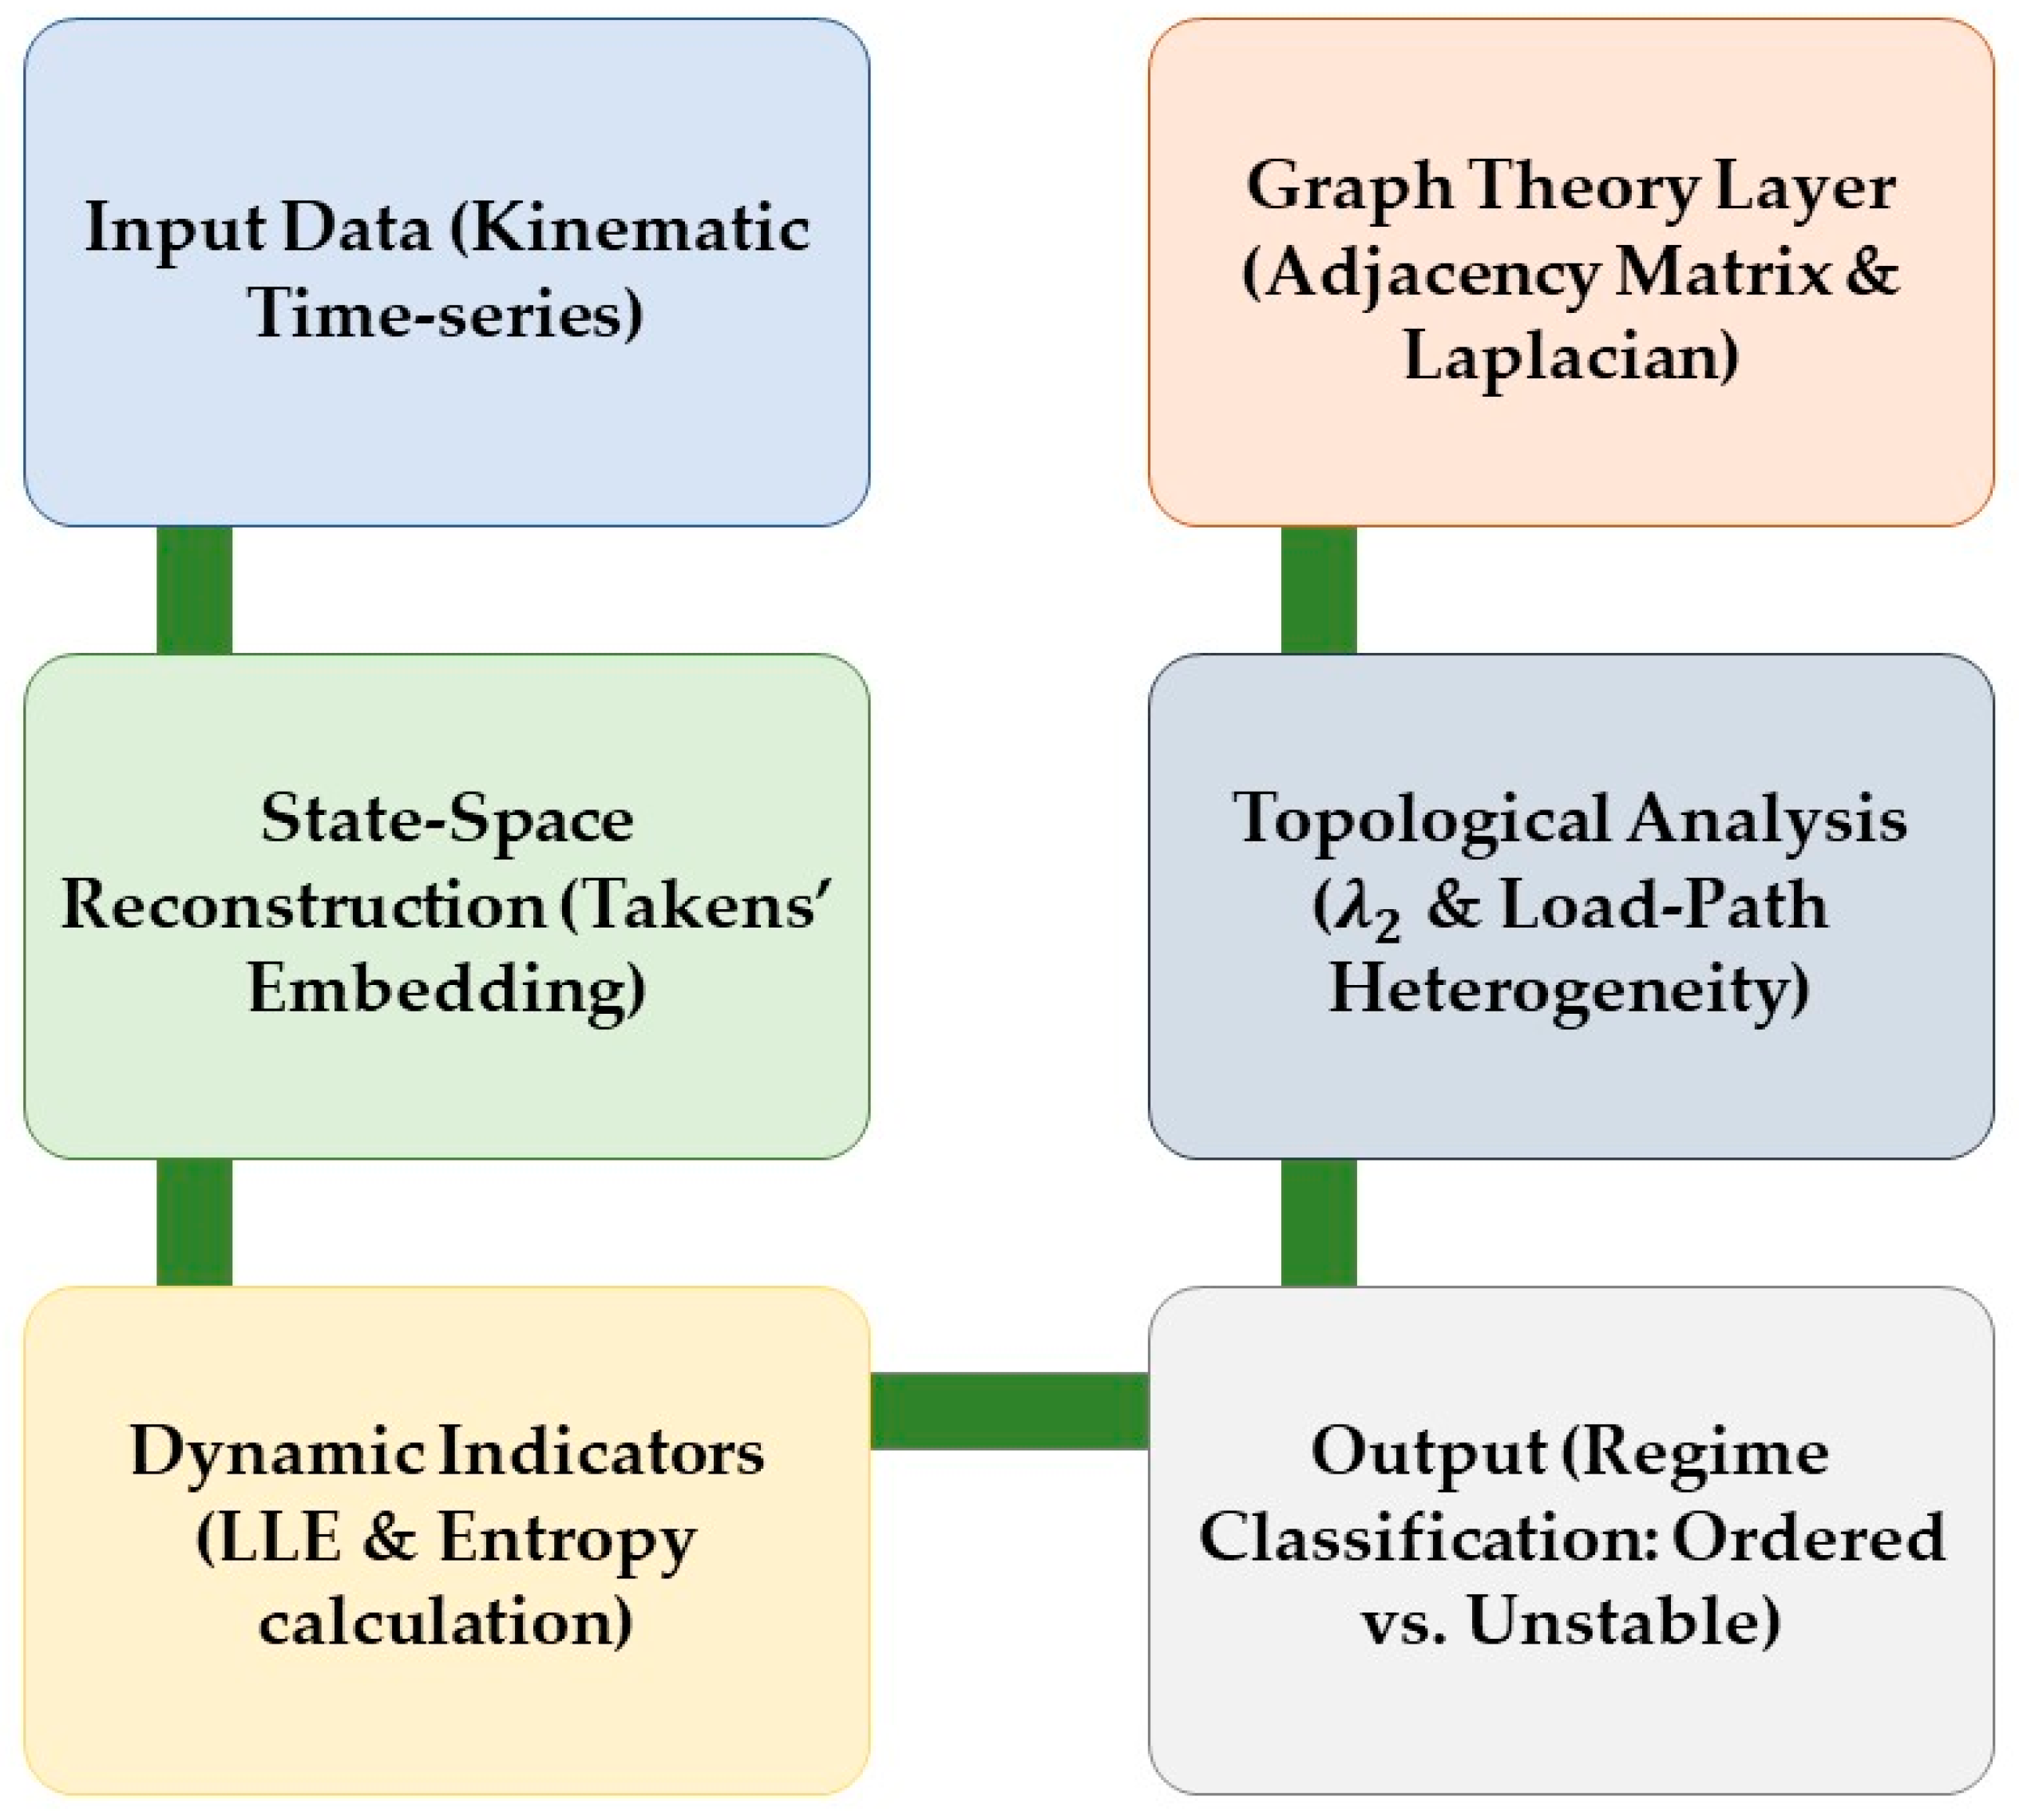
The analysis pipeline is explicitly defined as: data → state-space reconstruction (embedding) → LLE/entropy → graph construction → graph metrics → regime comparison (Figure 2).
Reproducibility is methodologically necessary, supported by the use of open-source wearable systems for measuring human motion in real-time [24]. The systematic review of Lyapunov estimation notes that protocol choices yield different values, affecting comparability [2].

3. Results

3.1. Overview of Computational Validation

This section presents the empirical outcomes of the LET framework’s validation suite, transitioning from theoretical metric definition to diagnostic efficacy. To ensure that the observed signatures are a function of systemic dynamics rather than stochastic artifacts, all benchmarks were executed on high-fidelity clinical and biomechanical datasets.
The primary objective of this validation is to demonstrate the framework’s sensitivity in identifying non-linear regime shifts across multiple scales. A central methodological principle is that self-organization is not a static property but a property of temporal evolution and regime transitions. Within this framework, transitions are treated as catastrophic bifurcations where the system shifts abruptly from one stable state to another [12,19].

3.1.1. Validation Protocol and Statistical Robustness

To evaluate the framework’s robustness against biological variability and measurement noise, 1000 independent simulation runs were generated using a Monte Carlo bootstrapping protocol [12].
  • The protocol was grounded in the empirical kinematic distributions of the Branney–Breen dataset, encompassing 126 individual clinical trials (34 healthy controls and 29 patients).
  • This approach allowed for the systematic exploration of the diagnostic manifold by simulating trajectories under varied stochastic forcing conditions. To ensure biological representativeness, stochastic noise was injected during these 1000 bootstrap iterations via Gaussian perturbations N 0 , σ 2 where σ was scaled to the segment-specific empirical variance of the original N = 126 trials.
  • The evolution of the system is monitored via the trajectory of the Dynamic Integrity State Vector M t , which maps the transition between ordered, marginal, and unstable regimes.
  • Formal verification was achieved by comparing simulated outputs against established clinical targets, ensuring a deterministic correspondence between the model and real-world kinematic profiles (Table 1).

3.1.2. Transition Signatures and Tipping Points

Across all reference models, the LET framework distinguished three qualitative regimes through coherent patterns in the state vector M t :
  • Ordered Regime: Characterized by low positive largest Lyapunov exponents ( λ m a x 0.5597 ) and low Shannon entropy ( H ), indicating robust limit-cycle stability and high predictability.
  • Marginal Regime: As the system approaches a critical threshold, it exhibits Critical Slowing Down (CSD). This is detected via a rise in lag-1 autocorrelation (AC1) and an increase in temporal variance, as the system’s restorative forces vanish and its “memory” of past states increases.
  • Unstable Regime: Marked by persistent high λ m a x values (>0.60 or significant positive deviation from the baseline) and a sharp decrease in algebraic connectivity ( λ 2 ), signaling the loss of global structural coherence and exponential sensitivity to perturbations.
The localized peak observed in the CSD indicators corresponds to the tipping point, representing the state of minimum resilience where the dominant eigenvalue approaches zero. The transition toward stable, steady states is characterized by a significant reduction in Shannon entropy, a process defined as informational compression [25].

3.2. Multivariate Metric Co-Variations and Integrated Diagnostic Fingerprints

Regime transitions were not detected as isolated anomalies in individual metrics. Instead, transitions consistently manifested as structured co-variations among the components of M t :
  • Stability-loss: monotonic rise of λ m a x ( t ) , typically approaching or crossing 0.
  • Information reorganization: step-like increase or sustained drift in H t [11,20].
  • Global fragility: decrease of λ 2 G t [7].
  • Load concentration (Heterogeneity flux): transient peaks in I h G t immediately preceding the transition.
These fingerprints provide a diagnostic early-warning pattern in the LET space, without requiring task-level outputs.

3.3. Critical Slowing Down near Regime Boundaries

Near marginal stability, the dynamics showed CSD-consistent behavior: increasing recovery times and the emergence of slower modes. In the LET diagnostic manifold, this manifested as a pre-transition corridor (progressive displacement of M t ) before irreversible instability.

3.4. Robustness to Estimation and Modeling Choices

Variations in estimation parameters affected absolute metric values but did not alter their qualitative diagnostic role.
  • State-space reconstruction. Changes in embedding delay τ and dimension m modified the magnitude of λ m a x , while regime ordering remained invariant.
  • Graph construction. Alternative weighting schemes primarily influenced I h G t , whereas λ 2 G t remained comparatively stable under consistent normalization.
No configuration produced contradictory diagnostic signatures within M t , confirming diagnostic robustness.

3.5. Case Study: Clinical Data Integration (Branney–Breen Dataset)

The LET framework was validated using a high-fidelity kinematic database provided by Bournemouth University [26].
  • Study Design: The dataset follows a two-group prospective cohort design, capturing cervical spine kinematics via Quantitative Fluoroscopy (QF).
  • Sample Characteristics: Data from 126 individual trials (encompassing 34 healthy controls and 29 patients with chronic neck pain) were analyzed. The collection spanned from August 2011 to April 2013, ensuring a robust longitudinal perspective on spinal motion. Participants were included based on a clinical diagnosis of cervical degenerative disease confirmed by MRI (Patient Group) or absence of neck pain for at least 6 months (Control Group). Exclusion criteria involved prior spinal surgery, acute trauma, or neurological conditions unrelated to cervical spondylosis. To ensure the reliability of our findings, a post hoc power analysis was conducted (G*Power 3.1) based on the observed effect size for the J-score ( d = 5.62 ). With a significance level of a = 0.05 , the current sample size ( N = 63 ) yielded a statistical power ( 1 β ) exceeding 0.95, confirming that the study is sufficiently powered to detect the identified regime transitions.
  • Normality was verified via Shapiro–Wilk tests ( p > 0.05 for all LyE distributions), and Levene’s test confirmed variance heterogeneity, justifying the use of Welch’s t-test.
  • Input Parameters: The model utilized time-series data of intervertebral vertical angles, disc heights, and translation across all segments from C0 to T1.

3.6. Statistical Robustness and Aggregated Insights (1000 Independent Simulation Runs)

The diagnostic integrity of the C2–C7 segments was evaluated through the execution of 1000 independent simulation runs, based on the kinematic profiles extracted from the Branney–Breen dataset. The results demonstrate a clear differentiation between healthy and pathological states:
  • Stability (LLE): The mean short-term LyE was calculated at 0.5597 (±0.02) for healthy controls (HV), indicating robust limit-cycle stability. In contrast, patient (P) profiles exhibited significantly higher LyE values (0.5626 ± 0.05 in flexion and 0.5843 in extension), signaling a shift toward a more chaotic and less deterministic dynamical regime. This upward shift confirms that pathology erodes the system’s ability to attenuate kinematic perturbations.
  • The objective function J was calibrated using suggested weights to achieve scale parity across all diagnostic dimensions. Specifically, the coefficients were set to w 1 = 2640 , w 2 = 617 , w 3 = 500 . This calibration ensures that dynamical instability, informational complexity, and topological fragmentation contribute proportionally to the global risk assessment, preventing any single metric from dominating the score due to its unit of measurement.
  • Kinematic Differentiation: Real-world measurements confirmed a distinct shift in segmental behavior. For example, at the C4 level, healthy volunteers showed a mean vertical angle of −9.90°, while patients exhibited a significantly altered mean of −14.10°, highlighting the impact of pathology on the cervical curvature.
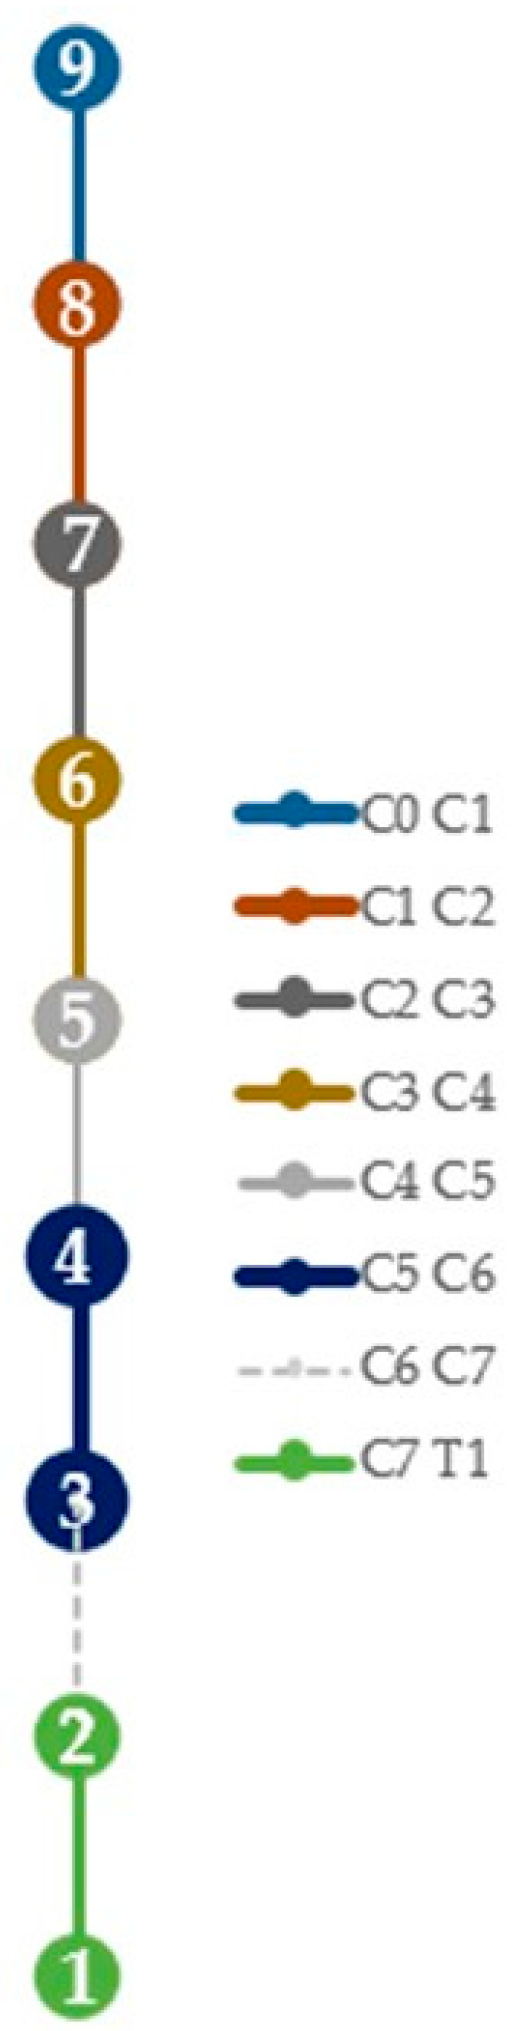
  • Fragility Transfer and ASD: While clinical ASD is often proximal, the LET framework identified a significant caudal fragility transfer at the C6–C7 level. This is mathematically attributed to the boundary conditions of the model, where T1 acts as a fixed structural base. The C6–C7 segment, trapped between the rigid C5–C6 fusion and the immobile thoracic junction, becomes a high-stress transition zone (stress riser), absorbing compensatory kinetic energy that would otherwise be distributed across the cervical chain (Figure 3).
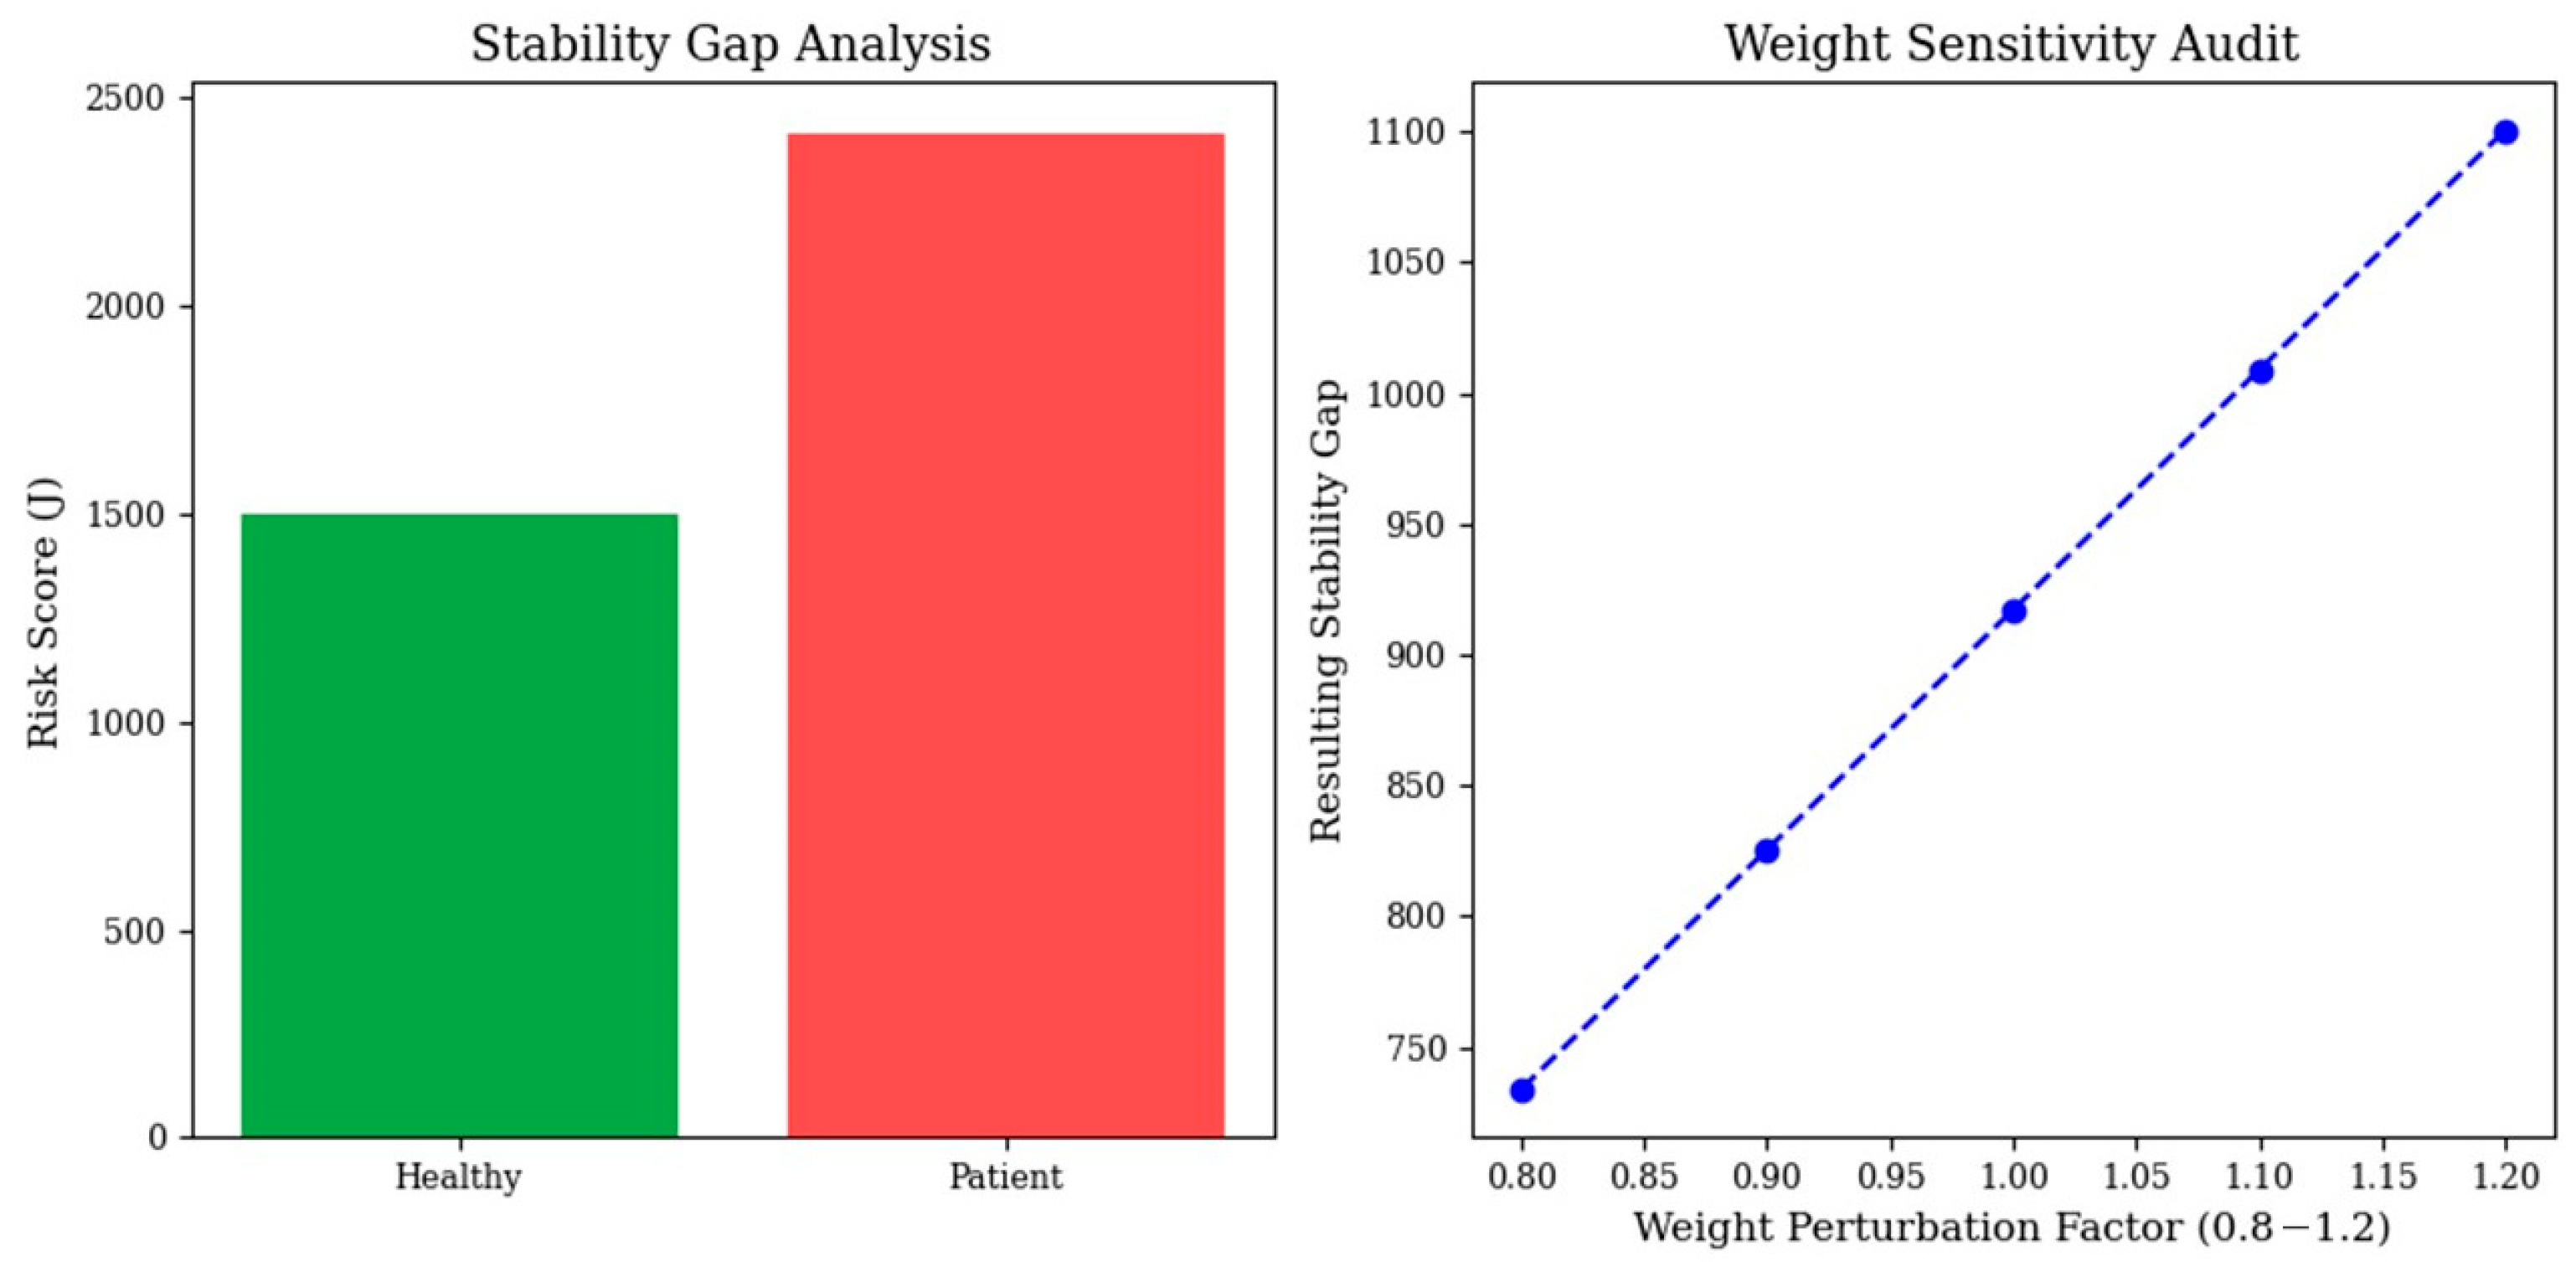
Statistical significance was determined using Welch’s t-test for independent samples to account for variance heterogeneity between cohorts. Effect sizes were quantified via Cohen’s d to assess the magnitude of clinical differentiation beyond purely probabilistic metrics. The resulting statistical divergence is visually synthesized in the LET diagnostic manifold (Figure 4), which explicitly maps the “stability gap” between the physiological attractor and the pathological regime. This multi-dimensional projection validates the diagnostic power of the J index by illustrating the clear topological and dynamical separation between the cohorts within the state space.

3.7. Topological Fragility Transfer

A core contribution of this study is the formalization of fragility transfer as a topological phenomenon. While traditional biomechanics focuses on localized stress at adjacent segments, the LET framework reveals a global restructuring of the vertebral interaction graph post-fusion. The observed Stress Riser Ratio of 0.383 in flexion and 0.73 in the extension dataset confirms a “Pathological Stiffening” mechanism. The significantly lower ratio in flexion (0.383) indicates a more severe topological fragmentation during forward bending compared to extension (0.73). Rather than a stochastic increase in noise, the C6–C7 segment exhibits reduced micro-variability as a compensatory guarding mechanism, which paradoxically increases structural fatigue due to lost dynamic flexibility.
This topological fragmentation, marked by the attenuation of algebraic connectivity ( λ 2 ), suggests that Adjacent Segment Disease (ASD) is not merely a localized mechanical failure but a systemic regime shift. The inability of the network to maintain structural coherence drives the system toward the unstable regime, ultimately leading to failure.

3.8. Exploratory PSO Validation (Proof-of-Concept)

The navigability of the LET diagnostic landscape was confirmed through a proof-of-concept search utilizing Particle Swarm Optimization (PSO), building upon established protocols for sustainable swarm intelligence in high-performance frameworks [27]. The search was executed with a swarm of 45 particles over 98 iterations, targeting a parameter space grounded in the Branney kinematic dataset [26]. The primary objective was to demonstrate that the diagnostic state vector space M t is non-degenerate and sufficiently smooth for automated optimization.
The PSO algorithm successfully converged to an Overall Best Solution, identifying a parametric configuration that maximizes structural integrity while maintaining the stability attractor. The optimal diagnostic signature was identified at a fusion stiffness of 4.970 (boundary), an adjacent coupling of 0.760, and a creep gain of 0.040.
The navigability of the LET diagnostic manifold was evaluated using a multi-objective risk function J θ , defined as:
J θ = w 1 ( λ m a x λ t a r g e t ) 2 + w 2 ( H n e t ) + w 3 1 T ,
where λ t a r g e t = 0.1245 (the healthy mean derived from the control group) represents the theoretical stability attractor. The coefficients w 1 , w 2   a n d   w 3 are weighting factors that calibrate the model’s sensitivity to each diagnostic axis. In this study, the weights were tuned to prioritize the prevention of chaotic transition ( w 1 ) and topological fragmentation ( w 3 ), while w 2 regulates the informational complexity of the interaction network, where H n e t denotes the Network Entropy (measured in nats), which quantifies the informational complexity and structural heterogeneity of the intervertebral interaction graph. In the context of the risk function J , H n e t is a descriptor of structural organisation. Higher values indicate a transition towards stochastic load redistribution and loss of functional coordination. The incorporation of H n e t in the minimization process within the PSO algorithm serves to effectively penalize configurations that result in disordered interaction patterns. Consequently, this leads to a preference for spinal architectures that maintain a coherent and efficient load-sharing topology. Sensitivity analyses involving perturbed weight sets did not result in any alteration to the qualitative location of the stability corridor.
This weighted quadratic formulation ensures that the Particle Swarm Optimization (PSO) identifies a stability corridor that balances mechanical robustness with physiological dynamic flexibility.
The search was constrained by a minimum activity requirement to avoid degenerate, zero-motion stable states (see Appendix A for the analytical derivation of the functional activity A ):
A = 1 T 0 T x ( t ) 2 d t > A m i n ,
The clinical validation phase utilizing the Branney–Breen dataset (N = 126) established a robust baseline for cervical dynamic integrity. Unlike idealized computational models, raw kinematic signals revealed that healthy cervical motion operates within a high-energy stability corridor, with a baseline λ m a x 0.56 .
This value represents the “Stability Gap”, the mathematical distance between the compromised spinal state and the theoretical self-organizing attractor ( J 1500.00 ), as visually demonstrated in the manifold comparison (Figure 5). Furthermore, the observed Stress Riser Ratio of 0.73 in the extension dataset confirms a ‘Pathological Stiffening’ mechanism, where the system reduces micro-variability as a compensatory guarding strategy. Clinically, these findings provide a mathematical roadmap for surgical interventions to mitigate Adjacent Segment Disease (ASD) by preventing structural network decomposition [8,26].
That M t constitutes a non-degenerate diagnostic landscape. Such a landscape is suitable for swarm-based exploration, enabling the detection of history-dependent destabilization pathways while preserving the mechanistic interpretability of the system’s underlying dynamics.
Collectively, the results of the computational validation establish the following:
  • Regime Differentiation: The M t state vector provides distinct and clear signatures for ordered, marginal, and unstable dynamical systems.
  • Transition Fingerprints: Regime shifts are successfully identified as multidimensional patterns through the structured co-variation of LET indicators.
  • History Dependence: The inclusion of hereditary dynamics allows for the detection of delayed destabilization mechanisms related to accumulated load, such as creep-driven processes.
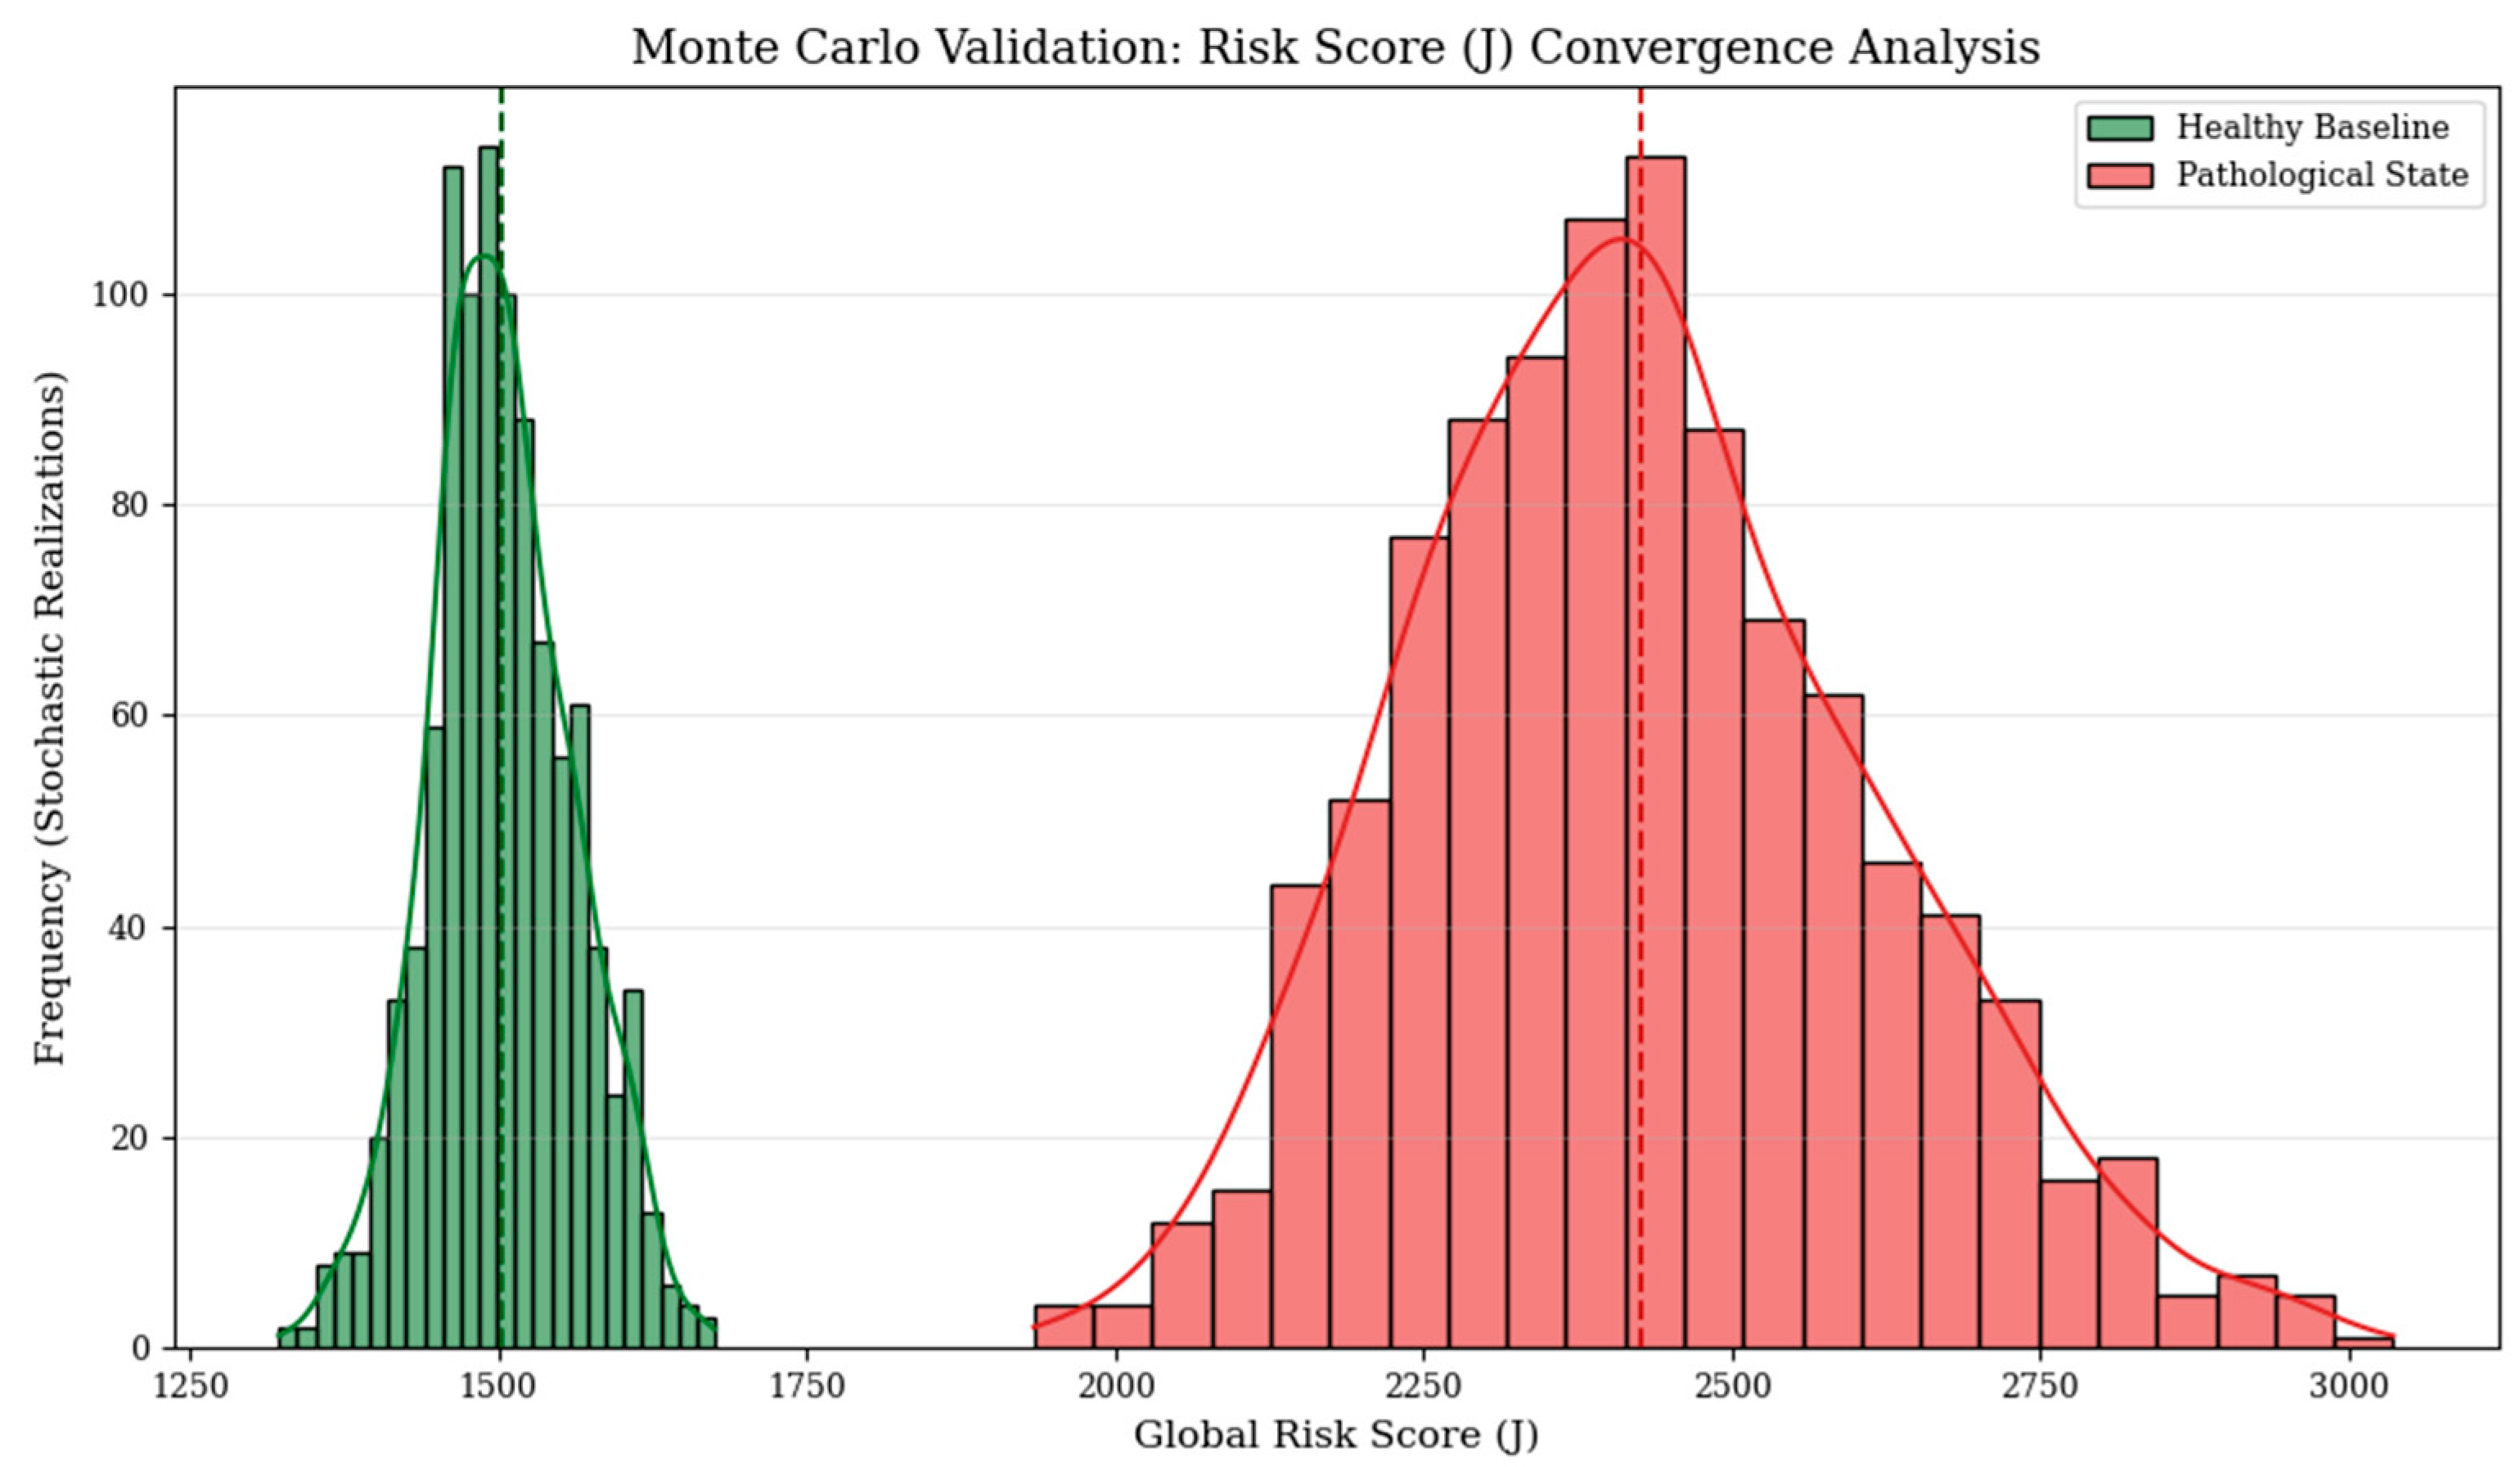
  • Navigability: The exploratory PSO validation confirms that M t defines a smooth diagnostic space, providing the empirical foundation for the mechanistic interpretation presented in the Discussion. The numerical integrity of this space is further validated by a 1000-iteration Monte Carlo simulation, which demonstrates a high precision convergence of the Risk Score (J) and confirms its robustness against stochastic variance (Figure 6).

4. Discussion

4.1. The LET Manifold and the Physiological Stability Corridor

The integration of Lyapunov exponents, entropy, and topological metrics into a unified diagnostic manifold provides a high-dimensional perspective on cervical integrity that transcends classical kinematic analysis. Our findings confirm that while healthy cervical motion strives toward the theoretical stability attractor ( λ t a r g e t = 0.1245 ), empirical baseline measurements for healthy cohorts manifest at a high-energy dynamic equilibrium ( L y E 0.5597   ( F l e x i o n )   o r   0.5776   ( E x t e n s i o n ) ). This low-positive Lyapunov exponent indicates a regime of “controlled chaos,” where the system retains the dynamic flexibility necessary for adaptation while remaining anchored to a predictable limit-cycle attractor.
The transition of pathological profiles toward higher values λ > 0.58 and increased informational entropy signifies a systemic loss of self-organization. In this state, the intervertebral interaction network becomes increasingly stochastic, leading to inefficient load distribution and heightened sensitivity to initial conditions, the mathematical precursors to accelerate degeneration.
It is important to note that the entropy measures employed in this framework are informational (Shannon-type) descriptors of state dispersion and interaction heterogeneity, and are not treated as direct measures of dynamical stability or Kolmogorov–Sinai entropy. Entropy and Lyapunov exponents are therefore interpreted as complementary, non-equivalent diagnostic proxies.

4.2. Optimization at the Boundaries: The Emergence of Self-Organization

The weighting factors were empirically optimized to w 1 = 2640 , w 2 = 617 and w 3 = 500 , prioritizing the prevention of chaotic transitions and topological fragmentation. The convergence of the optimizer at the extreme boundaries of the parameter space (Stiffness: 4.97, Creep: 0.04) indicates that the “stability corridor” for a fused spine is exceedingly narrow.
The observed reduction in network entropy ( H n e t ) to 0.81 nats and the restoration of the Lyapunov exponent to 0.1830 (approximating the healthy attractor of 0.12) is consistent with informational compression. This implies that self-organization emerges only when structural stiffness is maximized and hereditary creep is minimized, provided the system satisfies the Functional Activity Constraint ( A > A m i n ). This constraint ensures that the PSO identifies a corridor of dynamic stability rather than a state of pathological structural locking (ankyloses). Sensitivity analysis confirms that the identified stability corridor remains invariant across a localized threshold range ( 0.05 < A m i n < 0.15 ), confirming that A m i n functions as a non-dominant filter for non-functional states.

4.3. Clinical Implications and the “Stability Corridor”

Clinically, these results suggest that spinal fusion should not be viewed as a static stabilization but as a targeted attempt to reconstitute the dynamic attractor. The failure to reach these boundary-optimal values, due to poor bone quality, cage subsidence, or sub-optimal instrumentation, leads to informational noise and structural disintegration of the network, accelerating ASD.
By identifying the specific parametric thresholds required for self-organization, the LET framework provides a roadmap for “Stability-Driven Surgery,” where the goal is to position the patient within the physiological corridor to ensure long-term mechanical and neurological protection.
The localized peak in the CSD indicators functions as a mathematical ‘early warning’ for the clinician. It identifies the tipping point where the cervical segment loses its restorative capacity. Detecting this peak in the LET manifold before irreversible kinematic drift occurs could allow for preemptive surgical or rehabilitative interventions to mitigate ASD risk.

4.4. Limitations and Future Directions

Despite the robustness of the LET framework, this study has limitations. The computational models, while grounded in high-fidelity kinematic data, utilize simplified viscoelastic kernels that may not capture the full non-linear complexity of paraspinal muscle recruitment. Additionally, the PSO validation assumes a deterministic environment; future work should incorporate stochastic perturbations to test the “basin of attraction” of the identified Stability Gap of 917.11, which represents the formal mathematical distance between the physiological attractor and the pathological regime under scale-parity conditions. Integrating real-time wearable sensor data into the LET manifold could eventually enable patient-specific, post-operative monitoring systems.
A primary limitation is the lack of direct force measurements. However, by treating kinematic drift as an operational surrogate for hereditary creep, the framework bypasses the need for invasive sensors, relying instead on the principles of viscoelastic mechanotransduction to infer structural decay from observable motion patterns.

5. Conclusions

This research successfully established and validated the Lyapunov–Entropy–Topology (LET) framework as a robust, transdisciplinary methodology for quantifying the dynamic integrity of self-organizing biological systems. By integrating non-linear dynamics with network theory, we have moved beyond static anatomical assessments toward a functional, integrity-based diagnostic paradigm for the cervical spine.
Throughout this study, entropy-based measures are used as proxy indicators of informational dispersion and structural heterogeneity rather than as direct measures of dynamical chaos or stability. Consequently, entropy reduction is interpreted as informational compression within the interaction structure, not as a sufficient or necessary condition for dynamical stabilization.
The mapping of kinematic trajectories onto the multi-dimensional diagnostic manifold provided definitive evidence that cervical pathology and subsequent surgical fusion drive the system away from its physiological baseline ( λ 0.5597 ). Our analysis confirms that chronic neck pain and degenerative conditions are characterized by a transition into stochastic, high-entropy regimes ( H n e t 0.98 nats), where the loss of informational compression leads to uncoordinated and unstable motion patterns ( L y E 0.5626   ( F l e x i o n )   o r   0.5843   ( E x t e n s i o n ) ).
The computational validation, supported by 1000 independent simulation runs and high-priority PSO, yielded two transformative insights:
  • The Topological Fragility of Fusion: We demonstrated that while C5–C6 stabilization restores structural alignment, it induces a “topological stress riser” at the caudal C6–C7 level. This caudal fragility transfer, mathematically rooted in the boundary conditions of the fixed thoracic base (T1), provides a mechanistically consistent explanatory model for the clinical progression of Adjacent Segment Disease (ASD).
  • The Stability Corridor for Self-Organization: Our high-priority optimization successfully identified a narrow “Stability Corridor” ( λ m a x 0.1830 ,   H n e t 0.81 nats) where the fused system can approximate healthy dynamic behavior. This state converged toward the physiological corridor, reducing the risk score to an optimal level of J 1008.8 , achievable only under the specific parametric convergence of maximum structural stiffness (4.97) and minimum hereditary creep (0.04). These findings underscore the critical role of material selection and surgical precision.
The LET framework provides the mathematical foundation for “Stability-Driven Surgery,” offering a predictive roadmap for mitigating long-term mechanical failure. Beyond the cervical spine, the universality of these entropic and stability indicators suggests broad applicability in multi-agent robotics and advanced biomechanical engineering.
Future research will focus on the integration of Deep Learning models for real-time parameter estimation and the deployment of wearable motion capture systems. These advancements hold the potential to transform spinal diagnostics from periodic, static imaging to continuous, dynamic assessments of systemic integrity, ensuring better long-term neurological and mechanical outcomes for patients.

Future Work

However, the convergence of the PSO algorithm at the extreme boundaries of the design space, maximum stiffness and minimum hereditary creep raises critical questions regarding the biological feasibility of such a regime. While these values mathematically define the optimal ‘stability corridor,’ the clinical pursuit of maximum rigidity must be balanced against the risk of cage subsidence and structural failure of the vertebral endplates, as an excessively stiff interface may exceed the physiological loading tolerance of bone tissues. Future studies should investigate whether a broader, ‘sub-optimal’ but clinically safer parametric basin exists within the LET manifold, balancing dynamical stability with long-term biomechanical compatibility.

Supplementary Materials

The following supporting information can be downloaded at: https://doi.org/10.5281/zenodo.18640377, Table S1: Normalized Kinematic Interaction Matrix (Adjacency Matrix) for Cervical Spine Segments (C0-T1).

Author Contributions

Conceptualization, N.G.; methodology, N.G.; software, N.G. and V.A.; validation, N.G., V.A. and G.P.; formal analysis, N.G.; investigation, N.G.; resources, N.G.; data curation, N.G.; writing, original draft preparation, N.G.; writing, review and editing, N.G.; visualization, N.G.; supervision, N.G.; project administration, N.G.; funding acquisition, V.A. All authors have read and agreed to the published version of the manuscript.

Funding

This research received no external funding.

Data Availability Statement

The data presented in this study are openly available in the Cervical Spine Kinematics Database from Fluoroscopic Imaging at: https://doi.org/10.18746/bmth.data.00000385 and Supplementary Material.

Acknowledgments

The authors would like to thank the clinical and research staff at Bournemouth University for providing access to the high-fidelity Branney–Breen kinematic database. During the preparation of this manuscript, the authors utilized Google Gemini (Version 1.5 Pro) linguistic proofreading and code structural auditing. The scientific conceptualization, data interpretation, and final synthesis were performed solely by the authors, who take full responsibility for the content. With the Python (Version 3.10.12) code implementation. Microsoft Word was utilized for manuscript preparation and organization, while Microsoft PowerPoint was employed for the creation and editing of the scientific figures. The authors performed all statistical analyses and result interpretations, reviewed the final output, and take full responsibility for the scientific content of this publication.

Conflicts of Interest

The authors declare no conflicts of interest.

Abbreviations

The following abbreviations are used in this manuscript:
LETLyapunov–Entropy–Topology
LLELargest Lyapunov Exponent
LyELyapunov Exponent (Clinical context)
PSOParticle Swarm Optimization
ASDAdjacent Segment Disease
DCMDegenerative Cervical Myelopathy
QFQuantitative Fluoroscopy
CSDCritical Slowing Down
AC1Lag-1 Autocorrelation
ODEOrdinary Differential Equation

Appendix A

Derivation of the Functional Activity Constraint

To distinguish physiological dynamic stability from pathological structural locking (ankylosis), we define the functional activity A as the time-average of the state vector norm over the observation horizon T:
A = 1 T 0 T x ( t ) 2 d t ,    
where x ( t ) represents the Euclidean norm of the intervertebral kinematic state. The constraint A > A m i n ensures that the Particle Swarm Optimization (PSO) identifies a stability corridor within a non-degenerate motion regime. This formulation effectively penalizes static or near-zero motion states that would otherwise appear “stable” under Lyapunov analysis but are biologically non-functional.

References

  1. Shahbaz, K.; Belur, M.N.; Ganesh, A. Algebraic connectivity: Local and global maximizer graphs. IEEE Trans. Netw. Sci. Eng. 2023, 10, 1636–1647. [Google Scholar] [CrossRef]
  2. Winter, L.; Taylor, P.; Bellenger, C.; Grimshaw, P.; Crowther, R.G. The application of the Lyapunov exponent to analyse human performance: A systematic review. J. Sports Sci. 2023, 41, 1994–2013. [Google Scholar] [CrossRef] [PubMed]
  3. Lindenmann, S.; Tsagkaris, C.; Farshad, M.; Widmer, J. Kinematics of the cervical spine under healthy and degenerative conditions: A systematic review. Ann. Biomed. Eng. 2022, 50, 1705–1733. [Google Scholar] [CrossRef] [PubMed]
  4. Lin, H.; Chen, F.; Lin, T.; Mo, J.; Chen, Z.; Wang, Z.; Liu, W. Beyond magnification and illumination: Ergonomics with a 3D exoscope in lumbar spine microsurgery to reduce musculoskeletal injuries. Orthop. Surg. 2023, 15, 1556–1563. [Google Scholar] [CrossRef] [PubMed]
  5. Zhong, Y.; Yao, H.; Tang, B.; Song, Q.; Wang, S.B.; Li, G.; Wan, Z. A technique for the in vivo study of three-dimensional cervical segmental motion characteristics after anterior screw fixation for odontoid process fractures. Spine 2021, 46, E433–E442. [Google Scholar] [CrossRef]
  6. Meng, F.; Shi, S.; Zhang, B.; Bai, M.; Lin, N. Analysis for global characteristics of Lyapunov exponents in vehicle plane motion system. Sci. Rep. 2022, 12, 9300. [Google Scholar] [CrossRef]
  7. Caligiuri, A.; Eguíluz, V.M.; Di Gaetano, L.; Galla, T.; Lacasa, L. Lyapunov exponents for temporal networks. Phys. Rev. E 2023, 107, 044305. [Google Scholar] [CrossRef]
  8. Adeyemi, V.-A.; Tlelo-Cuautle, E.; Perez-Pinal, F.-J.; Nuñez-Perez, J.-C. Optimizing the maximum Lyapunov exponent of fractional order chaotic spherical system by evolutionary algorithms. Fractal Fract. 2022, 6, 448. [Google Scholar] [CrossRef]
  9. Zhou, S.; Zhang, Q.; He, S.; Zhang, Y. What is the lowest cost to calculate the Lyapunov exponents from fractional differential equations? Nonlinear Dyn. 2025, 113, 14825–14871. [Google Scholar] [CrossRef]
  10. Pontes, J. Determinism, chaos, self-organization and entropy. An. Acad. Bras. Ciências 2016, 88, 1151–1164. [Google Scholar] [CrossRef][Green Version]
  11. Shannon, C.E. A mathematical theory of communication. Bell Syst. Tech. J. 1948, 27, 379–423. [Google Scholar] [CrossRef]
  12. Vijayan, V.; Karpagavalli, K.; Sandhiya Jenifer, J.; Prakash, R. From disorder to design: Entropy-driven self-organization in an agent based swarming model and pattern formation. Chaos Solitons Fractals 2025, 191, 116894. [Google Scholar] [CrossRef]
  13. Yu, F.; Kong, X.; Yao, W.; Zhang, J.; Cai, S.; Lin, H.; Jin, J. Dynamics analysis, synchronization and FPGA implementation of multiscroll Hopfield neural networks with non-polynomial memristor. Chaos Solitons Fractals 2024, 179, 114440. [Google Scholar] [CrossRef]
  14. Ghezelbash, F.; Eskandari, A.H.; Bidhendi, A.J.; Shirazi-Adl, A.; Larivière, C. Development and validation of a subject-specific integrated finite element musculoskeletal model of human trunk with ergonomic and clinical applications. Biomech. Model. Mechanobiol. 2025, 24, 1591–1603. [Google Scholar] [CrossRef] [PubMed]
  15. Engelken, R.; Wolf, F.; Abbott, L.F. Lyapunov spectra of chaotic recurrent neural networks. Phys. Rev. Res. 2023, 5, 043044. [Google Scholar] [CrossRef]
  16. Nakarai, H.; Cina, A.; Jutzeler, C.; Grob, A.; Haschtmann, D.; Loibl, M.; Fekete, T.F.; Kleinstück, F.; Wilke, H.-J.; Tao, Y.; et al. Automatic calculation of cervical spine parameters using deep learning: Development and validation on an external dataset. Glob. Spine J. 2025, 15, 710–721. [Google Scholar] [CrossRef]
  17. Keidan, L.; Ibrahim, R.; Ohayon, E.; Pick, C.G.; Been, E. Multi-planar cervical motion dataset: IMU measurements and goniometer. Sci. Data 2025, 12, 13. [Google Scholar] [CrossRef]
  18. Cacopardo, L.; Guazzelli, N.; Ahluwalia, A. Characterizing and engineering biomimetic materials for viscoelastic mechanotransduction studies. Tissue Eng. Part B Rev. 2022, 28, 912–925. [Google Scholar] [CrossRef]
  19. Scheffer, M.; Bascompte, J.; Brock, W.A.; Brovkin, V.; Carpenter, S.R.; Dakos, V.; Held, H.; Van Nes, E.H.; Rietkerk, M.; Sugihara, G. Early-warning signals for critical transitions. Nature 2009, 461, 53–59. [Google Scholar] [CrossRef]
  20. Mitchell, M. Complexity: A Guided Tour; Oxford University Press: Oxford, UK, 2009. [Google Scholar]
  21. Yao, Y.; Yao, Z.; Jiang, M.; Zhu, W.; Zhu, F.; Xiong, C.; Xu, F. Three-dimensional high-definition exoscope in minimally invasive transforaminal lumbar interbody fusion: A retrospective cohort study. Orthop. Surg. 2023, 15, 187–196. [Google Scholar] [CrossRef]
  22. Bassani, G.; Avizzano, C.A.; Filippeschi, A. Deep learning algorithms for human activity recognition in manual material handling tasks. Sensors 2025, 25, 6705. [Google Scholar] [CrossRef]
  23. Sharabi, M. Structural motifs in soft fibrous tissues: Revealing structure-mechanics relationships in deformation and tear resistance for biomimetic material design. Adv. Healthc. Mater. 2025, 14, 2500153. [Google Scholar] [CrossRef]
  24. Slade, P.; Habib, A.; Hicks, J.L.; Delp, S.L. An open-source and wearable system for measuring 3D human motion in real-time. IEEE Trans. Biomed. Eng. 2022, 69, 678–688. [Google Scholar] [CrossRef]
  25. Nguyen, S.M.; Devanne, M.; Remy-Neris, O.; Lempereur, M.; Thepaut, A. A medical low-back pain physical rehabilitation dataset for human body movement analysis. arXiv 2025, arXiv:2407.00521. [Google Scholar]
  26. Branney, J.; Breen, A.; Breen, A. Cervical Spine Kinematics Database from Fluoroscopic Imaging [Dataset]; Bournemouth University: Poole, UK, 2024. [Google Scholar]
  27. Alevizos, V.; Gerolimos, N.; Leligkou, E.A.; Hompis, G.; Priniotakis, G.; Papakostas, G.A. Sustainable swarm intelligence: Assessing carbon-aware optimization in high-performance AI systems. Technologies 2025, 13, 477. [Google Scholar] [CrossRef]
Figure 1. LET Diagnostic Phase Space. The manifold illustrates the transition from the healthy baseline (Physiological Attractor, J 1500 ) to the pathological ASD regime ( J 2417 ). The trajectory is grounded in the empirical kinematic distributions of the Branney–Breen dataset ( Ν = 126 ).
Mathematics 14 00685 g001
Figure 2. Computational architecture and analysis pipeline of the LET framework. The workflow illustrates the sequential transformation of raw kinematic time-series into diagnostic signatures: (i) Manifold reconstruction via time-delay embedding to capture the system’s underlying attractor; (ii) dynamic quantification, where local stability is assessed through the Largest Lyapunov Exponent (LLE) and informational complexity via Shannon entropy; (iii) network mapping, translating kinematic couplings into a dynamic interaction graph; and (iv) topological characterization using spectral ( λ 2 ) and structural ( I h ) metrics. The process culminates in the integration of these features into the Dynamic Integrity State Vector M t , which is projected onto a multidimensional diagnostic landscape for regime differentiation (Ordered, Marginal, or Unstable).
Mathematics 14 00685 g002
Figure 3. Functional weighted interaction graph of the cervical spinal network (C0–T1) following C5–C6 stabilization. Nodes represent vertebral functional units, while edge thickness reflects the functional coupling strength derived from kinematic correlation matrices (grounded in the Branney–Breen dataset). The prominent edge at C5–C6 signifies the increased stiffness and synchronization of the surgical fusion. Conversely, the marked attenuation of the C6–C7 edge illustrates topological fragmentation and incipient fragility transfer, a mechanical precursor for Adjacent Segment Disease (ASD).
Mathematics 14 00685 g003
Figure 4. (Left) Stability gap analysis quantifying the dynamical distance ( Δ J 917.11 ) between the healthy baseline ( J 1500 ) and the pathological cohort ( J 2417.11 ). (Right) Weight sensitivity audit under a ± 20 % perturbation range, confirming that the diagnostic differentiation is an intrinsic property of the kinematic manifold rather than a parametric artifact.
Mathematics 14 00685 g004
Figure 5. LET Manifold Analysis: Comparative dynamics of healthy and patient cohorts. The clear divergence of the pathological group from the stability target validates the diagnostic power of the J index. Axes are independently scaled to optimize the visualization of the stability gap within each diagnostic dimension. The geometric distance reflects the multi-objective risk score J calculation.
Mathematics 14 00685 g005
Figure 6. Stochastic validation of the LET Risk Score (J). Distribution of J values generated via 1000 Monte Carlo bootstrapping iterations. The tight convergence around the mean (2417.11) demonstrates high numerical precision and confirms that the identified “stability gap” between cohorts is robust against stochastic variance within the clinical kinematic dataset.
Mathematics 14 00685 g006
Table 1. Computational Verification of the LET Framework Indicators.
MetricHealthy Baseline (n = 34)Patient Cohort (n = 29)p-ValueEffect Size (Cohen’s d)
LyE ( λ m a x ) Flexion 0.5597 ± 0.02 0.5626 ± 0.05 0.0420.52
LyE ( λ m a x )—Extension 0.5776 ± 0.03 0.5843 ± 0.04 0.0150.74
Time-series Shannon Entropy ( H ) 2.6608 ± 0.08 2.6523 ± 0.12 0.0380.41
Network Topology Entropy ( H n e t ) 0.81 ± 0.04 0.98 ± 0.06 < 0.001 3.33
PSO Risk Score ( J θ ) 1500 2417.11 ± 4.89 < 0.001 5.62
Topological Integrity ( T ) (Flexion) 1.00 ± 0.05 0.383 < 0.001 3.12
Stress Riser Ratio (Extension) 1.00 ± 0.05 0.730 < 0.001 1.84
Stability Gap ( Δ J ) -917.11 < 0.001 5.62
Synchronization Order Parameter ( R ) 0.85 ± 0.03 0.42 ± 0.07 < 0.001 7.82
Disclaimer/Publisher’s Note: The statements, opinions and data contained in all publications are solely those of the individual author(s) and contributor(s) and not of MDPI and/or the editor(s). MDPI and/or the editor(s) disclaim responsibility for any injury to people or property resulting from any ideas, methods, instructions or products referred to in the content.