1. Introduction
Anode furnaces play a pivotal role in the copper smelting process, particularly in the production of high-purity anode copper, which serves as the foundation for the subsequent electrolytic refining process. Anode furnaces process blister copper derived from converter blowing, and remove sulfur, oxygen, and other impurities through oxidation and reduction refining stages to meet the product quality requirements for electrolysis [
1].
Anode furnaces are critical pieces of smelting equipment widely used in the production of metals such as aluminum and copper [
2,
3]. In the operation of anode furnaces, endpoint determination is a crucial step that directly impacts the stability of the production process and the quality of the final product. The core of this process lies in the oxidation and reduction stages, which play a vital role in the refining process [
4]. In the production of anode furnaces, the oxidation and reduction endpoints in pyrometallurgical refining of crude copper are mostly determined through manual sampling and subjective judgment, leading to data latency, as well as through methods such as sampling analysis and flame image recognition. These approaches are plagued by issues including poor accuracy, high cost, response lag, and inadequate adaptability to complex operating conditions [
5]. For instance, manual empirical judgment is highly susceptible to the subjective factors of operators, resulting in poor consistency, while sampling analysis yields accurate results, it is time-consuming and cannot support real-time process control. Although methods like flame image recognition have achieved non-contact measurement to a certain extent, their recognition accuracy and adaptability to complex environments still need to be improved. In similar metallurgical processes such as basic oxygen furnace (BOF) steelmaking, end-point carbon content is a critical indicator. Conventional methods, including the time- or oxygen content-based exponential decarburization model and case-based reasoning approach, also have limitations, particularly in terms of prediction accuracy and adaptability to key model parameters [
6].
Currently, significant research has been conducted both domestically and internationally on endpoint determination technologies. Internationally, methods such as monitoring changes in copper deposition on electrolytic furnace electrodes and variations in redox potential are primarily used to determine the endpoint of copper furnaces [
7,
8]. These methods are widely applied in copper smelting due to their accuracy and operational simplicity. Domestically, due to the specific characteristics of the anode furnace fire refining process for copper, common endpoint determination methods primarily involve monitoring changes in furnace voltage, current, temperature, and oxygen content. Oráč et al. [
9] monitored the content of
during the oxidation–reduction process in an anode furnace through an
analysis system, achieving precise, visualized control of endpoint determination. Li Yumin et al. [
10] developed a reliable online data acquisition and intelligent analysis system to guide the precise control of the refining process in real time.
With the continuous advancement of image processing technology, flame recognition methods based on image features have attracted widespread attention [
11,
12]. Zhou M et al. [
13] proposed a new method based on flame spectrum and furnace mouth features using a Fuzzy Support Vector Machine (FSVM) for endpoint prediction in metal smelting. Zhang Y et al. [
14] used Gaussian-fitting algorithms and wavelet analysis algorithms to extract stable and unstable eigenvalues from flame spectrum information. By combining these with corresponding static models, a sample set was established. They then applied a backpropagation neural network algorithm to develop a continuous intelligent prediction model for carbon content and temperature in the later stages of steelmaking. The redox method, as a simple and effective algorithm for endpoint determination, can monitor changes in the redox state in real time, facilitating the adjustment of operating parameters and ensuring the stability of the production process [
15,
16]. This method allows endpoint determination solely through gas concentration monitoring. However, the redox method also has limitations. Since gas concentration is influenced by various factors such as temperature and pressure, it requires calibration and adjustment during practical application, typically involving the coupling of parameters like temperature and pressure to comprehensively assess the reaction state [
17,
18,
19,
20,
21].
Current research is actively exploring novel endpoint determination methods that integrate advanced data processing and artificial intelligence technologies. For instance, in the endpoint determination of copper converter blowing, existing studies have proposed the use of target detection algorithms to improve judgment accuracy. Unlike the traditional manual “effective eye” judgment method, this novel approach employs image recognition technology to analyze the internal state of the furnace, aiming to provide a more objective and intelligent determination method. It eliminates direct manual intervention in high-temperature environments and enhances the efficiency and precision of data processing. In addition, digital twin and ConvNeXt-based methods are being applied to the endpoint prediction of copper converter blowing, enabling non-contact real-time prediction via flame images, which effectively addresses the issues of low accuracy, high cost, and response delay in endpoint determination [
22]. In the optimization of copper smelting processes, artificial intelligence and machine learning models exhibit enormous potential. For example, backpropagation neural networks (BPNNs) have been widely used for modeling and prediction in industrial processes, such as improving current efficiency in copper electrolytic refining [
23], predicting the endpoint phosphorus content in argon oxygen decarburization (AOD) furnace for ferrochrome smelting [
24], and establishing decision-making models for emergency material allocation [
25]. BPNNs optimize model performance by adjusting weights and thresholds, and their accuracy is evaluated using mean squared error (MSE) [
26]. However, BPNNs also have inherent limitations, including slow convergence speed and a tendency to fall into local optima. To address these drawbacks, researchers have proposed improved BPNN algorithms, such as the hybrid model combining BPNN with the particle swarm optimization (PSO) algorithm to enhance the current efficiency of the process. A key innovation in recent studies lies in integrating the crystallization ratio method with image processing technology for the intelligent determination of the reduction endpoint in copper smelting anode furnaces. This method leverages the changes in the material microstructure during the crystallization process and performs quantitative analysis on these changes via image processing technology. It can provide more accurate and real-time determination criteria compared with methods that rely solely on neural networks or conventional approaches. For example, in basic oxygen furnace (BOF) steelmaking, Fuzzy Support Vector Machines (FSVMs) that integrate flame spectrum and furnace mouth image features have been applied for dynamic endpoint prediction, which can be implemented even under unstable furnace mouth operating conditions. Moreover, case-based reasoning methods have been adopted to determine the key parameters of decarburization models, thereby improving the real-time prediction accuracy of molten steel endpoint carbon content. By combining image processing with the crystallization ratio method and comparing the experimental data with those obtained from existing methods such as BPNNs and Generalized Regression Neural Networks (GRNNs), the superiority of this integrated method in resolving the problems of data latency and insufficient accuracy can be verified. This multi-technology integrated approach paves a new path for the refined control and intelligent production of copper smelting processes [
27].
In summary, the crystallization ratio method, as an effective algorithm for endpoint determination during the reduction phase of anode furnaces, plays a crucial role in the smelting process. This study aims to further develop endpoint determination techniques based on the analysis of anode copper composition, surface images of reduction samples, and cross-sectional image analysis in copper smelting anode furnaces. By establishing a reliable online data acquisition and intelligent analysis system, the precise control of the refining process can be guided in real time, ultimately achieving intelligent endpoint determination for anode furnace reduction. This study provides additional theoretical support for the advancement of the metal smelting field.
2. Materials and Methods
The anode furnace is a critical piece of equipment used in the copper smelting process. The basic principle of pyrometallurgical refining of copper in an anode furnace involves high-temperature melting, oxidation reactions, and reduction reactions to convert copper-containing ores into pure copper metal. During this process, by controlling the oxidation–reduction conditions and the reflective smelting process, major impurities such as sulfur, iron, and silicon are effectively separated from the copper metal, allowing for precise control of the composition and purity of the copper metal.
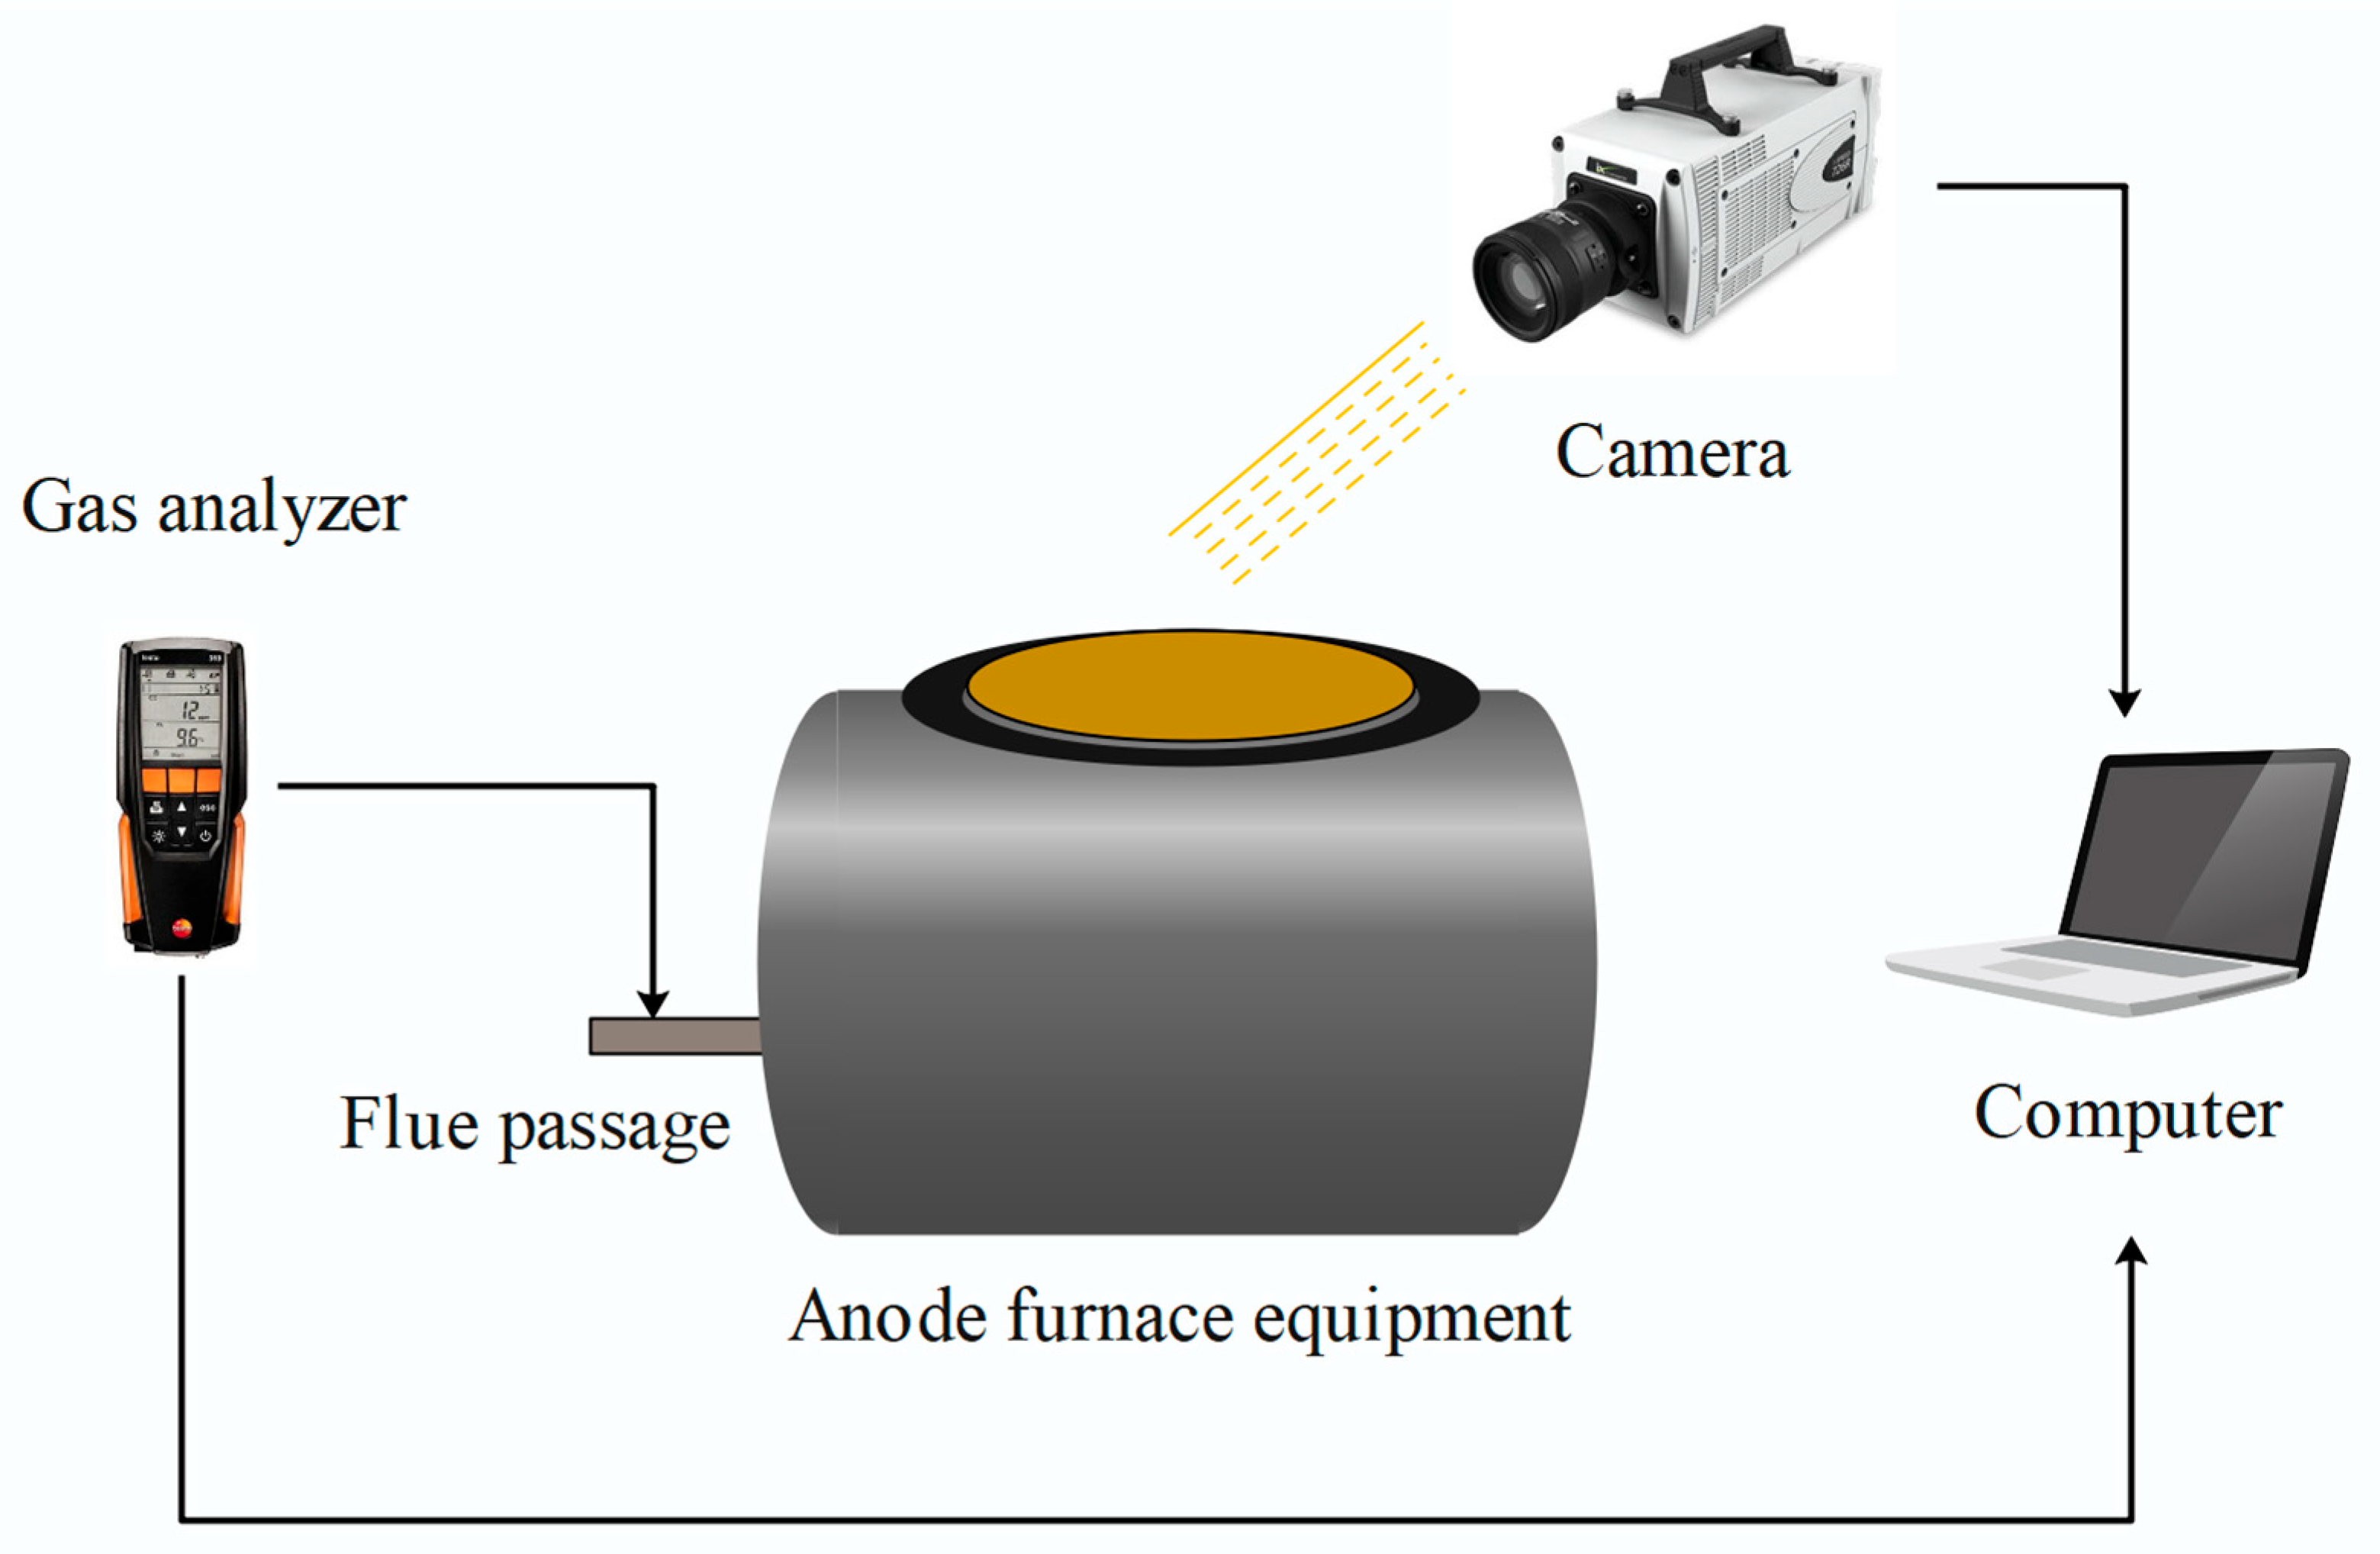
The equipment used in the pyrometallurgical refining of copper in an anode furnace primarily includes the melting furnace, blowing equipment, slag treatment equipment, cooling equipment, gas treatment system, and control system. The melting furnace is the core component of the anode furnace, used to heat copper ores or other copper-containing raw materials along with fuel to perform melting and oxidation reactions. The blowing equipment is used to inject oxygen or air into the melting furnace, facilitating the oxidation of impurities such as sulfur in the copper ore into gaseous forms and the formation of slag. Additionally, blowing also allows for the adjustment of the temperature and oxidation conditions during the melting process, thereby enabling better control of the reaction process. The slag treatment equipment is used to collect and process the slag produced during the melting process. Such equipment includes slag pots, slag cars, and slag treatment stations, which are used to discharge the slag from the melting furnace and handle it for subsequent processing. Cooling equipment is employed to cool and solidify the molten copper metal so that it can be removed from the furnace. The gas treatment system is responsible for handling the gases produced during the blowing process, such as sulfur dioxide, to minimize environmental pollution. The control system monitors and regulates the entire pyrometallurgical refining process, including parameters such as temperature, pressure, and gas flow rate. As shown in
Figure 1.
The oxidation endpoint and reduction endpoint in the pyrometallurgical refining of copper in an anode furnace are critical stages in the refining process, marking the completion of oxidation and reduction reactions, respectively. During the oxidation phase, harmful impurities such as sulfur in the copper ore are oxidized into gases like sulfur dioxide (), which are then removed. The oxidation endpoint can be determined by monitoring the concentration of sulfur-containing gases in the exhaust; a decrease in the concentration to a predetermined level indicates the completion of the oxidation reaction. In the reduction phase, oxygen injection into the furnace is typically halted to facilitate the reduction reaction, converting oxidized copper into pure copper. The reduction endpoint is usually determined based on factors such as furnace temperature, electrolysis efficiency, and copper yield, to ensure that the reduction reaction is completed effectively and to produce high-purity copper.
The oxidation and reduction reactions in the pyrometallurgical refining of copper in an anode furnace are as follows:
The overall chemical reaction for the process is:
This work has developed an intelligent endpoint determination system for oxidation and reduction in anode furnaces. The system enables precise monitoring and control of the copper smelting process, enhancing production efficiency, reducing energy consumption and production costs, while ensuring the stability and controllability of product quality.
3. Experiment Methodology
3.1. Image Processing Procedure
This work has developed an intelligent endpoint determination system for oxidation and reduction in anode furnaces. The system enables precise monitoring and control of the copper smelting process, enhancing production efficiency, reducing energy consumption and production costs, while ensuring the stability and controllability of product quality. When analyzing images at the reduction endpoint in an anode furnace, converting the image from the RGB color space to the HSV color space allows for more effective color selection and analysis. The HSV color space consists of Hue, Saturation, and Value. Hue represents the type or category of color, such as red, green, or blue, with values typically ranging from 0 to 360 degrees, corresponding to the colors of the rainbow. Saturation indicates the purity or intensity of the color, with a saturation of 0 representing shades of gray and a saturation of 1 representing the maximum vividness of the color. Value represents the brightness of the color, with a value of 0 indicating black and a value of 1 indicating the brightest possible color. In contrast, the RGB color space uses the red, green, and blue channels to represent color, but this method is less intuitive for color selection and analysis. Using the HSV color space allows for the easy selection of pixels within a specific hue range without the need for complex calculations on the RGB channels.
To convert an image from the RGB color space to the HSV color space, the R, G, and B component values must first be scaled to a range between 0 and 1 by dividing by 255. Then, using the following formulas, the corresponding values in the HSV color space can be obtained.
After conversion, the values of V and S range between 0 and 1, while the value of H ranges from 0° to 360°. If the computed result is less than 0, 360 should be added to the value. For instance, if a pixel with RGB components (110, 20, 50) is to be converted to the HSV model space, the corresponding transformation can be performed accordingly.
The contours of the target object can be extracted by setting a brightness threshold greater than 0.1 in the HSV image. Then, the image is cropped accordingly to define the region of interest for further analysis. Finally, the Laplacian operator is used for edge detection. The principle of the Laplacian operator is to traverse each pixel of the image, calculating the gray-level differences between a pixel and its surrounding pixels, thereby determining the position of edges. By setting a threshold, pixels with gray-level differences exceeding the threshold are marked as edge points, generating a binary edge image.
The Laplacian operator is a second-order differential operator in n-dimensional Euclidean space, defined as the divergence (
) of the gradient (
). Therefore, if
is a twice differentiable real-valued function, the Laplacian operator of
is defined as:
The Laplacian operator of
consists of all non-mixed second-order partial derivatives in the Cartesian coordinate system with respect to
.
3.2. Watershed Algorithm
After image processing is completed, watershed segmentation is performed. Morphological operations, including opening and closing, are applied for preprocessing to remove noise and smooth the image. Opening involves erosion followed by dilation, which helps eliminate small bright or dark spots in the image and smooth the edges, removing small objects. Closing involves dilation followed by erosion, primarily used to fill small holes or connect broken objects, making the object boundaries smoother.
Next, the preprocessed image is applied to the watershed algorithm for segmentation. The basic idea of the watershed algorithm is to treat the image as a topographic surface where pixel values represent elevation. The flow of water is determined by finding local minima of the gradient, with water starting from areas of lower gradient and flowing towards areas of higher gradient. In this process, segmentation boundaries are formed, known as watershed lines. After the segmentation is complete, the result can be labeled. During labeling, a unique tag is assigned to each region to facilitate subsequent recognition or analysis. Typically, labeling is achieved through connected component analysis or region-growing algorithms. Finally, the boundaries of each region can be displayed on the image, making the segmentation outcome visually clear. The watershed algorithm typically marks the segmentation boundaries with specific values, and these values can be used to highlight the boundary areas in the image, such as using different colors or line thicknesses to represent different region boundaries. The formula for the watershed algorithm is shown below.
where
denotes the original image and
denotes the gradient operation.
To reduce the over-segmentation produced by the watershed algorithm, the gradient function is usually modified, and a simple way to eliminate the over-segmentation produced by small changes in gray level is to threshold the gradient image, i.e.,
where
denotes the threshold value.
Level set methods handle topological changes by implicitly representing evolving interfaces (such as watershed lines) as zero level sets of higher dimensional functions. We regard the image grayscale function I(x, y) as a level set function, and its gradient size is as shown in Equation (11), which forms the basis of interface evolution. The derivation is as follows:
Let the level set function be
, where
is the time parameter. The evolution interface is defined by
. Its evolution follows a partial differential equation:
where
is the velocity function, controlling the movement in the normal direction of the interface. In the watershed algorithm,
can be associated with the image gradient field: let
, then the evolution equation becomes:
It means that the interface evolves along the gradient rising direction and finally stabilizes at the watershed line (at the maximum value of the gradient). The discrete watershed algorithm can be regarded as a numerical approximation of this continuous equation, where the “flooding” process corresponds to the gradual evolution of the interface.
4. Results
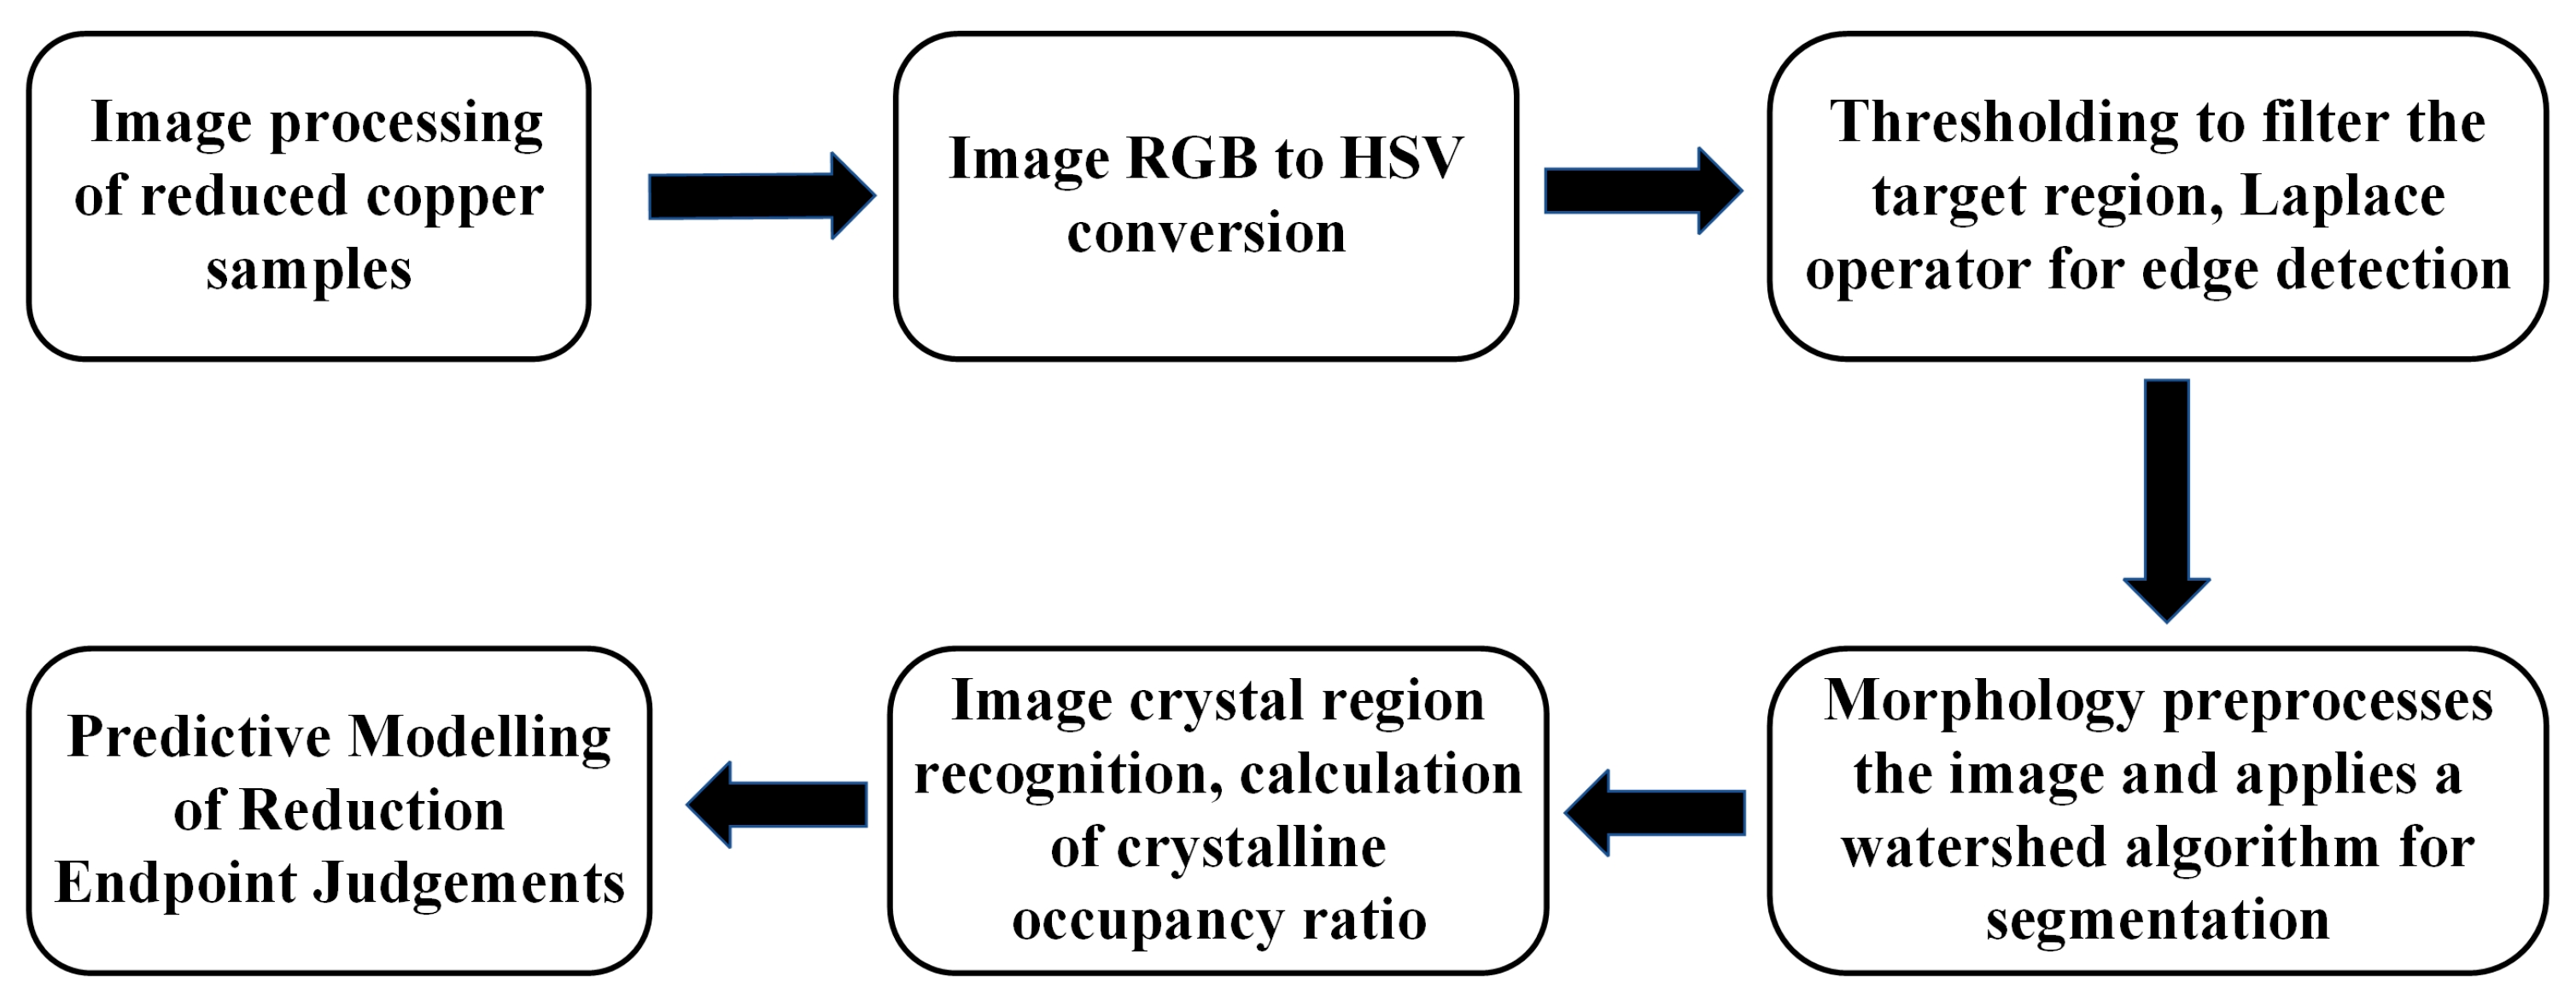
During the image processing of reduction period copper samples, the original RGB color space image is first converted to the HSV color space to facilitate more effective color filtering and analysis. Thresholding is used to select the target regions, and edge detection is performed using the Laplacian operator. Morphological operations, including opening and closing, are applied to preprocess the image, removing noise and smoothing the image. The preprocessed image is then subjected to the watershed algorithm for segmentation. Subsequently, thresholding, edge detection, and connected component analysis are used to identify the crystallization regions and points within the image. Features of the extracted crystallization regions can be used to calculate their proportion within the entire image, thus assessing whether the anode furnace has reached the reduction endpoint. As shown in
Figure 2.
4.1. Image Processing of Copper Samples and Crystalline Occupancy Method
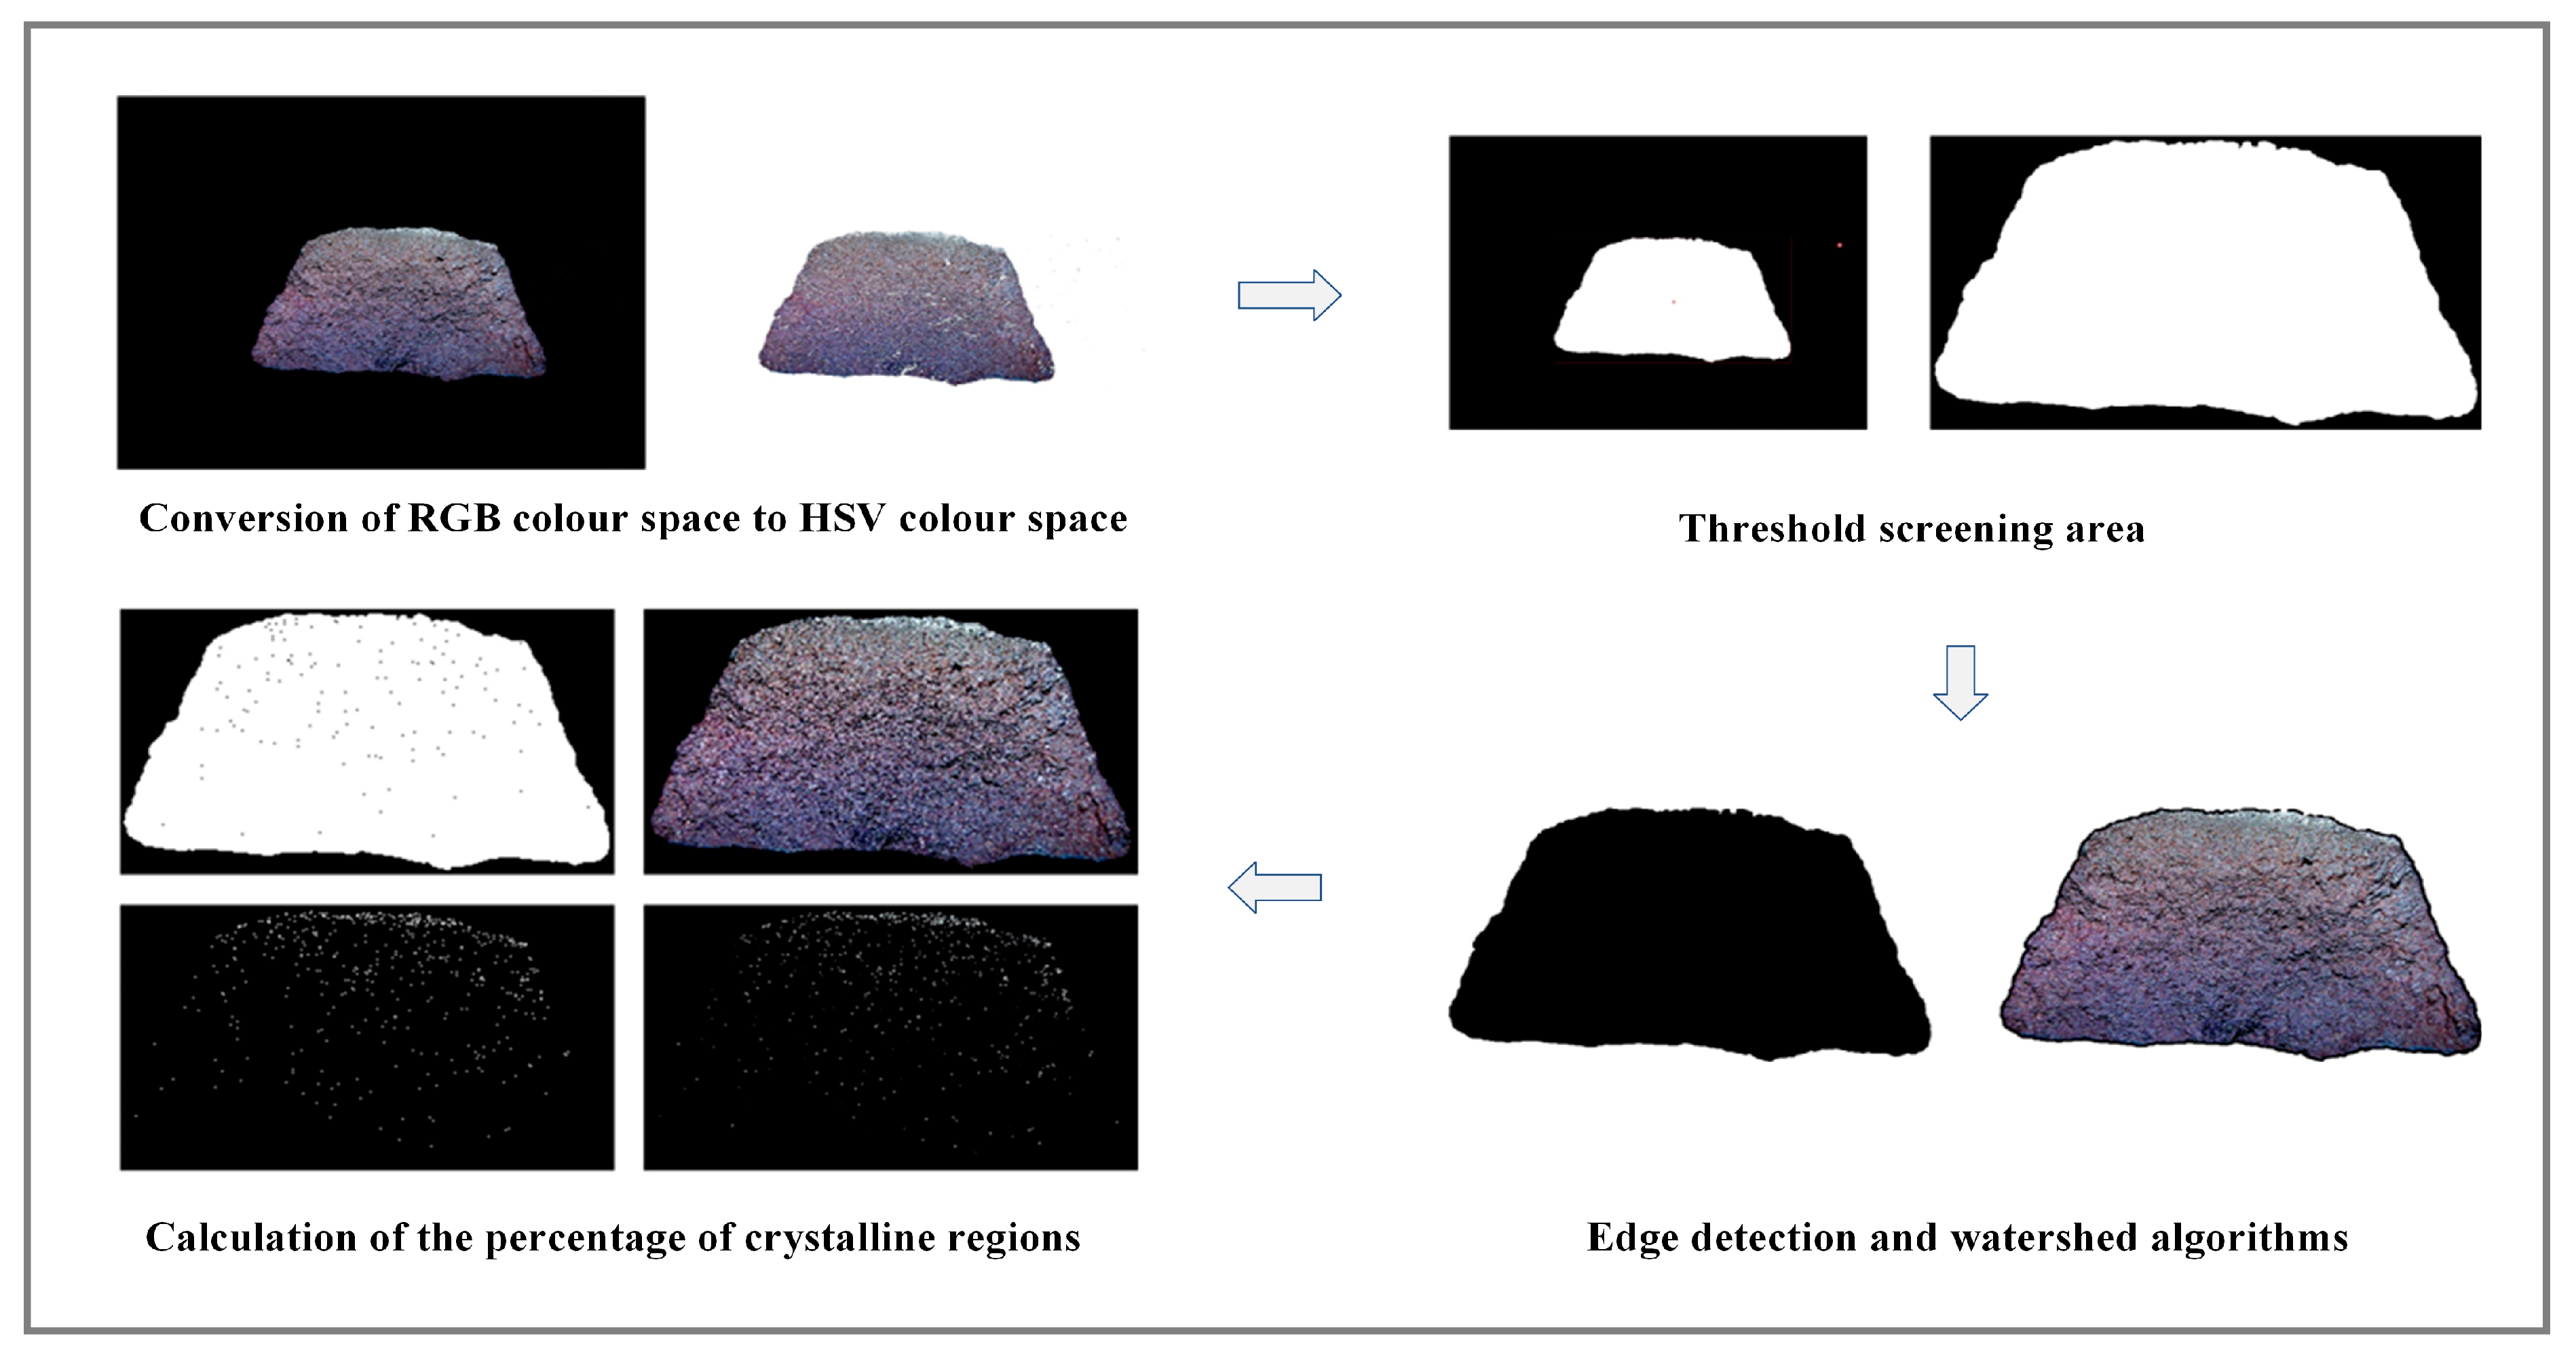
Figure 3 illustrates the image processing of copper samples during the reduction period. The original RGB color space image is converted to the HSV color space for more effective color filtering and analysis. Target regions are selected using thresholding, and edge detection is performed using the Laplacian operator. The preprocessed image is then subjected to the watershed algorithm for segmentation. After watershed processing, the segmented image undergoes further thresholding, edge detection, and connected component analysis to identify the crystallization regions and points. Features of the extracted crystallization regions are used to calculate their proportion within the entire image, thereby assessing whether the anode furnace has reached the reduction endpoint.
One hundred sets of production data were selected for experimental research and analysis to evaluate the crystallization ratio at various stages of the reduction process, denoted by α.
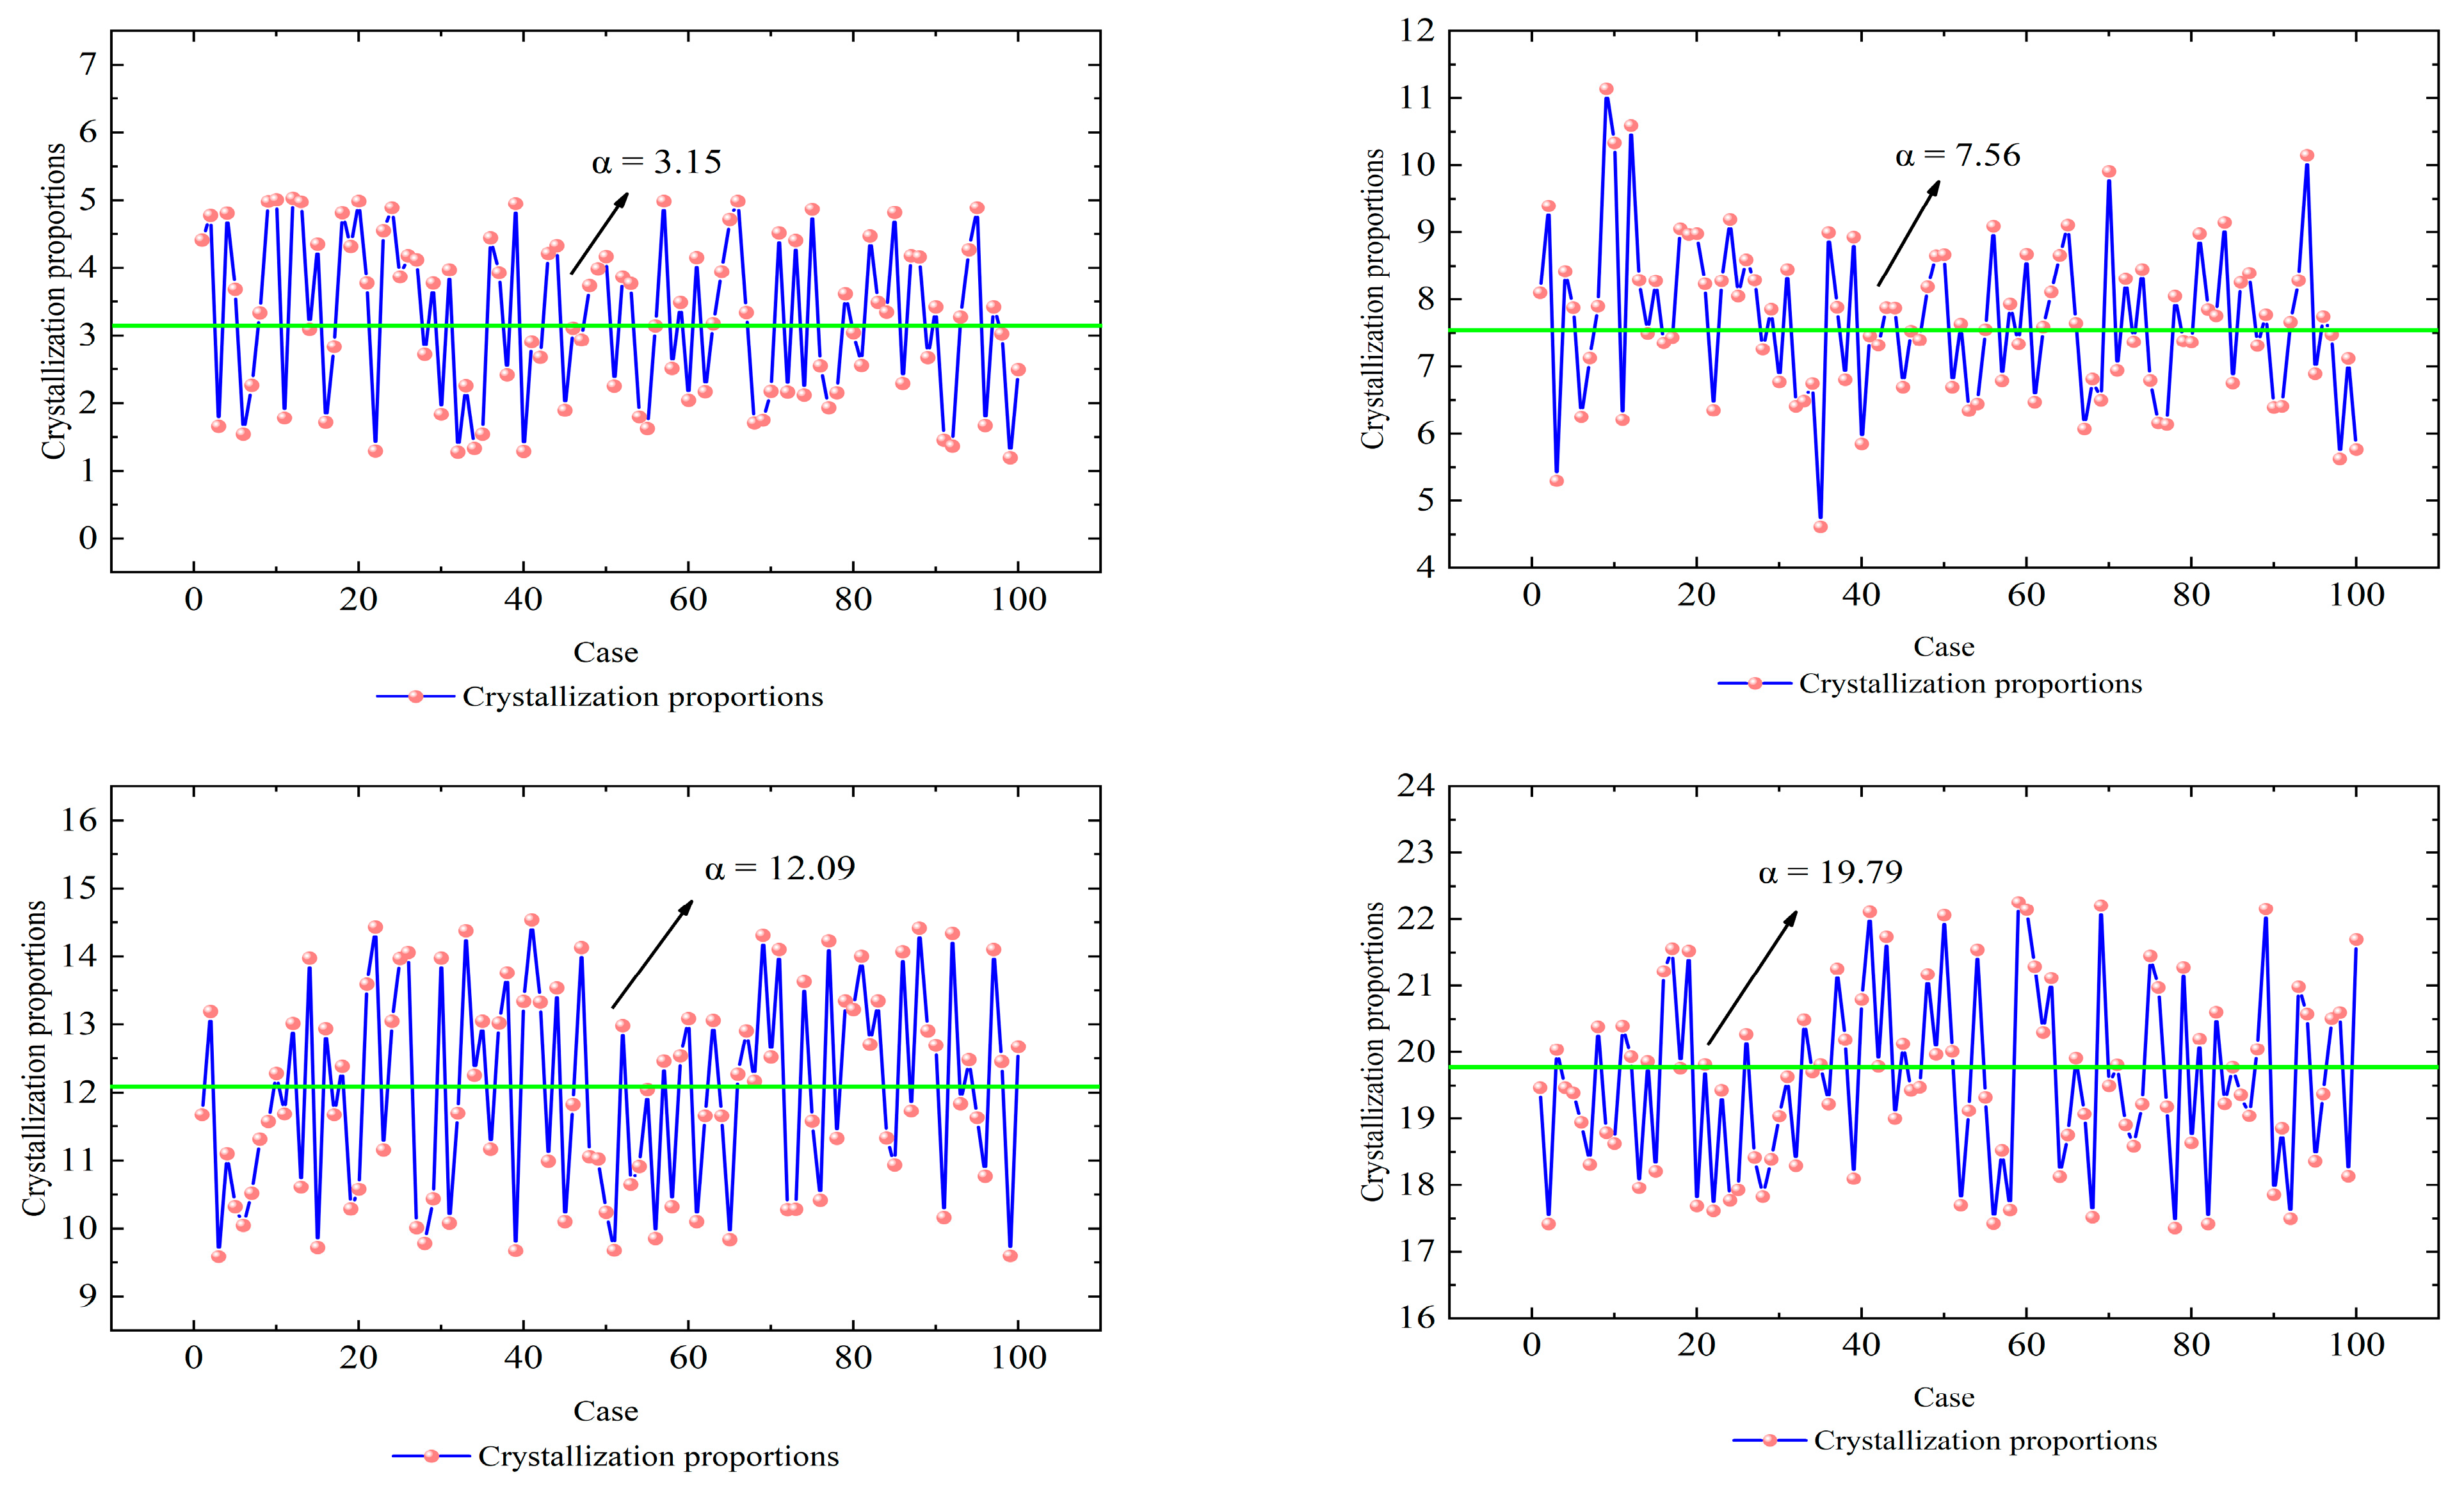
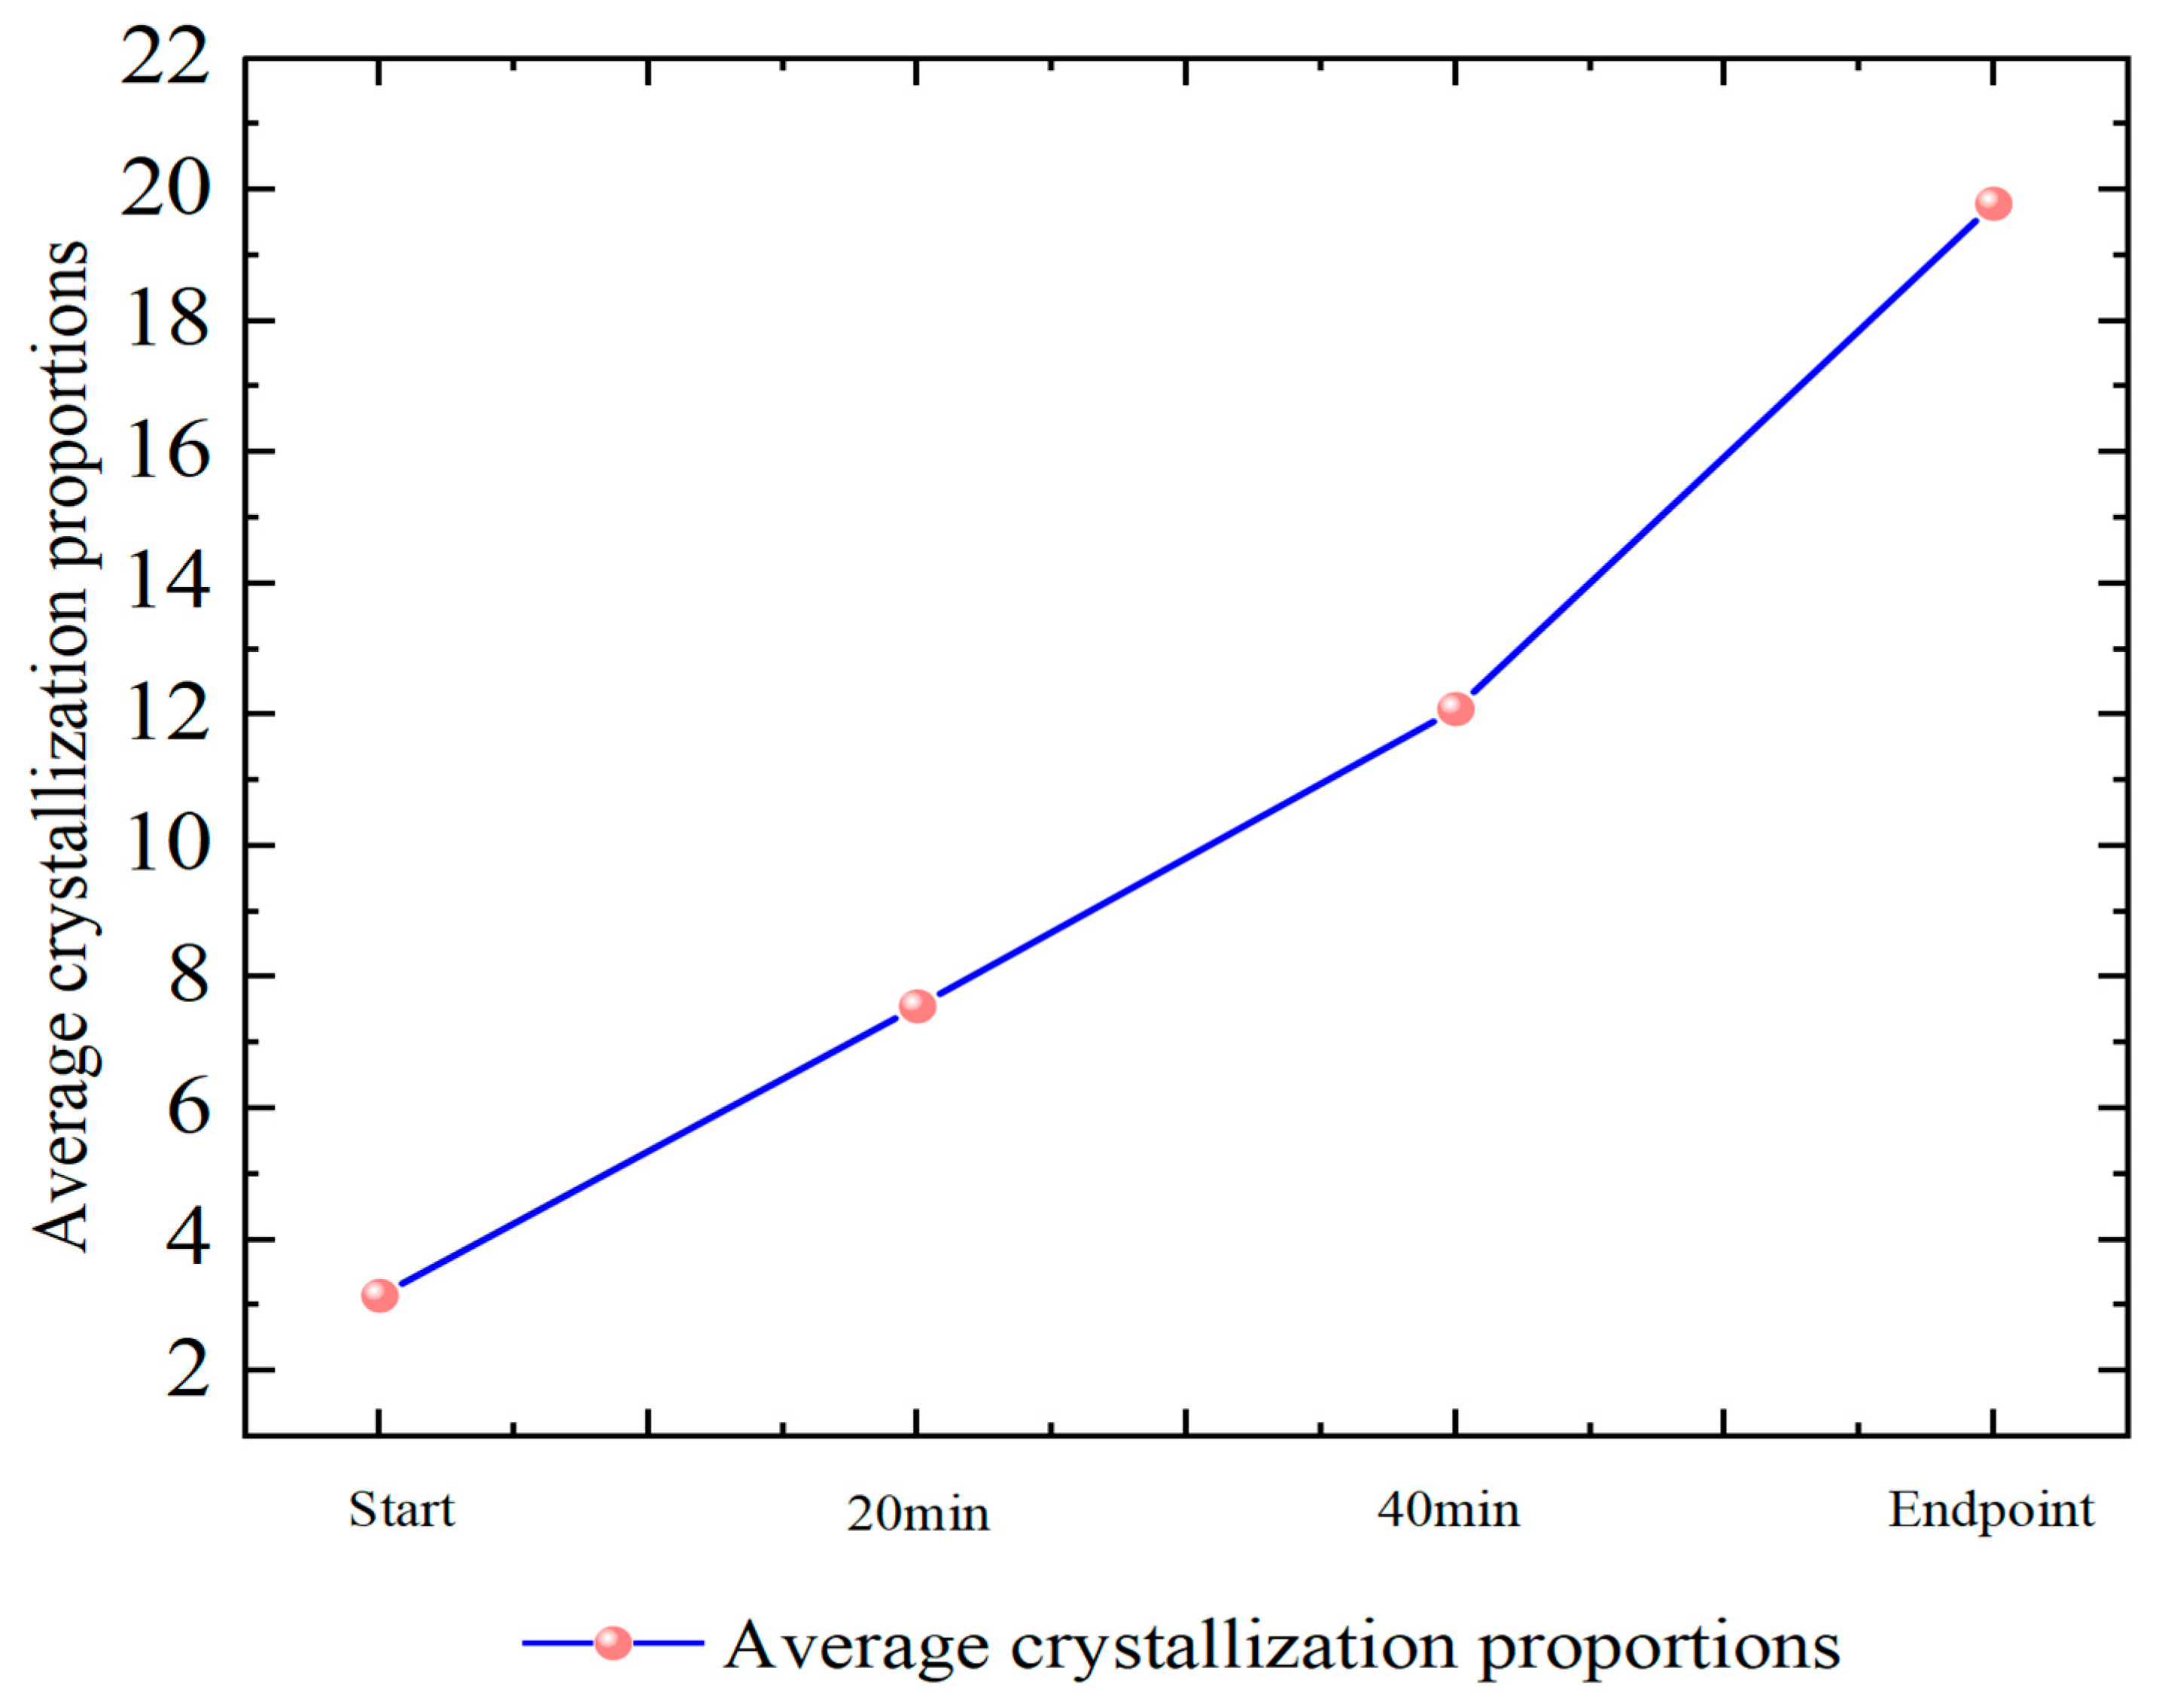
Figure 4 illustrates the crystallization ratios and the average crystallization ratios at different stages. At the beginning of reduction, the number of crystals is low, resulting in a small crystallization ratio, with an average crystallization ratio of 3.15%. As the reduction reaction progresses, the crystallization ratio gradually increases. After 20 min of reduction, the average crystallization ratio reaches 7.56%, with an increase in the number of crystals and a higher crystallization ratio. After 40 min of reduction, the number of crystals is higher, and the crystallization ratio is larger, with an average crystallization ratio of 12.09%. At the reduction endpoint, the number of crystals is at its maximum, and the crystallization ratio is the highest, with an average crystallization ratio of 19.79%.
Figure 5 shows the trend of the average crystallization ratio at each stage.
It can be observed from
Figure 5 that the average crystallization ratio increases progressively with the reduction reaction and reaches its maximum at the reduction endpoint.
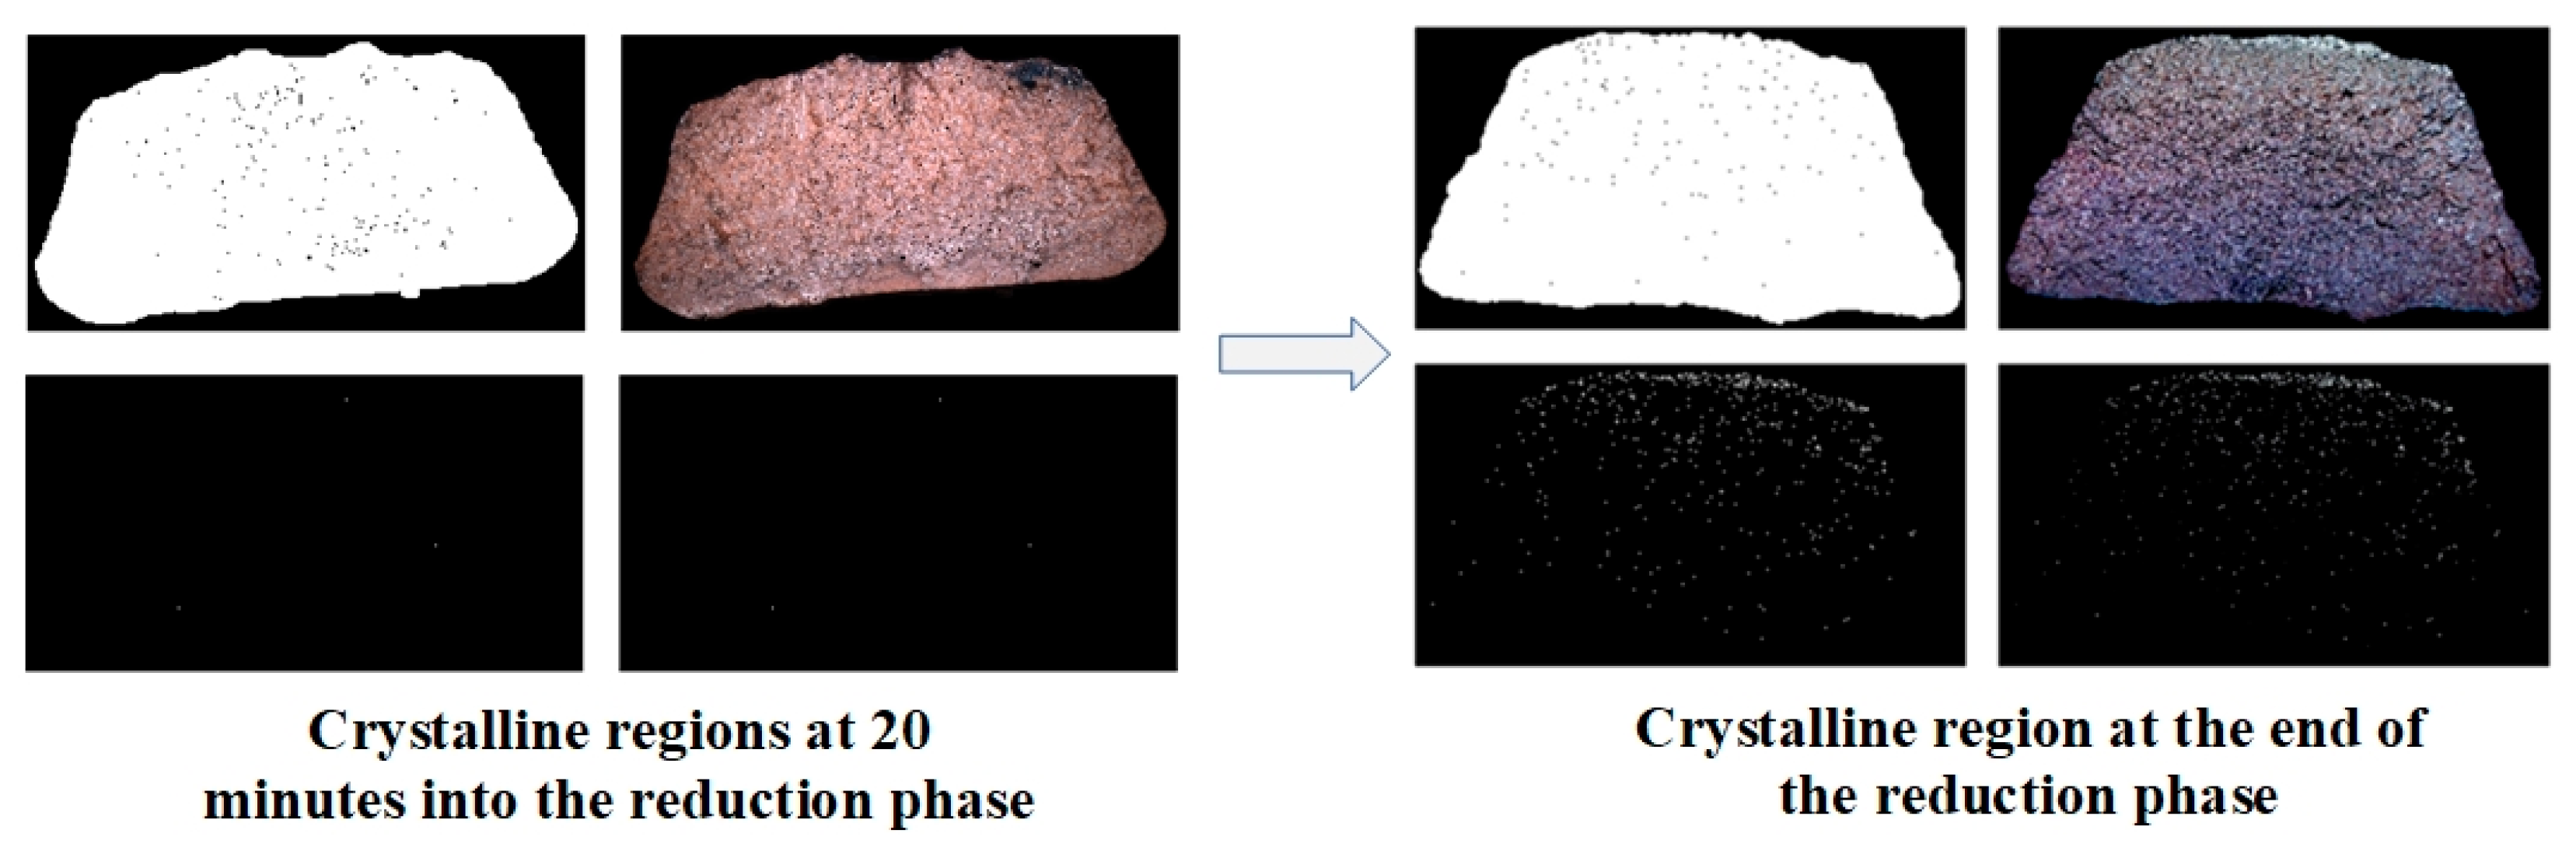
The crystallization regions at different stages of reduction vary, as shown in
Figure 6. After 20 min of reduction, the number of crystals is low, resulting in a lower crystallization ratio, and the image displayed by the crystallization ratio method appears darker. At the reduction endpoint, the number of crystals increases, leading to a higher crystallization ratio. The image displayed by the crystallization ratio method shows distinct highlights, with crystals more evenly distributed across the entire cross-sectional image.
The average crystallization ratio at various stages of reduction is shown in
Table 1. The changes in these values at different reduction stages reflect the variations in image features and illustrate how the image information of copper samples in the anode furnace evolves over time during the reduction process. The crystallization ratio method is used to determine whether the anode furnace has reached the reduction endpoint. A crystallization ratio of 19.79% indicates that the anode furnace has reached the reduction endpoint.
4.2. Comparison of the Accuracy of Anode Furnace Reduction Endpoints
BP and GRNN methods are commonly used techniques for determining the reduction endpoint in copper smelting. To assess the feasibility and superiority of the crystallization ratio method, this study compared the results calculated by BP, GRNN, and crystallization ratio methods, as shown in
Table 2.
Table 2 indicates that the BP method has an endpoint prediction accuracy of 90.12% with an average prediction error of 9.88%. The GRNN method has an endpoint prediction accuracy of 96.54% with an average prediction error of 3.46%. In contrast, the crystallization ratio method achieves an endpoint prediction accuracy of 98.91%, which is 8.79% and 2.37% higher than BP and GRNN methods, respectively, with an average prediction error of only 1.09%.
The crystallization ratio method provides higher prediction accuracy compared to traditional methods, reducing production costs and increasing production efficiency while offering a more precise determination of the reduction endpoint. This method demonstrates greater technical feasibility and significant reference value, indicating its substantial potential in industrial production and providing reliable support for predictions and decision-making in related fields.
4.3. Stochastic Regression Framework
This paper expresses the time evolution of α as “deterministic trend + random perturbation” and supplements parameter estimation, uncertainty quantification (CI/PI), and residual diagnosis to characterize the randomness and uncertainty of the crystal growth process in a mathematically statistical way. As shown in
Table 3.
Express the observed crystallization ratio at time (t) for each experiment as
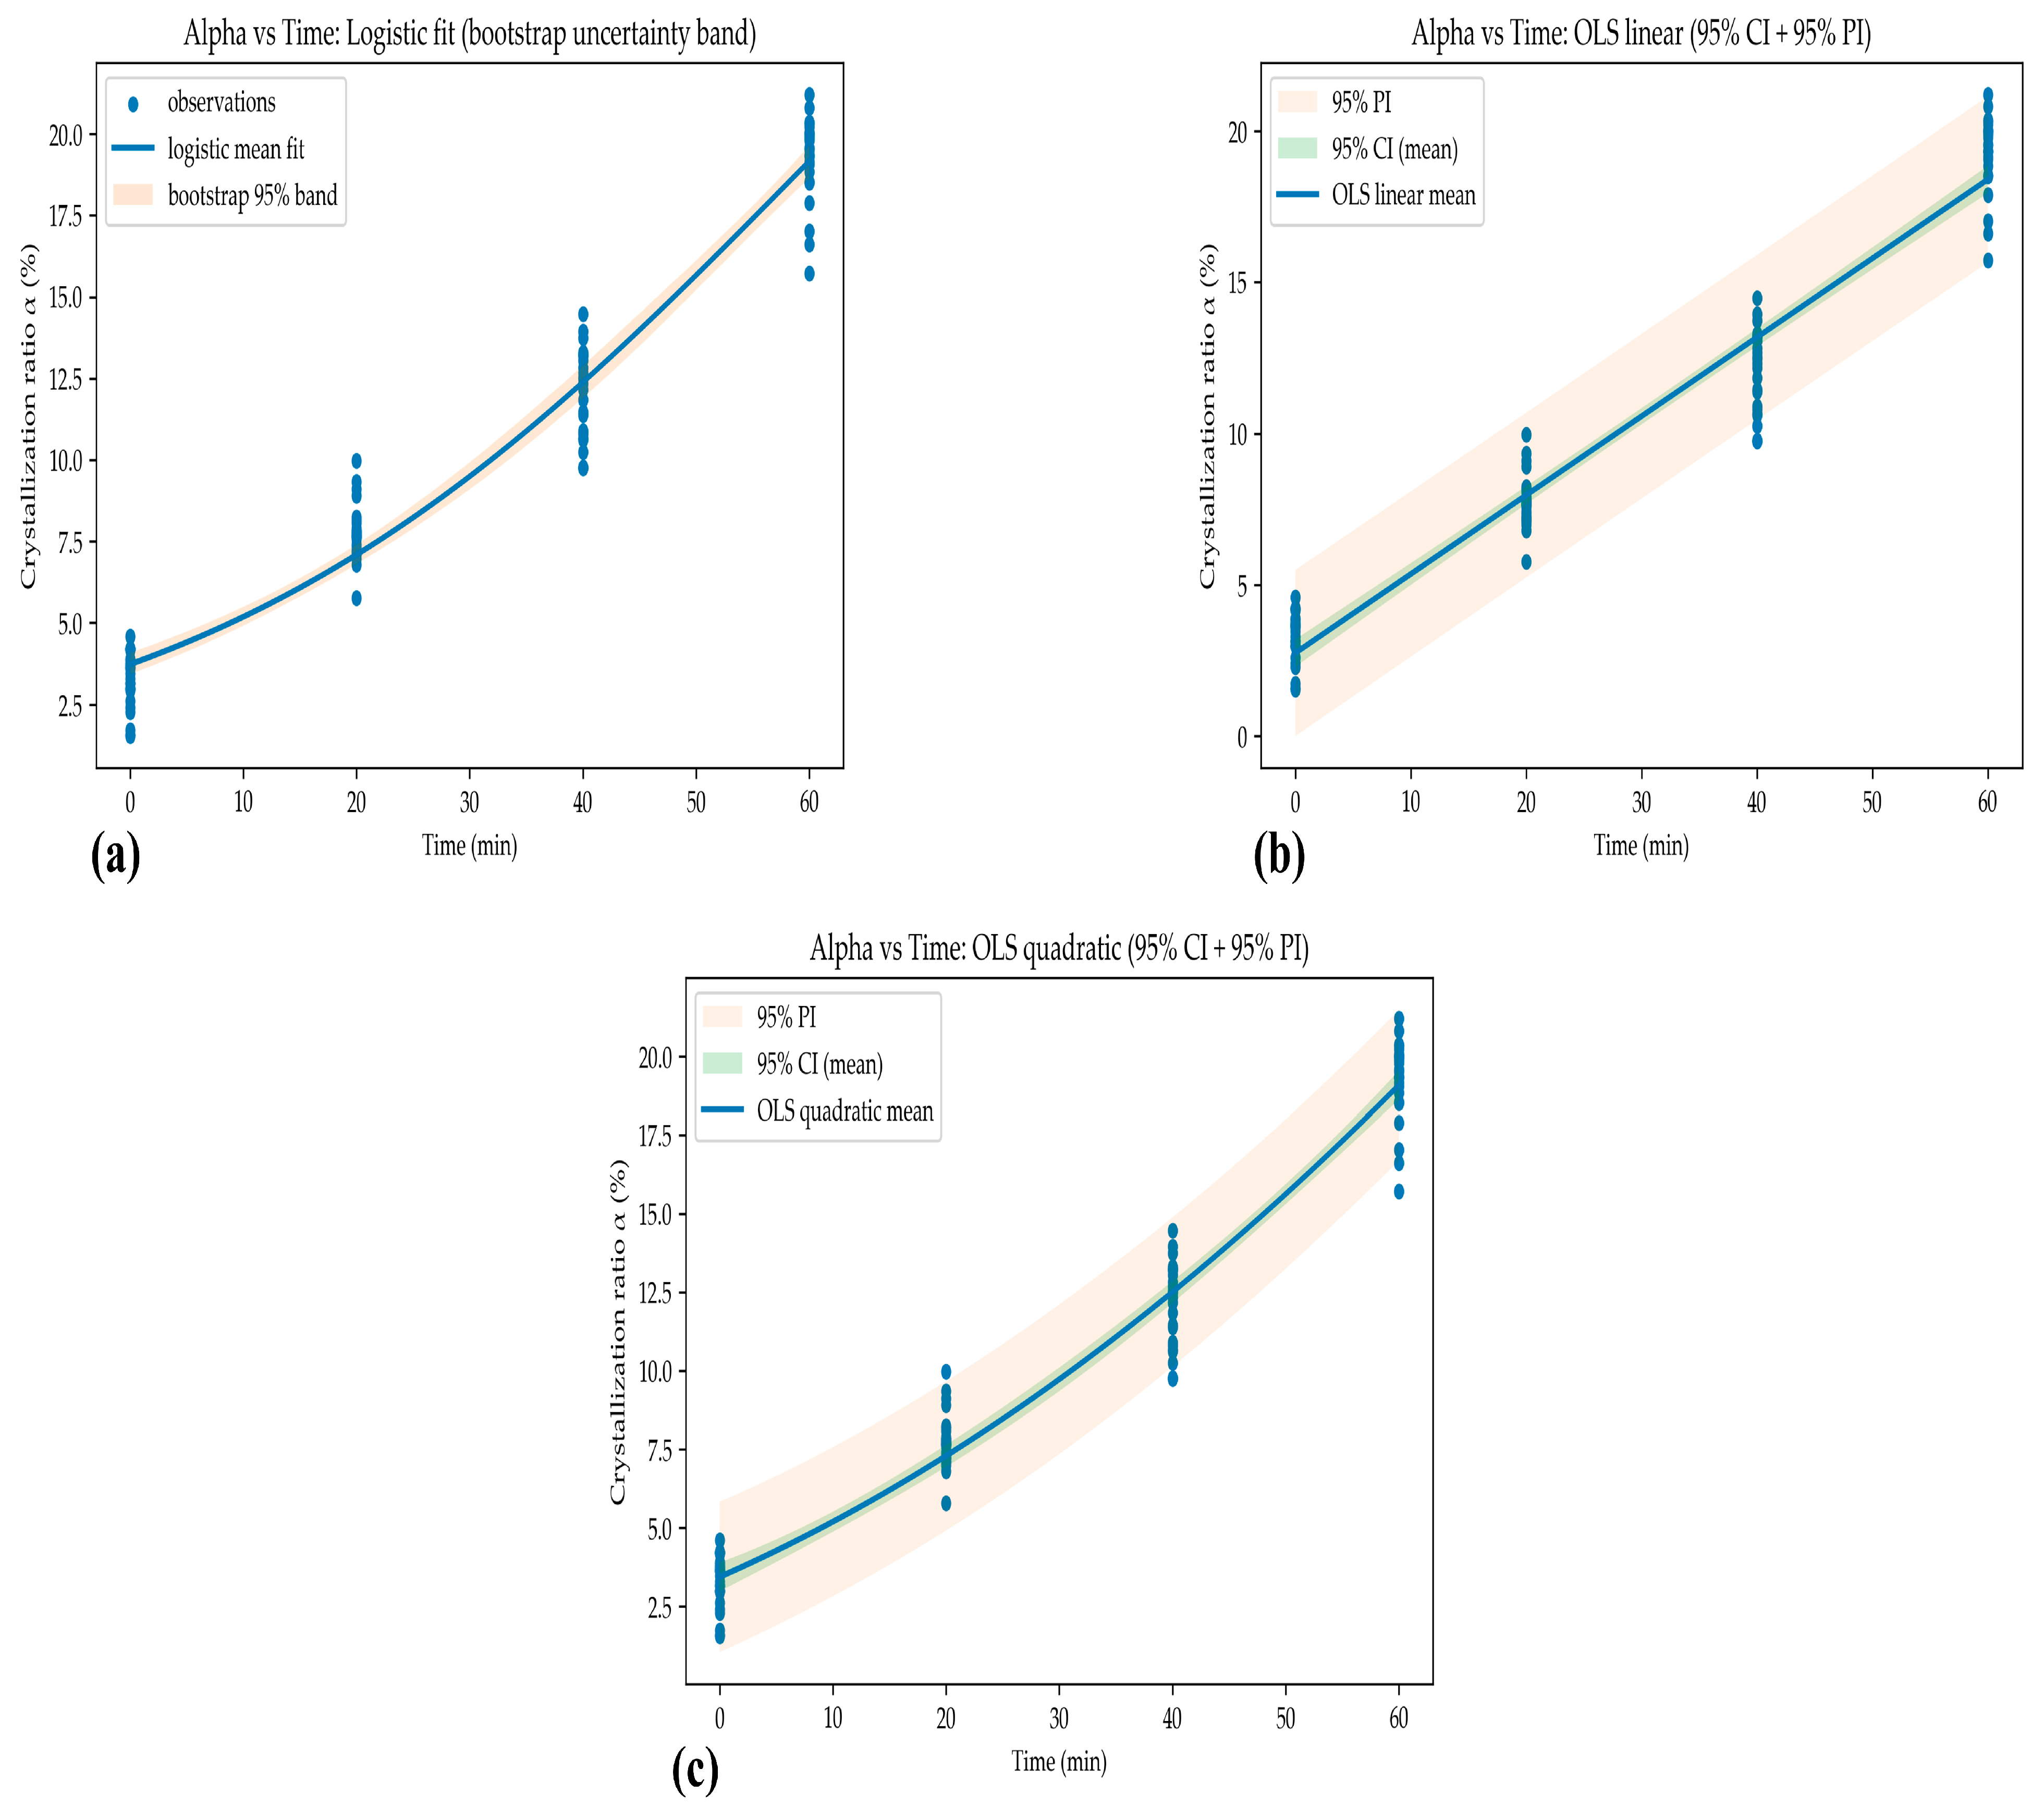
Among them, is fitted by linear regression, quadratic regression, and logistic growth model, respectively, to obtain an interpretable mathematical expression of α growth law and compare the fitting performance of different models accordingly.
In order to avoid reporting only the trend curve, we further provide the 95% confidence interval (CI) of the regression-to-the-mean curve and the 95% prediction interval (PI) of the future observation of a single experiment to quantify sample fluctuations and model uncertainty, and reflect the randomness of crystal growth from a mathematical, statistics perspective. As shown in
Figure 7.
4.4. Interval Estimation and Robust Statistic
In the prediction error evaluation of the anode furnace copper smelting reduction endpoint, in addition to the mean absolute error (MAE), the reporting standard deviation, median and interquartile range (IQR) are also used, and the bootstrap method is used to calculate the 95% confidence interval (CI) of the MAE and Accuracy to quantify the uncertainty and reliability of the results. As shown in
Table 4.
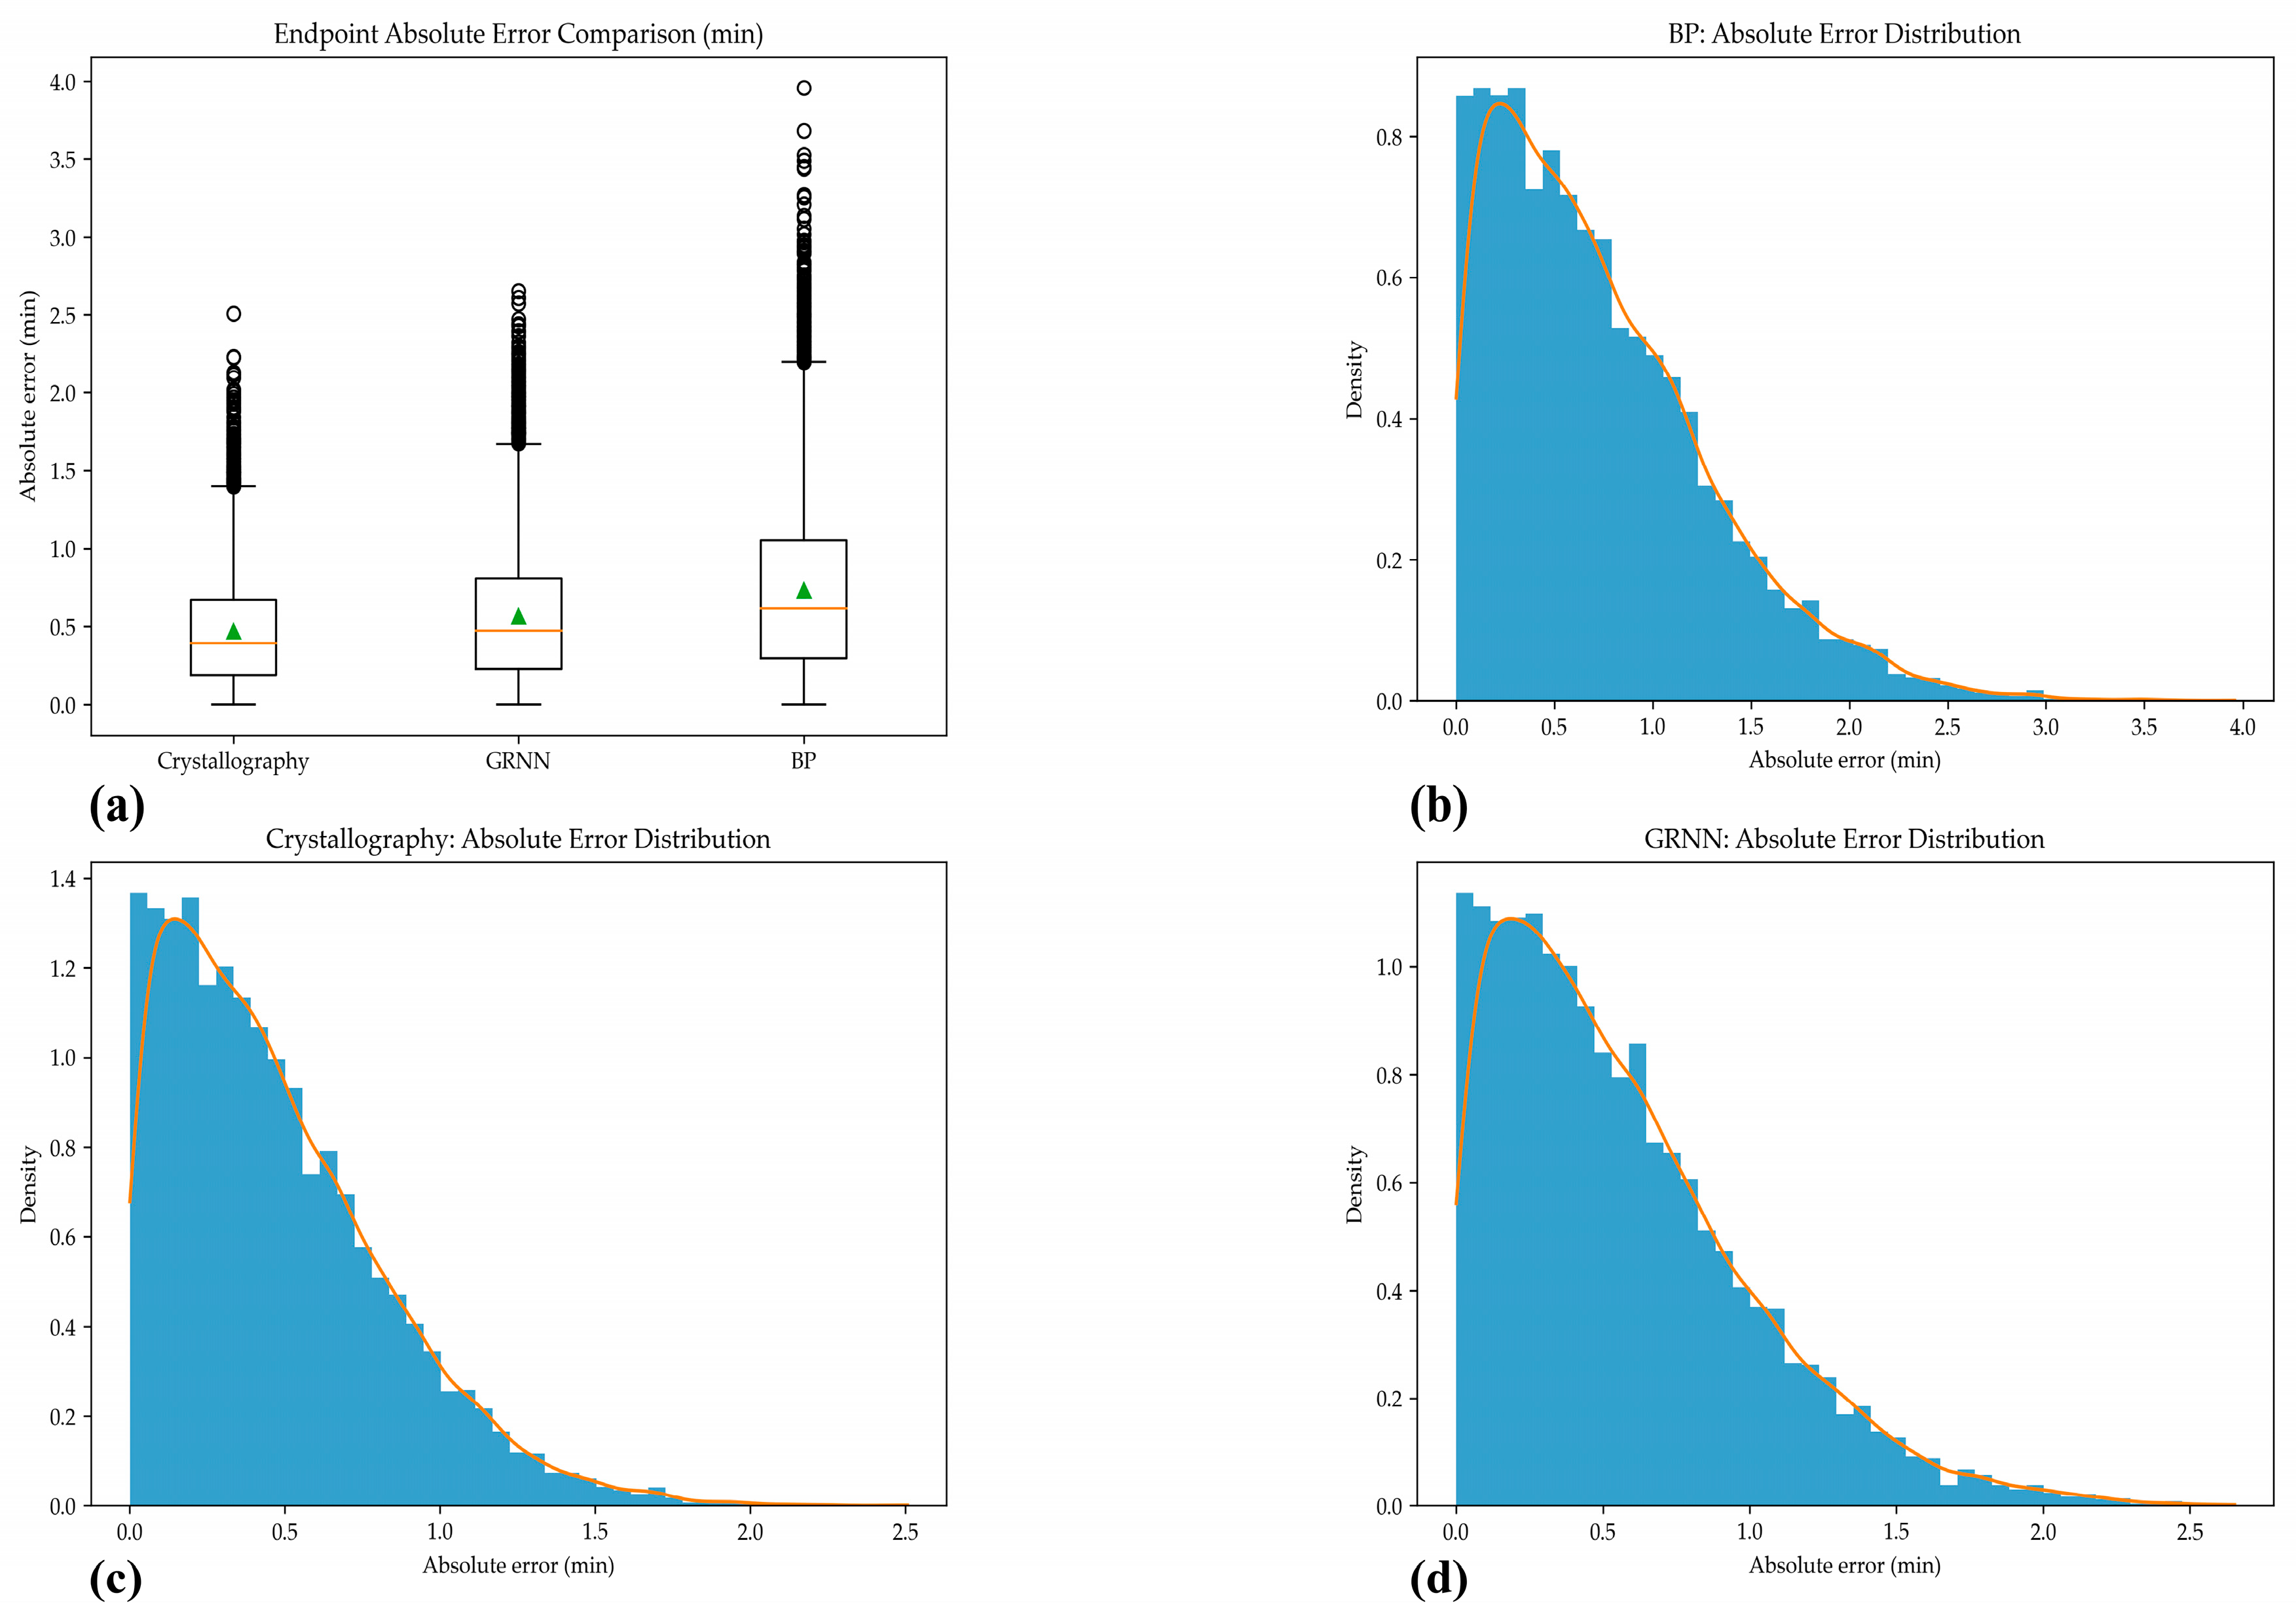
The box plot and histogram + kernel density estimation (KDE) of the absolute error at the endpoint of each method are used to display the error distribution shape (skewness/long tail/outliers), as shown in
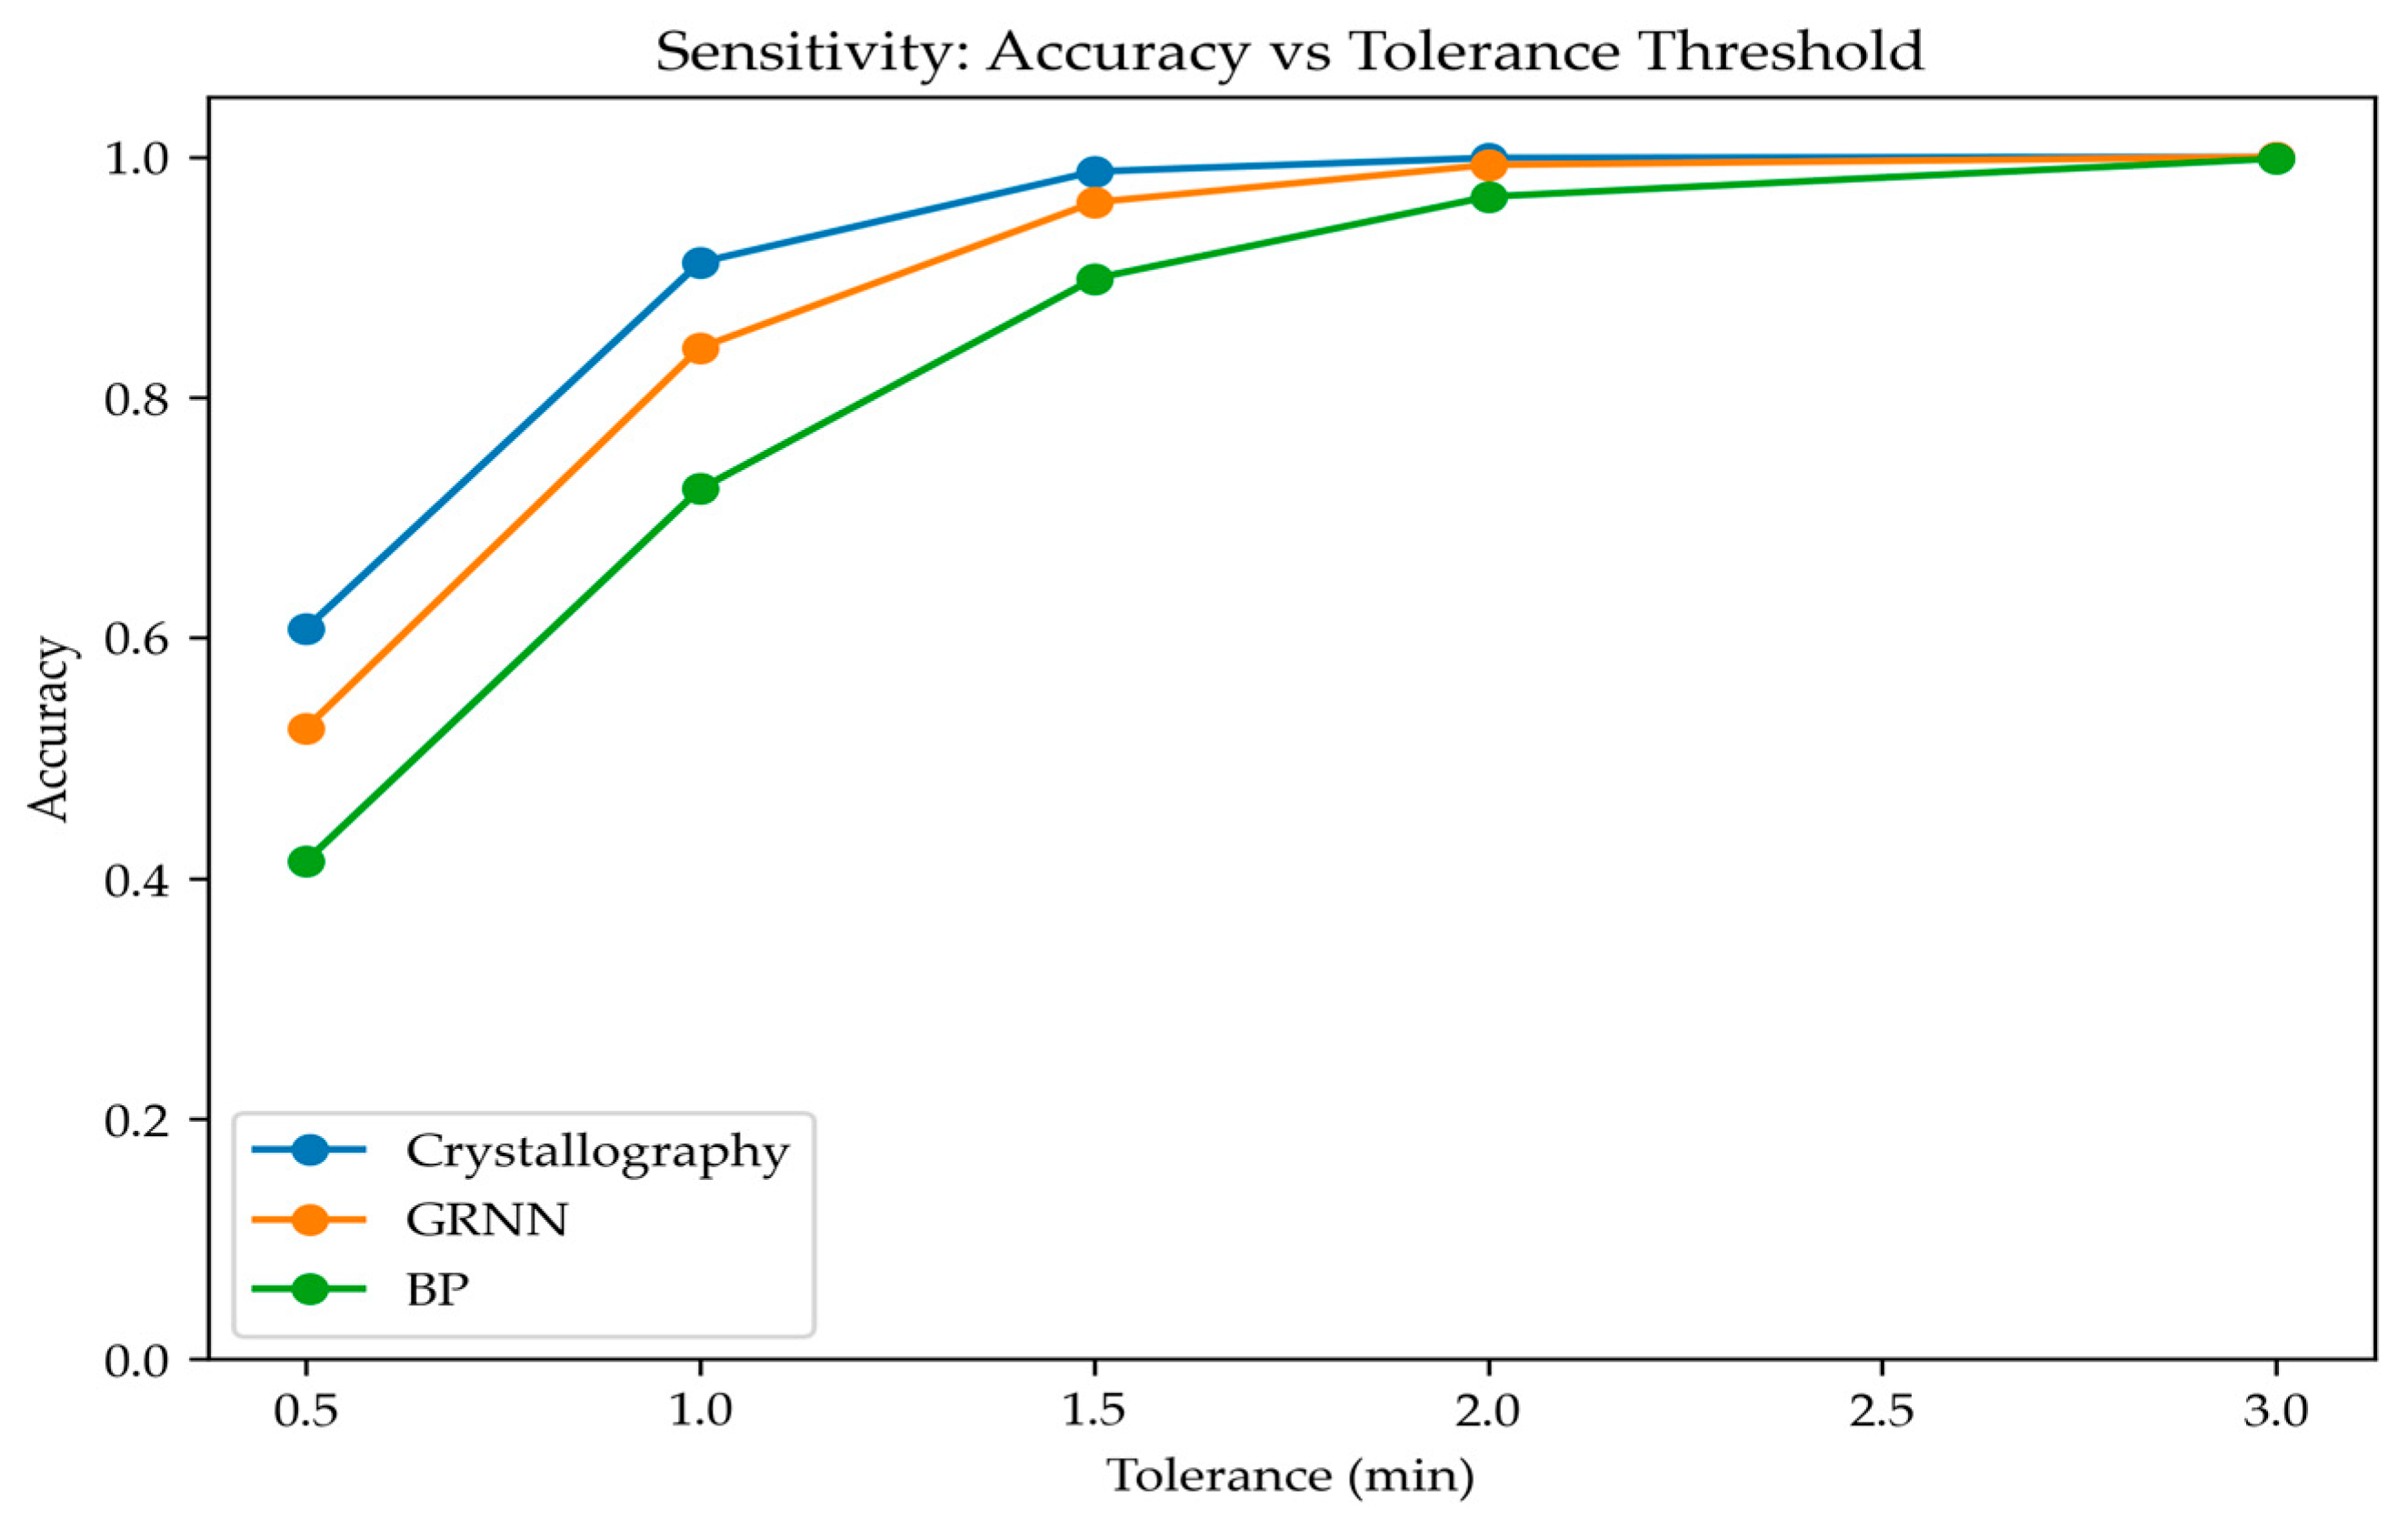
Figure 8. For the threshold/tolerance setting of “correct endpoint determination”, the variation trend of Accuracy under different tolerances is analyzed through the tolerance perturbation experiment, thereby evaluating the sensitivity and stability of the model to the selection of the determination threshold, as shown in
Figure 9.
ANOVA was introduced to re-update the data in
Table 2 and obtain the statistical inference basis for the accuracy comparison in
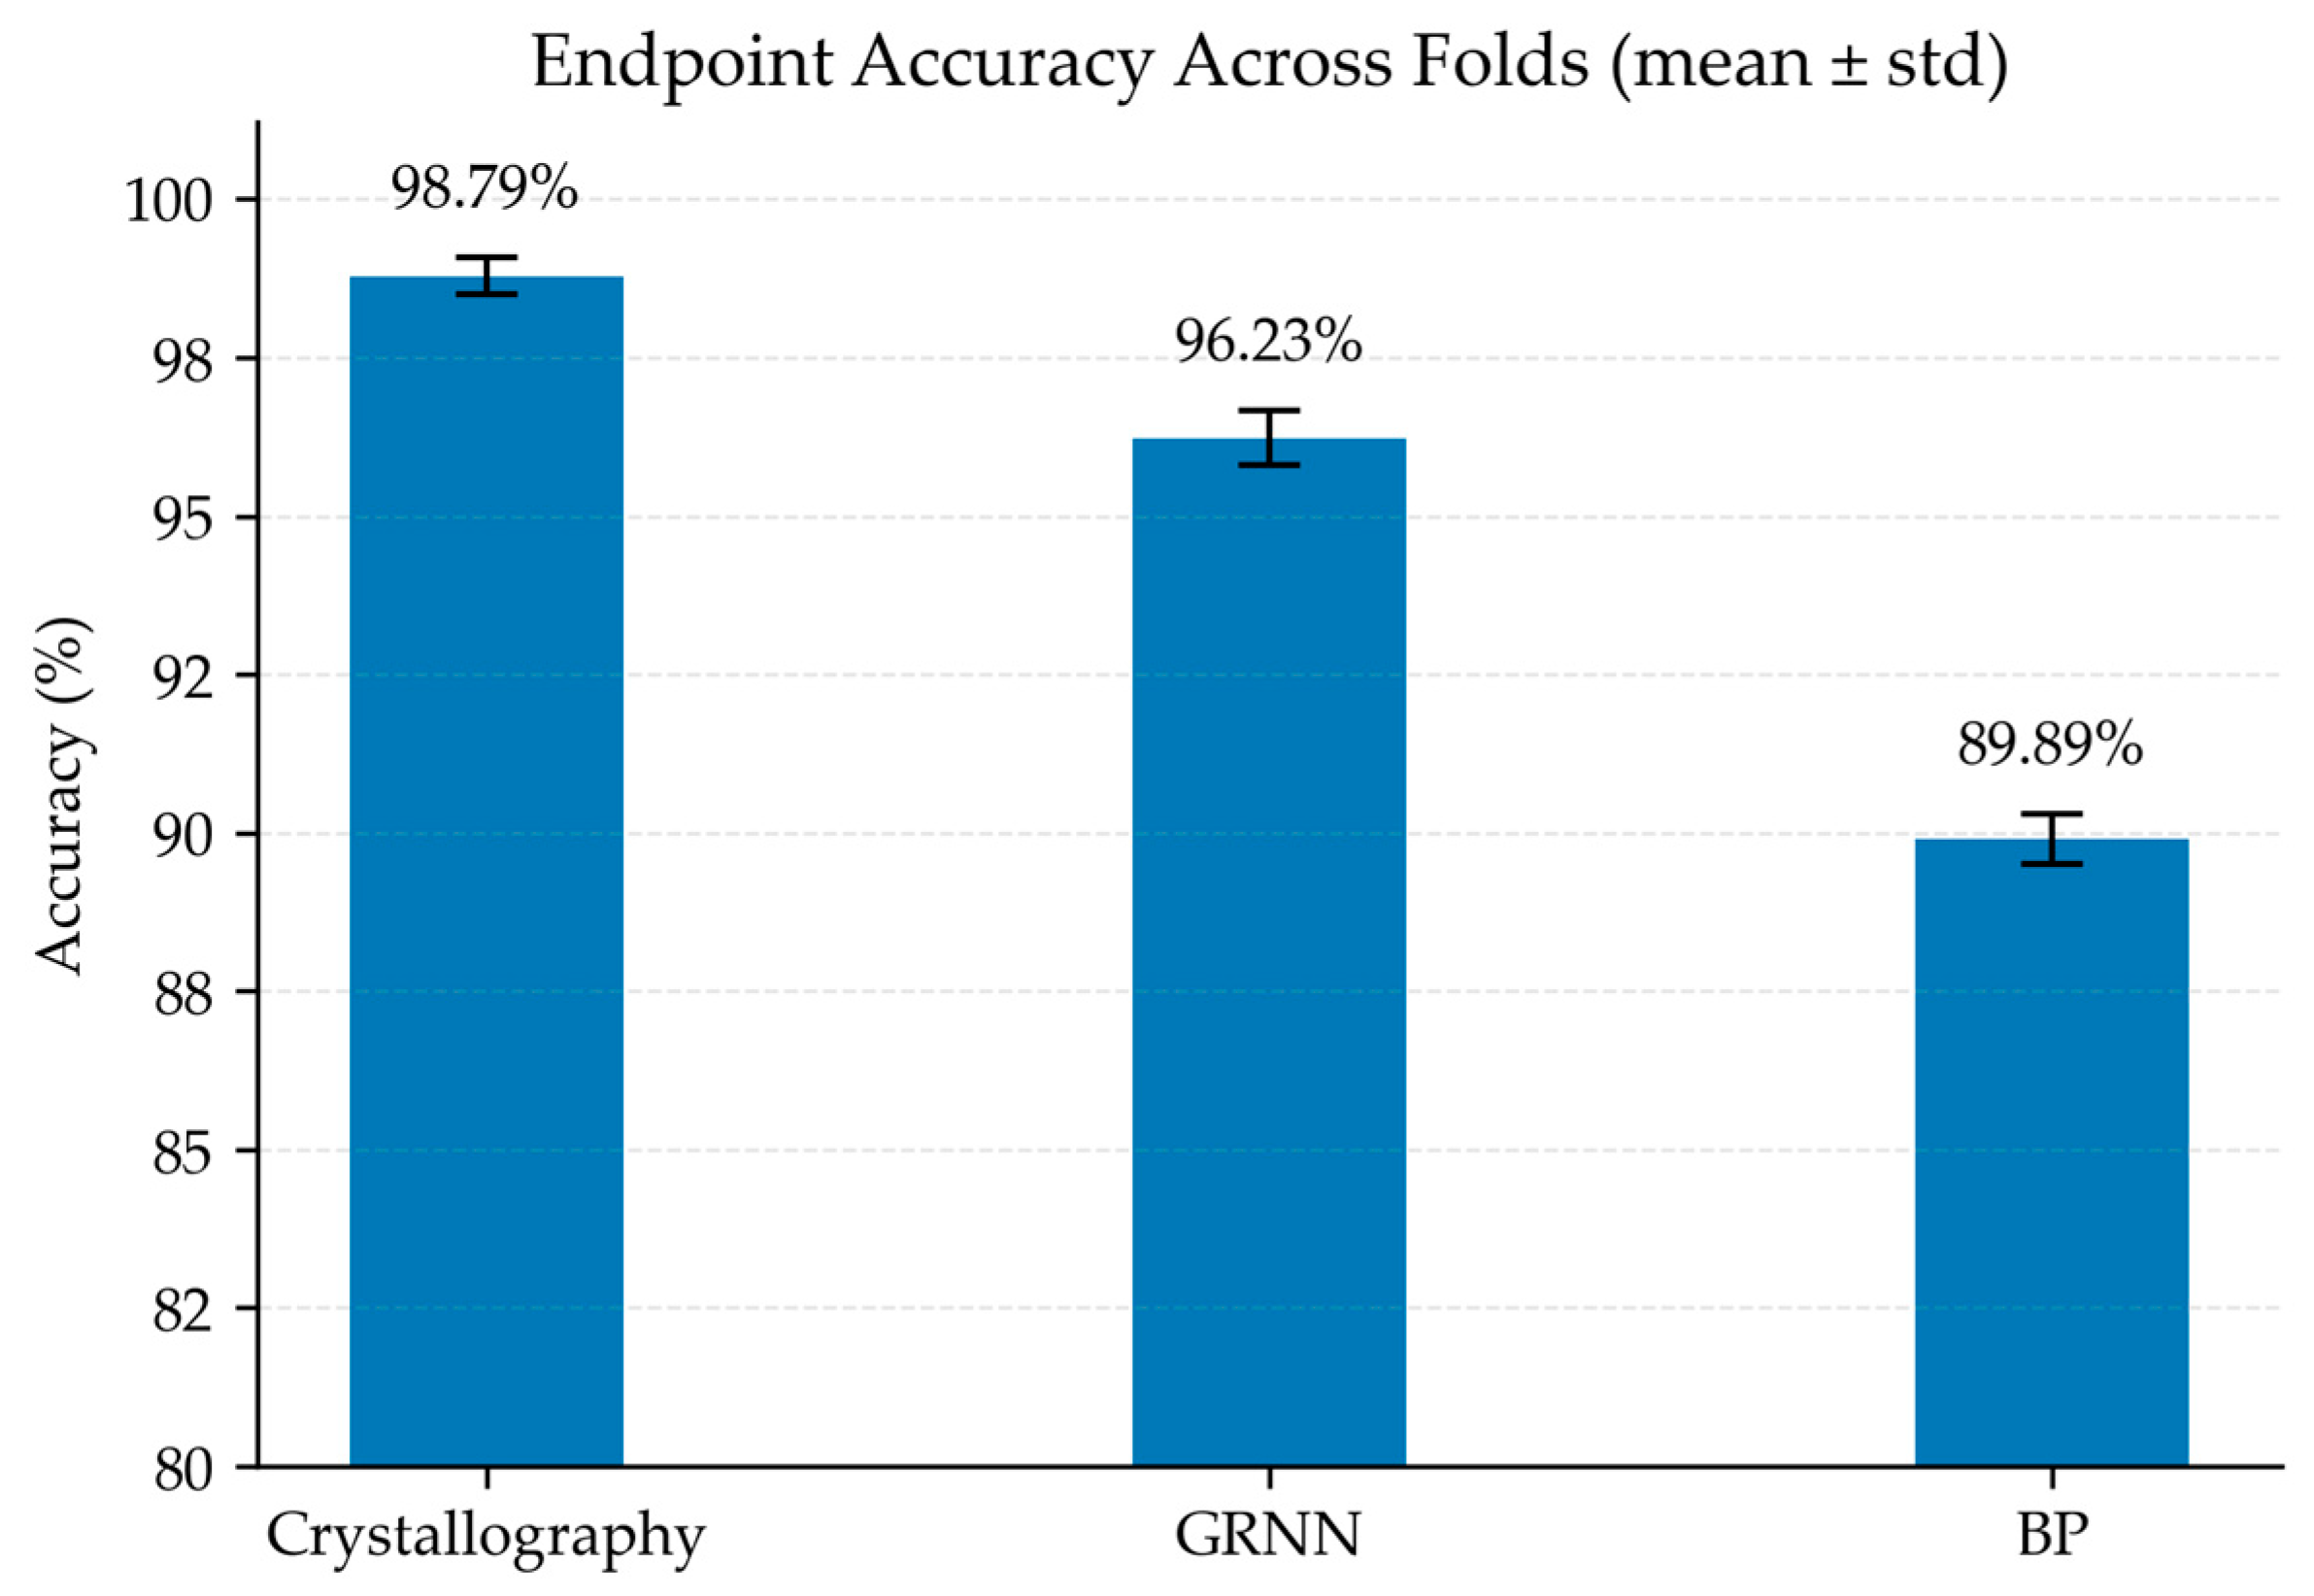
Table 5. The evaluation set was divided by fold, and the Accuracy of each fold was calculated to form a repeated observation sample that can be used for statistical testing. Then, one-way ANOVA was conducted to test the overall difference in the fold-level Accuracy of different methods, and Tukey HSD post hoc comparison was performed (Kruskal–Wallis was also provided as a non-parametric reference). The revised
Table 6 is presented in the form of “mean ± standard deviation (across folds)/95% CI + significance test conclusion” to avoid accidental misjudgments caused by only reporting single-point accuracy. As shown in
Figure 10.
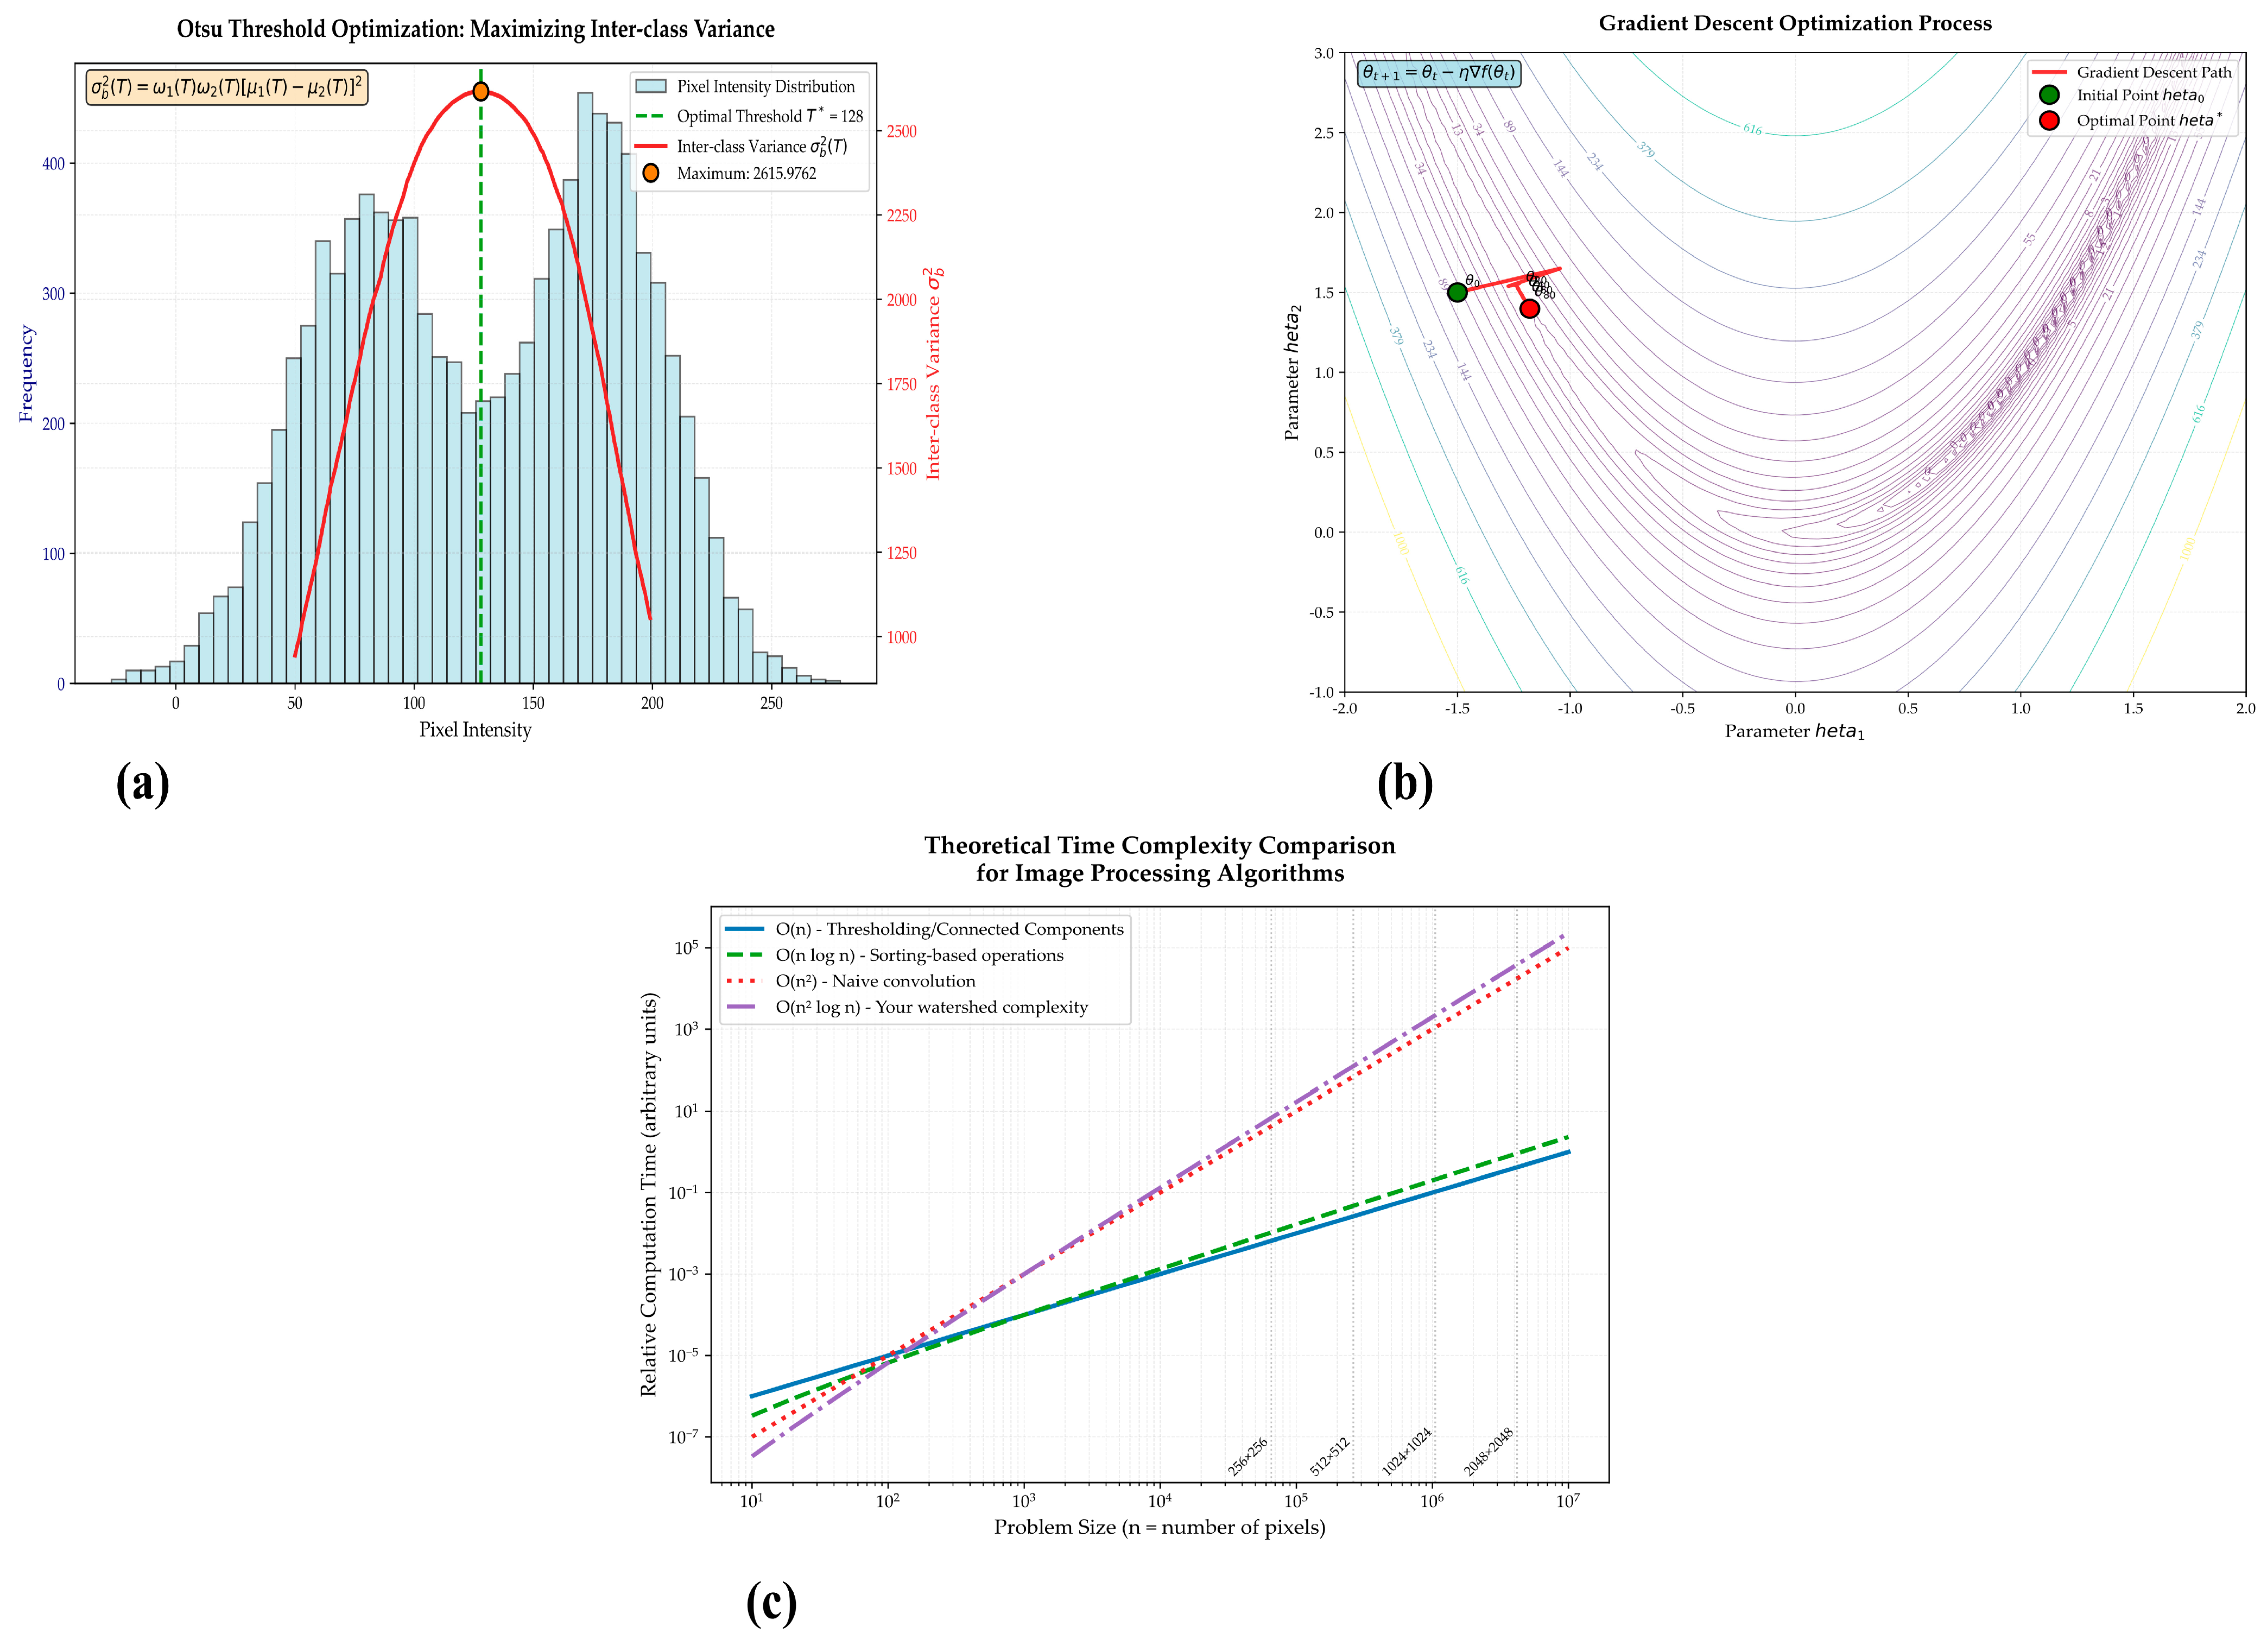
4.5. Computational Complexity Theory Analysis
In the evaluation of image processing algorithms, the time complexity of each step is theoretically analyzed, and the asymptotic representation (O-notation) is used to describe the algorithm complexity. At the same time, the correctness of the theoretical analysis is verified through experimental measurements. As shown in
Figure 11a–c.
4.6. Mathematical Principles of FSVM and BP/GRNN
FSVM [
22,
23,
24,
25] handles uncertainty by introducing fuzzy membership, and its optimization problem can be expressed as:
Among them,
is the fuzzy membership degree of sample
, which is used to weight the slack variable
. Kernel function
maps the input space to a high-dimensional feature space, where Mercer’s theorem guarantees the positive definiteness of the kernel:
Mathematical representation of the BP [
28,
29,
30,
31,
32,
33,
34,
35] neural network. Assume that the neural network has L layers, and the output of the l-th layer is:
where
is the activation function (such as Sigmoid or ReLU),
and
are the weights and biases. The entire network can be regarded as a composite function
, and its topology is defined by the inter-layer connection graph, which is isomorphic to the directed acyclic graph (DAG) in graph theory. This formalization reveals the relationship between network capacity and depth.
For SVM, it is derived through the dual problem. The original question is transformed into:
Among them, ,
Aiming at the uncertainty of image features in the crystallization scaling method, the fuzzy mathematical basis of FSVM is formalized [
36,
37,
38]:
where
(⋅) is the Euclidean distance,
is the class center. This definition assigns low membership to noise or outliers in crystal images, reducing their impact on the classifier.
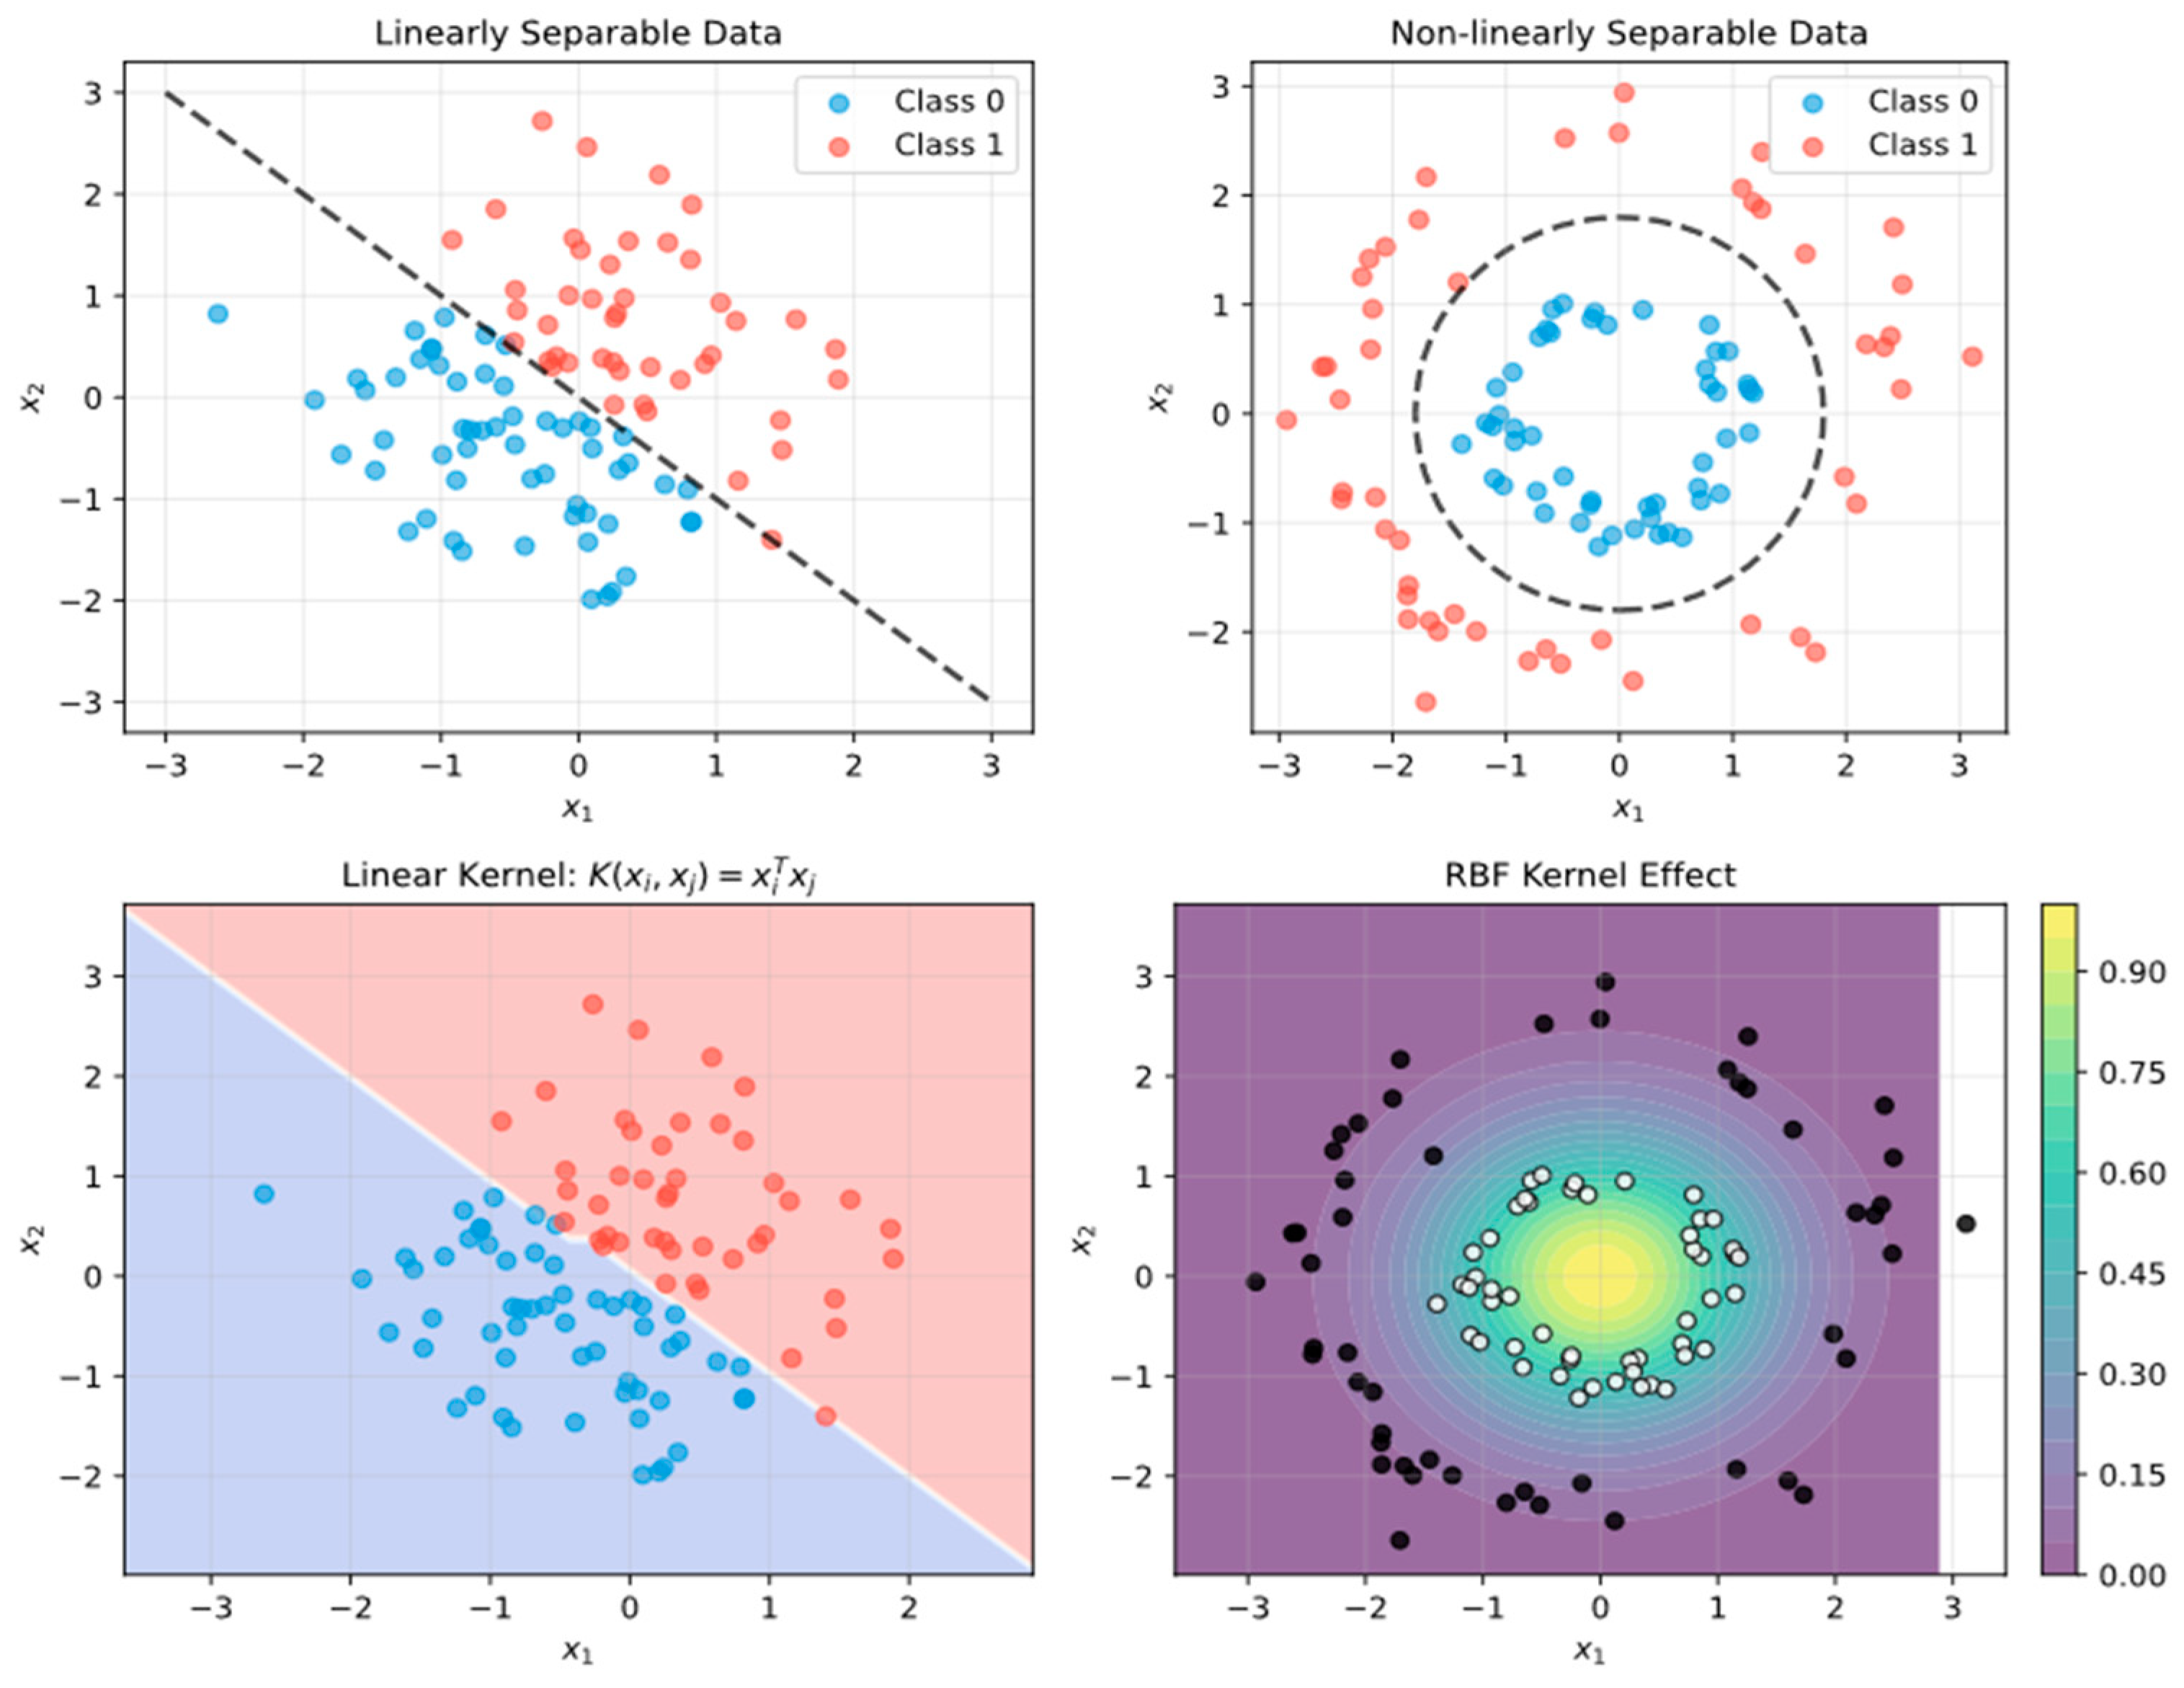
Through mathematical description of kernel function space mapping to enhance intuitive understanding, a mathematical representation of feature space mapping is provided for the polynomial kernel
, whose characteristic map
contains all monomials of order no more than d. For example, when d = 2 and
, there are:
This mapping transforms the nonlinear decision boundary in the original space into a hyperplane in the high-dimensional space, explaining the effectiveness of FSVM in copper sample classification. As shown in
Figure 12.
Through feature space mapping visualization, the figure shows how different kernel functions transform nonlinear separable problems in the original space into linearly separable problems in high-dimensional space.
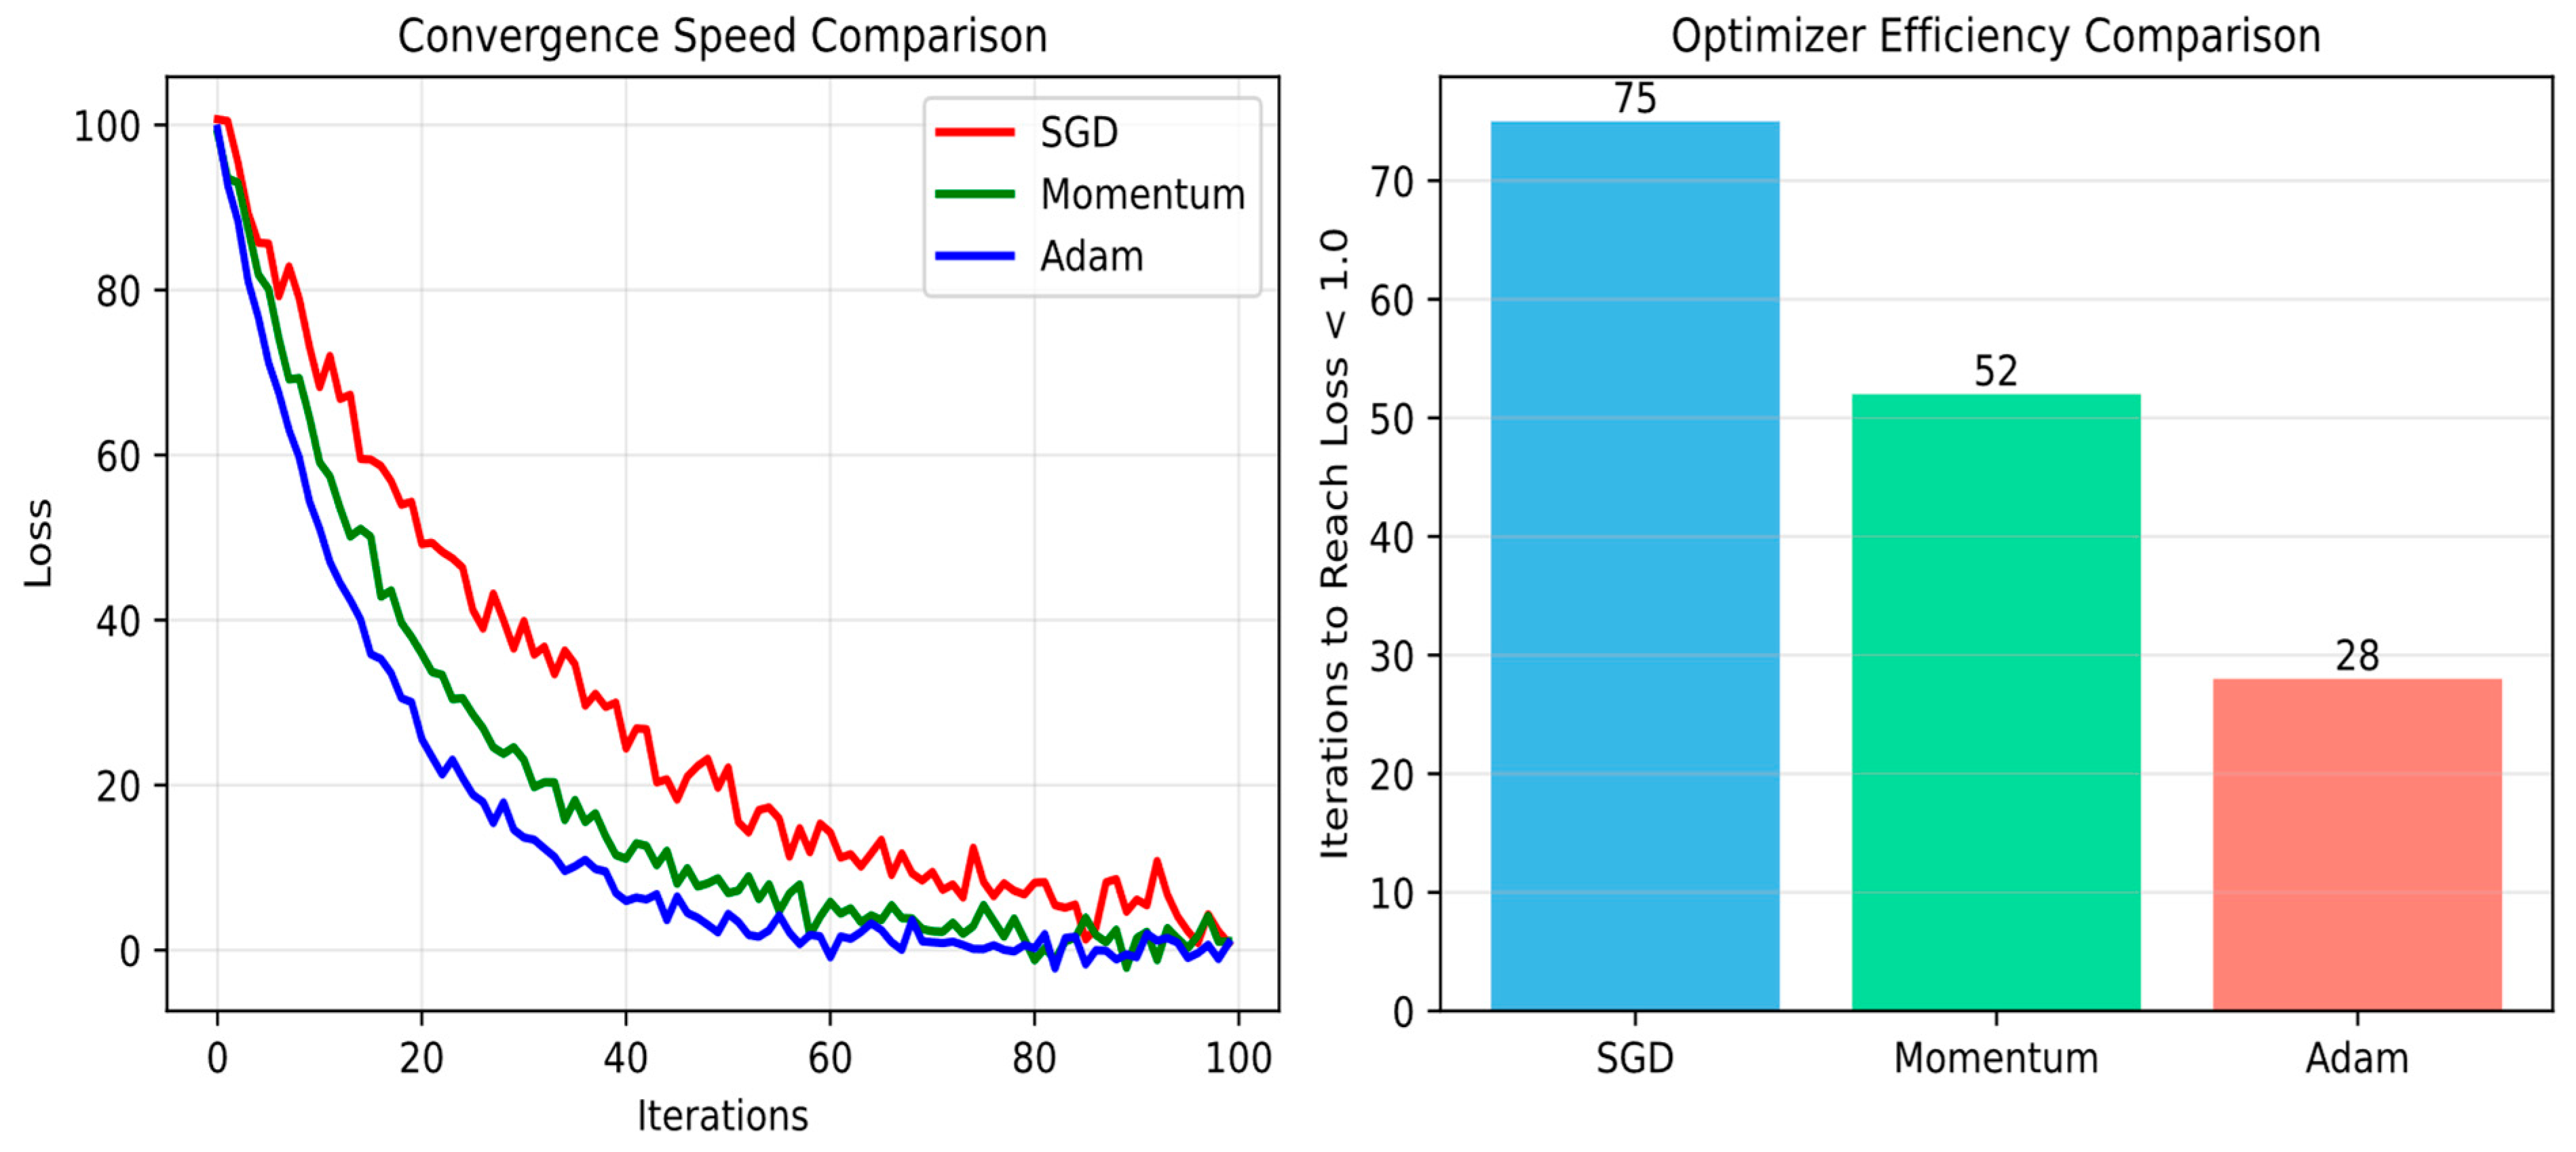
The BP neural network training process is formalized as a non-convex optimization problem, and the mathematical principles and convergence characteristics of optimizers such as gradient descent, the momentum method, and Adam are specified. As shown in
Figure 13.
5. Discussion
5.1. Performance of the Crystallization Ratio Method
This study proposes an intelligent determination method for the reduction endpoint of anode furnaces based on the crystallization ratio. Experimental results show that compared with existing technologies, the proposed method exhibits superior performance.
This method employs image processing techniques, including HSV color space conversion, Laplacian edge detection, and watershed segmentation, to accurately quantify the crystallization ratio of copper sample cross-sections. Its core insight is that the crystallization ratio α can serve as a direct and effective indicator of the reduction endpoint. As shown in
Figure 4 and
Figure 5 and
Table 1, the value of α shows a distinct increasing trend throughout the reduction process and reaches a maximum value of 19.79% at the endpoint. This trend is consistent with the metallurgical principles of copper reduction, verifying the effectiveness of the method.
The model constructed based on this characteristic achieves impressive endpoint prediction accuracy of 98.91%, with a mean absolute error (MAE) as low as 1.09% (
Table 2). The high accuracy can be attributed to the method’s capability to directly capture the intrinsic physical changes (crystallization) occurring in the copper melt, as illustrated in
Figure 6. In addition, the stochastic regression framework (Equation (14)) effectively simulates the temporal evolution of α, while taking both deterministic trends and random perturbations into account. The provided confidence intervals and prediction intervals (
Figure 7) enable robust quantification of uncertainties, which is critical for industrial decision-making. The boxplots and kernel density estimations of absolute errors (
Figure 8) further confirm the stability and reliability of the proposed method, showing concentrated error distributions with minimal outliers.
5.2. Comparative Analysis with Existing Methods
A rigorous comparison with two widely adopted data-driven methods (BP neural network and GRNN) highlights the advantages of the proposed method. As summarized in
Table 2 and statistically validated by the results of analysis of variance (ANOVA) (
Table 6), the crystallization ratio method exhibits significantly superior performance to BP (accuracy: 90.12%) and GRNN (accuracy: 96.54%). The
p-value derived from ANOVA is 2.90 × 10
−13, which strongly indicates that the observed performance differences are statistically significant rather than caused by random factors.
The superior performance of our method can be discussed in conjunction with the limitations of existing approaches. Traditional methods such as redox potential monitoring or SO2 analysis usually rely on indirect measurements and are susceptible to noise and environmental factors, leading to delays and inaccuracies. Although data-driven methods like FSVM and BP neural networks provide alternative solutions, they generally operate as “black boxes”, learning complex mapping relationships from process parameters to endpoints without explicit physical interpretations. In contrast, the crystallization ratio method establishes a direct and visually interpretable connection with the underlying metallurgical states. This aligns with the latest trend of interpretable metallurgical intelligence in process metallurgy.
In addition, the computational efficiency of the image processing pipeline (analyzed in
Table 7) ensures the applicability of this method for real-time applications. The watershed algorithm has a time complexity of O(N log N), achieving a favorable balance between segmentation accuracy and computational cost. This addresses the practical demand for timely endpoint determination in industrial settings, which is sometimes a challenge for more computationally intensive deep learning models.
5.3. Significance and Limitations
The findings of this study are of great significance to the copper smelting industry. The high accuracy and reliability of the crystallization ratio method can facilitate improvements in product quality, reductions in energy consumption, and enhancements in operational efficiency by precisely determining the optimal endpoint of the reduction stage.
However, certain limitations should be acknowledged. The current method requires high-quality cross-sectional images of copper samples, which involves a sampling process. Future work can explore online image acquisition directly from the furnace mouth to achieve truly non-invasive monitoring. Moreover, although the model demonstrates excellent performance on 100 production datasets, its generalizability across different anode furnace types and raw material compositions still needs further investigation. Integrating the crystallization ratio with other sensor data (e.g., temperature, gas composition) into a multi-modal fusion model can further enhance its robustness and accuracy.
In conclusion, the crystallization ratio method proposed in this paper provides a robust, accurate, and interpretable solution for the intelligent endpoint determination of copper smelting in anode furnaces. It effectively bridges the gap between traditional metallurgical principles and modern image analysis techniques.
6. Conclusions
This study processed the cross-sectional images of copper samples from the reduction phase of the anode furnace fire refining process using the HSV color space. Target areas were selected through threshold processing, edge detection was performed using the Laplacian operator, and image segmentation was carried out using the watershed algorithm. The crystallization regions and points within the images were identified, and the proportion of the crystallization areas within the entire image was calculated to determine whether the anode furnace had reached the reduction endpoint. The cross-sectional images at the start of reduction, after 20 min, after 40 min, and at the reduction endpoint were analyzed. The following conclusions were drawn:
(1) The crystallization ratio and average crystallization ratio at various stages of reduction were analyzed and calculated using the crystallization ratio method. The results indicate that the average crystallization ratio gradually increases with the progression of the reduction reaction and reaches its maximum value at the reduction endpoint.
(2) A comparison of the crystallization regions at 20 min of reduction and at the reduction endpoint was conducted, followed by image processing of these regions. At the reduction endpoint, the number of crystallizations increases, the crystallization ratio is higher, and the image exhibits prominent bright spots with crystallization points distributed more uniformly across the entire cross-sectional image.
(3) Based on the crystallization ratio method, a prediction model for the reduction endpoint of the anode furnace fire refining process was developed. The results indicate that the crystallization ratio method improves prediction accuracy by 8.79% compared to the BP method and by 2.37% compared to the GRNN method. This method offers higher prediction accuracy and simpler operation compared to traditional prediction methods.
(4) Experimental research and analysis of the cross-sectional images of copper samples from 100 anode furnace fire refining processes were conducted. The results indicate that the model achieved an endpoint prediction accuracy of 98.91% with an average prediction error of 1.09%, demonstrating a high level of accuracy.
(5) Through the stochastic regression framework, the time evolution of the crystallization ratio is expressed as “deterministic trend + random disturbance”, and linear regression, quadratic regression and logistic growth models are used for fitting (such as formula (14)). The results showed that both the quadratic regression and the logistic model had better goodness of fit (R2 ≥ 0.96) than the linear model. The 95% confidence interval (CI) and prediction interval (PI) were further introduced to quantify the randomness and model uncertainty of crystal growth. In the error assessment, the MAE of the crystallization ratio method was 0.468 ± 0.356, and its 95% CI was (0.461, 0.475), indicating that the results were highly reliable.
(6) The time complexity of each step of image processing has been theoretically analyzed and experimentally verified. For example, the complexity of the watershed segmentation algorithm is O(N log N), and the actual scaling factor is 3.21 ms/Mpixel-log(N), while the Laplacian edge detection is O(k2·N), and the actual scaling factor is 0.62 ms/Mpixel. This shows that the entire process is real-time for industrial applications while ensuring accuracy.
(7) FSVM handles image feature uncertainty through a fuzzy membership function (Formula (19)), and its optimization problem (Formula (15)) is based on the kernel function mapping of Mercer’s theorem, which enhances nonlinear classification capabilities. The topology of the BP neural network (Formula (17)) is formalized as a non-convex optimization problem, combining gradient descent and the Adam optimizer to improve convergence stability. These mathematical foundations provide theoretical support for the crystallization proportion method and explain why it is superior to traditional methods.
Author Contributions
Conceptualization, B.Z. and J.X.; Methodology, H.H. and J.X.; Software, B.Z.; Validation, H.H. and E.C.; Formal analysis, B.Z.; Investigation, B.Z., E.C. and Y.L.; Resources, H.H., E.C. and Y.L.; Data curation, B.Z.; Writing—original draft, B.Z.; Writing—review and editing, H.H. and J.X.; Visualization, B.Z.; Supervision, J.X.; Project administration, J.X.; Funding acquisition, J.X. All authors have read and agreed to the published version of the manuscript.
Funding
We acknowledge the support of the National Natural Science Foundation of China (Project No. 52166004), and The National Key Research and Development Plan project (Project No. 2022YFC3902000).
Data Availability Statement
Due to commercial confidentiality of industry-university-research partners, the data presented in this study are available on request from the corresponding author.
Conflicts of Interest
Authors Bi Zhao, Enlin Chen and Yongjie Lu were employed by the company Liangshan Mining Co., Ltd. The remaining authors declare that the research was conducted in the absence of any commercial or financial relationships that could be construed as a potential conflict of interest. The authors declare no conflicts of interest.
References
- Li, M.-Z.; Zhou, J.-M.; Tong, C.-R.; Zhang, W.-H.; Li, H.-S. Mathematical model of whole-process calculation for bottom-blowing copper smelting. Met. Res. Technol. 2017, 115, 107. [Google Scholar] [CrossRef]
- Sun, L.N.; Wang, H. Current status and development trends of anode furnace refining. Copp. Eng. 2020, 4, 69–72. [Google Scholar]
- Raabe, D.; Ponge, D.; Uggowitzer, P.J.; Roscher, M.; Paolantonio, M.; Liu, C.; Antrekowitsch, H.; Kozeschnik, E.; Seidmann, D.; Gault, B.; et al. Making Sustainable Aluminum by RECYCLING scrap: The Science of “Dirty” Alloys. Prog. Mater. Sci. 2022, 128, 100947. [Google Scholar] [CrossRef]
- Dong, Y.; Xu, J.; Yue, G. Speciation Study of the Aqueous Fe-Cu-As-Sb-Bi-H2SO4 System and Prediction of Redox Potential in Copper Electrorefining from 25 °C to 70 °C. Chem. Eng. Sci. 2022, 255, 117656. [Google Scholar] [CrossRef]
- Qiu, Y.; Li, M.; Huang, J.; He, Z.; Zhong, L.; He, F.; Xu, W.; Tong, C. Judgment Model of a Copper-Converter End Point Based on a Target Detection Algorithm. JOM 2024, 76, 2563–2574. [Google Scholar] [CrossRef]
- Wang, X.; Xing, J.; Dong, J.; Wang, Z. Data driven based endpoint carbon content real time prediction for BOF steelmaking. In Proceedings of the 36th Chinese Control Conference (CCC), Dalian, China, 26–28 July 2017; pp. 9708–9713. [Google Scholar] [CrossRef]
- Bai, S.; Ran, J.; Gan, J.; Chen, J.; Tang, S.; Gao, P. Research on the temperature control system of 6KA neodymium oxide electrolysis furnace with BAS_PID algorithm. J. Phys. Conf. Ser. 2021, 1820, 012190. [Google Scholar] [CrossRef]
- Tian, Z.; Li, H.; Wei, Q.; Qin, W.; Yang, C. Effects of redox potential on chalcopyrite leaching: An overview. Miner. Eng. 2021, 172, 107135. [Google Scholar] [CrossRef]
- Dhiman, S.; Ghosh, A.; Saravanan, V.; Jain, R. Hydrometallurgical Separation of Iron and Copper from Copper Industrial Dust Waste and Recovery of Copper as Copper Oxide. Sustain. Chem. Clim. Action 2025, 7, 100120. [Google Scholar] [CrossRef]
- Li, Y.M.; Sun, L.N. Discussion on intelligent refining of anode copper. Copp. Eng. 2020, 39–42+46. Available online: https://kns.cnki.net/kcms2/article/abstract?v=zWoS8hcslzDiQtzGlNrlsokidtYbMOcRwU3EPllGdK7xvfZf0oUAecE809086gMZihU6hanj9TrN2baCa-9-6I80oWzTTR_61TikUzCLqrmweleopN-PMSMcdZ65d_VXssG7t8ons2MIo2GCH-7er6EFBq6lTBintLSptaHgPEJXXLvYfLC9FA==&uniplatform=NZKPT&language=CHS (accessed on 23 January 2026).
- Liu, X.C.; Liu, H.; Zhao, A. A real-time prediction method for converter steelmaking carbon content based on QCN flame image feature extraction. Control. Theory Appl. 2022, 39, 1745. [Google Scholar]
- Liu, S.; Zhou, M.C. Prediction of steelmaking endpoint temperature based on flame image and spectral features. Laser Opto-Electron. Prog. 2023, 60, 0430001-1–0430001-4. [Google Scholar]
- Zhou, M.; Zhao, Q.; Chen, Y. Endpoint prediction of BOF by flame spectrum and furnace mouth image based on fuzzy support vector machine. Optik 2019, 178, 575–581. [Google Scholar] [CrossRef]
- Zhang, Y.; Zhang, C.-J.; Zeng, K.; Zhu, L.; Han, Y. Research on terminal control model of intelligent mining of flame spectral information of converter mouth in late smelting stage. Ironmak. Steelmak. 2021, 48, 677–684. [Google Scholar] [CrossRef]
- Liu, S.L. Discussion on redox endpoint determination in copper refining. Nonferrous Min. Metall. 2003, 19, 30–31. [Google Scholar]
- Guan, Y.C. Optimization of operating modes to reduce energy consumption in anode furnaces: Research and practice. Copp. Eng. 2017, 65–67. [Google Scholar]
- Gao, S.; Li, B.; Li, Z.; Shu, B.; Liu, D.; Wang, E.; Xu, J.; Wang, H.; Zhang, X. Multi-task dynamic prediction model and application for copper converter endpoint based on deep learning. J. Kunming Univ. Sci. Technol. (Nat. Sci. Ed.) 2022, 47, 8–15. [Google Scholar] [CrossRef]
- Zhang, H.Z.; Zhang, B.J.; Guo, T.Q. End-Point Judgment of Converter Blowing Based on Deep Fusion of Flame and Flue Gas Charac-teristics. Copp. Eng. 2023, 175–180. [Google Scholar] [CrossRef]
- Sun, W.Q.; Liu, H. Prediction of endpoint carbon content in converter steelmaking based on improved complete local binary pattern flame feature extraction. J. Electron. Meas. Instrum. 2021, 35, 56–64. [Google Scholar] [CrossRef]
- Shao, Y.M.; Chen, Y.R.; Zhao, Q. Prediction of converter final temperature based on tuyere flame radiation thermometry. Spectrosc. Spectr. Anal. 2015, 35, 3023–3027. [Google Scholar]
- Xu, L.-F.; Li, W.; Zhang, M.; Xu, S.-X.; Li, J. A model of basic oxygen furnace (BOF) end-point prediction based on spectrum information of the furnace flame with support vector machine (SVM). Optik 2011, 122, 594–598. [Google Scholar] [CrossRef]
- Gu, W.; Ma, S.; Li, T.; Yin, Y. A digital twin and integrated ConvNext-Based method for copper converter blowing endpoint determination. Can. Metall. Q. 2025, 1–15. [Google Scholar] [CrossRef]
- Wu, J.; Cheng, Y.-M.; Liu, C.; Lee, I.-K.; Cha, J.-S.; Huang, W.-L. A BP Neural Network Based on Improved PSO for Increasing Current Efficiency of Copper Electrowinning. J. Electr. Eng. Technol. 2021, 16, 1297–1304. [Google Scholar] [CrossRef]
- Qiu, D.; Dai, W.J. Research on Prediction Model of End-Point Phosphorus Content for AOD Furnace Smelting Ferrochrome Based on RBF Neural Network. Appl. Mech. Mater. 2014, 602–605, 769–772. [Google Scholar] [CrossRef]
- Yan, Y. Decision-Making Model Construction of Emergency Material Allocation for Critical Incidents Based on BP Neural Network Algorithm: An Overview. Arch. Comput. Methods Eng. 2024, 31, 3497–3513. [Google Scholar] [CrossRef]
- Deng, J.; Liu, G.; Wang, L.; Liu, G.; Wu, X. Intelligent optimization design of squeeze casting process parameters based on neural network and improved sparrow search algorithm. J. Ind. Inf. Integr. 2024, 39, 100600. [Google Scholar] [CrossRef]
- Liu, Q.; Liu, M.; Zhou, H.; Yan, F.; Ma, Y.; Shen, W. Intelligent manufacturing system with human-cyber-physical fusion and collaboration for process fine control. J. Manuf. Syst. 2022, 64, 149–169. [Google Scholar] [CrossRef]
- Liu, H.; Liu, J.; Wang, Y.; Xia, Y.; Guo, Z. Identification of grouting compactness in bridge bellows based on the BP neural network. Structures 2021, 32, 817–826. [Google Scholar] [CrossRef]
- He, S.; Liu, J.; Wang, H.; Sun, K. A discrete memristive neural network and its application for character recognition. Neurocomputing 2022, 523, 1–8. [Google Scholar] [CrossRef]
- Zhang, H.; Li, X.; Liu, J.; Han, P.; Yang, Y.; Ding, Z.; Han, L.; Zhang, X.; Wang, S. Study on wetting deformation model of coarse-grained materials based on P-Z model and BP neural network. Front. Earth Sci. 2023, 11, 1187032. [Google Scholar] [CrossRef]
- Jimenez-Castaño, C.; Álvarez-Meza, A.; Cárdenas-Peña, D.; Orozco-Gutíerrez, A.; Guerrero-Erazo, J. Kreĭn twin support vector machines for imbalanced data classification. Pattern Recognit. Lett. 2024, 182, 39–45. [Google Scholar] [CrossRef]
- Ding, S.; Huang, H.; Yu, J.; Zhao, H. Research on the hybrid models of granular computing and support vector machine. Artif. Intell. Rev. 2013, 43, 565–577. [Google Scholar] [CrossRef]
- Hang, J.; Zhang, J.; Cheng, M. Application of multi-class fuzzy support vector machine classifier for fault diagnosis of wind turbine. Fuzzy Sets Syst. 2016, 297, 128–140. [Google Scholar] [CrossRef]
- Macit, C.K.; Saatci, B.T.; Albayrak, M.G.; Ulas, M.; Gurgenc, T.; Ozel, C. Prediction of wear amounts of AZ91 magnesium alloy matrix composites reinforced with ZnO-hBN nanocomposite particles by hybridized GA-SVR model. J. Mater. Sci. 2024, 59, 17456–17490. [Google Scholar] [CrossRef]
- Duan, H.; Meng, X.; Tang, J.; Qiao, J. NOx emissions prediction for MSWI process based on dynamic modular neural network. Expert Syst. Appl. 2023, 238, 122015. [Google Scholar] [CrossRef]
- Zheng, Y.; Xu, Z.; Wu, T.; Yi, Z. A systematic survey of fuzzy deep learning for uncertain medical data. Artif. Intell. Rev. 2024, 57, 1–41. [Google Scholar] [CrossRef]
- Demirhan, H.; Baser, F. Hierarchical fuzzy regression functions for mixed predictors and an application to real estate price prediction. Neural Comput. Appl. 2024, 36, 11545–11561. [Google Scholar] [CrossRef]
- Salimi-Badr, A. A data-driven implicit deep adaptive neuro-fuzzy inference system capable of manifold learning for function approximation. Appl. Soft Comput. 2024, 155, 111458. [Google Scholar] [CrossRef]
Figure 1.
Diagram of the anode furnace equipment. Gas Analyzer: DOAS Ultraviolet Flue Gas Analyzer (Jingxun Changtong Technology Co., Ltd., Weihai, China). Camera: MV-CS050-10GC Industrial Camera (Hangzhou Hikrobot Co., Ltd., Hangzhou, China). Computer: ThinkBook 16+ 2025 Laptop (Lenovo Group Ltd., Beijing, China).
Figure 1.
Diagram of the anode furnace equipment. Gas Analyzer: DOAS Ultraviolet Flue Gas Analyzer (Jingxun Changtong Technology Co., Ltd., Weihai, China). Camera: MV-CS050-10GC Industrial Camera (Hangzhou Hikrobot Co., Ltd., Hangzhou, China). Computer: ThinkBook 16+ 2025 Laptop (Lenovo Group Ltd., Beijing, China).
Figure 2.
Flowchart for constructing the prediction model for reduction phase endpoint determination.
Figure 2.
Flowchart for constructing the prediction model for reduction phase endpoint determination.
Figure 3.
Schematic diagram of image processing and crystallization proportion method.
Figure 3.
Schematic diagram of image processing and crystallization proportion method.
Figure 4.
Crystallization proportions at each stage and average crystallization proportion. The green line represents the average value of the corresponding data.
Figure 4.
Crystallization proportions at each stage and average crystallization proportion. The green line represents the average value of the corresponding data.
Figure 5.
Average crystallization proportions at each stage.
Figure 5.
Average crystallization proportions at each stage.
Figure 6.
Comparison of crystallization areas at 20 min of reduction and at the reduction endpoint.
Figure 6.
Comparison of crystallization areas at 20 min of reduction and at the reduction endpoint.
Figure 7.
Confidence intervals (CI) and prediction intervals (PI) quantify randomness and reliability.
Figure 7.
Confidence intervals (CI) and prediction intervals (PI) quantify randomness and reliability.
Figure 8.
Boxplots and histograms + kernel density estimation of the absolute error at the endpoint of each method.
Figure 8.
Boxplots and histograms + kernel density estimation of the absolute error at the endpoint of each method.
Figure 9.
Change trend of Accuracy under different tolerances.
Figure 9.
Change trend of Accuracy under different tolerances.
Figure 10.
Endpoint Accuracy Across Folds.
Figure 10.
Endpoint Accuracy Across Folds.
Figure 11.
Computational complexity analysis.
Figure 11.
Computational complexity analysis.
Figure 12.
Kernel function space mapping visualization.
Figure 12.
Kernel function space mapping visualization.
Figure 13.
Neural network optimization analysis.
Figure 13.
Neural network optimization analysis.
Table 1.
Average crystallization ratios at various stages of reduction.
Table 1.
Average crystallization ratios at various stages of reduction.
| Stage | Average Crystallization Ratios/% |
|---|
| Start of the reduction phase | 3.15 |
| Reduction phase 20 min | 7.56 |
| Reduction phase 40 min | 12.09 |
| Reduction phase endpoints | 19.79 |
Table 2.
Comparison of three different methods.
Table 2.
Comparison of three different methods.
| | Method | Accuracy/% |
|---|
| 1 | BP | 90.12 |
| 2 | GRNN | 96.54 |
| 3 | Crystallography | 98.91 |
Table 3.
Comparison of the fitting performance of different models.
Table 3.
Comparison of the fitting performance of different models.
| Model | R2 | AIC | BIC | RMSE_in | MAE_in |
|---|
| OLS_linear | 0.95 | 348.00 | 353.21 | 1.35 | 1.07 |
| OLS_quadratic | 0.96 | 320.74 | 328.55 | 1.17 | 0.89 |
| Logistic_nls | 0.96 | | | 1.20 | 0.92 |
Table 4.
Evaluation of Endpoint Prediction Error.
Table 4.
Evaluation of Endpoint Prediction Error.
| Method | Accuracy
(%) | MAE
(Mean ± Std) | MAE
(Median ± IQR) | 95% CI
for MAE_min | 95% CI
for Accuracy |
|---|
| Crystallography | 98.79 | 0.468 ± 0.356 | 0.396 ± 0.484 | (0.461, 0.475) | (98.57%, 99.00%) |
| GRNN | 96.23 | 0.566 ± 0.434 | 0.472 ± 0.579 | (0.557, 0.574) | (95.85%, 96.59%) |
| BP | 89.89 | 0.733 ± 0.558 | 0.616 ± 0.762 | (0.722, 0.744) | (89.30%, 90.48%) |
Table 5.
Comparison of Optimization for Different Models.
Table 5.
Comparison of Optimization for Different Models.
| Fold | Accuracy | Method |
|---|
| 1 | 0.989 | Crystallography |
| 2 | 0.9905 | Crystallography |
| 3 | 0.9905 | Crystallography |
| 4 | 0.9845 | Crystallography |
| 5 | 0.985 | Crystallography |
| 1 | 0.9615 | GRNN |
| 2 | 0.9635 | GRNN |
| 3 | 0.9685 | GRNN |
| 4 | 0.9565 | GRNN |
| 5 | 0.9615 | GRNN |
| 1 | 0.9005 | BP |
| 2 | 0.902 | BP |
| 3 | 0.9025 | BP |
| 4 | 0.8935 | BP |
| 5 | 0.896 | BP |
Table 6.
Differences in testing between different methods.
Table 6.
Differences in testing between different methods.
| ANOVA_F | ANOVA_p | Kruskal_H | Kruskal_p | eta_Squared | n_Folds |
|---|
| 731.47 | 2.90 × 10⁻¹³ | 12.54 | 0 | 0.99 | 5 |
Table 7.
Algorithmic complexity.
Table 7.
Algorithmic complexity.
| Algorithm | Theoretical Complexity | Practical Scaling Factor | Notes |
|---|
| Otsu Thresholding | O(L·N) | 0.15 ms/Mpixel | L = 256 grayscale levels, N = pixels |
| Laplacian Edge Detection | O(k2·N) | 0.62 ms/Mpixel | k = 3 (3 × 3 kernel) |
| Watershed Segmentation | O(N log N) | 3.21 ms/Mpixel·log(N) | Dominant term for large images |
| Connected Components | O(N) | 0.38 ms/Mpixel | Two-pass algorithm |
| Disclaimer/Publisher’s Note: The statements, opinions and data contained in all publications are solely those of the individual author(s) and contributor(s) and not of MDPI and/or the editor(s). MDPI and/or the editor(s) disclaim responsibility for any injury to people or property resulting from any ideas, methods, instructions or products referred to in the content. |