In this section, we evaluate the performance of the proposed PINN-GNN hybrid algorithm using data centers as a representative validation scenario for PUE prediction.
4.1. Experimental Setup
All simulations are implemented in Python 3.8 using PyTorch 1.12 as the deep learning framework. The key implementation and simulation parameters are summarized in
Table 1.
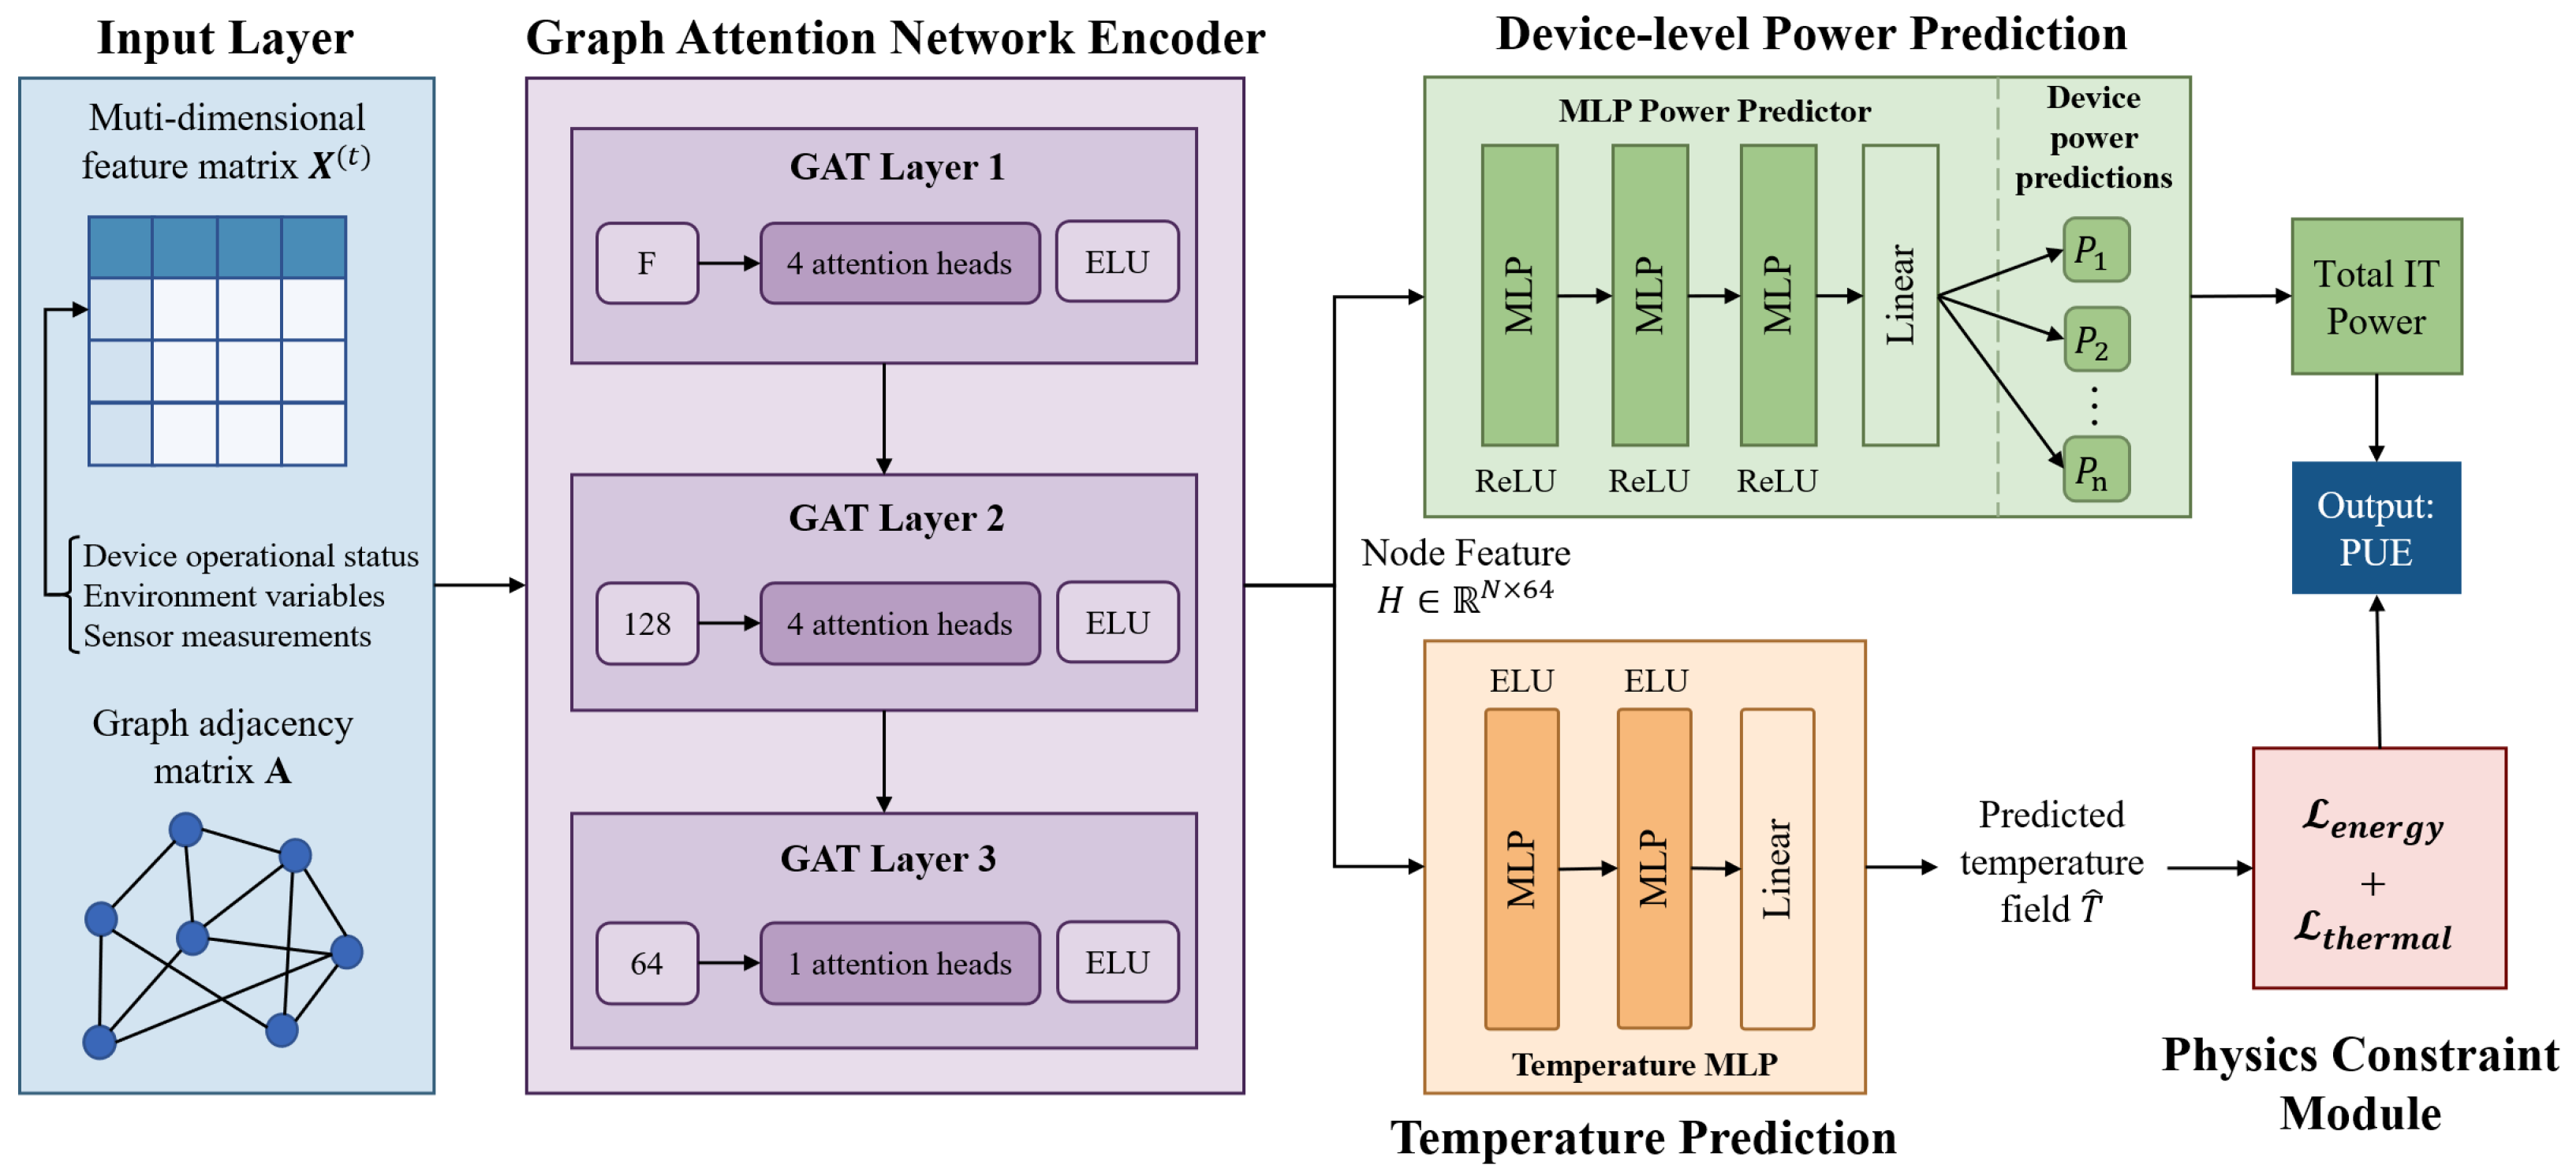
The GAT encoder adopts three attention layers with a hidden dimension of 64 and a multi-head configuration (4, 4, 1), providing a balance between representation capability and computational complexity. A dropout rate of 0.2 is adopted to reduce overfitting. The loss weights and are selected through grid search on the validation set.
The dataset was collected from the operational monitoring platforms of two geographically distributed production data center clusters located in Guian and Hohhot between 2018 and 2024, comprising 30,037 valid operational samples.
Table 2 summarizes the key statistics for each cluster. All measurements are collected from live production environments, ensuring that the dataset captures realistic sensor noise, workload variations, seasonal fluctuations, and operational dynamics. Each sample includes multi-dimensional features such as cold aisle temperature and humidity, outdoor temperature, rack utilization, device-level power consumption, and the actual PUE value. The monitoring platforms continuously acquire measurements from IT equipment, cooling infrastructure, and environmental sensors during normal production operation.
For model training and implementation, the dataset is chronologically divided into 70% training, 15% validation, and 15% testing subsets. Training uses a batch size of 64, the Adam optimizer with a learning rate of and weight decay of , and gradient clipping at norm 1.0. Early stopping is applied with a patience of 15 epochs based on validation loss. Maximum epochs are set to 100, though early stopping typically halts training between 20 and 30 epochs.
We compare the proposed PDPG and UEPG against two representative baseline methods for PUE prediction. The first baseline, termed Pure GNN, removes all physics-informed constraints while preserving the same GAT-based architecture, training strategy, and network configuration as PDPG. Therefore, the performance difference between Pure GNN and PDPG can be solely attributed to the introduced physics-informed constraints. The second baseline, CLDNN [
15], combines convolutional neural networks for spatial feature extraction with long short-term memory networks for temporal modeling, making it suitable for capturing both spatial and temporal dependencies in data center sensor data.
Sensors deployed throughout the two data center clusters continuously monitor IT equipment, cooling infrastructure, and environmental conditions at 12-h intervals. The raw dataset contains fewer than 1% missing values caused primarily by temporary sensor communication failures, which are handled using linear interpolation.
To prevent data leakage, we adopt a chronological split based on timestamps. The training set covers the period from 1 January 2018 to 31 December 2020 and contains 70 percent of the samples. The validation set covers the first half of 2021, from 1 January to 30 June 2021, and contains 15 percent of the samples. The test set covers the period from 1 July 2021 to 31 December 2022 and contains the remaining 15 percent of the samples. All normalization statistics including mean and standard deviation are computed exclusively from the training set and then applied to both the validation set and the test set.
All experiments are repeated using five random seeds (42, 123, 456, 789, and 101112). Results are reported as mean value plus or minus standard deviation. Statistical significance is evaluated using paired t-tests (), and 95% confidence intervals are estimated via bootstrap resampling with 1000 iterations.
To justify the simplification from multi-source dependence to a univariate function of outdoor temperature, we performed a correlation analysis on the operational data from both data center clusters. Outdoor temperature exhibits the strongest correlation with cooling power (), while cold aisle temperature (), rack utilization (), and humidity features () show weaker or collinear relationships. The variance inflation factor for the entire feature set exceeds 10, indicating severe multicollinearity.
Since cooling energy is the dominant non-IT energy component in modern air-cooled data centers, the target cooling ratio
is approximated using representative engineering values selected according to the typical cooling overhead ratios reported in previous studies for production air-cooled data centers operating under different outdoor temperature conditions [
29,
30]. The selected values of 0.25, 0.35, and 0.50 represent low, medium, and high cooling demand conditions, respectively, rather than exact physical constants.
These representative ratios are adopted as fixed physical priors within the PINN constraint to encode engineering knowledge while maintaining a simple and interpretable formulation.
The physical parameters used in the thermal evolution constraint are summarized in
Table 3. These parameters include the sampling interval, thermal diffusivity, air density, specific heat capacity, and energy-to-heat conversion efficiency. All values are selected according to standard physical properties of air and commonly adopted engineering settings for production data centers, ensuring physically consistent thermal modeling.
The experimental evaluation consists of three parts. First, the proposed methods are compared with representative baseline models to evaluate prediction accuracy. Second, ablation studies are conducted to quantify the contribution of each physics-informed constraint. Finally, cross-site, cross-time, and sensitivity analyses are performed to assess the robustness and generalization capability of the proposed framework.
4.2. Prediction Performance
To evaluate the prediction accuracy of the proposed methods, we compared PDPG and UEPG against two baseline methods, Pure GNN and CLDNN [
15], on the test dataset.
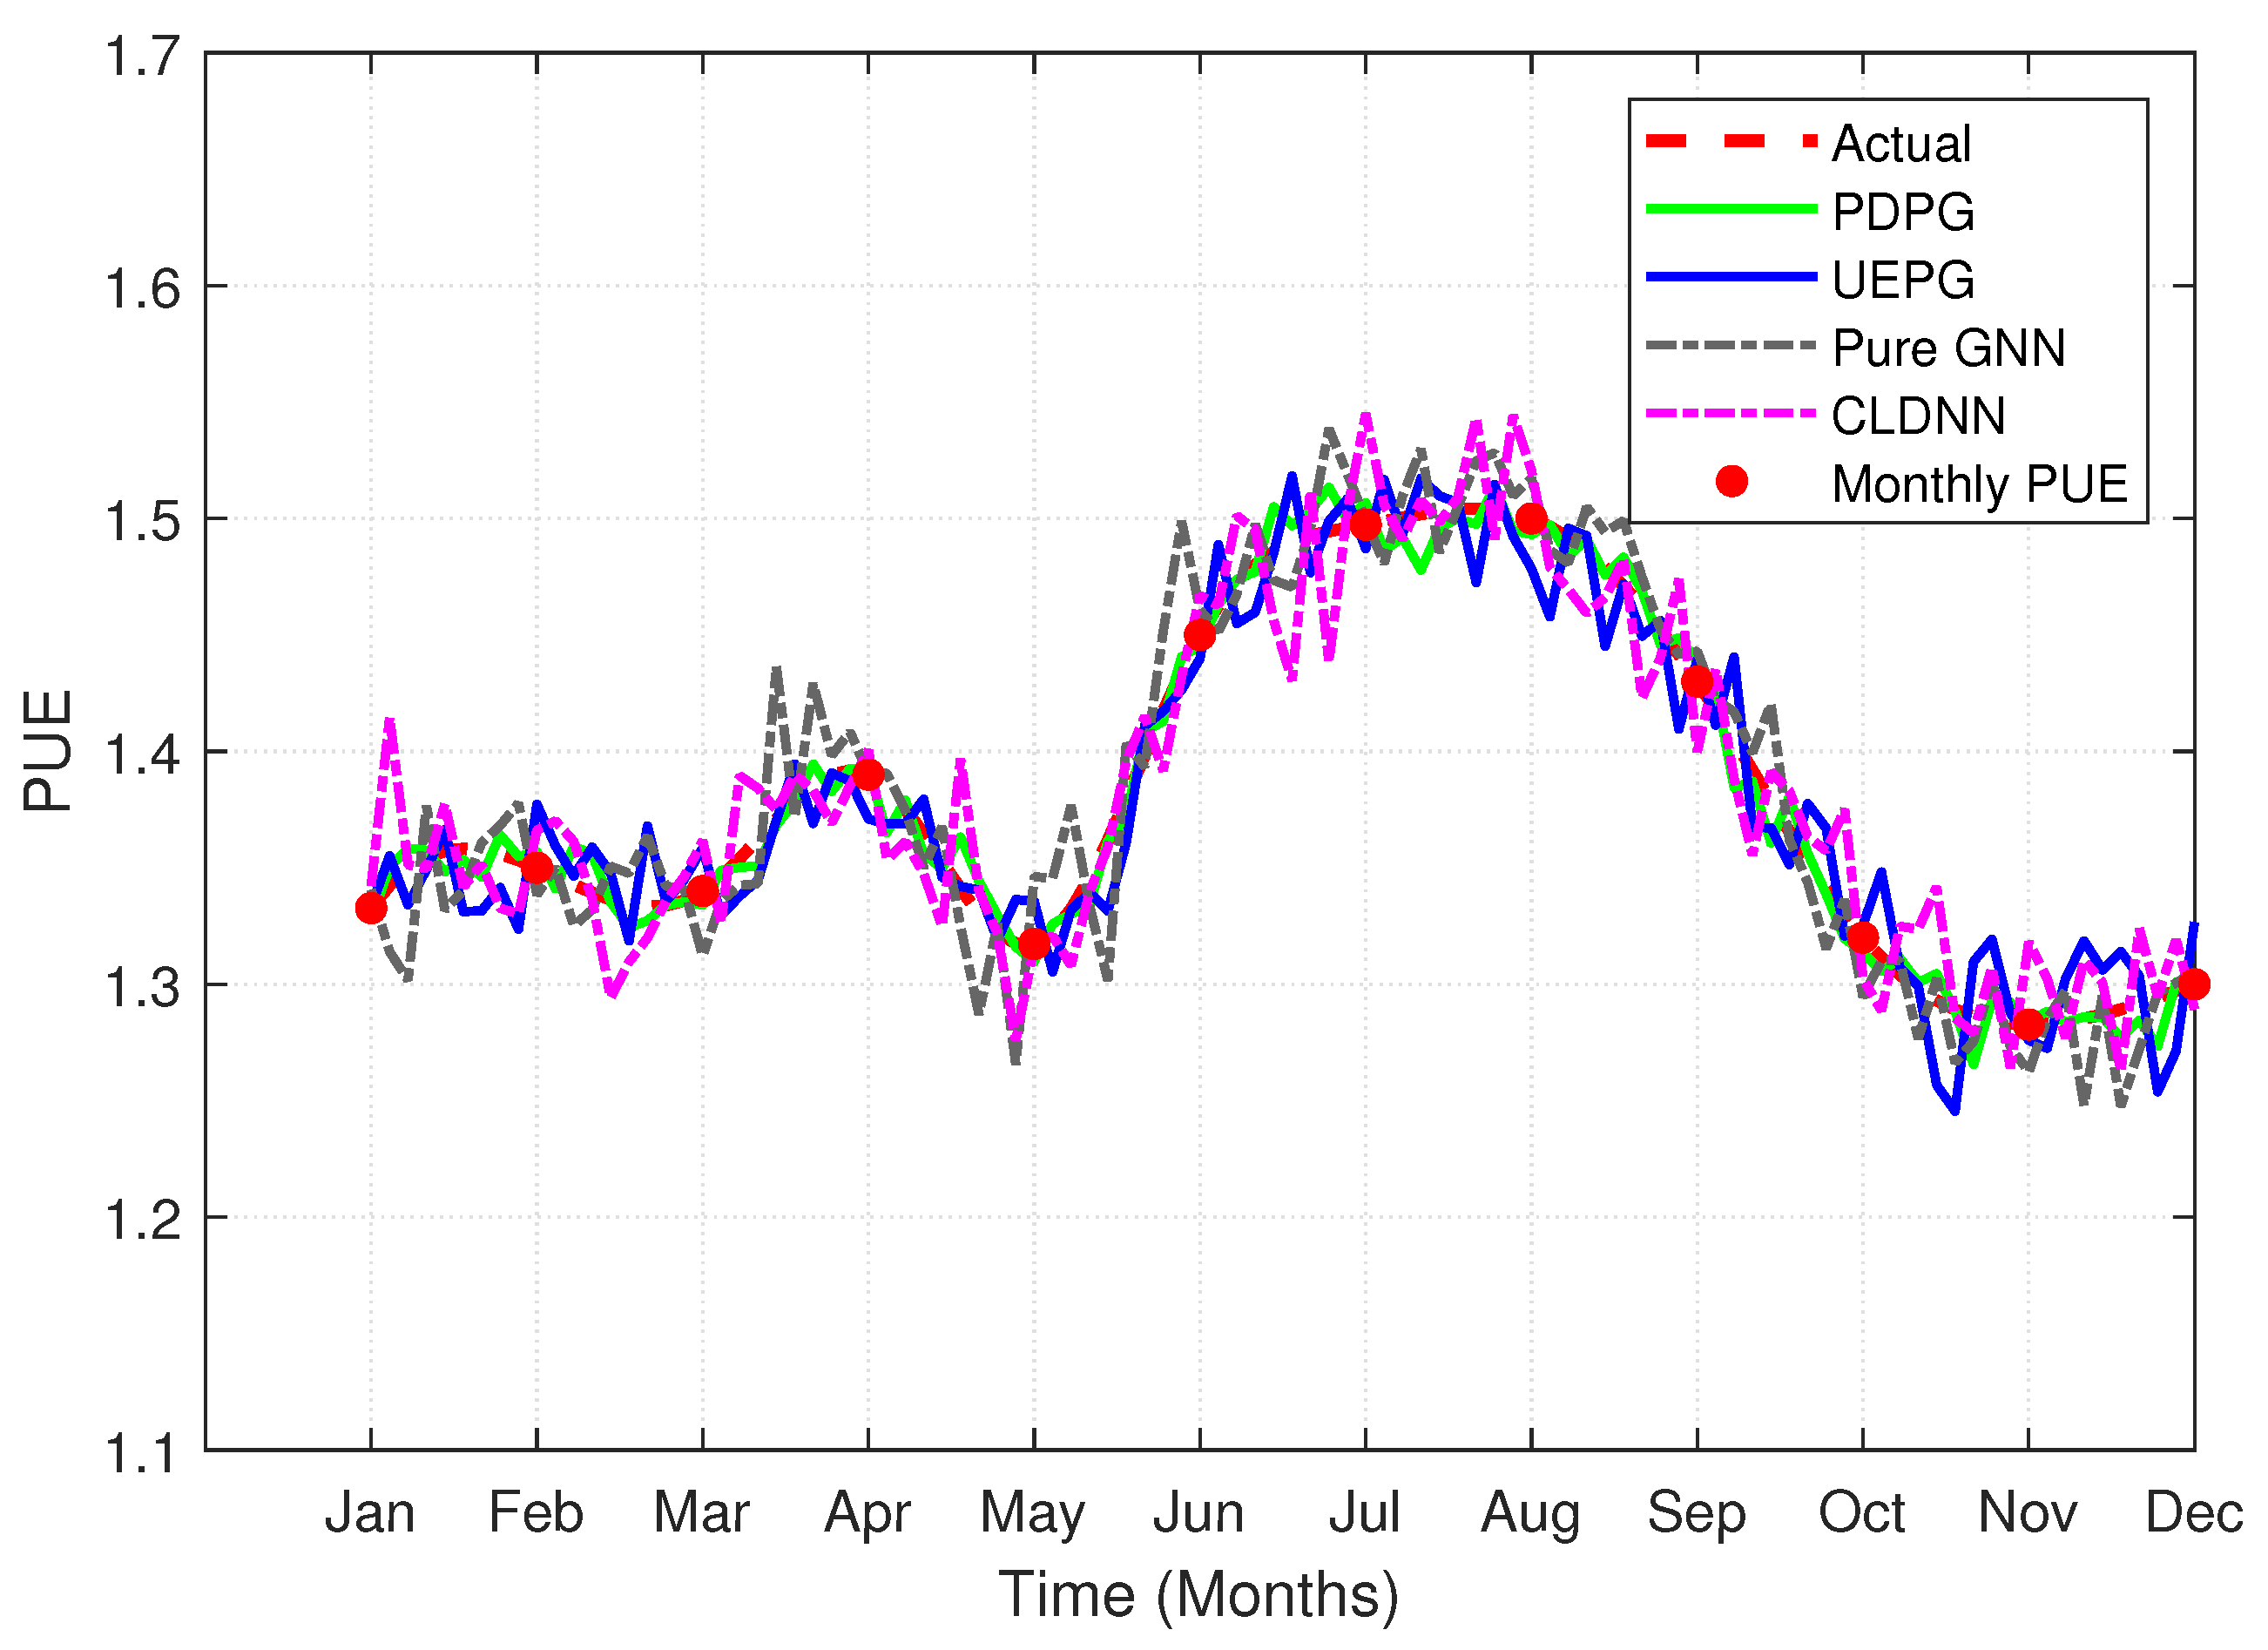
Figure 2 shows the monthly PUE variation curves over a one-year period for all methods together with the actual measured PUE values.
As shown in
Figure 2, all methods follow the general seasonal trend of PUE variation, with higher values in summer and lower values in winter. The proposed PDPG and UEPG curves closely track the actual measured values throughout the year, demonstrating superior stability and accuracy. By contrast, both Pure GNN and CLDNN exhibit larger deviations during periods of rapid operational or environmental changes. The Pure GNN curve shows noticeable fluctuations around the actual trend, while CLDNN displays even larger errors, particularly during the summer months when cooling demand is highest. These observations confirm that the physics-informed constraints effectively regularize the GNN predictions and improve robustness under varying operational conditions.
Table 4 presents the quantitative comparison of prediction performance across all methods. All results are based on five independent runs with different random seeds, and the reported MSE values are expressed as mean plus or minus standard deviation in units of
.
The results demonstrate that the proposed PDPG method achieves the lowest MSE of , outperforming UEPG by a factor of approximately four, Pure GNN by a factor of approximately 7.2, and CLDNN by a factor of approximately 7.7. Pure GNN achieves a slightly lower MSE than CLDNN, indicating that the graph-based spatial modeling of GAT is more effective than the CNN-LSTM hybrid for this task. The performance gap between PDPG and Pure GNN, an 86.1% reduction in MSE, quantifies the contribution of the physics-informed constraints. The standard deviations are consistently small across all methods, indicating stable training and reliable performance. The 95% confidence intervals show no overlap between PDPG and the baseline methods, confirming the statistical significance of the observed improvements. Pairwise t-tests between PDPG and each baseline yield for all comparisons.
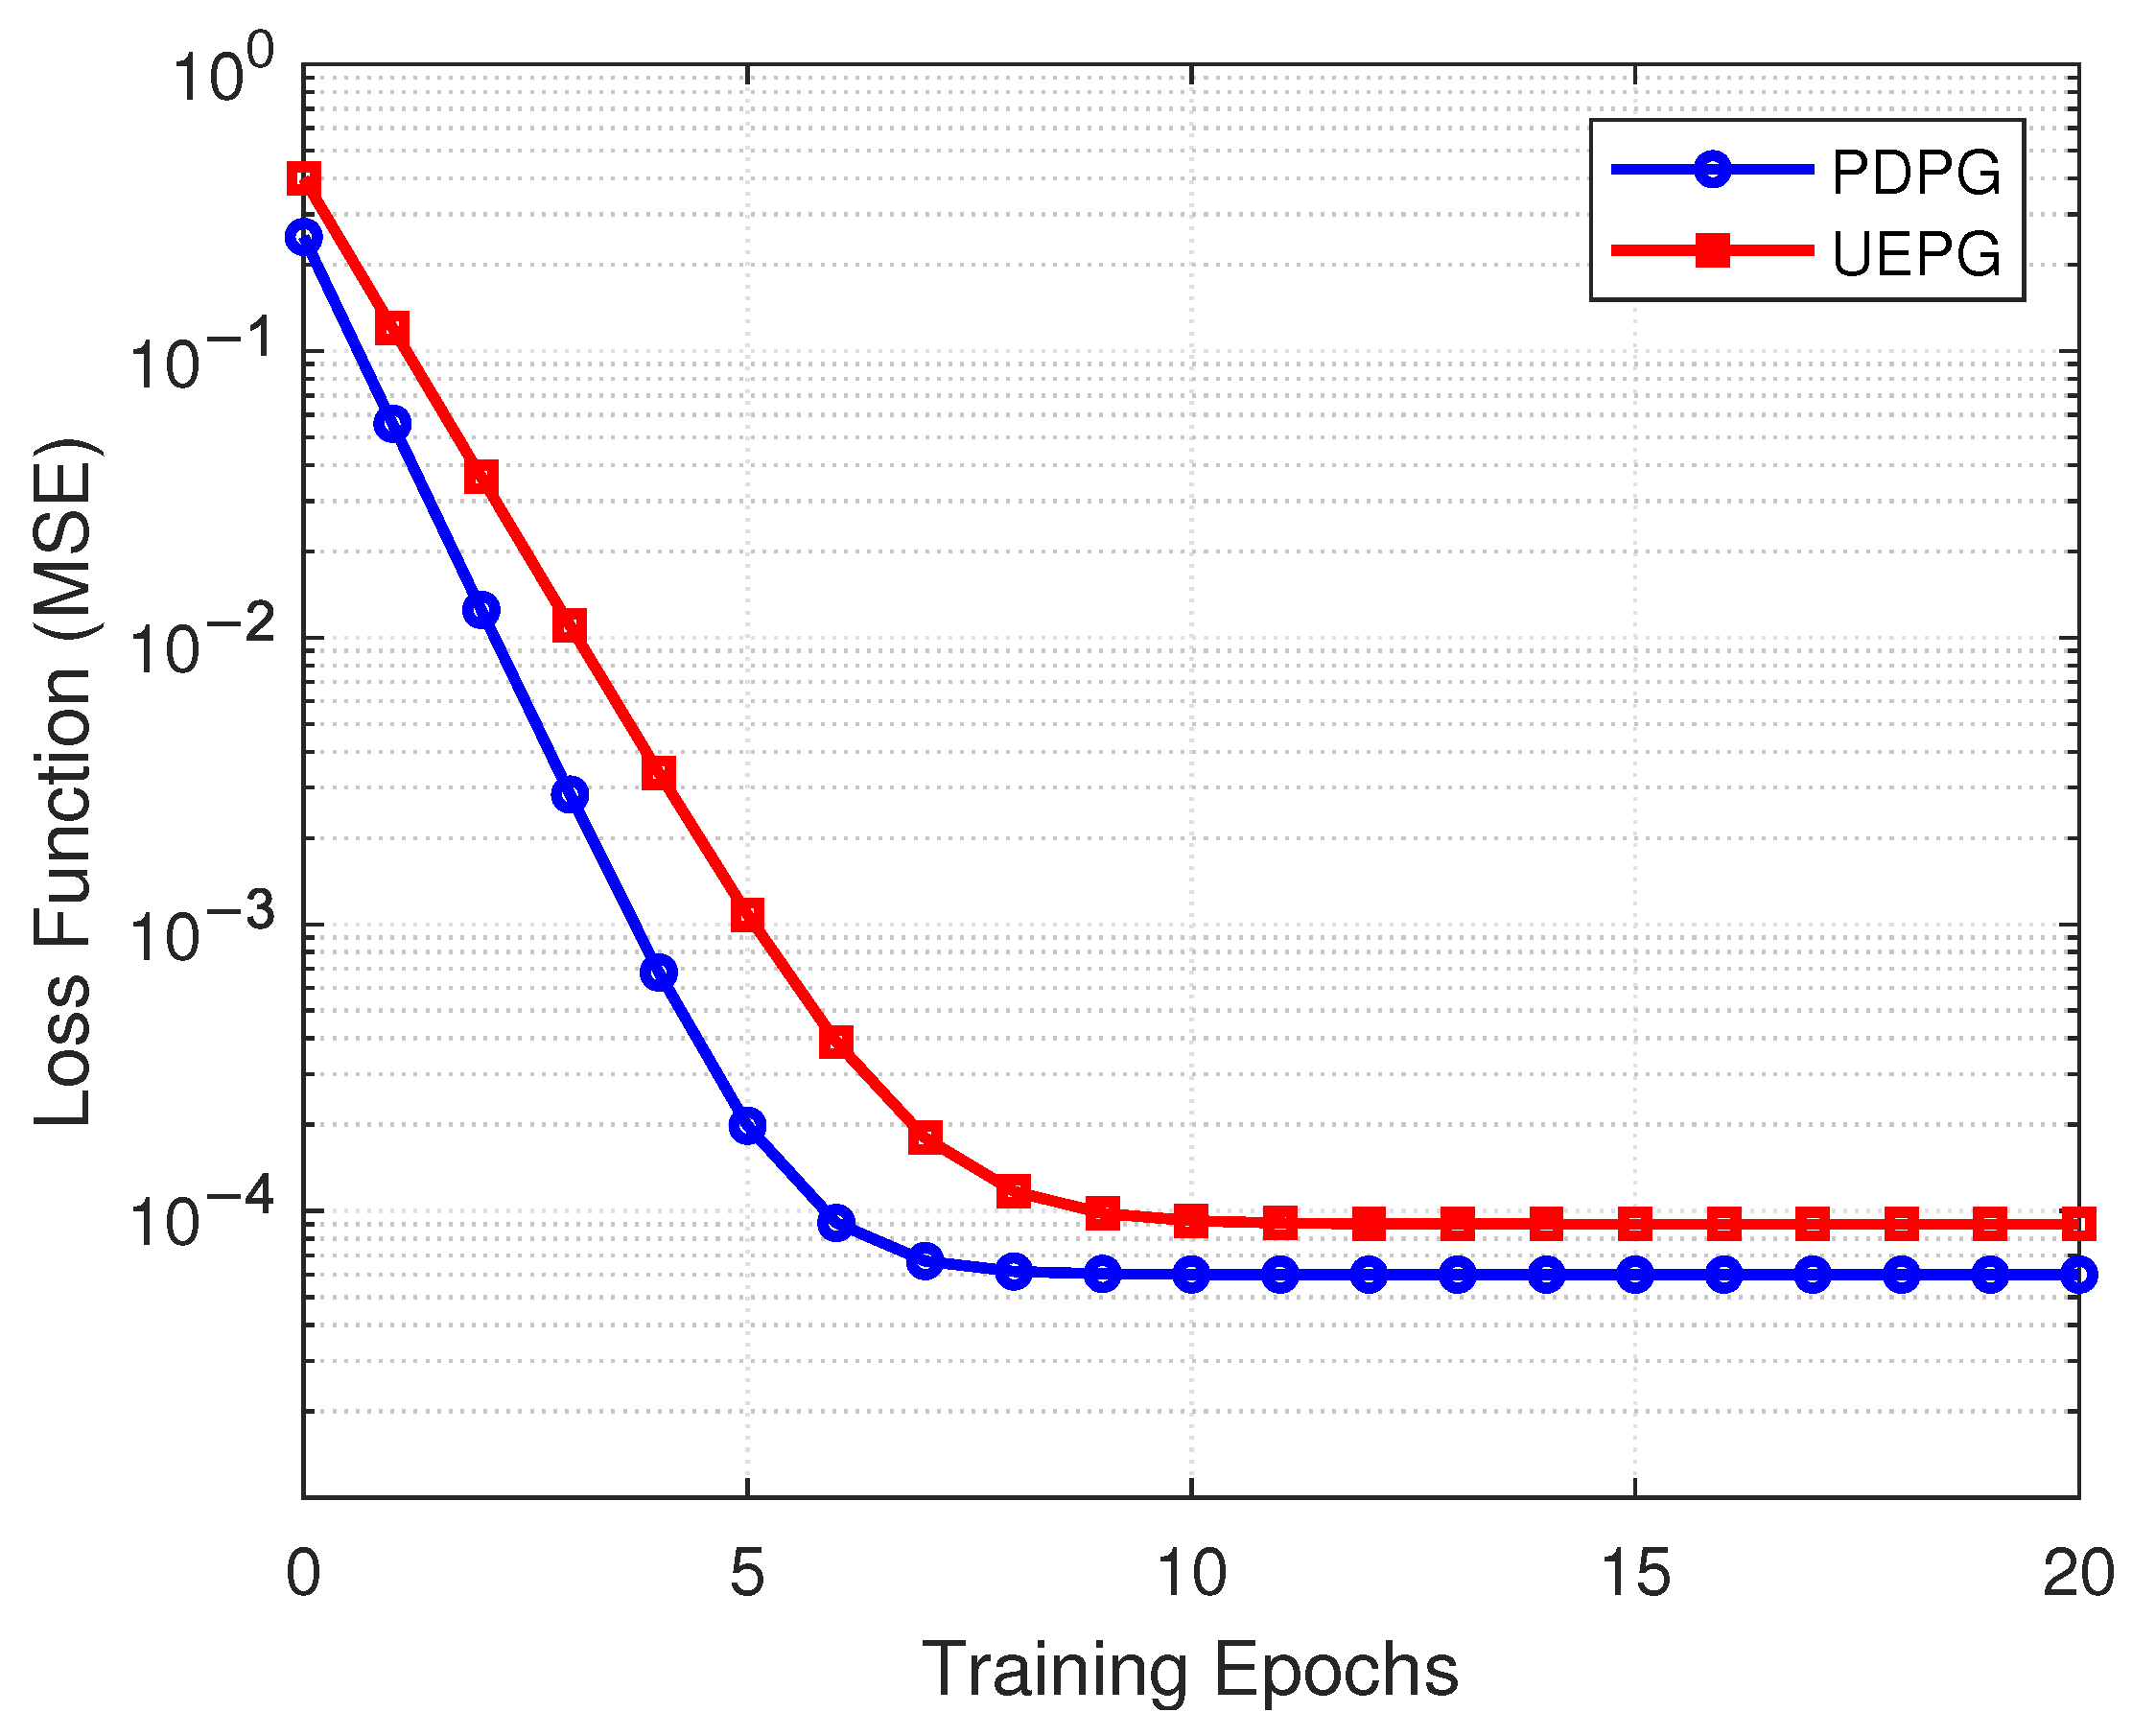
The convergence performance during model training is illustrated in
Figure 3, which shows the loss function MSE curves of PDPG and UEPG with the increase of training epochs. Both models achieve rapid convergence in the initial training stage, with the loss value dropping by orders of magnitude within the first five epochs. PDPG converges faster and reaches a stable state at around six epochs, with a final steady-state loss of approximately
. UEPG converges slightly slower than PDPG but maintains a lower loss oscillation amplitude during the convergence process, and its final steady-state loss of approximately
is slightly higher than that of PDPG, which is attributed to the more complex end-to-end optimization objective of the unified mapping structure.
Finally,
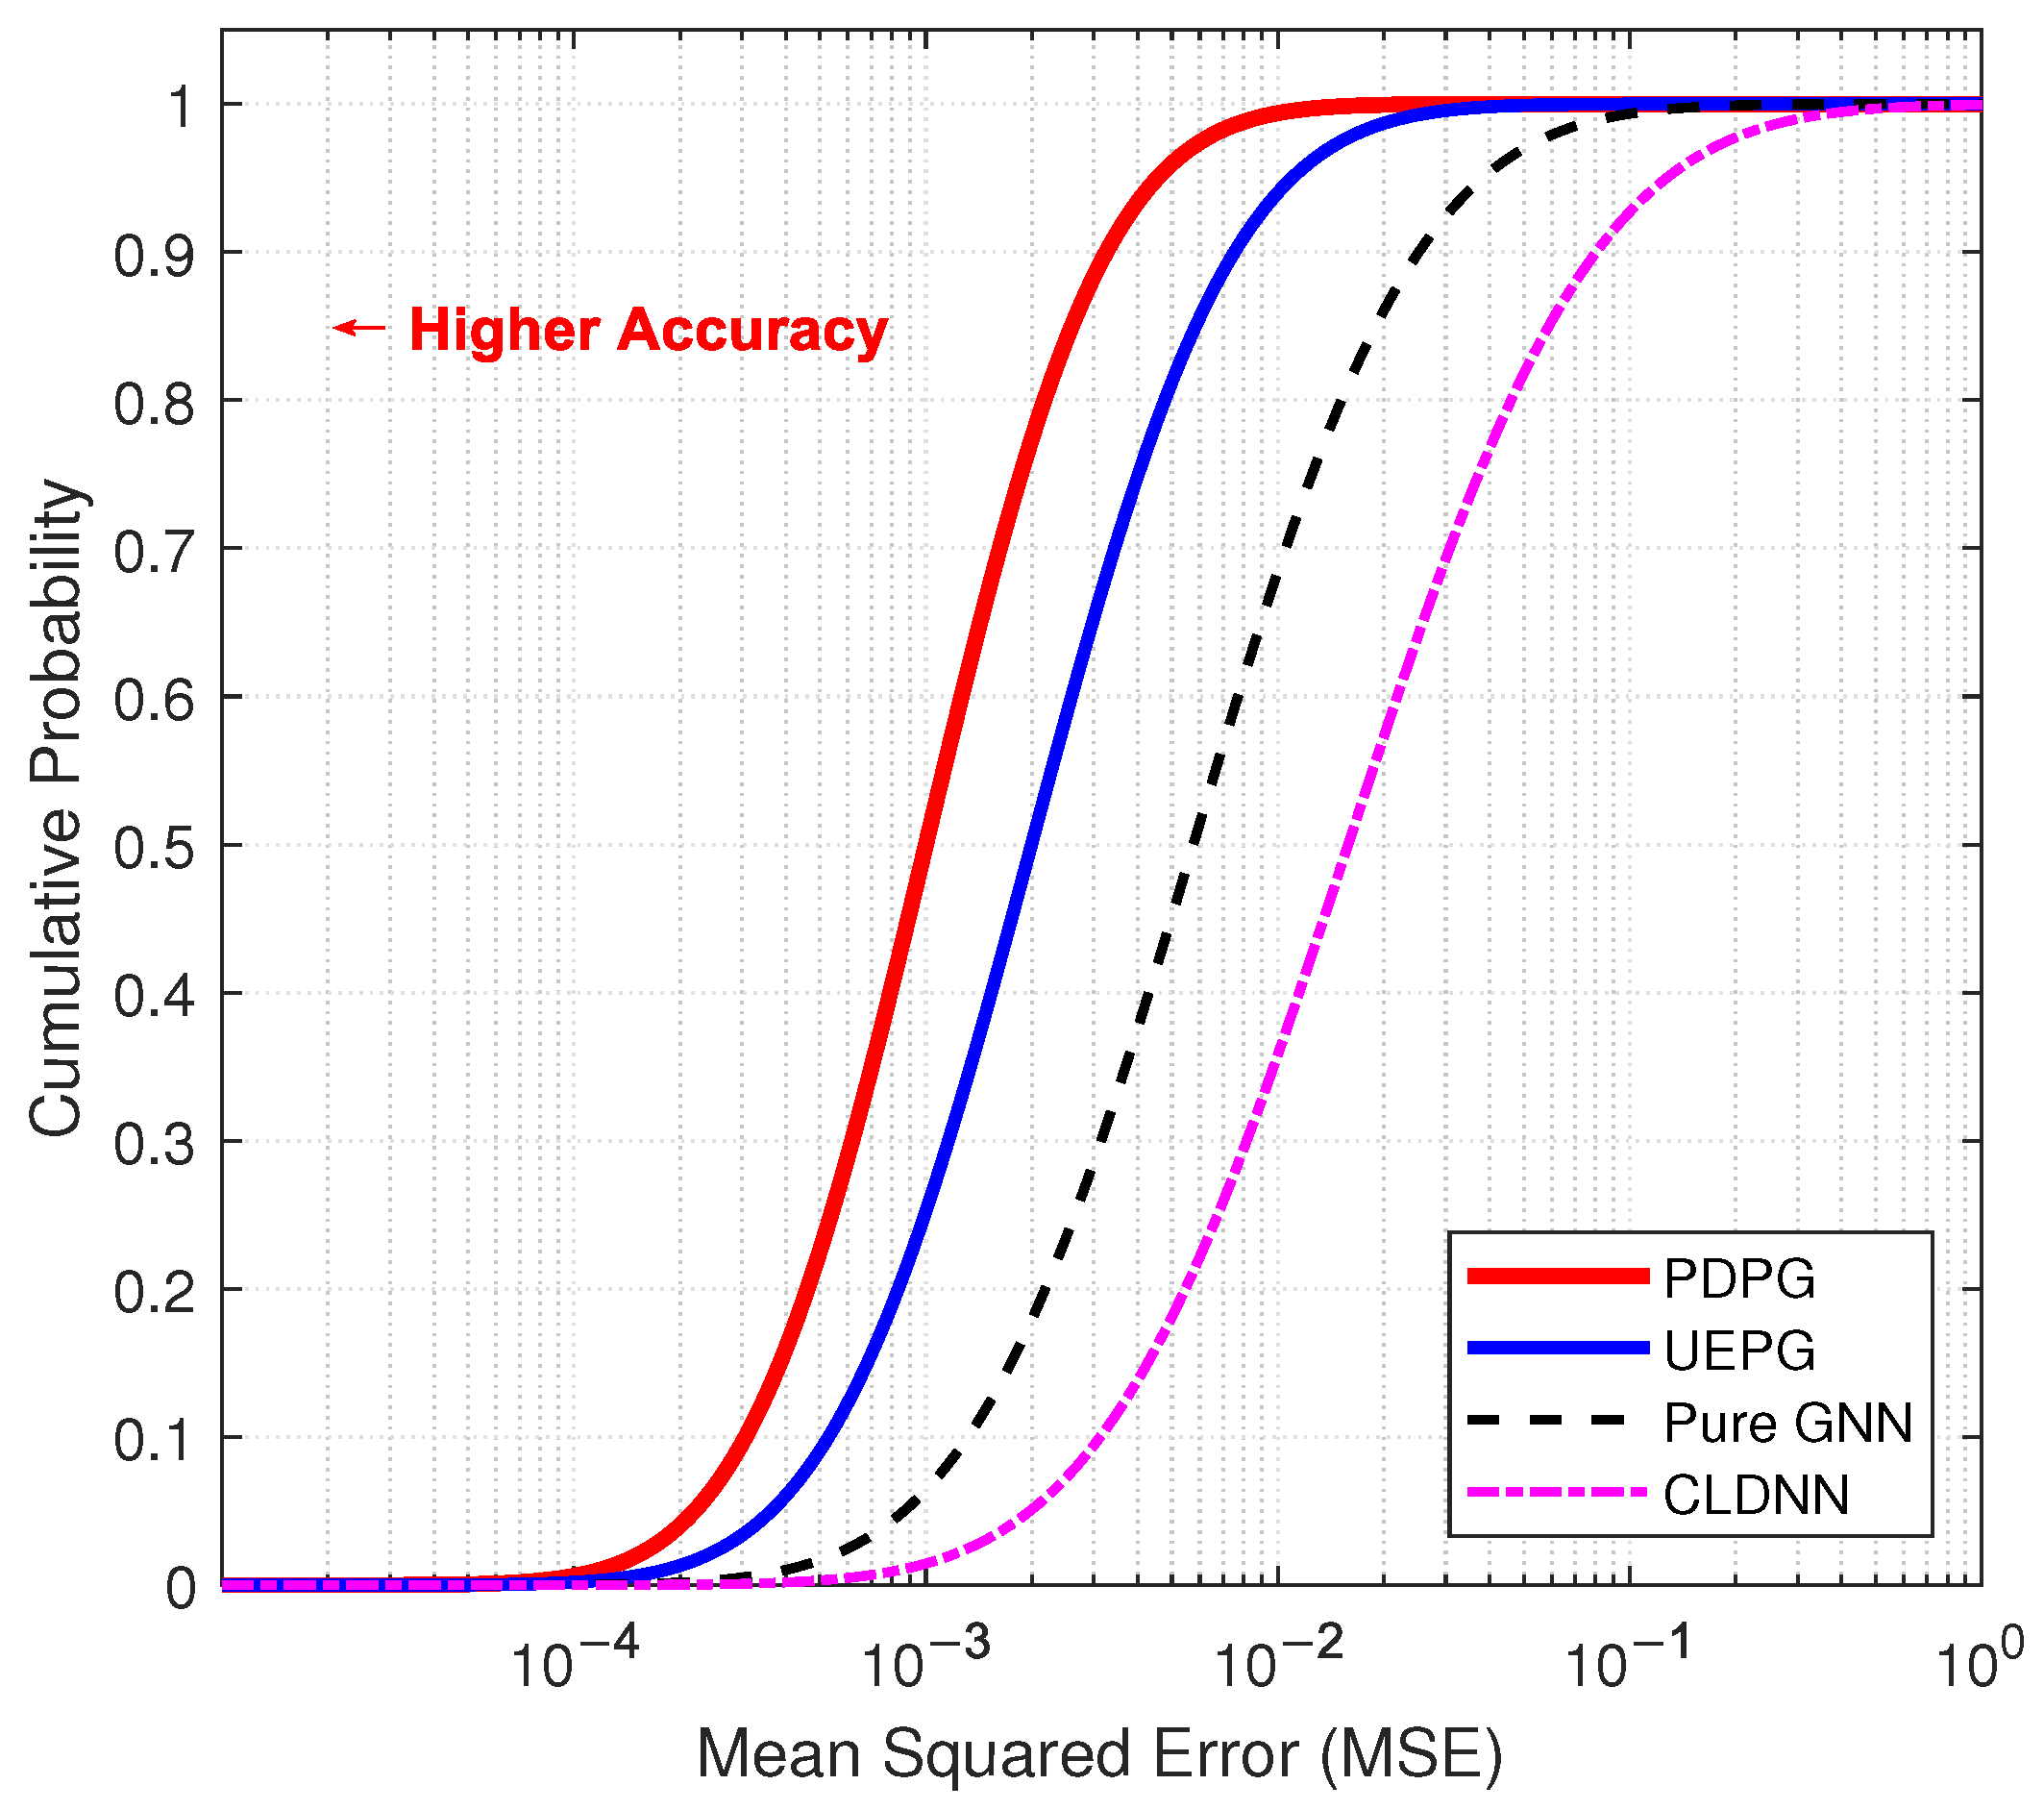
Figure 4 presents the cumulative distribution function (CDF) curves of prediction MSE for the proposed methods and the baselines. As indicated by the direction of the label “Higher Accuracy”, a leftward shift of the CDF curve signifies superior prediction performance, as it means a higher proportion of samples exhibit lower prediction errors.
The CDF curves clearly separate the methods by their prediction accuracy, with a leftward shift indicating superior performance. The PDPG curve lies furthest to the left, reaching a cumulative probability of 1.0 at an MSE below
. The UEPG curve shifts slightly to the right of PDPG, indicating that the fixed physical aggregation formula in PDPG is more effective than the learnable aggregation module. The Pure GNN and CLDNN curves both lie significantly to the right, with CLDNN showing the slowest accumulation and reaching full probability near an MSE of
. These results are consistent with the quantitative findings in
Table 4, confirming that the full PINN-GNN architecture yields the most accurate and robust predictions. Collectively, the analysis demonstrates that both the graph-based spatial modeling and the physics-informed regularization are critical to achieving superior prediction performance.
Compared with CLDNN, both graph-based models achieve lower prediction errors, demonstrating the effectiveness of modeling spatial dependencies among data center devices. More importantly, PDPG consistently outperforms Pure GNN, indicating that the introduced physics-informed constraints provide complementary information beyond graph representation learning alone. These results indicate that both graph representation learning and physics-informed regularization are indispensable for achieving high prediction accuracy in complex data center environments.
4.3. Ablation Study
To evaluate the contribution of each component in the proposed framework, we conducted systematic ablation experiments on both PDPG and UEPG. The following variants were compared against the full model: removal of the energy balance constraint only, removal of the thermal evolution constraint only, removal of both physics constraints (pure GNN), removal of the entire GNN structure (MLP baseline), replacement of the GAT encoder with a standard GCN, and replacement of the physics-based adjacency matrix with a random graph structure.
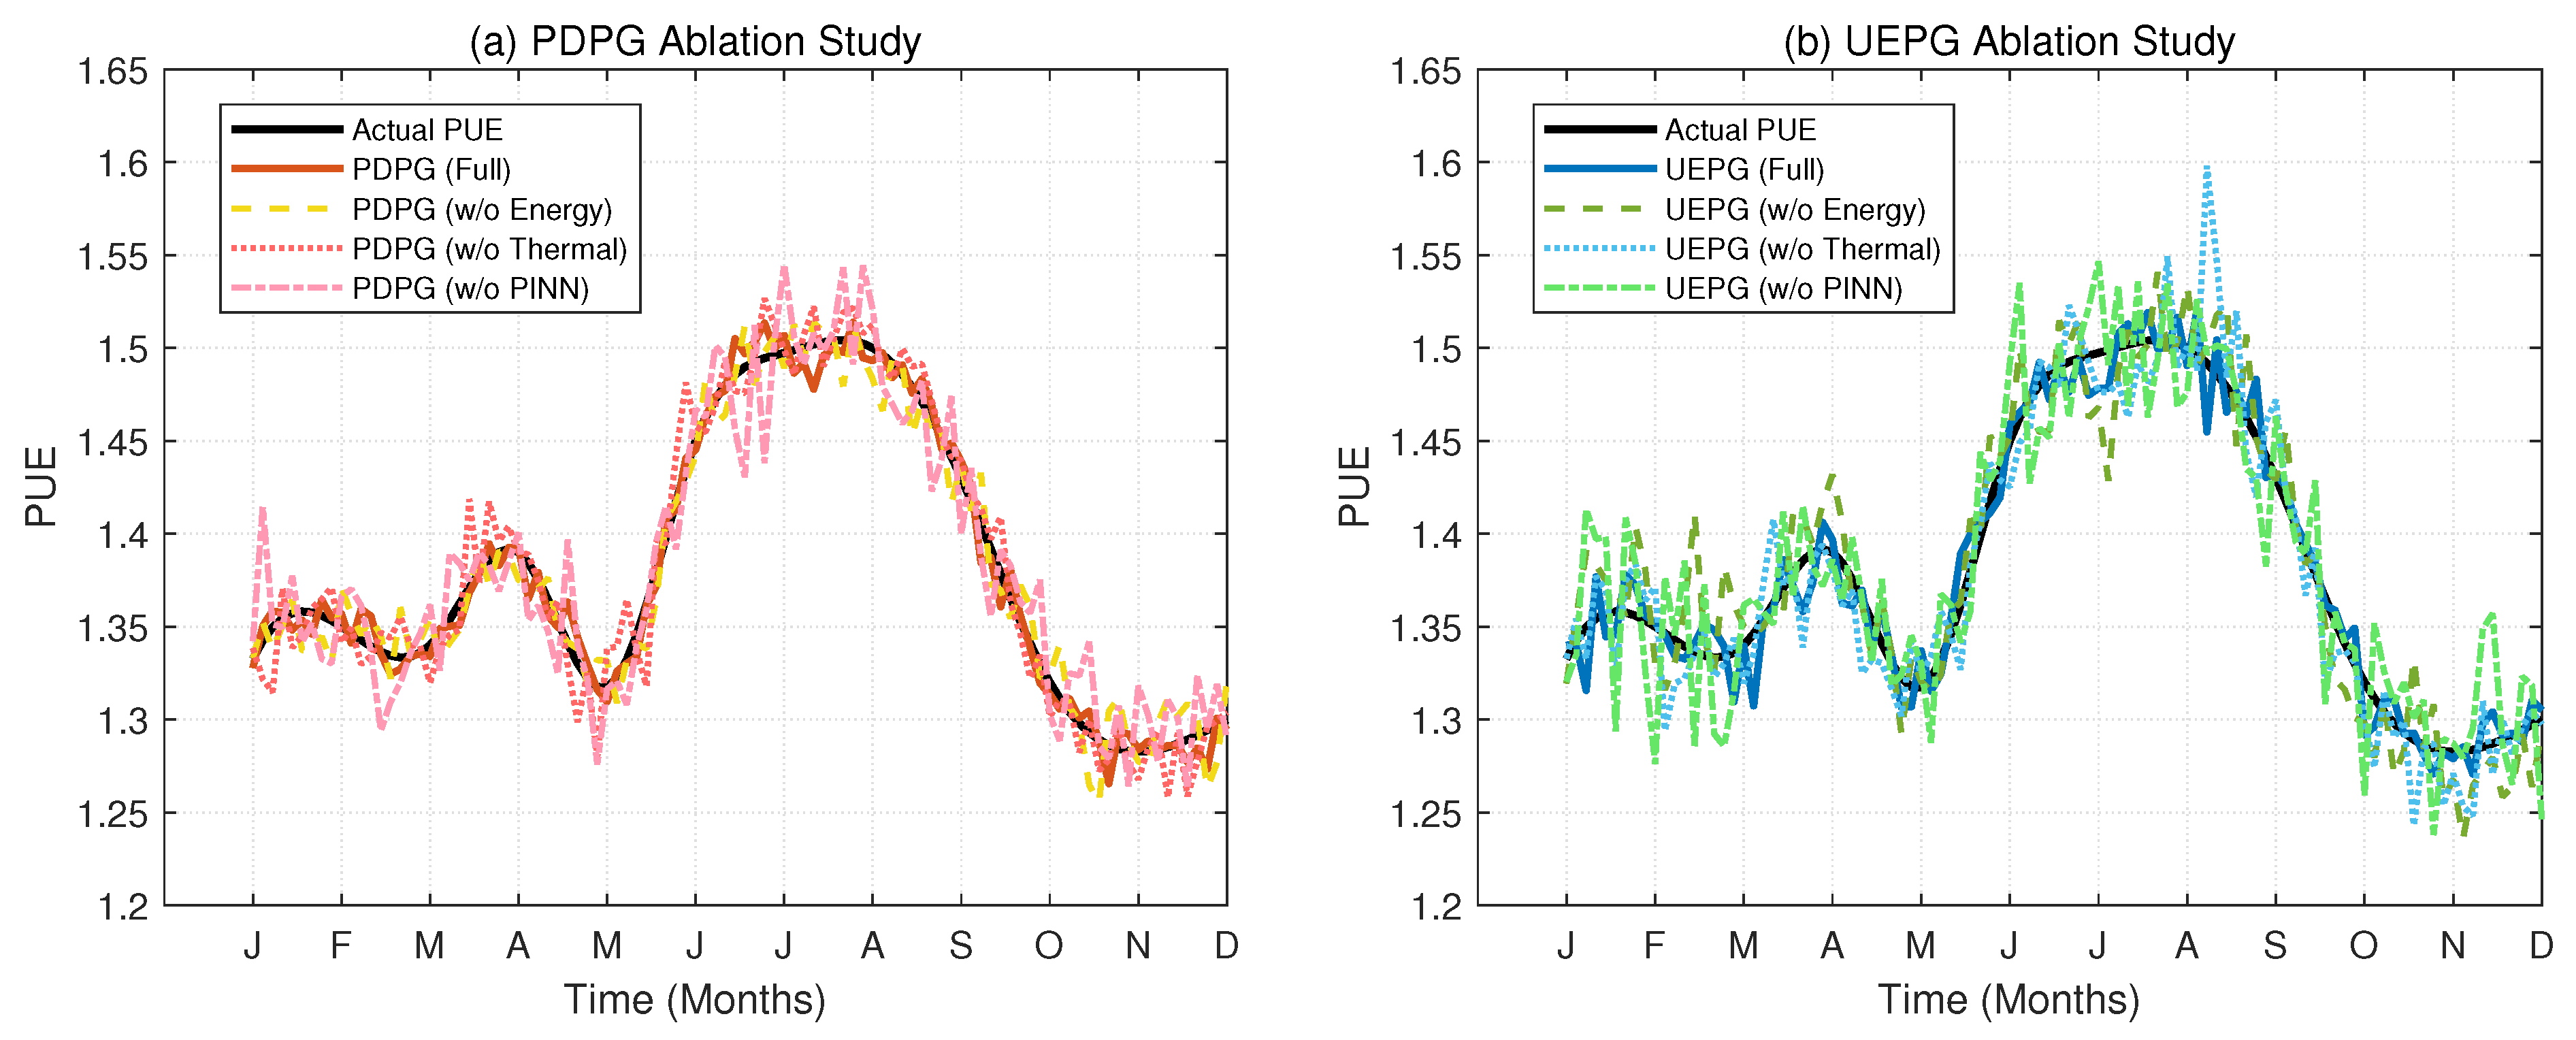
Table 5 reports the complete ablation results for all variants, and
Figure 5 presents the prediction curves for representative variants to visualize the performance differences.
Removing the energy balance constraint or the thermal evolution constraint individually degrades prediction accuracy, with the thermal constraint showing a larger impact. Removing both constraints yields a substantially larger performance drop, confirming that the physics-informed regularization contributes significantly beyond the GNN architecture alone. Replacing GAT with GCN leads to a clear increase in MSE, demonstrating the advantage of the attention mechanism in capturing spatial dependencies. When the physics-based adjacency matrix is replaced with a random graph structure, the MSE increases to a level comparable to removing the PINN constraints, indicating that the graph construction based on physical adjacency and thermal coupling is essential. The MLP baseline results in the largest error among all variants, confirming the necessity of graph-based spatial modeling.
The ablation results further explain the performance gains observed in
Section 4.2. Removing either the energy proportionality constraint or the thermal evolution constraint leads to a noticeable increase in prediction error, indicating that the two physical constraints provide complementary information. These findings confirm that the superior performance of PDPG is not merely due to increased model complexity but results from the effective integration of graph representation learning and physics-informed regularization.
4.4. Generalization and Robustness Analysis
To evaluate the generalization capability of the proposed model, we conducted cross-site and cross-time tests. For cross-site generalization, we trained the model on the Guian cluster comprising 18,234 samples and tested it on the Hohhot cluster comprising 11,803 samples. PDPG achieved an MSE of , which remains significantly lower than the within-site MSE of CLDNN at . This indicates that physics-informed constraints help the model generalize across different climate conditions. For cross-time generalization, we trained on samples from 2018 to 2020 and tested on samples from 2021 to 2022. PDPG achieved an MSE of , demonstrating that the model captures underlying physical relationships rather than memorizing seasonal patterns.
We further analyzed the sensitivity of the proposed model to the hyperparameters
and
, which balance the contributions of the energy balance constraint and the thermal evolution constraint, respectively.
Table 6 reports the MSE as a function of
with
fixed at 1.0, and as a function of
with
fixed at 0.1. The model remains stable for
in the range of 0.05 to 0.5 and for
in the range of 0.5 to 2.0. Performance degrades when
is too small because the energy constraint becomes ineffective or too large because it dominates data loss. Similarly, excessive
forces the model to overemphasize thermal smoothness, reducing responsiveness to actual temperature variations. The current values of
= 0.1 and
= 1.0, selected via grid search on the validation set, are within the stable region and yield near-optimal performance.
From the above results, three main observations can be drawn. First, PDPG consistently outperforms UEPG, suggesting that when the underlying physical relationship is already well-defined by a deterministic formula, embedding this knowledge as a fixed aggregation mechanism is more effective than learning it from data. Second, the performance gap between the full model and the variants without physics constraints indicates that the proposed PINN-GNN framework benefits from the synergy between spatial dependency modeling and physical consistency enforcement, rather than from either component alone. Third, the model’s competitive performance under cross-site and cross-time settings confirms that the physics-informed constraints help capture transferable physical principles instead of memorizing environment-specific patterns. These findings collectively demonstrate the effectiveness and validity of the proposed PINN-GNN framework, suggesting that incorporating domain knowledge into neural network design offers a practical pathway toward accurate, physically consistent, and generalizable energy efficiency prediction.