Article

Strategic Choices of Carbon Trading Modes for Competing Manufacturers Under the Cap-and-Trade Policy

1
Digital Intelligence Management Research Institute, Shanghai University of Finance and Economics Zhejiang College, Jinhua 321015, China
2
Xingzhi College, Zhejiang Normal University, Jinhua 321100, China
*
Author to whom correspondence should be addressed.
Mathematics 2026, 14(13), 2441; https://doi.org/10.3390/math14132441
Submission received: 18 April 2026 / Revised: 26 June 2026 / Accepted: 29 June 2026 / Published: 7 July 2026
(This article belongs to the Special Issue Applications of Mathematical Methods in Economics and Finance)

Abstract

Confronted with the constraints of global carbon reduction mandates and the widespread implementation of cap-and-trade (CAT) policy, competing manufacturers face critical choices in carbon quota trading, such as engaging in external markets or internal agreements. We develop a duopolistic game model comprising a low-carbon manufacturer (MG) and a traditional manufacturer (MT) under a CAT framework. In a perfect carbon quota trading market, manufacturers simultaneously cooperate and compete, facing a strategic choice between external trading through the open carbon market and internal trading agreements. We investigate how the low-carbon development level, carbon quota surplus, and internal carbon price affect their choices of carbon quota trading modes. Analytical results indicate that in the scenario where MG’s quota surplus is insufficient to fully meet MT’s demand, both manufacturers can achieve Pareto improvement in their respective profits within a certain range of internal carbon prices. Otherwise, the internal trading agreements may only guarantee an increase in their aggregate profits. A numerical analysis based on the actual situation of China’s steel industry verifies the theoretical conclusions.

1. Introduction

Since the Industrial Revolution, the continuous accumulation of global carbon emissions has intensified climate change, posing an unprecedented threat to ecological stability and human well-being. In alignment with the establishment of the United Nations Sustainable Development Goals (SDGs), nations worldwide are advancing carbon reduction regulatory frameworks such as the cap-and-trade (CAT) [1]. The CAT policy is a market-oriented mechanism in which governments impose a limit, or “cap”, on firms’ carbon emissions. Firms can then buy or sell allowances based on their actual emissions, a process known as the “trade” [2]. This mechanism enables firms to identify the most cost-effective emission reduction strategies, offering a market-driven approach that simultaneously ensures compliance with overall environmental targets. The CAT policy has been implemented in regions including Europe, South Korea, parts of the United States, and China. Notably, the European Union operates one of the most extensive carbon markets worldwide through its Emissions Trading System (EU-ETS) [3,4]. China established its national ETS in 2021, initially targeting the power sector. In 2024, the Interim Regulations on the Administration of Carbon Emission Trading were officially implemented, further clarifying the framework of its carbon trading system [5,6].
As a major source of global emissions, the manufacturing sector relies heavily on fossil fuels for energy-intensive operations, making it a key target for CAT implementation [7]. Emission-control manufacturers operating under the CAT mechanism are required to factor carbon emission constraints into their production strategies to align with global climate goals [8]. They must buy additional allowances if their emissions exceed the limit allocated by the government, or they can sell their surplus allowances. Globally, leading corporations have actively participated in carbon markets through distinct strategies. For instance, Siemens aligns its internal carbon pricing with the EU-ETS, Tesla generates substantial revenue via carbon credit sales, and China Baowu Steel Group leverages technology to achieve allowance surpluses [9,10]. Essentially, the CAT mechanism not only incentivizes emission reductions but also stimulates manufacturers’ strategic low-carbon investments and new business modes. Additionally, with the enhancement of consumer environmental consciousness, the low-carbon transition of the manufacturer can be converted into carbon assets, providing a distinct competitive advantage over industry peers. In particular, environmentally aware consumers increasingly demonstrate a preference for low-carbon products certified by recognized third-party standards or official ecolabels (e.g., EU Ecolabel, China Emission Reductions) [11,12]. Consequently, products with lower carbon footprints are more likely to gain consumer favor, capture market share, and achieve higher sales volumes.
The low-carbon transition offers significant potential to enhance manufacturers’ competitiveness, yet it necessitates substantial investments. As a result, many manufacturers are reluctant to proactively adopt innovative low-carbon production technologies [13,14]. Indeed, manufacturers’ application of low-carbon technology incurs not only fixed costs such as technology research and development (R&D), equipment investment, and talent introduction, but also elevated marginal production costs [15]. For instance, the cost of producing a gallon of oil in Bp Amoco will rise by 5–6 cents after using a sulfur-reduction technology [16]; implementing advanced desulfurization technologies can increase operational expenditures by 5–8% in the petroleum sector [17]. Apparently, manufacturers adopting low-carbon production methods (the low-carbon manufacturer, hereafter referred to as MG) may face competitive disadvantages in the short run due to elevated expenses. In contrast, manufacturers that continue to rely on traditional technologies (the traditional manufacturer, hereafter referred to as MT) can avoid such additional expenditures and maintain a competitive position based on lower operating costs. Therefore, the competitive dynamics between MG and MT warrant sound examination, especially as an increasing number of manufacturers undertake the low-carbon transition for sustainable development [18].
Despite their competitive relationship, MG and MT can find avenues for cooperation within the CAT framework, particularly through practices such as carbon quota trading. MG would normally be the quota seller while MT acts as the buyer. Thus, MG and MT have two viable carbon quota trading modes to choose from: (i) external trading, which refers to exchanging allowances solely in the open carbon market, and (ii) internal trading, where they trade quotas at an internal carbon price. In the external trading mode, MG and MT are in a state of pure competition. The internal trading mode enables them to cooperate based on the internal carbon price, thereby mitigating profit losses resulting from market competition. Such a strategic approach aligns with the concept of “coopetition” [19,20,21].
In practice, direct allowance trading between horizontal competitors is fully viable under the CAT framework, owing to the homogeneous nature of carbon allowances as standardized tradable commodities. International carbon market practices demonstrate that supply-demand imbalances in carbon allowances constitute the fundamental driver of carbon trading, as low-carbon manufacturers generate revenue by selling surplus allowances, while traditional ones purchase allowances to comply with mandatory carbon regulatory requirements set by authorities. China’s national carbon market adopts the core CAT regulatory paradigm, and a full-coverage digital system has been built to deliver reliable data governance to support direct allowance trading.
Nevertheless, this institutional feasibility does not imply the absence of practical obstacles; horizontal carbon trading between competitive manufacturers still faces multiple real-world constraints. China’s low-carbon industry remains in its infancy. Insufficient technological maturity and limited external supporting capacity constrain manufacturers’ emission reduction intentions. The cost gap between low-carbon and traditional manufacturing further diminishes manufacturers’ economic incentives to pursue voluntary low-carbon transitions. In addition, consumers’ environmental awareness requires further improvement. Their limited willingness to pay premium prices for eco-friendly products fails to establish an effective downstream cost transmission channel, indicating that additional green production costs cannot be offset through higher product pricing.
Considering the background described above, this study investigates the strategic choices of carbon quota trading modes in a duopolistic market consisting of low-carbon and traditional manufacturers (MG and MT) under a CAT framework. We attempt to achieve the equilibrium strategies of emission reduction, marketing pricing for respective products of competing manufacturers, as well as the corresponding environmental performance and economic benefits. Specifically, we formulate the following research questions.
(1)
Given the differences in production costs and the varying difficulties in reducing emissions, can MG and MT reach a mutually beneficial internal carbon quota trading agreement, rather than relying solely on external carbon markets?
(2)
Which factors influence the formation of such an internal trading agreement? How do the factors affect the manufacturers’ decisions?
(3)
In the context of a successfully established internal trading agreement, how should MG and MT set the internal carbon price, and how does this price work to improve the economic benefits and environmental performance?
To address these questions, we adopt Cournot game models to investigate competing manufacturers’ strategic choices between external and internal carbon quota trading modes. Among these, the internal trading mode can be further classified into two scenarios: (i) Quota insufficiency, where MG’s carbon surplus is insufficient to meet MT’s demand after the trade, and (ii) Quota sufficiency, where a quota surplus remains with MG after fully satisfying MT’s quota demand. Based on the model solutions and analyses, we examine the impacts of production cost differences between MG and MT, the carbon prices under different trading modes (external vs. internal), the difficulty of emission reduction, carbon quotas imposed by the government, and consumers’ low-carbon awareness, on manufacturers’ strategies. We also compare the manufacturers’ emission reduction decisions, outputs, prices and profits across alternative trading modes, to identify the preferred modes with their respective conditions.
The remainder of this paper is structured as follows. Section 2 provides an overview of the literature to support the positioning of this paper. Section 3 presents problem characteristics, assumptions, and theoretical models. Section 4 focuses on the discussion results by analyzing and comparing the equilibrium solutions and profits of the two duopolistic manufacturers under different carbon trading modes. It further derives the conditions for manufacturers to enter into an internal trading agreement. In Section 5, a numerical example emerges with reference to China’s steel industry. The conditions under which manufacturers choose the internal trading mode and the impact of different internal carbon prices on manufacturers’ profits and total emissions are further analyzed. Section 6 summarizes the key conclusions and policy implications, and proposes directions for future research.

2. Literature Review

With an increasing focus on carbon reduction and environmental preservation, carbon regulations and sustainable operations management have attracted significant attention. We limit our review to two streams of literature closely related to the topic of interest: (i) carbon regulations on sustainable operational strategies, and (ii) cooperation and competition of enterprises under carbon regulations.

2.1. Carbon Regulations on Sustainable Operational Strategies

Extensive research has studied carbon regulations such as carbon quotas, carbon taxes and subsidies, and carbon trades, which have been implemented globally [22,23,24]. Wang et al. [25] analyzed the interplay of carbon taxes and subsidies in prefabricated construction supply chains, demonstrating that carbon taxes are more effective in reducing emissions and in balancing responsibilities and benefits among channel members. Hua et al. [26] examined a firm’s equilibrium strategies under the carbon tax (CT) and cap-and-trade (CAT) policies, in conjunction with the impending carbon border tax (CBT), which is designed to mitigate emission leakage from cross-regional production. Khan et al. [27] compared the effectiveness of CT and CAT in terms of emission reduction, emphasizing the advantages of CAT in further reducing emissions at a potentially lower cost.
To mitigate carbon emissions, the CAT mechanism has proven highly effective and is regarded as one of the most successful policy instruments. As a market-based mechanism, CAT provides enterprises with flexibility to trade emission quotas while complying with regulatory constraints [5,28,29]. Existing literature has examined the operational effects of CAT, including its impacts on firms’ production and pricing decisions [30], supply chain coordination [31,32], and environmental initiatives and performance [33,34]. Dye and Hsieh [35] formulated a joint dynamic pricing and advertising model under a CAT framework, finding that higher carbon prices lead to elevated product prices but diminished advertising efforts. Zhang et al. [36] proved that the CAT policy is conducive to company economics and sustainable development by proposing a four-party logistics network design and corresponding algorithm solutions. Nguyen et al. [37] demonstrated that higher carbon prices can invigorate airlines to improve their eco-productivity, whereas persistently low prices may deter investment in green technologies due to insufficient returns. Considering CAT and echelon utilization of spent power batteries, Zhang et al. [38] proposed four battery collection modes via game theory. Their results identify impacts of emission reductions on the manufacturer’s mode selections and the role of echelon utilizers in enhancing the manufacturer’s profit. Extant literature commonly assumes that firms face no constraints when buying or selling emission allowances in the external markets. While simplifying the analysis, this assumption fails to capture the strategic dynamics of oligopolistic firms. In contrast, this study assumes that manufacturers can trade carbon allowances directly with competitors via internal trading agreements, while the external trading price is determined exogenously. Considering the impacts of external and internal trading prices simultaneously, we shed light on the interactions between competing manufacturers in both the emission trading market and the product market.

2.2. Corporate Cooperation and Competition Under Carbon Regulations

In the context of carbon regulations, cooperative initiatives enable enterprises to complement environmental technology, optimize resource allocation and share costs and benefits, thereby fostering carbon reduction and sustainable competitiveness [39,40]. Many scholars have noted that enterprises are increasingly leveraging cooperative R&D to attain market competitiveness and ensure supply chain sustainability [41,42]. Feng et al. [43] and Tao et al. [44] affirm that environmental cooperation within supply chains improves both environmental and economic benefits, which is critical for the viability of circular economy initiatives. Considering carbon reduction imperatives, Liu et al. [45] proposed a cooperative model for the abatement investment among agricultural supply chain members. Zhang et al. [46] investigated the impact of cooperative implementations between two manufacturers on the production strategies for low-carbon products. Liu et al. [47] examined a manufacturer’s cooperation with a technology firm in developing low-carbon technologies, specifically through linear fees or revenue-sharing contracts. Li et al. [48] probed into the cooperation of firms’ environmental innovation in a supply chain under CT and CAT.
The effect of competition on corporate decisions within carbon regulation regimes has also been explored [49,50,51]. Ji et al. [52] analyzed how CAT regulation and consumer low-carbon preference impact pricing and carbon reduction rates of competing manufacturers with differentiated products, finding that CAT enforcement does not guarantee higher reduction rates, lower emissions, or greater social welfare. To investigate the impacts of misrepresentation of carbon emissions and blockchain technology on the production process among competing manufacturers, Ran and Duan [53] developed three supply chain models based on various blockchain adoption strategies and analyzed the equilibrium decisions for each competing manufacturer. Li et al. [54] contended that when carbon prices are relatively low, manufacturers prefer the platform to share demand information with their competitors rather than with themselves.
Emerging research highlights the integration of cooperation and competition, thereby promoting research on coopetition and its impact on corporate strategies and performance under carbon reduction pressures [55,56]. Rahmani et al. [57] and Saha and Nielsen [58] considered not only channel coopetition but also cross-chain collusion among manufacturers. Yang [59] analyzed panel data from the automotive industry to explore how manufacturers use supplier relationship management to drive new product development under vertical coopetition. Yu et al. [60] developed a coopetition differential game between a private-label retailer and a national-brand manufacturer under carbon trading policy. To clarify the dynamic behavioral strategies of local governments and homogeneous energy enterprises, Zhang et al. [61] employed a game-theoretical model to explore coopetition between a traditional thermal electricity generator and a renewable one under CAT policy, indicating that a CAT framework results in lower electricity prices under relatively loose carbon emission constraints. Shang et al. [62] addressed coopetition between green and non-green supply chains under a policy mix involving government subsidies and carbon taxes to consumers.

2.3. The Distinctiveness of This Study

Most relevant research has primarily investigated the influence of vertical coopetition, or focuses on the coopetition initiatives within supply chains, while the role of horizontal coopetition has been largely overlooked. Zhou et al. [63] proposed a tripartite evolutionary game model grounded in the significance of horizontal coopetition and governmental regulation for low-carbon technological innovation; however, they failed to incorporate the CAT policy context. Dong and Wu [64] investigated how competing firms make technology choices (clean technology vs. traditional technology) and production decisions by adopting a two-stage game-theoretical model to analyze firms’ response to CAT regulations, but did not consider differentiated carbon quota trading modes (external and internal). In contrast, this study, fully integrating the actual operational scenarios of manufacturers, clarifies that competitive manufacturers can not only conduct external trading in the carbon market but also carry out internal carbon quota trading among themselves. Meanwhile, we further refine internal trading modes and divide them into different scenarios based on whether the carbon quota provider can sufficiently meet the needs of the recipient, enriching the research dimensions of carbon quota trading modes. Table 1 further helps position our research in the literature and pinpoint the research gaps.
This study focuses on the strategy choices of horizontally competitive manufacturers on internal and external transaction modes under the CAT policy. Among these, we combine different emission intensities and production costs of manufacturers to conduct a sound analysis of the specific impacts of key factors regarding carbon quota surplus, emission reduction difficulty, the relative carbon trading price between external and internal modes and consumers’ low-carbon preference on manufacturers’ carbon-trading mode selection, emission reduction, product pricing and production decisions. Through theoretical modeling and numerical analysis, we derive the equilibrium solutions of operational decisions, clarify the prerequisite conditions and critical thresholds, and elaborate the corresponding economic benefits and environmental performance.

3. Problem Description and Model Development

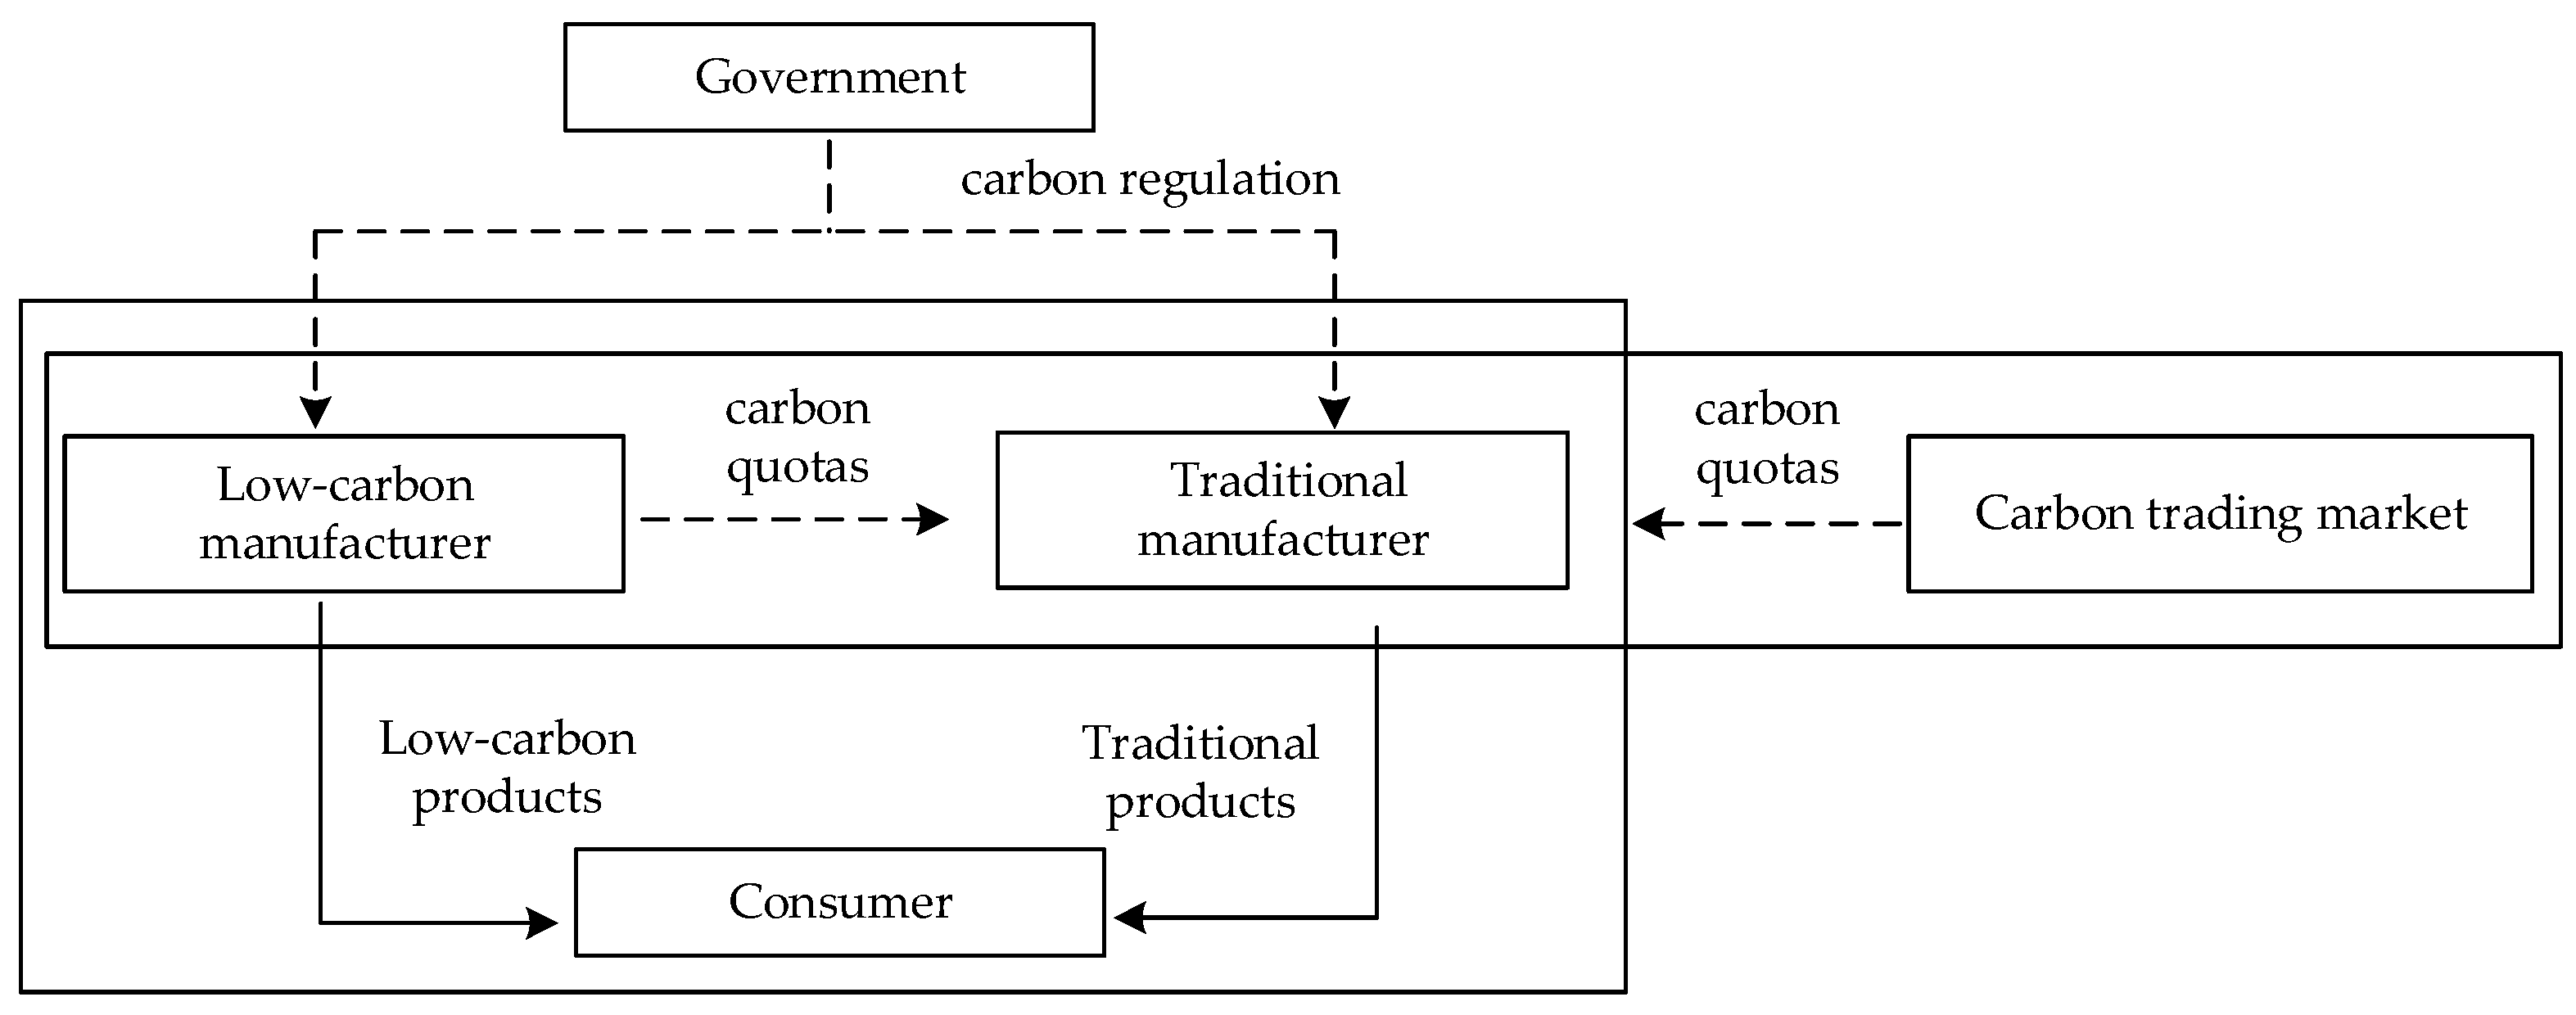
In this section, we consider a coopetition model of two duopolistic manufacturers comprising MG and MT under CAT regulation (as shown in Figure 1). MG, as a low-carbon pioneer in the industry, has accomplished its low-carbon transition and obtained low-carbon certification from competent authorities. With the gradual enhancement of consumers’ low-carbon awareness, MG will further conduct low-carbon technology R&D based on its current low-carbon production capacity to reduce emission intensity, improve its competitiveness and realize sustainable development. MT, on the contrary, opts against low-carbon transition and thus maintains a relatively high emission intensity.
Both manufacturers are subject to emission constraints and enjoy the same market power, thus forming a Cournot competition relationship. To comply with carbon regulations under the government-imposed carbon quotas of E g and E t , respectively, the two manufacturers should rationally adjust their production and quota trading volumes based on their individual actual situations, with MG determining its optimal emission reduction strategies. There are two modes of quota trading: external and internal, with their respective carbon quota prices being p e E and p e I . Internal trading between the two manufacturers, based on their respective quota consumption, can be further subdivided into two scenarios: (i) Quota insufficiency, which occurs when MG sells all its remaining quotas to MT yet fails to cover MT’s demand, (ii) Quota sufficiency, which constitutes the scenario where a quota surplus remains with MG after fully satisfying MT’s quota demand.
The following assumptions are made to ensure the precision and validity of the model.
Assumption 1.
MG and MT produce homogeneous products, with their only distinction lying in the carbon emission intensity of production. Take two types of Tesco orange juice as an example, namely 100% freshly squeezed juice and long-life juice, which share identical core attributes yet differ markedly in carbon emissions. The former incurs a carbon footprint of 360 per 250 mL due to required cold-chain logistics and bulky packaging. In comparison, concentrated long-life juice uses lightweight packaging and ambient-temperature transportation to achieve a much smaller carbon footprint at 260 per 250 mL [65]. Let the carbon emissions per unit of product produced by MG and MT be  e _ g  and  e _ t , respectively, subject to the constraint  e _ g < e _ t .
Assumption 2.
c g  and  c t  are defined as the manufacturing costs per unit of product of MG and MT, respectively. The production of low-carbon products entails higher costs for MG than MT ( c g > c t  and  c g c t = Δ c > 0 ), as it requires cleaner energy, environmentally friendly materials, and other emission-reduction investments [66,67]. For simplicity, we assume that  c t = 0 , thus resulting in  c g = Δ c . Generally, when MG’s technical level and efficiency in low-carbon production are relatively low,  Δ c  is relatively high, and vice versa.
Assumption 3.
e _ g  of MG’s initial emission intensity reflects the emission standard required by the low-carbon label-granting agency. It can be reduced to  e g  by introducing new emission-reduction technologies with an associated cost  η e _ g e g 2 / 2  [9,68,69], where  e = e _ g e g  denotes the level of emission reduction,  η  represents the cost coefficient of further emission reduction. The value of  η  reveals the development level of emission-reduction technology in the industry and, to some extent, reflects the difficulty of emission reduction. Generally, in the early stage of the low-carbon transition in industry, only a few manufacturers can meet the emission standards required by the low-carbon label-granting agency, leading to  η . As relevant technologies advance and achieve widespread adoption,  η  will increasingly decrease [70].
Assumption 4.
p g  and  p t  are deemed as market prices for per unit of product determined by MG and MT, respectively.  k  represents consumers’ low-carbon awareness,  k ( 0 , 1 ) . Consumers’ willingness to pay (WTP) for low-carbon products is denoted by  v , which is uniformly distributed in  [ 0 , 1 ] . Thus, consumers obtain utilities  U g  and  U t  from purchasing products from MG and MT, respectively, with  U g = v p g + k e ,  U t = ( 1 k ) v p t . Obviously,  k  exhibits a positive impact on  U g  and a negative correlation with  U t . We find evidence in practice that low-carbon labels enable consumers to identify products’ carbon emission information, thus motivating environmentally conscious consumers to purchase such products.
The total population of consumers is normalized to 1. To ensure demand exists for both products in the market, we assume that  1 k p g k e > p t  and  p g p t k e / k < 1 , should be satisfied. Combining the expressions of  U g  and  U t , we obtain inverse demand functions as follows [71,72,73].
p g = 1 q g 1 k q t + k e
p t = 1 k 1 q g q t
Assumption 5.
Given that a manufacturer’s carbon emission is proportional to its output [74,75], the emissions from MG and MT, along with the total emissions, expressed by  C E G ,  C E T  and  T C E , respectively, can be achieved as follows.
C E G = e _ g e q g C E T = e _ t q t T C E = C E G + C E T
Assumption 6.
p e I  is defined as the internal trading price of carbon quotas between MG and MT, which is formulated as an exogenous parameter rather than an endogenous bargaining variable. In practice, an individual manufacturer cannot independently determine the internal carbon trading price,  p e I  is benchmarked against the external carbon price [76], and its equilibrium level is dominated by exogenous constraints such as carbon caps and abatement costs [77]. The internal carbon price is essentially determined by exogenous factors including external market conditions and total carbon quotas. Thus, carbon price exogenization is a standard modeling paradigm in supply chain carbon management studies [78,79,80]. This modeling specification helps us eliminate redundant computational complexity and concentrate on the core research objectives of this paper.
All notations are listed in the following Table 2.

3.1. External Trading Mode (Model E)

In Model E, MG and MT only buy and sell quotas in the external carbon market. The decision-making proceeds in two stages. MG first decides on the volume of emission reduction; MG and MT then compete in a Cournot fashion. Their respective profit functions are formulated as follows.
max   { e , q g } π G E = p g Δ c q g η 2 e 2 + E g e _ g e q g p e E
max   q t π T E = p t q t e _ t q t E t p e E
The first term in Equation (4) denotes MG’s product sales revenue. Other terms include the emission reduction costs and the revenue from selling surplus carbon quotas to MT. For Equation (5), the first term is the revenue from selling its products, and the remaining term refers to its purchase of additional carbon quotas from MG.
Having solved the functions, the following proposition is obtained (see Supplementary Materials S1 for the proofs of all propositions, theorems, and corollaries).
Proposition 1.
Equilibrium solutions and profits in Model E can be achieved as follows.
e E * = 4 k + p e E 1 + k 2 Δ c + e _ t 2 e _ g p e E η 3 + k 2 8 k + p e E 2
q g E * = η 3 + k 1 + k 2 Δ c + e _ t 2 e _ g p e E η 3 + k 2 8 k + p e E 2
q t E * = η 3 + k 1 k 1 + Δ c + e _ g p e E 2 e _ t p e E 4 k + p e E 2 1 k e _ t p e E 1 k η 3 + k 2 8 k + p e E 2
p g E * = η 3 + k 1 + k 1 + Δ c + e _ g p e E + e _ t p e E 4 k + p e E p e E + 2 k Δ c + k p e E + e _ t p e E 2 + 2 e _ g k p e E η 3 + k 2 8 k + p e E 2
p t E * = η 3 + k 1 k 1 + Δ c + e _ g p e E + e _ t p e E 1 + k 4 k + p e E 2 1 k + e _ t p e E η 3 + k 2 8 k + p e E 2
π G E * = η 1 + k 2 Δ c 2 e _ g p e E + e _ t p e E 2 η 3 + k 2 8 k + p e E 2 + E g p e E
π T E * = 1 k q t E * 2 + E t p e E
η > η 1 Δ c 1 E Δ c Δ c 2 E  should be satisfied (The mathematical expressions of all threshold values are listed in Supplementary Materials S2).
η > η 1  should be satisfied (MG’s reduction difficulty must be greater than a certain threshold) to ensure that  π G E  is a concave function of  e . This condition holds true in the model, as MG possesses a low-carbon label issued by authoritative certification bodies, indicating its production technology is already industry-leading. As a result, achieving further reductions in carbon emissions presents a significant challenge. In practice, the initial phase of MG’s low-carbon transition is characterized by  η  and  e E * = 0 . As low-carbon technologies mature and diffuse throughout the industry, more sophisticated emission-reduction solutions become available, the value of  η  is expected to decline progressively.
For the cost difference between MG and MT,  Δ c 1 E Δ c Δ c 2 E  is a prerequisite for the proposed model. If the cost difference is too large, i.e.,  Δ c > Δ c 2 E , MG will not enter, leaving MT as the sole manufacturer in the market. In contrast, if the cost difference is narrow, i.e.,  Δ c < Δ c 1 E , MT will exit, and only MG will remain in the market. Only when  Δ c  is in the range of  Δ c 1 E , Δ c 2 E  will MG and MT coexist in the market.
A further analysis of Proposition 1 yields the following corollary.
Corollary 1.
The impacts of production cost difference  Δ c  on equilibrium solutions and profits.
(1) 
For the impacts of  Δ c  on equilibrium productions of manufacturers  q g E * ,  q t E * ,  Q E *  ( Q E * = q g E * + q t E * ), and on volumes of emission reduction  e E * , we have  q g E * / Δ c < 0 ,  q t E * / Δ c > 0 ,  Q E * / Δ c < 0 , and  e E * / Δ c < 0 . A reduction in the cost difference mitigates MG’s capital pressure, consequently strengthening its competitive advantage over MT and raising its production volume. The increased output further turns into greater cost-effectiveness for its emission reduction initiatives.
(2) 
For impacts of  Δ c  on equilibrium product prices  p t E *  and  p g E * , we have  p t E * / Δ c > 0  and the following expressions.
p g E * Δ c > 0 i f   p e E 2 p e E < k < 1   and   η > η ¯ 0   or   0 < k p e E 2 p e E p g E * Δ c 0 i f   p e E 2 p e E < k < 1   and   η 1 < η η ¯ 0  
As the cost difference narrows, the product price of MT will reduce accordingly. MG’s pricing is influenced not only by its production volume but also by its emission reduction efforts, which are additionally affected by consumers’ environmental awareness.
(3) 
For impacts of  Δ c  on profits  π G E *  and  π T E * , we have  π G E * / Δ c < 0 π T E * / Δ c > 0 . With a decreasing cost difference, MG’s production increases and MT’s decreases, positively and negatively impacting their profits accordingly. In addition, when consumers have strong low-carbon awareness and emission reduction is feasible, a narrowing cost difference boosts both total output and emission reductions. Rather than reducing prices, MG counterintuitively leverages consumers’ enthusiasm for low-carbon products to maintain high pricing, thus maximizing profits.
In practice, a declining  Δ c  leads to the continued advancement of MG’s low-carbon production technology, requiring adjustment in its pricing strategy to align with market shifts. Specifically, once MG has mastered the new emission-reduction technology, it should survey its current consumers to gauge their degree of concern for low-carbon labels, which will assist in product pricing. The government should also actively publicize the low-carbon label to protect and promote the local low-carbon industry.

3.2. Internal Trading Modes (Model iI, i = L or H)

If MG and MT sign an internal trading agreement, the situation can be divided into two scenarios based on their carbon-quota position. (i) Quota insufficiency: After selling its excess carbon quotas to MT, MG still cannot meet MT’s demand. (ii) Quota sufficiency: MG’s surplus quotas are more than sufficient to fully meet MT’s requirement. We then discuss these two scenarios in the following by establishing models of Model LI and Model HI, respectively.

3.2.1. “Quota Insufficiency” Scenario (Model LI)

We adopt Model LI to formulate the “quota insufficiency” scenario, namely the situation where MG’s surplus is inadequate to fulfill MT’s demand, alongside the game and trading interactions of the two manufacturers. Internal carbon quota trading is conducted between MG and MT constrained by a formal agreement. MT has priority to purchase MG’s remaining carbon quotas at an internal carbon price of p e I . Since MG can still not meet MT’s demand after sharing all its quotas, MT is compelled to purchase the remaining required quotas from the external carbon market at a price of p e E , to comply with carbon regulations. We have the following formulas expressing the manufacturers’ profits.
max   { e , q g } π G L I = p g Δ c q g η 2 e 2 + E g L ( e _ g e ) q g p e I
max   { q t } π T L I = p t q t E g L e _ g e q g p e I e _ t q t + ( e _ g e ) q g E t L E g L p e E
s . t .   e _ t q t L I * E t L E g L e _ g e L I * q g L I * E g L e _ g e L I * q g L I * > 0
After solving the above problem, the following proposition can be obtained.
Proposition 2.
Equilibrium solutions and profits in Model LI can be achieved as follows.
e L I * = 4 k + p e I 1 + k 2 Δ c + e _ t p e E 2 e _ g p e I η 3 + k 2 8 k + p e I 2
q g L I * = η 3 + k 1 + k 2 Δ c + e _ t p e E 2 e _ g p e I η 3 + k 2 8 k + p e I 2
q t L I * = η 3 + k 1 k 1 + Δ c + e _ g p e I 2 e _ t p e E 4 k + p e I 2 1 k e _ t p e E 1 k η 3 + k 2 8 k + p e I 2
p g L I * = η 3 + k 1 + k 1 + Δ c + e _ g p e I + e _ t p e E 4 k + p e I p e I + 2 k Δ c + k p e I + e _ t p e E p e I + 2 e _ g k p e I η 3 + k 2 8 k + p e I 2
p t L I * = η 3 + k 1 k 1 + Δ c + e _ g p e I + e _ t p e E 1 + k 4 k + p e I 2 1 k + e _ t p e E η 3 + k 2 8 k + p e I 2
π G L I * = η 1 + k 2 Δ c + e _ t p e E 2 e _ g p e I 2 η 3 + k 2 8 k + p e I 2 + E g L p e I
π T L I * = 1 k q t L I * 2 p e E p e I e _ g e L I * q g L I * + E t L p e E + p e E p e I E g L
η > η 2 ,  Δ c 1 L Δ c Δ c 2 L ,  e _ g e L I * q g L I * < E g L e _ t q t L I * + e _ g e L I * q g L I * E t L  should be satisfied.  E g u p p e r L = e _ t q t L I * + e _ g e L I * q g L I *  and  E g l o w L = e _ g e L I * q g L I *  are introduced to denote the upper and lower bounds of MG’s quota quantity, respectively.
In contrast to Proposition 1, equilibrium solutions in Proposition 2 are affected not only by the market carbon price, but also by the internal carbon price. Further observations of all equilibrium solutions manifest that they are unaffected by the total quota allocation  E g  and  E t , under both carbon-trading modes. The total quotas merely influence the manufacturers’ respective profits.

3.2.2. “Quota Sufficiency” Scenario (Model HI)

In a like manner, we employ Model HI for the “quota sufficiency” scenario, where MG’s surplus quotas are more than sufficient to fully meet MT’s requirement. The following presents profit functions and propositions derived from model calculations.
max   { e , q g } π G H I = p g Δ c q g η 2 e 2 + e _ t q t E t H p e I + E g H + E t H e _ g e q g e _ t q t p e E
max   { q t } π T H I = p t q t e _ t q t E t H p e I
s . t . e _ t q t H I * E t H < E g H e _ g e H I * q g H I * e _ t q t H I * E t H > 0
Proposition 3.
Equilibrium solutions and profits in Model HI can be achieved as follows.
e H I * = k + p e E 4 1 + k 2 Δ c 2 e _ g p e E + e _ t p e E e _ t 1 k p e E p e I η 3 + k 2 8 k + p e E 2
q g H I * = η 3 + k 1 + k 2 Δ c + e _ t p e I 2 e _ g p e E + 2 e _ t p e E p e I k + p e E 2 η 3 + k 2 8 k + p e E 2
q t H I * = η 3 + k 1 k 1 + Δ c + e _ g p e E 2 e _ t p e I k + p e E 2 4 1 k + e _ t 1 k p e E 5 k p e I 1 k η 3 + k 2 8 k + p e E 2
p g H I * = η 3 + k 1 + k 1 + Δ c + e _ g p e E + e _ t p e I k + p e E e _ t 1 + k p e E 2 + 4 1 + k + 2 e _ g k + e _ t 3 p e I 2 k k p e I p e E + 2 k 4 Δ c + e _ t p e I η 3 + k 2 8 k + p e E 2
p t H I * = η 3 + k 1 + Δ c + e _ g p e E 1 k + e _ t p e I 1 + k k + p e E 2 1 k 4 + e _ t p e E + e _ t p e I 3 + k η 3 + k 2 8 k + p e E 2
π G H I * = η 1 + k 2 Δ c 2 e _ g p e E + e _ t p e I 2 η 3 + k 2 8 k + p e E 2 e _ t k + p e E p e E p e I 2 2 η 3 + k 2 8 k + p e E 2 p e E p e I e _ t q t H I * + E g H + E t H p e E E t H p e I
π T H I * = 1 k q t H I * 2 + E t H p e I
η > η 1  should be satisfied. If  p e E p e I , then  Δ c 1 H Δ c Δ c 2 H . If  p e E < p e I , then  Δ c 1 H Δ c Δ c 3 H  and  4 1 k + e _ t 1 k p e E 5 k p e I > 0 .
In the early stage of MG’s low-carbon transition, a period characterized by high emission reduction difficulty ( η ), we have the two manufacturers’ equilibrium solutions summarized in Table 3, as derived from Propositions 1–3.
From Table 3, considering that high emission reduction is difficult ( η ), we further analyze the relationship between the equilibrium solutions and the internal carbon price p e I , leading to the following corollary.
Corollary 2.
The impacts of internal carbon price  p e I  on equilibrium solutions.
(1) 
In Model LI, we have the impacts of  p e I  on equilibrium productions of MG and MT, showing as  q g L I * / p e I < 0 ,  q t L I * / p e I > 0  and  Q L I * / p e I < 0 , where  Q L I * = q g L I * + q t L I * . Relations of  p e I  and equilibrium prices are presented as  p g L I * / p e I > 0 ,  p t L I * / p e I > 0 .
From an environmental perspective, we recall the aggregated carbon emissions  T C E  illustrated in Assumption 5. The impact of  p e I  on  T C E L I *  is related to the relative emission intensities of the two products  e _ g ,  e _ t , as reflected in the following formulas.
T C E L I * p e I > 0 , i f   e _ g < e _ t 2 T C E L I * p e I 0 , i f   e _ t 2 e _ g < e _ t
(2) 
With respect to Model HI, impacts of  p e I  on equilibrium productions, market prices and total carbon emissions can be achieved as  q g H I * / p e I > 0 ,  q t H I * / p e I < 0 ,  Q H I * / p e I < 0 ,  p g H I * / p e I > 0 ,  p t H I * / p e I > 0 ,  T C E H I * / p e I < 0 , where  Q H I * = q g H I * + q t H I * .
In Model LI, if the two manufacturers engage in internal trading under a “quota insufficiency” scenario, MG’s equilibrium production and the total output will decline with an increase in the internal carbon price, while MT’s production and the market prices are positively correlated with the internal carbon price. We find evidence in practice that when observing an increase in the internal carbon price that would augment the income from quota sales, rational MG will appropriately reduce output to free up more quotas for trading. MT, in response, will raise production to acquire more market share.
From the standpoint of environmental impact, when the initial emission intensity of the low-carbon product is less than half that of the traditional product, i.e., e _ g < e _ t / 2 , the total carbon emissions T C E L I * will rise with an increase in the internal carbon price p e I . In this context, both manufacturers should endeavor to reach an internal trading agreement with a lower internal carbon price. Such an agreement would improve the social supply of low-carbon products, reduce overall carbon emissions, which is conducive to enhancing corporate image and reputation.
In Model HI, in contrast to Model LI, it is revealed that under the condition of “quota sufficiency”, equilibrium production of MG increases while that of MT decreases as the internal carbon price rises. This is because a higher internal carbon price pressures MT to cut production in order to reduce the loss resulting from quota trading, which in turn allows MG to expand its production.

4. Results and Discussion

Impacts of internal carbon prices discussed in Section 3 are limited to the constraint η , as presented in Table 3 and Corollary 2. In this section, a comprehensive analysis of the equilibrium solutions and profits under a finite value of η is provided. Based on the results of Section 3, we explore the optimal strategic choices of carbon trading modes for competing manufacturers by comparing the equilibrium solutions and profits of MG and MT, in both external and internal trading modes across the scenarios of “quota insufficiency” and “quota sufficiency”.

4.1. Equilibrium Strategies Under Quota Insufficiency

Theorem 1.
MG’s emission reduction levels  e  in the two trading modes (internal vs. external) satisfy the following conditions.
Situation 1 (high carbon price situation):  p e I > p e E
(1) 
If  e _ g < min { 3 + k 1 k e _ t p e E 2 1 k k + p e I , e _ t } , then 
e E * < e L I * i f   η 2 < η < η 3   a n d   Δ c 1 L Δ c < Δ c e L e E * e L I * i f   η 2 < η < η 3   a n d   Δ c e L Δ c Δ c 2 L e E * < e L I * i f   η η 3   a n d   Δ c 1 E Δ c < Δ c e L e E * e L I * i f   η η 3   a n d   Δ c e L Δ c Δ c 2 L ,
(2) 
If  e _ g > min { 3 + k 1 k e _ t p e E 2 1 k k + p e I , e _ t } , then
e E * < e L I * i f   η 2 < η < η 3   a n d   Δ c 1 L Δ c < Δ c e L e E * e L I * i f   η 2 < η < η 3   a n d   Δ c e L Δ c Δ c 2 L e E * < e L I * i f   η 3 η < η ¯ 2   a n d   Δ c 1 E Δ c < Δ c e L e E * e L I * i f   η 3 η < η ¯ 2   a n d   Δ c e L Δ c Δ c 2 L e E * e L I * i f   η η ¯ 2   .
Situation 2 (low carbon price situation):  p e I < p e E
(1) 
If  e _ g < min { 3 + k 1 k e _ t p e E 2 1 k k + p e E , e _ t } , then
e E * > e L I * i f   η 1 < η < η 3   a n d   Δ c 1 E Δ c < Δ c e L e E * e L I * i f   η 1 < η < η 3   a n d   Δ c e L Δ c Δ c 2 E e E * > e L I * i f   η η 3   a n d   Δ c 1 L Δ c < Δ c e L e E * e L I * i f   η η 3   a n d   Δ c e L Δ c Δ c 2 E ,
(2) 
If  e _ g > min { 3 + k 1 k e _ t p e E 2 1 k k + p e E , e _ t } , then
e E * > e L I * i f   η 1 < η < η 3   a n d   Δ c 1 E Δ c < Δ c e L e E * e L I * i f   η 1 < η < η 3   a n d   Δ c e L Δ c Δ c 2 E e E * > e L I * i f   η 3 η < η ¯ 1   a n d   Δ c 1 L Δ c < Δ c e L e E * e L I * i f   η 3 η < η ¯ 1   a n d   Δ c e L Δ c Δ c 2 E e E * e L I * i f   η η ¯ 1   ,
When  e _ g < min { 3 + k 1 k e _ t p e E / 2 1 k k + p e I , e _ t }  is satisfied, indicating a low initial emission intensity of MG, the emission reduction level in different trading modes mainly depends on carbon prices  p e I ,  p e E , and the cost difference  Δ c . When the internal carbon price is higher than the market carbon price, i.e.,  p e I > p e E  (hereinafter referred to as the high carbon price situation), MG can achieve a higher emission reduction level through internal trading under the condition of a lower cost difference ( Δ c < Δ c e L ). When  p e I < p e E  (hereinafter referred to as the low carbon price situation) and  Δ c < Δ c e L , MG is more inclined to reduce emissions in the external trading mode. This is because in the high carbon price situation, MG earns greater revenue per unit of quota, motivating the manufacturer to invest more in emission reduction and thus obtaining more quota surplus for greater profits. Nonetheless, this is not the case with a higher cost difference ( Δ c Δ c e L ). Due to limited production of MG under a higher cost difference, as Corollary 1 demonstrates ( q g E * / Δ c < 0 ), the investment in emission reduction is not cost-effective. MG, in response, will reduce production to free up more carbon quotas for profit maximization under the high carbon price situation. This decline in production further weakens its motivation for emission reduction.
When  e _ g > min { 3 + k 1 k e _ t p e E / 2 1 k k + p e I , e _ t }  is met, illustrating MG’s high initial emission intensity, it will maintain output at a low level to comply with the carbon regulations despite a narrow cost difference. Based on the analysis above, if the two manufacturers reach an internal agreement under a high carbon price situation, as opposed to trading externally, total emission reduction will not rise but decline instead.
To summarize, if the two manufacturers reach an internal trading agreement, only when MG is at a high output level will the high carbon price have a positive incentive effect on emission reduction activities. Otherwise, it will instead inhibit the reduction in emissions. Therefore, MG must fully assess its production cost and internal carbon price before signing the trading agreement with MT, so as to achieve the goal of emission reduction through cooperation.
Theorem 2.
Remaining equilibrium solutions regarding product outputs  q g ,  q t ,  Q , prices per unit of a product  p g ,  p t in the two modes satisfy the following conditions.
Situation 1 (high carbon price situation):  p e I > p e E
q g E * < q g L I * , q t E * > q t L I * , Q E * < Q L I * , p t E * > p t L I * i f   η 2 < η < η 3   a n d   Δ c 1 L Δ c < Δ c q L   q g E * q g L I * , q t E * q t L I * , Q E * Q L I * , p t E * p t L I * i f   η 2 < η < η 3   a n d   Δ c q L Δ c Δ c 2 L q g E * q g L I * , q t E * q t L I * , Q E * Q L I * , p t E * p t L I * i f   η η 3   .
Situation 2 (low carbon price situation):  p e I < p e E
q g E * > q g L I * , q t E * < q t L I * , Q E * > Q L I * , p t E * < p t L I * i f   η 1 < η < η 3   a n d   Δ c 1 E Δ c < Δ c q L   q g E * q g L I * , q t E * q t L I * , Q E * Q L I * , p t E * p t L I * i f   η 1 < η < η 3   a n d   Δ c q L Δ c Δ c 2 E q g E * q g L I * , q t E * q t L I * , Q E * Q L I * , p t E * p t L I * i f   η η 3   .
Theorem 2 indicates that carbon prices p e I , p e E , emission-reduction difficulty η , and cost difference Δ c are the main factors impacting the inequality relationship between the equilibrium solutions. When the new emission-reduction technology mastered by MG is not sufficiently mature, i.e., η η 3 , the relationship between product output and price, as well as dynamics of internal versus external trading, are only affected by the carbon prices.
After the emission-reduction technology has been fully converted into the manufacturers’ low-carbon production capacities, i.e., max   η 1 , η 2 < η < η 3 is met, the inequality relationships between the internal and external trading variables will also be affected by the cost difference, which is analyzed as follows.
(1)
For the product outputs q g and q t , when the cost difference is high ( Δ c Δ c q L ), the high carbon price ( p e I > p e E ) cannot promote MG’s production and leads to lower output. Only when the cost difference is low ( Δ c < Δ c q L ) can the high carbon price effectively promote the production of the low-carbon products. This happens because MG has a stronger emission-reduction initiative with low carbon-emission intensity of the products, which limits the quota savings brought about by a decrease in production. By contrast, increasing production will raise sales profits for MG. Given their competitive relationship, the inequality relationships between MT’s and MG’s outputs are exactly opposite under the two trading methods.
(2)
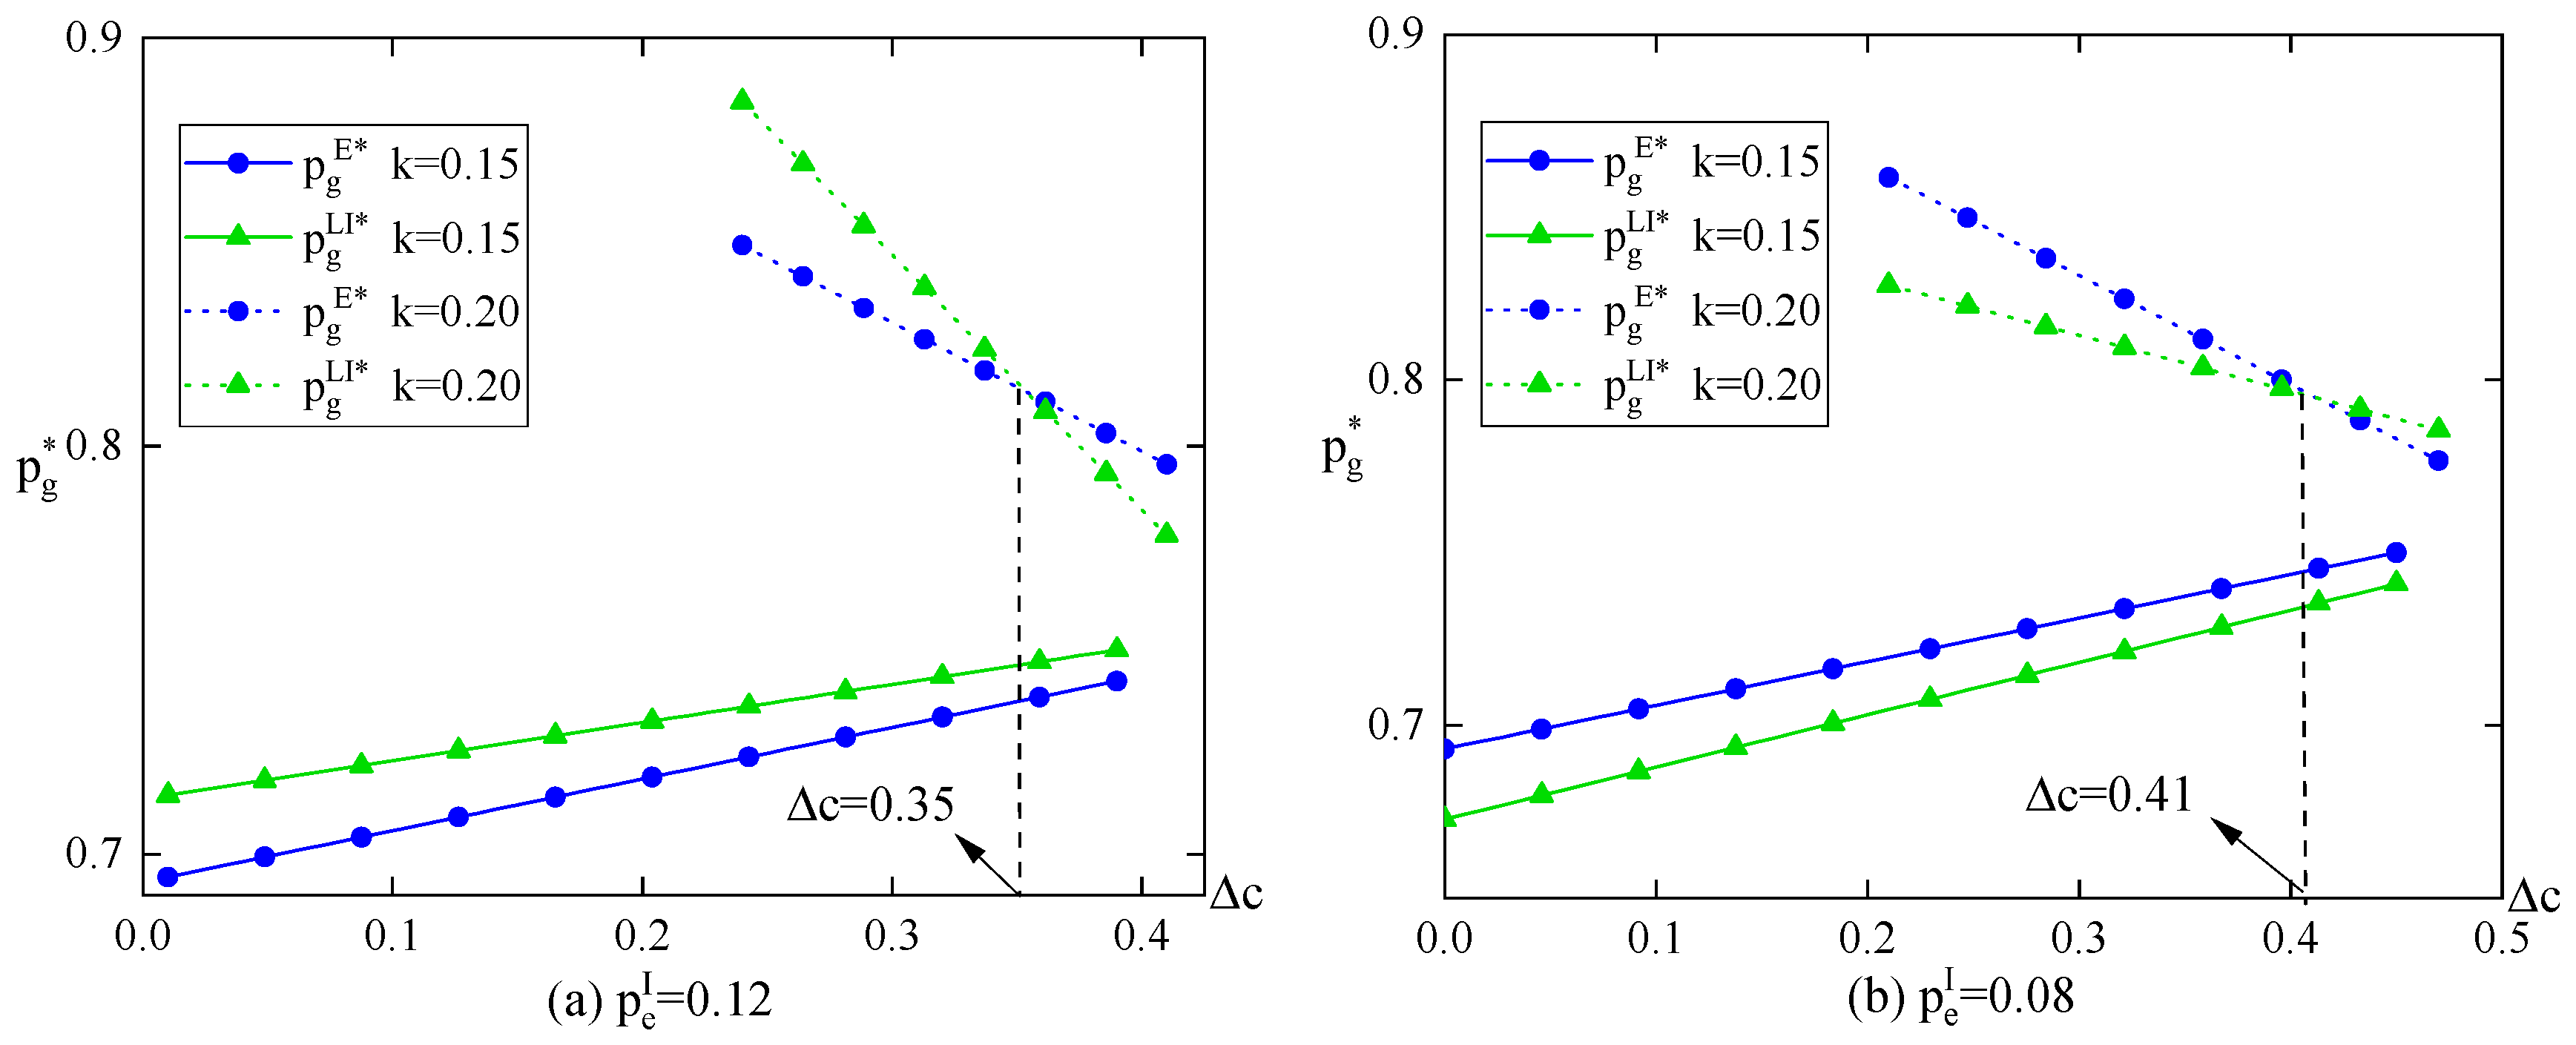
For the market prices per unit of product p g and p t , (i) the market price per unit of traditional product p t is inversely proportional to the total output of the two manufacturers Q , (ii) the monotonicity of MG’s pricing for low-carbon products p g , as a function of the cost difference Δ c , is influenced by consumers’ low-carbon awareness k , which is depicted in Figure 2. Specifically, Figure 2a,b show how the market price of the low-carbon product varies with the cost difference under both high and low levels of carbon prices, p e I = 0.12 and p e I = 0.08 , respectively.
Figure 2a shows that when consumers place only a minimal valuation on low-carbon products ( k = 0.15 ), the implementation of a high carbon price consistently elevates the equilibrium price of these products.
However, this effect does not hold when consumers exhibit higher low-carbon awareness ( k = 0.20 ). As shown in Figure 2a, the high carbon price and strong consumer low-carbon awareness prompt MG to lower product price when the cost difference exceeds a certain threshold (i.e., Δ c > 0.35 and Δ c > Δ c e L ). Due to consumers’ high low-carbon awareness, MG’s emission reduction exerts a more pronounced influence on product pricing, resulting in its relatively higher pricing in the external trading mode, as p g E * and p g L I * with k = 0.20 are much higher than those with k = 0.15 in Figure 2a.
Similarly, Figure 2b illustrates the low carbon price situation across varying consumers’ low-carbon awareness. When k = 0.15 , all p g s in Figure 2b rise with the increase in cost difference Δ c . When k = 0.20 , just as under a high carbon price situation, a strong consumer low-carbon awareness in the low carbon price situation also results in a significant impact on product pricing in the external trading mode, thus p g E * and p g L I * with k = 0.20 far exceed those with k = 0.15 in Figure 2b.
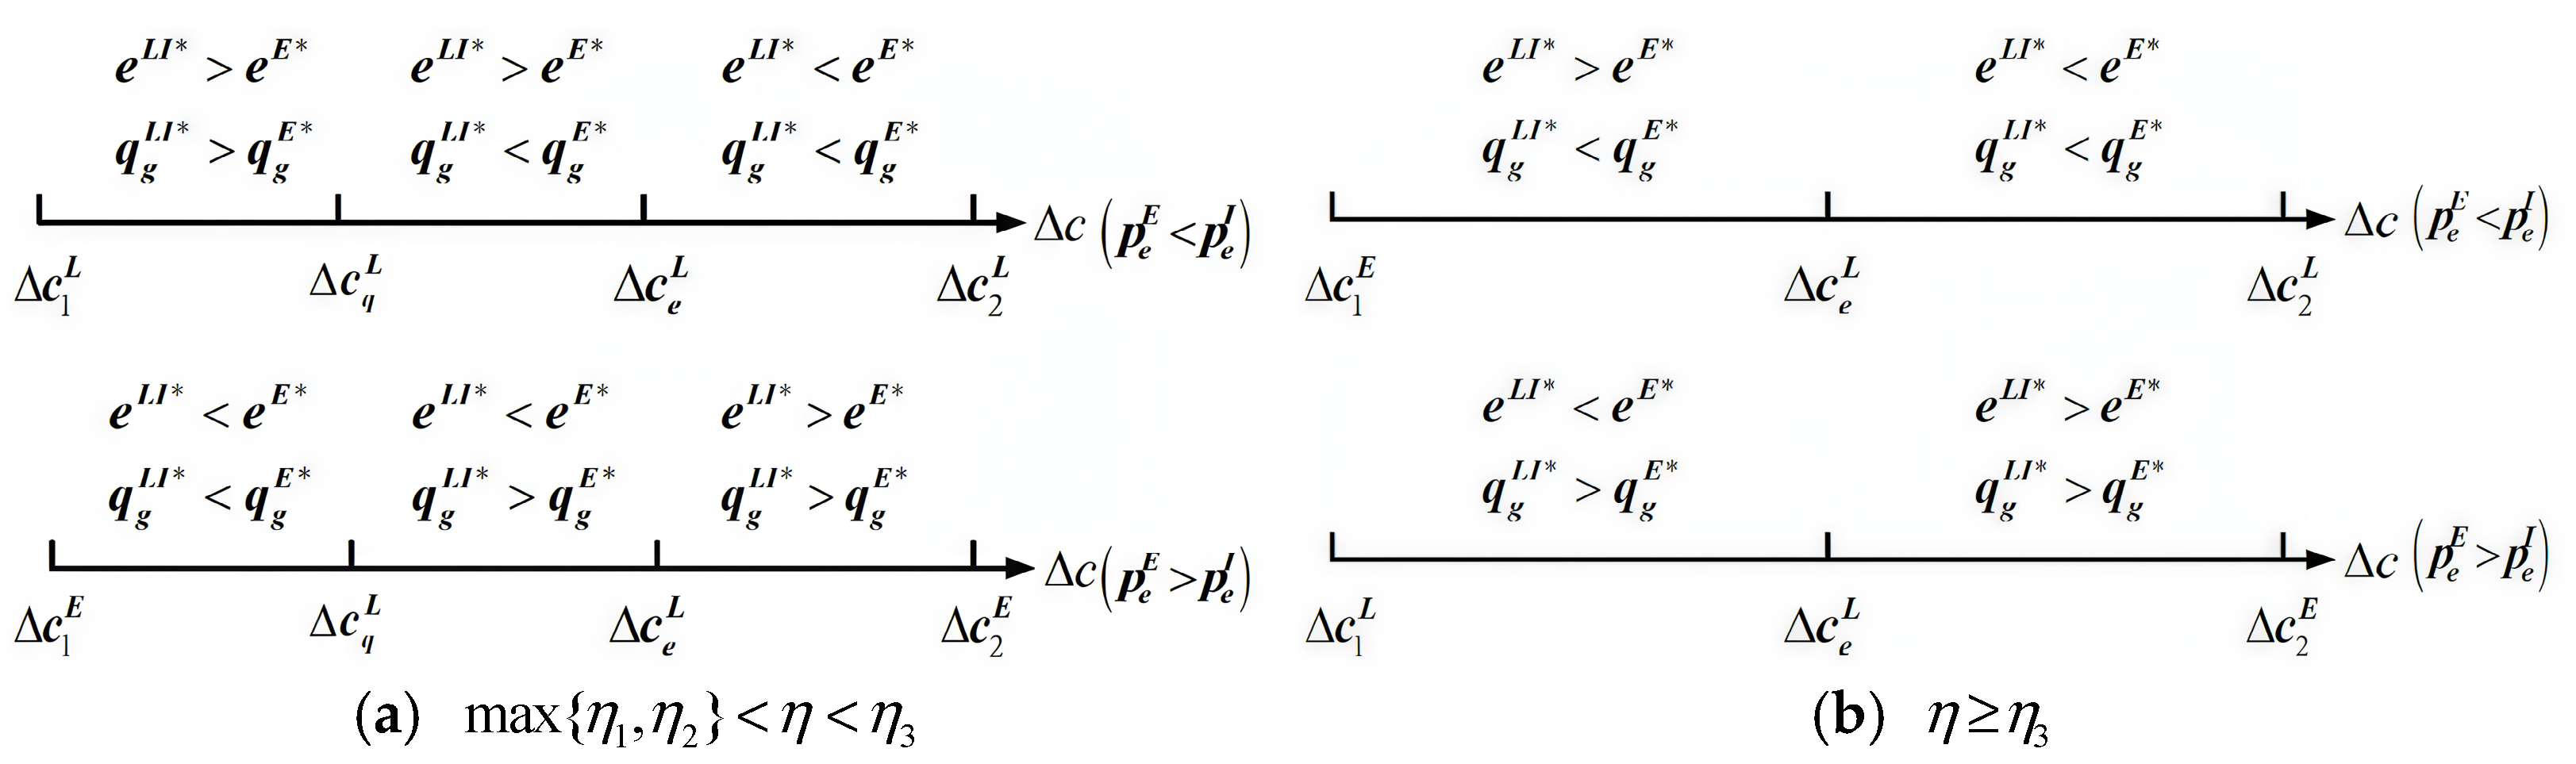
Figure 3 depicts variations in MG’s emission reduction and output level across high and low internal carbon prices. In the high carbon price situation where p e E < p e I , when the cost difference exceeds a certain threshold (i.e., Δ c > Δ c e L ), MG’s output and emission reduction in the external trading mode are both higher than those in the internal trading mode, as e L I * < e E * and q g L I * < q g E * . In the low carbon price situation, by contrast, when Δ c > Δ c e L holds, e L I * > e E * and q g L I * > q g E * can be achieved.
For MG, improving environmental performance involves not only enhancing emission-reduction levels but also increasing its own output. This is because an increase in MG’s output leads to a relative decrease in MT’s output, thus raising the proportion of low-carbon products in the market. Therefore, it is crucial for MG to choose an appropriate internal carbon price p e I to strengthen its low-carbon competitiveness and environmental performance. Specifically, the choice of an internal carbon price should fully consider MG’s current low-carbon capabilities, that is, its proficiency in new emission-reduction technologies and the cost efficiency of its low-carbon production. If MG has mastered new emission-reduction technologies and benefits from significant scale economies in low-carbon production (i.e., max   { η 1 , η 2 } < η < η 3 , Δ c Δ c q L ), emission reduction and output levels can be simultaneously improved, reaching an internal trading agreement under the low-carbon price situation.
The above discussions primarily investigate, from an environmental perspective, whether an internal trading agreement should be established and how the corresponding internal carbon price should be determined. The following discussion shifts the focus to profit-driven considerations and further examines the conditions under which an internal trading agreement would be viable.
Theorem 3.
The impacts of emission-reduction difficulty  η , and the internal trading price  p e I  on MG’s profits in internal trading are presented as follows.
(1) 
If  η 2 < η < η ¯ 4 , then  π G L I * p e I > 0 .
(2) 
If  η η ¯ 4 , then  π G L I * p e I > 0 i f   H 1 < E g L max   { H 1 , E g u p p e r L } π G L I * p e I 0 i f   E g l o w L E g L min { H 1 , E g u p p e r L } .
Generally, as the quota seller in internal trading, MG can generate higher sales revenue by setting a higher carbon quota price, thus earning more profits in cooperation with MT. However, Theorem 3 indicates that a higher carbon price does not always lead to higher returns. To illustrate, if MG has not fully mastered the new low-carbon production technologies and its allowance surplus is insufficient, setting a high internal agreement price may reduce its profit. In practice, it is often difficult for manufacturers with excessive emissions, especially large industrial firms, to purchase sufficient allowances in the short term. To comply with government-mandated emission targets in the specified time, such manufacturers may be willing to cooperate with quota sellers whose prices exceed the market average.
Recalling Equations (11) and (22), we obtain that when p e I = p e E , π G L I = π G E holds. Thus, the inequality relationship between equilibrium profits in the two trading modes can be derived from Theorem 3, as summarized in Corollary 3.
Corollary 3.
MG’s profits in the two modes (internal vs. external) are presented as follows.
(1) 
If  max   { η 1 , η 2 } < η < η ¯ 4 , then  π G L I * < π G E * i f   p e I < p e E π G L I * π G E * i f   p e I p e E .
(2) 
If  η η ¯ 4 , then  π G L I * < π G E * i f   H 1 < E g L max   { H 1 , E g u p p e r L }   a n d   p e I < p e E π G L I * π G E * i f   H 1 < E g L max   { H 1 , E g u p p e r L }   a n d   p e I p e E π G L I * > π G E * i f   E g l o w L E g L min { H 1 , E g u p p e r L }   a n d   p e I < p e E π G L I * π G E * i f   E g l o w L E g L min { H 1 , E g u p p e r L }   a n d   p e I p e E .
(3) 
η ¯ 4 Δ c < 0 .
According to Corollary 3 (1), when MG achieves a substantial breakthrough in emission-reduction technology (i.e., η < η ¯ 4 ), it will only consider cooperating with MT in quota trading under the high carbon price situation (if p e I p e E , then π G L I * π G E * ). Conversely, if MG still faces challenges in emission reduction as observed in Corollary 3 (2) (i.e., η η ¯ 4 ), it must assess its own quota surplus before signing a cooperation contract. Further analysis, as shown in Corollary 3 (3), indicates that the cost difference will affect the value of η ¯ 4 , which is a threshold in Corollary 3 (1) and (2). As economies of scale gradually take shape in MG’s low-carbon production sector, η ¯ 4 will progressively rise, further influencing the formation of internal agreements within the manufacturers.
Theorem 4.
MT’s profits in the two modes (internal vs. external) are presented as follows.
Situation 1 (high carbon price situation):  p e I > p e E
If  η 2 < η < η 3    and    Δ c 1 L Δ c < Δ c q L ; or  η 2 < η < η 3    and  Δ c q L Δ c Δ c 2 L , with  min { H 2 , E g u p p e r L } < E g L E g u p p e r L ; or  η η 3  and  min { H 2 , E g u p p e r L } < E g L E g u p p e r L , then  π T E * > π T L I * . Otherwise,  π T E * π T L I * .
Situation 2 (low carbon price situation):  p e I < p e E
If  η 1 < η < η 3    and    Δ c 1 E Δ c < Δ c q L ; or  η 1 < η < η 3   Δ c q L Δ c Δ c 2 E  and  min { H 2 , E g u p p e r L } < E g L E g u p p e r L ; or  η η 3  and  min { H 2 , E g u p p e r L } < E g L E g u p p e r L , then  π T E * < π T L I * . Otherwise,  π T E * π T L I * .
According to Theorem 4, whether MT chooses to sign internal trading agreements depends on the following factors: the internal carbon price p e I , the production cost difference Δ c , difficulty in emission reduction η , and MG’s carbon quotas E g L . (i) In the high carbon price situation, MT will only agree to sign an internal trading agreement when MG’s low-carbon level is deficient, and its quota surplus is limited, thus avoiding losses that could arise from excessive quota trading at elevated prices. (ii) In the low carbon price situation, when MG’s low-carbon capability is relatively high (i.e., η 1 < η < η 3   and   Δ c 1 E Δ c < Δ c q L ), MT will choose to sign an internal trading agreement unconditionally. This is because, compared with external trading, MT can obtain higher output and market pricing as well as a lower carbon price in internal trading (as can be seen from Theorem 2). When MG’s low-carbon level is deficient (i.e., η 1 < η < η 3   and Δ c q L Δ c Δ c 2 E or η η 3 ), MT will further consider MG’s quota surplus. If MG’s quota surplus is sufficiently large, MT is inclined to sign an internal trading agreement; otherwise, it will opt for external trading.

4.2. Equilibrium Strategies Under Quota Sufficiency

In the “quota insufficiency” scenario, the volume of quotas for internal trading depends on the MG’s remaining quotas. In the “quota sufficiency” scenario, however, it is determined by the amount MT would need to purchase. Following the similar analysis in Section 4.1, Theorem 5 can be derived by comparing the equilibrium solutions and profits under the two trading modes.
Theorem 5.
The equilibrium solutions under the two modes (internal vs. external) satisfy the following conditions.
Situation 1 (high carbon price situation):  p e I > p e E
e E * < e H I * ,   q g E * < q g H I * ,   q t E * > q t H I * ,   p g E * p g H I * i f   0 < k < k ¯   and   η 1 < η η ¯ 6 p g E * < p g H I * i f   0 < k < k ¯   and   η > η ¯ 6   or   k ¯ k < 1 ,   Q E * < Q H I * , p t E * > p t H I * i f   η 1 < η < η ¯ 5 Q E * Q H I * , p t E * p t H I * i f   η η ¯ 5 .
Situation 2 (low carbon price situation):  p e I < p e E
e E * > e H I * ,   q g E * > q g H I * ,   q t E * < q t H I * ,   p g E * p g H I * i f   0 < k < k ¯   and   η 1 < η η ¯ 6 p g E * > p g H I * i f   0 < k < k ¯   and   η > η ¯ 6   or   k ¯ k < 1 ,   Q E * > Q H I * , p t E * < p t H I * i f   η 1 < η < η ¯ 5 Q E * Q H I * , p t E * p t H I * i f   η η ¯ 5 .
Theorem 5 shows that the emission-reduction level e and output of the two types of products q g , q t , under different quota trading modes, is influenced solely by the carbon price p e .
In the high carbon price situation, it is reasonable for MT to moderately reduce its output, thereby minimizing losses from purchasing excessively high-priced quotas in internal carbon trading. By contrast, MG opts to increase production to capture greater sales revenue. This output expansion correspondingly enhances the cost-effectiveness of emission-reduction investments, which in turn elevate its emission-reduction level.
From a market pricing perspective, both the internal carbon price p e I and the difficulty of emission reduction η influence the market price of traditional products p t . For the pricing of the low-carbon product p g , when it is easy for MG to further reduce emissions, a high carbon price will significantly promote the output of low-carbon products. This leads to a higher total output, which in turn depresses the price of traditional products. When consumer preference for low-carbon products is significant, a high carbon price also drives up the price of low-carbon products. Nevertheless, if low-carbon consumption awareness is insufficiently strong, consumers are not sensitive to MG’s emission-reduction efforts, and the market price of low-carbon products is mainly affected by output. Moreover, it is the difficulty of emission reduction, rather than the cost difference, that determines the relative prices of the two products across different trading modes.
To encourage emission-reduction investment and popularize low-carbon products, manufacturers should endeavor to enter into internal trading agreements under the high carbon price situation. The government must establish and enhance the relevant low-carbon consumption education system, refine the certification standards for low-carbon products, and guide residents toward a shift in consumption habits to foster an appropriate low-carbon consumption culture. In cases where consumer awareness remains underdeveloped, the government should additionally focus on advancing green and low-carbon technologies. This entails strengthening fundamental and applied research in low-carbon technology, providing platforms for low-carbon R&D, fostering deeper integration among industry, academia, and research institutions, and refining the low-carbon industrial chain. These endeavors aim to boost the supply of low-carbon products and encourage low-carbon consumption.
We further explore whether manufacturers can reach internal trading agreements in the “quota sufficiency” scenario, as presented in Theorem 6.
Theorem 6.
The equilibrium profits in the two modes (internal vs. external) satisfy the following conditions.
If  p e I > p e E , then  π T E * > π T H I * . If  p e I p e E , then  π G E * π G H I * .
Theorem 6 demonstrates that in the “quota sufficiency” scenario, the two manufacturers’ choices of quota trading mode are no longer affected by their endogenous attributes (i.e., Δ c and η ). Instead, the manufacturers decide whether to sign an internal trading agreement based solely on the internal trading price. It follows that no such agreements can be reached under either high carbon price or low carbon price situations. That is, internal trading fails to achieve Pareto improvements of both manufacturers’ profits.

5. Numerical Analysis of China’s Steel Industry

Section 4 has discussed, from a theoretical perspective, the equilibrium solutions, the conditions under which MG and MT can reach an internal trading agreement, and the impacts of signing the agreement. In this section, we incorporate the actual situation of China’s steel market to conduct further investigation through numerical analyses.
We select the steel industry as the research focus for the following reasons. First, China’s steel industry was included in the list of “control and emission manufacturers” by the National Development and Reform Commission as early as 2016, and was subsequently incorporated into the national carbon market in 2025. Its quota allocation mainly aligns with the contextual framework of this study. Second, most manufacturers still use a traditional production method called “long-process steelmaking”, while less than 10% of them adopt a less emission-intensive technology called “short-process steelmaking”, which lays a realistic foundation for the emergence of competition between low-carbon and traditional manufacturers. Accordingly, we define a low-carbon manufacturer (MG) as one that employs “short-process steelmaking”, and a traditional manufacturer (MT) as one that uses only the long-process route. Third, beyond “short-process steelmaking”, a more advanced low-carbon technology, “hydrogen metallurgy technology”, is emerging in the industry. This aligns with the “new emission-reduction technology” considered in the proposed model. By using green hydrogen as the reducing agent, it significantly reduces the carbon intensity of steel production.
The production cost of “long-process steelmaking” is approximately CNY 4200 per ton, while that of the “short-process steelmaking” method is around CNY 4900 per ton [81]. As the latter technology continues to mature, its costs are expected to decline further. Therefore, the possible range of the cost difference Δ c is assigned to be 0 , 700 . In terms of carbon emissions, on-site surveys at Jiangsu Yonggang Group Co., Ltd. indicate that the long-process method generates about 2 tons of CO2 per ton of crude steel, compared to 0.6 tons for the short-process route. Regarding carbon pricing, this study adopts the price of CNY 62 per ton as the representative average price level observed in China’s national carbon market in 2025. Based on the above data, and after normalization (the raw data is scaled down in proportion, 1000 times specifically, to make the calculations reasonable and convenient), the relevant parameters can be set as e _ g = 0.6 , e _ t = 2 , Δ c 0 , 0.7 , and p e E = 0.062 .

5.1. Strategy Choices of Carbon Trading Modes Under Quota Insufficiency

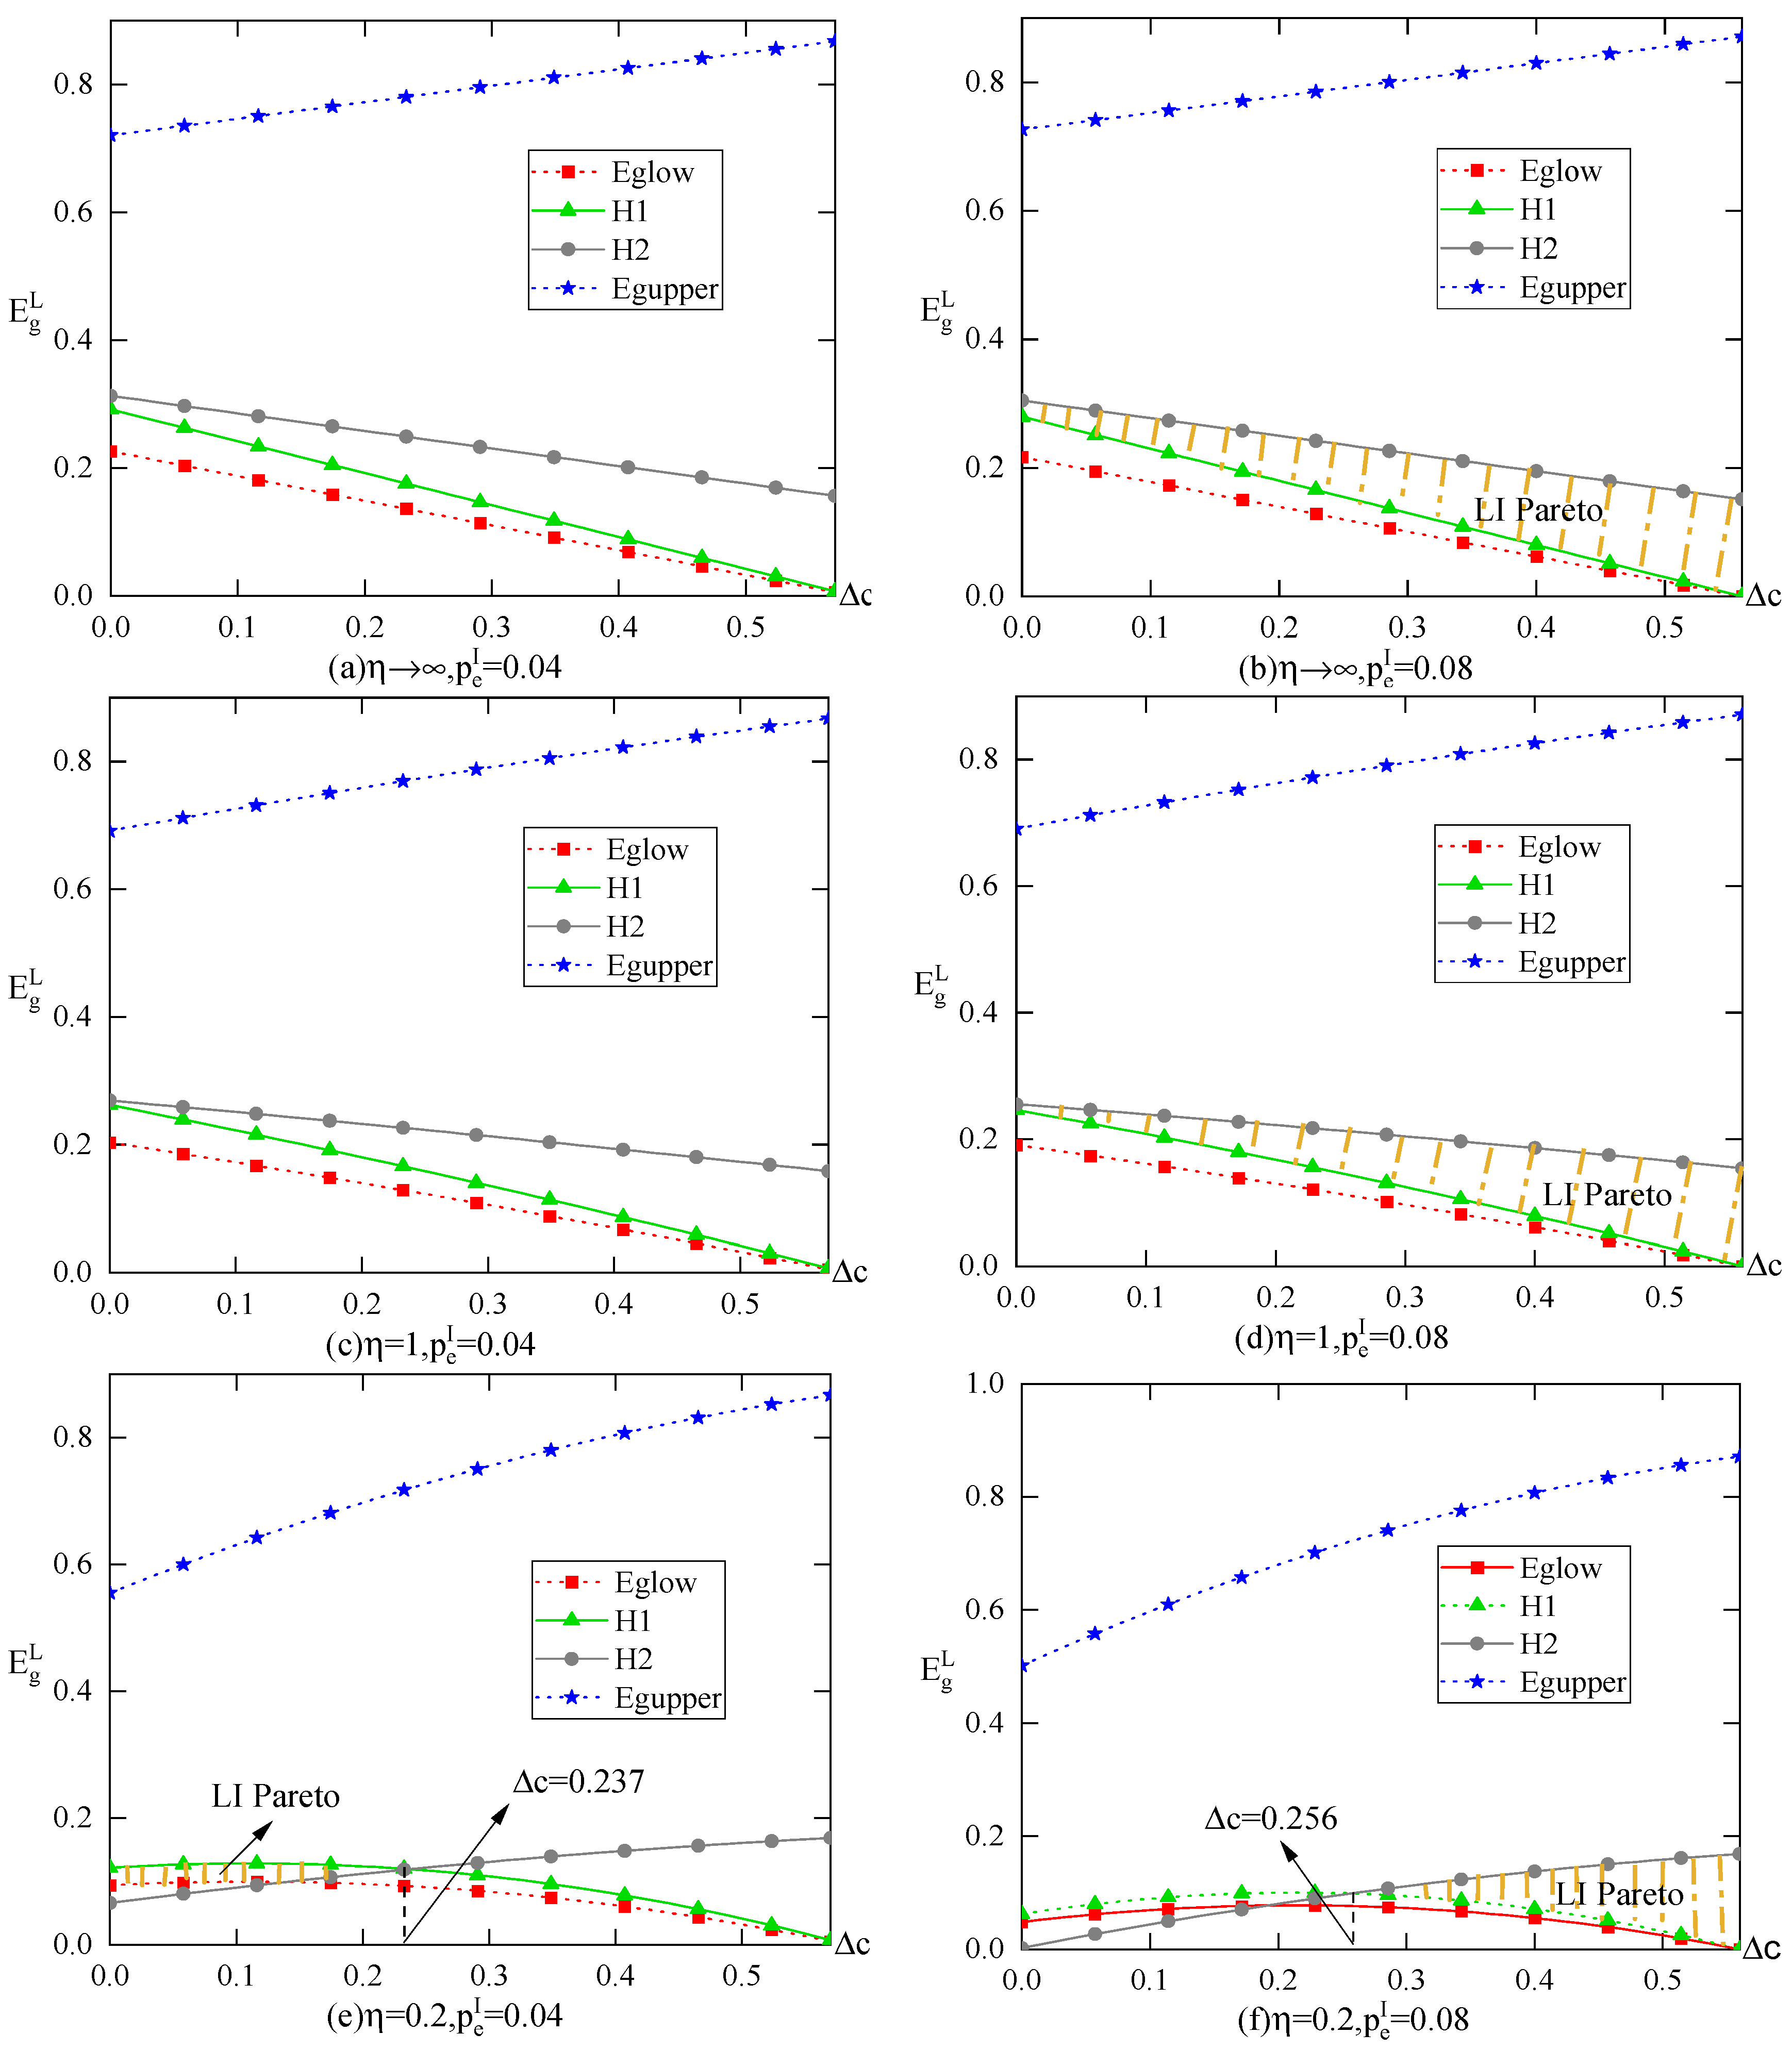
In the “quota insufficiency” scenario, to intuitively demonstrate the conditions and corresponding ranges under which MG and MT can achieve cooperation by signing an internal trading agreement, Figure 4 illustrates how the cost difference Δ c and carbon quotas imposed by the government E g L affect manufacturers’ selections of quota trading modes (internal vs. external), taking into account the difficulty of emission reduction η and the internal carbon price p e I (see Table 4 for specific threshold values under distinct conditions).
In the shaded regions of Table 4, both manufacturers are willing to enter an internal trading agreement, i.e., π i L I * > π i E * i = G , T is satisfied. When MG has not yet mastered “hydrogen metallurgy technology” (when η and η = 1.0 , then η > η 3 ), MT and MG can only reach an internal trading agreement under the high carbon price (when p e I = 0.08 ), as Figure 4b,d demonstrates. When MG has fully acquired “hydrogen metallurgy technology” (when η = 0.2 , then max { η 1 , η 2 } < η < η 3 ), they can not only engage in internal trading under a high carbon price, but may also reach an agreement under the low carbon price within a certain quota range, as Figure 4e,f depicts.
Based on Figure 3 and Figure 4 and Table 4, it can be concluded that under certain conditions, although the internal trading agreement is conducive to the Pareto improvement of the manufacturers’ profits, it can simultaneously have adverse environmental effects. For instance, under the condition of Δ c e L Δ c Δ c 2 L in the two upper cases in Figure 3, where Δ c e L is equal to 0.465, 0.470, and 0.487, in Figure 4a and Figure 4b and Figure 4f, respectively, we achieve e L I * < e E * and q g L I * < q g E * . Meanwhile, when max { η 1 , η 2 } < η < η 3 and 0 Δ c < Δ c q L are satisfied in Figure 3a, where Δ c q L = 0.140 in Figure 4e, we obtain the same results. These indicate that signing an internal trading agreement will not only inhibit MG’s emission-reduction initiative, but will also reduce the market share of low-carbon steel, thereby contributing to a significant increase in total carbon emissions.
In China, “short-process steelmaking” is still considered relatively advanced within the steel industry, and “hydrogen metallurgy technology”, which requires electrolysis of water to produce hydrogen, faces challenges in scaling up without the efficient use of renewable energy. As a result, MG’s production cost and emission reduction difficulties are expected to remain high for the foreseeable future, and internal trading agreements between manufacturers are likely to be reached only in a high carbon price scenario. Meanwhile, since internal quota trading under conditions of significant cost difference often leads to higher total carbon emissions, and given that the adoption of “short-process steelmaking” entails substantial capital investment, such an agreement can alleviate MG’s funding constraints and enhance its operational resilience. Thus, carbon quota trading among competing manufacturers carries certain positive implications for the development of low-carbon manufacturers.
To further examine how the internal carbon price p e I affects the profits π G L I , π T L I , and environmental outcomes C E G L I , C E T L I of competing MT and MG, we assign the following parameters, Δ c = 0.3 , η = 1 , E g L = E t L = 0.2 , and k = { 0.1 , 0.2 } , with other parameters remaining unchanged. The solutions are summarized in Table 5.
Table 5 demonstrates that, when k = 0.1 and p e I 0.062 , 0.10 , the values of all π T L I * s, and π G L I * s are no less than those under the condition p e I = 0.062 . In this case, both manufacturers choose to cooperate and adopt internal carbon trading, since their profits under internal trading exceed or equal those from external trading. Once the agreement is in place, MG’s profit rises more significantly than MT’s, giving MG even stronger incentive to enter into such an arrangement. From an environmental perspective, while internal carbon trading encourages MG’s greater initiative in emission reduction, it also increases the output of MT’s traditional products, which causes higher total carbon emissions. Nonetheless, the implementation of internal trading ultimately supports the further improvement and dissemination of low-carbon technologies, contributing to the industry’s transition toward a lower-carbon future.
When consumers show greater preference for low-carbon products (i.e., k = 0.2 ), the conditions for reaching internal trading agreements between manufacturers change, and internal trading agreements cannot be realized under the current quota level. However, carbon quota trading between the MG and MT can still contribute to higher overall profits. It is thus advisable for the government to regularly conduct surveys on public awareness and attitudes toward low-carbon consumption. The resulting data would help inform the rational allocation of carbon quotas and facilitate cooperation in quota trading between the manufacturers.

5.2. Strategy Choices of Carbon Trading Modes Under Quota Sufficiency

In the “quota sufficiency” scenario, we further examine the impacts of an internal carbon price p e I on manufacturers’ profits and carbon emissions, as shown in Table 6. Relevant parameters are assigned as follows, Δ c = 0.3 , η = 1 , E g L = E t L = 0.5 , and k = { 0.1 , 0.2 } (all other parameters remain unchanged).
Recall that in the analysis for Theorem 6, in the “quota sufficiency” scenario, an internal trading agreement fails to achieve a Pareto improvement for each manufacturer’s profit. This aligns with the results in Table 6, as values of π G H I * s under p e I 0.062 , 0.10 exceed those from external carbon trading (when p e I = 0.062 and k = 0.1 , then π G H I * = 0.0625 ; when p e I = 0.062 and k = 0.2 , then π G H I * = 0.0736 ), whereas π T H I * s are lower than those under external trading mode. However, Table 6 also reveals that total profits can still increase when manufacturers agree on a high carbon price ( T π H I * s under p e I 0.062 , 0.10 are higher than those under p e I = 0.062 as the benchmark of external trading mode). This growth is more pronounced when consumers exhibit strong low-carbon awareness ( T π H I * s under k = 0.2 show a more significant increase than those under k = 0.1 ). Furthermore, the total carbon emissions T C E H I * are reduced with a higher internal carbon price, owing to an increased proportion of low-carbon products. In essence, the high carbon price in internal trading effectively transfers part of MG’s emission reduction costs to MT. Such cost transfer may not be feasible theoretically; in practice, however, factors regarding limited quota-purchase channels, contractual obligations, and information asymmetry between trading parties can facilitate its realization. Notably, as consumers’ low-carbon awareness enhances, the efficiency of this cost transfer can be further enhanced.
Combining Table 5 and Table 6, we find that MG’s profit is consistently lower than MT’s, which reflects the high cost of low-carbon transition and the uncertain returns on low-carbon investment. Therefore, funding constraints remain the primary obstacle to the development of the low-carbon steel industry. While some manufacturers may pursue low-carbon transformation for social responsibility, most are reluctant to take such risks. Although the establishment of the carbon trading market has to some extent impacted traditional steel manufacturers relying on “long-process steelmaking” technology, low carbon prices have resulted in insufficient rewards for low-carbon pioneers. Hence, it is essential for the low-carbon steel industry, especially in its early development stages, to actively engage in quota trading with traditional competitors by fully utilizing their carbon quota advantages. In addition, the government should expedite carbon footprint assessments for the steel industry and establish relevant low-carbon standards. These measures would not only be conducive to the improvement of the market competitiveness of low-carbon steel manufacturers, but are also helpful in enhancing their bargaining power in the quota-trading cooperation with traditional steel competitors.

6. Conclusions and Implications

6.1. Concluding Remarks

This study investigates the choice of carbon quota trading modes for a low-carbon manufacturer (MG) and a traditional manufacturer (MT), which are characterized by distinct production costs and low-carbon technology levels, under the CAT policy. By comparing the equilibrium solutions and profits across various quota trading modes, we emphasize the underlying economic mechanisms driving the manufacturers’ behaviors toward alternative trading paths, as well as the impacts of entering into an internal trading agreement on the manufacturers’ decisions and profits, and carbon reduction. Furthermore, the impact of low-carbon development level (i.e., the difficulty of emission reduction) and the role of consumers’ low-carbon awareness are elucidated. The main findings are summarized as follows.
(1)
In the internal trading mode, the market price and emission reduction in products depend on various factors, involving the cost difference between MG and MT, the internal carbon price of carbon quotas, the difficulty of emission reduction, and consumers’ low-carbon awareness, among others (Propositions 2 and 3, Table 3). When the new emission reduction technology remains at the stage of theoretical verification, product market pricing will increase with a rise in the internal carbon price, irrespective of whether MG’s quota surplus is adequate (Corollary 2). In contrast, once the new emission reduction technology is applied in production, the pricing of the product is influenced not only by the internal carbon price, but also by factors such as the difficulty of emission reduction, consumers’ low-carbon awareness, and cost differences. Among these, cost difference affects manufacturers’ pricing strategies only under conditions of “quota insufficiency” (Theorem 2, Figure 2). Furthermore, MG’s abatement activities are also influenced by the internal carbon price. In the “quota insufficiency” scenario, a high carbon price effectively stimulates emission reduction only when the cost difference is narrow. Otherwise, the incentive effect of a low carbon price becomes more significant. In the “quota sufficiency” scenario, a high carbon price consistently motivates MG to invest in carbon emission abatement (Theorem 5).
(2)
When selecting a carbon quota trading mode, MG and MT must weigh the profits derived from cooperative quota trading against the losses resulting from competition. Under the condition of “quota insufficiency”, whether the manufacturers can reach an internal trading agreement depends on three factors regarding MG’s quota surplus, the difficulty of emission reduction, and the cost difference between MG and MT (Theorem 1). When MG faces great difficulty in emission reduction, the manufacturers can only reach an agreement under a high carbon price. However, when emission reduction is relatively easy, internal trading can be realized either under a high carbon price with a high cost difference or under a low carbon price with a low cost difference (Figure 3 and Figure 4).
In the case of “quota sufficiency”, the profits of both manufacturers cannot be simultaneously enhanced through internal trading. Therefore, they are unlikely to cooperate in quota trading in theory. However, in practice, MT often struggles to procure adequate quotas within the stipulated timeframe. As a result, it may be willing to purchase quotas at a relatively high price to avoid substantial penalties for failing to perform the contract on time, which can facilitate the formation of internal trading agreements.
(3)
An increase in total profits can be achieved via the cooperation of manufacturers in carbon quota trading, although the effects vary under different internal carbon prices. In the “quota insufficiency” scenario, and given a certain level of quota surplus, an internal trading agreement enables Pareto improvement for both manufacturers, with MG’s profit increase significantly exceeding that of MT. Taking China’s steel industry as an example, within a certain range of internal carbon prices, a higher internal trading price corresponds to a greater profit for MG.
In the “quota sufficiency” scenario, internal trading under the high carbon price essentially transfers MG’s emission-reduction cost to MT, and the amount of this transfer rises as the internal carbon price rises. The enhancement of consumers’ low-carbon awareness will contribute to improving the efficiency of such cost transfer.
(4)
In scenarios of “quota insufficiency/sufficiency,” internal trading agreements result in higher/lower carbon emissions while achieving an increase in total profits. Shortly after MG completes its low-carbon transition, only a limited number of allowances will be available for sale, aligning with the “quota insufficiency” scenario outlined in this study. Although quota trading cooperation under such conditions increases carbon emissions, it also enhances MG’s disposable funds, thereby laying the groundwork for the expansion of low-carbon industries (Theorems 3 and 4, Corollary 3, Table 5).
As MG’s quotas that are available for sale increase annually, cooperation in quota trading among the competing manufacturers will shift toward a “quota sufficiency” scenario. Under such conditions, MG should fully understand the current quota-trading market and MT’s demand for quotas, while exploring opportunities for internal trading cooperation. The government should raise penalties for manufacturers that exceed their allocated emissions and fail to secure sufficient quotas within the specified period, thereby incentivizing MG to engage more proactively in internal trading (Theorems 5 and 6, Table 6).

6.2. Managerial Implications

In the early phase of the low-carbon transition, manufacturers’ low-carbon technologies are still under theoretical verification. Meanwhile, manufacturers are confronted with inadequate carbon quota supply, as well as great difficulties and high costs in emission reduction.
From the perspective of manufacturers, (1) it is essential to develop pricing and emission reduction strategies based on the cost difference between low-carbon and traditional production modes. A narrow cost gap allows manufacturers to gain higher profits under a high carbon price. In contrast, a substantial cost difference calls for a low carbon price to better incentivize emission reduction efforts. (2) Meanwhile, manufacturers shall fully evaluate their carbon quota surplus, the difficulty of emission reduction and the cost difference when deciding whether to implement internal carbon trading arrangements. If a manufacturer’s newly adopted emission reduction technologies are not yet fully mature, maintaining a high carbon price is a prudent choice. By contrast, mature technologies require carbon pricing to align with practical trading scenarios: a high carbon price matches a significant cost difference, and a low carbon price corresponds to a narrow cost gap. These practices can effectively mitigate losses arising from coopetition and maximize the Pareto improvement generated by internal carbon trading. (3) Furthermore, internal carbon trading may inevitably increase total carbon emissions in the short run. Manufacturers need to rationally acknowledge this temporary drawback, as such trading serves the long-term goal of low-carbon transformation.
For governments, (1) carbon quotas should be set in a targeted way according to manufacturers’ conditions, including difficulty of emission reduction and cost disparities. This helps prevent rigid quota restrictions from dampening manufacturers’ enthusiasm for low-carbon transition. (2) The government should enhance public low-carbon awareness. By conducting industrial outreach, market promotion and consumption guidance, authorities can popularize fundamental low-carbon concepts and foster consumer preference for low-carbon consumption. These efforts can lay a solid market foundation for the premium pricing of low-carbon products, and gradually establish a preliminary low-carbon governance system that integrates policy regulation and public market awareness.
As low-carbon manufacturing develops and evolves into a mature stage, manufacturers have fully implemented low-carbon technologies, the emission reduction system has matured, and there is an abundant stock of carbon quotas with a significant increase in tradable quotas. At this point, manufacturers and governments should appropriately adjust their strategies.
From the position of manufacturers’ operational management, (1) it is imperative to establish a multi-dimensional market-oriented pricing system that integrates internal carbon pricing, difficulty of emission reduction, consumer low-carbon awareness, and cost difference between low-carbon and traditional manufacturing modes. This system is designed to fully unlock the dividends of the low-carbon market and convert products’ low-carbon attributes into core market competitive advantages. (2) Manufacturers should proactively monitor market dynamics and the carbon quota demands of carbon-intensive manufacturers to explore potential internal carbon trading opportunities and conduct quota cooperation based on market supply and demand gaps.
From a governmental regulatory perspective, (1) the governance paradigm may transition from strict regulation to flexible supervision, thereby constructing an elastic regulatory framework centered on positive incentives with moderate punitive mechanisms as a supplementary safeguard. (2) A comprehensive reward and punishment incentive system ought to be established, providing policy support, quota rewards, or tax incentives to manufacturers that actively engage in emission reduction, compliant trading, and low-carbon transformation with outstanding achievements. (3) The government should steadily advance efforts to foster public low-carbon l awareness, shifting from basic popularization to in-depth guidance. By deploying multiple methods such as policy empowerment, public media advocacy, and low-carbon consumption subsidies, the authority can elevate preference for low-carbon goods and public recognition of eco-friendly products. This fully leverages the forcing effect of the consumer side, further enhances the premium space of low-carbon products, and continuously magnifies the Pareto effect of carbon trading.
Overall, manufacturers can optimize their carbon trading, pricing and emission reduction strategies based on the availability of quotas and technological progress across distinct low-carbon transformation phases. For governments, a phased and differentiated approach to governance should be adopted, featuring stringent oversight in the preliminary stage, flexible supervision in the mature stage, alongside sustained initiatives to cultivate public awareness of low-carbon lifestyles throughout the transformation lifecycle. Such a framework facilitates effective coordination between administrative regulation and market mechanisms, advancing standardized industrial carbon trading and long-term low-carbon development.
This study has certain limitations that merit further exploration. For instance, the cost difference is treated as an exogenous variable, which somewhat deviates from real-world conditions. Future work could investigate how the adoption of emission reduction technology influences this cost differential. The current analysis examines quota-sharing behavior among competing firms solely from the perspective of profit maximization, without considering social welfare objectives. Subsequent research could set the internal carbon price with the aim of maximizing social welfare, thereby providing a more comprehensive evaluation of quota-sharing cooperation between low-carbon and traditional manufacturers. Moreover, future research can further explore anti-competitive risks arising from carbon quota transactions between horizontal duopolists and their regulatory governance mechanisms.

Supplementary Materials

The following supporting information can be downloaded at: https://www.mdpi.com/article/10.3390/math14132441/s1, Supplementary Materials S1. Proofs of all propositions, theorems, and corollaries; Supplementary Materials S2. Threshold values.

Author Contributions

Conceptualization, X.Z. and Q.H.; methodology, X.Z.; software, X.Z.; validation, X.Z., Q.H. and X.J.; formal analysis, T.L.; investigation, X.Z.; writing—original draft preparation, X.Z.; writing—review and editing, X.J. and T.L.; visualization, Q.H.; supervision, Q.H.; project administration, Q.H.; funding acquisition, X.Z., Q.H. and T.L. All authors have read and agreed to the published version of the manuscript.

Funding

This research was funded by the Philosophy and Social Science Planning Project of Zhejiang Province of China (grant number 25NDJC021YBMS); The National Social Science Foundation of China (grant number 22BGL120); The Humanities and Social Sciences Youth Foundation of Ministry of Education of China (grant numbers 23YJC630054); The Scientific Research Foundation of Zhejiang Provincial Education Department of China (grant number Y202353212); 2025 Cultivation Program for Ministerial/Provincial Research Projects, Shanghai University of Finance and Economics Zhejiang College (grant number YJPY202503); The Development Foundation of Shanghai University of Finance and Economics Zhejiang College (grant number 2025FZJJ20; 2025FZJJ21).

Data Availability Statement

The original contributions presented in this study are included in the article. Further inquiries can be directed to the corresponding author.

Acknowledgments

The authors would like to appreciate the editors and the anonymous reviewers for their insightful suggestions to improve the quality of this paper.

Conflicts of Interest

The authors declare no conflicts of interest.

References

  1. Avval, A.E.; Dehghanian, F.; Pirayesh, M. Joint optimization of multiple supply chains under cap-and-trade regulation: A Bi-Level programming model and solution algorithm. Asia-Pac. J. Oper. Res. 2023, 40, 2250019. [Google Scholar]
  2. Jauhari, W.A.; Adam, N.A.F.P.; Rosyidi, C.M. A closed-loop supply chain model with rework, waste disposal, and carbon emission. Oper. Res. Perspect. 2020, 7, 100155. [Google Scholar] [CrossRef]
  3. Cheng, P.; Ji, G.; Zhang, G.; Shi, Y. A closed-loop supply chain network considering consumer’s low carbon preference and carbon tax under the cap-and-trade regulation. Sustain. Prod. Consum. 2022, 29, 614–635. [Google Scholar]
  4. Abbasi, S.; Choukolaei, H.A. A systematic review of green supply chain network design literature focusing on carbon policy. Decis. Anal. J. 2023, 6, 100189. [Google Scholar] [CrossRef]
  5. Wang, Y.; Xu, X.; Zhu, Q. Carbon emission reduction decisions of supply chain members under cap-and-trade regulations: A differential game analysis. Comput. Ind. Eng. 2021, 162, 107711. [Google Scholar]
  6. Qin, L.; Chen, W.; Ding, J. How to develop recycling strategies for capital-constrained remanufacturer under cap-and-trade mechanism? Comput. Ind. Eng. 2025, 208, 11275. [Google Scholar]
  7. Dragomir, V.D.; Dumitru, M.; Perevoznic, F.M. Carbon reduction and energy transition targets of the largest European companies: An empirical study based on institutional theory. Clean. Prod. Lett. 2023, 4, 100039. [Google Scholar] [CrossRef]
  8. Gao, F.; Souza, G.C. Carbon offsetting with eco-conscious consumers. Manag. Sci. 2022, 68, 7793–8514. [Google Scholar] [CrossRef]
  9. Yang, L.; Hu, Y.; Huang, L. Collecting mode selection in a remanufacturing supply chain under cap-and-trade regulation. Eur. J. Oper. Res. 2020, 287, 480–496. [Google Scholar]
  10. Nefzi, M.; Hajji, A.; Kadi, D.A. Evalutating cap-and-trade and green subsidies in promoting green investments for capital-constrained manufacturers with environmentally aware consumers. J. Clean. Prod. 2026, 538, 147416. [Google Scholar]
  11. Xu, M.; Lin, B. Towards low-carbon economy by carbon label?: Survey evidence from first-tier cities in China. Environ. Impact Assess. Rev. 2022, 97, 106902. [Google Scholar]
  12. Pienwisetkaew, T.; Wongsaichia, S.; Boontham, W.; Padthar, S.; Ponsree, K.; Wannapipat, W.; Ketkaew, C. Carbon labels and rewards: Driving sustainable consumer purchase decisions through incentive-based strategies. Sustain. Futures 2025, 10, 101385. [Google Scholar] [CrossRef]
  13. Yenipazarli, A. Incentives for environmental research and development: Consumer preferences, competitive pressure and emissions taxation. Eur. J. Oper. Res. 2019, 276, 757–769. [Google Scholar] [CrossRef]
  14. Zhou, Z.; Hu, F.; Xiao, D. Optimal pricing strategy of competing manufacturers under carbon policy and consumer environmental awareness. Comput. Ind. Eng. 2020, 150, 106918. [Google Scholar] [CrossRef]
  15. Ahlvik, L.; Bijgaart, I.V.D. Screening green innovation through carbon pricing. J. Environ. Econ. Manag. 2024, 124, 102932. [Google Scholar] [CrossRef]
  16. Wang, X.; Cho, S.; Scheller-Wolf, A. Green technology development and adoption: Competition, regulation, and uncertainty—A global game approach. Manag. Sci. 2020, 67, 201–219. [Google Scholar]
  17. Liu, X.; Liu, Y.; Bai, C.; Peng, R.; Chi, Y. Pathways for decarbonizing China’s iron and steel industry using cost-effective mitigation technologies: An integrated analysis with top-down and bottom-up models. Renew. Energy 2024, 237, 121506. [Google Scholar]
  18. Yuan, M.; Li, W. Carbon capture and storage for small-to-medium biorefineries: Promising carbon removal solution with economic challenges. Environ. Sci. Technol. Lett. 2025, 12, 945–950. [Google Scholar]
  19. Pi, S.; Li, H. Vertical cooperation and coopetition of incumbents under the new energy substitute: Evidence from Chinese automobile industry. J. Clean. Prod. 2022, 359, 131964. [Google Scholar] [CrossRef]
  20. Mosgaard, M.A.; Kristensen, H.S.; Bocken, N. Competition of coopetition? Collabotation strategies for the circular economy. J. Clean. Prod. 2025, 513, 145686. [Google Scholar]
  21. Arthur, E.K.; Almaraz, S.D.-L.; Solymosi, T. Strategic dynamic in hydrogen deployment: A game-theoretical review of competition, cooperation, and coopetition. Renew. Sustain. Energy Rev. 2026, 226, 116293. [Google Scholar]
  22. Lin, B.; Huang, C. Analysis of emission reduction effects of carbon trading: Market mechanism or government intervention? Sustain. Prod. Consum. 2022, 33, 28–37. [Google Scholar] [CrossRef]
  23. Bai, Q.; Chen, J.; Xu, J. Energy conservation investment and supply chain structure under cap-and-trade regulation for a green product. Omega 2023, 119, 102886. [Google Scholar]
  24. Cai, D.; Zhang, G.; Lai, K.-H.; Guo, C.; Su, B. Government incentive contract design for carbon reduction innovation considering market value under asymmetric information. Energy Policy 2024, 186, 114009. [Google Scholar] [CrossRef]
  25. Wang, D.; Li, Y.; Hong, J. Tax or subsidy? The impact assessment of environmental policies on carbon allocation and emissions abatement of prefabricated construction. J. Environ. Manag. 2025, 373, 123451. [Google Scholar]
  26. Hua, J.; Wang, K.; Lin, J.; Qian, Y. Carbon tax vs. carbon cap-and-trade: Implementation of carbon border tax in cross-regional production. Int. J. Prod. Econ. 2024, 274, 109317. [Google Scholar]
  27. Khan, A.-A.; Cárdenas-Barrón, L.E.; Treviño-Garza, G.; Céspedes-Mota, A. Optimzing emissions reduction investments in livestock-producing farms under non-linear holding cost and power demand: A comparative analysis of carbon tax and cap-and-trade enviromental regulations. Appl. Math. Model. 2025, 1138, 115821. [Google Scholar]
  28. Anand, K.S.; Giraud-Carrier, F.C. Pollution regulation of competitive markets. Manag. Sci. 2020, 66, 4193–4206. [Google Scholar] [CrossRef]
  29. Wang, Y.; Xu, X.; Zhu, Q. Accelerate or hinder it? Manufacturer transformation under competition and carbon emission trading. Int. J. Prod. Res. 2023, 61, 6230–6250. [Google Scholar]
  30. Turken, N.; Carrillo, J.; Verter, V. Strategic supply chain decisions under environmental regulations: When to invest in end-of-pipe and green technology. Eur. J. Oper. Res. 2020, 283, 601–613. [Google Scholar]
  31. Yang, Y.; Goodarzi, S.; Bozorgi, A.; Fahimnia, B. Carbon cap-and-trade schemes in closed-loop supply chains: Why firms do not comply? Transp. Res. Part E Logist. Transp. Rev. 2021, 156, 102486. [Google Scholar]
  32. Pun, H.; Ghamat, S. Cap-and-trade under a dual-channel setting in the presence of information asymmetry. Eur. J. Oper. Res. 2025, 322, 500–510. [Google Scholar]
  33. Tan, R.; Lin, B. The long term effects of carbon trading markets in China: Evidence from energy intensive industries. Sci. Total Environ. 2022, 806, 150311. [Google Scholar] [CrossRef] [PubMed]
  34. Lin, C.-C.; Zhang, S.-Y.; Chou, Y.-L.; Liu, W.-Y. Energy management scheduling of a smart factory with carbon capture and storage, carbon emission quota cap-and-trade, and green energy trading. Energy 2025, 333, 137231. [Google Scholar]
  35. Dye, C.-Y.; Hsieh, T.-P. A sustainable dynamic optimization model of pricing and advertising in the presence of green innovation investment. Eur. J. Oper. Res. 2024, 315, 654–667. [Google Scholar] [CrossRef]
  36. Zhang, Y.; Huang, M.; Wu, Y.; Cao, Z.; Lin, Y.; Zhang, J.; Wang, X. Green forth-party logistics network design under carbon cap-and-trade policy. Int. J. Prod. Econ. 2025, 282, 109540. [Google Scholar]
  37. Nguyen, M.A.T.; Yu, M.M.; Lirn, T.C. Airlines’ eco-productivity changes and the European union emissions trading system. Transp. Res. Part D Transp. Environ. 2022, 102, 103100. [Google Scholar] [CrossRef]
  38. Zhang, C.; Li, H.; Tian, Y. Manufacturer’s carbon abatement strategy and selection of spent power battery collecting mode based on echelon utilization and cap-and-trade policy. Comput. Ind. Eng. 2023, 177, 109079. [Google Scholar]
  39. Chen, X.; Wang, X.; Xia, Y. Low-carbon technology transfer between rival firms under cap-and-trade policies. IISE Trans. 2022, 54, 105–121. [Google Scholar]
  40. Chai, Q.; Sun, M.; Lai, K.-H.; Xiao, Z. The effects of government subsidies and environmental regulation on remaufacturing. Comput. Ind. Eng. 2023, 178, 109126. [Google Scholar]
  41. Wang, Z.; Brownlee, A.E.I.; Wu, Q. Production and joint emission reduction decisions based on two-way cost-sharing contract under cap-and-trade regulation. Comput. Ind. Eng. 2020, 146, 106549. [Google Scholar]
  42. Hafezi, M.; Zhao, X.; Zolfagharinia, H. Together we stand? Co-opetition for the development of green products. Eur. J. Oper. Res. 2023, 306, 1417–1438. [Google Scholar]
  43. Feng, Y.; Lai, K.; Zhu, Q. Green supply chain innovation: Emergence, adoption, and challenges. Int. J. Prod. Econ. 2022, 248, 108497. [Google Scholar] [CrossRef]
  44. Tao, F.; Wang, Y.-Y.; Zhu, S.-H. Impact of blockchain technology on the optimal pricing and quality decisions of platform supply chains. Int. J. Prod. Res. 2023, 61, 3670–3684. [Google Scholar]
  45. Liu, Z.; Lang, L.; Hu, B.; Shi, L.; Huang, B.; Zhao, Y. Emission reduction decision of agricultural supply chain considering carbon tax and investment cooperation. J. Clean. Prod. 2021, 294, 126305. [Google Scholar] [CrossRef]
  46. Zhang, H.; Li, P.; Zheng, H.; Zhang, Y. Impact of carbon tax on enterprise operation and production strategy for low-carbon products in a co-opetition supply chain. J. Clean. Prod. 2021, 287, 125058. [Google Scholar]
  47. Liu, J.; Ke, H.; Gao, Y. Manufacturer’s R&D cooperation contract: Linear fee or revenue-sharing payment in a low-carbon supply chain. Ann. Oper. Res. 2022, 318, 323–355. [Google Scholar]
  48. Li, X.; Zhang, G.; Xu, H. Cooperation of firms’ environmental innovation in a supply chain under government regulation. Comput. Ind. Eng. 2024, 192, 110232. [Google Scholar] [CrossRef]
  49. Kraft, T.; Raz, G. Collaborate or compete: Examining manufacturers’ replacement strategies for a substance of concern. Prod. Oper. Manag. 2017, 22, 1035–1055. [Google Scholar]
  50. El Ouardighi, F.; Sim, J.; Kim, B. Pollution accumulation and abatement policies in two supply chains under vertical and horizontal competition and strategy types. Omega 2021, 98, 102108. [Google Scholar] [CrossRef]
  51. Liu, L.; Feng, L.; Jiang, T.; Zhang, Q. The impact of supply chain competition on the introduction of clean development mechanisms. Transp. Res. Part E Logist. Transp. Rev. 2021, 155, 102506. [Google Scholar] [CrossRef]
  52. Ji, J.; Li, T.; Yang, L. Pricing and carbon reduction strategies for vertically differentiated firms under Cap-and-Trade regulation. Transp. Res. Part E Logist. Transp. Rev. 2023, 171, 103064. [Google Scholar]
  53. Ran, W.; Duan, Y. Competing manufacturers blockchain technology adoption strategies for carbon emission misrepresentation under cap-and-trade regulation. Comput. Ind. Eng. 2025, 203, 110960. [Google Scholar]
  54. Li, L.; Guo, Q.; Li, Y.; Wang, C.; Hou, P. Information sharing in platform supply chains under manufacturer competition and cap-and-trade. Transp. Res. Part E Logist. Transp. Rev. 2025, 203, 104361. [Google Scholar] [CrossRef]
  55. Yu, W.; Wang, Y.; Feng, W.; Bao, L.; Han, R. Low carbon strategy analysis with two competing supply chain considering carbon taxation. Comput. Ind. Eng. 2022, 169, 108203. [Google Scholar] [CrossRef]
  56. Cao, K.; Mei, Y.; Liu, Y. Collaboration or competition? Low-carbon platform regulations and pricing decisions in environmental, social, and governance (ESG). Clean. Eng. Technol. 2025, 28, 101044. [Google Scholar] [CrossRef]
  57. Rahmani, S.; Haeri, A.; Hosseini-Motlagh, S.M. Proposing channel coordination and horizontal cooperation in two competitive three-echelon reverse supply chains. Int. Trans. Oper. Res. 2020, 27, 1447–1477. [Google Scholar]
  58. Saha, S.; Nielsen, I. Strategic integration decision under supply chain competition in the presence of online channel. Symmetry 2020, 13, 58. [Google Scholar] [CrossRef]
  59. Yang, W.; Yang, Y.; Chen, H. How to stimulate Chinese energy companies to comply with emission regulations? Evidence from four-party evolutionary game analysis. Energy 2022, 258, 124867. [Google Scholar] [CrossRef]
  60. Yu, W.; Hou, G.; He, Y.; Xin, B. Dynamic coopetition game between private label and national brand under carbon trading policy. Heliyon 2023, 9, el4348. [Google Scholar] [CrossRef]
  61. Zhang, W.; Mao, Q.; Pan, X.; Luo, R.; Liang, L. Two-stage hybrid electricity market trading strategy optimization with renewable electricity under cap-and-trade policy. Energy Econ. 2025, 150, 108764. [Google Scholar]
  62. Shang, W.; Han, Z.; Wei, W.; Li, T. Competition and cooperation between green and non-green supply chains under Government’s subsidy and carbon tax to consumers. Comput. Ind. Eng. 2025, 203, 110957. [Google Scholar]
  63. Zhou, W.; Shi, Y.; Zhao, T.; Cao, X.; Li, J. Government regulation, horizontal coopetition, and low-carbon technology innovation: A tripartite evolutionary game analysis of government and homogeneous energy enterprises. Energy Policy 2024, 184, 113844. [Google Scholar]
  64. Dong, S.; Wu, X. Technology choice under the cap-and-trade policy: The impact of emission cap and technology efficiency. Eur. J. Oper. Res. 2025, 326, 286–298. [Google Scholar]
  65. Schader, C.; Lindenthal, T.; Markut, T.; Hörtenhuber, S. Carbon Footprint of Organic Products; Research Institute of Organic Agriculture: Frick, Switzerland; Biofach: Nuremberg, Germany, 2010. [Google Scholar]
  66. Sabzevar, N.; Enns, S.; Bergerson, J.; Kettunen, J. Modeling competitive firms’ performance under price-sensitive demand and cap-and-trade emissions constraints. Int. J. Prod. Econ. 2017, 184, 193–209. [Google Scholar]
  67. Du, S.; Zhu, Y.; Zhu, Y.; Tang, W. Allocation policy considering firm’s time-varying emission reduction in a cap-and-trade system. Ann. Oper. Res. 2020, 290, 543–565. [Google Scholar]
  68. Wang, L.; Xu, T.; Chen, T. Optimal strategies in green supply chains when considering consumers’ green preferences and government subsidies. Mathematics 2025, 13, 2209. [Google Scholar] [CrossRef]
  69. Yang, T.; Zhan, Y.; Tang, H. Optimizing low-carbon supply chain decisions considering carbon trading mechanisms and date-driven marketing: A fairness concern perspective. Mathematics 2026, 14, 104. [Google Scholar]
  70. Yang, W.; Pan, Y.; Ma, J.; Yang, T.; Ke, X. Effects of allowance allocation rules on green technology investment and product pricing under the cap-and-trade mechanism. Energy Policy 2020, 139, 111333. [Google Scholar]
  71. Pathak, D.; Malakar, D. Willingness to pay more for green products: A challenge for young consumers. EuroMed J. Manag. 2024, 6, 281–293. [Google Scholar] [CrossRef]
  72. Zhong, S.; Chen, J. How Environmental Beliefs Affect Consumer Willingness to Pay for the Greenness Premium of Low-Carbon Agricultural Products in China: Theoretical Model and Survey-based Evidence. Sustainability 2019, 11, 592. [Google Scholar]
  73. Zhou, D.; Yu, Y.; Wang, Q.; Zha, D. Effects of a generalized dual-credit system on green technology investments and pricing decisions in a supply chain. J. Environ. Manag. 2019, 247, 269–280. [Google Scholar] [CrossRef]
  74. Du, S.; Zhu, L.; Liang, L.; Ma, F. Emission-dependent supply chain and environment-policy-making in the ‘cap-and-trade’ system. Energy Policy 2013, 57, 61–67. [Google Scholar]
  75. Ji, J.; Zhang, Z.; Yang, L. Comparisons of initial carbon allowance allocation rules in an O2O retail supply chain with the cap-and-trade regulation. Int. J. Prod. Econ. 2017, 187, 68–84. [Google Scholar]
  76. Weitzman, M.L. Can negotiating a uniform carbon price help to internalize the global warming externality. J. Assoc. Environ. Resour. Econ. 2014, 1, 29–49. [Google Scholar] [CrossRef]
  77. Xiang, Y.; Qing, G.; Fang, M.; Li, Z.; Yao, H.; Liu, J.; Guo, Z.; Liu, J.; Zeng, P. A carbon emission allowance bargaining model for energy transactions among prosumers. IEEE Trans. Power Syst. 2024, 39, 6095–6098. [Google Scholar] [CrossRef]
  78. Wang, D.; Yin, Y.; Zhu, M. Research on Emission Reduction Decision of Supply Chain Based on Different Carbon Quota Trading Path. J. Oper. Res. Manag. Sci. 2024, 33, 35–41. [Google Scholar]
  79. Wang, Y.; Li, J.; Gao, Y.; Xu, H.; Dong, J.; Qu, D.; Liu, Q. Process monitoring and adjustment method with application to real-time electricity and internal carbon pricing models under reputation theory. Energy Econ. 2025, 152, 108983. [Google Scholar] [CrossRef]
  80. Xue, F.; Liao, Z.; Qian, Q.; Jiao, Z. Impact of carbon transfer and low carbon preferences on firm decision making under two power structures. Sustainability 2025, 17, 4956. [Google Scholar] [CrossRef]
  81. Ruan, Q.; Bai, M. Cost comparison of long-process and short-process steelmaking in China. China Steel Ind. 2019, 10, 58–60. [Google Scholar]
Figure 1. The carbon trading structure.
Mathematics 14 02441 g001
Figure 2. The impact of the cost difference on MG’s market pricing ( p e E = 0.1 ).
Mathematics 14 02441 g002
Figure 3. The inequality relationship of MG’s output and emission reduction in the two trading modes.
Mathematics 14 02441 g003
Figure 4. The impacts of Δ c and E g L on manufacturers’ choices of quota trading modes ( k = 0.1 ).
Mathematics 14 02441 g004
Table 1. Comparison of this paper and most relevant studies.
LiteraturePartners and Power StructureCAT PolicyHorizontal CoopetitionEmission Reduction Efforts/OutcomesExogenous Carbon PriceInternal and External Carbon Trading PricesCarbon Quota Surplus
Qin et al. [6]a manufacturer/remanufacturer
Li et al. [48]a leading manufacturer and
a following retailer
Ji et al. [52]two vertically differentiated
manufacturers
Ran and Duan [53]competing manufacturers
Li et al. [54]competing manufacturers
Yu et al. [60]private label retailers and national brand manufacturers
Shang et al. [62]green and non-green supply chains
Zhou et al. [63]local government and energy enterprises
Dong and Wu [64]competing manufacturers
This studycompeting manufacturers
Table 2. Notations and descriptions.
Parameters
e _ g ,   e _ t Initial emission intensities of MG and MT, respectively
Δ c Cost difference between products manufactured by MG and MT
η The difficulty of emission reduction
k Consumers’ low-carbon awareness
E g ,   E t Total amount of carbon quotas allocated by the government to MG and MT, respectively
p e E The external carbon price
p e I The internal carbon price between MG and MT
Variables
q g ,   q t The production of MG and MT, respectively
e The volume of emission reduction
p g ,   p t Market prices per unit of product of MG and MT, respectively
π G ,   π T Profits of MG and MT, respectively
Table 3. Equilibrium solutions in different models with high emission reduction difficulty ( η ).
ModelsEquilibrium Solutions
Model E e E * = 0
q g E * = 1 + k 2 Δ c + e _ t 2 e _ g p e 3 + k ,   q t E * = 1 k 1 + Δ c + e _ g p e 2 e _ t p e 1 k 3 + k
p g E * = 1 + k 1 + Δ c + e _ g p e + e _ t p e 3 + k ,   p t E * = 1 k 1 + Δ c + e _ g p e + e _ t p e 1 + k 3 + k
Model LI e L I * = 0
q g L I * = 1 + k 2 Δ c + e _ t p e 2 e _ g p e 3 + k ,   q t L I * = 1 k 1 + Δ c + e _ g p e 2 e _ t p e 1 k 3 + k
p g L I * = 1 + k 1 + Δ c + e _ g p e + e _ t p e 3 + k ,   p t L I * = 1 k 1 + Δ c + e _ g p e + e _ t p e 1 + k 3 + k
Model HI e H I * = 0
q g H I * = 1 + k 2 Δ c + e _ t p e I 2 e _ g p e E 3 + k ,   q t H I * = 1 k 1 + Δ c + e _ g p e E 2 e _ t p e I 1 k 3 + k
p g H I * = 1 + k 1 + Δ c + e _ g p e E + e _ t p e I 3 + k ,   p t H I * = 1 k 1 + Δ c + e _ g p e E + e _ t p e I 1 + k 3 + k
Table 4. Major threshold values ( k = 0.1 ).
Δ c 1 E Δ c 2 E Δ c 1 L Δ c 2 L Δ c q L Δ c e L η 1 η 2 η 3
η ,   p e I = 0.04 −0.7770.573−0.7660.584 0.4890.021/0.558
η ,   p e I = 0.08 −0.7770.573−0.7900.560 0.465/0.0270.633
η = 1.0 ,   p e I = 0.04 −0.7490.573−0.7440.584−1.7950.4920.021/0.558
η = 1.0 ,   p e I = 0.08 −0.7490.573−0.7540.560−1.5150.470/0.0270.633
η = 0.2 ,   p e I = 0.04 −0.6370.573−0.6560.5840.1400.5040.021/0.558
η = 0.2 ,   p e I = 0.08 −0.6370.573−0.6080.5600.1910.487/0.0270.633
Table 5. The impacts of the internal carbon price on manufacturers’ profits and carbon emissions.
p e I k = 0.1 k = 0.2
π G L I * π T L I * T π L I * C E G L I * C E T L I * T C E L I * π G L I * π T L I * T π L I * C E G L I * C E T L I * T C E L I *
0.050.04280.11900.16180.10320.68830.79150.05420.09410.14830.11480.63950.7543
0.060.04350.11910.16260.10090.69180.79280.05480.09400.14880.11280.64250.7553
0.0620.04370.11910.16280.10040.69260.79300.05500.09400.14900.11240.64370.7555
0.070.04420.11910.16330.09870.69530.79400.05540.09390.14930.11090.64560.7564
0.080.04490.11920.16410.09650.69870.79530.05600.09370.14970.10890.64860.7575
0.090.04570.11920.16490.09440.70220.79650.05660.09360.15020.1070.65160.7587
0.100.04650.11910.16560.09220.70560.79780.05730.09330.15060.10520.65470.7598
0.110.04730.11900.16630.09010.70900.79920.05800.09310.15110.10330.65770.7610
T π L I * = π G L I * + π T L I * . The bold parts indicate the profits and carbon emissions of the two manufacturers under the external trading mode ( p e E = 0.062 ), which serves as the benchmark for comparison. The shaded parts represent scenarios where the profits increase, and the carbon emissions decrease relative to the benchmark.
Table 6. The impact of an internal carbon price on manufacturers’ profits and carbon emissions.
p e I k = 0.1 k = 0.2
π G H I * π T H I * T π H I * C E G H I * C E T H I * T C E H I * π G H I * π T H I * T π H I * C E G H I * C E T H I * T C E H I *
0.050.05720.13970.19690.09850.71410.81260.06860.11400.18260.11060.66700.7776
0.060.06160.13570.19730.10210.68540.78750.07290.11080.18370.11390.63570.7495
0.0620.06250.13490.19730.10280.67970.78250.07360.11020.18390.11460.62950.7439
0.070.06550.13200.19750.10570.65670.76240.07660.10800.18460.11710.60430.7215
0.080.06890.12870.19760.10930.62800.73730.07970.10570.18540.12040.57300.6934
0.090.07180.12580.19760.11290.59930.71210.08230.10370.18600.12360.54170.6653
0.100.07420.12320.19740.11650.57060.68700.08440.10210.18650.12690.51040.6373
The bold parts indicate the profits and carbon emissions of the two manufacturers under the external trading mode ( p e E = 0.062 ), which serves as the benchmark for comparison. The shaded parts represent scenarios where the profits increase, and the carbon emissions decrease relative to the benchmark.
Disclaimer/Publisher’s Note: The statements, opinions and data contained in all publications are solely those of the individual author(s) and contributor(s) and not of MDPI and/or the editor(s). MDPI and/or the editor(s) disclaim responsibility for any injury to people or property resulting from any ideas, methods, instructions or products referred to in the content.