


Abstract
Raw sentiment extracted from Chinese financial news is noisy and difficult to use directly for market prediction. This study proposes a mathematical filtering framework that converts noisy Chinese financial news sentiment into reliable quantitative signals for financial market prediction. Three daily sentiment measures were constructed from Chinese financial news: sentiment mean, sentiment dispersion, and polarity imbalance. Seven filtering methods were applied to each measure, including exponential smoothing, autoregressive filtering, ARIMA filtering, moving average smoothing, discrete wavelet transform, Savitzky–Golay filtering, and Kalman filtering. The seven filtered outputs were averaged to produce an ensemble-smoothed sentiment signal. Support vector machines and neural networks were then used to compare the predictive performance of raw and filtered signals for stock index log returns and realized volatility. Filtering reduced the standard deviation of sentiment mean by 48%, sentiment dispersion by 55%, and polarity imbalance by 50%, while mean levels remained stable. Filtered sentiment consistently outperformed raw sentiment across all model configurations. The improvement was larger for realized volatility than for returns: the best support vector machine reduced volatility prediction error by 16.9% and return prediction error by 5.8%. A moderate neural network with 20 hidden neurons achieved optimal performance for both outcomes. Mathematical filtering extracts stable and informative sentiment signals from Chinese financial news. Filtered sentiment is more useful than raw sentiment for predicting market volatility, and the improvement holds across multiple machine learning models.
Keywords:
Chinese financial news; sentiment analysis; signal filtering; realized volatility; machine learning; stock market prediction MSC:
62M10; 91G70; 68T50; 91G15
1. Introduction
Financial markets respond not only to fundamental economic information but also to how information is interpreted, emotionally framed, and disseminated among market participants. In modern capital markets, the information environment is dense and heterogeneous. News articles, official regulatory announcements, earnings disclosures, analyst commentaries, and social media discussions collectively shape investor expectations and risk perceptions. Among these sources, financial news occupies a particularly prominent position because financial news bridges macroeconomic conditions, corporate events, regulatory policies, and the psychological state of market participants. When investors read financial news, they do not extract purely factual content. Investors simultaneously absorb the emotional tone of the text, including optimism, uncertainty, caution, fear, or confidence, and incorporate this tone into investment decisions [1,2,3,4,5].
Chinese financial news has several distinctive characteristics that differentiate it from financial news in other markets. First, Chinese financial news is heavily influenced by policy-related language. Monetary policy adjustments, fiscal stimulus packages, industrial guidance documents, regulatory supervision notices, and official government statements frequently appear in Chinese financial news and may prompt immediate, substantial investor reactions. The language of Chinese policy communication is often formal, indirect, and subject to interpretation, which means that different readers may extract different sentiment signals from the same article. Second, Chinese financial news frequently contains sector-specific narratives that evolve over time. Narratives about technology self-sufficiency, real estate stabilization, consumption recovery, export pressure, and energy transition can amplify investor attention toward particular market segments and create temporary but powerful sentiment dynamics. Third, the Chinese language introduces significant computational challenges for sentiment analysis. Word segmentation ambiguity is a fundamental problem because Chinese text is written without spaces between words. Contextual sentiment reversal is common in Chinese financial text. A phrase that appears positive in general language may carry a negative meaning in a financial context. Idiomatic expressions and domain-specific terminology further complicate sentiment classification. For example, the term meaning “tightening” may indicate policy discipline, liquidity contraction, or credit risk control. The meaning depends on context, and each interpretation carries a different sentiment implication for different market participants [6,7,8,9,10].
Because of these features, the raw sentiment score derived from Chinese financial news is rarely a clean, reliable signal. Raw sentiment may exhibit excessive volatility due to duplicated articles across multiple platforms, short-term reporting bursts following major events, sensational headlines that overstate the significance of news, and reporting delays that mix predictive and reactive information. Using raw sentiment to directly predict financial indicators may therefore lead to unstable, inconsistent, or misleading conclusions. A mathematically filtered sentiment signal, by contrast, may better capture the persistent component of market sentiment while attenuating short-term textual noise.
This study develops a mathematical filtering and prediction framework for Chinese financial news sentiment signals. The central idea is that the observed daily sentiment signal should be formally decomposed into a smooth latent sentiment component, an abnormal-event-driven component, and random noise. The observed sentiment signal at time can be expressed as:
where is the observed raw sentiment signal, is the latent smoothed sentiment component that reflects persistent investor attitudes, represents abnormal event-related sentiment shocks, and is the random noise term. The Gaussian assumption for is adopted as a working approximation that enables tractable state-space filtering and is consistent with the Kalman filter framework. It does not imply that raw sentiment is exactly normally distributed in finite samples. Empirical skewness, kurtosis, and Jarque–Bera statistics are reported later in Section 3.1 to characterize the actual distribution of raw sentiment. Extensions to non-Gaussian or heavy-tailed noise structures, such as robust Kalman filtering or particle filtering, are acknowledged as a limitation and future research direction. The smoothed component can be further expressed as:
where denotes the central tendency of the sentiment signal at time t and denotes moderate sentiment fluctuation around the underlying trend. Abnormal sentiment shocks can be expressed as:
where is the magnitude of the abnormal sentiment shock occurring at event time , n is the total number of abnormal events within the observation period, and is an indicator function that equals one when and zero otherwise.
1.1. Literature Review
The primary purpose of this study is to propose and evaluate a mathematical filtering framework for Chinese financial news sentiment. Raw sentiment data derived from financial news is vulnerable to at least four distinct types of noise. First, language-processing noise may occur because Chinese word segmentation and sentiment classification are inherently imperfect. Segmentation errors can cause meaningful financial terms to be split or merged incorrectly, and domain-specific sentiment dictionaries may not cover all relevant expressions. Second, media noise may arise from repeated publication, article syndication across platforms, and headline emphasis that exaggerates the emotional content of news. Third, event noise may occur when sudden events temporarily dominate news coverage but do not represent a persistent or fundamental shift in investor sentiment. A single major event may generate hundreds of articles within a short period, creating a temporary spike in sentiment that does not reflect a sustained change in market psychology. Fourth, market-feedback noise may arise when financial news reports market movements after they have already occurred, creating a mixture of predictive and reactive sentiment within the same corpus.
Filtering techniques are appropriate for addressing these issues. Individual filtering methods offer specific advantages. Exponential smoothing assigns greater weight to recent observations and is suitable for capturing short-term sentiment adjustment while attenuating older observations. Autoregressive and ARIMA models capture temporal dependence in the sentiment series and can model the persistence of investor attitudes. Moving-average smoothing removes temporary fluctuations by averaging recent values within a fixed window. The discrete wavelet transform decomposes sentiment into high-frequency noise components and low-frequency trend components. Savitzky–Golay filtering preserves local shape characteristics while reducing noise, which is particularly useful when the curvature of the sentiment signal carries meaningful information. Kalman filtering dynamically updates latent sentiment estimates using a state-space representation, making Kalman filtering well-suited for real-time monitoring applications [11,12,13,14,15,16,17,18].
However, relying on a single filtering method may introduce method-specific bias. A moving average may lag behind rapid shifts in sentiment. Exponential smoothing may overemphasize very recent observations at the expense of medium-term patterns. Wavelet filtering may be sensitive to the choice of decomposition level and wavelet basis. Kalman filtering requires assumptions about the process and measurement noise covariances, which may be difficult to specify precisely. Therefore, this study combines multiple filtered outputs into a robust ensemble-averaged sentiment signal. The purpose of combining methods is to reduce dependence on a single filtering assumption and to obtain a more stable, reliable representation of latent sentiment. This ensemble approach is consistent with the broader principle in statistical forecasting that combining multiple models or methods tends to reduce variance and improve robustness.
This study focuses on three sentiment dimensions. The first is sentiment mean, which captures the daily average tone of Chinese financial news and represents general optimism or pessimism in the information environment. The second is sentiment dispersion, which captures disagreement or heterogeneity across news articles and reflects uncertainty in interpreting market conditions, consistent with evidence that heterogeneity in expectations is relevant to financial decisions [19]. The third is polarity imbalance, which captures the asymmetry between positive and negative sentiment intensity and represents directional emotional pressure on market participants.
1.2. Research Gap and Contributions
Although financial news sentiment has been widely examined in relation to stock returns, volatility, and investor behavior, many existing studies construct sentiment indicators by directly aggregating article-level or text-level sentiment scores. Tetlock [1] measures media pessimism and examines its relationship with stock market activity; Loughran and McDonald [2] construct financial textual sentiment measures from corporate disclosures; Bollen et al. [3] use aggregated social-media mood indicators to predict stock market movements; and Baker et al. [4] construct an economic policy uncertainty index based on newspaper coverage. These studies provide important foundations for financial sentiment analysis, but their primary focus is on sentiment measurement and predictive association rather than on systematic denoising of the resulting sentiment time series. In particular, relatively limited attention has been paid to whether raw or directly aggregated sentiment indicators contain high-frequency textual noise and whether mathematical filtering can improve their predictive usefulness.
This study does not claim to introduce new filtering algorithms. Its contribution lies in developing and evaluating an integrated filtering and prediction pipeline for Chinese financial news sentiment. The framework contributes to the literature in three ways. First, it constructs a three-dimensional daily sentiment representation comprising sentiment mean, sentiment dispersion, and polarity imbalance, which captures average tone, disagreement, and directional emotional asymmetry simultaneously. Second, it systematically applies and compares seven filtering methods and constructs an ensemble-smoothed sentiment signal that is more robust than any individual method. Third, it evaluates whether filtered sentiment improves the prediction of stock index log returns and realized volatility relative to raw sentiment and standard baseline models, using both support vector machines and neural networks.
1.3. Research Purpose
The primary purpose of this study is to propose and evaluate a mathematical filtering framework for Chinese financial news sentiment. Raw sentiment data derived from financial news is vulnerable to at least four distinct types of noise. First, language-processing noise may occur because Chinese word segmentation and sentiment classification are inherently imperfect. Second, media noise may arise from repeated publication, article syndication across platforms, and headline emphasis that exaggerates the emotional content of news. Third, event noise may occur when sudden events temporarily dominate news coverage but do not represent a persistent or fundamental shift in investor sentiment. Fourth, market-feedback noise may arise when financial news reports market movements after they have already occurred, creating a mixture of predictive and reactive sentiment within the same corpus.
Filtering techniques are appropriate for addressing these issues. Individual filtering methods offer specific advantages. Exponential smoothing assigns greater weight to recent observations and is suitable for capturing short-term sentiment adjustment. Autoregressive and ARIMA models represent temporal dependence in the sentiment series. Moving-average smoothing removes temporary fluctuations by averaging recent values within a fixed window. The discrete wavelet transform decomposes sentiment into high-frequency noise components and low-frequency trend components. Savitzky–Golay filtering preserves local shape characteristics while reducing noise. Kalman filtering dynamically updates latent sentiment estimates using a state-space representation.
However, relying on a single filtering method may introduce method-specific bias. Therefore, this study combines multiple filtered outputs into a robust ensemble-averaged sentiment signal. This ensemble approach is consistent with the broader principle in statistical forecasting that combining multiple models or methods tends to reduce variance and improve robustness [12].
This study focuses on three sentiment dimensions. The first is sentiment mean, which captures the daily average tone of Chinese financial news. The second is sentiment dispersion, which captures disagreement or heterogeneity across news articles. The third is polarity imbalance, which captures the asymmetry between positive and negative sentiment intensity.
1.4. Chinese Financial News Sentiment and Research Questions
Let denote the sentiment score of article published on day , where and is the number of financial news articles collected on day The daily sentiment mean is defined as:
The daily sentiment dispersion is defined as:
The daily polarity imbalance is defined as:
where is the aggregate positive sentiment intensity on day , is the aggregate negative sentiment intensity, and the constant one in the denominator prevents division by zero. The raw daily sentiment vector is:
After applying the filtering framework, the smoothed sentiment vector is:
The central research questions of this study are as follows. First, can mathematical filtering effectively reduce noise in Chinese financial news sentiment without eliminating meaningful market information? Second, do filtered sentiment mean, sentiment dispersion, and polarity imbalance provide improved predictive performance for market returns and volatility compared with raw sentiment signals? Third, which machine learning model configurations are most suitable for connecting filtered sentiment signals with financial market indicators?
1.5. Research Structure
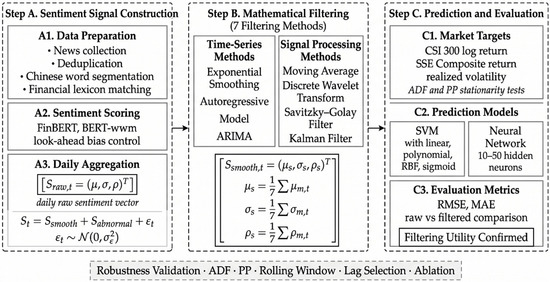
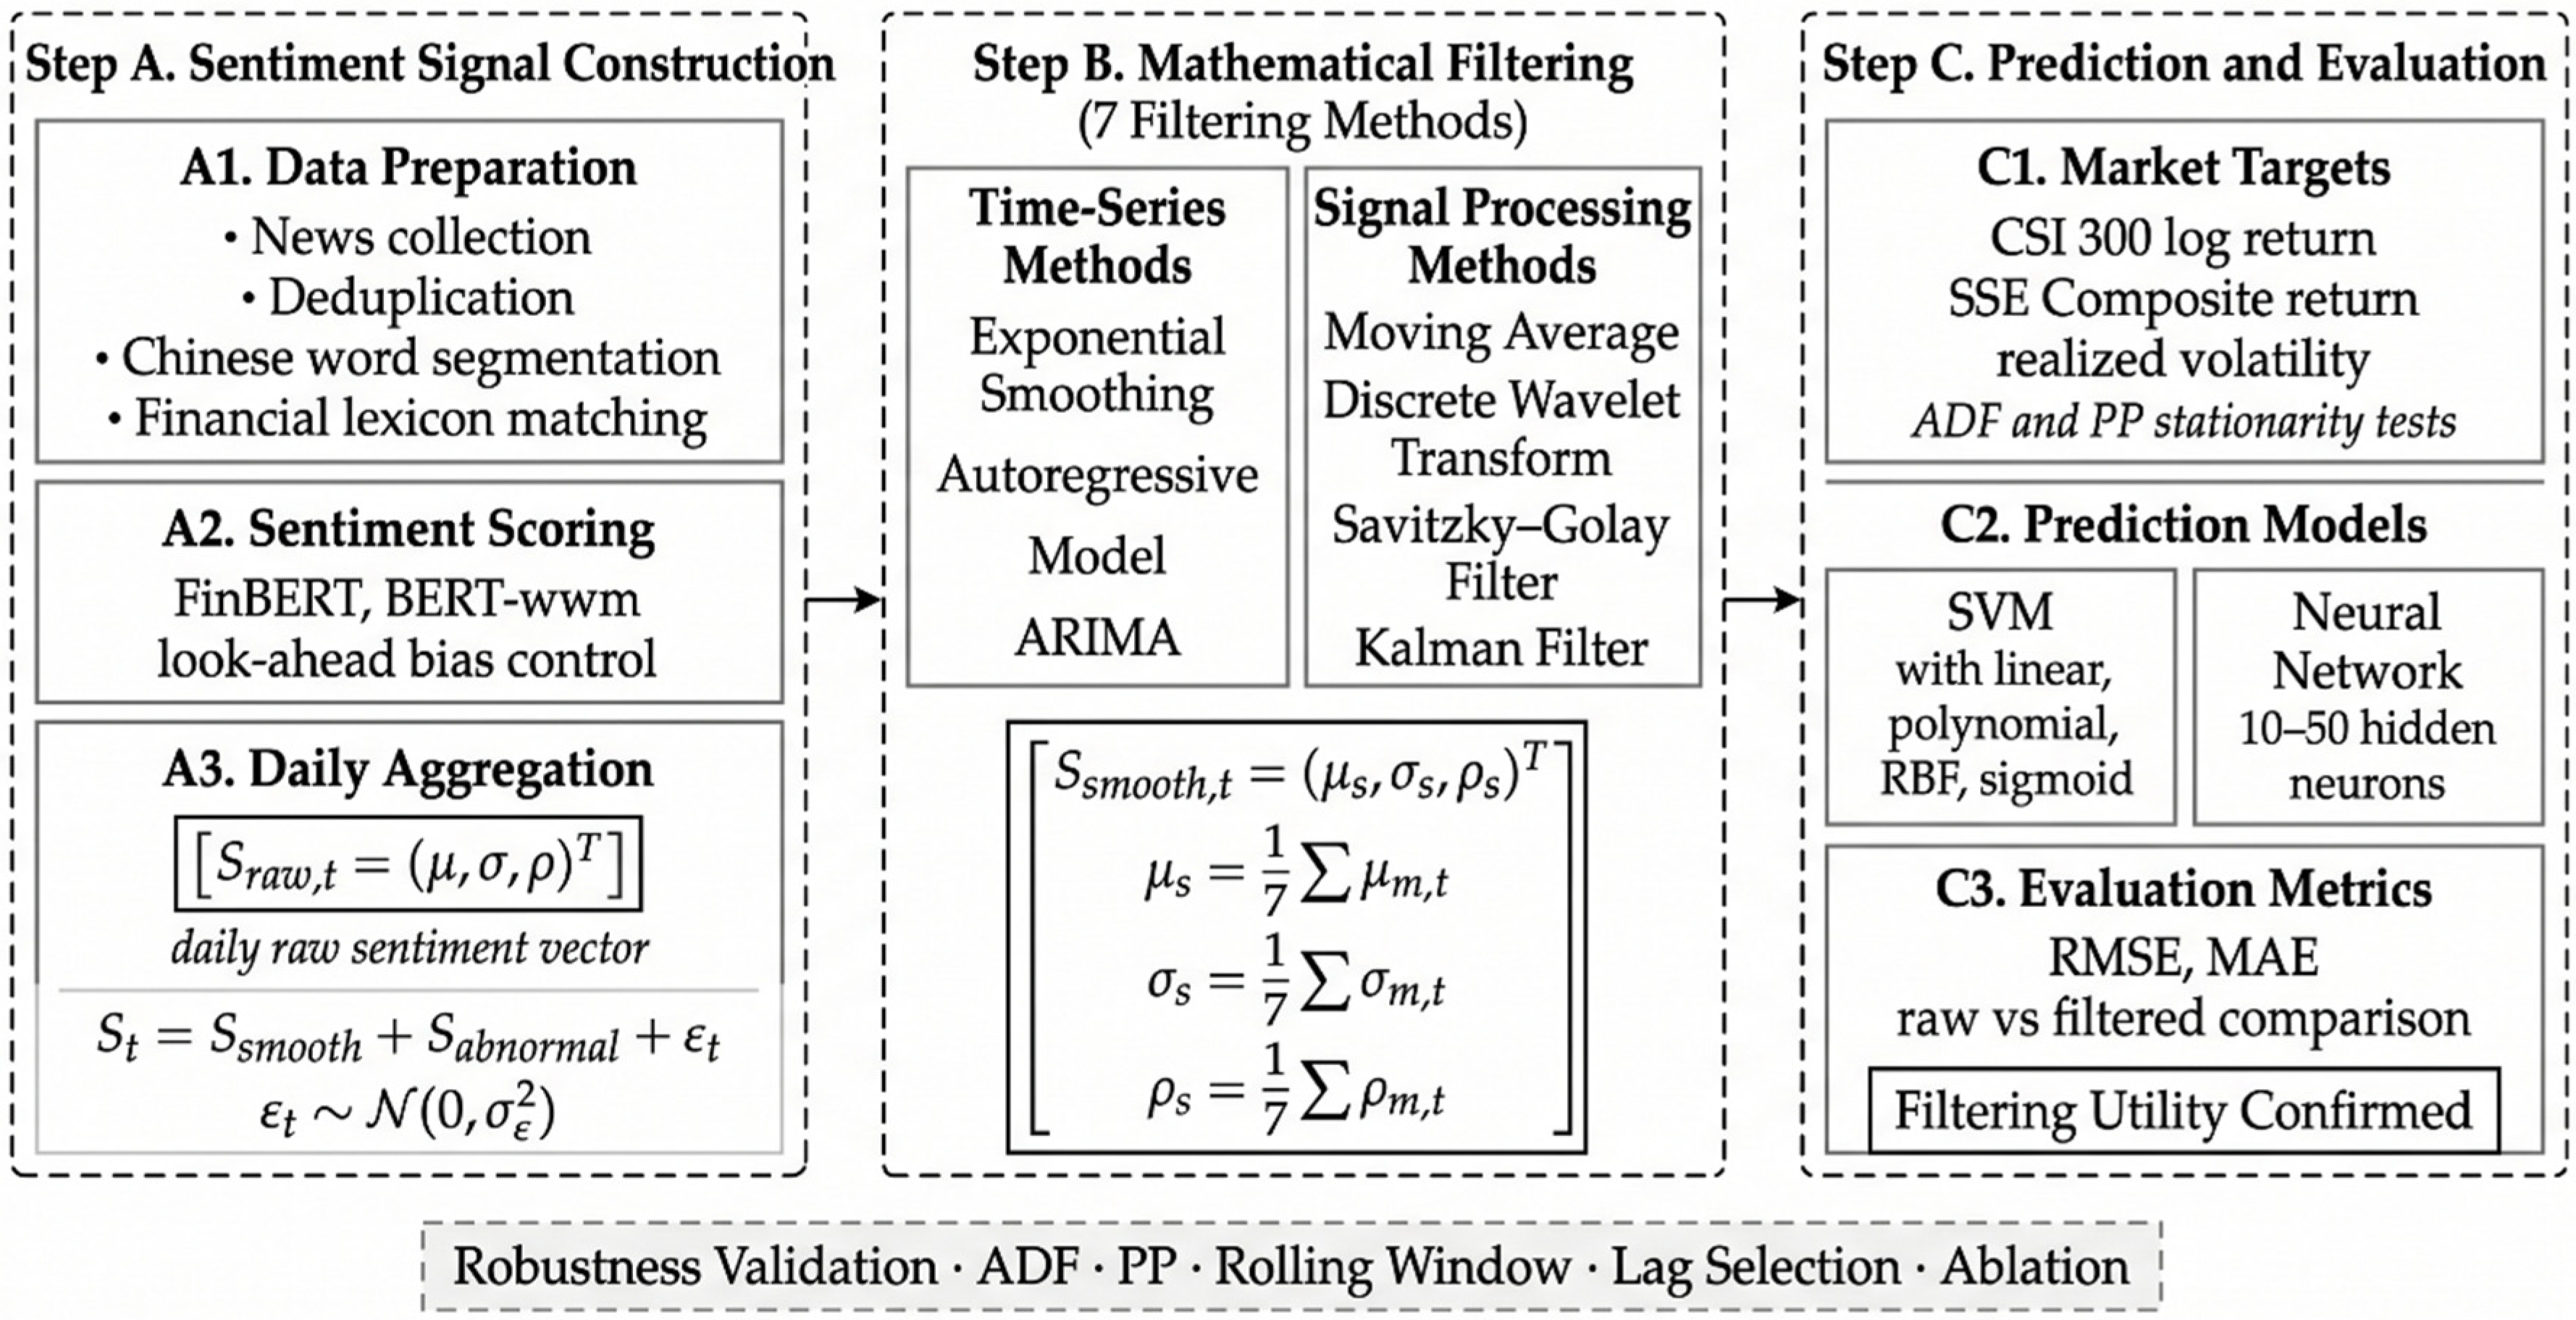
The research process follows three main steps, as shown in Figure 1. In Step A, Chinese financial news articles are collected, cleaned, deduplicated, and segmented. Each article is transformed into a sentiment score. Daily sentiment mean, dispersion, and polarity imbalance are then calculated from the article-level scores.
Figure 1.
Research framework for filtering Chinese financial news sentiment and predicting the financial market.
In Step B, the raw sentiment vector is filtered using seven methods: exponential smoothing, autoregressive filtering, ARIMA filtering, moving-average smoothing, discrete wavelet transform, Savitzky–Golay filtering, and Kalman filtering. Each method produces filtered estimates of all three sentiment components. The method-specific filtering results are reported in Section 4.2, and the final smoothed sentiment vector is obtained by averaging the seven filtered outputs. The final smoothed sentiment vector is obtained by averaging the seven filtered outputs, thereby producing an ensemble-smoothed representation that is more robust than any single method.
In Step C, the filtered sentiment signals are used to predict financial market indicators. Before prediction, stationarity tests are applied to the market indicators. Non-stationary variables are transformed by logarithmic transformation or differencing. Support vector machines and neural networks are then used to compare the predictive performance of raw and filtered sentiment signals. Baseline comparisons and ablation analyses are also conducted to evaluate the contribution of individual filtering methods and individual sentiment components.
To make the information flow explicit, the pipeline can be read as a step-by-step sequence. At the article stage, only timestamped article information available at publication, including title, body text, source identifier, category, and publication time, is used to compute article-level sentiment scores. At the daily aggregation stage, articles assigned to trading day t are converted into sentiment mean, sentiment dispersion, and polarity imbalance. At the filtering stage, each daily sentiment component is filtered causally, with all filtering parameters selected inside rolling training windows and without using observations after t. At the prediction stage, the filtered sentiment vector available at t is standardized using training-sample statistics and used to predict the market outcome at t + 1. This sequence clarifies both what information is available and what quantity is computed at each stage of the framework. Figure 1. Research framework for filtering Chinese financial news sentiment and predicting the financial market.
1.6. Market Indicators as Outcomes
The market indicators in this study include Chinese stock index log returns and realized volatility. The China Securities Index 300 (CSI 300) is a broad benchmark that reflects the performance of the 300 largest and most liquid A-share companies listed on the Shanghai and Shenzhen stock exchanges. The Shanghai Stock Exchange Composite Index (SSE Composite) is also widely used to represent the overall condition of the Chinese equity market.
Let denote the closing price of a market index at day t. The log return is defined as:
Because this study uses daily index data rather than intraday high-frequency data, realized volatility is measured as a rolling-window proxy based on squared daily log returns. This approach follows the standard realized-volatility literature when high-frequency intraday data are unavailable [20,21]. Specifically, for a rolling window of length , the realized volatility proxy is defined as:
where is the rolling window length, set to 20 trading days in the empirical implementation, and is the average return within the rolling window. Following Andersen and Bollerslev [20] and Zhang et al. [21], no square-root transformation is applied in the construction of . A logarithmic transformation is subsequently applied to before prediction to stabilize variance.
Market volatility is included as an outcome because sentiment dispersion and polarity imbalance may be more closely related to market uncertainty than to return direction.
2. Computation
This section provides the mathematical foundation of the proposed framework. The framework contains four computational components: sentiment signal construction, sentiment signal filtering, market indicator transformation, and machine learning prediction.
2.1. Chinese Financial News Sentiment Signal Construction
Suppose that a corpus of Chinese financial news articles is collected over T trading days. On each day t, there are articles. Each article is transformed into a sentiment score . In the empirical implementation of this study, a dictionary-based Chinese financial sentiment lexicon is used for sentiment scoring. The use of pretrained language models such as FinBERT or BERT-wwm-ext, fine-tuned on financial text, is discussed as a methodological alternative but is not used in the reported experiments. Recent studies have also explored large language models and graph neural network architectures for financial sentiment analysis [22]. The dictionary-based method is selected for transparency and reproducibility, as it does not require access to proprietary model weights or fine-tuning datasets.
For a dictionary-based method, each article is segmented into tokens using a financial-domain Chinese word segmentation tool. Let denote token k in article j on day t. The article-level sentiment score is computed as:
where is the sentiment weight assigned to token from the financial sentiment dictionary. Positive financial terms receive positive weights, negative financial terms receive negative weights, and neutral terms receive zero weights.
For a machine-learning-based sentiment model, the article sentiment score is expressed as:
where is the predicted probability of positive sentiment and is the predicted probability of negative sentiment. The daily raw sentiment vector is then defined as in Equation (7).
2.2. Sentiment Signal Filtering
The observed sentiment vector contains both meaningful information and noise. Filtering is applied separately to each of the three sentiment components. Seven filtering methods are employed. To avoid look-ahead bias, all filtering parameters are estimated or selected using only information available up to time t. The specific procedure for each method is described in the subsections below and summarized in Table A1.
2.2.1. Exponential Smoothing
Exponential smoothing assigns a geometrically decreasing weight to past observations:
where is the smoothing parameter. To avoid look-ahead bias, is selected at each prediction date using only the training window ending at t. Specifically, is chosen by minimizing the one-step-ahead mean squared error within the rolling training window:
where L is the rolling window length. No future observations are used in this selection.
2.2.2. Autoregressive Filtering
Autoregressive filtering represents the current sentiment component as a linear combination of past values:
where c is a constant, p is the lag order, are autoregressive coefficients estimated by ordinary least squares, and is the error term. The lag order p is selected at each prediction date using AIC computed only from observations within the rolling training window ending at t. The maximum candidate lag order is set to . No future observations are used for lag-order selection or coefficient estimation.
2.2.3. ARIMA Filtering
ARIMA filtering extends the autoregressive model by incorporating differencing and a moving-average component:
where d is the order of differencing, q is the moving-average order, and are the moving-average coefficients. The orders p, d, and q are selected at each prediction date using AIC within the rolling training window. The candidate space is and . Unit-root tests are applied within the training window to guide the choice of d. No future observations are used.
2.2.4. Moving Average Smoothing
Moving average smoothing calculates the average value of the sentiment component over a fixed window:
The window length is fixed ex ante at five trading days, corresponding to one trading week. Because the window length is not estimated from the data, no future observations are involved in this step. Only observations up to and including time t are used in the computation.
2.2.5. Discrete Wavelet Transform
The discrete wavelet transform decomposes the sentiment signal into low-frequency approximation components and high-frequency detail components:
where is the approximation component at decomposition level J computed using scaling functions , and is the detail component at level j computed using wavelet basis functions . The filtered signal retains only the approximation component: .
To avoid look-ahead bias, wavelet filtering is implemented within each rolling training window ending at time t. The decomposition level J is selected within the training window by minimizing one-step-ahead validation error over the candidate set . No observations after time t are used in the decomposition or level selection.
2.2.6. Savitzky–Golay Filtering
The standard centered Savitzky–Golay filter fits a polynomial within a window of length centered at time t, which requires observations after time t and therefore introduces lookahead bias. To avoid this, a one-sided causal Savitzky–Golay filter is used in this study. The filter fits a polynomial of degree using only the m+1 observations ending at time t:
where are the convolution coefficients derived from the one-sided least-squares polynomial fitting procedure. For a cubic polynomial, the local approximation uses only . This ensures that no future observations are used in the smoothing step.
2.2.7. Kalman Filtering
Kalman filtering estimates the latent sentiment state using a linear-Gaussian state-space model [16,23]. The state transition equation is:
and the observation equation is:
where is the latent sentiment state vector, F is the state transition matrix, H is the observation matrix, Q is the process noise covariance matrix, and R is the measurement noise covariance matrix. The Kalman filter proceeds through prediction and update steps:
To avoid look-ahead bias, the noise covariance matrices Q and R are initialized from the rolling training window using maximum-likelihood estimation and re-estimated only using observations available up to time t. The Kalman filter then proceeds recursively from the beginning of the training window to time t, using only past and current observations. No future observations are used in the estimation of Q, R, or the latent state.
2.3. Integrated Filtered Sentiment Matrix
Each of the seven filtering methods produces a filtered estimate for each of the three sentiment components. The filtered estimates for sentiment mean are organized as:
Similarly, the filtered estimates for sentiment dispersion and polarity imbalance are organized as and , respectively. The final ensemble-smoothed sentiment components are obtained by averaging the seven filtered outputs:
Equal-weight averaging is used as a transparent benchmark ensemble method. It avoids estimating additional combination weights that may introduce overfitting in finite samples, and it is consistent with the forecast combination literature, which shows that simple averaging often performs comparably to, or better than, more complex weighting schemes [12]. As a robustness check, Section 4.5 also compares equal-weight averaging with validation-error-weighted aggregation, where each method’s weight is proportional to its inverse validation-set RMSE.
The final filtered sentiment matrix is:
2.4. Prevention of Look-Ahead Bias
A critical requirement for the validity of the prediction framework is that no future information is used during filtering, parameter selection, or model training. This section provides a unified description of how look-ahead bias is prevented at each stage.
All filtering parameters are estimated or selected within a rolling training window of length L = 250 trading days. At prediction date t, the training window contains observations from day t − L to day t − 1. Filtering parameters are estimated within this window and applied to produce the filtered sentiment value at time t. The filtered value at time t is then used to predict the market outcome at time t + 1.
Specifically: the exponential smoothing parameter is selected by minimizing one-step-ahead validation error within the training window; AR and ARIMA lag orders are selected by AIC within the training window; the moving-average window is fixed ex ante at five days and requires no estimation; the wavelet decomposition level is selected by validation error within the training window; the Savitzky–Golay filter uses a one-sided causal window; and the Kalman filter noise covariance matrices are estimated by maximum likelihood within the training window and updated recursively using only past observations.
For machine learning models, feature standardization parameters (mean and standard deviation) are computed only from the training sample and then applied to the validation and test samples. Hyperparameters for SVM and neural networks are selected by time-series cross-validation within the training sample. The test sample is never used during model selection or hyperparameter tuning.
The prediction target is the market outcome at time t + 1, using filtered sentiment available at time t. This one-step-ahead prediction design ensures that the sentiment signal precedes the predicted outcome and that no contemporaneous market information is embedded in the input. Table A1 summarizes the parameter selection procedure for each filtering method.
2.5. Making Market Indicators Stationary
Financial market variables may be non-stationary. Following standard unit-root testing practice [24,25], the Augmented Dickey–Fuller test is formulated as:
where k denotes the number of lagged difference terms included in the ADF regression. The null hypothesis of a unit root corresponds to gamma = 0. The ADF results are reported using both the test statistic and the associated p-value. Similarly, the Phillips-Perron test results are reported using both the PP test statistic and the corresponding p-value, so that the two unit-root tests are presented consistently. Depending on the test results, the market variable is transformed as:
2.6. Machine Learning Prediction
The filtered sentiment vector serves as the input variable for prediction:
The prediction target is the transformed market indicator . The prediction is one-step-ahead:
This design ensures that the sentiment signal at time t is used to predict the market outcome at time t + 1, so that no future market information is embedded in the input.
2.6.1. Support Vector Machines
Following [26], the support vector machine prediction function is:
where is the kernel function, are the support vector weights, and b is the bias term. Four kernel functions are considered:
Hyperparameters, including the regularization parameter C, kernel bandwidth , polynomial degree d, and bias c, are selected by time-series cross-validation within the training sample. The candidate grid is , , and . Feature standardization is applied using the training sample mean and standard deviation.
2.6.2. Neural Networks
Following standard neural network formulations [27], a feedforward neural network with one hidden layer is represented as:
where and are weight matrices, and are bias vectors, and is the rectified linear unit activation function. Five hidden-layer sizes are considered: 10, 20, 30, 40, and 50 neurons. The learning rate is selected from , and the number of training epochs is determined by early stopping based on validation loss. All hyperparameters are selected within the training sample only.
2.7. Unified Computational Form
The complete framework can be summarized as:
3. Materials and Filtering Process Results
3.1. Chinese Financial News Corpus
The empirical sample covers the period from 2 January 2018, to 31 December 2022, comprising 1217 trading days. Chinese financial news articles were collected from major financial news platforms and exchange announcement systems, including the Shanghai Stock Exchange official announcement platform, the Shenzhen Stock Exchange official announcement platform, the China Securities Journal, the Shanghai Securities News, the Securities Times, and major online financial portals. Each article record contains the publication timestamp, title, body text, source identifier, and article category.
Articles unrelated to financial markets, including general lifestyle content, sports news, and duplicated advertisements, were removed during preprocessing. Duplicate articles were identified and removed using title similarity and body-text similarity measures with a cosine similarity threshold of 0.85. News published after the market close at 15:00 Beijing time was assigned to the next trading day to avoid look-ahead bias. Based on the reported daily news count in Table 1, the final sample corresponds to approximately 226,900 article records after cleaning and deduplication.
Table 1.
Descriptive information of the Chinese financial news sentiment dataset.
Chinese word segmentation was performed using a financial-domain dictionary to ensure that important financial expressions are correctly recognized as single semantic units. Examples of domain-specific terms include expressions for reserve requirement ratio cut, northbound capital flows, margin financing balance, earnings pre-announcement, and risk appetite. These terms are examples of the segmentation vocabulary and do not constitute the complete list of search keywords. The news corpus was collected by category from financial news channels rather than via keyword searches, ensuring coverage of the full information environment rather than a topic-specific subset.
Sentiment scoring was applied at the article level using a dictionary-based Chinese financial sentiment lexicon. The lexicon assigns positive weights to financially positive terms and negative weights to financially negative terms. The resulting article-level scores were aggregated daily to produce the three sentiment components described in Section 2.1.
Market data for the CSI 300 and SSE Composite indices were obtained from the Wind financial database. Daily closing prices were used to compute log returns. The rolling-window realized volatility proxy was computed using the average of squared daily log-return deviations over a 20-trading-day window, without applying the square root, consistent with Andersen and Bollerslev [20] and Zhang et al. [21]. A typical descriptive summary of the dataset is presented in Table 1.
The sample period of 2018 to 2022 covers a range of market regimes, including the 2018 trade-tension period, the 2019 market recovery, the 2020 COVID-19 shock and subsequent rebound, the 2021 regulatory tightening period, and the 2022 market correction. This variation in market conditions provides a demanding test environment for the filtering and prediction framework.
3.2. Filtering Process and Results
The raw sentiment mean exhibits short-term fluctuations driven by day-to-day variation in news content. After filtering, the smoothed sentiment mean preserves broad trends while reducing daily noise. Table 2 presents the descriptive comparison between raw and filtered sentiment signals, and Table 3 presents the method-specific standard deviations for each filtering method and each sentiment component.
Table 2.
Comparison between raw and filtered sentiment signals.
Table 3.
Method-specific standard deviations of filtered sentiment components.
The results in Table 3 show that all seven filtering methods reduce the standard deviation of each sentiment component relative to the raw signal. The Kalman filter and the discrete wavelet transform achieve the largest individual reductions, while moving-average smoothing achieves the smallest reduction. The ensemble average achieves a standard deviation close to the best individual methods, confirming that averaging across methods does not substantially sacrifice denoising performance while reducing dependence on any single method’s assumptions.
The comparison in Table 2 indicates that filtering substantially reduces the standard deviation of all three sentiment components while preserving mean levels. These reductions are consistent with the purpose of filtering: to remove random fluctuations without changing the central information contained in the data.
3.3. Stationarity of Market Indicators
Table 4 reports the stationarity test results used to determine the required transformations before prediction.
Table 4.
Stationarity test results of market indicators before and after transformation.
The stationarity test results show that stock index prices are non-stationary in levels but become stationary after transformation into log returns. Realized volatility is stationary in its original form according to both ADF and PP tests, and the logarithmic transformation is used only for variance stabilization before prediction. Both ADF and PP tests are reported using test statistics and p-values to ensure consistent interpretation.
4. Empirical Testing
The empirical testing compares predictive models using raw sentiment signals and filtered sentiment signals. The dataset is divided into a training sample covering the first 60% of trading days and a test sample covering the remaining 40%, with a chronological split that preserves the time-series structure of the data. Hyperparameters are selected by time-series cross-validation within the training sample only. All filtering parameters are estimated within rolling windows as described in Section 2.4. The test sample is never used during model selection, hyperparameter tuning, or parameter estimation.
Prediction performance is evaluated using root mean squared error and mean absolute error, two scale-dependent regression error metrics widely used for forecasting evaluation [28]:
4.1. Baseline Comparisons
Before presenting the main results, Table 5 compares the proposed filtered-sentiment models with standard baseline models that do not use sentiment information. This comparison examines whether sentiment signals provide incremental predictive value beyond what market-based models alone capture.
Table 5.
Baseline model comparison for CSI 300 log return and realized volatility.
The baseline results show that market-only models provide modest predictive performance for both returns and volatility. Raw sentiment models outperform market-only baselines, and filtered sentiment models achieve the lowest prediction errors across all configurations. This pattern confirms that filtered sentiment provides incremental predictive value beyond both market-based benchmarks and raw sentiment signals.
4.2. Individual Filtering Method Comparison
Table 6 presents the prediction performance of each filtering method relative to the raw signal and the ensemble, using the SVM-RBF model for CSI 300 log return prediction. Table 7 presents the corresponding results for realized volatility prediction.
Table 6.
Prediction performance by individual filtering method (SVM-RBF, CSI 300 log return).
Table 7.
Prediction performance by individual filtering method (SVM-RBF, realized volatility).
The results in Table 6 and Table 7 show that all seven individual filtering methods improve prediction accuracy relative to raw sentiment. The ensemble consistently achieves the best performance, confirming that combining multiple filtering methods is more effective than relying on any single method. For volatility prediction, the Kalman filter and discrete wavelet transform achieve the largest individual improvements, which is consistent with their ability to separate persistent low-frequency sentiment components from high-frequency noise.
4.3. Prediction Comparison by Support Vector Machines
Support vector machines are used to predict CSI 300 log returns and realized volatility. The comparison between raw sentiment and filtered sentiment is presented in Table 8 and Table 9.
Table 8.
SVM prediction comparison for CSI 300 log return.
Table 9.
SVM prediction comparison for realized volatility.
The RBF kernel consistently delivers the best performance across both raw and filtered sentiment datasets. Filtered sentiment improves prediction accuracy across all four kernel types. The improvement is most pronounced for the RBF kernel, where the test RMSE decreases from 0.01338 to 0.01261 for returns (a reduction of approximately 5.8%) and from 0.00706 to 0.00587 for volatility (a reduction of approximately 16.9%).
4.4. Prediction Comparison by Neural Networks
Neural networks with five hidden-layer configurations are used to examine the effect of model complexity on predictive performance. Table 10 and Table 11 report the corresponding results for CSI 300 log return and realized volatility, respectively.
Table 10.
Neural network prediction comparison for CSI 300 log return.
Table 11.
Neural network prediction comparison for realized volatility.
A moderate hidden-layer size of 20 neurons achieves the best testing performance under both raw and filtered sentiment inputs. Filtered sentiment consistently outperforms raw sentiment across all hidden-layer configurations.
4.5. Robustness: Ensemble Aggregation Comparison
Table 12 compares three ensemble aggregation strategies: equal-weight averaging, validation-error-weighted averaging, and PCA-based aggregation using the first principal component. Results are reported for the SVM-RBF model.
Table 12.
Comparison of ensemble aggregation strategies (SVM-RBF).
The results show that the three aggregation strategies produce very similar predictive performance. Equal-weight averaging performs comparably to validation-error-weighted averaging and outperforms PCA-based aggregation for volatility prediction. These results support the use of equal-weight averaging as the primary ensemble method, given its simplicity and robustness.
4.6. Ablation Study
Table 13 presents the ablation study results, examining the contribution of each sentiment component to prediction performance using the SVM-RBF model.
Table 13.
Ablation study: contribution of individual sentiment components (SVM-RBF, filtered sentiment).
The ablation results show that all three sentiment components contribute to predictive performance. The full three-component model consistently achieves the lowest prediction errors. For return prediction, sentiment mean provides the largest individual contribution. For volatility prediction, sentiment dispersion makes the largest individual contribution, consistent with the theoretical argument that disagreement among news articles is more directly related to market uncertainty than to return direction. Combining all three components produces the best performance, confirming that the three-dimensional sentiment representation captures complementary information.
4.7. Interpretation of Predictive Results
Filtered sentiment consistently outperforms raw sentiment. Across all four SVM kernels and all five neural network configurations, and across both outcome variables, filtered sentiment produces lower RMSE and MAE values than raw sentiment. This consistent pattern provides strong evidence that mathematical filtering successfully removes noise from Chinese financial news sentiment while preserving information content relevant to market prediction.
Sentiment signals are more useful for predicting volatility than returns. The percentage improvement in prediction accuracy from filtering is substantially larger for realized volatility than for stock returns across all models. This asymmetry is theoretically meaningful. Stock returns are notoriously difficult to predict because returns reflect the aggregation of all available information in an efficient market. Realized volatility reflects the level of uncertainty and disagreement in the market and is more closely linked to the sentiment dispersion and polarity imbalance components of the filtered sentiment vector.
Nonlinear models outperform linear models for return prediction. The RBF-kernel SVM consistently outperforms the linear-kernel SVM for return prediction, suggesting that the relationship between sentiment and returns contains nonlinear components. For volatility prediction, the improvement from nonlinear kernels over the linear kernel is smaller, suggesting that the sentiment-volatility relationship has a stronger linear component.
Moderate model complexity is optimal. For neural networks, the 20-neuron configuration consistently achieves the best testing performance. Larger networks show higher testing errors, indicating overfitting. This finding is consistent with the principle that simpler models are preferable when input dimensionality is low.
The predictive improvements reported in this section reflect statistical associations between filtered sentiment and future market outcomes. They do not establish causal relationships between news sentiment and market movements, nor do they directly imply that a profitable trading strategy can be constructed from these signals alone. Formal trading applications would require additional transaction-cost analysis, risk-adjusted performance evaluation, and portfolio backtesting.
5. Discussion
This study proposes and evaluates a mathematical filtering and prediction framework for Chinese financial news sentiment signals. The framework addresses a fundamental challenge in financial text analysis: the raw sentiment signal extracted from Chinese financial news is noisy, which weakens the predictive relationship between sentiment and market outcomes.
5.1. Methodological Implications
The findings carry several important methodological implications. First, sentiment analysis should not be treated as a complete pipeline that ends at text classification. Even when article-level sentiment scores are accurate, the daily-aggregated sentiment signal may still contain substantial noise arising from media dynamics, variation in article volume, and event clustering. Mathematical filtering is a necessary additional step to convert noisy textual sentiment into a reliable time-series indicator. Second, combining multiple filtering methods through ensemble averaging is more robust than relying on any single method. Each of the seven filtering methods has specific strengths and weaknesses. By averaging the outputs of all seven methods, the ensemble approach reduces dependence on any single set of assumptions and produces a more reliable filtered signal [12].
Third, the three-dimensional sentiment representation comprising sentiment mean, sentiment dispersion, and polarity imbalance provides richer information than a single sentiment score. Sentiment mean captures the average tone and is most directly related to directional market expectations. Sentiment dispersion captures disagreement and uncertainty across news articles and is most directly related to market volatility. Polarity imbalance captures the asymmetry between positive and negative emotional pressure and may reflect tail risk and extreme market movements. The ablation results in Table 13 confirm that each component contributes independently to predictive performance.
Fourth, the choice of machine learning model should be guided by the nature of the predictive relationship and the input dimensionality. For the low-dimensional filtered sentiment vector used in this study, moderate-complexity models such as RBF-kernel SVMs and 20-neuron neural networks achieve the best performance. More complex models do not improve predictions and may introduce overfitting, consistent with evidence from robust multidimensional time-series forecasting that model complexity should be controlled relative to the dimensionality and stability of the input signal [29].
5.2. Practical Implications
The empirical results suggest that filtered sentiment can serve as an auxiliary monitoring indicator for market uncertainty. The improvement in volatility prediction indicates that the denoised sentiment signal contains information associated with future market risk levels. These findings may be of interest to practitioners in the following contexts.
For risk managers at financial institutions, filtered sentiment dispersion may serve as a complementary early-warning signal during periods of elevated market uncertainty. A persistent increase in filtered sentiment dispersion, reflecting growing disagreement among news sources about market conditions, may be associated with upcoming volatility increases and could supplement existing risk monitoring frameworks.
For financial regulators, filtered sentiment signals derived from Chinese financial news may offer a perspective on market conditions independent of price-based indicators. The mathematical transparency of the filtering framework makes it auditable and interpretable, which is important for regulatory applications.
It is important to emphasize that the results reported in this study reflect predictive associations rather than causal effects. The framework demonstrates that filtered sentiment is statistically associated with future returns and volatility, but it does not establish that positive news causes stock prices to rise or that negative news causes stock prices to fall. Nor do the results directly establish a profitable trading strategy. Formal trading applications would require additional transaction-cost analysis, risk-adjusted performance evaluation, and portfolio backtesting that are beyond the scope of this study. The practical implications described above should therefore be interpreted as potential directions for further investigation rather than as direct operational recommendations.
5.3. Limitations
Several limitations of this study should be acknowledged; they are distinct from the practical implications described above.
First, the quality of the filtered sentiment signal depends fundamentally on the quality of the article-level sentiment scoring. Chinese word segmentation errors, domain-specific sentiment reversals, and the presence of sarcasm or irony in financial commentary may introduce systematic errors into the sentiment scores that filtering cannot fully correct. The dictionary-based sentiment method used in this study may not capture all the nuances of Chinese financial language. Future research should examine the framework’s sensitivity to different sentiment scoring methods.
Second, the empirical results are based on a single sample period from 2018 to 2022. The relationship between sentiment and market outcomes may vary across different market regimes, and the filtering and prediction framework may perform differently in other time periods or market environments. Out-of-sample validation across different periods and markets would strengthen the generalizability of the findings.
Third, the Gaussian noise assumption in Equations (1) and (2) is a working approximation. The Jarque–Bera statistics in Table 1 indicate that some sentiment components and market variables exhibit significant departures from normality. In the presence of non-Gaussian noise, the Kalman filter is no longer the minimum-variance linear estimator, and robust filtering methods may be more appropriate.
Fourth, the framework does not account for potential endogeneity between sentiment and market outcomes. Financial news may report on market movements and even predict them, creating a feedback loop. The one-step-ahead prediction design reduces but does not eliminate this concern. Causal identification methods would be needed to establish causality more rigorously.
Fifth, the current framework does not incorporate information on the credibility of sources, readership, or social media amplification of individual news articles. An article published by a major financial news agency may have a substantially greater impact on investor sentiment than one from a minor outlet. Source-weighted sentiment construction is an important direction for future research.
These limitations do not contradict the practical implications described in Section 5.2. The practical implications are framed as potential auxiliary monitoring applications. At the same time, the limitations identify boundaries on the strength of the causal and operational conclusions that can be drawn from the current results.
5.4. Future Research Directions
Future research can extend the proposed framework in three primary directions.
First, integrating GARCH-family models would provide a more rigorous examination of the relationship between filtered sentiment and market volatility dynamics. A GARCH-X specification that includes filtered sentiment dispersion as an exogenous variable in the conditional variance equation would allow formal testing of whether sentiment uncertainty significantly affects volatility persistence:
where is the filtered sentiment dispersion. Multivariate GARCH models could further examine whether sentiment co-movements across different news categories are associated with cross-asset volatility spillovers. These extensions would provide stronger economic evidence for the role of filtered sentiment in volatility transmission.
Second, the use of intraday high-frequency data would enable the construction of more precise realized volatility measures, such as the sum of squared intraday returns or bipower variation, which are less susceptible to microstructure noise than the rolling-window daily proxy used in this study. High-frequency realized volatility would also enable the framework to be extended to intraday sentiment monitoring, leveraging the Kalman filter’s real-time updating capability.
Third, the framework could be extended to incorporate multiple information sources beyond financial news, including social media sentiment from platforms such as Weibo and Xueqiu, analyst report tone, and regulatory announcement language. A unified multi-source sentiment filtering system would provide a richer representation of the information environment. It could be evaluated using the same ensemble filtering and prediction pipeline developed in this study.
6. Conclusions
Chinese financial news sentiment is a valuable but inherently noisy source of market information. The mathematical filtering framework proposed in this study provides a systematic and rigorous approach to reducing noise, preserving meaningful sentiment structure, and improving predictive performance. By combining sentiment construction, ensemble filtering, stationarity transformation, and machine learning prediction in a unified pipeline, the framework contributes to the quantitative study of textual information in financial markets.
The main empirical findings are as follows. First, all seven filtering methods reduce the standard deviation of the three sentiment components relative to the raw signal, and the ensemble reduces the standard deviation of sentiment mean, sentiment dispersion, and polarity imbalance by 47.8%, 55.4%, and 50.0%, respectively. Second, filtered sentiment consistently outperforms raw sentiment across all SVM kernels and neural network configurations for both return and volatility prediction. Third, the ensemble filtered signal outperforms all individual filtering methods in the SVM-RBF prediction comparison, confirming the value of combining multiple filtering approaches. Fourth, the ablation study shows that all three sentiment components contribute independently to predictive performance, with sentiment mean being most informative for return prediction and sentiment dispersion being most informative for volatility prediction. Fifth, the predictive improvement from filtering is substantially larger for realized volatility than for stock returns, which is consistent with the theoretical argument that sentiment disagreement and polarity asymmetry are more directly related to market uncertainty than to return direction.
The framework is designed to be transparent, reproducible, and free of look-ahead bias. All filtering parameters are estimated within rolling training windows, and the prediction target is always one step ahead of the sentiment input. These design choices ensure that the reported predictive improvements reflect genuine information content in the filtered sentiment signal rather than artifacts of data leakage or overfitting.
Author Contributions
Conceptualization, R.L.; Methodology, S.W.; Software, S.W.; Validation, L.Z.; Formal analysis, S.W.; Investigation, L.Z.; Resources, R.L.; Data curation, S.W.; Writing—original draft preparation, S.W.; Writing—review and editing, L.Z.; Visualization, L.Z.; Supervision, R.L.; Project administration, R.L.; Funding acquisition, R.L. All authors have read and agreed to the published version of the manuscript.
Funding
This research was funded by the China Youth & Children Research Association “Climb Plan” (G2025-0901-005), the Fund of Shanghai Education Science Research Project (C2024196); The Ministry of Education’s Supply-Demand Docking Employment and Education Project (2023123031821); Funds of USST (CFTD2026ZD17, JXJY202609, YLKC202424443, SH2026295, SH2026296, 24SKPY04); 2025 “Social Innovation and Education Integration” Community Education Innovation Project (SCRJ20250501005).
Data Availability Statement
The data presented in this study are available on request from the corresponding author due to privacy restrictions.
Conflicts of Interest
The authors declare no conflict of interest.
Appendix A
Table A1.
Parameter selection and look-ahead bias control for the seven filtering methods.
Table A2.
Notation summary for the main variables and parameters.
References
- Tetlock, P.C. Giving Content to Investor Sentiment: The Role of Media in the Stock Market. J. Financ. 2007, 62, 1139–1168. [Google Scholar] [CrossRef] [Scilit]
- Loughran, T.; McDonald, B. When Is a Liability Not a Liability? Textual Analysis, Dictionaries, and 10-Ks. J. Financ. 2011, 66, 35–65. [Google Scholar] [CrossRef] [Scilit]
- Bollen, J.; Mao, H.; Zeng, X. Twitter Mood Predicts the Stock Market. J. Comput. Sci. 2011, 2, 1–8. [Google Scholar] [CrossRef] [Scilit]
- Baker, S.R.; Bloom, N.; Davis, S.J. Measuring Economic Policy Uncertainty. Q. J. Econ. 2016, 131, 1593–1636. [Google Scholar] [CrossRef] [Scilit]
- Zhang, X.; Wang, M. Large Language Models for Financial Knowledge Extraction Analytical Insights and Corporate Planning Support. Math. Model. Algorithm Appl. 2025, 6, 44–56. [Google Scholar] [CrossRef] [Scilit]
- Devlin, J.; Chang, M.-W.; Lee, K.; Toutanova, K. BERT: Pre-training of Deep Bidirectional Transformers for Language Understanding. In Proceedings of the NAACL-HLT 2019; Association for Computational Linguistics: Minneapolis, MN, USA, 2019; pp. 4171–4186. [Google Scholar]
- Yang, Z.; Dai, Z.; Yang, Y.; Carbonell, J.; Salakhutdinov, R.; Le, Q.V. XLNet: Generalized Autoregressive Pretraining for Language Understanding. In Advances in Neural Information Processing Systems 32; Curran Associates: Red Hook, NY, USA, 2019. [Google Scholar]
- Du, K.; Xing, F.; Mao, R.; Cambria, E. An Evaluation of Reasoning Capabilities of Large Language Models in Financial Sentiment Analysis. In Proceedings of the 2024 IEEE Conference on Artificial Intelligence (CAI); IEEE: Piscataway, NJ, USA, 2024; pp. 189–194. [Google Scholar]
- Li, R.; Feng, S. Academic Librarians in Research Competitions: A Network Analysis of Resource Provision and Collaborative Dynamics. J. Acad. Librariansh. 2025, 51, 103100. [Google Scholar] [CrossRef] [Scilit]
- Ahmed, R.; Rauf, S.A.; Latif, S. Leveraging Large Language Models and Prompt Settings for Context-Aware Financial Sentiment Analysis. In Proceedings of the 2024 5th International Conference on Advancements in Computational Sciences (ICACS); IEEE: Piscataway, NJ, USA, 2024; pp. 1–9. [Google Scholar]
- Box, G.E.P.; Jenkins, G.M.; Reinsel, G.C.; Ljung, G.M. Time Series Analysis: Forecasting and Control, 5th ed.; Wiley: Hoboken, NJ, USA, 2015. [Google Scholar]
- Hyndman, R.J.; Athanasopoulos, G. Forecasting: Principles and Practice, 3rd ed.; OTexts: Melbourne, Australia, 2021. [Google Scholar]
- Luo, J.; Ying, K.; He, P.; Bai, J. Properties of Savitzky–Golay Digital Differentiators. Digit. Signal Process. 2005, 15, 122–136. [Google Scholar] [CrossRef] [Scilit]
- Zhang, D. Wavelet Transform. In Fundamentals of Image Data Mining; Springer: Cham, Switzerland, 2019; pp. 35–44. [Google Scholar]
- Khodarahmi, M.; Maihami, V. A Review on Kalman Filter Models. Arch. Comput. Methods Eng. 2023, 30, 727–747. [Google Scholar] [CrossRef] [Scilit]
- Särkkä, S.; Svensson, L. Bayesian Filtering and Smoothing, 2nd ed.; Cambridge University Press: Cambridge, UK, 2023. [Google Scholar]
- Pataky, T.C.; Robinson, M.A.; Vanrenterghem, J.; Challis, J.H. Smoothing Can Systematically Bias Small Samples of One-Dimensional Biomechanical Continua. J. Biomech. 2019, 82, 330–336. [Google Scholar] [CrossRef] [Scilit] [PubMed]
- Wu, S.; Li, R. Estimating an Affine Term Structure Model of Interest Rates with Correlated Noise. PLoS ONE 2025, 20, e0318076. [Google Scholar] [CrossRef] [Scilit] [PubMed]
- Ameriks, J.; Kézdi, G.; Lee, M.; Shapiro, M.D. Heterogeneity in Expectations, Risk Tolerance, and Household Stock Shares: The Attenuation Puzzle. J. Bus. Econ. Stat. 2020, 38, 633–646. [Google Scholar] [CrossRef] [Scilit] [PubMed]
- Andersen, T.G.; Bollerslev, T. Answering the Skeptics: Yes, Standard Volatility Models Do Provide Accurate Forecasts. Int. Econ. Rev. 1998, 39, 885–905. [Google Scholar] [CrossRef] [Scilit]
- Zhang, Y.; He, M.; Wang, Y.; Liang, C. Global Economic Policy Uncertainty Aligned: An Informative Predictor for Crude Oil Market Volatility. Int. J. Forecast. 2023, 39, 1318–1332. [Google Scholar] [CrossRef] [Scilit]
- Mu, Z.; Wan, Y.; Zhuang, Y.; Tan, J.; Cheng, H.; Wang, Y. Exploring Financial Sentiment Analysis via Fine-tuning Large Language Model and Attributed Graph Neural Network. Neural Netw. 2026, 199, 108620. [Google Scholar] [CrossRef] [Scilit] [PubMed]
- Wu, S.; Zhang, L.; Li, R. Review on the Applications of Kalman Filter Class Approaches to Term Structure Estimation of Interest Rates. Int. Rev. Econ. Financ. 2026, 109, 105440. [Google Scholar] [CrossRef] [Scilit]
- Paparoditis, E.; Politis, D.N. The Asymptotic Size and Power of the Augmented Dickey–Fuller Test for a Unit Root. Econom. Rev. 2018, 37, 955–973. [Google Scholar] [CrossRef] [Scilit]
- Vogelsang, T.J.; Wagner, M. A Fixed-b Perspective on the Phillips–Perron Unit Root Tests. Econom. Theory 2013, 29, 609–628. [Google Scholar] [CrossRef] [Scilit]
- Vapnik, V. The Nature of Statistical Learning Theory; Springer: New York, NY, USA, 1995. [Google Scholar]
- Goodfellow, I.; Bengio, Y.; Courville, A. Deep Learning; MIT Press: Cambridge, MA, USA, 2016. [Google Scholar]
- Chicco, D.; Warrens, M.J.; Jurman, G. The Coefficient of Determination R-Squared Is More Informative than SMAPE, MAE, MAPE, MSE and RMSE in Regression Analysis Evaluation. PeerJ Comput. Sci. 2021, 7, e623. [Google Scholar] [CrossRef] [Scilit] [PubMed]
- Shen, C.; He, Y.; Qin, J. Robust Multi-Dimensional Time Series Forecasting. Entropy 2024, 26, 92. [Google Scholar] [CrossRef] [Scilit] [PubMed]

Disclaimer/Publisher’s Note: The statements, opinions and data contained in all publications are solely those of the individual author(s) and contributor(s) and not of MDPI and/or the editor(s). MDPI and/or the editor(s) disclaim responsibility for any injury to people or property resulting from any ideas, methods, instructions or products referred to in the content. |
© 2026 by the authors. Licensee MDPI, Basel, Switzerland. This article is an open access article distributed under the terms and conditions of the Creative Commons Attribution (CC BY) license.