Article

Optimal Latinized Partially Stratified Sampling for High-Efficiency Nonstationary Stochastic Seismic Excitation and Response Analysis

1
College of Water Resources & Civil Engineering, Hunan Agricultural University, 1 Nongda Road, Changsha 410128, China
2
Hunan Provincial Engineering Research Center for Irrigation District Technology, Changsha 410128, China
3
Key Laboratory of Efficient Agricultural Water Conservation and Digital Water Resources Construction for Universities in Hunan Province, Changsha 410128, China
*
Author to whom correspondence should be addressed.
Mathematics 2026, 14(1), 140; https://doi.org/10.3390/math14010140
Submission received: 8 September 2025 / Revised: 21 December 2025 / Accepted: 27 December 2025 / Published: 29 December 2025
(This article belongs to the Special Issue Advances in High-Dimensional Scientific Computing)

Abstract

This paper proposes a computationally efficient framework for estimating first-passage probabilities of nonlinear structures under stochastic seismic excitations. The methodology integrates Optimal Latinized Partially Stratified Sampling (OLPSS) with the Random Function Spectral Representation Method (RFSRM) to generate a minimal yet optimal set of samples in the low-dimensional input space. Each sample corresponds to a representative nonstationary ground motion time history, which is then used to drive nonlinear dynamic analyses. The extreme values of the structural responses are extracted, and their distribution tails are accurately modeled using the Shifted Generalized Lognormal Distribution (SGLD), whose parameters are efficiently estimated via an extrapolation method. This allows for the construction of the probability density function (PDF) and cumulative distribution function (CDF) of the extreme responses, from which the failure probabilities and reliability indices are calculated. The proposed framework is rigorously validated against the Monte Carlo simulation (MCS) benchmarks using two illustrative examples, including a nonlinear single-degree-of-freedom (SDOF) system and a three-story shear building model. The results demonstrate that the proposed method achieves excellent accuracy in estimating failure probabilities and reliability indices, while significantly reducing the number of required simulations and thereby confirming its high efficiency and accuracy for rapid performance-based seismic assessment.

1. Introduction

The accurate assessment of structural dynamic reliability under stochastic excitations, such as earthquakes, constitutes a cornerstone of Performance-Based Seismic Design (PBSD) [1]. Within this framework, the first-passage probability, which quantifies the likelihood that a structural response exceeds a predefined safe threshold for the first time within a given duration, serves as a critical risk indicator [2]. However, precisely and efficiently estimating this probability remains a significant challenge in civil engineering risk analysis, particularly for nonlinear systems. This difficulty arises from the inherent uncertainties in seismic loading—characterized by non-stationarity and randomness—coupled with complex structural nonlinearities, including material yielding and hysteretic behavior [3,4]. These factors collectively contribute to the high computational cost and statistical complexity associated with traditional reliability methods.
Numerous methods have been developed to estimate first-passage probabilities, yet each category presents notable limitations. The Monte Carlo Simulation (MCS) is widely regarded as a benchmark due to its robustness and broad applicability [5,6,7]. However, its computational cost becomes prohibitively expensive for estimating small failure probabilities involving complex nonlinear time-history analyses [8]. To improve efficiency, variance reduction techniques such as subset simulation [9,10] and line sampling [11] have been introduced. While these methods enhance sampling efficiency, their accuracy can be sensitive to parameter selection, and they may struggle with highly nonlinear structural behavior. Another approach relies on extreme value theory [12,13], particularly the Generalized Extreme Value (GEV) distribution [14], to model asymptotic behavior. Nevertheless, the validity of GEV distribution often requires a sufficiently long reference time—a condition frequently unmet in typical earthquake durations—potentially leading to significant estimation bias. Consequently, a common bottleneck persists across existing methods: the trade-off between computational efficiency and estimation accuracy, especially in capturing the tail behavior of the response distribution where small probabilities reside.
To bridge this critical gap between computational efficiency and estimation accuracy, this paper proposes a novel framework that integrates advanced sampling techniques with an efficient extreme value distribution modeling strategy. On the input side, the high-dimensionality of stochastic process simulation is addressed by the Random Function Spectral Representation Method (RFSRM), which characterizes non-stationary seismic excitations using only two elementary random variables [15]. Within this reduced-dimensional space, the Optimal Latinized Partially Stratified Sampling (OLPSS) [16] technique is employed to generate a minimal yet highly representative set of input samples with optimal space-filling properties, ensuring efficient coverage of the uncertainty domain. On the output side, accurately estimating distribution tails from limited response data remains challenging. To this end, the Shifted Generalized Lognormal Distribution (SGLD) [17,18,19]—a flexible four-parameter distribution capable of capturing diverse skewness and kurtosis characteristics—is adopted to model the tail behavior of the extreme structural responses. Furthermore, an extrapolation method is introduced to robustly estimate the SGLD parameters from sparse data, overcoming the large-sample requirement inherent in conventional moment-based fitting approaches. This integrated methodology enables the precise construction of extreme value distributions and the subsequent calculation of failure probabilities, while drastically reducing the number of required numerical simulations.
The present study develops the aforementioned integrated framework to facilitate the efficient and accurate estimation of first-passage probabilities for nonlinear structures subjected to stochastic seismic excitations. Building upon recent developments in L-moments based extreme value distribution [4] and seismic fragility analysis using methods of moment [20], the proposed methodology is rigorously validated through the detailed case study of a nonlinear single-degree-of-freedom (SDOF) system and a three-story shear building model. The accuracy and computational efficiency of the method are assessed by comparing its results against those obtained from extensive MCS, which serve as the benchmark solution. The numerical results demonstrate that the proposed approach achieves excellent agreement with MCS in estimating failure probabilities and reliability indices, while reducing the required number of simulations by orders of magnitude.
The remainder of this paper is organized as follows: Section 2 describes the proposed integrated framework, including the stochastic ground motion model using RFSRM, the optimal sample strategy using OLPSS, along with the procedure for efficient stochastic ground motion generation and dynamic reliability analysis. Section 3 presents the numerical examples involving a nonlinear SDOF system and a three-story shear building model to validate the accuracy and efficiency of the proposed methodology. Finally, Section 4 concludes the paper with summarizing remarks.
To the best of our knowledge, no previous study has integrated RFSRM’s dimensionality reduction with OLPSS’s optimal sampling for seismic reliability analysis. The sequential combination (RFSRM, OLPSS, and SGLD) represents a novel mathematical framework, ultimately enabling the precise estimation of reliability indices, where each component’s output is optimally conditioned for the next stage.

2. The Proposed Framework for Efficient Seismic Reliability Analysis

2.1. Stochastic Ground Motion Model Using RFSRM

The accurate characterization of non-stationary stochastic seismic excitations is paramount for dynamic reliability analysis. The Evolutionary Power Spectral Density (EPSD) function provides a powerful tool for defining such processes. A non-stationary Gaussian process u ¨ g ( t ) with a prescribed two-sided EPSD, S u ¨ g ( ω k , t ) , can be traditionally simulated through a finite sum of harmonic components [21]:
u ¨ g t = k = 1 d 2 S u ¨ g ω k , t Δ ω a k cos ω k t + b k sin ω k t
where ω k = ( k 1 ) Δ ω , Δ ω = ω u / ( d 1 ) , ω u is the cut-off frequency, and a k and b k are independent standard normal random variables. This conventional Spectral Representation Method (SRM) requires a large number of random variables (2N), leading to a high-dimensional uncertainty space that is computationally prohibitive for reliability analysis involving complex nonlinear structures.
To overcome this dimensional challenge, the RFSRM is employed. The RFSRM achieves dramatic dimensionality reduction by mapping the high-dimensional set of random variables a k , b k onto a low-dimensional space spanned by only two elementary random variables, Θ 1 and Θ 2 , which are uniformly distributed in 0 , 2 π . This mapping is accomplished via random functions utilizing the Hartley function, cas = sin + cos :
a k = cas k ¯ Θ 1 ,   b k = cas k ¯ Θ 2
here, k ¯ represents a deterministic one-to-one mapping of the index k k = 1 , 2 , , N , which can be generated by creating a random permutation of the integers from 1 to N (e.g., using the randperm (N) function in MATLAB R2023a). This mapping ensures the statistical properties of the generated process are preserved.
Consequently, the non-stationary ground motion process can be efficiently represented in its reduced-dimensional form as:
U ¨ g t = k = 1 N 2 S u ¨ g ω k , t Δ ω cos ω k t cas k ¯ Θ 1 + sin ω k t cas k ¯ Θ 2
For the common case of a modulated stationary process, where U ¨ g t = m t U t and U t is a stationary process with Power Spectral Density (PSD) S u ω , the expression simplifies to:
U ¨ g t = m t k = 1 N 2 S u ω k Δ ω cos ω k t cas k ¯ Θ 1 + sin ω k t cas k ¯ Θ 2
This formulation encapsulates the complete uncertainty of the non-stationary stochastic seismic excitation within the two-dimensional input space Θ 1 , Θ 2 . This profound reduction in dimensionality is the cornerstone of the proposed computational framework, as it allows for the application of efficient sampling strategies to explore the input uncertainty space exhaustively yet with a minimal number of simulations.

2.2. Optimal Sample Strategy Using OLPSS

The RFSRM effectively reduces the input dimension of the stochastic excitation to a two-dimensional space Θ 1 , Θ 2 . However, the efficiency and accuracy of the subsequent reliability analysis remain highly dependent on how this space is sampled. Traditional MCS within this domain, while straightforward, may exhibit poor space-filling properties and slow convergence for estimating small failure probabilities. To address this, an advanced sampling technique, termed OLPSS, is employed to generate a sparse yet highly representative set of points.
OLPSS is built upon the foundation of Latinized Partially Stratified Sampling (LPSS), which itself is a hybrid method combining the strengths of Stratified Sampling (SS) and Latin Hypercube Sampling (LHS). In standard LPSS, the d-dimensional random space Φ is first decomposed into S disjoint subspaces Θ i i = 1 , 2 , , S , such that i = 1 S d i = d and i = 1 S Θ i = Φ . Within each lower-dimensional subspace Θ i , samples are generated using Latinized Stratified Sampling (LSS), which ensures stratification in all dimensions of the subspace simultaneously. Finally, samples in the full-dimensional space are created by randomly pairing the samples from these subspaces. While LPSS offers significant variance reduction, the random pairing process may lead to a suboptimal arrangement of samples in the full space, compromising the space-filling property.
The OLPSS method introduces an optimization step to overcome this limitation. The core idea is to optimize the pairing of samples across subspaces to achieve an optimal configuration in the full dimensional space, as defined by a specific space-filling criterion. The process can be summarized as follows:
  • Subspace Decomposition and Initial Sampling: The input space is decomposed. For the specific case of RFSRM, the space is two-dimensional d = 2 , which can be treated as a single subspace S = 1 . N samples are generated within this 2D space using LSS, resulting in an initial N × 2 sample matrix L .
  • Optimization via Columnwise–Pairwise Exchange: An optimization algorithm, such as the columnwise–pairwise exchange algorithm, is employed. This algorithm iteratively improves the space-filling of the sample set by randomly selecting pairs of rows within the matrix L and swapping their values in a randomly chosen column (dimension). After each swap, a predefined space-filling objective function is evaluated.
  • Objective Function Evaluation: Common criteria for assessing space-filling include the maximin distance criterion and the Audze–Eglais (AE) potential energy criterion.
The Maximin criterion aims to maximize the minimum distance between any two points in the sample set:
f M m = min d ( x i , x j )
where d ( x i , x j ) = x i x j q with q = 2 is the Euclidean distance among design points x i and x j [22].
The AE criterion is derived from a physical analogy, treating points as particles with repulsive forces, and aims to minimize the system’s potential energy to achieve a uniform distribution:
f A E = i = 1 N 1 j = i + 1 N 1 d x i , x j 2
4.
Iterative Improvement: If the swap leads to an improvement in the objective function (e.g., a higher f M m or a lower f A E ), the new configuration is accepted. This process is repeated for a large number of iterations ( T , e.g., 10,000) to converge towards a near-optimal configuration.
The final output of the OLPSS procedure is an optimal set of N samples in the 2D Θ 1 , Θ 2 space. These samples exhibit superior uniformity and space-filling properties compared to those generated by MCS, LHS, or standard LPSS. When fed into the RFSRM model, each of these optimal 2D points yields a representative non-stationary ground motion time history. The combination of RFSRM and OLPSS ensures that the entire uncertainty space of the seismic excitation is explored with a minimal number of highly efficient, non-redundant simulations, forming the cornerstone of the proposed computational framework for efficient dynamic reliability analysis.

2.3. The Proposed Framework for Generating Stochastic Ground Motions and Dynamic Reliability Analysis

The core objective of dynamic reliability analysis is to estimate the first-passage failure probability, P f , which defines the probability that a structural response Z t (e.g., inter-story drift) exceeds a specified safety threshold b within a time duration T . As per the equivalent extreme value principle, this problem is transformed into evaluating the Cumulative Distribution Function (CDF) of the extreme value response Z e x t = max t = 0 , T Z t [4,8]:
P f = 1 P Z e x t b = 1 F Z e x t b
where F Z e x t is the CDF of Z e x t . The reliability index β , another fundamental safety measure, can be subsequently calculated from P f using the inverse CDF of the standard normal distribution:
β = Φ 1 P f
where Φ 1 is the inverse standard normal CDF.
For nonlinear structures, the precise form of F Z e x t Z is typically unknown. The extreme value response Z e x t is often right-skewed and non-Gaussian, making traditional distributions like the Gaussian or Lognormal unsuitable for accurately capturing its tail behavior. To address this, the SGLD is adopted for its exceptional flexibility in modeling a wide range of skewness and kurtosis, particularly in the distribution tails. The Probability Density Function (PDF) of the SGLD is defined as:
f X x = α x ξ exp 1 τ σ τ ln x ξ θ τ , x > ξ
where ξ is the location parameter; θ is the scale parameter; and σ > 0 , τ > 0 are shape parameters controlling the skewness and kurtosis, respectively. The coefficient α is a normalization constant. The corresponding CDF is given by:
F X x = 1 2 + 1 2 sgn x ξ θ 1 γ 1 r , ln x ξ θ τ τ σ τ
where γ , is the lower incomplete gamma function ratio.
The parameters of the SGLD ξ , θ , σ , τ are efficiently estimated from a limited number of extreme value response samples using an extrapolation method. This method utilizes information from the body of the distribution (e.g., estimates at exceedance probabilities of 10 1 and 10 2 ) to accurately reconstruct its tail, avoiding the need for the large sample sizes required by conventional moment-fitting techniques. If the small probabilities are need to be obtain with sufficient accuracy, the two reliatively large exceedance probabiliites that are used to estimate the model estimate the model parameters of the SGLDs can be set to be P1 = 10−1 and P 2 0.5 × 10 2 , 10 2 . To estimate P1 and P2, it is necessary to choose a low discrepancy sampling method [23], e.g., the pseudo MCS method and the correlation-reduction Latin hypercube sampling method [24].
Once the parameters are estimated, the PDF f Z e x t Z and CDF F Z e x t Z of the extreme response are fully defined. The failure probability for any threshold b is then computed directly as P f = 1 F Z e x t b , and the reliability index β is derived accordingly.

2.4. Step-by-Step Implementation Framework

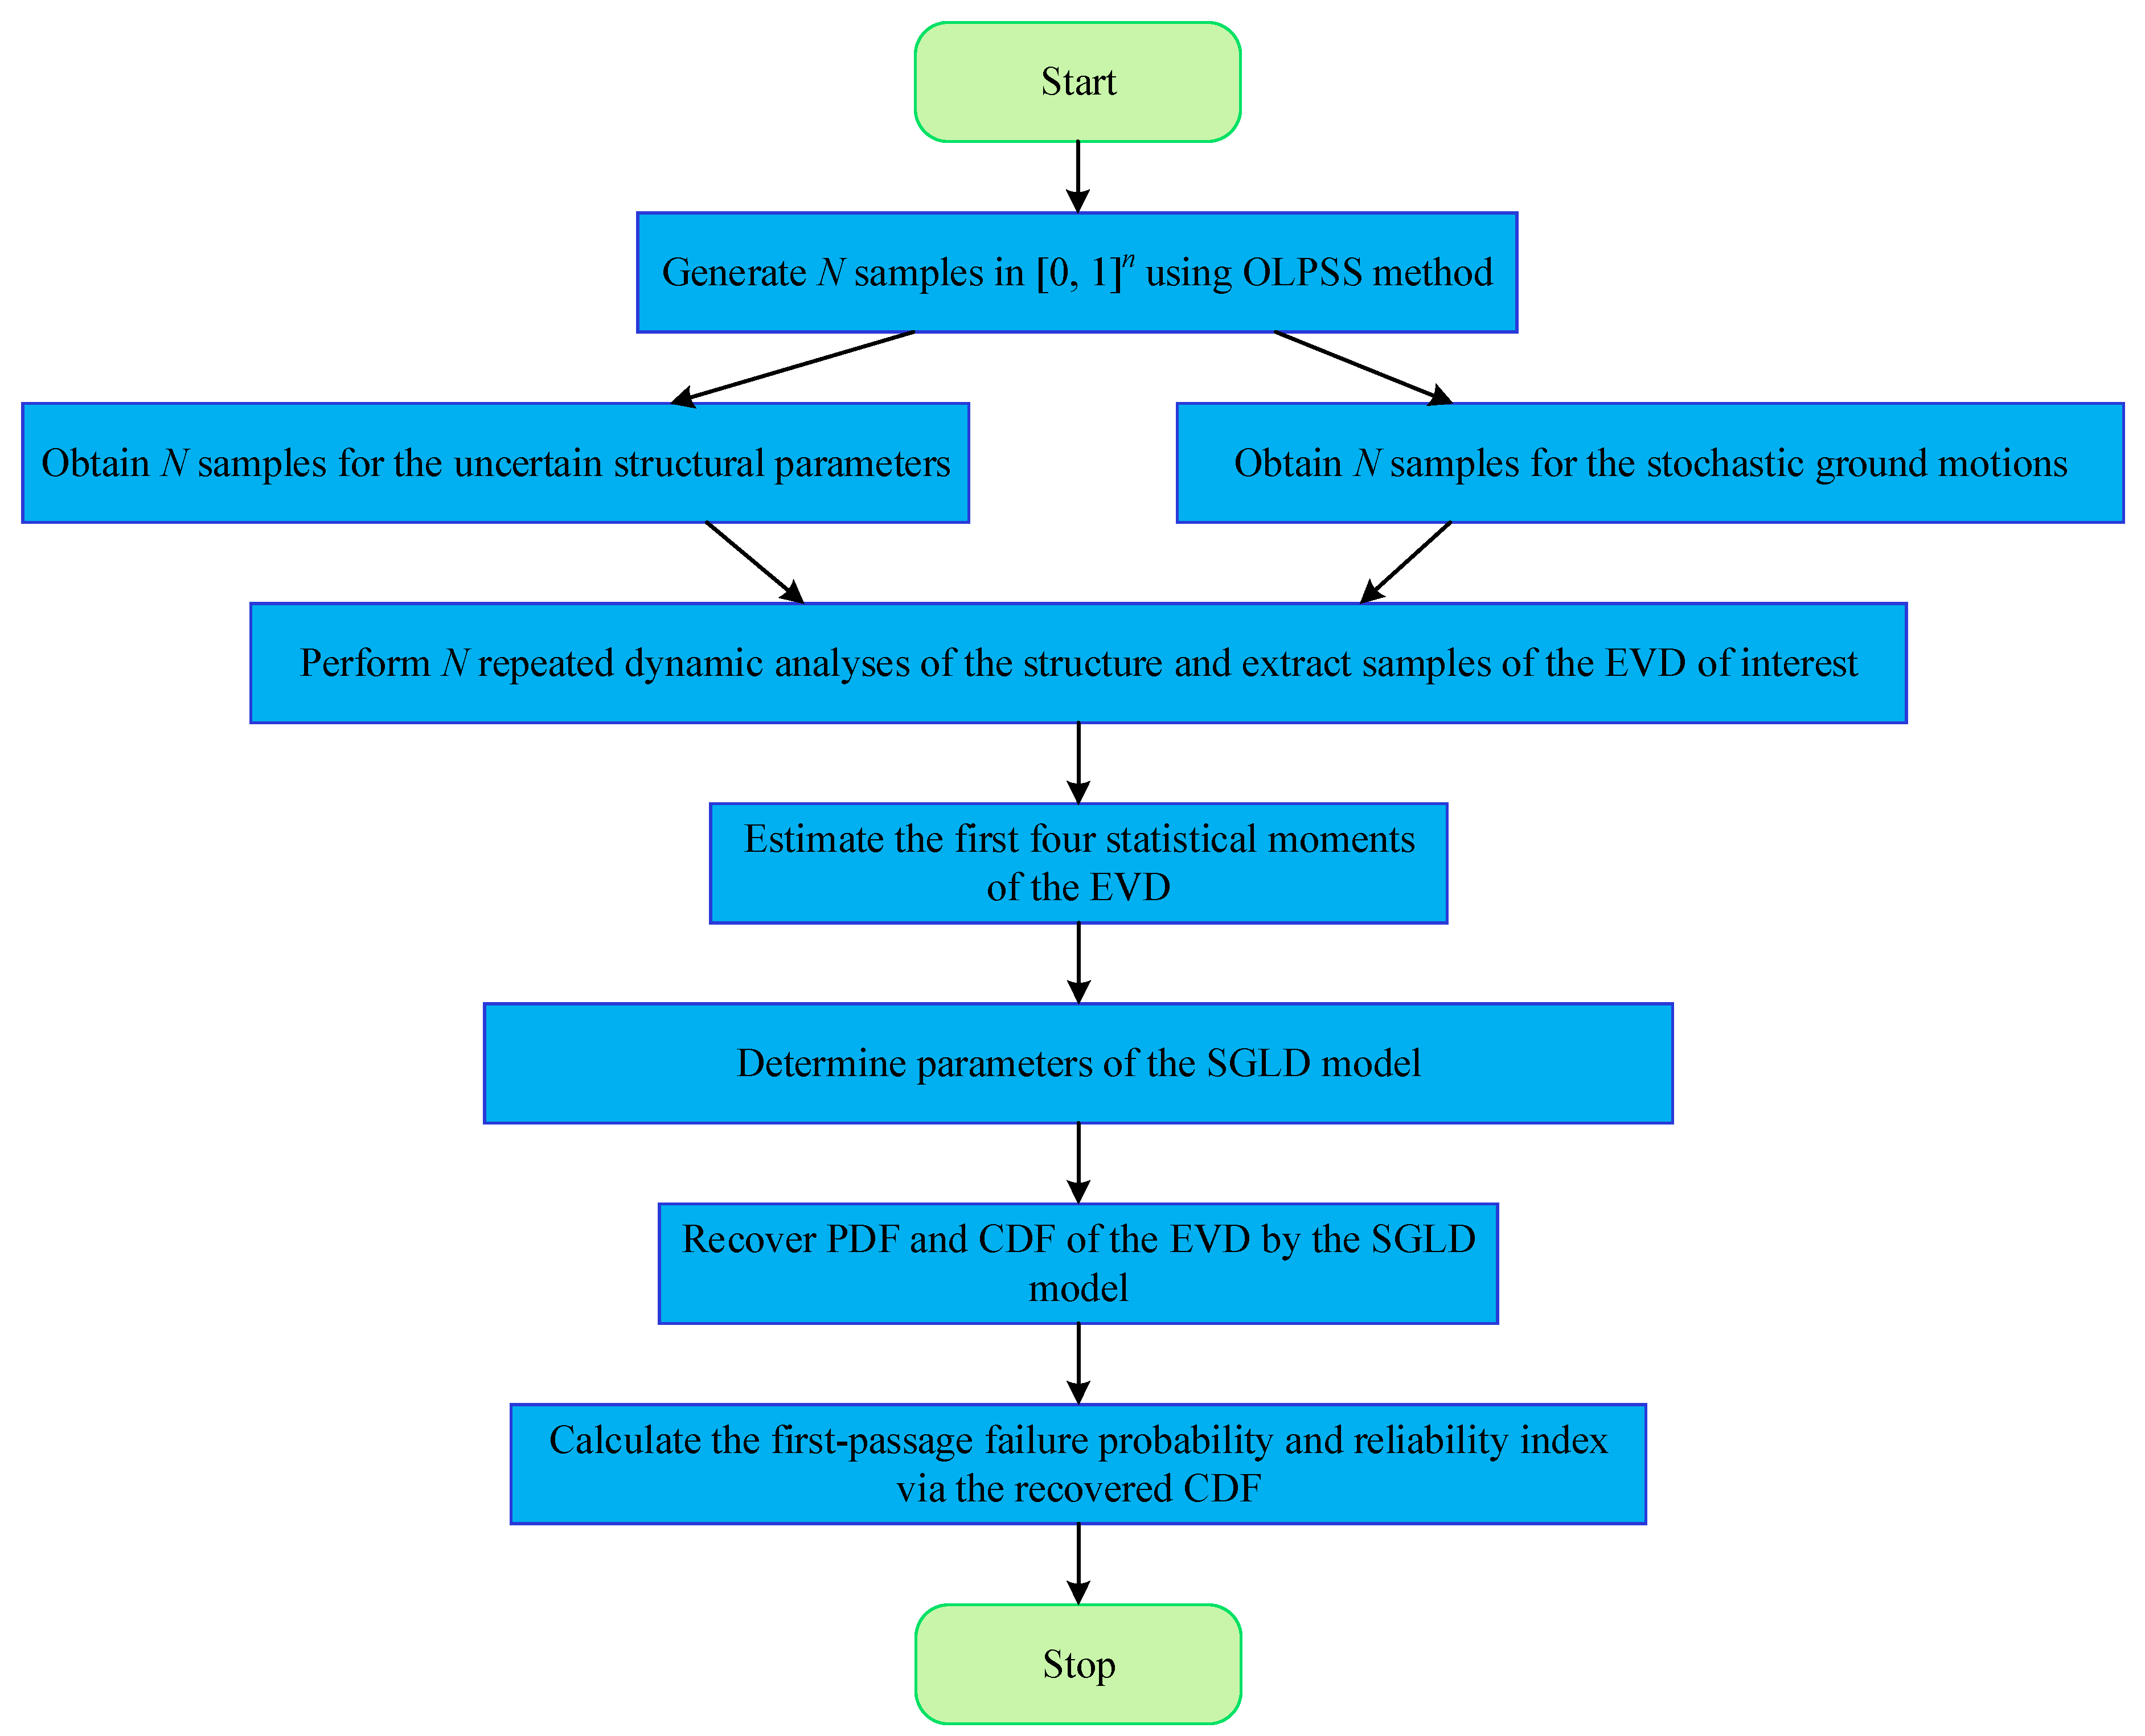
The proposed integrated framework for efficient stochastic seismic motion generation and dynamic reliability analysis combines the RFSRM (Section 2.1), OLPSS (Section 2.2), and SGLD-based extreme value distribution (EVD) modeling (Section 2.3). Figure 1 illustrates the implementation procedure of the proposed methodology. The specific procedural steps are as follows:
  • Optimal Input Sampling: Generate an optimal set of n samples in the 2D input space Θ 1 , Θ 2 using the OLPSS strategy detailed in Section 2.2.
  • Stochastic Ground Motion Generation: For each of the n samples Θ 1 i , Θ 2 i , generate a fully non-stationary ground motion acceleration time history, a g i t , using the RFSRM model described in Section 2.1.
  • Nonlinear Dynamic Response Analysis: For each generated ground motion a g i t , perform a deterministic nonlinear time-history analysis of the structural model. From each analysis, extract the extreme value response of interest, such as the maximum absolute displacement S i = max t 0 , T u i t . This results in a set of n extreme value samples S 1 , S 2 , , S n .
  • Extreme Value Distribution Modeling and Reliability Calculation: Fit the SGLD to the dataset S 1 , S 2 , , S n using the extrapolation method to obtain its parameters. Construct the CDF F Z e x t Z . For a given threshold b , calculate the failure probability P f = 1 F Z e x t b and the corresponding reliability index β = Φ 1 P f .

3. Numerical Example

3.1. Example 1: Nonlinear SDOF System

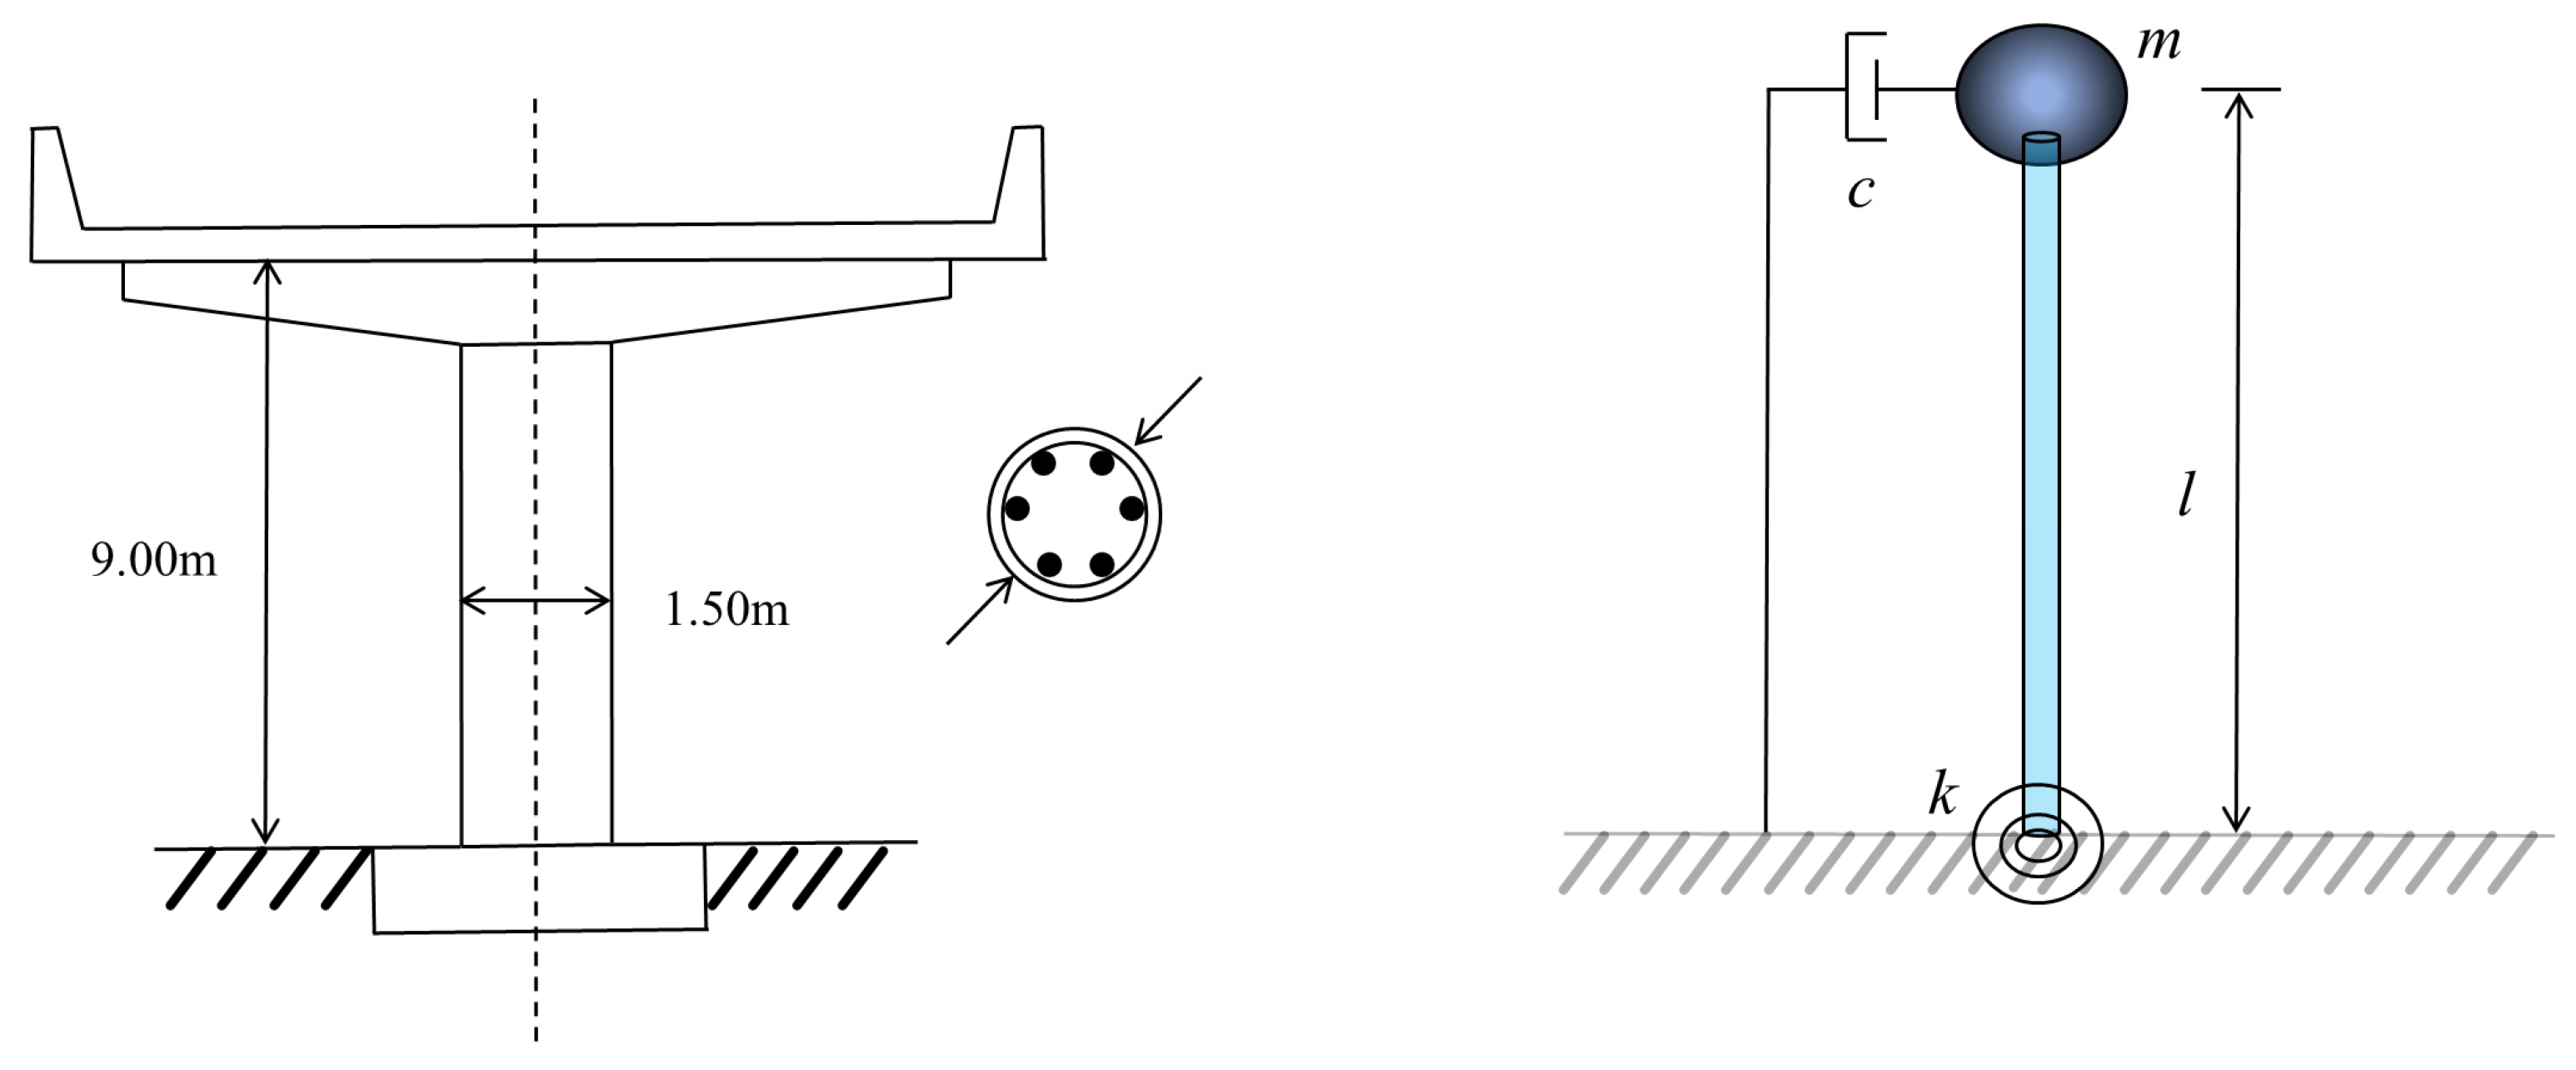
To rigorously validate the accuracy and efficiency of the proposed integrated framework, a detailed case study of a SDOF system subjected to non-stationary stochastic ground motions is conducted. The system configuration is illustrated in Figure 2.
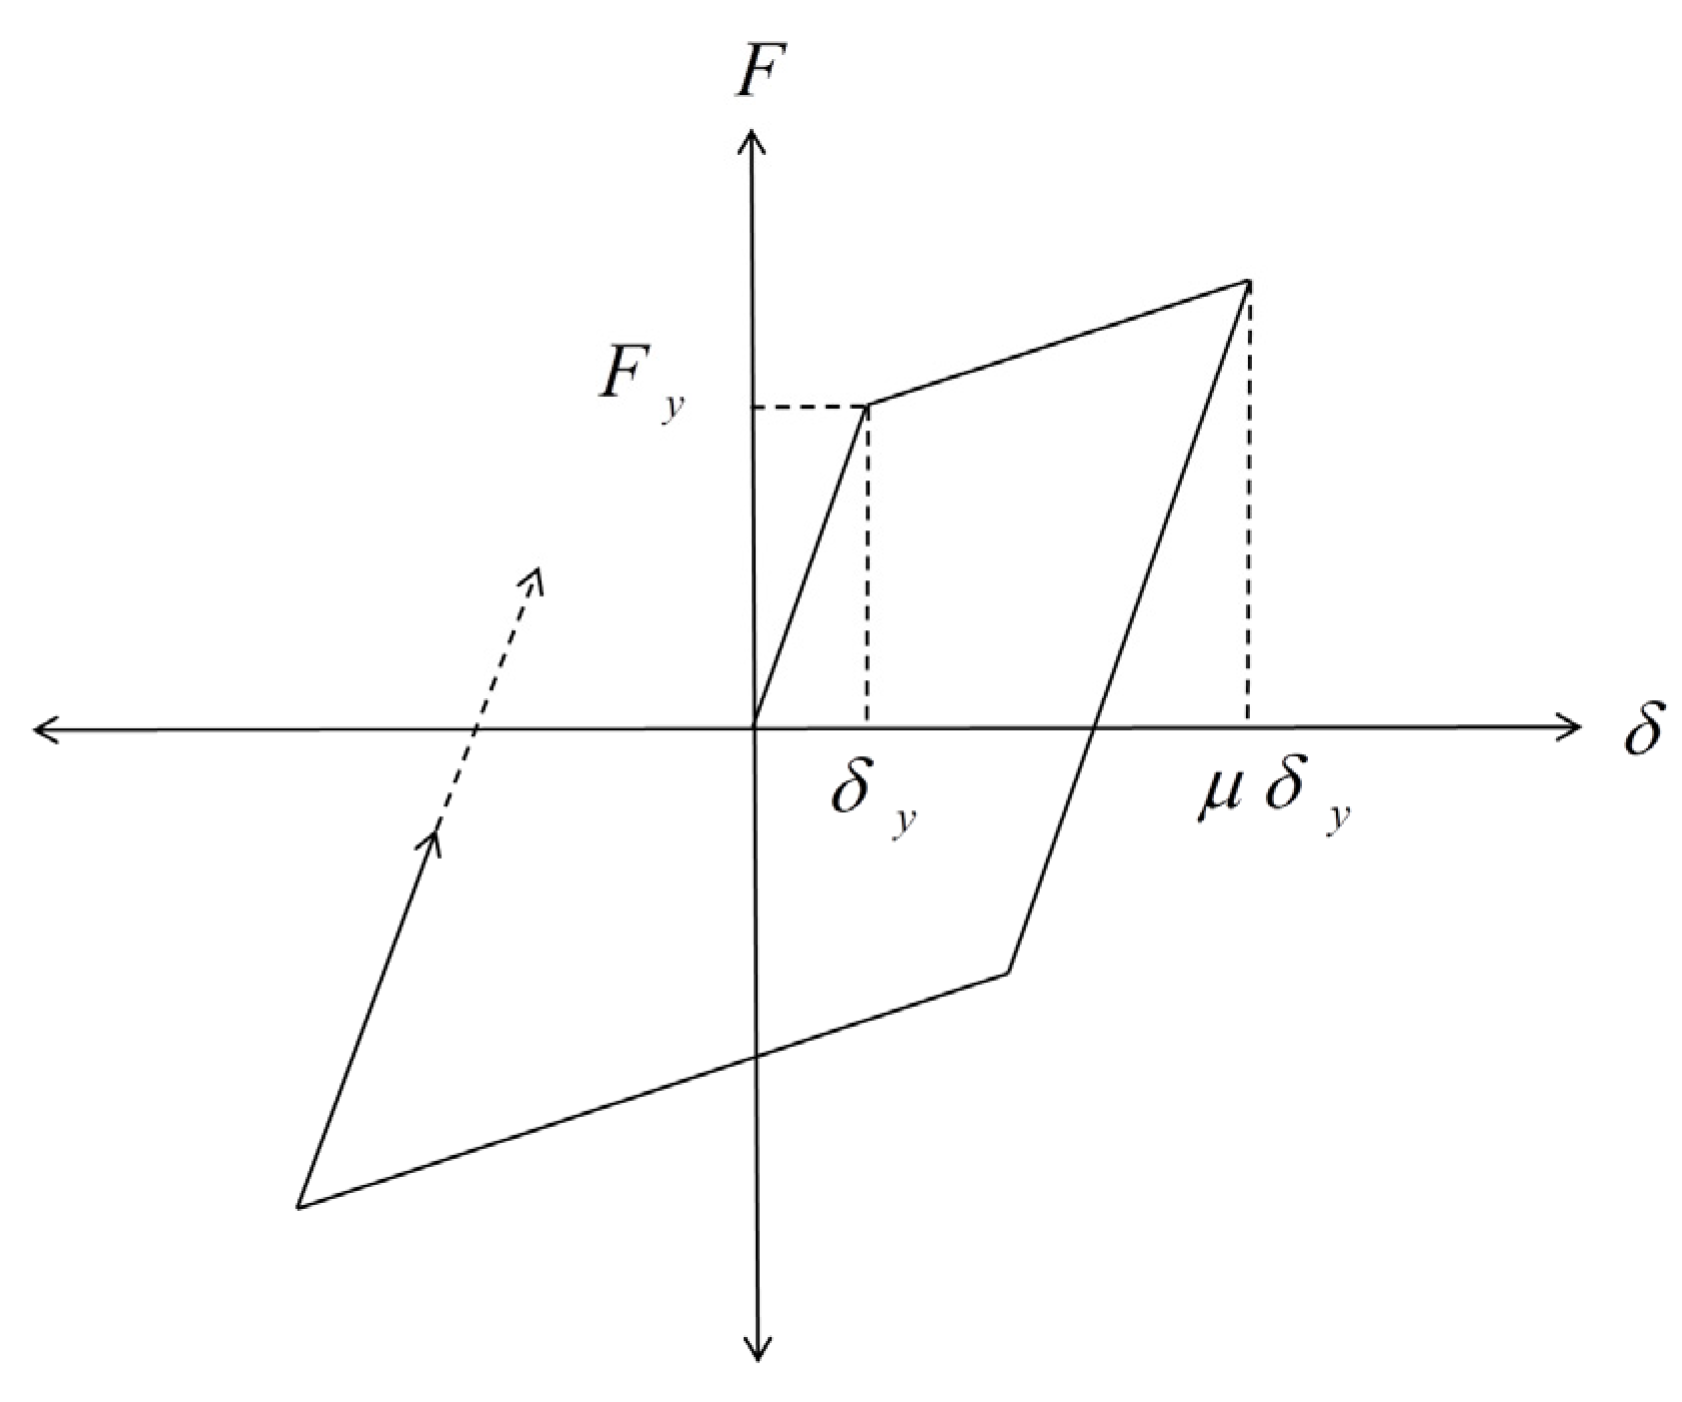
The nonlinear restoring force of the system is characterized by a bilinear model (force f -displacement Δ x ), as depicted in Figure 3. The model parameters are defined as follows: mass m = 60,000 kg, damping coefficient c = 30,000 N·s/m, initial stiffness kc0 = 2,350,000 N/m, and yield displacement x c = 0.01   m . The post-yield stiffness reduction coefficient is set to 0.2. The structural responses for each realization of the input excitation are computed using the classical Wilson-θ method with a time step of Δ t = 0.02   s .

3.1.1. Generating of the Stochastic Ground Motions Using OLPSS

The seismic excitation is modeled as a non-stationary Gaussian process defined by the Clough–Penzien EPSD function [25]. The two-sided Clough–Penzien spectrum is given by:
S ω = ω g 4 + 4 ζ g 2 ω g 2 ω 2 ω 2 ω g 2 2 + 4 ζ g 2 ω g 2 ω 2 ω 4 ω 2 ω f 2 2 + 4 ζ f 2 ω f 2 ω 2 S 0
where ω g and ζ g are the predominant frequency and damping ratio of the site soil, respectively, and ω f and ζ f are the parameters of the second filter hindering low-frequency components. The spectral intensity S 0 is related to the peak ground acceleration (PGA, U ¨ g , max 2 ) and is defined as:
S 0 = a ¯ max 2 γ 2 π ω g 2 ζ g + 1 2 ζ g
where γ is the peak factor. The specific parameters used in this study are listed in Table 1.
The non-stationary Gaussian ground motion U ¨ g t is modeled by modulating U ¨ g t using m(t):
m t = t / 0.5 2 0 t 0.5   1 5 < t 10 exp 0.45 ( t 10 ) 2 t > 10
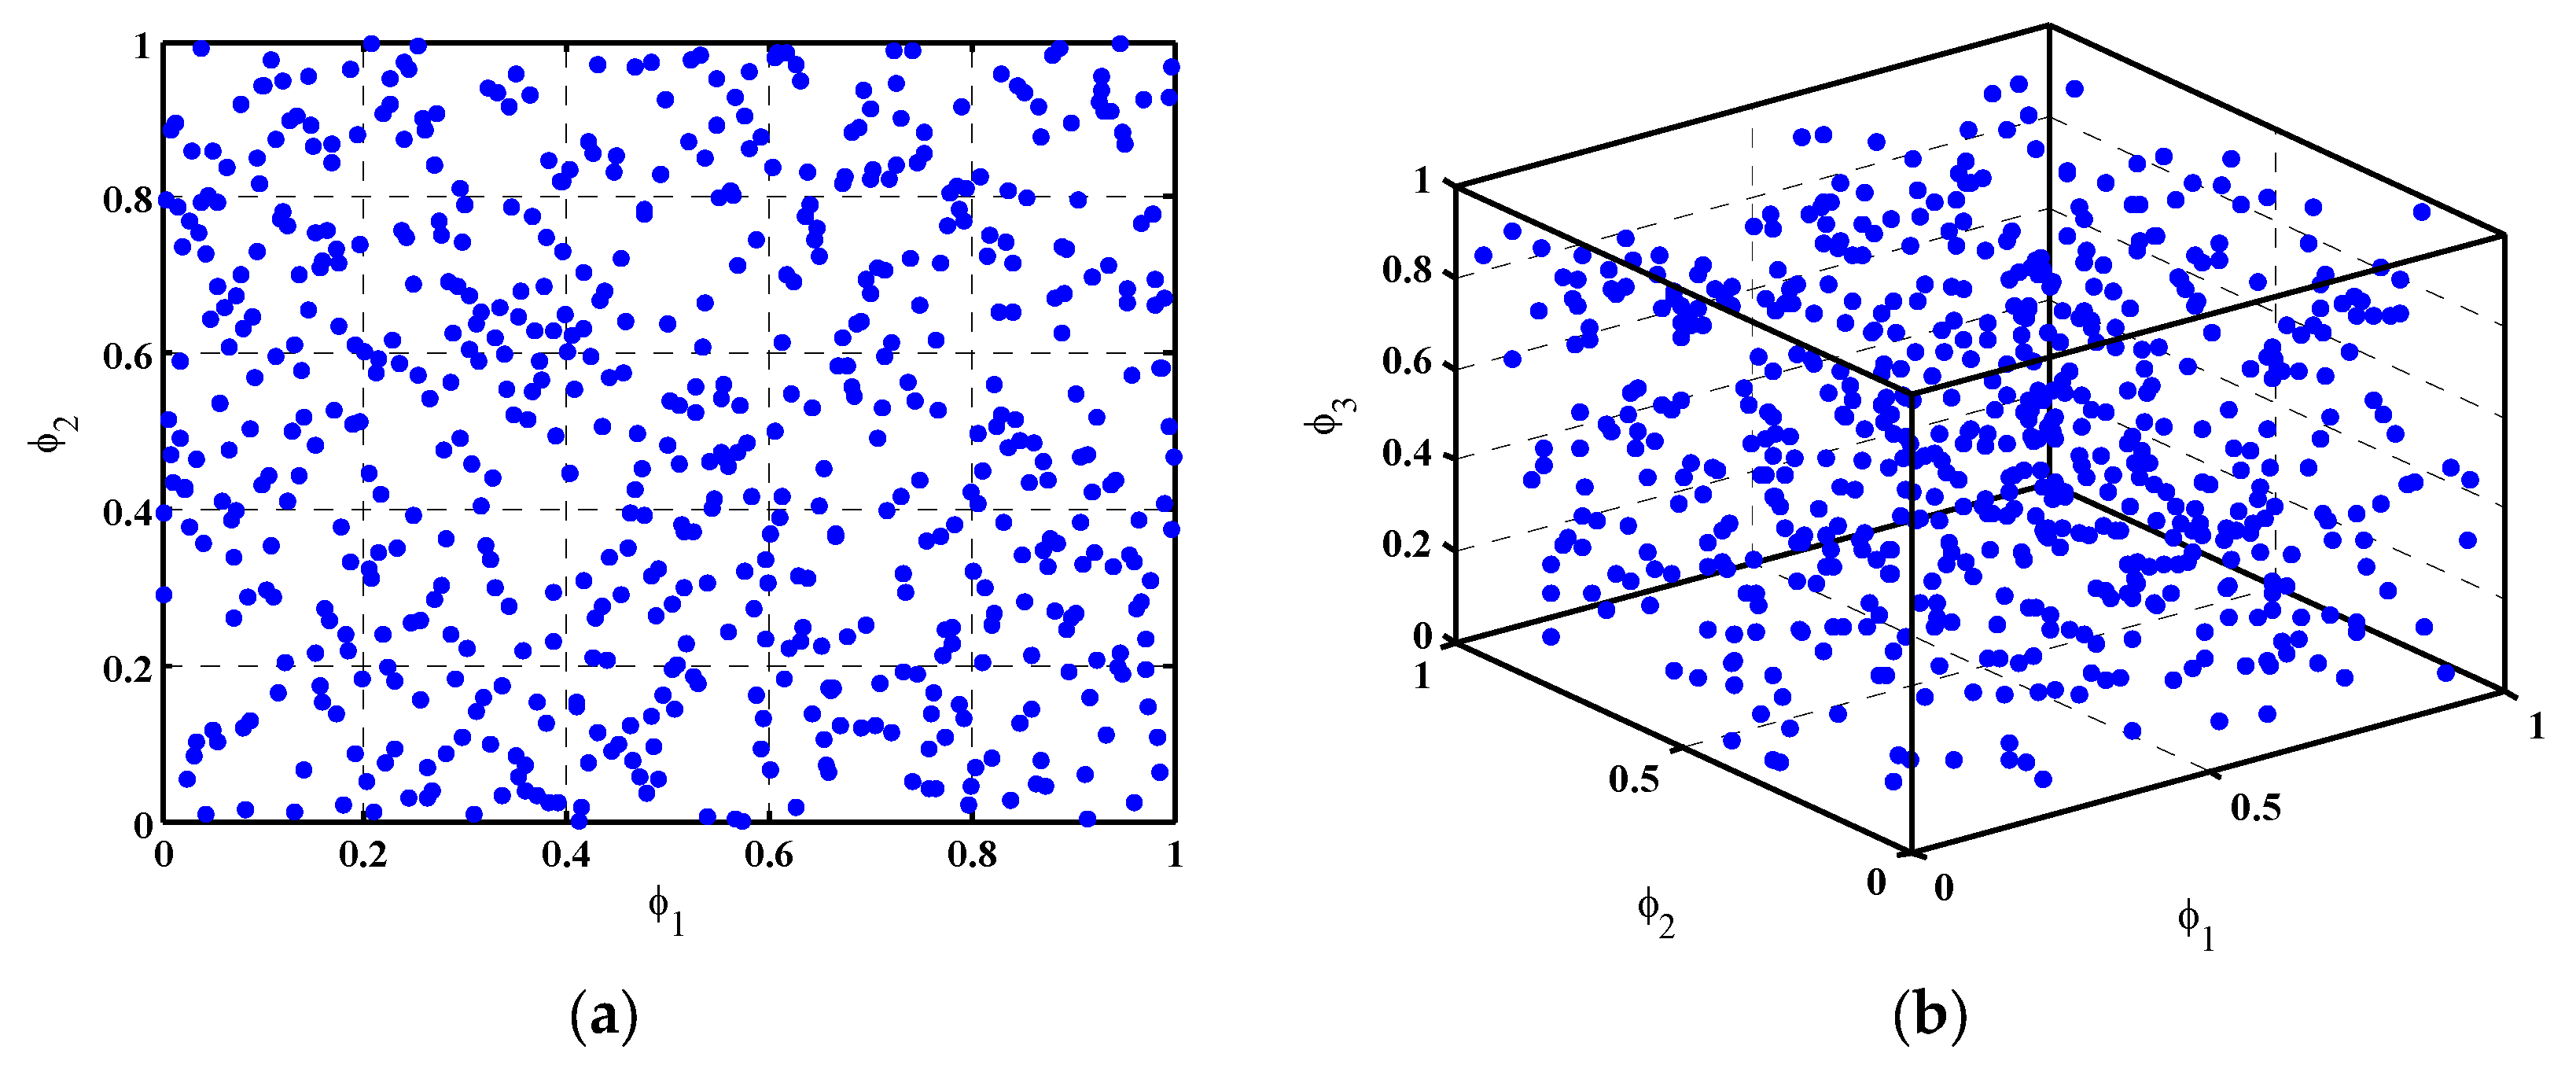
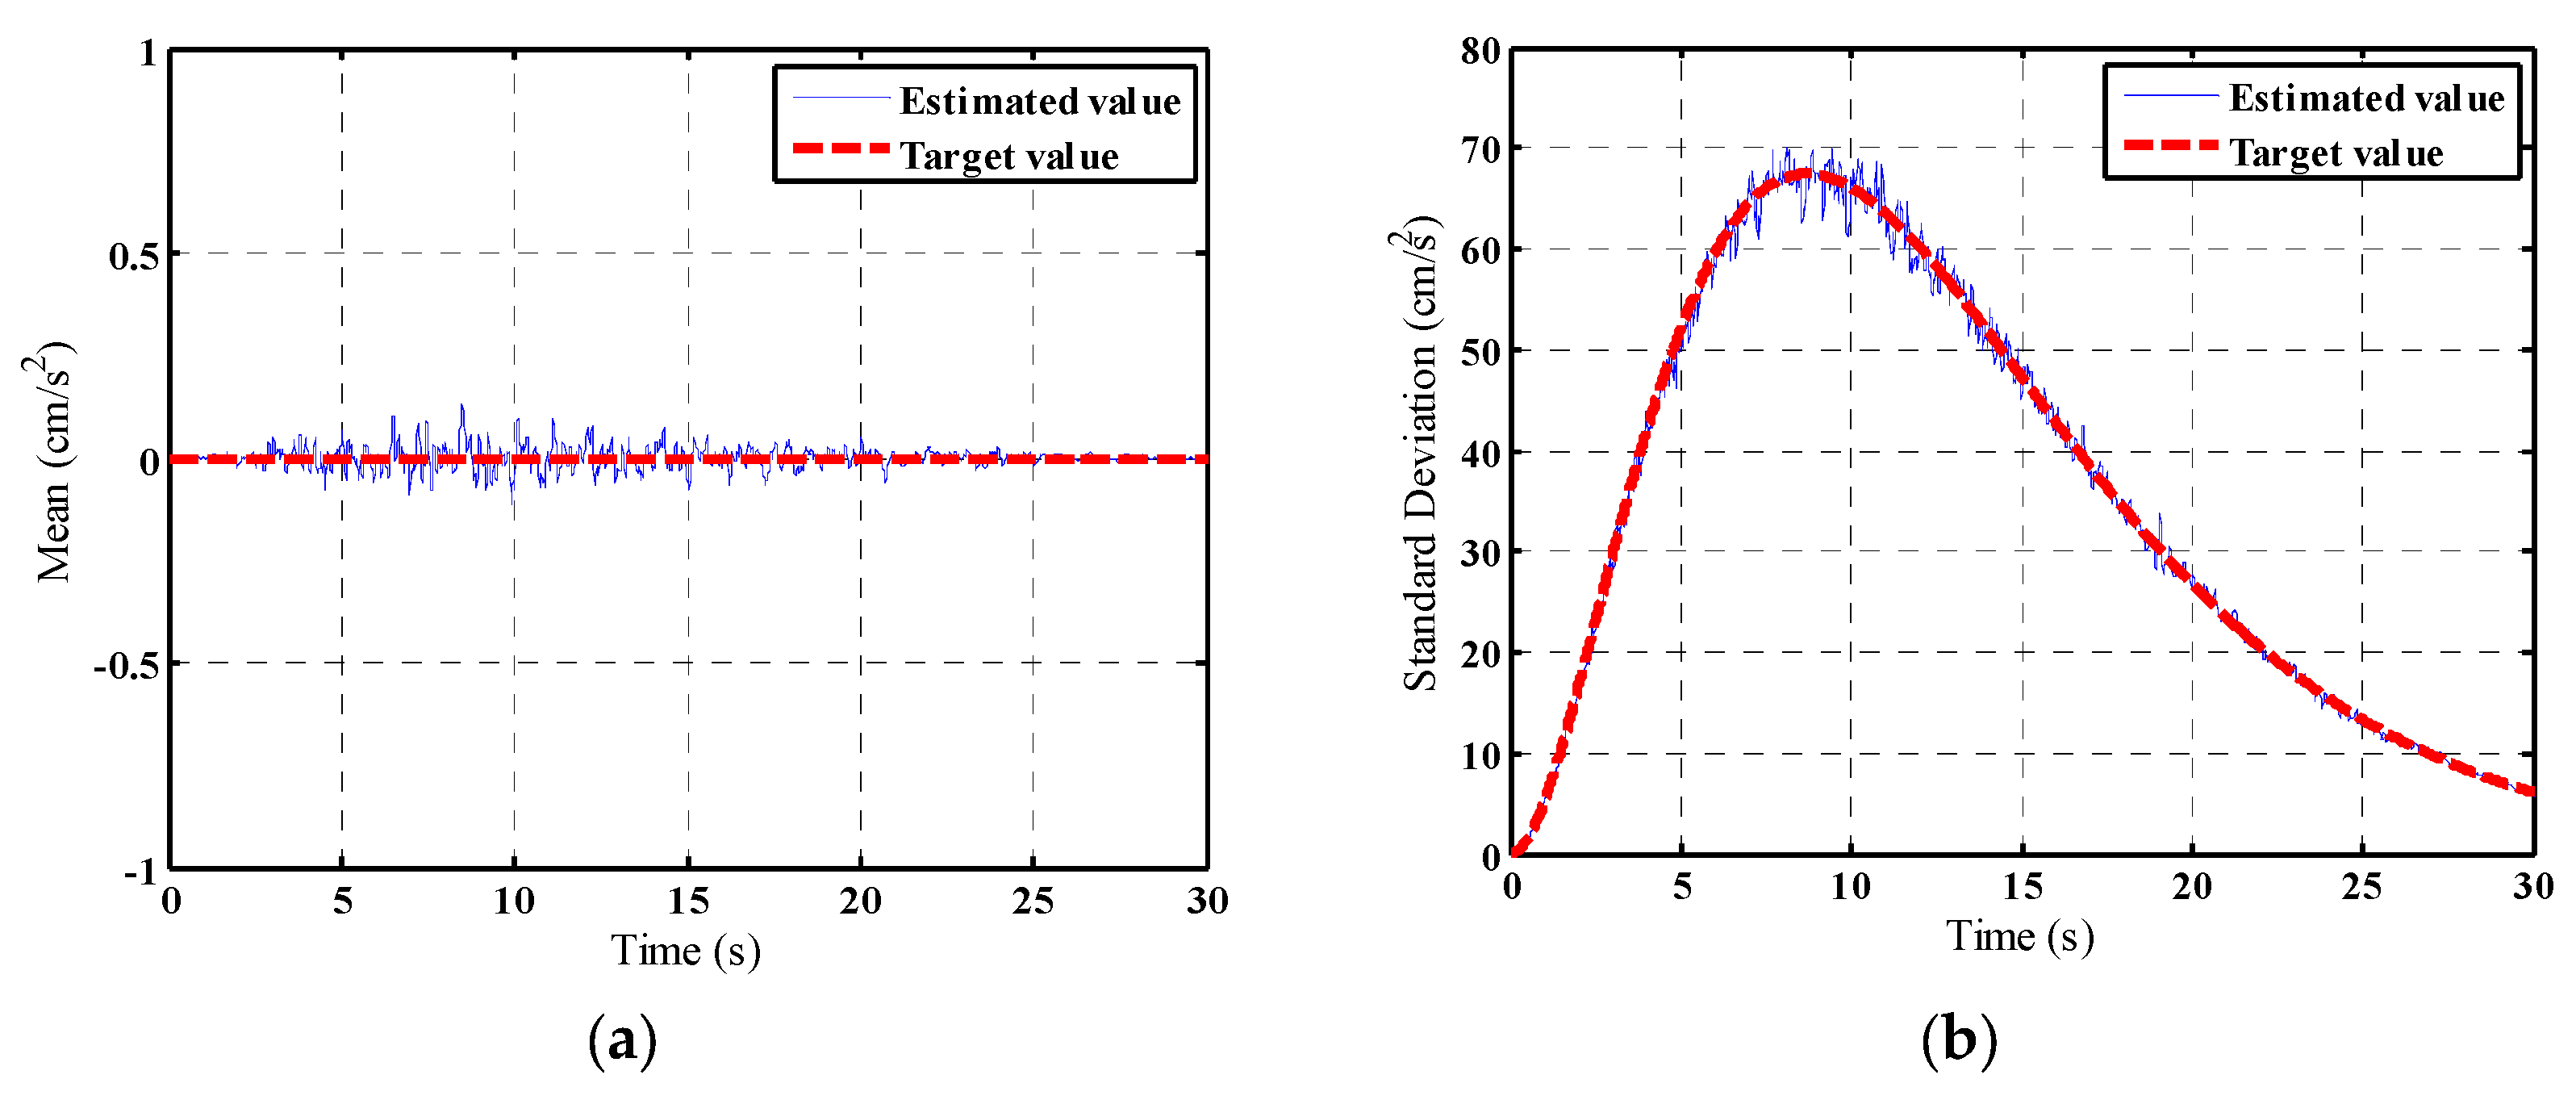
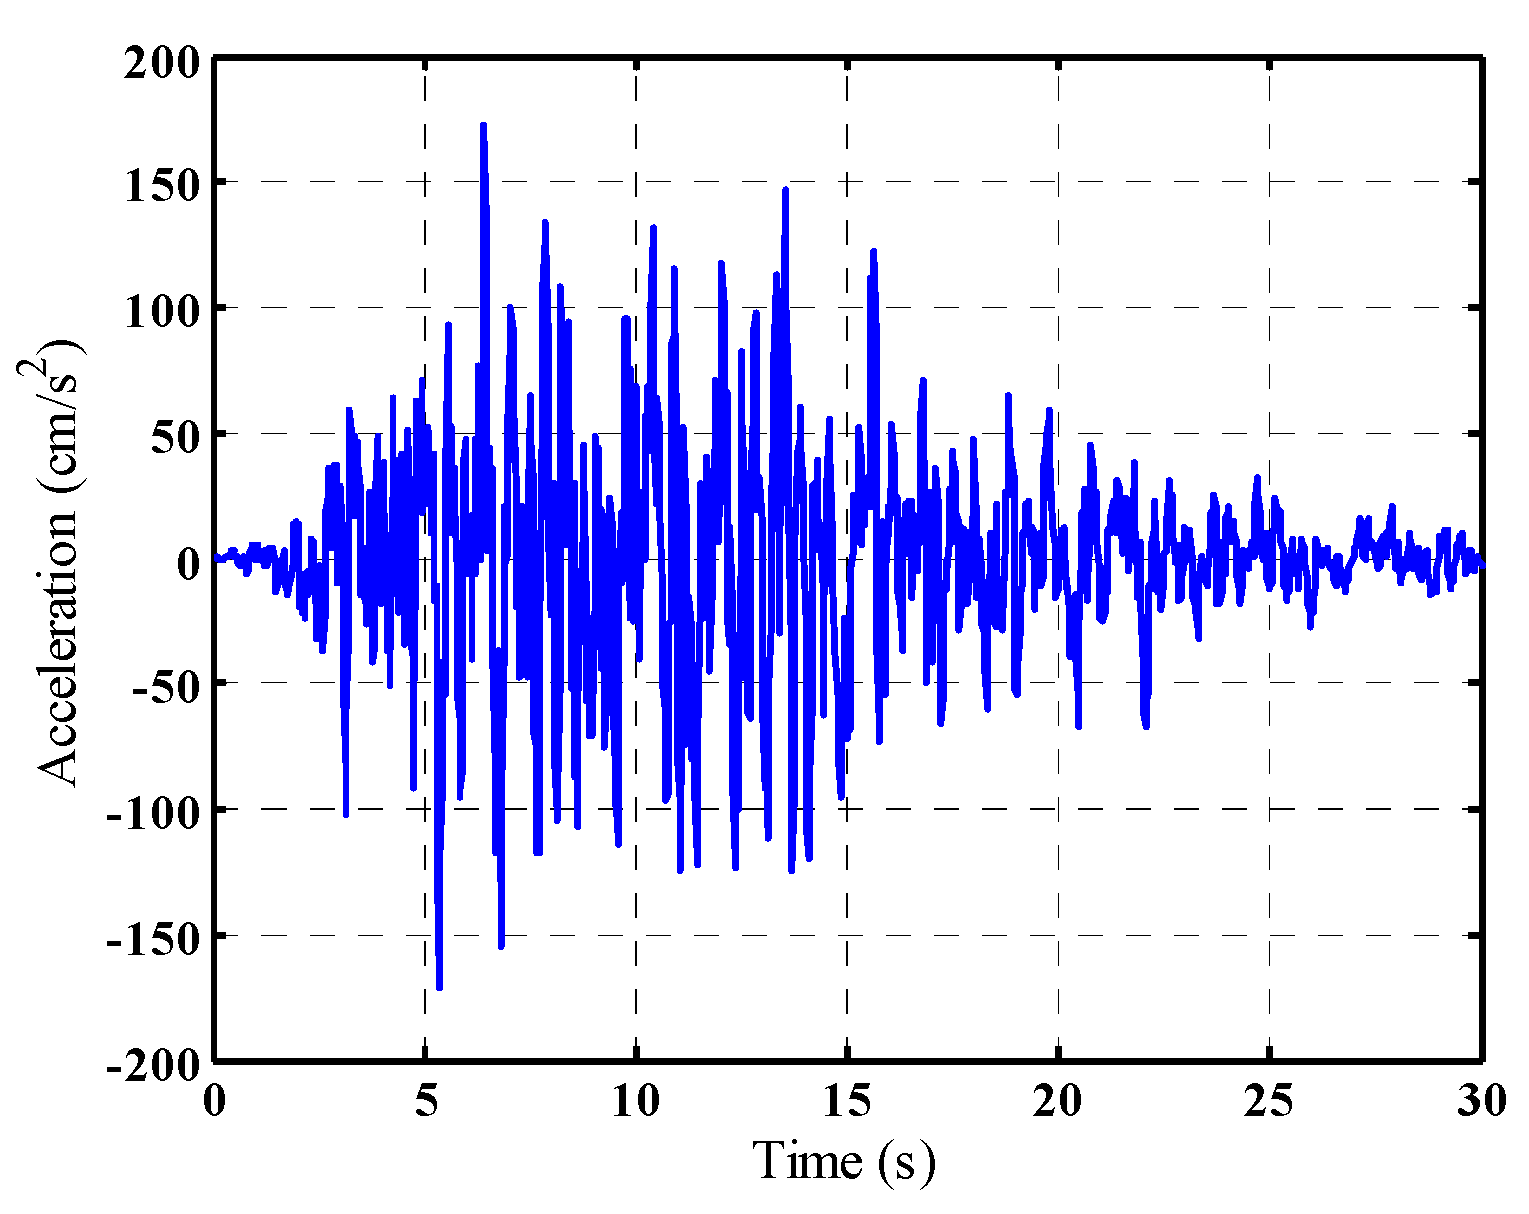
The RFSRM is employed to generate the seismic excitations. To ensure a relative mean-square error of less than 5% for accurate representation, the number of frequency intervals is set to d = 1601 , reducing the problem to two dimensions Θ 1 , Θ 2 . Subsequently, the OLPSS strategy is applied to generate an optimal set of n = 625 samples in this 2D space. These 625 optimal samples are then transformed into 625 representative non-stationary ground motion time histories via the RFSRM, which are used for subsequent analysis, drastically reducing the computational burden compared to conventional MCS. Figure 4a,b present the point distributions in two-dimensional and three-dimensional spaces, respectively. It can be observed that the points generated in these low-dimensional spaces are uniformly distributed within the [0, 1] interval, thus demonstrating their suitability for use in the RFSRM to generate uniform point sets for simulating ground motions. Figure 5a,b present the mean and standard deviation, respectively, of the ground motion acceleration time histories generated using 625 samples. The results show that the computed mean and standard deviation closely match their target values, demonstrating the capability of the proposed method to accurately simulate stochastic ground motions with only 625 samples. Furthermore, Figure 6 displays a typical sample of the acceleration time history, which effectively captures the non-stationary characteristics of seismic ground motions.

3.1.2. Stochastic Structural Responses of Nonlinear SDOF System

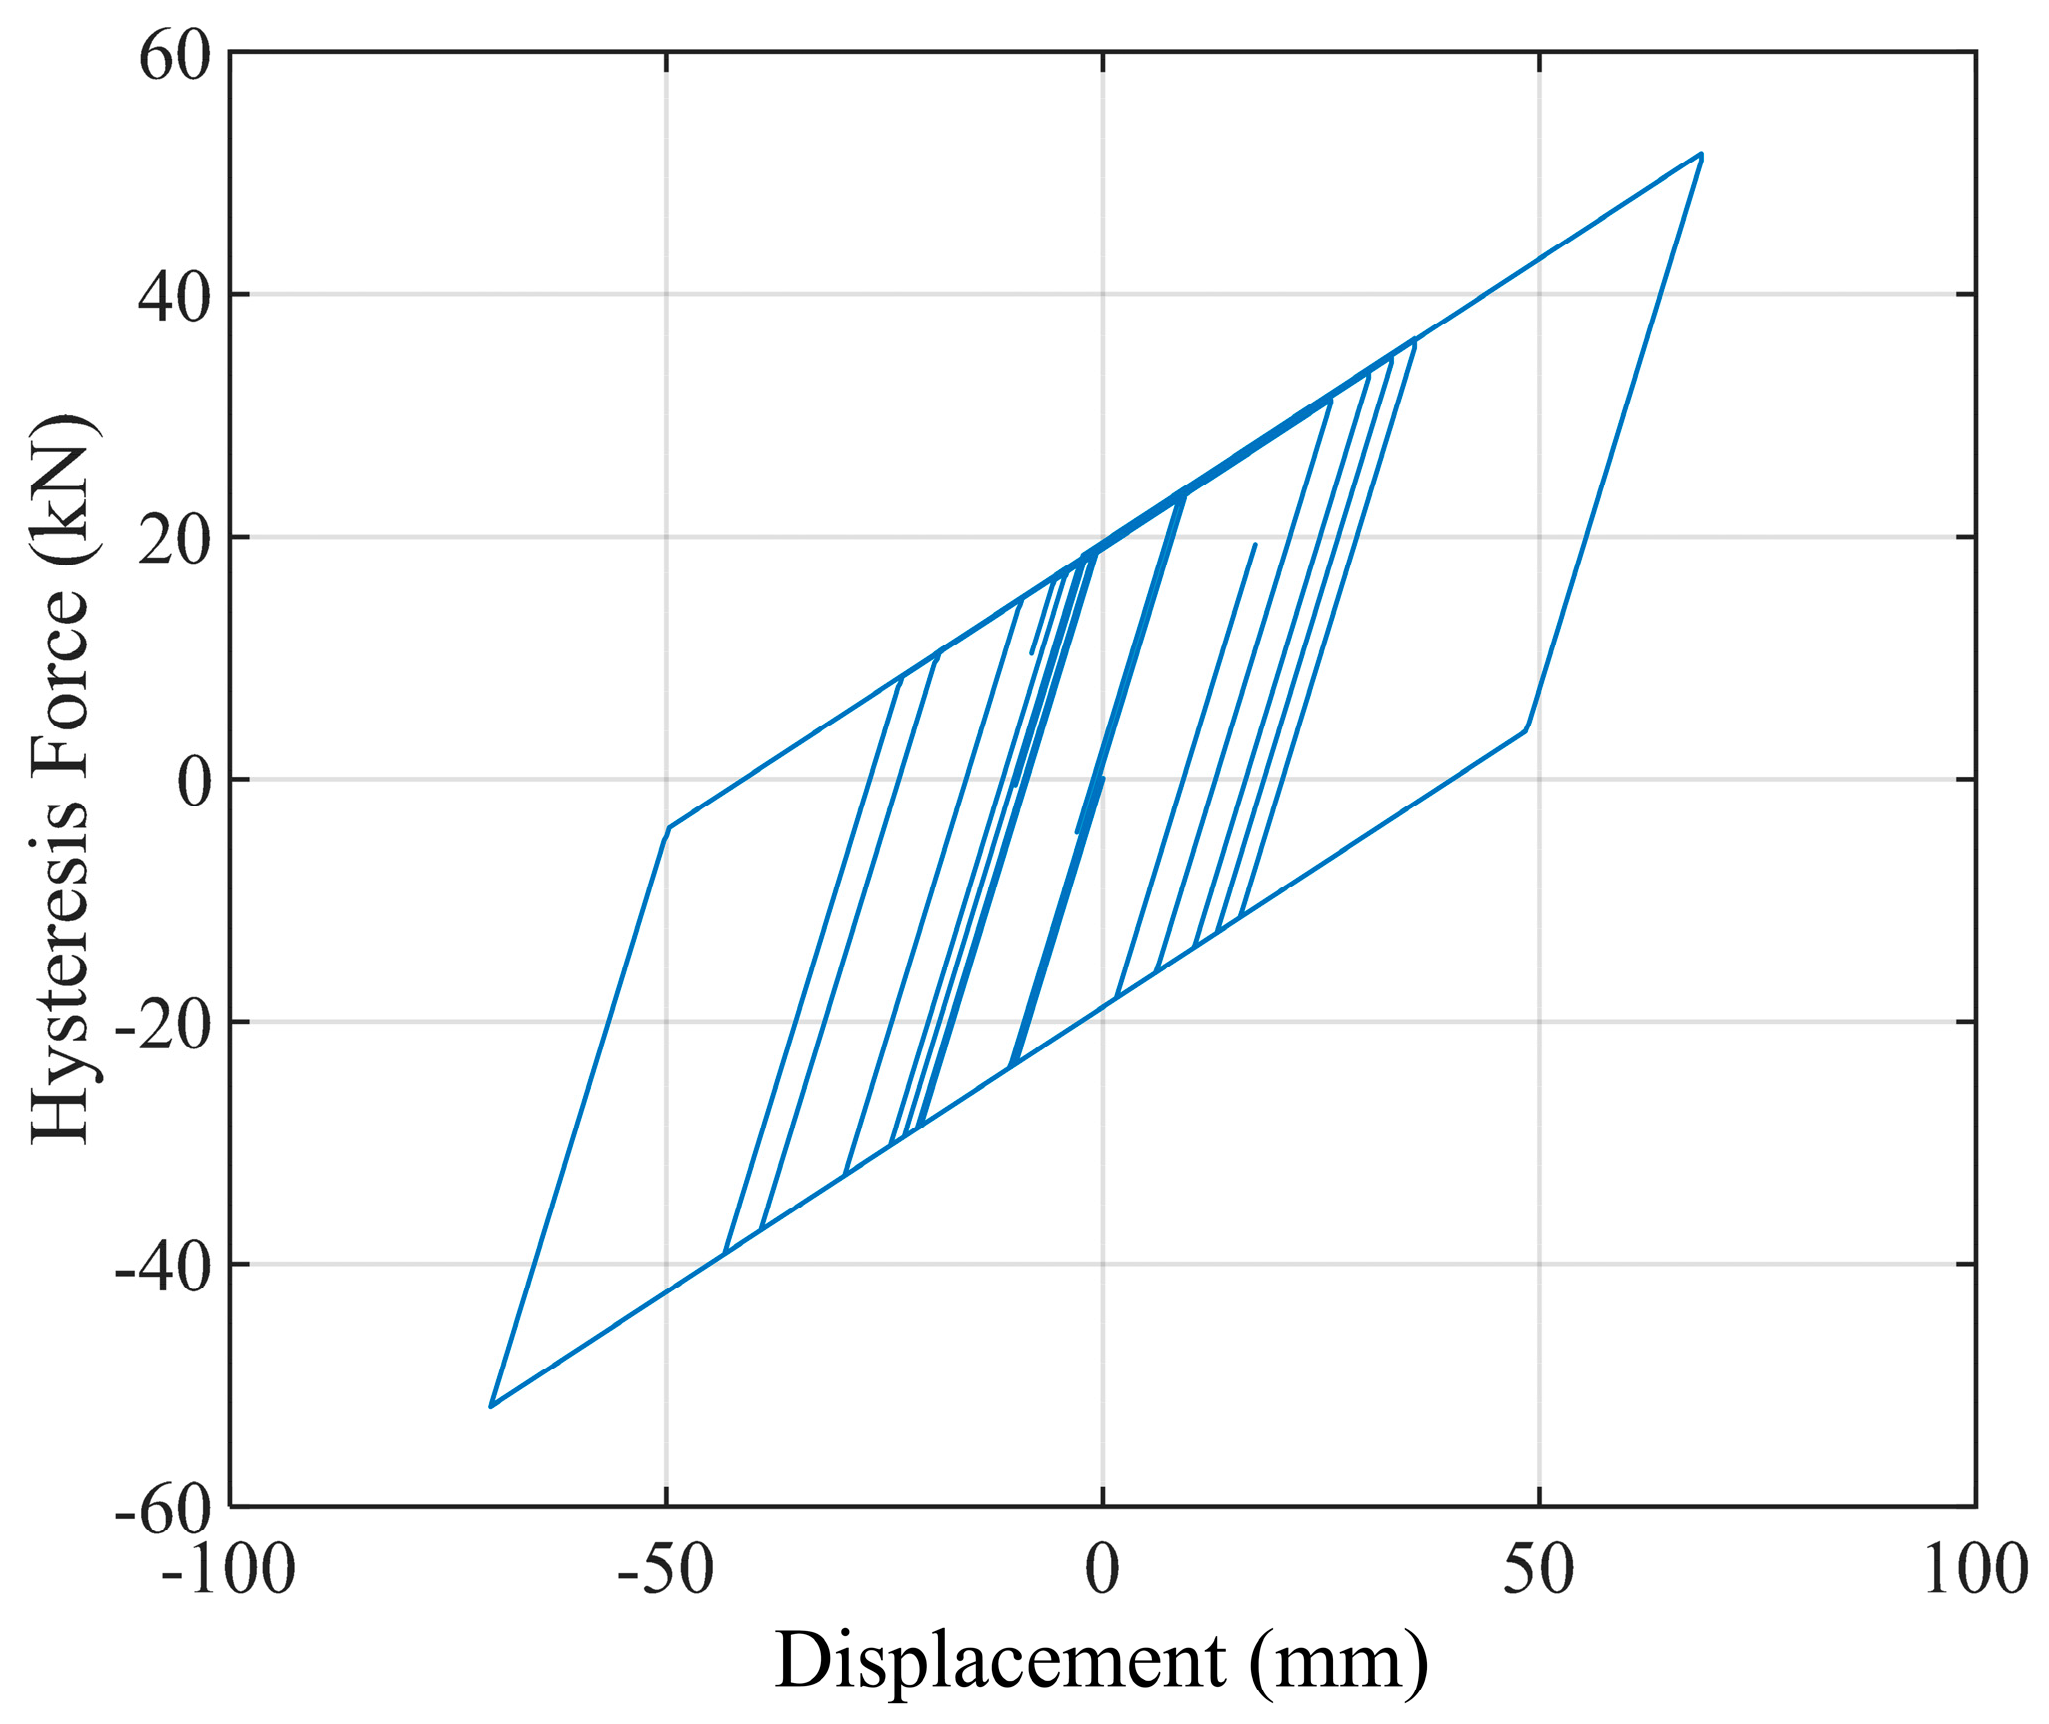
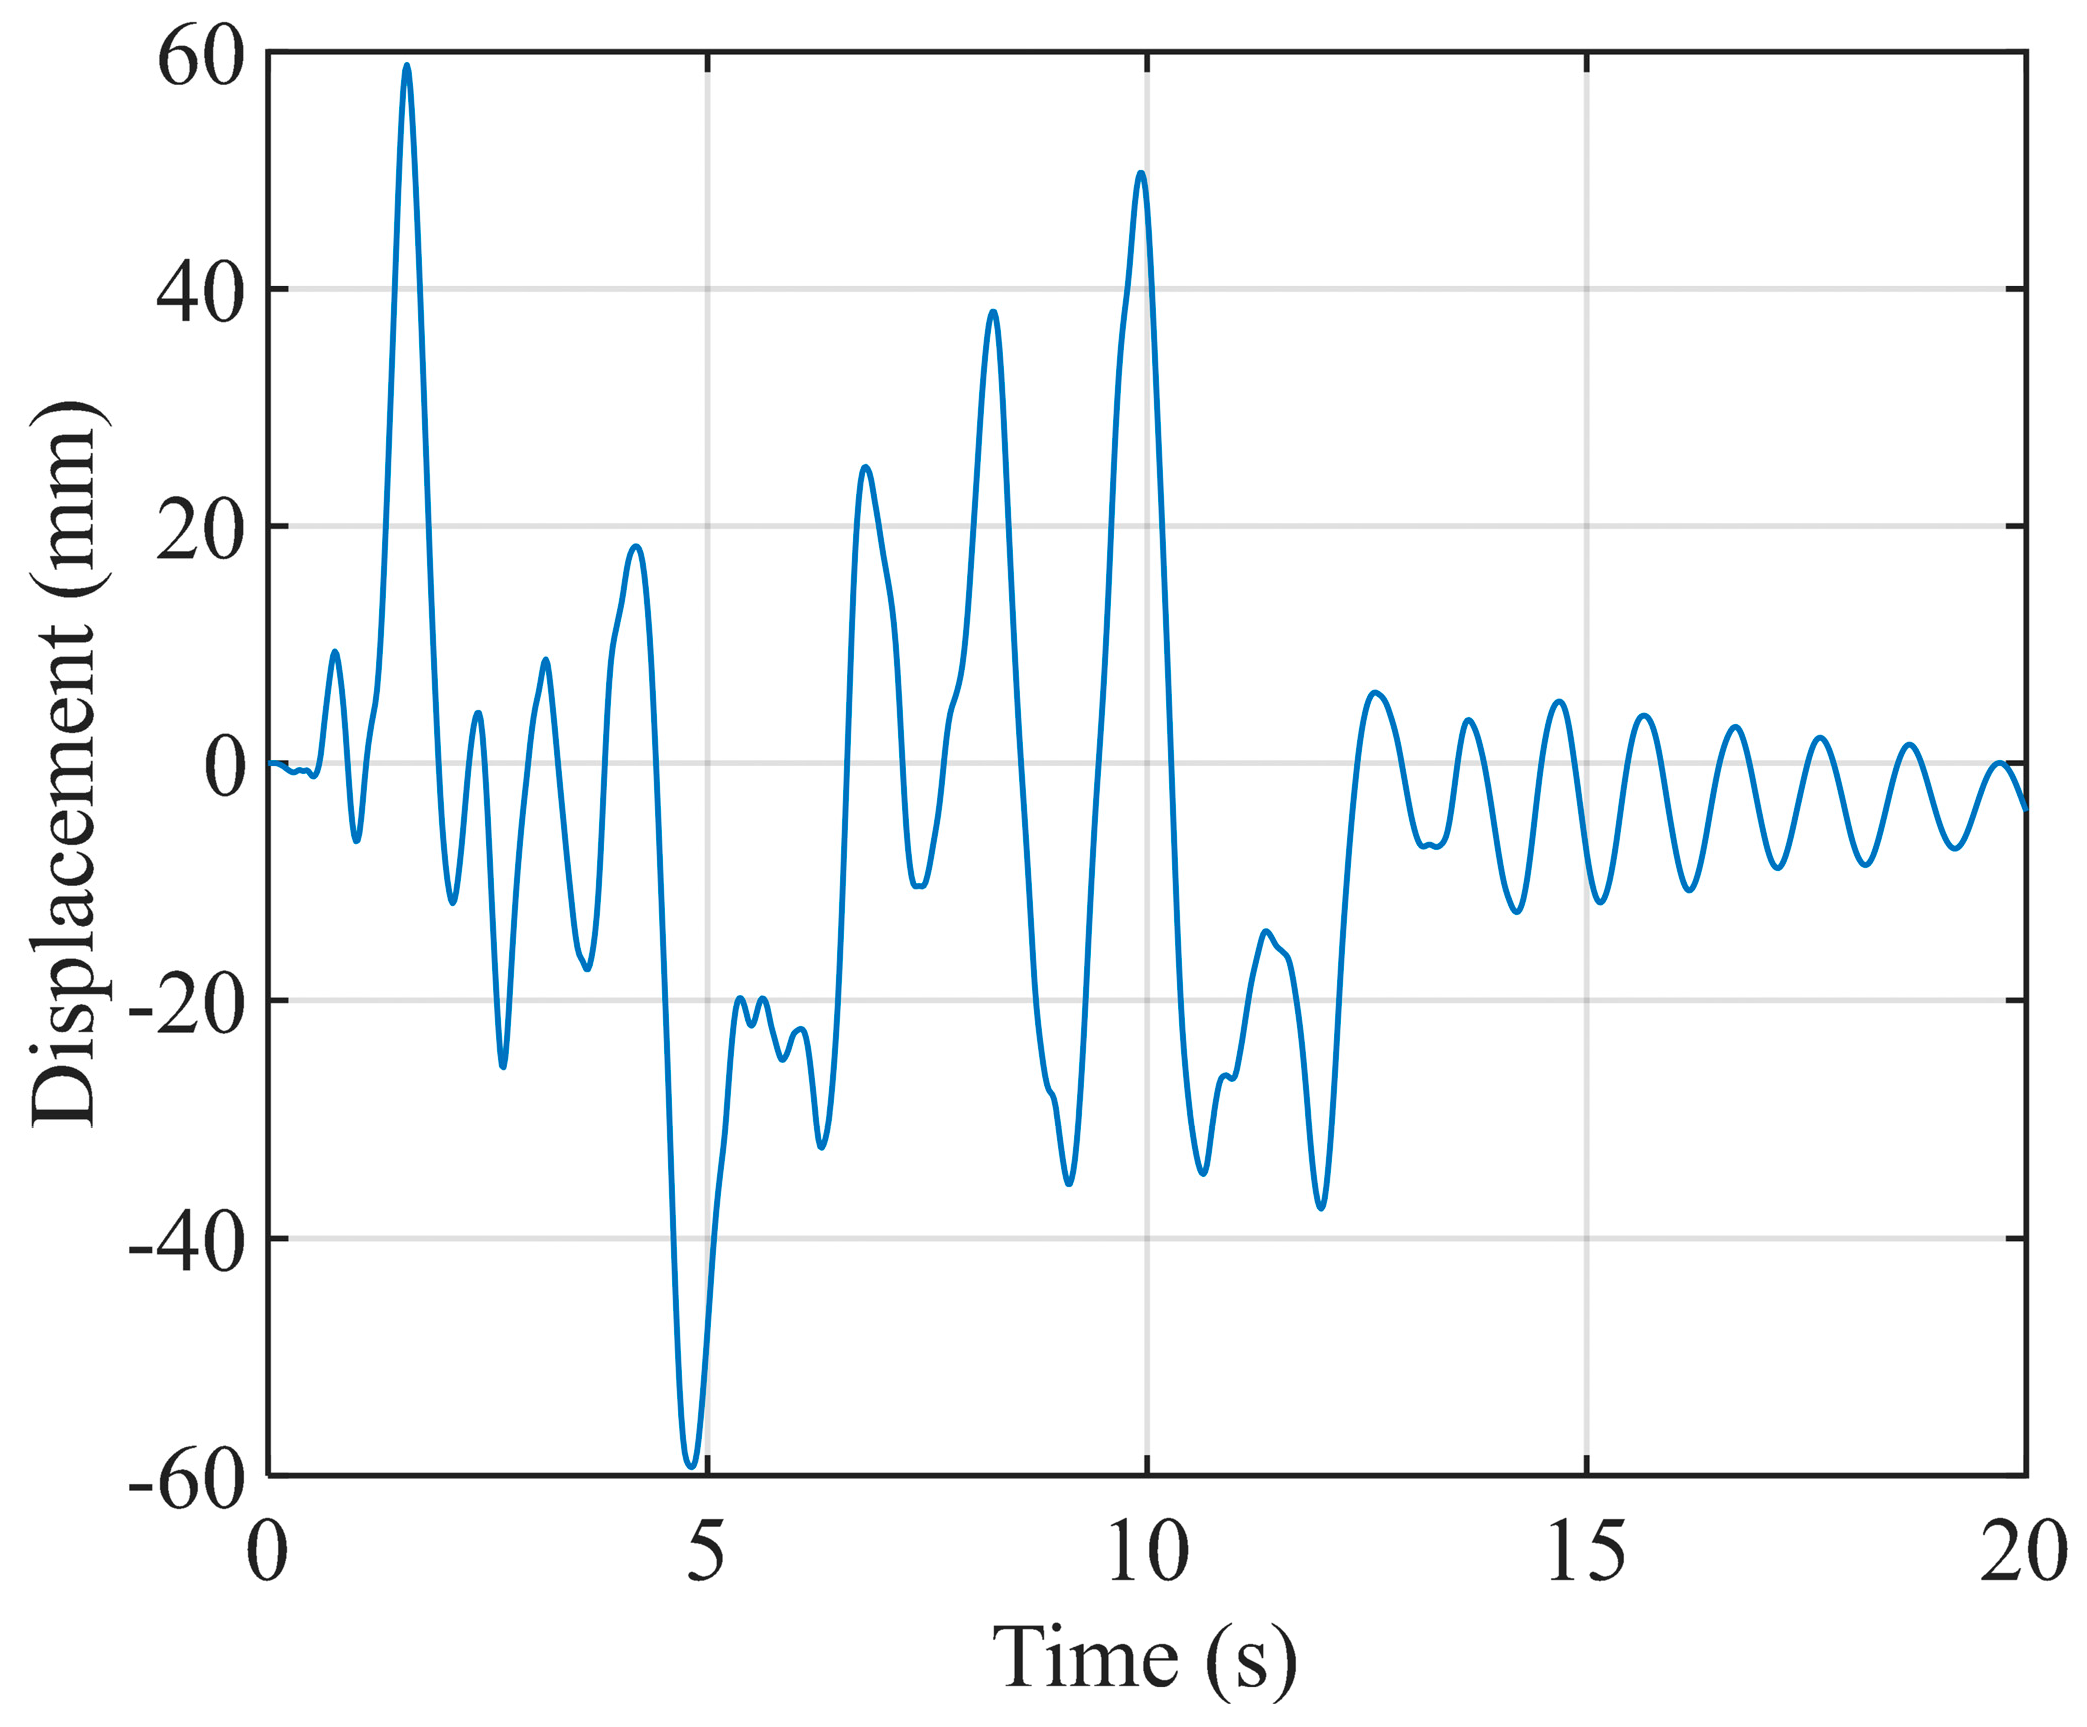
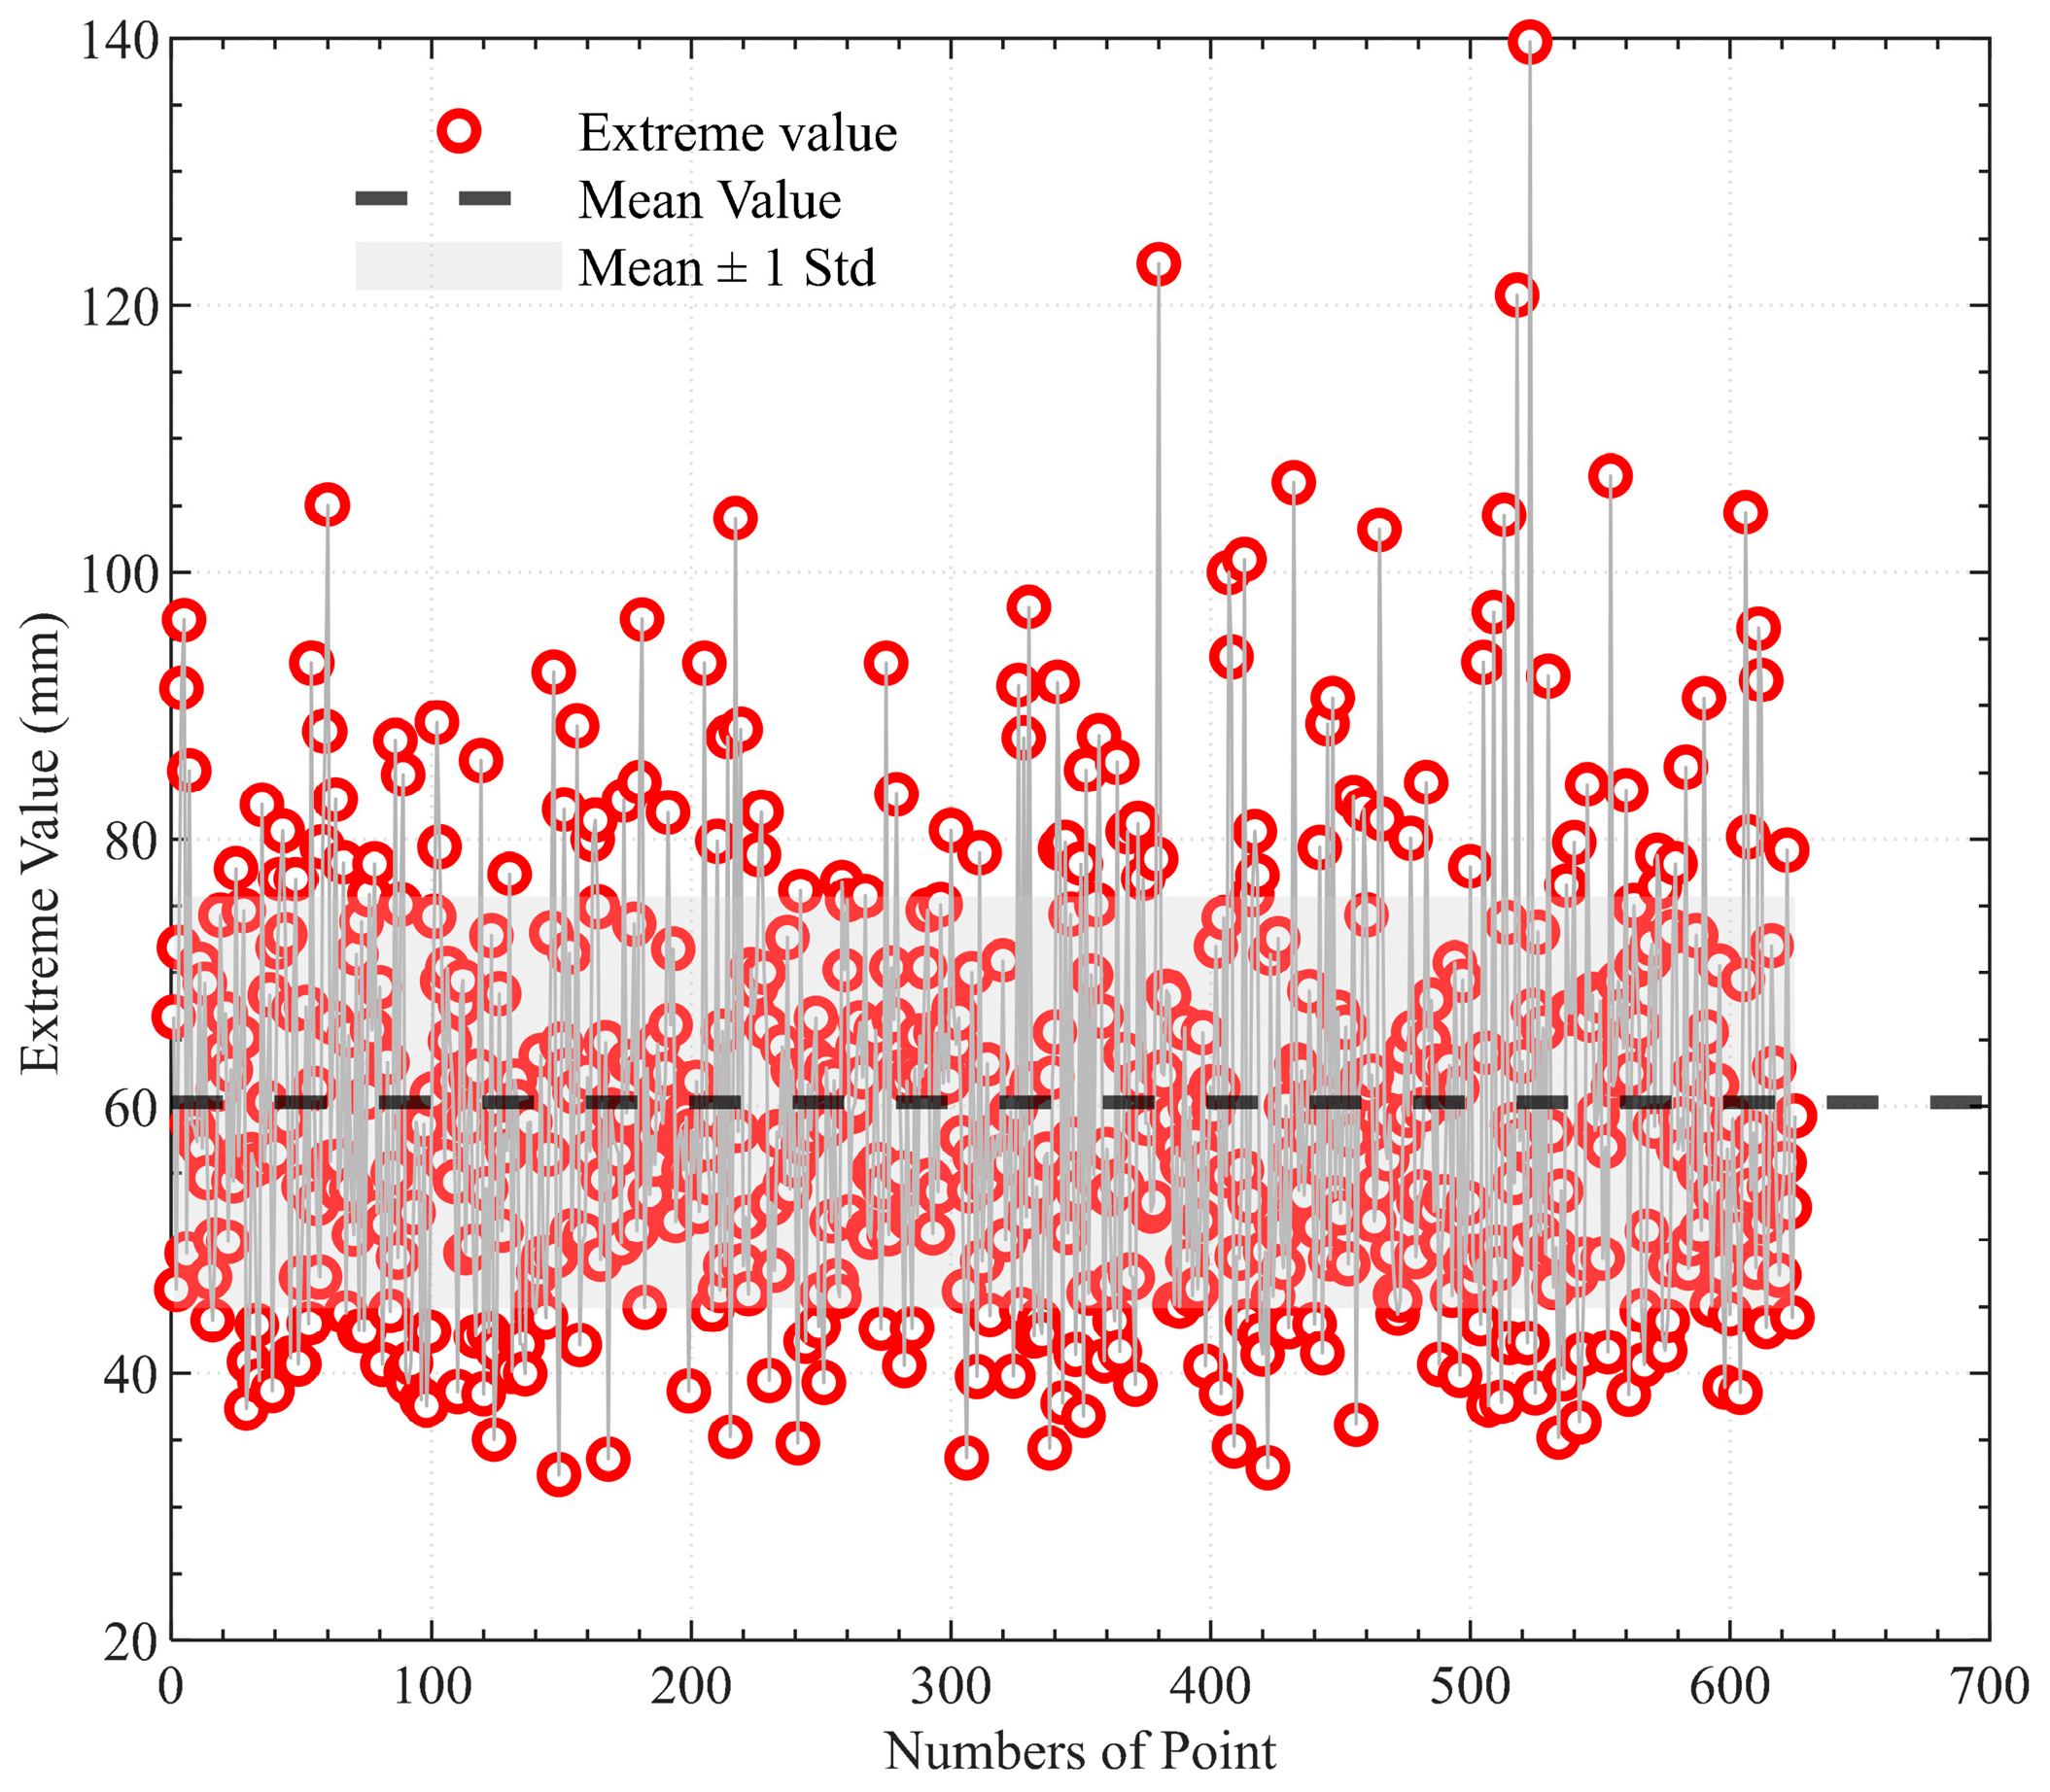
The 625 generated ground motions are subsequently used as input to the nonlinear SDOF system. For each input motion, a nonlinear time-history analysis is performed using the Wilson-θ method. The maximum absolute displacement response, S i = max t 0 , T u i t , is extracted from each analysis to form the extreme value response dataset S 1 , S 2 , , S 100 . Figure 7 presents the hysteresis loop obtained from the structural response analysis. It can be observed that the structural nonlinearity exhibits bilinear hysteretic behavior, thereby validating the effectiveness of the bilinear hysteresis model adopted in the structural analysis. Figure 8 shows a typical displacement time history response of the structure under a sample ground motion acceleration input. Figure 9 displays the extreme values of the structural displacement responses obtained from the 625 ground motion acceleration time history samples.

3.1.3. Dynamic Reliability Analysis of Nonlinear SDOF System

The dataset S 1 , S 2 , , S 100 is utilized to fit the SGLD using the extrapolation method. The fitted SGLD provides the complete probabilistic description of the extreme displacement, enabling the direct calculation of the CDF, F Z e x t Z .
The first-passage failure probability for a displacement threshold b is computed as P f = 1 F Z e x t b . The reliability index is then derived as β = Φ 1 P f .
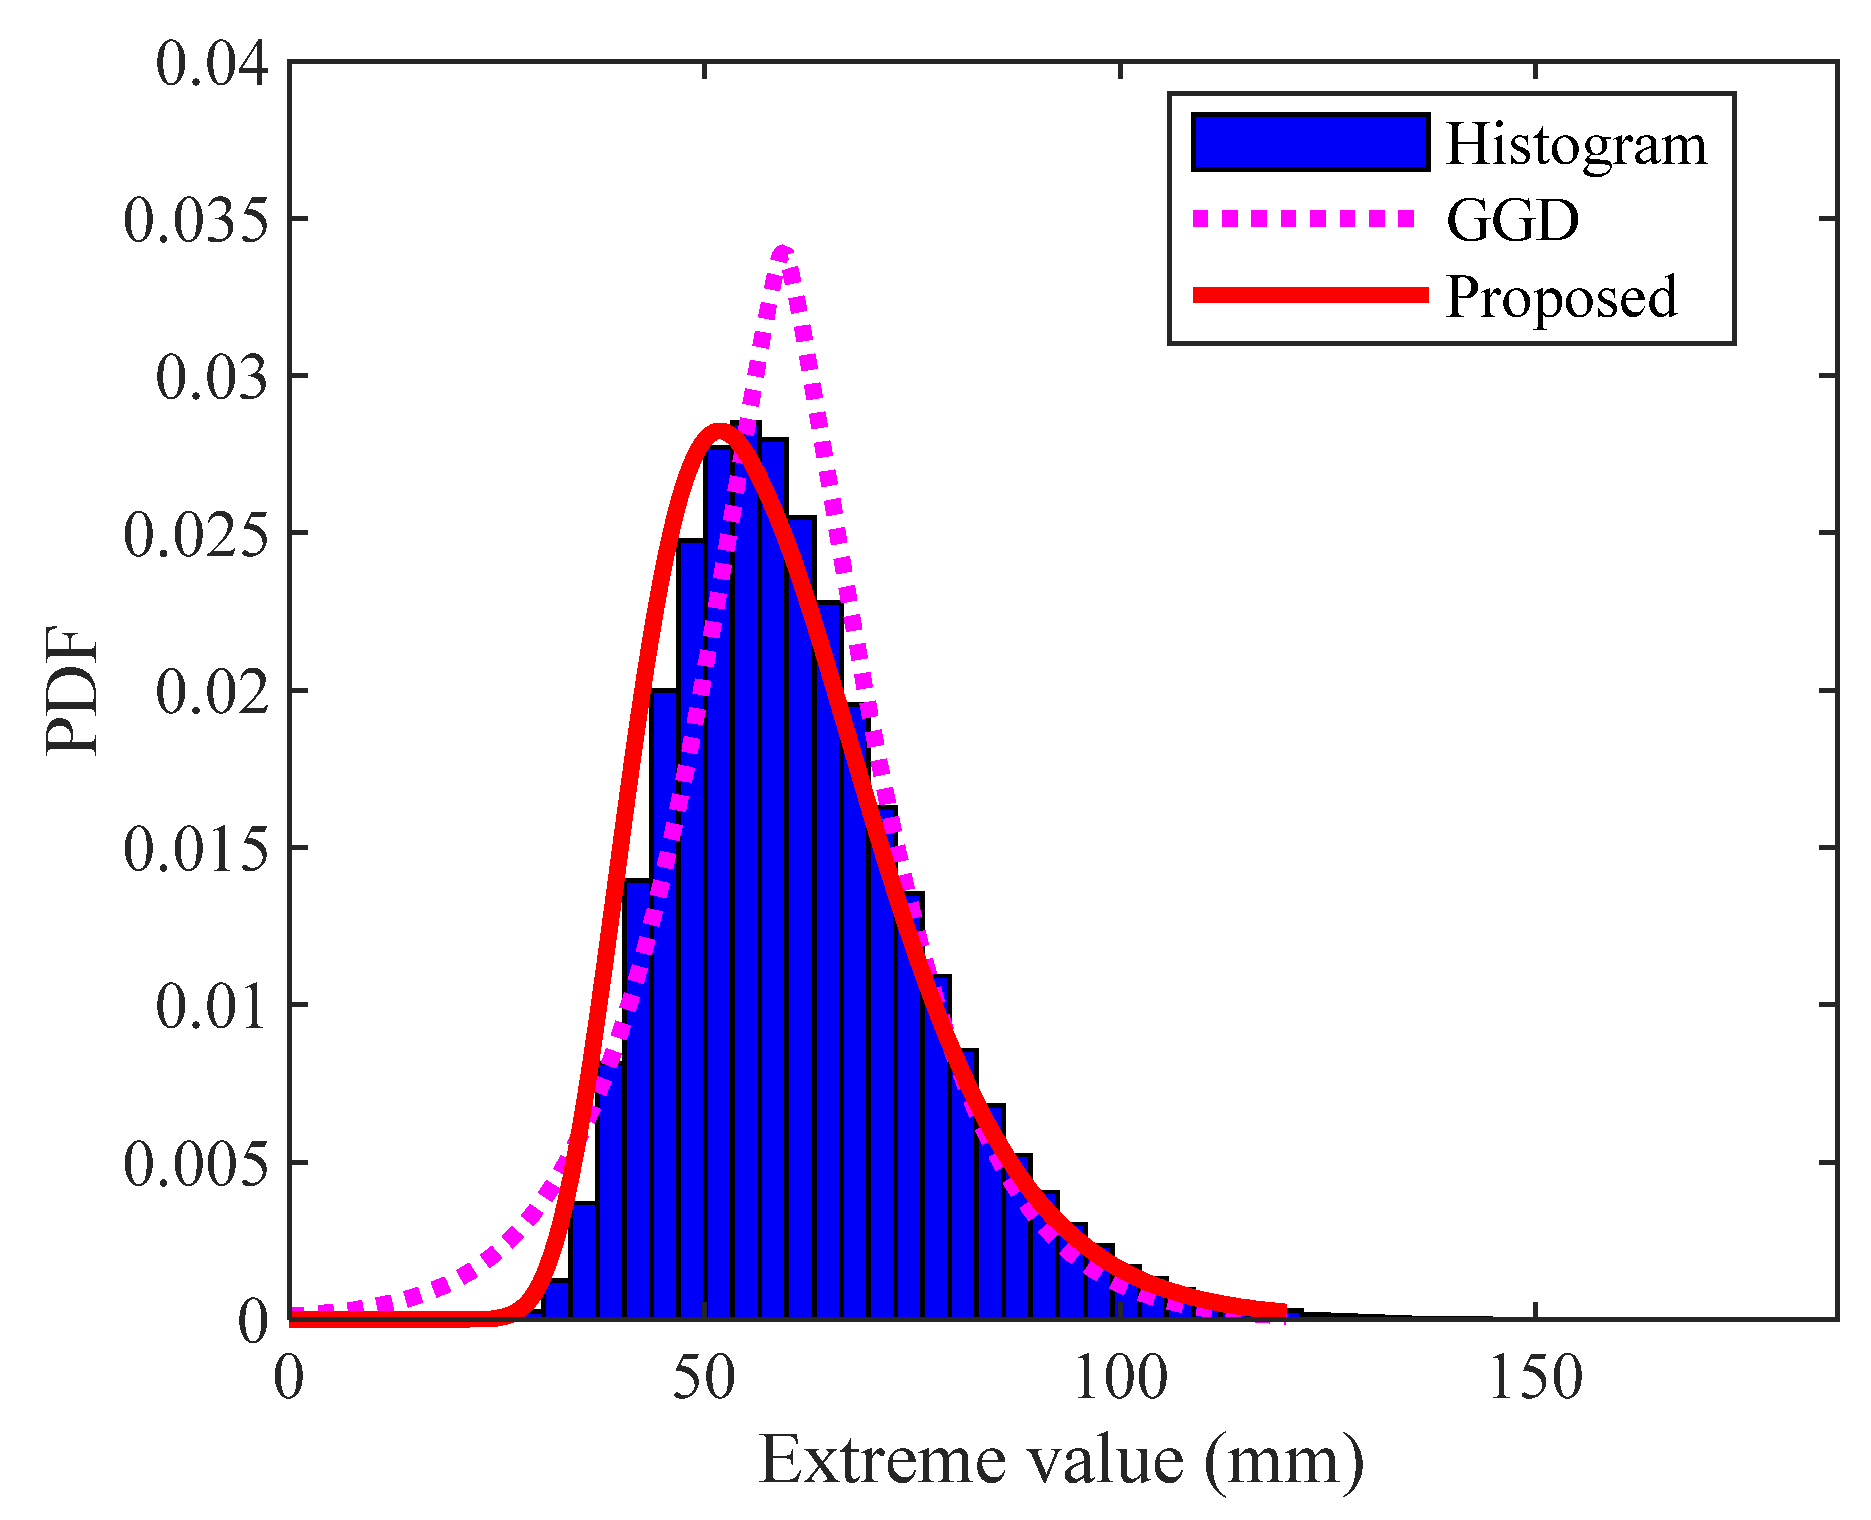
The statistical characteristics of these extreme responses are analyzed. Figure 10 shows the PDF of the extreme displacement values estimated from the 625 OLPSS-RFSRM samples, compared against the benchmark histogram from 100,000 MCS samples and the PDF obtained using the Generalized Gaussian Distribution (GGD) method. It can be observed that the PDF from the proposed OLPSS-RFSRM exhibits close agreement with the MCS benchmark across both the body and tail regions. In contrast, the GGD result shows noticeable deviations from the MCS histogram, particularly in capturing the tail behavior. This comparison demonstrates that the small set of samples generated by the proposed OLPSS-RFSRM approach effectively captures the statistical properties of the system’s nonlinear response, outperforming the GGD fit.
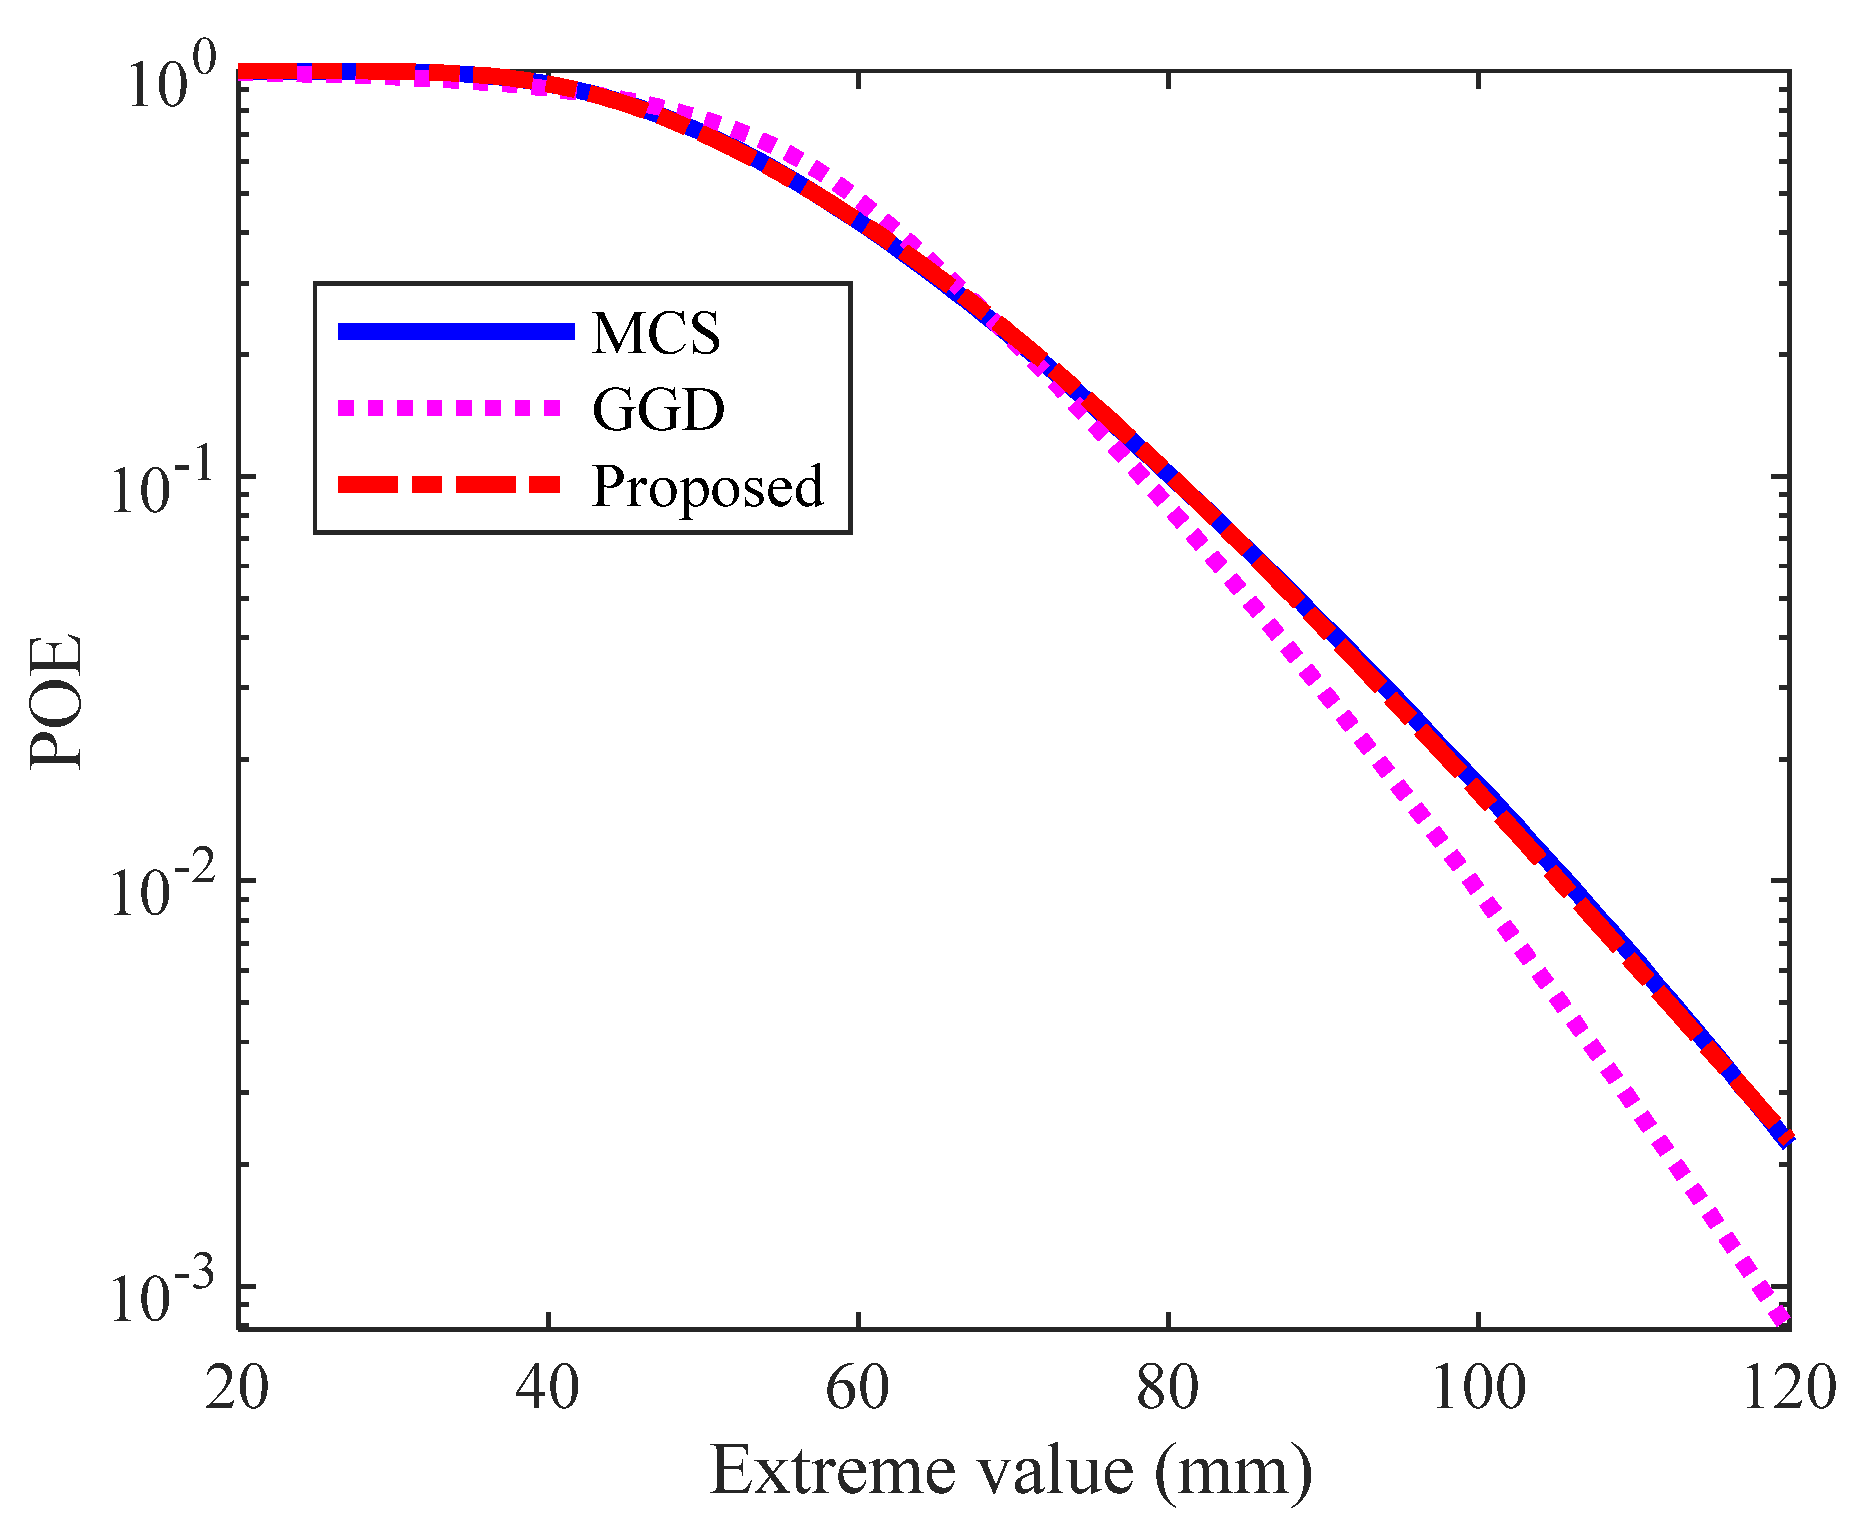
Figure 11 plots the probability of exceedance (POE) obtained from the proposed method (using only 625 analyses), the benchmark MCS method (using 100,000 analyses), and the GGD method, with all POE curves presented on a logarithmic scale. The results indicate excellent agreement between the proposed method and the MCS benchmark across a wide range of threshold levels, including the tail region corresponding to very small probabilities of failure. In contrast, the GGD method exhibits noticeable deviations from the MCS results, particularly in the low-probability region where it fails to accurately capture the tail behavior. This comparison demonstrates the superior accuracy of the proposed SGLD extrapolation in capturing the extreme response distribution, especially in the tail region. The primary advantage of the proposed framework is its remarkable computational efficiency: it achieved this high accuracy with only 625 simulations, which is 160 times fewer than the 100,000 simulations required by the conventional MCS approach. This conclusively validates the proposed framework as a highly efficient and accurate tool for the dynamic reliability analysis of nonlinear structures under stochastic seismic excitation.
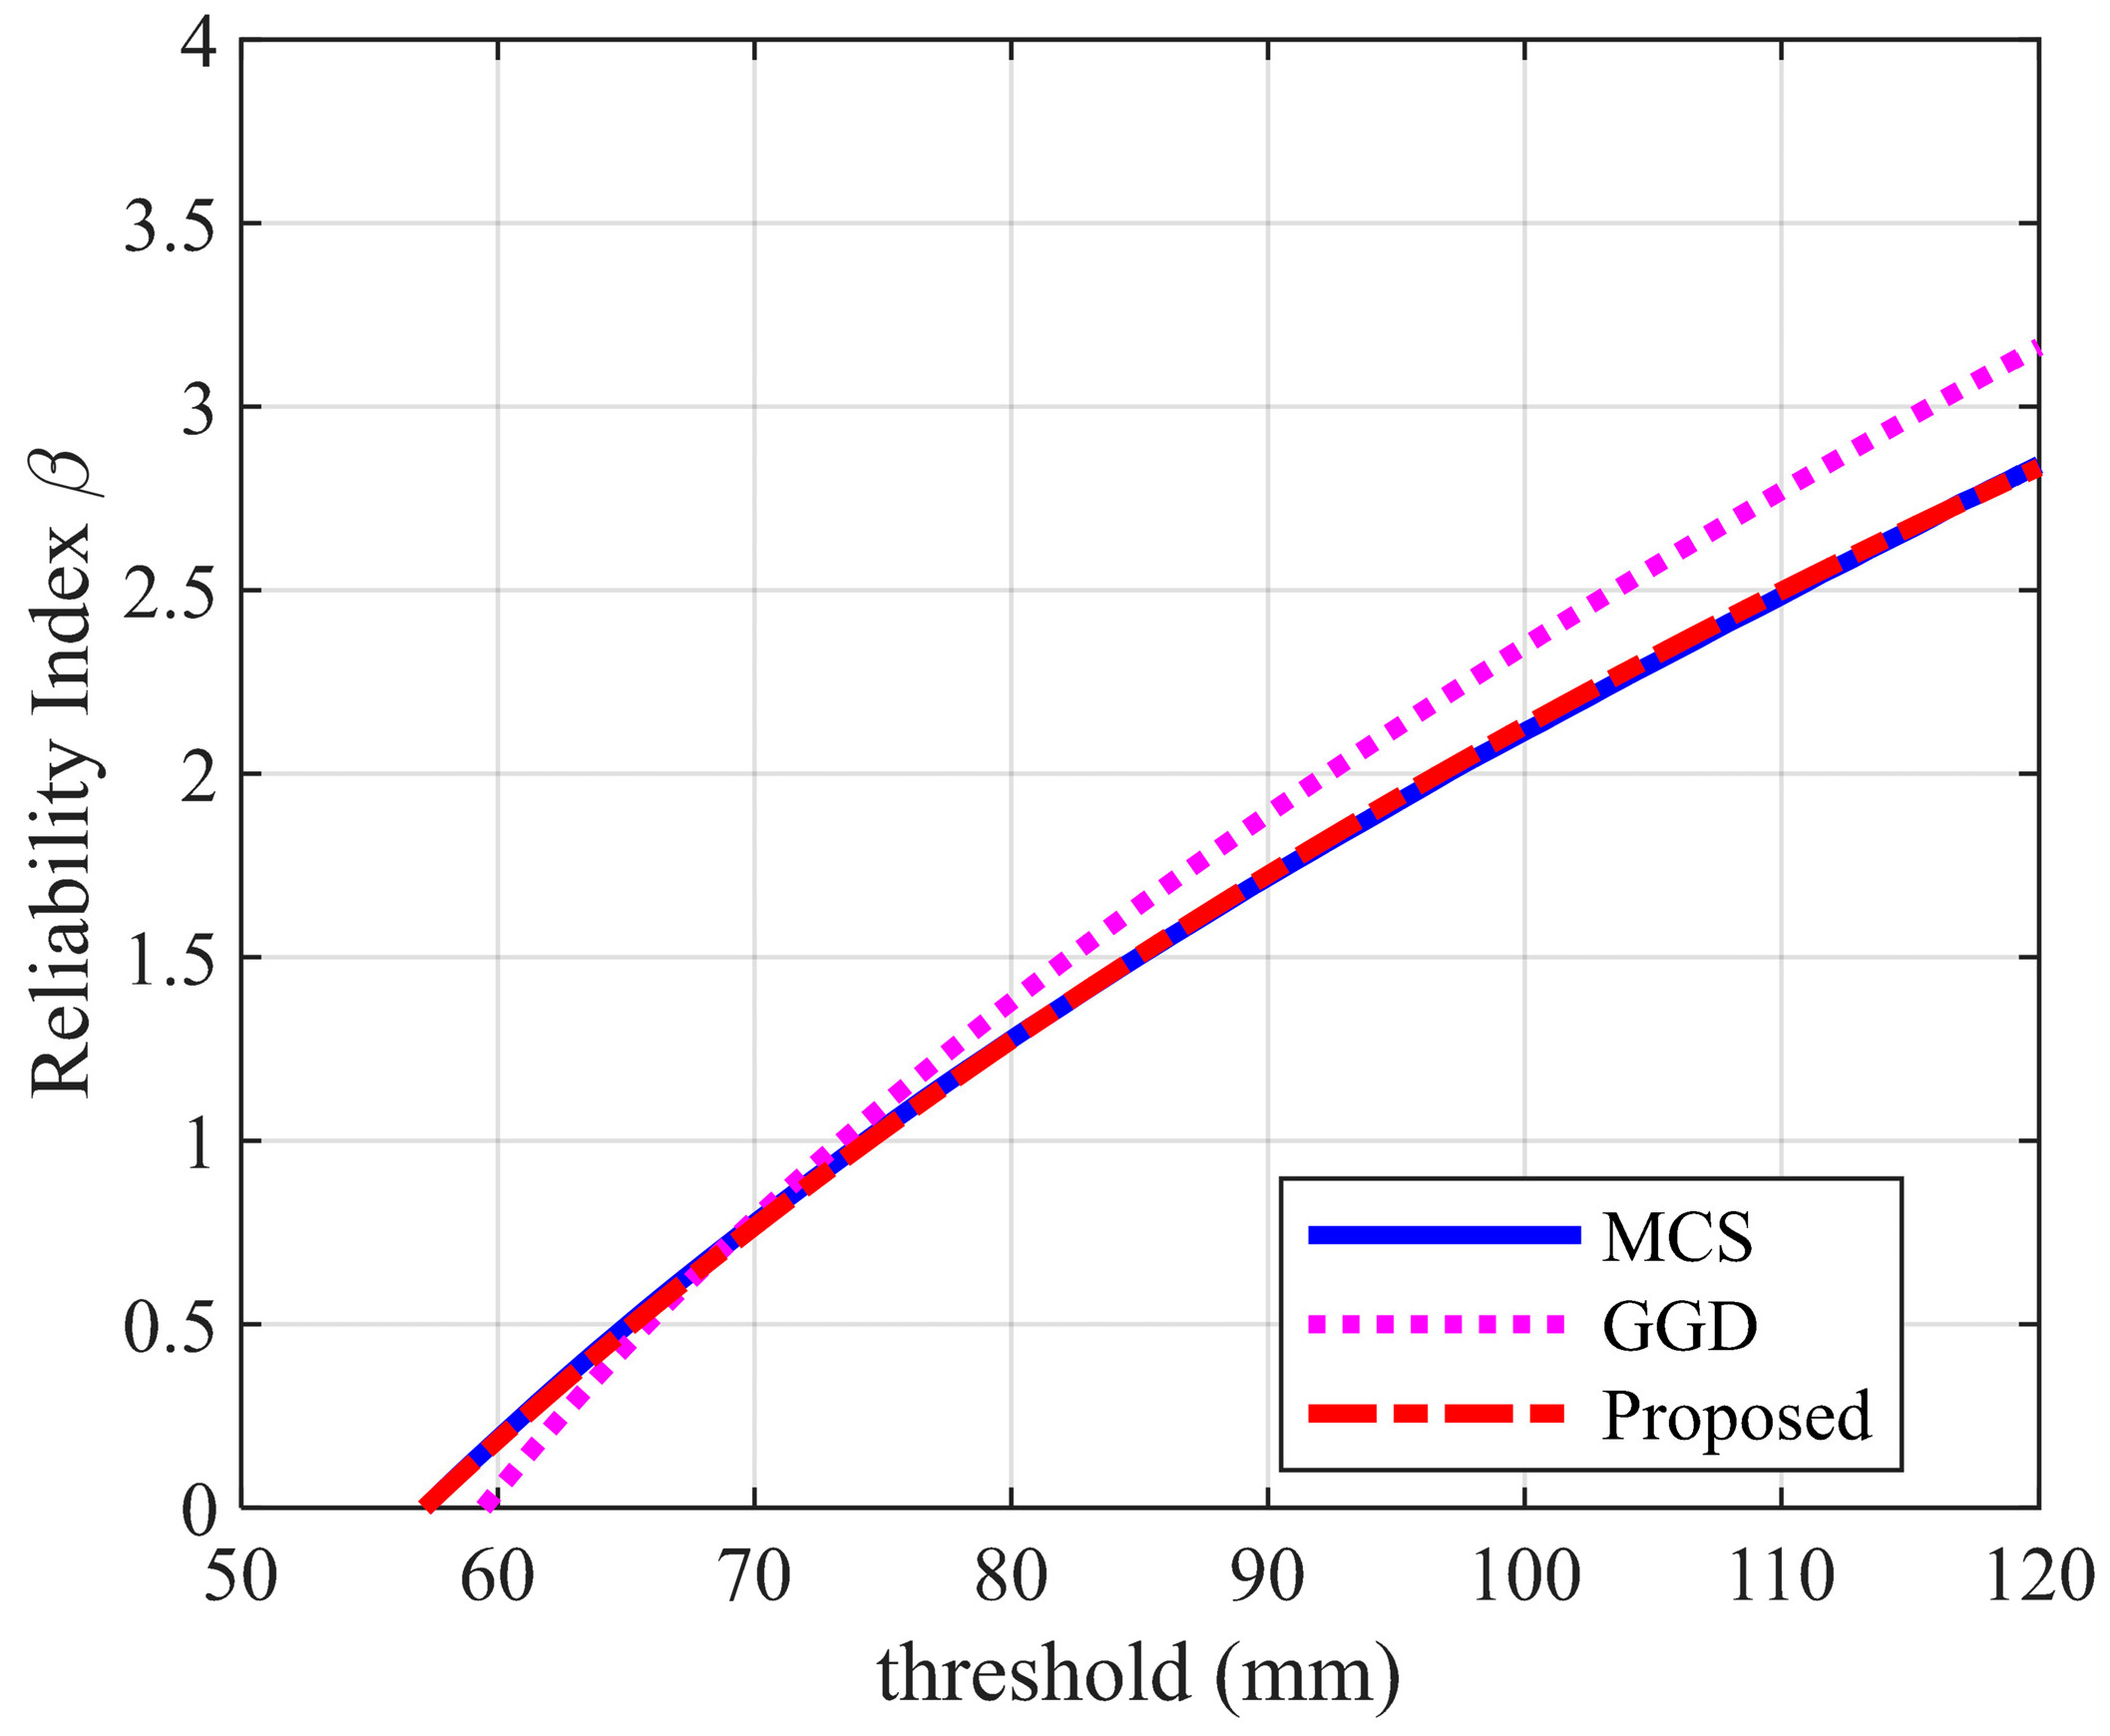
Figure 12 compares the reliability indices obtained by the GGD, the proposed method, and the MCS. A similar conclusion can be drawn: the results from the proposed method show close agreement with the MCS benchmark across all threshold levels, whereas the GGD method exhibits noticeable discrepancies.
To further quantitatively assess the accuracy of the results computed by different methods, Table 2 presents the POE obtained under various threshold levels for the MCS, GGD, and proposed method. The relative error (RE) is defined as the discrepancy between the MCS result and those obtained by either the GGD or the proposed method. As can be observed from Table 2, the REs of the proposed method are consistently smaller than those of the GGD, further demonstrating the superior accuracy of the proposed approach.

3.2. Example 2: Three-Degree-of-Freedom Shear Building Model

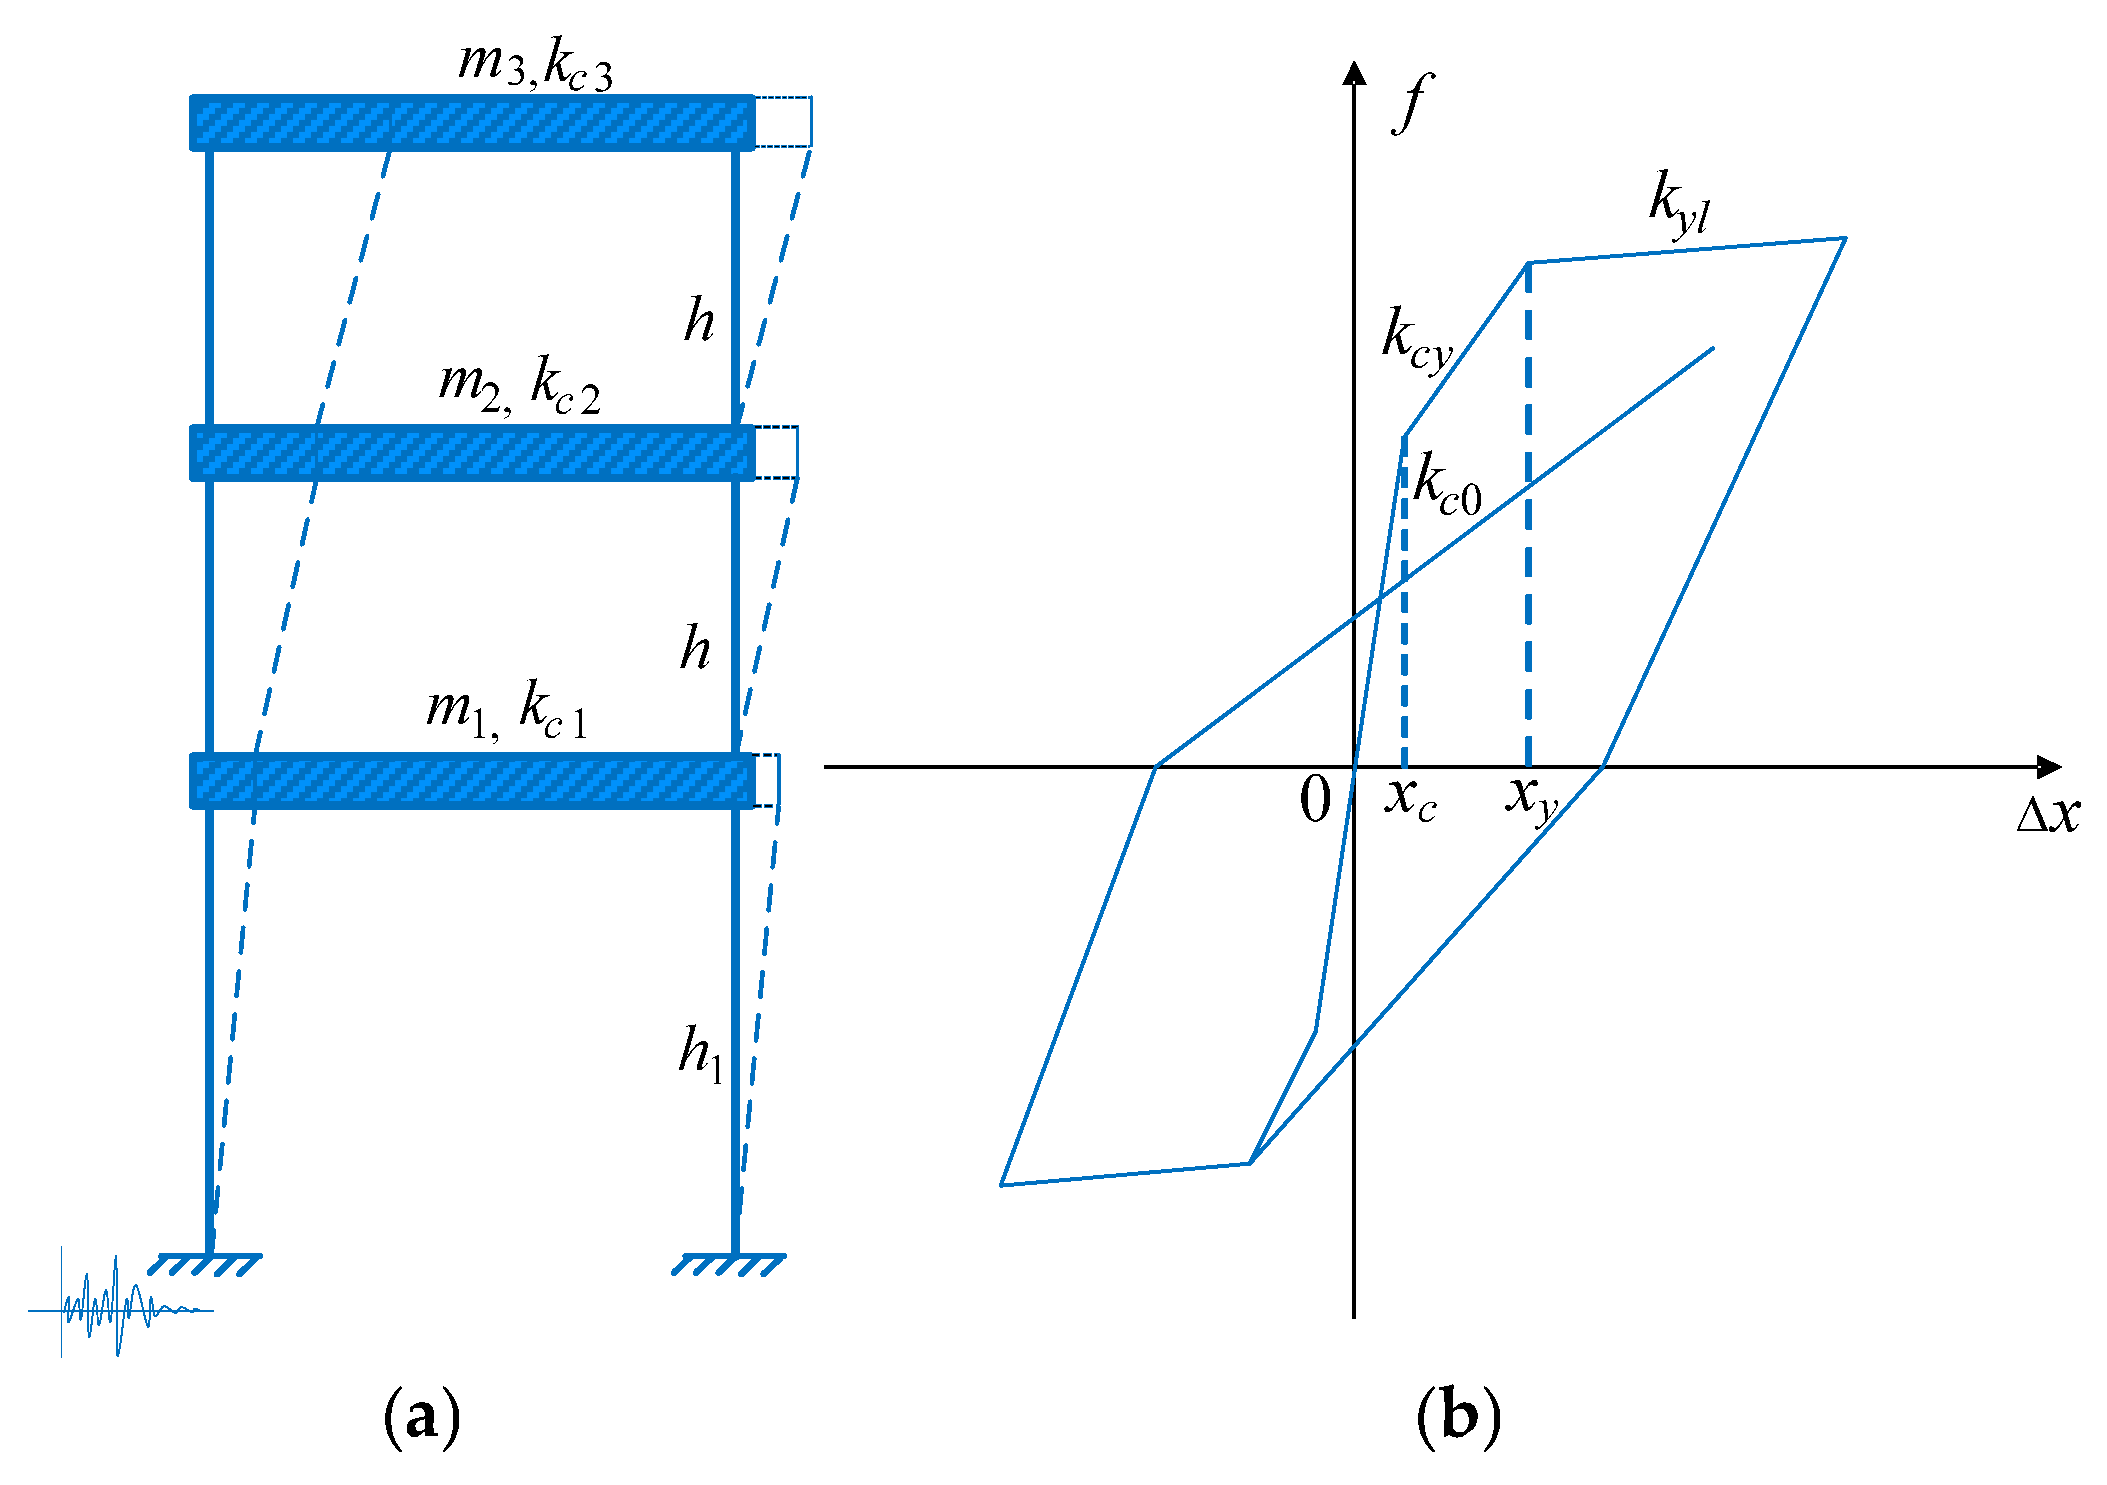
Consider a three-story reinforced concrete structure, idealized as a story shear model as shown in Figure 13a. The restoring force model adopts a trilinear stiffness degradation rule (Figure 13b). The relevant structural parameters are specified as follows: the masses from the first to the third story are m1 = 1.690 × 10⁴ kg, m2 = 1.581 × 10⁴ kg, and m3 = 1.412 × 10⁴ kg, respectively; the story stiffnesses are kc1 = 1.512 × 10⁷ N/m, kc2 = 2.012 × 10⁷ N/m, and kc3 = 2.012 × 10⁷ N/m, respectively; the cracking displacements are 6.3 mm, 4.9 mm, and 4.2 mm for the first to third stories, respectively; the yield displacements are 21.8 mm, 18.9 mm, and 17.2 mm for the first to third stories, respectively; and the story heights are h1 = 4 m, h2 = h3 = h = 3.3 m for the first to third stories, respectively. The structural damping matrix is formulated based on the Rayleigh damping assumption.
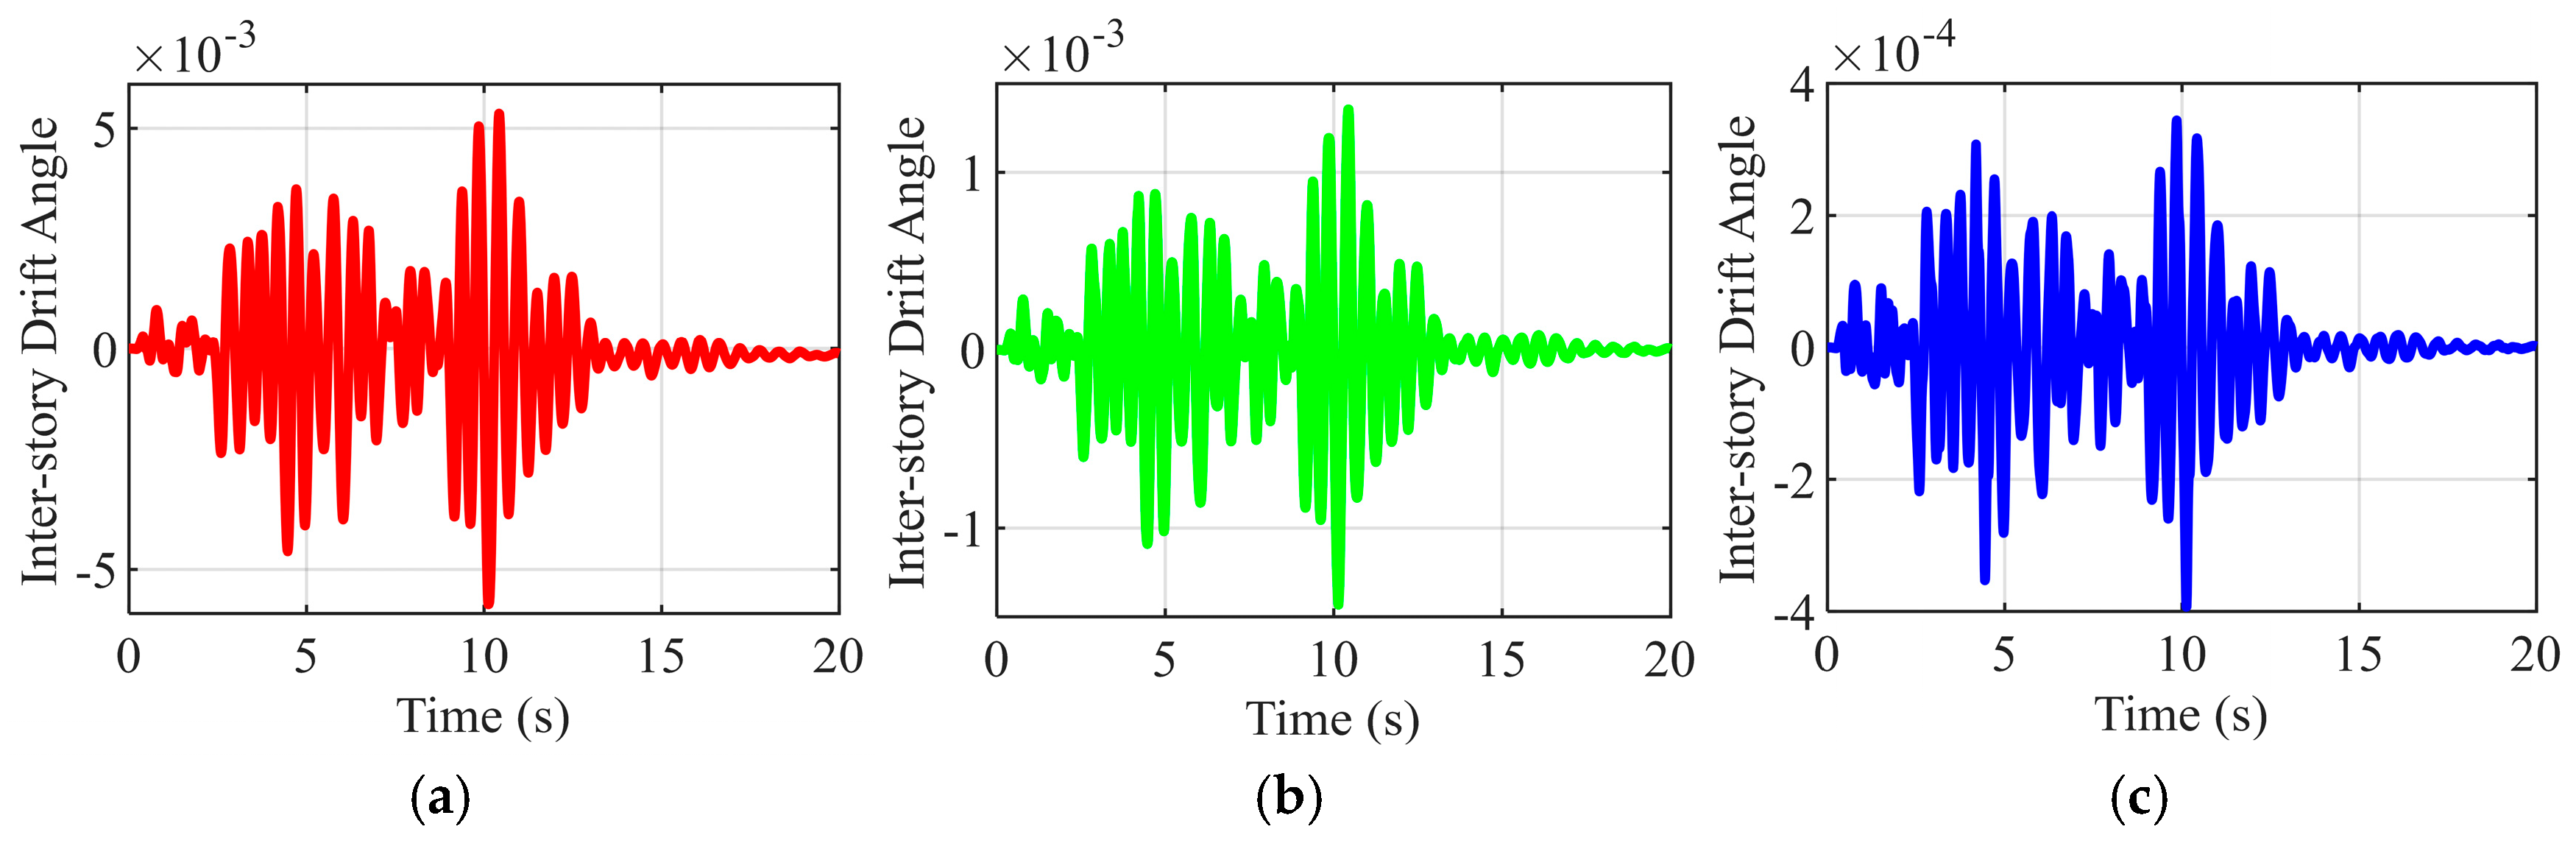
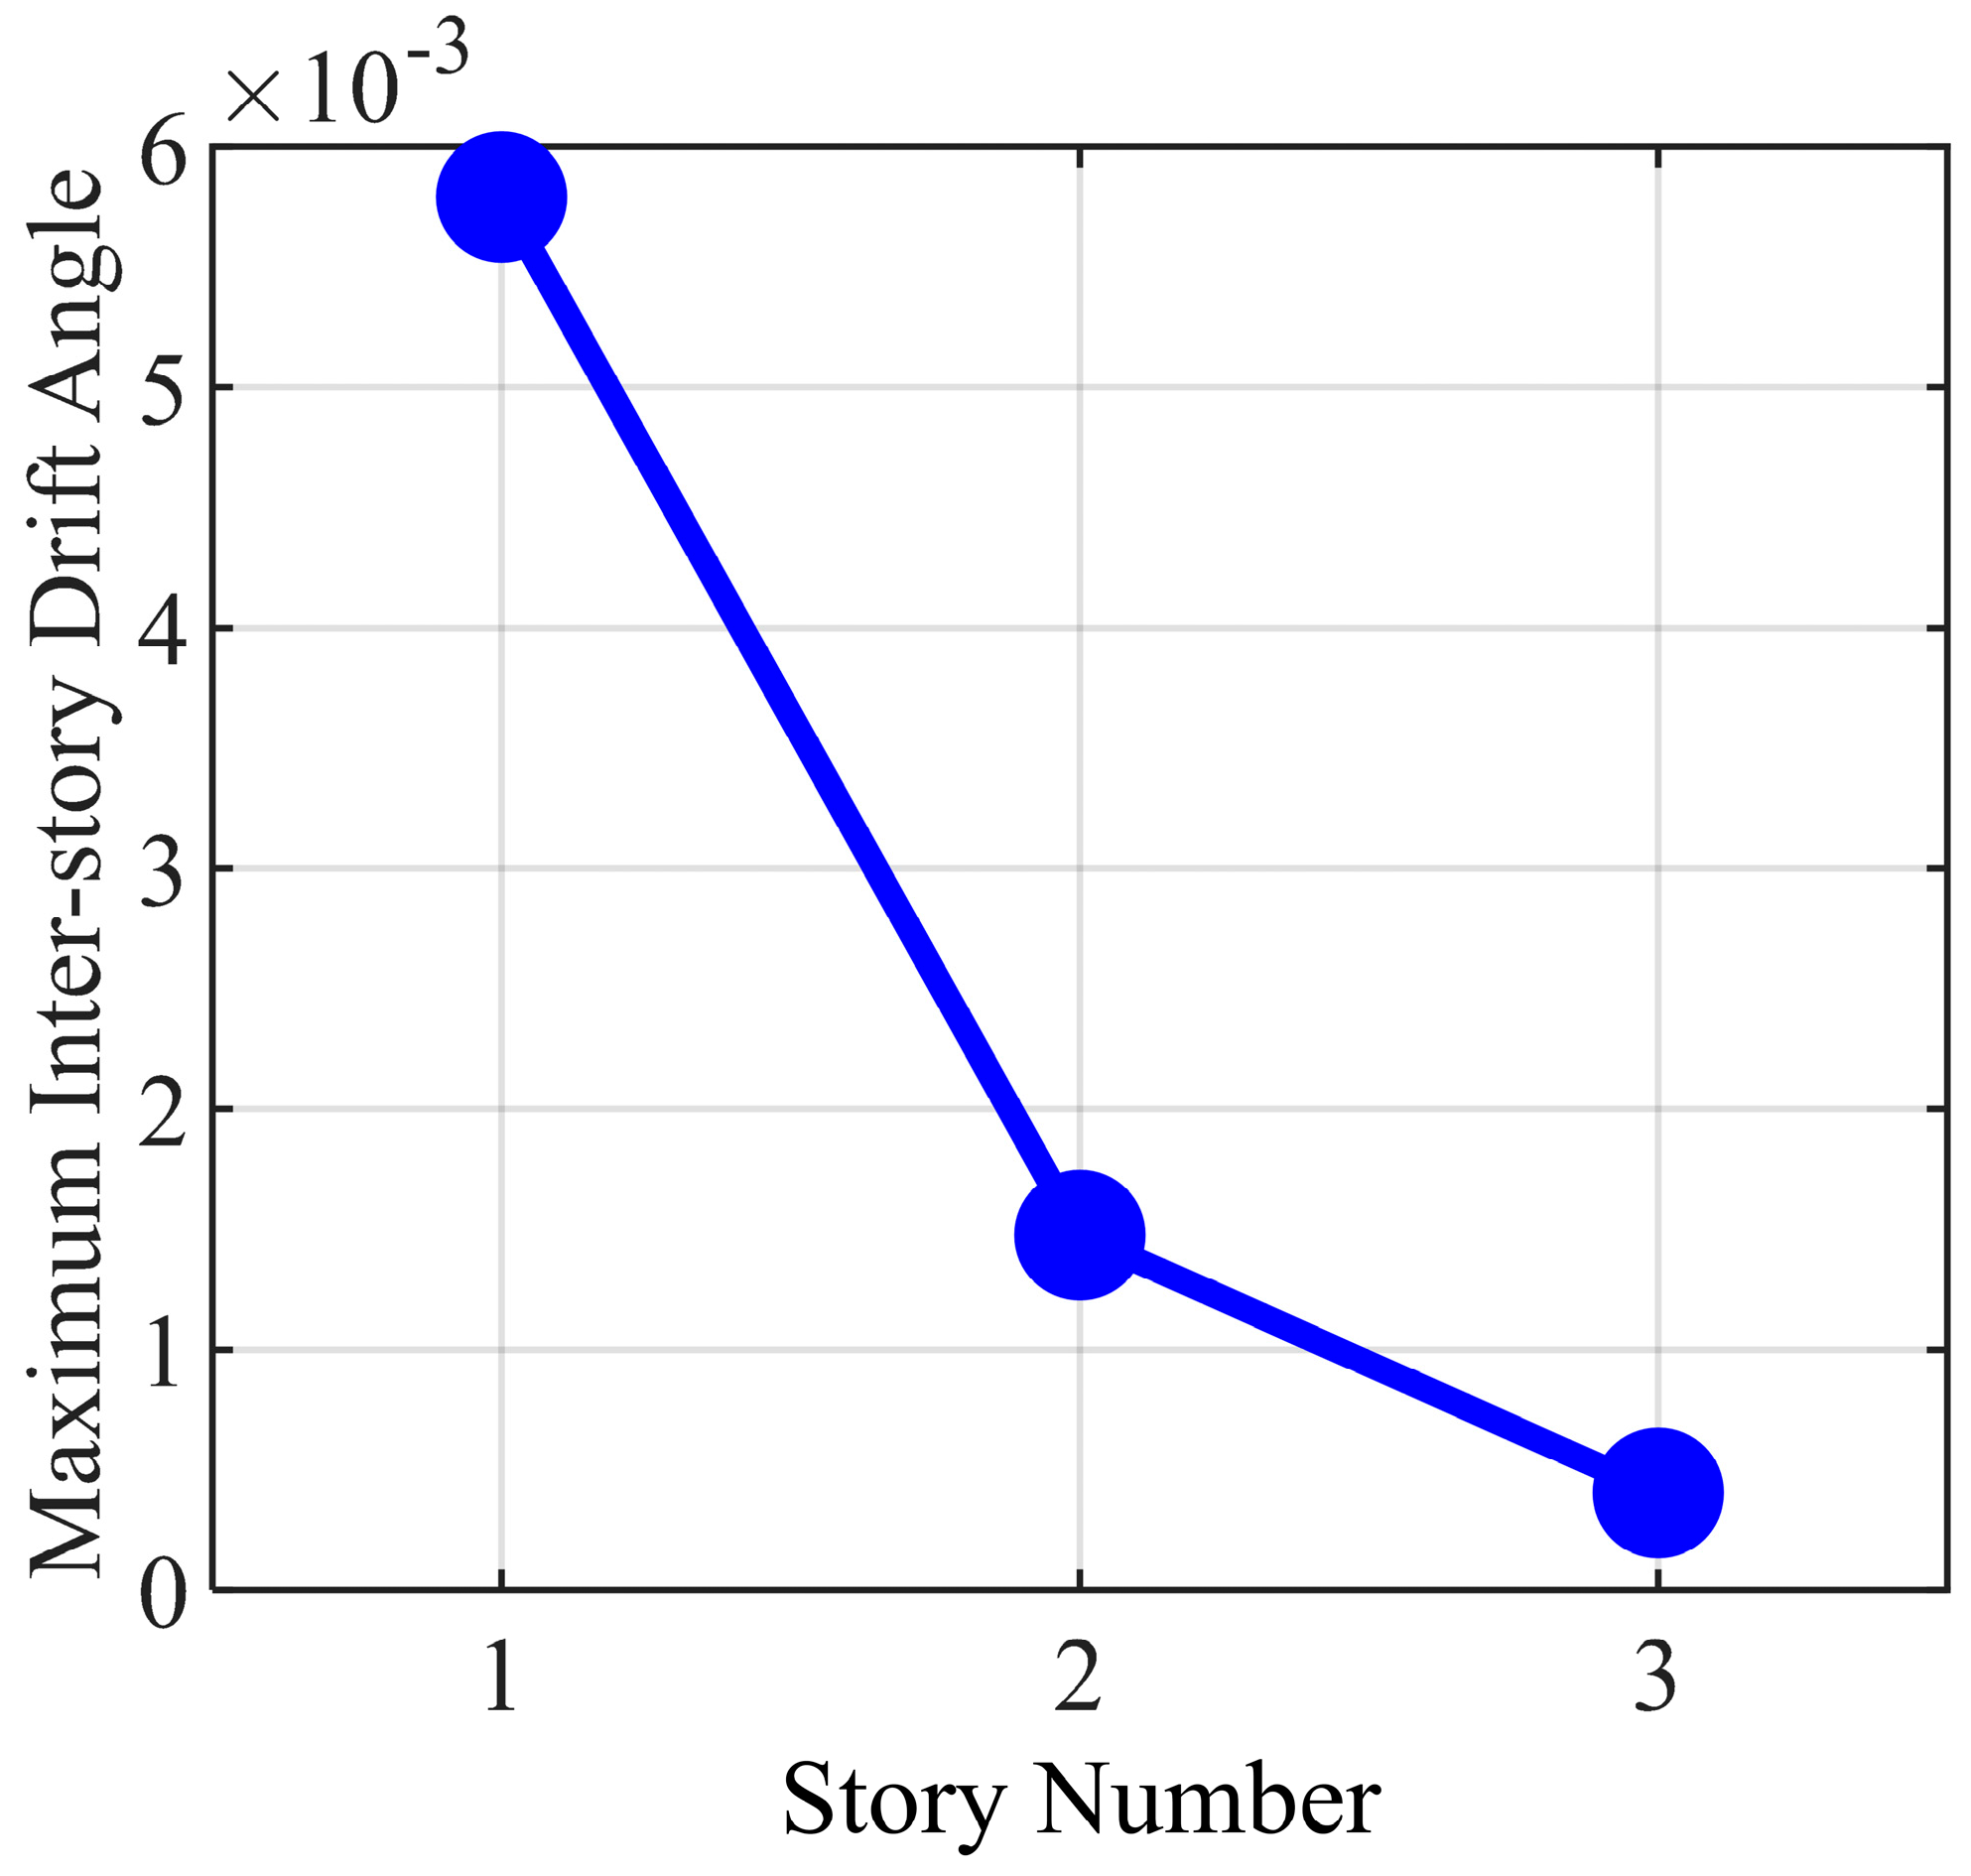
Figure 14 presents the inter-story drift ratios of the first to third stories, respectively, under a single ground motion acceleration input. Figure 15 shows the maximum inter-story drift ratios for each story. It can be observed from Figure 15 that the maximum inter-story drift ratio occurs in the first story. Therefore, the dynamic reliability problem in this case is defined by whether the maximum inter-story drift ratio of the first story exceeds the specified drift limit. The limit state function G is expressed as:
G = δlimitδmax
where δlimit is the allowable inter-story drift ratio and δmax is the maximum inter-story drift ratio.
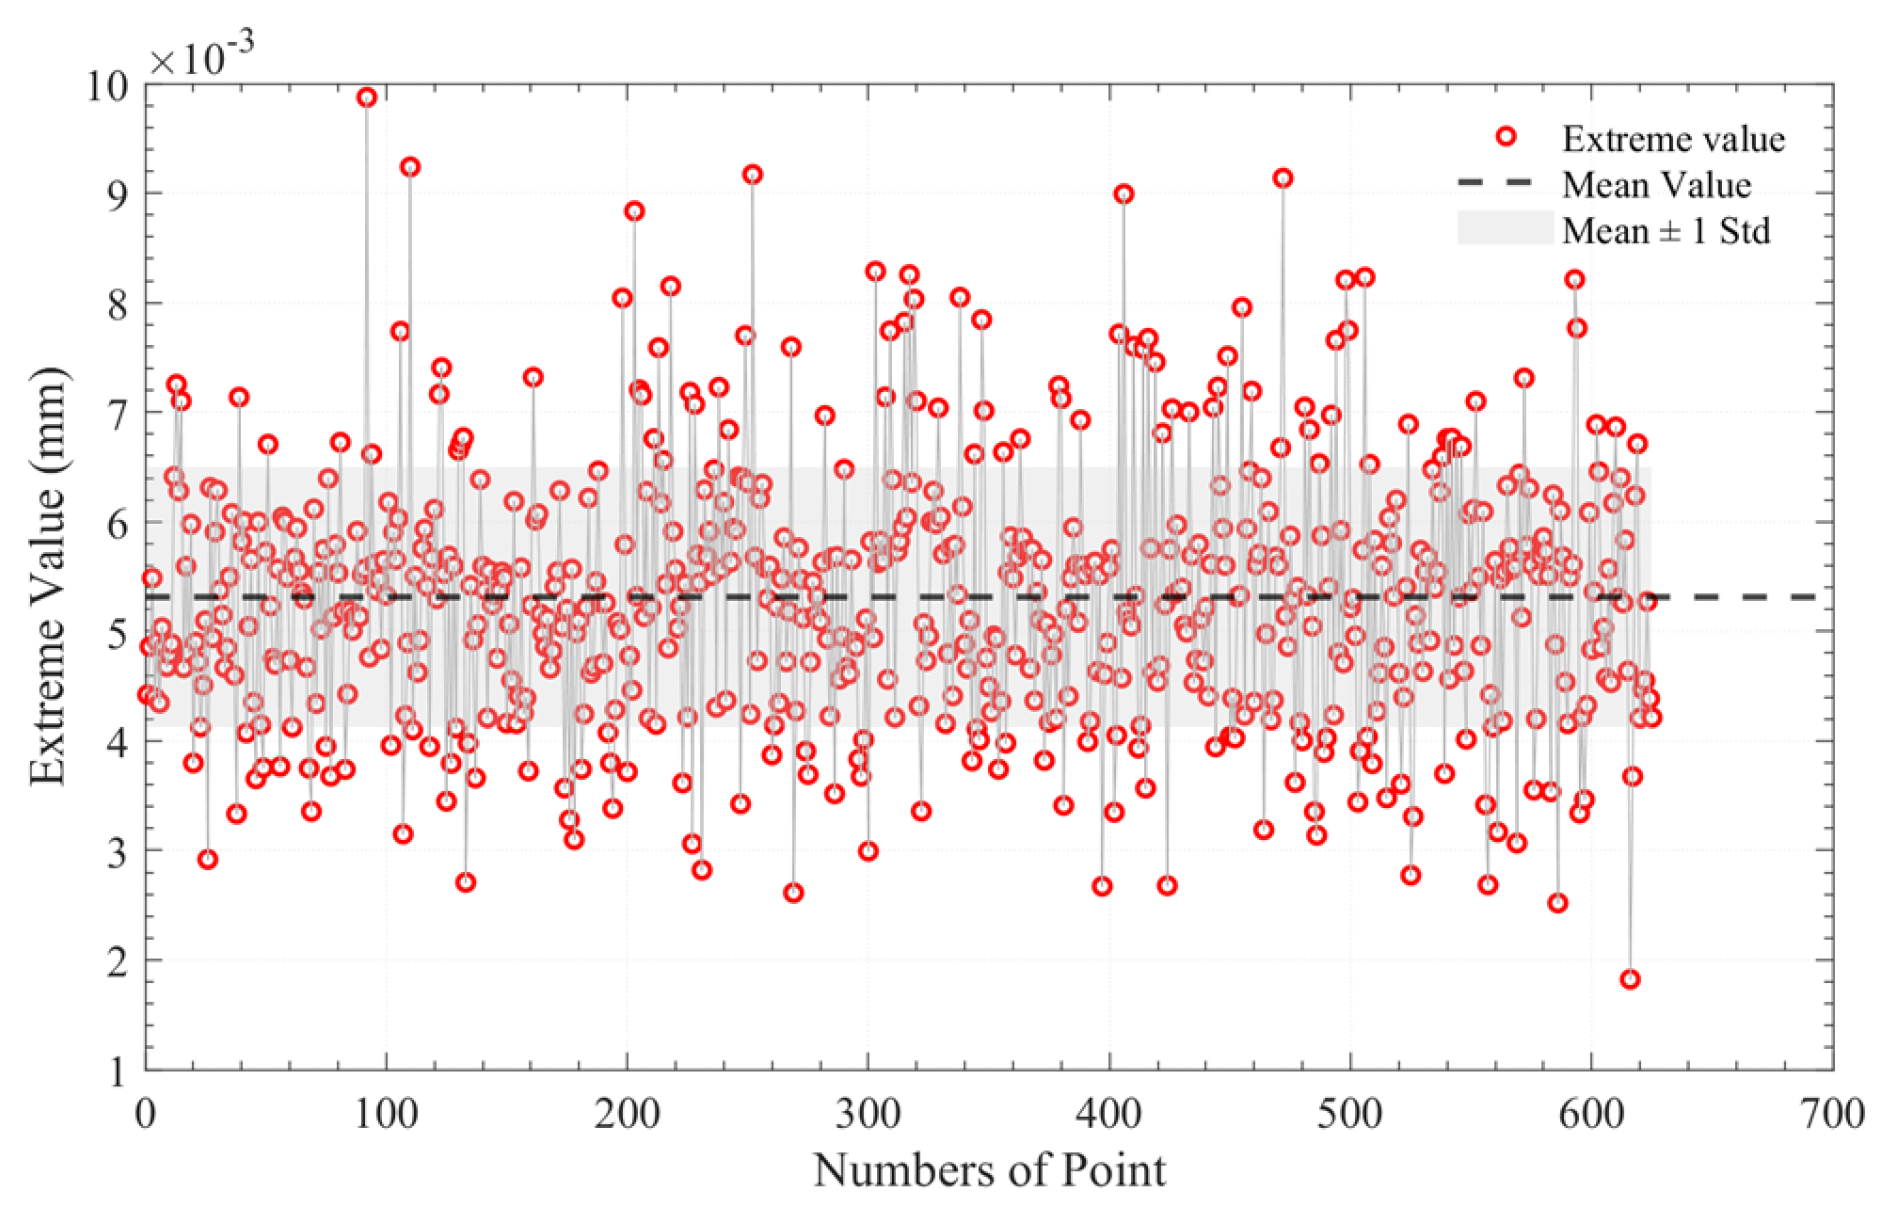
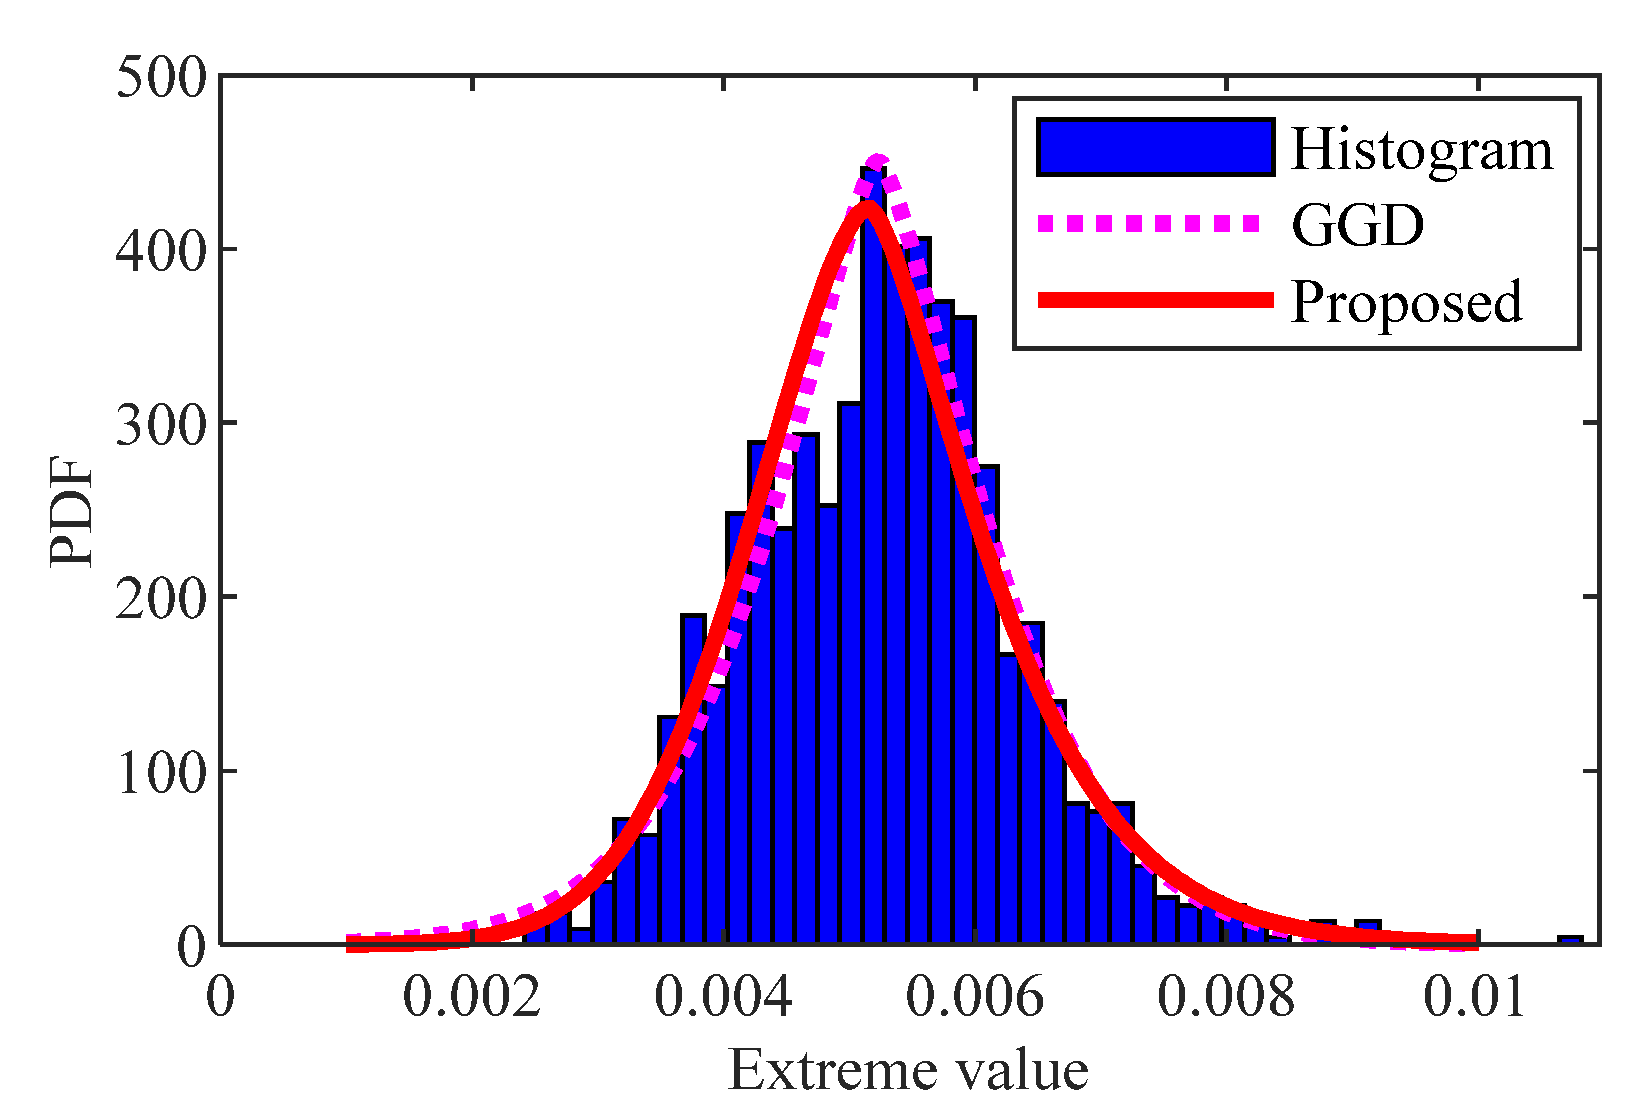
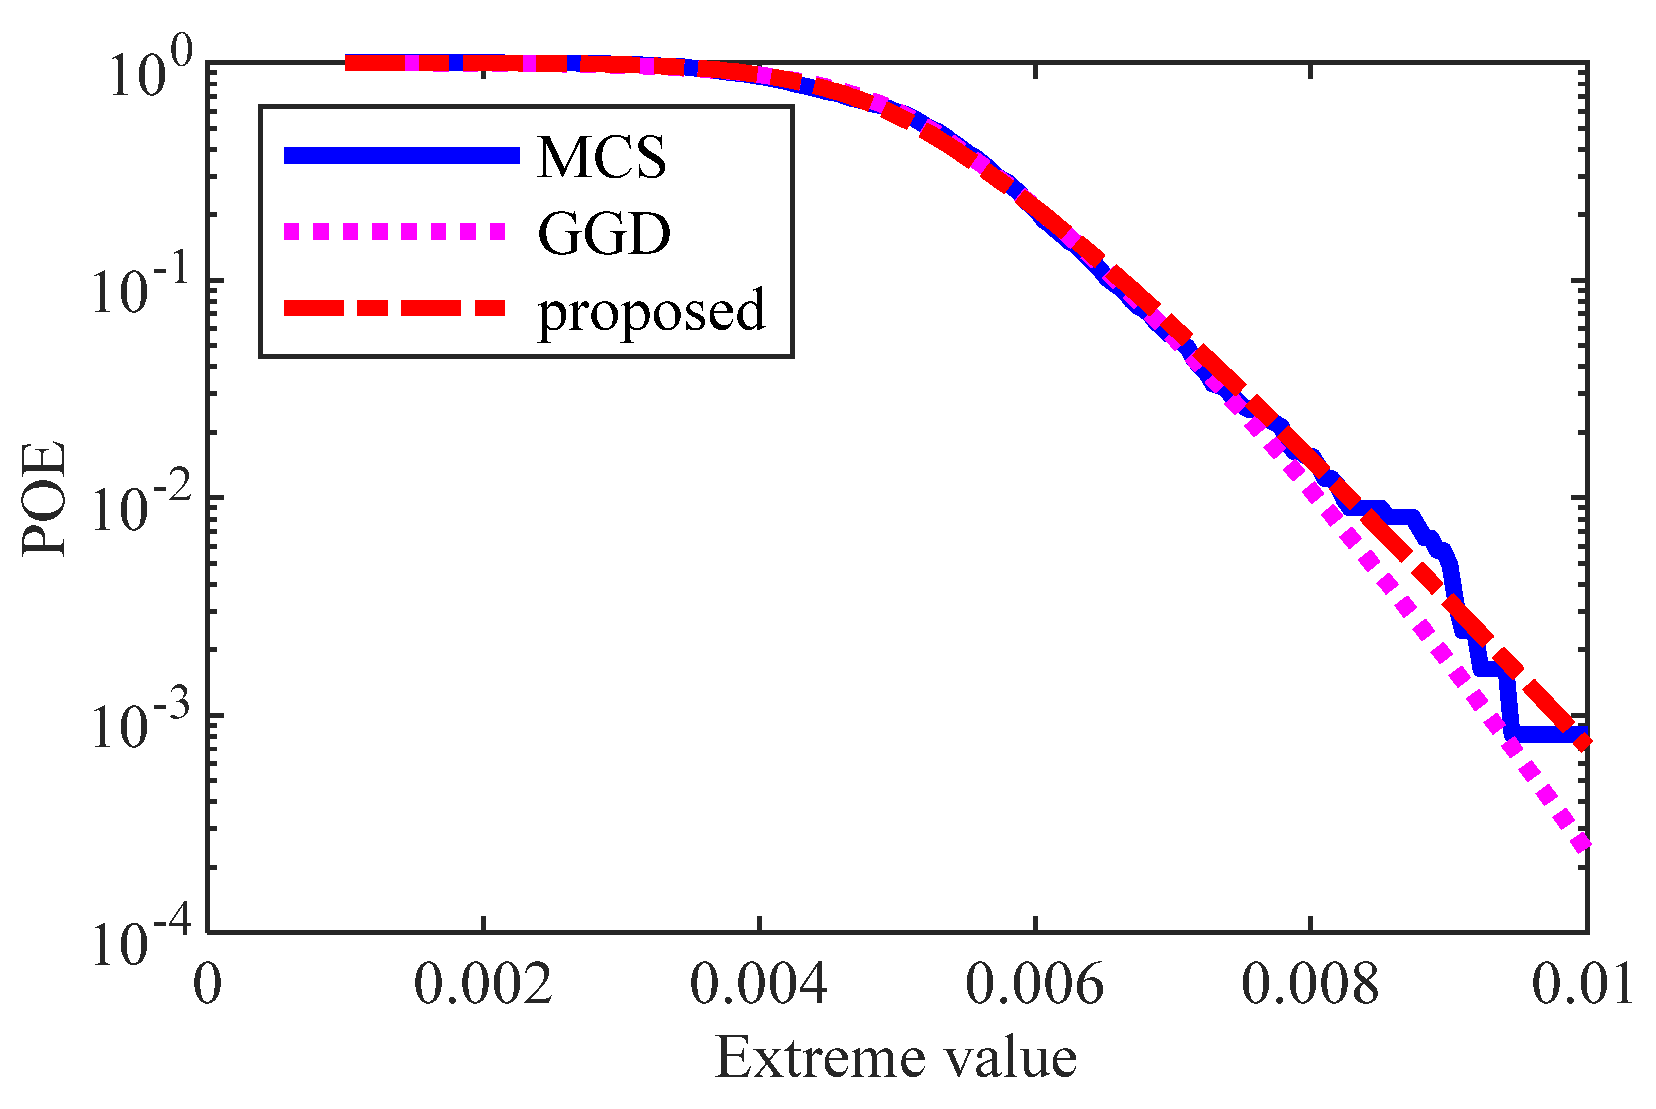
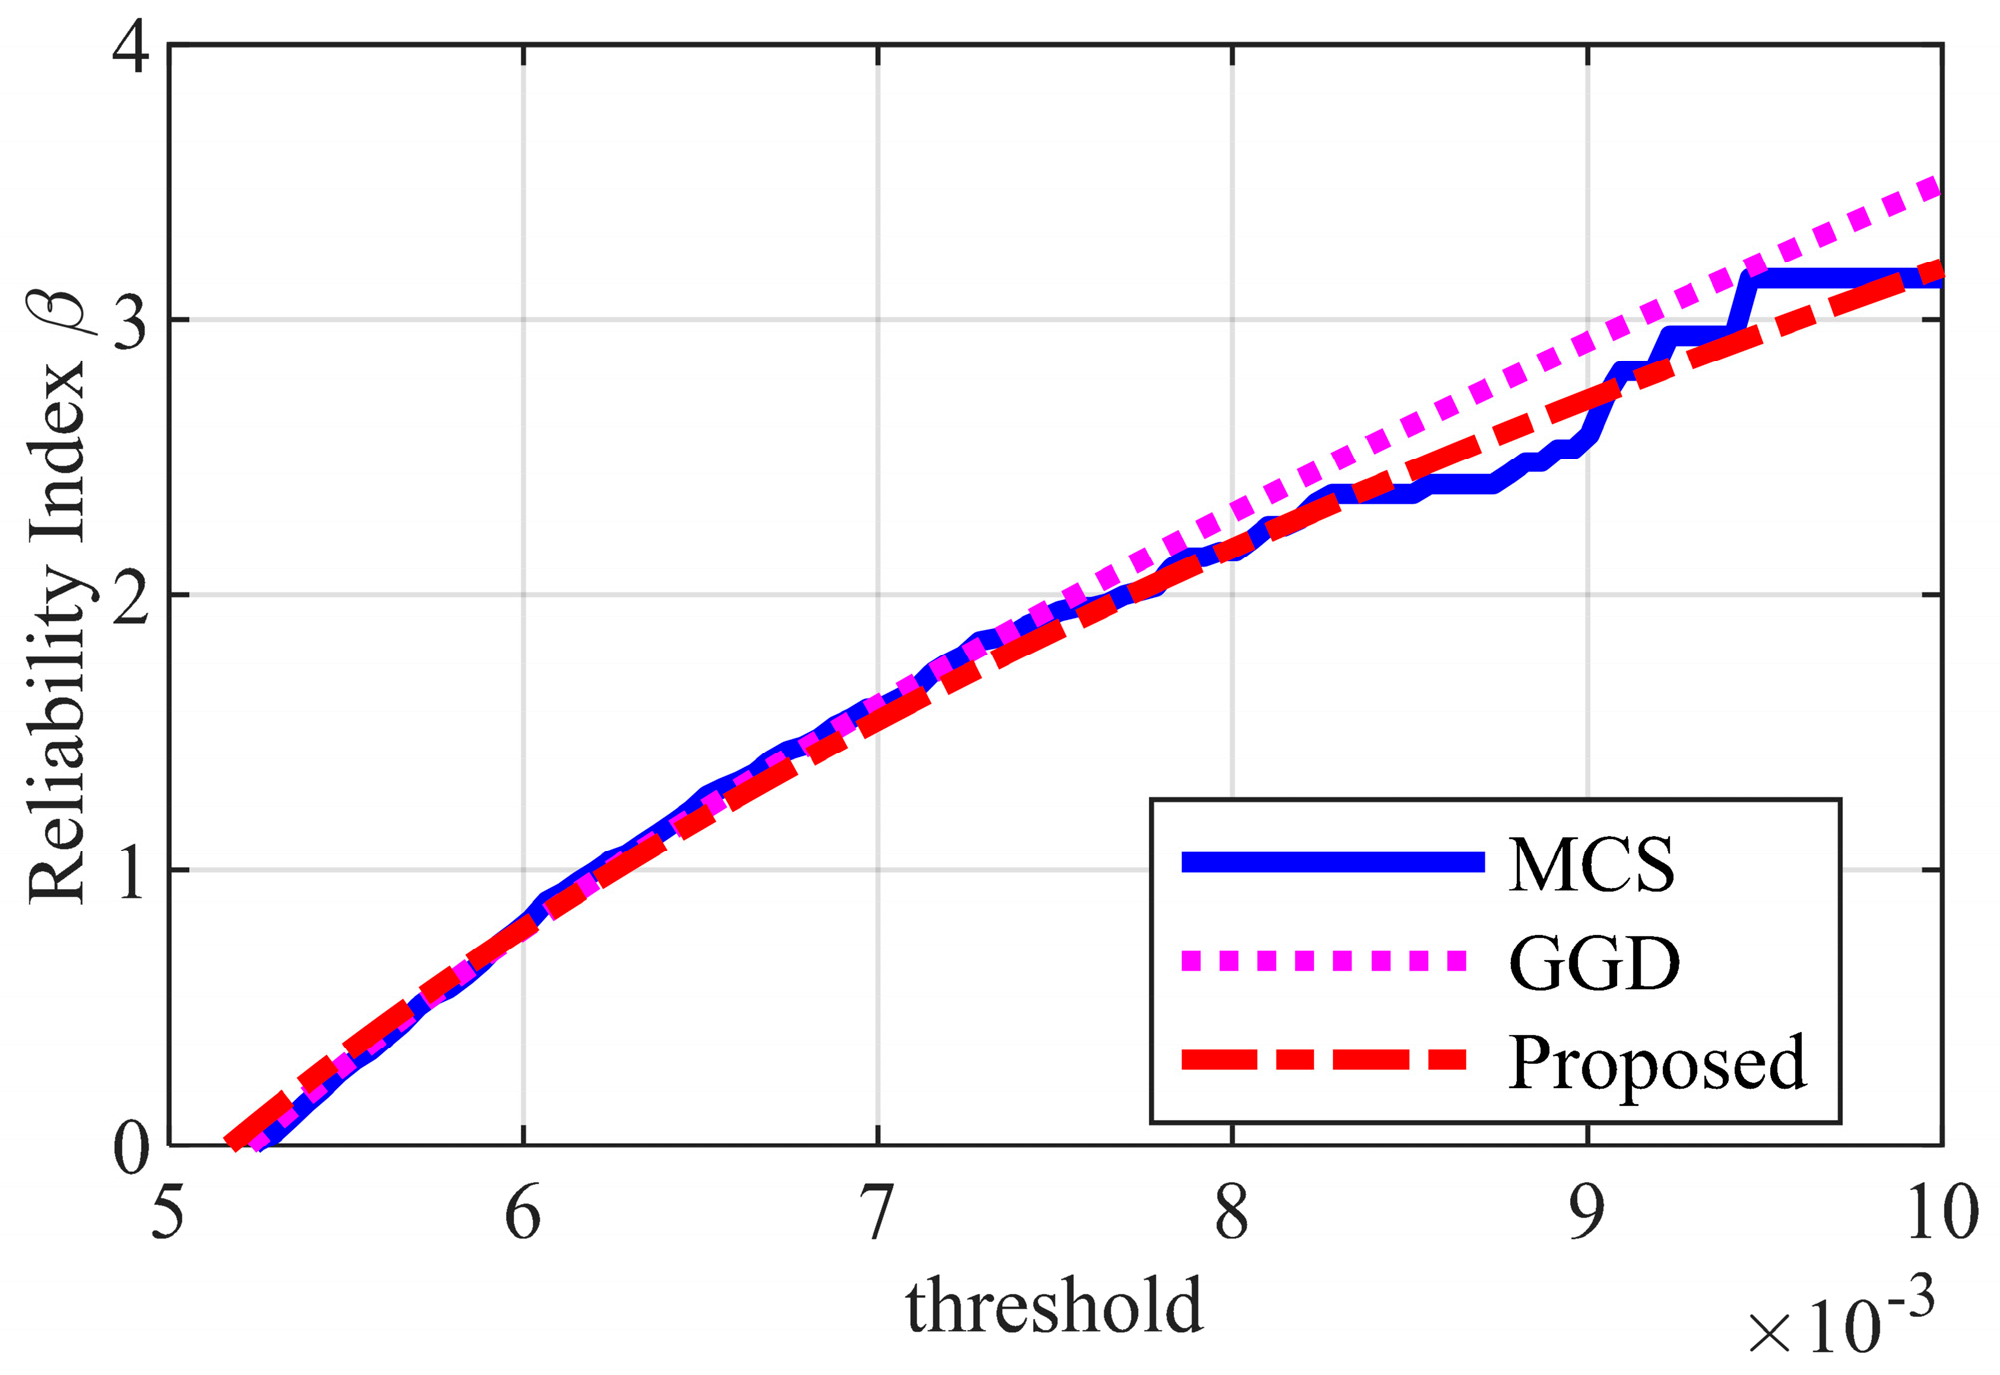
Figure 16 presents the maximum (i.e., extreme) inter-story drift ratios of the first story computed using the proposed method, with a total of 625 data points. The first four statistical moments of these results are calculated as 0.005309, 0.001184, 0.417964, and 3.612005, respectively. Figure 17 shows the PDF obtained by the proposed method, along with the histogram derived from MCS and the results estimated from GGD. It can be observed from Figure 17 that the two show close agreement, validating the accuracy of the proposed approach. Additionally, the PDF generated from only 625 samples using the proposed method matches well with the MCS result based on 100,000 samples, demonstrating its high computational efficiency. Similarly, Figure 18 compares the POE curves from the proposed method, GGD and MCS, which exhibit good consistency across different extreme values. Figure 19 further illustrates the reliability indices obtained under different extreme value thresholds, validating both the effectiveness and accuracy of the proposed method. However, the results computed by the GGD method exhibit noticeable deviations from the MCS results, particularly in the region of larger reliability indices.

4. Conclusions

An efficient and accurate framework for dynamic reliability analysis of nonlinear structures under non-stationary stochastic seismic excitations has been proposed. The methodology integrates the RFSRM for dimension reduction, OLPSS for efficient input generation, and SGLD with an extrapolation method for extreme value distribution modeling. The accuracy and computational efficiency of the proposed framework were rigorously validated through a detailed numerical investigation of a nonlinear SDOF system and the three-degree-of-freedom shear building model by comparing its results against the MCS and GGD methods. The main conclusions derived from this study are summarized as follows:
(1)
This study proposes a novel integrated computational framework that seamlessly combines advanced sampling and distribution modeling techniques. The RFSRM effectively characterizes the full uncertainty of non-stationary ground motions using only two elementary random variables. The OLPSS strategy optimally samples this 2D space, generating a minimal set of highly representative input points. Finally, the SGLD accurately captures the tail behavior of extreme structural responses from the limited resulting data. This integrated approach provides a complete and efficient pipeline from seismic input generation to reliability index calculation.
(2)
The proposed framework achieves a remarkable reduction in computational cost without sacrificing accuracy. The numerical example demonstrated that the proposed method could obtain POE and reliability indices in excellent agreement with the benchmark MCS solution. Crucially, this high level of accuracy was achieved using only 625 nonlinear time-history analyses, which is 160 times fewer than the 100,000 analyses required by the conventional MCS method. This dramatic efficiency gain is primarily attributed to the synergistic effect of the OLPSS optimal sampling and the powerful tail-fitting capability of the SGLD.
(3)
The proposed framework is robust, straightforward to implement, and provides a rational tool for performance-based seismic assessment. Its core advantage lies in the integration of the SGLD—which overcomes the limitations of traditional distributions in modeling skewed extreme responses. This makes the method particularly advantageous for estimating reliability index, where traditional simulation methods become prohibitively expensive. Consequently, the framework offers significant practical value by enabling: (i) the efficient generation of reliability-based design parameters compatible with modern seismic codes, and (ii) rapid fragility assessment for existing structures.
(4)
While this study validates the framework on an SDOF system and three-degree-of-freedom shear building model, the methodology holds significant potential for broader application. Future work will focus on extending its application to more complex structural systems, including multi-degree-of-freedom (MDOF) structures, systems with various hysteresis models (e.g., Bouc-Wen, degrading stiffness), and problems involving multi-component excitations or spatially varying ground motions. Further research could also explore the integration of the proposed sampling strategy with machine learning-based surrogate models [26] to further accelerate the analysis.

Author Contributions

Methodology, B.-H.L. and L.-W.Z.; software, Y.C. and L.-W.Z.; validation, B.-H.L., L.-W.Z. and Y.C.; formal analysis, Y.C.; investigation, Y.C. and B.-H.L.; writing—original draft preparation, B.-H.L., Y.C. and L.-W.Z.; writing—review and editing, L.-W.Z., B.-H.L. and Y.C.; visualization, Y.C., L.-W.Z. and B.-H.L.; and supervision, L.-W.Z. All authors have read and agreed to the published version of the manuscript.

Funding

This research was funded by [the Hunan Provincial Department of Education Key Scientific Research Project] grant number [23A0176], [Science and Technology Project of the Hunan Provincial Department of Water Resources] grant number [XSKJ2025056-41] and 2023 Central Agricultural Machinery Research and Development, Manufacturing, Promotion, and Integrated Application Pilot Fund, China Project (Hunan Finance Department’s Pre-[2023] No. 204 Document).

Data Availability Statement

The original contributions presented in this study are included in the article. Further inquiries can be directed to the corresponding author.

Acknowledgments

The study is partially supported by the Hunan Provincial Department of Education Key Scientific Research Project (Grant No. 23A0176); Science and Technology Project of the Hunan Provincial Department of Water Resources (XSKJ2025056-41); and 2023 Central Agricultural Machinery Research and Development, Manufacturing, Promotion, and Integrated Application Pilot Fund, China Project (Hunan Finance Department’s Pre-[2023] No. 204 Document). All of the sources of the support are gratefully acknowledged.

Conflicts of Interest

The authors declare no conflicts of interest.

References

  1. Cornell, C.A. Engineering seismic risk analysis. Bull. Seismol. Soc. Am. 1968, 58, 1583–1606. [Google Scholar] [CrossRef] [Scilit]
  2. Zhao, Y.-G.; Zhang, L.-W.; Lu, Z.-H.; He, J. First passage probability assessment of stationary non-Gaussian process using the third-order polynomial transformation. Adv. Struct. Eng. 2019, 22, 187–201. [Google Scholar] [CrossRef] [Scilit]
  3. Pang, R.; Yao, H.; Xu, B. Dynamic reliability and seismic fragility analysis for high concrete-faced rockfill dam slopes subjected to stochastic earthquake and parameter excitation via PDEM. Soil Dyn. Earthq. Eng. 2024, 186, 108915. [Google Scholar] [CrossRef] [Scilit]
  4. Zhang, L.-W.; Lu, Z.-H.; Zhao, Y.-G. Dynamic reliability assessment of nonlinear structures using extreme value distribution based on L-moments. Mech. Syst. Signal Process. 2021, 159, 107832. [Google Scholar] [CrossRef] [Scilit]
  5. Song, C.; Kawai, R. Monte Carlo and variance reduction methods for structural reliability analysis: A comprehensive review. Probab. Eng. Mech. 2023, 73, 103479. [Google Scholar] [CrossRef] [Scilit]
  6. Naess, A.; Gaidai, O. Monte Carlo methods for estimating the extreme response of dynamical systems. J. Eng. Mech. 2008, 134, 628–636. [Google Scholar] [CrossRef] [Scilit]
  7. Rubinstein, R.Y.; Kroese, D.P. Simulation and the Monte Carlo Method; John Wiley & Sons, Inc.: New York, NY, USA, 2016. [Google Scholar]
  8. Dang, C.; Wei, P.; Beer, M. An approach to evaluation of EVD and small failure probabilities of uncertain nonlinear structures under stochastic seismic excitations. Mech. Syst. Signal Process. 2021, 152, 107468. [Google Scholar] [CrossRef] [Scilit]
  9. Au, S.K.; Beck, J.L. Subset simulation and its application to seismic risk based on dynamic analysis. J. Eng. Mech. 2003, 129, 901–917. [Google Scholar] [CrossRef] [Scilit]
  10. Lin, Z.; Tao, L.; Wang, S.; Yong, N.; Xia, D.; Wang, J.; Ge, D. A subset simulation analysis framework for rapid reliability evaluation of series-parallel cold standby systems. Reliab. Eng. Syst. Saf. 2024, 241, 109706. [Google Scholar] [CrossRef] [Scilit]
  11. Papaioannou, I.; Straub, D. Combination line sampling for structural reliability analysis. Struct. Saf. 2021, 88, 102025. [Google Scholar] [CrossRef] [Scilit]
  12. Grigoriu, M.; Samorodnitsky, G. Reliability of dynamic systems in random environment by extreme value theory. Probab. Eng. Mech. 2014, 38, 54–69. [Google Scholar] [CrossRef] [Scilit]
  13. Chen, X.; Li, J. A novel approach for structural system reliability evaluation using decoupled first-order reliability method and equivalent extreme-value event. Reliab. Eng. Syst. Saf. 2025, 257, 110851. [Google Scholar] [CrossRef] [Scilit]
  14. Zhang, Z.; He, Q.; Gou, J.; Li, X. Analyzing travel time reliability and its influential factors of emergency vehicles with generalized extreme value theory. J. Intell. Transp. Syst. 2019, 23, 1–11. [Google Scholar] [CrossRef] [Scilit]
  15. Liu, Z.; Liu, W.; Peng, Y. Random function based spectral representation of stationary and non-stationary stochastic processes. Probab. Eng. Mech. 2016, 45, 115–126. [Google Scholar] [CrossRef] [Scilit]
  16. Ghazaan, M.I.; Yekta, A.D. Optimal Latinized partially stratified sampling for structural reliability analysis. Struct. Eng. Mech. 2024, 92, 111–120. [Google Scholar]
  17. Low, Y.M. A new distribution for fitting four moments and its applications to reliability analysis. Struct. Saf. 2013, 42, 12–25. [Google Scholar] [CrossRef] [Scilit]
  18. He, J. Approximate method for estimating extreme value responses of nonlinear stochastic dynamic systems. J. Eng. Mech. 2015, 141, 04015009. [Google Scholar] [CrossRef] [Scilit]
  19. He, J.; Gong, J. Estimate of small first passage probabilities of nonlinear random vibration systems by using tail approximation of extreme distributions. Struct. Saf. 2016, 60, 28–36. [Google Scholar] [CrossRef] [Scilit]
  20. Zhang, L.-W.; Lu, Z.-H.; Chen, C. Seismic fragility analysis of bridge piers using methods of moment. Soil Dyn. Earthq. Eng. 2020, 134, 106150. [Google Scholar] [CrossRef] [Scilit]
  21. Shinozuka, M.; Deodatis, G. Simulation of Stochastic Processes by Spectral Representation. Appl. Mech. Rev. 1991, 44, 191–204. [Google Scholar] [CrossRef] [Scilit]
  22. Johnson, M.E.; Moore, L.M.; Ylvisaker, D. Minimax and maximin distance designs. J. Stat. Plan. Inference 1990, 26, 131–148. [Google Scholar] [CrossRef] [Scilit]
  23. Dai, H.; Wang, W. Application of low-discrepancy sampling method in structural reliability analysis. Struct. Saf. 2009, 31, 55–64. [Google Scholar] [CrossRef] [Scilit]
  24. Olsson, A.; Sandberg, G.; Dahlblom, O. On Latin hypercube sampling for structural reliability analysis. Struct. Saf. 2003, 25, 47–68. [Google Scholar] [CrossRef] [Scilit]
  25. Clough, R.; Penzien, J. Dynamic of Structures; McGraw-Hill: New York, NY, USA, 2003. [Google Scholar]
  26. Parida, S.S.; Bose, S.; Butcher, M.; Apostolakis, G.; Shekhar, P. SVD enabled data augmentation for machine learning based surrogate modeling of non-linear structures. Eng. Struct. 2023, 280, 115600. [Google Scholar] [CrossRef] [Scilit]
Figure 1. Computational workflow of the proposed method.
Mathematics 14 00140 g001
Figure 2. SDOF system.
Mathematics 14 00140 g002
Figure 3. Bilinear hysteretic model.
Mathematics 14 00140 g003
Figure 4. OLPSS Sample Points: (a) two-dimensional sample points; (b) three-dimensional sample points.
Mathematics 14 00140 g004
Figure 5. Mean and standard deviation of seismic acceleration time history samples: (a) mean; (b) standard deviation.
Mathematics 14 00140 g005
Figure 6. Seismic acceleration time history samples.
Mathematics 14 00140 g006
Figure 7. Output bilinear hysteretic curves.
Mathematics 14 00140 g007
Figure 8. Displacement response time history.
Mathematics 14 00140 g008
Figure 9. Extreme value sample points.
Mathematics 14 00140 g009
Figure 10. PDF curves of Example 1.
Mathematics 14 00140 g010
Figure 11. POE curves of Example 1.
Mathematics 14 00140 g011
Figure 12. Reliability index curves of Example 1.
Mathematics 14 00140 g012
Figure 13. Three story frame structure and its trilinear restoring force model: (a) three story frame structure; (b) trilinear restoring force model.
Mathematics 14 00140 g013
Figure 14. The inter-story drift angle of the different stories: (a) the first story, (b) the second story, and (c) the third story.
Mathematics 14 00140 g014
Figure 15. The maximum inter-story drift angle of the different stories.
Mathematics 14 00140 g015
Figure 16. The extreme values estimated by the proposed method of the example 2.
Mathematics 14 00140 g016
Figure 17. PDF of example 2.
Mathematics 14 00140 g017
Figure 18. POE of example 2.
Mathematics 14 00140 g018
Figure 19. Reliability indices of example 2.
Mathematics 14 00140 g019
Table 1. Parameters of the Clough–Penzien spectrum used for ground motion generation.
ω g (rad/s) ω f (rad/s) ζ g ζ f γ a ¯ max (cm/s2)T (s) ω u (rad/s) Δ ω
5 π0.1 ωg0.600.602.8200302400.15
Table 2. Results of the POE obtained by using the different methods of Example 1.
Thresholds (mm) MCSGGDProposedRE of GGDRE of the Proposed
801.01 × 10−18.40 × 10−21.01 × 10−116.88%0.34%
904.29 × 10−22.94 × 10−24.23 × 10−231.51%1.43%
1001.72 × 10−29.42 × 10−31.66 × 10−245.24%3.62%
1106.48 × 10−32.80 × 10−36.25 × 10−356.74%3.64%
1202.25 × 10−37.80 × 10−42.29 × 10−365.25%2.17%
Disclaimer/Publisher’s Note: The statements, opinions and data contained in all publications are solely those of the individual author(s) and contributor(s) and not of MDPI and/or the editor(s). MDPI and/or the editor(s) disclaim responsibility for any injury to people or property resulting from any ideas, methods, instructions or products referred to in the content.