Article

Volatility Spillover Between China’s Carbon Market and Traditional Manufacturing

School of Economics and Management, Nanjing Tech University, Nanjing 211816, China
*
Author to whom correspondence should be addressed.
These authors contributed equally to this work.
Mathematics 2025, 13(9), 1514; https://doi.org/10.3390/math13091514
Submission received: 1 April 2025 / Revised: 2 May 2025 / Accepted: 2 May 2025 / Published: 4 May 2025
(This article belongs to the Special Issue Mathematics and Applications)

Abstract

:
This study constructed a DGC-t-MSV model by integrating dynamic correlation and Granger causality into the MSV framework. Using daily closing price data from 4 January 2022 to 21 November 2024, it empirically analyzed volatility spillover effects between China’s carbon market and traditional manufacturing from an industrial heterogeneity perspective. The findings are as follows: (1) The carbon market exhibits significant unidirectional volatility spillover effects on carbon-intensive industries, such as steel, chemicals, shipbuilding, and automobile manufacturing, with the carbon market acting as the spillover source. (2) Bidirectional volatility spillover effects exist between the carbon market and industries such as forest products, textiles, construction engineering, and machinery manufacturing, with the carbon market predominantly acting as a recipient. (3) The carbon market exhibits general dynamic correlations with traditional manufacturing industries, where the correlation strength is positively associated with industry-level carbon emissions. Notably, the correlations with the steel, chemicals, machinery manufacturing, construction engineering, and automobile manufacturing industries are significant, whereas those with the textile industry and the forest products industry are relatively weaker. Furthermore, the carbon market demonstrates substantially higher volatility than traditional manufacturing industries. This study innovatively explored volatility spillover effects between China’s carbon market and traditional manufacturing from an industrial heterogeneity perspective, providing policy implications for their coordinated development.

1. Introduction

With the acceleration of global warming, governments worldwide have increasingly recognized the imperative of mitigating carbon emissions. In response, the Paris Agreement has established more comprehensive climate targets and reinforced the assessment framework, further driving governments to expedite the development of carbon markets [1,2,3]. As a major industrial economy, China’s traditional manufacturing industry represents a critical sector for carbon emissions [4,5,6]. Motivated by the responsibility of building a community with a shared future for mankind and the pressing imperative of sustainable development, China established its “dual-carbon” objectives in 2020 and launched the national carbon market in 2021. The market’s initial scope covers the power sector, including around 2200 power enterprises. With ongoing industrial reforms, an increasing number of industries are being integrated into the carbon emissions regulatory framework. On 9 September 2024, the Ministry of Ecology and Environment issued the Work Plan for the Coverage of the Cement, Steel, and Electrolytic Aluminum Industries in the National Carbon Emissions Trading Market (Draft for Soliciting Opinions), Proposing to include traditional manufacturing sectors like cement, steel, and electrolytic aluminum in carbon emission regulations. Therefore, examining the intermarket fluctuations between the carbon market and conventional manufacturing industries enhances the understanding of the intrinsic transmission mechanisms linking these sectors. This analysis is of considerable significance in facilitating energy structure optimization and accelerating the green transformation of traditional manufacturing industries.
Given that carbon markets regulate the cost of greenhouse gas emissions through carbon pricing, thereby influencing production costs in the manufacturing industries, the spillover effects between the carbon market and manufacturing industries have received considerable academic attention. Existing studies can be broadly classified into two main areas. The first strand examines the impact of carbon markets on the operational efficiency of manufacturing firms [7,8,9]. Löschel et al. analyzed the causal impact of the EU Emissions Trading System on the German manufacturing sector. Their study revealed that the EU Emissions Trading System enhanced the efficiency of German manufacturing firms. Cui et al. assessed the effects of China’s pilot Emissions Trading System (ETS). While the ETS exerted downward pressure on employment and capital investment, it also incentivized regulated firms to enhance productivity. The second strand focuses on evaluating the effectiveness of carbon markets in promoting emission reductions among manufacturing enterprises [10]. For instance, An et al. found that when the marginal abatement cost exceeds RMB 200 per ton, both the number and the magnitude of emission reduction activities tend to plateau. Existing research on the spillover effects between carbon markets and manufacturing has predominantly focused on the aggregate level of the manufacturing industry, with insufficient attention paid to the specific domain of traditional manufacturing. Traditional manufacturing not only accounts for the bulk of total carbon emissions in the manufacturing industry but is also more directly influenced by the carbon market. Moreover, significant heterogeneity exists in the difficulty and duration of emission reduction across different subsectors of traditional manufacturing [11,12,13]. To address these research gaps, this study adopted an industrial heterogeneity perspective to investigate the spillover effects between the carbon market and traditional manufacturing, as well as its subsectors. The findings aim to inform the development of policies that facilitate the coordinated advancement of the carbon market and traditional manufacturing industries.
Previous studies have commonly used the MSV model, the DC-MSV model, or the DCGC-MSV model to analyze volatility spillover effects across financial assets and markets. However, traditional methods have significant limitations. The MSV model involves estimating a large number of parameters in high-dimensional settings, resulting in a considerable computational burden. The DC-MSV model does not incorporate causal relationships between variables, which limits its ability to capture the direction of volatility spillovers across markets. The DCGC-MSV model addresses this limitation by introducing Granger causality, allowing for the identification of lead-lag effects. However, it still relies on the assumption of normally distributed errors, which limits its ability to accurately model the extreme volatility and fat-tailed characteristics commonly observed in financial time. To address these limitations, the DGC-t-MSV model integrates dynamic correlation and Granger causality within a t-distribution framework, providing a more flexible and robust approach for analyzing spillover effects across markets. For example, Zhang and Zhuang [14] utilized the DGC-t-MSV model to study cross-market spillover effects. Compared to the MSV and DC-MSV models, the DGC-t-MSV model employs the Markov Chain Monte Carlo (MCMC) method to more effectively capture the direction of volatility spillovers among multivariate time series. In contrast to the DCGC-MSV model, it models volatility as a latent stochastic process under a t-distribution framework, offering enhanced flexibility in characterizing extreme volatility and fat-tailed behaviors commonly observed in financial data. These improvements significantly enhance the model’s ability to reflect the true dynamics of financial markets [15]. Motivated by these advantages, this study constructed a DGC-t-MSV model to systematically investigate the spillover effects between China’s carbon market and traditional manufacturing industries.
In summary, to address the limitations of existing research, this study extended the MSV model to construct a DGC-t-MSV model, employing the MCMC method to investigate dynamic correlations and spillover effects between China’s carbon market and traditional manufacturing industries from an industrial heterogeneity perspective. The primary contributions of this research are summarized as follows: (1) This study utilized the DGC-t-MSV model to address the limitations of the MSV, DC-MSV, and DCGC-MSV models in parameter estimation. By modeling volatility as a latent stochastic process within a t-distribution framework, the model provides a more accurate representation of the volatility spillover effects between the carbon market and traditional manufacturing industries. (2) Unlike previous studies that focused on the manufacturing industry as a whole, this paper examined the dynamic correlations and volatility spillover effects between China’s carbon market and traditional manufacturing industries from the perspective of industrial heterogeneity. It specifically analyzed the spillover effects between different subindustries and the carbon market, filling the gap in prior research that had largely overlooked these interactions. (3) This study presented several novel findings. There exist widespread dynamic correlations between China’s carbon market and traditional manufacturing industries, and the strength of these correlations is positively associated with industry-level carbon emissions. The carbon market exhibits significant unidirectional volatility spillover effects on the steel, chemicals, shipbuilding, and automobile manufacturing industries, acting as the primary spillover source. Moreover, significant bidirectional volatility spillover effects are observed between the carbon market and the forest products, textile, construction engineering, and machinery manufacturing industries, with the carbon market predominantly functioning as the spillover recipient.

2. Model Construction

This study employed an extended composite model based on the Multivariate Stochastic Volatility Model (MSV) to investigate the dynamic correlations and volatility spillover effects between China’s carbon market and the traditional manufacturing industries. The DGC-t-MSV model represents an extended version of the MSV framework, incorporating Granger causality tests and dynamic correlation coefficients. This model is widely employed to analyze the volatility dynamics of multi-asset markets such as equities and bonds, as it not only quantifies the standalone volatility persistence of individual markets but also identifies the dynamic conditional correlations and asymmetric volatility spillovers across them [16,17]. Moreover, utilizing the Markov Chain Monte Carlo (MCMC) method enhances the estimation of time-varying interdependencies across financial markets with greater accuracy.

2.1. MSV Model

The equation represents the MSV model, which is constructed by integrating two SV models:
y t = d i a g ( exp ( q t / 2 ) ) ε t , ε t ~ N ( 0 , I )
q t + 1 = μ + d i a g ( ϕ 11 , ϕ 22 ) ( q t μ ) + ξ t , ξ t ~ N ( 0 , d i a g ( σ ξ 1 2 , σ ξ 2 2 ) )
In this framework, y t denotes the return series of the carbon trading market and the traditional manufacturing industries; q t is the volatility series of the market; and ε t is the stochastic error term, which follows an independent normal distribution.
Equation (2) represents the generation process of the market volatility series, where μ denotes the long-term mean of market volatility; ϕ 11 and ϕ 22 are the autocorrelation coefficients of market volatility; and ξ t serves as the disturbance term. The disturbance term follows a bivariate normal distribution with a mean of zero and variances of σ ξ 1 2 and σ ξ 2 2 , respectively.

2.2. GC-MSV Model

The GC-MSV model represents an extension of the MSV model, incorporating the Granger causality test within the framework of the MSV model:
y t = d i a g ( exp ( q t / 2 ) ) ε t , ε t ~ N ( 0 , I )
q t + 1 = μ + ϕ 11 ϕ 12 ϕ 21 ϕ 22 ( q t μ ) + ξ t , ξ t ~ N ( 0 , d i a g ( σ ξ 1 2 , σ ξ 2 2 ) )
This model has the capacity to capture the volatility spillover effect across diverse markets. In this expression, ϕ 12 denotes the volatility spillover effect of the traditional manufacturing industry on the carbon market, and ϕ 21 denotes the volatility spillover effect of the carbon market on the traditional manufacturing industry.

2.3. DC-MSV Model

The DC-MSV model incorporates a dynamic correlation coefficient into the MSV model:
y t = d i a g ( exp ( q t / 2 ) ) ε t , ε t ~ i i d N ( 0 , Σ ε , t )
ε ,   t = 1 ρ t ρ t 1
q t + 1 = μ + d i a g ( ϕ 11 , ϕ 22 ) ( q t μ ) + ξ t ,   ξ t ~ i i d N ( 0 , d i a g ( σ ξ c f 2 , σ ξ a f 2 ) )
r t + 1 = v 0 + v a c ( r t v 0 ) + σ ρ o t ,   o t ~ i i d N ( 0 , 1 ) ,   ρ t = exp ( r t ) 1 exp ( r t ) + 1
The dynamic correlation between the two markets is modeled by the dynamic conditional correlation algorithm and allowed to change over time. Where ρ t is the dynamic correlation coefficient at moment t and is controlled by the latent variable r t , which fluctuates in the interval (−1, 1).

2.4. DGC-t-MSV Model

The DGC-t-MSV model integrates the advantages of the aforementioned models by incorporating dynamic correlation and Granger causality:
y t = d i a g ( exp ( q t / 2 ) ) ε t , ε t ~ i i d T ( 0 , Σ ε , t , o )
ε ,   t = 1 ρ t ρ t 1
r t + 1 = v 0 + v a c ( r t v 0 ) + σ ρ o t ,   o t ~ i i d N ( 0 , 1 ) ,   ρ t = exp ( r t ) 1 exp ( r t ) + 1
q t + 1 = μ + ϕ 11 ϕ 12 ϕ 21 ϕ 22 ( q t μ ) + ξ t ,   ξ t ~ i i d N ( 0 , d i a g ( σ ξ a 2 , σ ξ c 2 ) )
The model not only allows asset correlations to change over time but also detects volatility spillover effects between two markets, providing a more accurate representation of interdependencies in financial markets. In addition, by introducing a t-distribution for the error terms, the model can effectively capture heavy-tailed behaviors and extreme volatility in financial time series.

2.5. Model Estimation Method

This study employed the Gibbs sampling in the Markov Chain Monte Carlo (MCMC) method to iteratively sample from the conditional distributions of the aforementioned parameters, thereby obtaining their posterior distributions.
P { X 0 = x 0 , X 1 = x 1 , , X T = x T } = P ( X 0 = x 0 ) t = 1 T P ( X t = x t | X t 1 = x t 1 )
In this framework, P ( X t = x t | X t 1 = x t 1 ) represents the transition probability of the t-th sample given the (t−1)-th sample, where x refers to the observed data’s logarithmic return. As time t increases, the state distribution gradually approaches the target distribution, thereby enabling sampling from complex distributions. The specific procedure is as follows:
(1) Initial setup θ 1 ( 0 ) , θ 2 ( 0 ) ,……, θ n ( 0 ) .
(2) For the t-th iteration:
A: Sampling from the conditional distribution θ 1 ( t ) ~ p ( θ 1 | θ 2 ( t 1 ) , , θ n ( t 1 ) , y ) .
B: Sampling from the conditional distribution θ 2 ( t ) ~ p ( θ 2 | θ 1 ( t ) , θ 3 ( t 1 ) , θ n ( t 1 ) , y ) .
C: Continue this process until convergence is achieved θ n ( t ) ~ p ( θ n | θ 1 ( t ) , , θ n 1 ( t ) , y ) .
After sufficient iterations, the Markov chain generated by Gibbs sampling converges to the target joint posterior distribution, allowing for efficient sampling of the model’s unknown parameter vector θ . By updating parameters sequentially, it circumvents the difficulty of directly drawing samples from complex high-dimensional distributions.

3. Empirical Results Analysis

3.1. Data and Preprocessing

To study the volatility spillover effects between China’s carbon market and traditional manufacturing industries from the perspective of industrial heterogeneity, this study, based on the 2024 Report on China’s Manufacturing Development Trends, divided traditional manufacturing into upstream, midstream, and downstream sectors. The upstream sector comprises the steel and chemicals industries; the midstream sector comprises the machinery manufacturing and construction engineering industries; and the downstream sector comprises the textile, forest products, automobile manufacturing, and shipbuilding industries.
This study utilized the daily closing prices of selected indices from 4 January 2022, to 21 November 2024, as key data indicators. The indices include China’s carbon trading price (CC), the CSI All Share Steel Index (St), the CSI All Share Chemicals Index (Ch), the CSI All Share Paper & Forest Products Index (FP), the CSI All Share Passenger Vehicles & Auto Parts Index (PV), the CSI All Share Textiles & Apparel Index (TA), the CSI All Share Construction & Engineering Index (Co), the CSI All Share Machinery Index (Ma), the CSI All Share Electric Utilities Index (EU), and the CSI Shipbuilding Industry Stimulus Index (SB). Data were sourced from the CSMAR database and the China Securities Index. The CC index represents the closing prices of the national carbon market; the St and Ch indices represent the upstream steel and chemicals industries; the Co and Ma indices represent the midstream construction engineering and machinery manufacturing industries; the FP, PV, TA, and SB indices represent the downstream forest products, automobile manufacturing, textile, and shipbuilding industries. The EU index is included as a reference supplement for the power industry.
The data were preprocessed by calculating the logarithmic returns of each series to eliminate the effects of price levels. This process improved the symmetry and stability of the data, thereby enhancing the accuracy of the subsequent statistical analysis. Moreover, the prior distributions for the model parameters follow those specified in Yu and Meyer (2006) [18].
Table 1 presents the descriptive statistics of the logarithmic returns for China’s carbon market and traditional manufacturing industries. The results show that the logarithmic returns of the CC and Ma indices exhibit relatively low skewness, approximating a normal distribution, while the skewness of the other indices is statistically significant. Regarding kurtosis, the logarithmic returns of the CC, St, and TA indices display significant kurtosis, indicating the presence of extreme values. These findings indicate that the logarithmic returns of China’s carbon market and traditional manufacturing industries experience frequent fluctuations. Their price movements are influenced by unexpected domestic and international events, macroeconomic policies, and spillover effects arising from market interlinkages [19]. This further supports the rationale for employing the DGC-t-MSV model to analyze the dynamic correlations and volatility spillover effects between the carbon emissions trading market and traditional manufacturing industries [20,21,22].
Figure 1 presents the time series of logarithmic returns for China’s carbon market and traditional manufacturing industries. As shown in Figure 1, the logarithmic returns of the St and Ch indices, the FP and TA indices, and the Co and Ma indices exhibit similar trends. This pattern indicates a strong alignment in the fluctuations of logarithmic returns within their respective industrial segments, namely the upstream steel and chemical industries, the midstream machinery manufacturing and construction engineering industries, and the downstream textile and forest products industries.
Further analysis of Figure 1 reveals two key findings. First, the logarithmic return of China’s carbon market exhibits significant volatility, distinct from the trends observed in other markets. This can be attributed to the nascent stage of China’s carbon emissions trading market, characterized by a limited range of trading products and a narrow participant structure. As a result, the price discovery mechanism remains imperfect. Additionally, the allocation of carbon emission quotas is primarily determined by government policies, making market prices highly sensitive to policy changes [23]. Second, apart from the carbon market, all traditional manufacturing industries experienced substantial fluctuations in logarithmic returns after September 2024. This phenomenon is closely associated with the macroeconomic policy package introduced by the People’s Bank of China in September 2024, which included reductions in the reserve requirement ratio, cuts to policy interest rates, and the introduction of new monetary instruments aimed at stabilizing stock market operations. These policy measures highlight the spillover effects of domestic shocks and policy shifts on traditional manufacturing industries [24].
Subsequently, stationarity and heteroskedasticity tests were performed on the logarithmic return series. Table 2 presents the results of stationarity and heteroscedasticity tests for logarithmic returns. The results confirm that all series meet the stationarity condition but exhibit significant heteroskedasticity. These findings indicate that conventional linear stationary models fail to adequately capture the characteristics of the data. In contrast, the application of the DGC-t-MSV model is both appropriate and well-justified for simulating volatility spillover effects across markets.

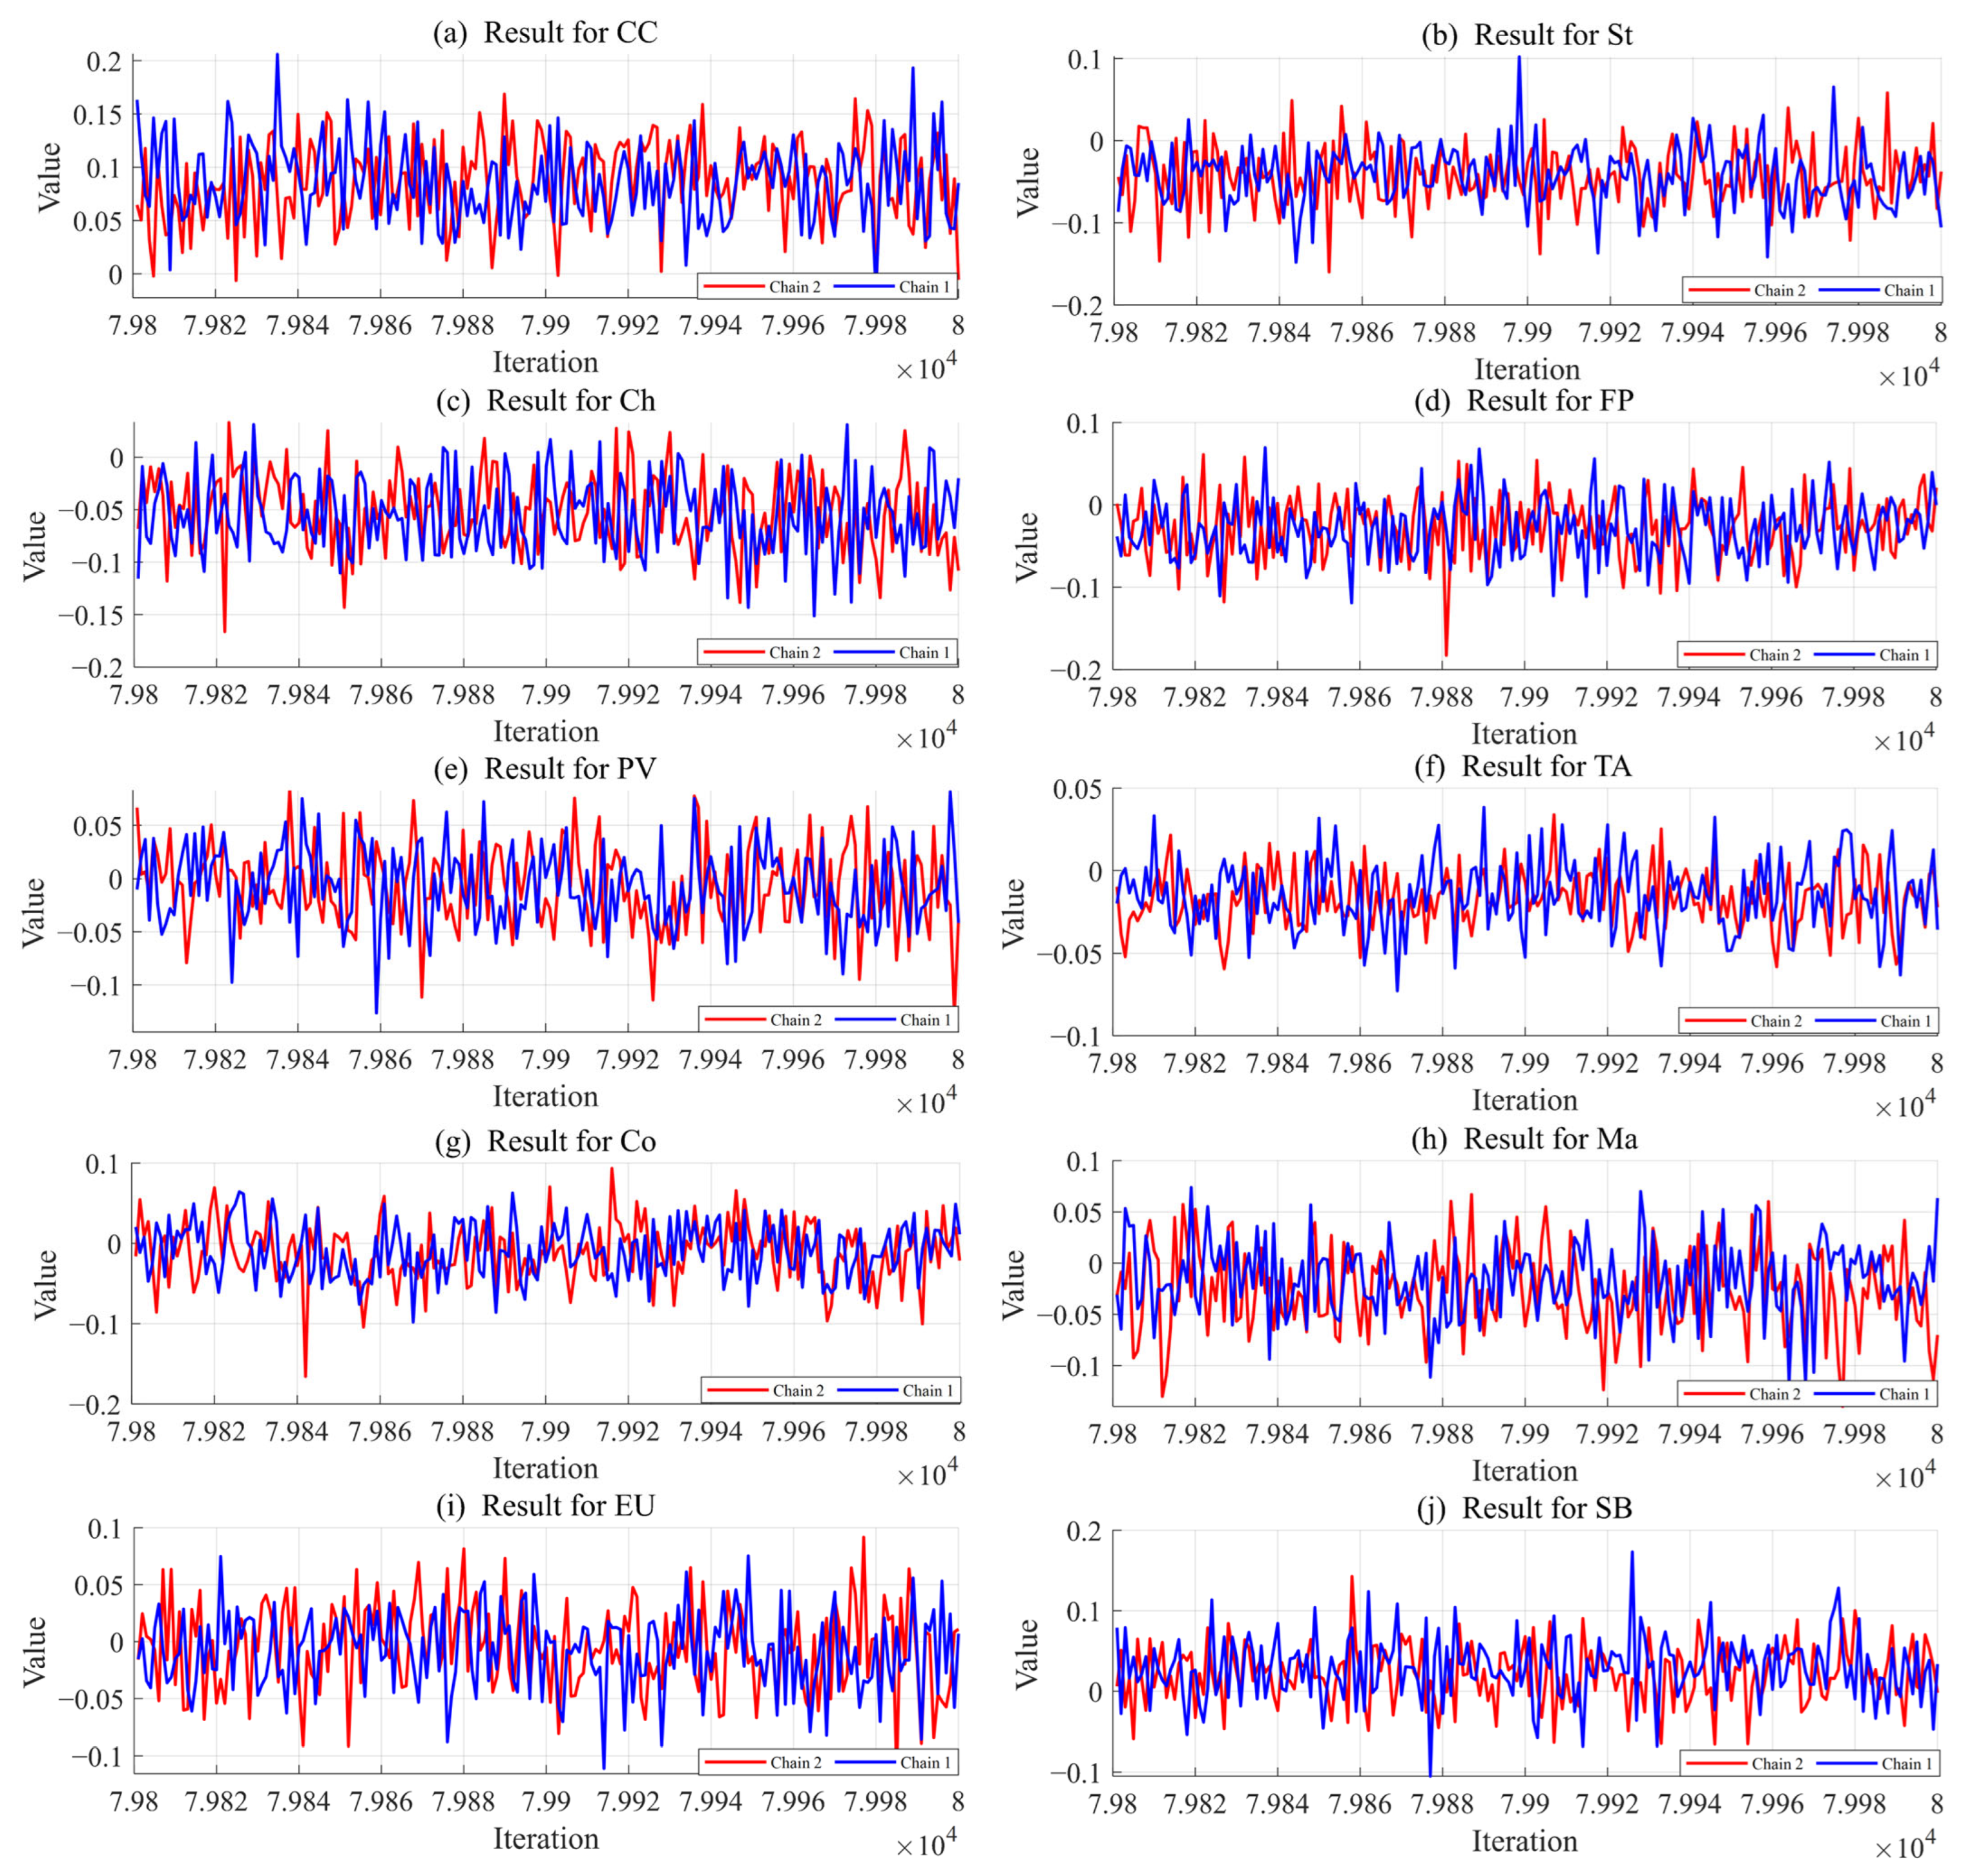
3.2. Convergence Analysis of the DGC-t-MSV Model

This study employed Gibbs sampling within the MCMC framework to conduct a convergence analysis of the selected data. Using MATLAB R2024b, the logarithmic returns of ten groups underwent 80,000 iterations, with the first 10,000 iterations discarded as a burn-in phase to mitigate early-stage instability. The remaining 70,000 iterations were retained for visualization analysis, and the final 200 iterations were magnified for detailed examination. Figure 2 and Figure 3 present the dynamic tracking iteration results for China’s carbon market and traditional manufacturing industries. By observing the stability of the iteration trajectories and the concentration of parameter distributions, the study assessed the convergence of the DGC-t-MSV model in capturing dynamic correlations and volatility spillover effects across markets.
Figure 2 presents the dynamic tracking and iterative results of the volatility level parameters for China’s carbon market and traditional manufacturing industries. As shown in Figure 2, after the initial 10,000 burn-in iterations, the volatility of the iteration trajectories significantly decreases and gradually stabilizes into a steady-state distribution. This indicates that as the iterations progress, the model parameters converge and fluctuate within a stable range, demonstrating the stability and reliability of the DGC-t-MSV model. After sufficient iterations, the posterior distribution effectively characterizes the dynamic correlations and volatility spillover effects between China’s carbon market and traditional manufacturing industries.
Figure 3 presents the results of the final 200 iterations in the dynamic tracking of volatility-level parameters for China’s carbon market and traditional manufacturing industries. The two series largely overlap and exhibit no discernible trend or periodicity, indicating that the parameter trajectories have successfully converged to the target distribution. This convergence demonstrates the effectiveness of Bayesian estimation via Gibbs sampling within the MCMC framework, as the parameters fluctuate randomly within a narrow and stable range.
Further analysis reveals that the two data series are strongly correlated and exhibit coupled dynamics across iterations, facilitating efficient information transmission. This finding highlights the stability and effective mixing properties of the DGC-t-MSV model, thereby ensuring the accuracy of posterior estimates. In addition, DIC tests were conducted for the DC-MSV, DCGC-MSV, and DGC-t-MSV models. Table 3 presents the DIC test result of DC-MSV, DCGC-MSV and DGC-t-MSV models. The DIC values indicate that the DGC-t-MSV model provides the best fit. These findings further confirm the robustness of the model and validate its applicability in analyzing the volatility spillover effects between China’s carbon market and traditional manufacturing industries.

3.3. Analysis of Mean Spillover Effect

The mean spillover effects between China’s carbon market and traditional manufacturing industries are illustrated by the dynamic correlation coefficients shown in Table 4. A thorough analysis reveals that:
Firstly, the dynamic correlation between the CC and St indices is significant, with an average dynamic correlation coefficient of 0.0980. The observed values range from −0.1445 to 0.3529, resulting in a total span of 0.4974, indicating that the coefficient fluctuates within a relatively narrow interval. Moreover, the 50% quantile is 0.1115, and the 97.5% quantile reaches 0.2777, suggesting that in most iterations, the correlation remains consistently positive and does not center around zero. This reflects a stable dynamic relationship between the carbon market and the steel industry. The underlying reason is that the steel industry is a traditional high-carbon manufacturing sector in China. According to data from the China Iron and Steel Association, carbon emissions from the steel industry account for approximately 15% of China’s total emissions. Therefore, fluctuations in the CC index exert a significant impact on the St index [25].
Secondly, the dynamic correlation between the CC and PV indices is also highly significant, with an average correlation coefficient of 0.0990, the highest among all dynamic correlation coefficients. However, despite the significant correlation, the dynamic correlation exhibits considerable volatility, with a range reaching up to 0.5541, indicating substantial fluctuations. The underlying reasons are twofold. First, the automobile manufacturing industry, especially during energy-intensive processes such as stamping and casting, produces significant carbon emissions, which makes its production costs highly sensitive to fluctuations in carbon prices. Second, the enforcement of carbon reduction policies is accelerating the transition of automotive manufacturers toward new energy vehicles, thereby intensifying the volatility in the dynamic correlation between the carbon emissions trading market and the automobile manufacturing industry.
Thirdly, the dynamic correlations between the CC index and the TA, FP, and SB indices are not significant. Compared with high-carbon manufacturing sectors such as the steel and automobile manufacturing industries, the average dynamic correlation coefficients between China’s carbon market and the textile industry (0.0268) and the forest products industry (0.0990) remain relatively low. Notably, the 97.5% quantiles for the TA (0.2059) and FP (0.2118) indices are modest, further indicating weak and unstable correlations with the carbon market. This is primarily because the textile and forest products industries are light and labor-intensive sectors, where the impact of carbon emissions is relatively less pronounced. In addition, the average dynamic correlation coefficient between the CC and SB indices is only 0.0262, with the 50% quantile for the SB index at merely 0.0168. Although shipbuilding is highly energy-intensive, its dynamic linkage with the carbon market remains insignificant. This is mainly because the industry’s heavy dependence on international trade heightens its vulnerability to national trade policies and economic cycles, thereby diminishing its correlation with domestic carbon prices. For instance, the 2018 China–U.S. trade tensions led to a contraction in global maritime trade. According to the UNCTAD Review of Maritime Transport 2019, international seaborne trade growth declined, with container port throughput slowing from 6.7% in 2017 to 4.7% in 2018. This downturn affected the shipbuilding industry, resulting in cyclical fluctuations.
Fourthly, except for the FP, TA, and SB indices, the dynamic correlations between the carbon market and other industries remain relatively high, with average values exceeding 0.06. This indicates that the dynamic correlations between China’s carbon market and traditional manufacturing industries exhibit significant industry heterogeneity. Industries with higher carbon emission intensity show more pronounced dynamic correlations with the carbon market. This finding suggests that the carbon pricing mechanism serves as an effective market-driven incentive, promoting low-carbon technological innovation and improving production process efficiency within traditional manufacturing industries.
Figure 4 presents the dynamic correlations between China’s carbon market and traditional manufacturing industries. The results indicate significant time-varying volatility, with consistent patterns of fluctuation across industries. A more detailed analysis revealed the following.
Firstly, the dynamic correlation trends between the CC index and the PV and Ma indices are highly consistent. This synchronization stems from the strong interconnection within the manufacturing value chain, where the machinery manufacturing industry directly influences the production efficiency and technological advancement of the automobile manufacturing industry. According to the Machine Tools Market Size, Share & Trends Report, 2030 by Grand View Research, the automotive industry accounted for 41.7% of global machine tool demand in 2024, making it the largest end-use sector. This strong supply–demand relationship between the two industries reinforces the observed consistency in their dynamic correlation trends.
Secondly, although the average values are low, the dynamic correlations between the CC index and the FP and TA indices exhibit periodic co-movements, indicating synchronized responses to common external shocks. An analysis of the time-varying correlations reveals that the dynamic correlation coefficients oscillate around zero and gradually converge, with the fluctuation range narrowing significantly over time. Although multiple directional shifts in correlation occur during the study period, the overall trend stabilizes at a low level of positive correlation. This finding is consistent with the earlier observation that the dynamic correlations between the CC index and the FP and TA indices are not significant.

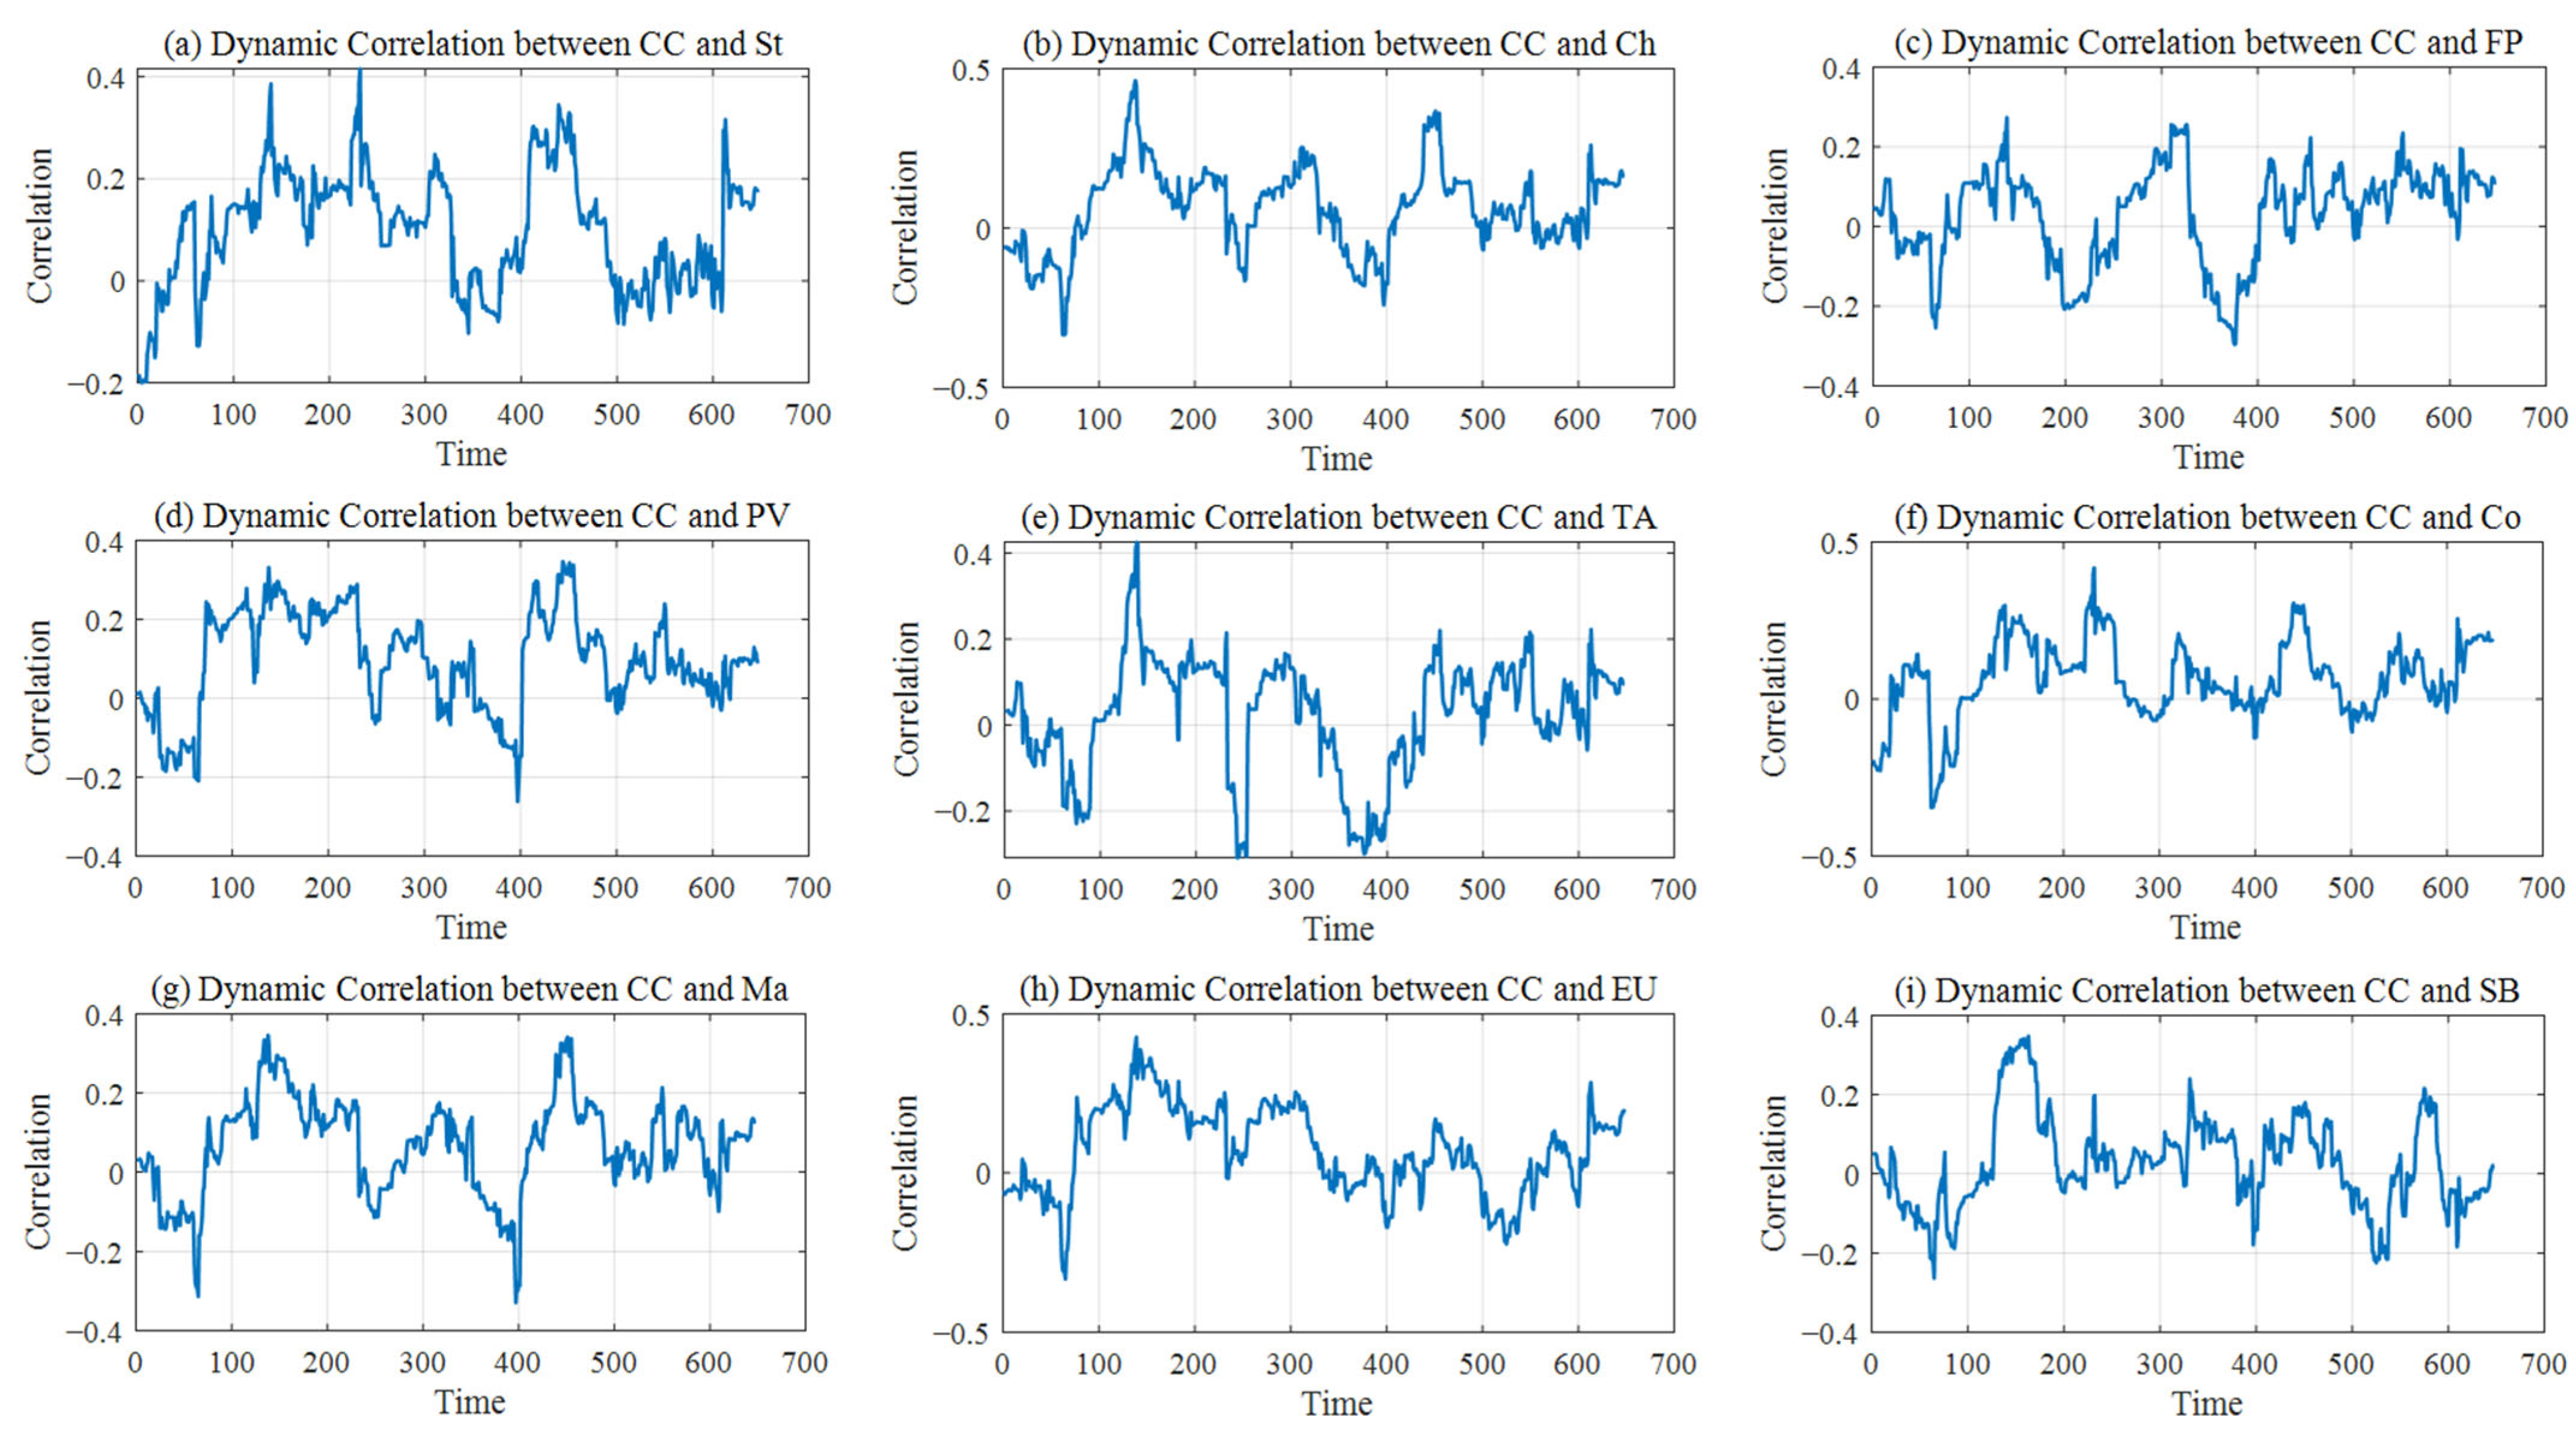
3.4. Analysis of the Volatility Spillover Effect

The volatility spillover effect refers to the phenomenon where an asset’s volatility is influenced not only by its own past volatility but also by the volatility of other assets over a certain period. When an asset experiences a sudden increase in volatility due to macroeconomic or microeconomic shocks, this change can spill over to other related assets. Analyzing volatility spillover effects provides deeper insights into the intrinsic relationships between different assets. Table 5 presents the volatility level parameters of China’s carbon market and traditional manufacturing industries, where μ denotes the long-term mean of volatility. A detailed analysis of Table 5 reveals the following findings.
Firstly, the volatility level parameter of the CC index is significantly higher than those of traditional manufacturing industries. The average value reaches 6.8092, the highest among all markets, while the standard deviation is 4.0883. This indicates that the carbon market experiences substantial fluctuations. The primary reasons include the early development stage of China’s carbon emissions trading market, where the trading system and regulatory framework remain imperfect, leading to inadequate price discovery and heightened volatility. Additionally, the participant structure is relatively homogeneous, mainly consisting of emission-controlled enterprises, with limited involvement from financial institutions and individual investors. This lack of diversification results in low market liquidity, making it more susceptible to sharp price swings. Furthermore, the carbon market is highly policy-driven, making it vulnerable to policy uncertainties and unexpected domestic and international events.
Secondly, the volatility level parameter of the EU index is second only to the CC index, the data demonstrate an average of 0.9456 with a corresponding standard deviation of 0.4433. Although fluctuations are present, the parameter remains relatively stable. This stability primarily stems from the power industry’s fundamental role in societal operations, where government-regulated electricity prices mitigate excessive volatility. However, electricity demand is still influenced by macroeconomic conditions and seasonal changes. Additionally, fluctuations in fuel prices, such as coal and natural gas, can further impact power generation costs, contributing to the volatility of the index.
Thirdly, the volatility-level parameters for traditional manufacturing industries are not statistically significant. For instance, the mean value of the volatility-level parameter for the Ma Index is −1.2957. This can be attributed to the inherent characteristics of the traditional manufacturing industry, as reflected in the following aspects. First, traditional manufacturing is a well-established sector with relatively stable market supply and demand, rendering it less sensitive to economic cycle fluctuations. Second, its limited growth potential results in relatively stable market expectations. Lastly, the data utilized in this study are derived from the CSI All Share Index, which reflects the aggregate volatility of a broad range of listed companies within the industry. Consequently, the estimated volatility parameters exhibit low significance.
The φ parameter represents the volatility spillover coefficient, which reflects the extent to which the volatility at time t is influenced by the volatility at time t−1. Using the DGC-t-MSV model, this study not only observes the volatility level parameters of each market but also quantifies the dynamic cross-effects of volatility between different markets. Table 6 presents the volatility spillover simulation results between China’s carbon market and traditional manufacturing industries. A detailed analysis revealed the following.
Firstly, a significant unidirectional spillover effect is observed from the CC index to the St index. The average spillover effect of the CC index on the St index is 0.8171, whereas the spillover effect of the St index on the CC index is −1.3316. This indicates that price fluctuations in China’s carbon market influence the steel industry through the price transmission mechanism, while fluctuations in the steel industry have little impact on carbon trading prices. This asymmetry can be attributed to the steel industry’s role as a high-carbon traditional manufacturing sector. An increase in carbon trading prices directly raises the cost of carbon emissions, thereby contributing to price volatility within the industry. Moreover, the negative spillover effect from the steel industry to the carbon market may result from the fact that not all relevant enterprises are currently regulated under the carbon trading system, thereby limiting the industry’s pricing power in the carbon market.
Secondly, the CC index exhibits unidirectional volatility spillover effects on the SB, Ch, and PV indices. Among them, the Ch and PV indices show a pattern similar to that of the St index, where the carbon market exerts a significant unidirectional volatility spillover effect. This suggests that the carbon market has a widespread impact on high-carbon traditional manufacturing industries, and that price dynamics in the carbon market can effectively transmit to various high-carbon sectors. Notably, the spillover effect from the CC index to the SB index is minimal. This finding is consistent with earlier results indicating that the shipbuilding industry exhibits a relatively weak dynamic correlation with the carbon market.
Thirdly, there are significant bidirectional asymmetric volatility spillover effects between the CC index and the FP and TA indices, with the spillover effect from these indices to the CC index being more pronounced. This suggests that the carbon market primarily serves as the recipient of the volatility spillover effect. This can be attributed to the presence of high-carbon-emission segments within the production processes of the forest products industry and the textile industry, resulting in a spillover effect from the carbon emissions trading market to these sectors. Moreover, as both industries are closely tied to daily consumption, they serve as indicators of macroeconomic demand, which, in turn, influences government carbon trading policies and the distribution of emission allowances, ultimately affecting carbon market prices [26,27].
Fourthly, significant bidirectional volatility spillover effects are observed between the CC index and the Ma and Co indices. The spillover effects from the Ma and Co indices to the CC index have mean values of 1.4275 and 4.1737, respectively, which are considerably higher than the corresponding effects from the CC index on these two industries. This asymmetry can be attributed to the nature of the Ma and Co indices, which represent midstream traditional manufacturing sectors. Specifically, the machinery manufacturing sector is a significant contributor to carbon emissions, and the Co index includes listed companies from several high-carbon industries. Although not all related sectors are currently included in the carbon emission regulatory system, their strong association with high-emission activities enables them to indirectly influence carbon trading prices by shaping carbon quota allocation policies.

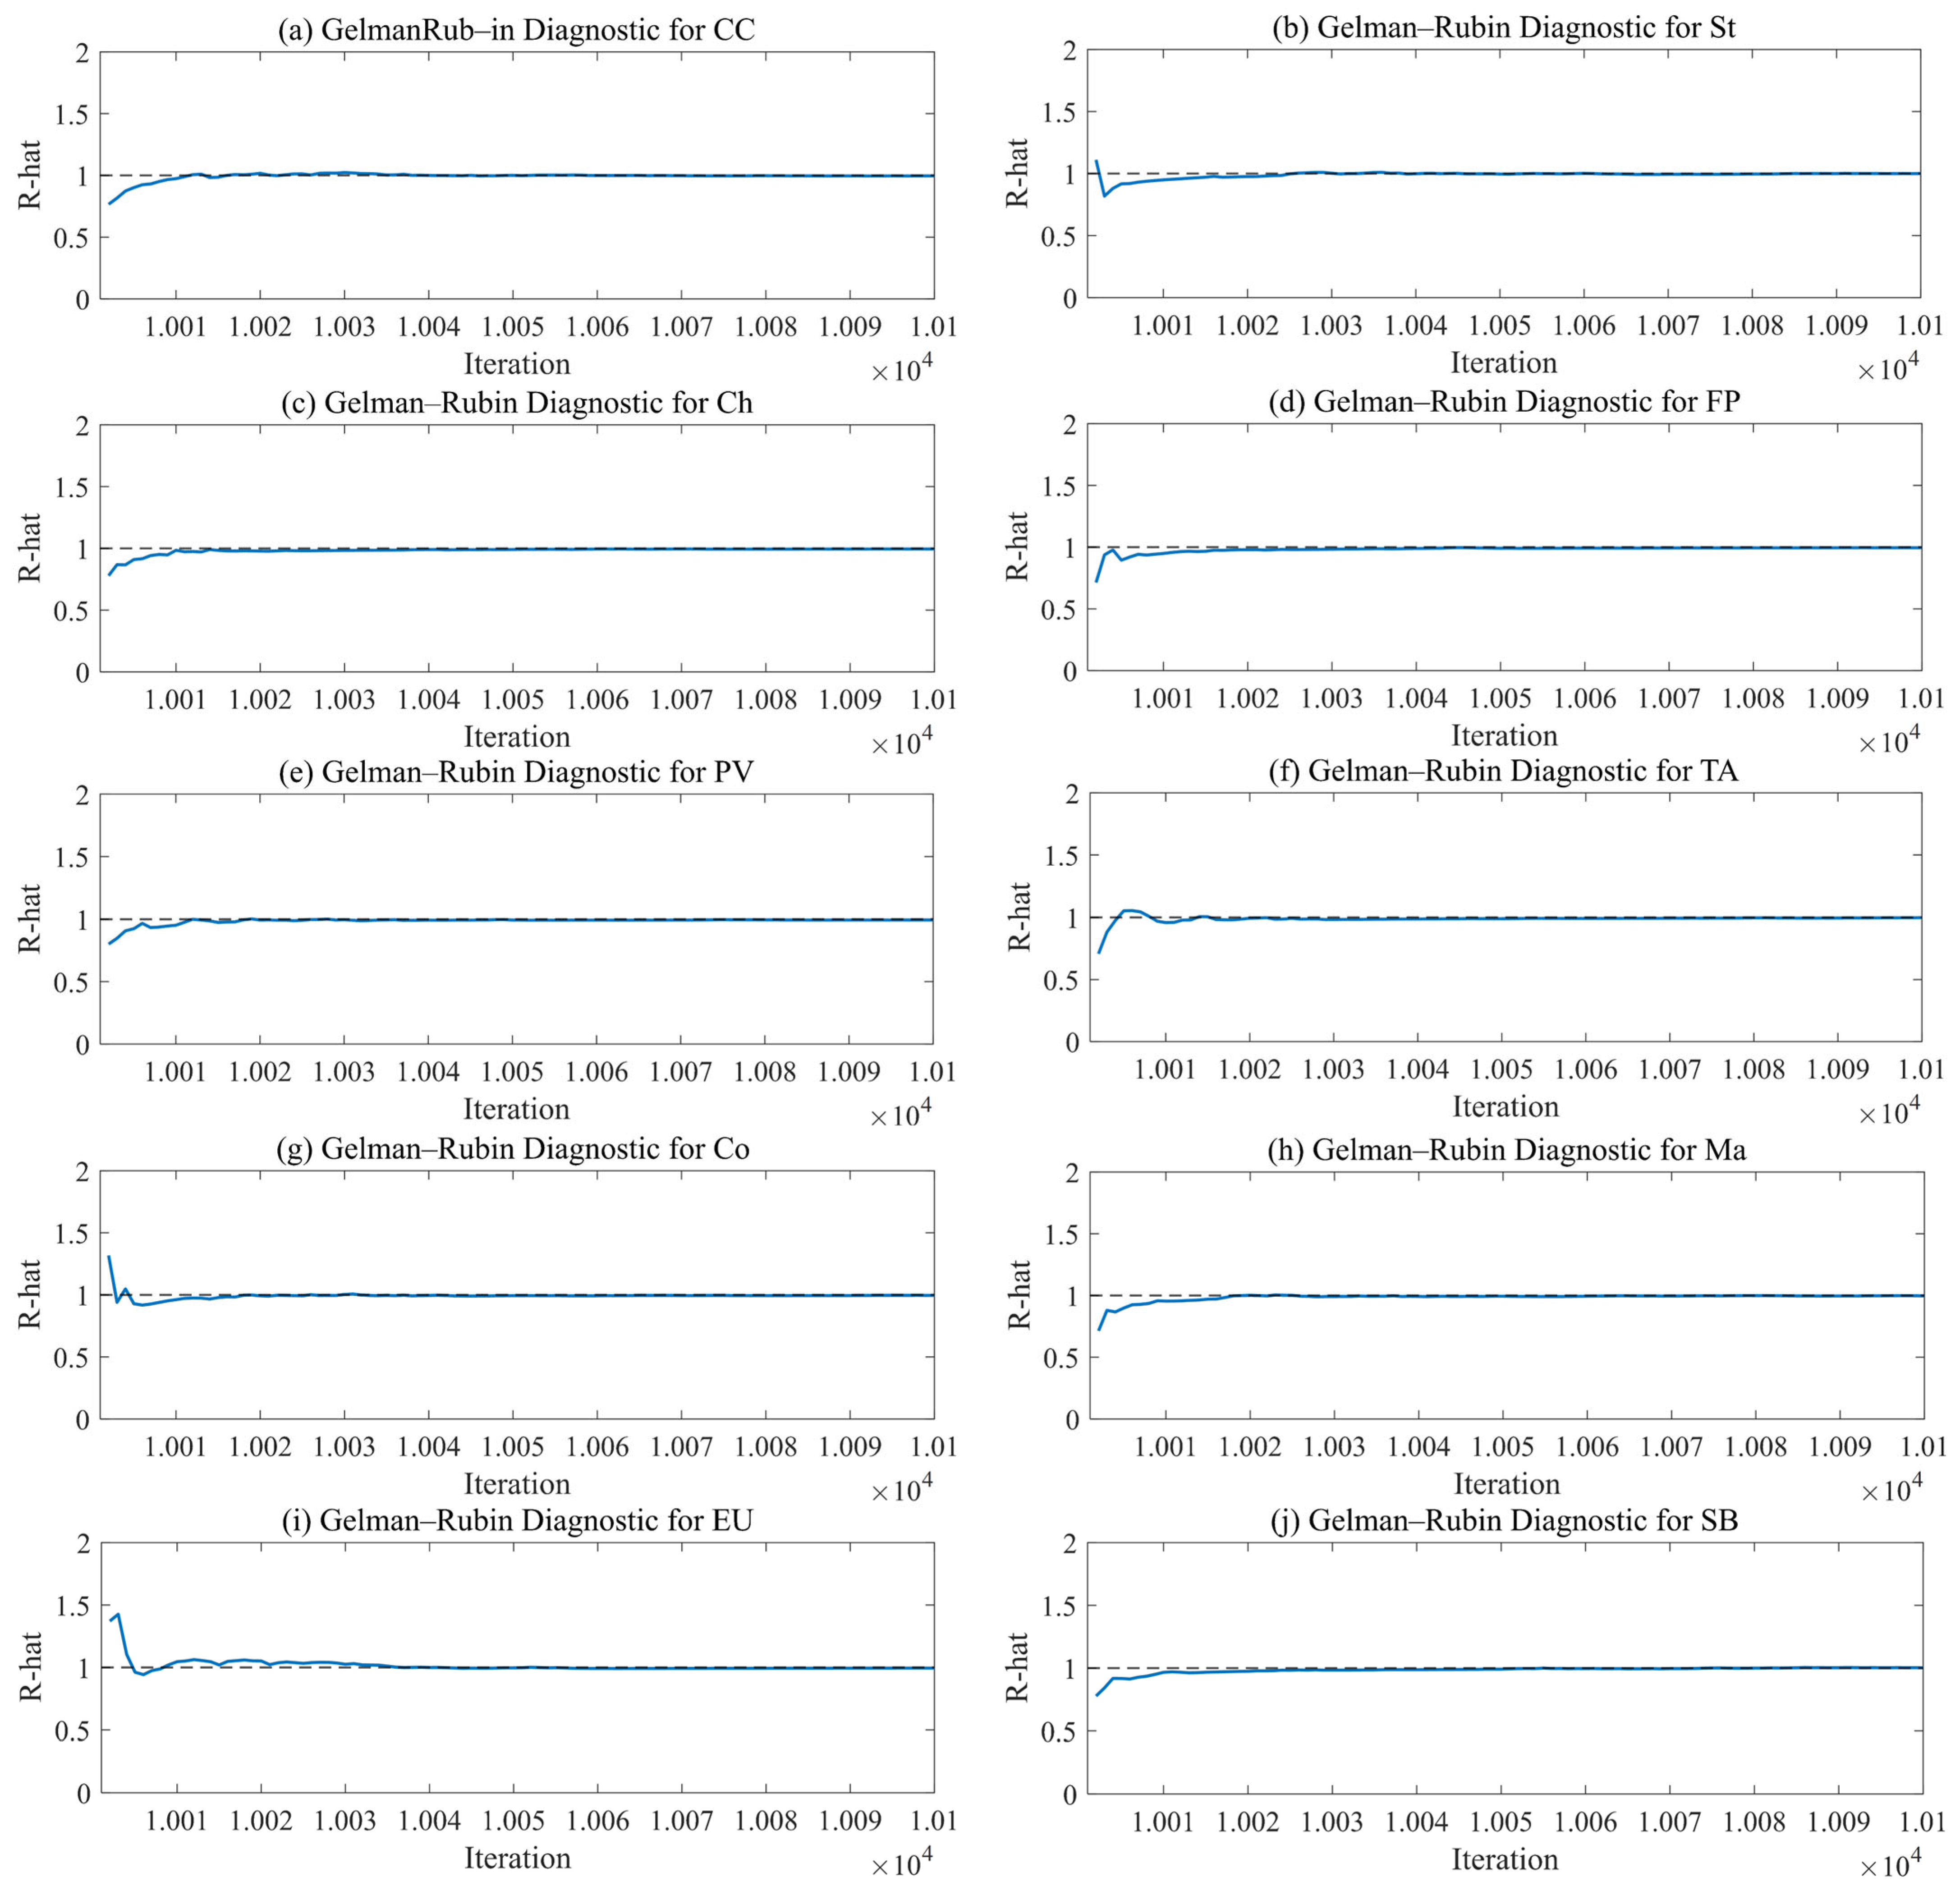
3.5. Analysis of Model Convergence

This study employed the Gelman–Rubin test to assess the convergence of the Markov Chain Monte Carlo (MCMC) method by comparing the variances of multiple chains to determine if the model has reached a stationary distribution. The procedures are as follows: First, two MCMC chains with different initial values are generated. Subsequently, the within-chain and between-chain variances are computed. Based on these variances, the potential scale reduction factor (PSRF) is calculated. A PSRF value approaching 1 indicates convergence of the Markov chain, whereas a value exceeding 1.1 or 1.2 suggests that the chain has not yet converged.
Figure 5 presents the Gelman–Rubin test results for the volatility-level parameter μ of China’s carbon market and traditional manufacturing industries. As shown in Figure 5, the PSRF value gradually approaches 1 after initial fluctuations and ultimately converges to 1 after 10,090 iterations. This indicates that the Markov chains have sufficiently converged to a stable value after adequate iterations. Combined with the sampling stability and convergence tests presented in Section 3.2, these results confirm that the DGC-t-MSV model provides an accurate and effective approach for simulating the dynamic correlations and volatility spillover effects between China’s carbon market and traditional manufacturing industries. Given the model’s strong convergence and robustness, the conclusions drawn from the empirical analysis can be considered reliable.

4. Conclusions

In this research, the DGC-t-MSV model was developed by integrating dynamic correlation and Granger causality into the basic MSV framework. The Gibbs sampling in the Markov Chain Monte Carlo (MCMC) method was subsequently applied to analyze the dynamic correlations and volatility spillover effects between China’s carbon market and traditional manufacturing industries. The key findings of this study are as follows:
(1) Widespread dynamic correlations exist between China’s carbon market and traditional manufacturing industries, characterized by significant industry heterogeneity. The strength of this correlation is positively associated with each industry’s carbon emissions. Notably, the carbon market exhibits stronger dynamic correlations with high-carbon manufacturing industries, including the steel, chemicals, automobile manufacturing, machinery manufacturing, and construction engineering industries. In contrast, its correlations with the forest products industry, as well as the textile industry, remain relatively weaker.
(2) Significant volatility spillover effects exist between China’s carbon market and traditional manufacturing industries. Specifically, the carbon market exhibits significant unidirectional volatility spillover effects on the steel, shipbuilding, chemicals, and automobile manufacturing industries, with the carbon market acting as the spillover source. In contrast, bidirectional volatility spillover effects are observed between the carbon market and the forest products, textile, machinery manufacturing, and construction engineering industries, where the carbon market not only influences these industries but is also more susceptible to the uncertainties they transmit, positioning it as a recipient of volatility spillovers.
(3) The volatility level of China’s carbon market is significantly higher than that observed in traditional manufacturing industries. As China’s carbon market remains in its early developmental stage, the limited experience of market participants and the inadequacy of regulatory frameworks render it highly susceptible to substantial fluctuations. Currently, carbon prices are primarily influenced by carbon quota allocations and national policies. To ensure the long-term stability of the carbon market, future efforts should focus on refining dual-carbon policies, improving the institutional framework, and strengthening regulatory mechanisms.
Based on the findings, this study proposes the following policy recommendations. (1) Expand the coverage of the carbon market and strengthen the supervision of industrial classification. Specifically, priority should be given to incorporating high-carbon emission sectors such as steel and chemicals into the carbon emission regulatory system. In addition, a phased approach should be adopted to achieve full industry coverage, supported by a hierarchical regulatory framework to improve adaptability and implementation efficiency. (2) Enhance the stability of the carbon price mechanism and enhance the expected management ability of enterprises for policies. It is suggested that a scientific and transparent quota allocation mechanism should be established to guide the rational operation of carbon prices and avoid irrational shocks to manufacturing enterprises caused by short-term sharp fluctuations. (3) Promote the coordination between the carbon market and industrial transformation policies. In particular, strengthen the alignment with initiatives such as green manufacturing, technological upgrading, and energy efficiency improvement. Moreover, design differentiated incentive mechanisms based on industry-specific carbon emissions to accelerate the green transformation of traditional manufacturing.
This study provides empirical insights into the interaction between China’s carbon market and traditional manufacturing industries, offering a foundation for further market optimization. However, due to limitations in data availability and methodology, key market variables such as bid-ask spreads, trading volume, and energy prices were not incorporated, which may constrain the scope of the analysis. As additional high-emission industries are integrated into the carbon management system and more participants enter the market, the overall structure is expected to become more robust. Future research can build upon this framework to investigate the dynamic correlations and volatility spillover effects between the carbon market and traditional manufacturing sectors.

Author Contributions

J.W.: Conceptualization and Methodology. D.S.: Writing—Original draft preparation and Analysis. L.W.: Calculation and Supervision. J.W., D.S. and L.W. contributed equally to this work. They are co-first authors. All authors have read and agreed to the published version of the manuscript.

Funding

This research was supported by National Natural Science Foundation of China (No. 71971111), Jiangsu Province’s Youth Science and Technology Talent Support Project (No. JSTJ-2024-438).

Data Availability Statement

The original contributions presented in this study are included in the article. Further inquiries can be directed to the corresponding author

Conflicts of Interest

The authors declare that they have no competing interests.

References

  1. Gong, X.; Shi, R.; Xu, J.; Lin, B. Analyzing spillover effects between carbon and fossil energy markets from a time-varying perspective. Appl. Energy 2021, 285, 116384. [Google Scholar] [CrossRef]
  2. Su, C.W.; Pang, L.D.; Qin, M.; Lobonț, O.R.; Umar, M. The spillover effects among fossil fuel, renewables and carbon markets: Evidence under the dual dilemma of climate change and energy crises. Energy 2023, 274, 127304. [Google Scholar] [CrossRef]
  3. Xu, C.; Chen, Z.; Zhu, W.; Zhi, J.; Yu, Y.; Shi, C. Time-frequency Spillover and Early Warning of Climate Risk in International Energy Markets and Carbon Markets: From the Perspective of Complex Network and Machine Learning. Energy 2025, 318, 134857. [Google Scholar] [CrossRef]
  4. Entezaminia, A.; Gharbi, A.; Ouhimmou, M. A joint production and carbon trading policy for unreliable manufacturing systems under cap-and-trade regulation. J. Clean. Prod. 2021, 293, 125973. [Google Scholar] [CrossRef]
  5. Xi, B.; Jia, W. Research on the impact of carbon trading on enterprises’ green technology innovation. Energy Policy 2025, 197, 114436. [Google Scholar] [CrossRef]
  6. Li, J.; Wan, Q.; Zhang, J.; Zhang, L.; Ou, Z. Application research on deep learning algorithms supporting cross-border low-carbon IoT systems in manufacturing—Taking Guangdong, China, as an example. Int. J. Low-Carbon Technol. 2025, 20, 315–322. [Google Scholar] [CrossRef]
  7. Löschel, A.; Lutz, B.J.; Managi, S. The impacts of the EU ETS on efficiency and economic performance–An empirical analyses for German manufacturing firms. Resour. Energy Econ. 2019, 56, 71–95. [Google Scholar] [CrossRef]
  8. Zhang, W.; Li, J.; Li, G.; Guo, S. Emission reduction effect and carbon market efficiency of carbon emissions trading policy in China. Energy 2020, 196, 117117. [Google Scholar] [CrossRef]
  9. Cui, J.; Wang, C.; Zhang, J.; Zheng, Y. The effectiveness of China’s regional carbon market pilots in reducing firm emissions. Proc. Natls. Acad. Sci. USA 2021, 118, e2109912118. [Google Scholar] [CrossRef]
  10. An, Y.; Zhou, D.; Yu, J.; Shi, X.; Wang, Q. Carbon emission reduction characteristics for China’s manufacturing firms: Implications for formulating carbon policies. J. Environ. Manag. 2021, 284, 112055. [Google Scholar] [CrossRef]
  11. Wang, W.; Zhang, Y.J. Does China’s carbon emissions trading scheme affect the market power of high-carbon enterprises? Energy Econ. 2022, 108, 105906. [Google Scholar] [CrossRef]
  12. Tang, M.; Cheng, S.; Guo, W.; Ma, W.; Hu, F. Effects of carbon emission trading on companies’ market value: Evidence from listed companies in China. Atmosphere 2022, 13, 240. [Google Scholar] [CrossRef]
  13. Sun, Y.; Huang, Z.; Chi, F.; Zhang, W. Exploring a low-carbon transition quality assessment framework for Chinese energy-intensive industries: From carbon reduction perspective. Environ. Dev. Sustain. 2024, 2024, 1–32. [Google Scholar] [CrossRef]
  14. Zhang, J.; Zhuang, Y. Cross-Market Infection Research on Stock Herding Behavior Based on DGC-MSV Models and Bayesian Network. Complexity 2021, 2021, 6645151. [Google Scholar] [CrossRef]
  15. Wang, J.; Zeng, R.; Wang, L. Volatility Spillover Between the Carbon Market and Traditional Energy Market Using the DGC-t-MSV Model. Mathematics 2024, 12, 3789. [Google Scholar] [CrossRef]
  16. Li, J.; Umar, M.; Huo, J. The spillover effect between Chinese crude oil futures market and Chinese green energy stock market. Energy Econ. 2023, 119, 106568. [Google Scholar] [CrossRef]
  17. Liang, Y.; Jin, X.; Taghvaee, V. Sustainable development spillover effects among selected Asian countries: Analysis of integrated sustainability perspective. Socio-Econ. Plan. Sci. 2024, 91, 101781. [Google Scholar] [CrossRef]
  18. Yu, J.; Meyer, R. Multivariate stochastic volatility models: Bayesian estimation and model comparison. Econom. Rev. 2006, 25, 361–384. [Google Scholar] [CrossRef]
  19. Chen, T.; Zheng, X.; Wang, L. Systemic risk among Chinese petrochemical firms based on dynamic tail risk spillover networks. North Am. J. Econ. Financ. 2025, 77, 102404. [Google Scholar] [CrossRef]
  20. Wan, Y.; Sheng, N.; Wei, X.; Su, H. Study on the spatial spillover effect and path mechanism of green finance development on China’s energy structure transformation. J. Clean. Prod. 2023, 415, 137820. [Google Scholar] [CrossRef]
  21. Chen, W.; Wang, G.; Yang, L.; Huang, C.; Xu, N.; Gu, T.; Zeng, J. Spillover effects of urbanization on carbon emissions: A global view from 2000 to 2019. Environ. Impact Assess. Rev. 2023, 102, 107182. [Google Scholar] [CrossRef]
  22. Radmehr, R.; Shayanmehr, S.; Baba, E.A.; Samour, A.; Adebayo, T.S. Spatial spillover effects of green technology innovation and renewable energy on ecological sustainability: New evidence and analysis. Sustain. Dev. 2024, 32, 1743–1761. [Google Scholar] [CrossRef]
  23. Ren, X.; Li, J.; He, F.; Lucey, B. Impact of climate policy uncertainty on traditional energy and green markets: Evidence from time-varying granger tests. Renew. Sustain. Energy Rev. 2023, 173, 113058. [Google Scholar] [CrossRef]
  24. Hung, Y.S.; Lee, C.; Chen, P.F. China’s monetary policy and global stock markets: A new cointegration approach with smoothing structural changes. Econ. Anal. Policy 2022, 76, 643–666. [Google Scholar] [CrossRef]
  25. Wu, R.; Tan, Z.; Lin, B. Does carbon emission trading scheme really improve the CO2 emission efficiency? Evidence from China’s iron and steel industry. Energy 2023, 277, 127743. [Google Scholar] [CrossRef]
  26. Li, Z.Z.; Li, Y.; Huang, C.Y.; Dumitrescu Peculea, A. Volatility spillover across Chinese carbon markets: Evidence from quantile connectedness method. Energy Econ. 2023, 119, 106542. [Google Scholar] [CrossRef]
  27. Klarić, K.; Pirc Barčić, A.; Basarac Sertić, M. Assessing the role of forest certification and macroeconomic indicators on croatian wood exports to the EU: A panel data approach. Forests 2023, 14, 1908. [Google Scholar] [CrossRef]
Figure 1. Time series of logarithmic returns for China’s carbon market and traditional manufacturing industries.
Mathematics 13 01514 g001
Figure 2. Dynamic tracking and iterative results of volatility level parameters for China’s carbon market and traditional manufacturing industries.
Mathematics 13 01514 g002
Figure 3. Dynamic tracking and iterative results of volatility level parameters for China’s carbon market and traditional manufacturing industries (last 200 iterations).
Mathematics 13 01514 g003
Figure 4. Dynamic correlation results between China’s carbon market and traditional manufacturing industries.
Mathematics 13 01514 g004
Figure 5. Graph of Gelman–Rubin test results.
Mathematics 13 01514 g005
Table 1. Descriptive statistics of logarithmic returns for China’s carbon market and traditional manufacturing industries.
MeanMedianSDVarKurtosisSkewnessRangeMinMax
CC0.08650.00001.67472.80457.18080.008319.5193−10.29829.2211
St−0.0448−0.04241.43482.05866.0546−0.197317.3347−8.73368.6011
Ch−0.0557−0.08631.48092.19314.6343−0.115217.1045−8.51168.5929
FP−0.0273−0.00431.53882.36793.8515−0.376716.2768−8.36247.9145
PV−0.0058−0.07301.76613.11901.62890.134315.8171−7.18958.6275
TA−0.03110.02211.38411.91577.0716−0.583618.0303−9.91538.1149
Co−0.0081−0.06171.59842.55503.30100.149217.1366−9.01128.1254
Ma−0.02170.01101.60112.56354.9326−0.008018.8491−9.02649.8227
EU−0.0069−0.02111.29251.67053.2216−0.256313.7645−7.27786.4867
SB0.0212−0.03591.77473.14972.99400.287415.8020−7.65998.1421
Table 2. Results of stationarity and heteroscedasticity tests for logarithmic returns.
SeriesADF StatisticADF p-ValueARCH LM StatARCH LM p-Value
CC−35.12930110.91460
St−25.07540133.6760
Ch−23.83020176.99610
FP−16.84890102.59280
PV−25.0161078.63560
TA−25.35690129.92230
Co−17.56760139.56960
Ma−25.49780205.16570
EV−26.7173056.24280
SB−27.9325050.54490
Table 3. DIC test result of DC-MSV, DCGC-MSV and DGC-t-MSV models.
DbarDhatpDDIC
DC-MSV7.91−52.6760.5868.49
DCGC-MSV9.45−36.6746.1255.57
DGC-t-MSV8.32−4.7213.0421.35
Table 4. Descriptive statistics of dynamic correlation coefficients between China’s carbon market and traditional manufacturing industries.
NodeMeanSD50%97.5%MaxMinRange
ρ CCSt0.09800.10320.11150.27770.3529−0.14450.4974
ρ CCCh0.06330.11620.07630.30680.3732−0.20080.5741
ρ CCFP0.02950.10890.06540.21180.2552−0.23620.4914
ρ CCPV0.09900.11060.09980.27970.3792−0.17490.5541
ρ CCTA0.02680.12190.05710.20590.3382−0.28360.6219
ρ CCCo0.06320.10580.05450.29190.3645−0.23830.6028
ρ CCMa0.06790.10490.07930.27280.3604−0.19470.5550
ρ CCEU0.07340.12260.06590.31840.3905−0.18300.5735
ρ CCSB0.02620.10410.01680.29910.3249−0.22740.5523
Table 5. Volatility level parameters of China’s carbon market and traditional manufacturing industries.
NodeMeanSD2.50%50.00%97.50%Naive SETime-Series SE
μCC6.80924.08831.18428.893111.77940.03340.2738
μSt−0.20510.1726−0.6548−0.1517−0.01550.00140.0222
μCh−0.04910.4360−0.7586−0.08730.81340.00360.0318
μFP−0.61460.1885−1.0180−0.6041−0.27800.00150.0214
μPV−0.78410.3106−1.2214−0.8866−0.16730.00250.0448
μTA−0.20960.1306−0.4870−0.20450.02430.00970.0123
μCo−0.58900.1453−0.8840−0.5869−0.32380.00120.0124
μMa−1.29570.9289−2.8296−1.1359−0.35520.00760.0644
μEU0.94560.44330.44480.88202.03010.00360.0958
μSB−0.83890.1077−1.0310−0.8456−0.60140.00090.0097
Table 6. Volatility spillover simulation results between China’s carbon market and traditional manufacturing industries.
NodeMeanSD2.50%50.00%97.50%Naive SETime-Series SE
φ CCSt−1.33161.4160−4.7391−1.19940.09970.01160.3589
φ StCC0.81715.60300.70330.81480.93660.00040.0181
φ CCCh−0.20401.7400−3.78570.00852.94080.01420.4040
φ ChCC0.91070.05210.84670.91260.97580.00040.0018
φ CCFP4.26933.5040−0.56514.053010.03880.02860.8674
φ FPCC0.83260.05840.70840.84830.92820.00050.0160
φ CCPV−3.01936.6522−12.4294−4.27229.96950.05431.2401
φ PVCC0.93710.02410.88840.94520.96290.00020.0059
φ CCTA3.01102.06000.53262.51897.91830.01680.5601
φ TACC0.78380.05310.68000.77820.89140.00040.0132
φ CCCo4.17371.7740−4.17370.39661.53520.01450.2709
φ CoCC0.85610.06210.71820.86650.94760.00050.0124
φ CCMa1.42750.91460.24681.51042.72430.00750.1004
φ MaCC0.92800.07370.82520.97470.99360.00060.0024
φ CCEU−1.3210.7263−2.4643−1.1618−0.49830.00590.0779
φ EUCC0.92220.07360.81880.96470.98800.00060.0011
φ CCSB−0.50276.875−12.15742.69037.65100.05610.6781
φ SBCC0.49490.01150.24670.53090.72750.00130.0261
Disclaimer/Publisher’s Note: The statements, opinions and data contained in all publications are solely those of the individual author(s) and contributor(s) and not of MDPI and/or the editor(s). MDPI and/or the editor(s) disclaim responsibility for any injury to people or property resulting from any ideas, methods, instructions or products referred to in the content.

