Abstract
When objects are obscured by shadows or dim surroundings, image quality is improved by fusing near-infrared and visible-light images. At night, when visible and NIR lights are insufficient, long-wave infrared (LWIR) imaging can be utilized, necessitating the attachment of a visible-light sensor to an LWIR camera to simultaneously capture both LWIR and visible-light images. This camera configuration enables the acquisition of infrared images at various wavelengths depending on the time of day. To effectively fuse clear visible regions from the visible-light spectrum with those from the LWIR spectrum, a multi-band fusion method is proposed. The proposed fusion process subsequently combines detailed information from infrared and visible-light images, enhancing object visibility. Additionally, this process compensates for color differences in visible-light images, resulting in a natural and visually consistent output. The fused images are further enhanced using a night-to-day image translation module, which improves overall brightness and reduces noise. This night-to-day translation module is a trained CycleGAN-based module that adjusts object brightness in nighttime images to levels comparable to daytime images. The effectiveness and superiority of the proposed method are validated using image quality metrics. The proposed method significantly contributes to image enhancement, achieving the best average scores compared to other methods, with a BRISQUE of 30.426 and a PIQE of 22.186. This study improves the accuracy of human and object recognition in CCTV systems and provides a potential image-processing tool for autonomous vehicles.
MSC:
68T45
1. Introduction
Various algorithms have been proposed to enhance low-light images, particularly under nighttime conditions. These include methods based on single-scale Retinex, dehazing models, enhancement techniques for non-uniform illumination, and deep learning-based approaches. Liang et al. introduced a Retinex-based decomposition method using nonlinear diffusion filtering to accurately estimate the illumination component [1]. This method incorporates surround suppression to effectively reduce unnecessary textures while preserving edge information, thereby minimizing halo artifacts often observed in traditional Retinex algorithms and enhancing local contrast. Lin and Lu proposed a novel Retinex-based enhancement model by combining Shrinkage Mapping with a Plug-and-Play ADMM framework [2]. This model applies non-convex Lp regularization to the illumination component to suppress texture while preserving major edges. It also refines the illumination map using iterative self-guided filtering, which helps reduce edge blurring. This integrated strategy provides a balance between visual quality and computational efficiency.
In the context of dehazing-based methods, Yu and Zhu proposed a physics-inspired illumination model to explain the degradation process of low-light images through variables such as local ambient lighting and light scattering attenuation [3]. Initial illumination is estimated based on Retinex theory and a Gaussian surround function, followed by iterative refinement of illumination and attenuation under constraints that minimize information loss. A weighted guided filter is used to suppress halo and block artifacts, while adjustments in brightness are performed in the HSV color space to reduce color distortion.
For handling non-uniform illumination, Pu and Zhu proposed a contrast/residual decomposition approach inspired by retinal visual mechanisms [4]. Without relying on physical models or deep learning, this method achieves natural brightness enhancement and detail preservation by using multi-scale adjustment and a weighted guided filter to maintain local contrast and suppress halo artifacts. Wang and Luo proposed NPIE-MLLS [5], which improves brightness imbalance and detail loss in low-light images by aligning the low-frequency components of multi-layer frequency decompositions with luminance statistics derived from high-quality natural images.
Among deep learning approaches, the recently proposed Zero-DCE offers a reference-free, curve estimation-based method for low-light enhancement [6]. It predicts pixel-wise curve parameters from the input image and adjusts brightness iteratively. The model is trained using a set of non-reference loss functions—including spatial consistency, exposure control, color constancy, and illumination smoothness—and achieves real-time performance with a lightweight architecture. It effectively restores natural brightness and contrast and demonstrates competitive results compared to supervised methods.
While these methods significantly improve the visual quality of low-light images and enhance object visibility in dark regions, they face limitations when dealing with extreme overexposure caused by strong light sources, such as vehicle headlights or tunnel exits at night. As shown in Figure 1, even after applying Zero-DCE, objects in overexposed regions remain difficult to recognize, and fine details are not sufficiently restored.
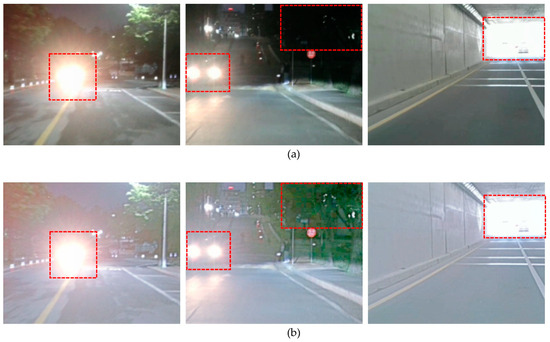
Figure 1.
Example of an image containing both overexposed and underexposed areas(red square): (a) a region with high exposure under nighttime conditions, and (b) a low-light image enhanced using Zero-DCE.
Moreover, the field of image-to-image translation has advanced significantly. Using deep learning, generative models are primarily applied for image translation; these models map input images to corresponding output images [7]. This approach allows nighttime images to be transformed into daytime scenes, yielding clear visual outcomes even under low-light conditions.
One of the deep learning-based image translation methods, namely Pix2Pix, is a type of conditional generative adversarial network (CGAN), trained to map a conditional vector (or input image) to the corresponding image within the training dataset [8]. The main objective of Pix2Pix is to minimize the pixel-wise difference between the generated and real images using CGAN and L1 losses. However, Pix2Pix has the disadvantage of requiring paired datasets, which can limit performance under restricted data availability. CycleGAN was introduced to overcome this limitation. This method enables image-to-image translation using unpaired datasets, eliminating the requirement for paired data [9].
Various image translation algorithms have been developed based on CycleGAN, one of which is ToDayGAN, a method for converting nighttime images to daytime images [10]. ToDayGAN improves performance by modifying the ComboGAN network as well as applying three different discriminators based on the CycleGAN concept. This modified network enables the transformation from day to night, as well as from night to day. To achieve this, fake B images transformed from A to B are used as input to the generator, which subsequently performs reverse transformation, converting the B images back to A. This structure demonstrates excellent performance in converting nighttime images to daytime images. Unlike traditional generative adversarial networks, which compare fake images with real images, ToDayGAN introduces a discriminator network with the same structure to compare fake and real images using the following three methods: Blur-RGB, Grayscale, and xy-Gradient, which refine the discriminator process. Similar to CycleGAN, ToDayGAN can effectively preserve the sky area in nighttime images while generating images that resemble daytime scenes. However, the fine details of objects present in nighttime images may not be clearly transformed.
The base–detail paired training method proposed by Son et al. [11] is another CycleGAN-based technique for converting nighttime images to daytime images. This method uses limited daytime and nighttime image data by generating a base nighttime image via a bilateral filter and applying the single luminance adaptation transform (SLAT) technique to the daytime image to set the base–detail learning direction. The images obtained from the trained modules use a newly defined sigmoid function to generate a noise reduction weight map based on the detailed images. This post-processing step removes noise from unnecessary areas and enhances the details of the image, converting nighttime images to daytime images. However, this conversion method presents limitations. Perfectly converting completely dark nighttime images to daytime images is difficult, and depending on the distribution of the training dataset, incorrect objects, such as trees or traffic lights, may be generated owing to the arbitrary generation of unseen information.
To effectively represent object information in nighttime or low-light images, various CycleGAN-based techniques for deep learning image translation have been applied. However, in test images that contain dark regions, object information is difficult to discern, possibly generating incorrect objects. Additionally, as shown in Figure 1, images that simultaneously contain low-light and overexposed regions are challenging to process for image translation and enhancement using a single sensor. To address this issue, the information in the input test images must be accurately complemented to prevent the arbitrary generation of unnecessary objects during image translation.
This study aims to generate improved images for nighttime or low-light image conversion without errors by acquiring visible-light and infrared (IR) images in multiple bands and synthesizing these images, thereby accurately conveying the information contained in the input test images. To achieve this, IR images were acquired and synthesized.
To capture IR images at night, an IR lamp is used as an artificial near-infrared (NIR) light source, as shown in Figure 2, allowing NIR images to be acquired even in the absence of natural light [12]. However, such existing imaging devices increase structural complexity and have limitations when capturing distant objects in NIR images. Therefore, a new device is required that reduces the complexity of the equipment while simultaneously capturing visible-light and IR images at the same location, even when objects are moving.
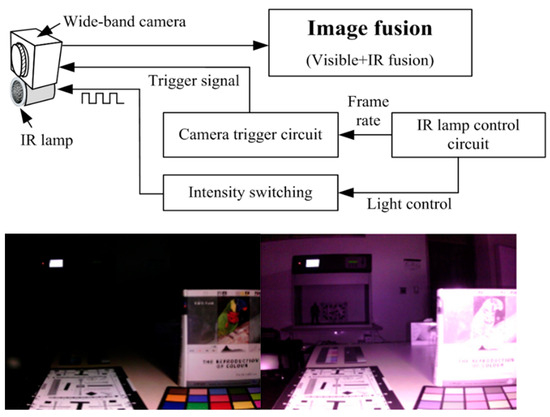
Figure 2.
Conventional visible and NIR image acquisition equipment using an IR lamp [12].
Conventional methods for synthesizing IR and visible-light images include deep learning- and algorithm-based methods. One deep learning-based method for IR and visible light image synthesis is DenseFuse (The version of PyTorch used for DenseFuse in this study is 1.11.0) [13]. This deep learning network consists of convolutional layers, fusion layers, and dense blocks. The dense blocks connect the output of each layer to all the other layers, allowing the information from the input layer to be passed to the next layer. The deep learning-based fusion process extracts additional useful features from the original image during the encoding phase. The input test images, including the visible-light and IR images, are fused using two strategies, namely, the additive and L1-norm strategies, which are applied through the trained module. The advantage of the dense blocks is that they preserve existing information for as long as possible and reduce overfitting via regularization effects. However, the resulting images are not as sharp as those generated by conventional algorithm-based fusion methods.
Another deep learning approach for visible and IR image fusion is SWIN fusion [14]. To address the context information lost by the content-independent nature of convolutional operations, this study proposes a Residual Swin Transformer Fusion Network. The method consists of three stages—global feature extraction, fusion layer, and feature reconstruction—and employs a pure transformer-based backbone together with an attention-based encoding architecture to effectively model long-range dependencies that conventional CNNs overlook. An L1-norm-based fusion strategy is also introduced, measuring activity levels across both row and column dimensions to balance the preservation of infrared brightness and visible details. However, because extremely bright visible regions (e.g., vehicle headlights) are retained almost unchanged, the enhancement of LWIR details in scenarios such as tunnel entry/exit or under headlight illumination remains limited.
Next, the low-rank representation fusion algorithm, known as a traditional synthesis algorithm, decomposes the image into low-rank (global structure) and saliency (local structure) components [15]. The low-rank fusion separates the low-rank (global structure) and saliency components (local structure), and the low-rank components are fused using a weighted average strategy to preserve edge information. The saliency components are subsequently fused using a sum strategy, and the final fused image is obtained by summing the low-rank and saliency components. However, this algorithm has limitations when capturing the fine details of IR images, reducing its effectiveness at representing edge information.
To extract the fine details of IR images and apply them to the fused image, the Laplacian–Gaussian pyramid [16] is used to separate the base and detail components, followed by multi-resolution decomposition for image synthesis. The Laplacian–Gaussian pyramid and local entropy fusion algorithm are traditional methods used for visible-NIR image fusion, maximizing the information obtained from visible-light and IR images using local entropy [17]. This algorithm decomposes the image into multiple resolutions using the Laplacian–Gaussian pyramid and subsequently smoothly fuses the images at each resolution level based on local entropy. Additionally, the multi-resolution fusion process generates a weight map to adjust local contrast and visibility to yield the final fused result. However, this method fails to sufficiently preserve the fine details of IR (NIR) images and has the limitation of producing unnatural color representations.
Another approach involves using the Laplacian–Gaussian pyramid to separate the base and detail layers and subsequently combining the visible and IR images using principal component analysis (PCA) to enhance image sharpness [18]. Unlike traditional PCA computation, this method generates a weight map for specific detail areas and avoids PCA computation in unnecessary regions with many zero-pixel values. Afterward, the PCA-based fusion method generates a radiance map, and the Stevens effect is applied to the color representation model to enhance local contrast and details. Colors are corrected by calculating the brightness difference between the input visible-light image and the generated radiance map. This method reduces edge degradation in IR images to a greater extent than conventional methods, improving local contrast and detail and preserving the colors on visible-light images.
To effectively extract the fine details of IR images, a method uses the contourlet transform [19] instead of the Laplacian–Gaussian pyramid to decompose the base and detail images and effectively synthesize the detail information. This method extracts directional detail information from both visible-light and IR images using the contourlet transform and calculates the optimal weights for combining the details of both images using the PCA fusion algorithm. Subsequently, the iCAM06 tone mapping method is applied to the base visible-light image to enhance the overall brightness and contrast of the fused image [20]. This synthesis method yields sharper details than the traditional Laplacian–Gaussian pyramid fusion algorithm but has limitations in controlling halo artifacts and the bright light from vehicle headlights, which can complicate vehicle identification.
This study conducts multi-band image fusion using visible-light and long-wave infrared (LWIR) images. First, directional detail and base information are precisely extracted from IR and visible-light images through the contourlet transform. Instead of traditional PCA-based fusion, discrete cosine transform (DCT) [21,22] is used to effectively combine the base and detailed information of each band. Subsequently, iCAM06 tone mapping [23] is applied to adjust the overall tone of the fused image naturally. The synthesized image is subsequently used as an input to the CycleGAN night-to-day translation module to enhance detail training. This approach minimizes the problem related to generating incorrect objects during image translation and sets the training direction to effectively represent the details of IR images using a multi-scale single-scale Retinex (SSR) module [24,25], unlike existing methods.
Conventional image fusion techniques, such as the algorithm-based Latent Low-Rank method and deep learning-based networks like DenseFuse and Swin fusion, have attempted to combine IR and visible images. However, these methods face limitations in effectively handling extreme nighttime lighting conditions, such as overexposure caused by vehicle headlights or underexposed backgrounds. In particular, DenseFuse and Swin fusion focus primarily on the simple integration of low-level features, while Latent Low-Rank and base–detail CycleGAN-based approaches rely on decomposing image details for synthesis and translation, yet fail to explicitly preserve directional or spectral detail information.
In contrast, the proposed method introduces a hybrid approach that integrates algorithmic and deep learning-based techniques to overcome these limitations. Specifically, it combines multi-band image fusion using the contourlet transform for directional decomposition, DCT-based fusion to preserve local details, and iCAM06 tone mapping for natural color representation. This is integrated with a CycleGAN-based night-to-day translation module to enhance visibility in low-light nighttime environments. Notably, the infrared image compensates for detail loss in overexposed regions that visible cameras cannot recover, while helping preserve the overall structure and natural appearance of the scene. This integrated strategy enhances object visibility and edge clarity in both bright and dark areas, demonstrating superior performance across multiple image quality evaluation metrics. Consequently, it is well-suited for real-world applications such as surveillance systems and autonomous driving.
2. Materials and Methods
2.1. IR Camera Settings and Preprocessing of LWIR Images
A new camera device was required to enhance images of dark areas using IR imaging. To simultaneously capture IR and visible-light images in a real vehicle, a configuration was developed using an LWIR camera and a compact camera sensor. The LWIR camera can typically use a hot mirror beam splitter filter, employed to separate the wavelength bands of LWIR cameras. However, separate filter plates that reflect LWIR wavelengths are expensive and difficult to obtain. Therefore, instead of using a beam splitter, the camera is arranged vertically, as shown in Figure 3.
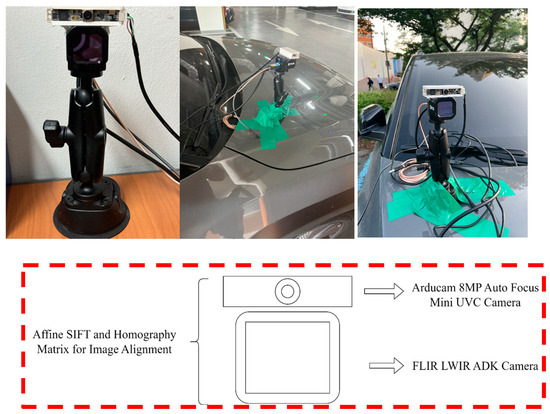
Figure 3.
Installation of the FLIR camera on the vehicle bonnet.
As the LWIR wavelength cannot pass through the windshield of the vehicle, the camera is mounted on top of the vehicle’s bonnet to capture the images, as shown in Figure 3. The FLIR ADK model thermal camera was used, developed and manufactured by Teledyne FLIR, headquartered in Wilsonville, OR, USA, with a horizontal field of view (HFOV) of 32° and an operating frequency of 60 Hz. For visible-light imaging, a general-purpose Arducam 8-megapixel USB camera with an HFOV of 58° was used. The Arducam 8MP AF Mini USB camera module, designed and developed by Arducam (Nanjing, China), was utilized. As the visible-light camera has a wide field of view, alignment with the LWIR camera is essential. The wavelength information of the webcam and LWIR camera is summarized in Table 1.

Table 1.
Camera device specifications.
NIR images can be directly applied to the fusion algorithms of the existing and proposed methods without any preprocessing. However, as shown in Figure 4, the sky region of LWIR images is represented in black, and applying the fusion algorithm under this condition may degrade the image quality. Therefore, the LWIR input images must be appropriately preprocessed before applying the fusion algorithm.
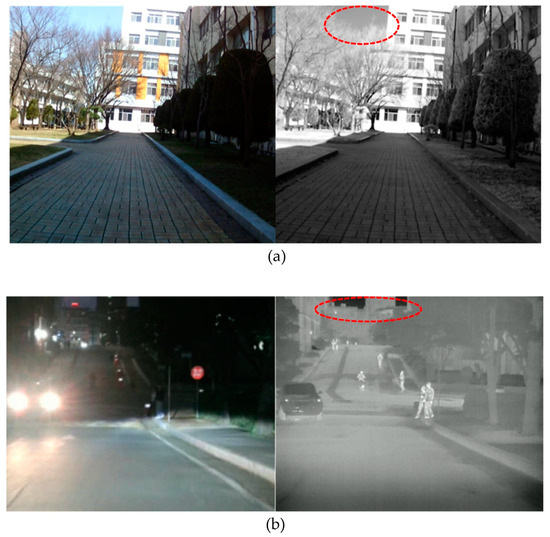
Figure 4.
Comparison between the NIR and LWIR images, the sky area (red circle) in the NIR image appears in gray tones, while the sky area in the LWIR image appears black. (a) Visible-light and NIR images, (b) visible-light and LWIR images.
LWIR images may contain unnecessary black regions, such as a sky area. To address this issue, the input images are preprocessed using inverse and difference images. The difference between the LWIR and visible-light images is considered during preprocessing, with an emphasis on visible objects in LWIR images but not in visible-light images. The objective is to enhance the quality of the fused image by inversely transforming the dark areas. Additionally, a bilateral filter is applied to reduce the noise that may exist in the original LWIR image and improve the final LWIR input image. The code used in this process is presented in Algorithm 1, and the processed result is displayed in Figure 5.
| Algorithm 1. Pseudocode for inversely transforming the black-region pixels in LWIR images |
| Inverse LWIR images for image fusion |
| Input: vis: visible grayscale image ir: LWIR grayscale image Output: ir_inv_processed: processed LWIR image with inverse detail emphasis # Invert the LWIR image 1: inv_ir = 255 − ir # Clip negative values to emphasize IR-dominant regions 2: dff_img = max(ir − vis, 0) # Remove low-frequency components using inverse IR 3: dff_img_2 = max(dff_img − inv_ir, 0) # Combine high-frequency details with smooth inverted IR 4: add_img = dff_img_2 + inv_ir # Denoise using edge-preserving bilateral filter 5: ir_inv_processed = BilateralFilter(add_img) # Result of image 6: return ir_inv_processed |
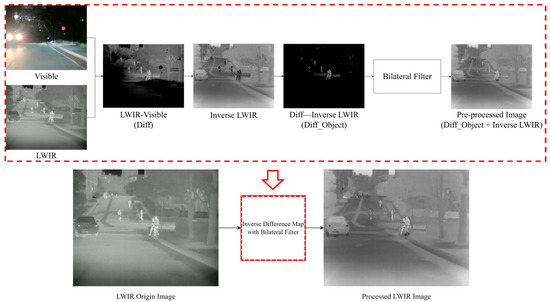
Figure 5.
LWIR input image after preprocessing.
2.2. Visisble-IR Image Fusion
Prior to image synthesis, extracting detail components to preserve the features that constitute multi-band images is crucial. Multi-band image synthesis captures and accurately extracts the contours of invisible objects in the visible-light image. Traditional detail extraction methods primarily decompose an image using the Laplacian–Gaussian pyramid, an algorithm that decomposes the input image into multiple scales by Gaussian blurring, up/down sampling, and difference images. This process enables the detailed information obtained from the different images to effectively extract the contours of objects appearing in the IR image, and by combining this with the detailed information from the visible-light image, an improved synthesized image can be generated.
However, the traditional Laplacian–Gaussian pyramid method has limitations in terms of extracting fine details. To overcome this, the contourlet transform, which can extract directional components, has been introduced. Contourlet transform effectively captures directional details, thereby increasing the sophistication of image synthesis and enhancement. Accurate image synthesis and enhancement processes can be implemented using the extracted detailed information. In this study, image synthesis is conducted via the process outlined in Figure 6 for image detail extraction, synthesis, and enhancement.
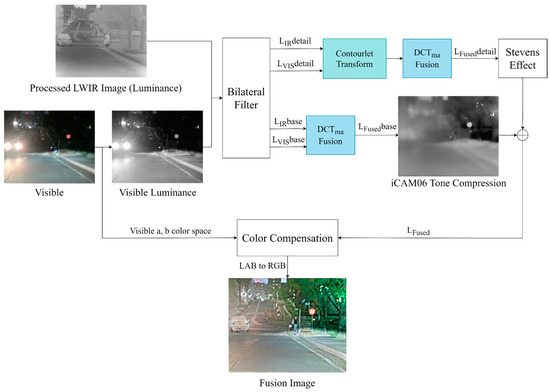
Figure 6.
Proposed LWIR fusion method.
This study developed an algorithm for fusing LWIR and visible-light images and proposed a method that can be applied to NIR and visible-light image fusion. To achieve this, the traditional synthesis methods based on contourlet transform, PCA, and iCAM06 were improved. In the existing fusion approach, the base region was used as the visible-light base image, and only the detail region was synthesized using PCA for visible-light and IR detail images [20]. However, the proposed improved method introduces a new DCT-based fusion technique to combine the base and detail components.
In the traditional synthesis method, PCA is used to compute the most influential weights from each image, and based on these, the base and detail images of visible-light and IR are fused. However, if the detail image contains several zero pixels, noise is introduced, and the darkness of the resulting image increases. To overcome this limitation, a DCT-based image fusion method is proposed.
In DCT-based fusion, the frequency components of an image are separated into DC and AC components [22]. The DC component corresponds to the low-frequency region of the image and primarily handles brightness information, whereas the AC component represents the high-frequency region, containing detailed information such as contours. Herein, after applying DCT transformation, the visible-light and IR images are fused via the following approach. The DCT-based fusion technique allows for the application of various fusion algorithms, and herein, the method of averaging the brightness information of the two images to adjust the overall brightness difference is adopted. This can be expressed using Equation (1).
where represents the fused DC component, denotes the DC component of the visible-light image, and refers to the DC component of the IR image.
The AC component is fused by selecting the one with the more distinct contours or details between the two images. To achieve this, the size, contrast, or energy of the AC components is used to determine which image contains dominant details. In this study, the AC components of the two images are fused based on the magnitude of the AC component, as expressed in Equation (2).
where represents the synthesized AC component, is the AC component of the visible-light image, and is the AC component of the IR image.
This method allows the details of both images to be preserved while emphasizing the contours. The approach, known as DCTma, which averages the DC components and selects the AC components, demonstrated the highest fusion quality in experimental results, and this method was chosen as the optimal fusion technique in this study. Figure 7 displays the results obtained from combining the base and detail images, decomposed through contourlet transform, using the DCT fusion method.
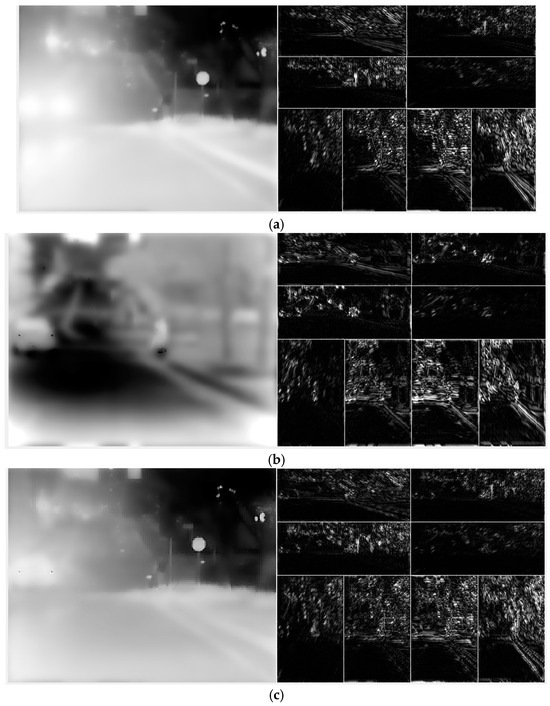
Figure 7.
Extraction of directional detail components and synthesis of base and detail components using contourlet transform. Decomposition results of the (a) visible-light, (b) LWIR images, and (c) images resulting from the synthesis of the base and detail components.
The pseudocode presented in Algorithm 2 explains the DCT fusion method applied herein. First, the visible-light and IR images are divided into 4 × 4 blocks. The DC components of each band are fused using the average value, whereas the AC components are synthesized by selecting the larger value between the two images.
| Algorithm 2. Pseudocode for DCT-based fusion |
| DCT-based image fusion |
| # List of terms: Output: Visible or IR image divided into blocks of a specific size : Discrete cosine transform : DCT coefficients of the visible or IR image Selected DCT coefficients from the visible and IR images : Size of the image : Fused image obtained by processing the visible and IR DCT coefficients on a block-by-block basis # Block-wise decomposition: (1) Selection of AC components: |
The base and detail images synthesized using the DCT fusion method (DCTma) are corrected based on the iCAM06 framework. Tone mapping is applied to the base image to adjust image brightness, yielding a visual effect similar to that of HDR images. Subsequently, the Stevens effect is applied to the detail region based on the adjusted base image, enhancing the overall visibility of details.
iCAM06 is a tone mapping algorithm designed to make low dynamic range (LDR) images appear as high dynamic range images. This algorithm operates by estimating the brightest white point in the LDR image and calculating a new white point to enhance brightness and contrast. Herein, visible-light and IR images were divided into base and detail regions and subsequently fused. The tone mapping algorithm was specifically applied to the base image, which contains fundamental information. The visible-light and IR images were treated as low- and high-exposure images, respectively. Via tone mapping based on these two images, the image quality was effectively improved.
Unlike the original iCAM06, which transforms LDR images in RGB channels into the XYZ color space, RGB channels could not be directly used owing to the inclusion of IR images. Therefore, all input images were converted into the LAB color space, and iCAM06 tone mapping was performed in the luminance channel. Chromatic adaptation was redesigned to adapt the luminance components between the visible-light and IR fused image and the visible-light image based on the values of the fused and visible-light images before establishing the final white point. This process is briefly depicted in Figure 8.
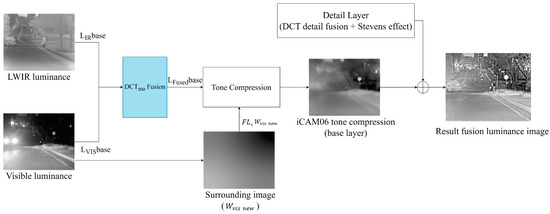
Figure 8.
Block diagram for generating base layer tone compression of the visible-light and IR fused image based on the iCAM06 process (in Figure 6. ).
To calculate tone compression in the luminance channel, three pieces of information must be determined based on the visible-light image, as expressed in Equation (3).
where represents 20% of the luminance channel in the surrounding visible-light image, denotes the surrounding visible image (instead of the white point) of the visible-light image, is calculated based on La and used to compute , and is the factor of the luminance-dependent power function.
The surrounding image ( is calculated based on the luminance channel and serves as a reference point for adjusting the brightness of the image. Tone compression was conducted based on and is expressed using Equation (4).
where is the final tone mapping image (resulting fusion luminance image), is the base image of the visible-light and IR fused image generated by DCT fusion, and is the surrounding image of the visible-light image.
Figure 9 compares the synthesis results based on block size. When the block size was 2, the noise was minimal; however, the detailed representation of the road surface was insufficient. By contrast, although some noise appeared in the sky region, the detailed representation of the road surface and building improved considerably when the block size was 4. When the block sizes were set to 8 and 16, the noise increased sharply, thereby deteriorating the overall image quality. In conclusion, using a 4 × 4 block size minimized noise while maximizing the quality of the synthesized image. This indicates that the most prominent details from both images can be effectively combined, balancing the advantages of both visible-light and IR images.
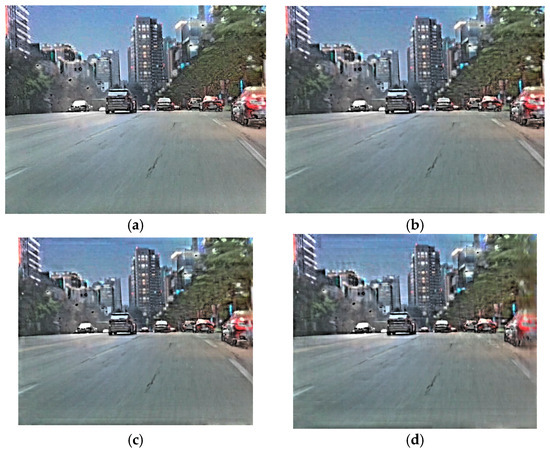
Figure 9.
Comparison of the resulting images based on block size: (a) 2 × 2, (b) 4 × 4, (c) 8 × 8, and (d) 16 × 16 block sizes.
2.3. Fused Image with Image Translation Modules
To enhance nighttime images using the proposed fusion method, two image translation methods were applied. The first method applies the base night-to-day module, using the existing SLAT image processing technique to enhance the overall brightness of the image [11]. The second translation module employs the SSR image processing technique to preprocess all training datasets and improve image sharpness related to object identification [25].
Figure 10 displays the proposed block diagram, depicting the image translation method following image fusion. The proposed method generates a base component to set the training direction for improving the fused images obtained from the two sensor modules and forms a paired dataset with the real daytime images to enhance overall brightness (base night-to-day module [11]). This method improves contrast through training from nighttime to daytime while learning details to enhance object contour identification (multi-scale SSR module [25]), thereby distinguishing this method from the previously proposed training translation methods.
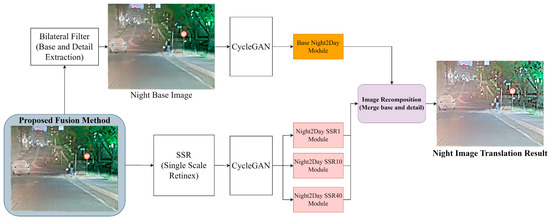
Figure 10.
Block diagram of the process applied to improve image quality through image translation using the proposed method after image fusion.
Additionally, the training dataset of the multi-scale SSR module differs in composition from those of previous methods. The proposed method learns the transformation directionality based on nighttime and daytime images while maintaining the basic structure of the nighttime-daytime paired dataset, including SSR1, SSR10, and SSR40.
The main object of training the base night-to-day translation module is to ensure that the sharpness of the nighttime images matches that of the daytime images. To achieve this, a training dataset for converting nighttime to daytime is used to improve object visibility in nighttime images. After training in an unpaired manner using the proposed synthesized image data augmentation technique, a paired dataset consisting of generated fake nighttime images and real daytime images was prepared. This training method enhances details while preserving the original color and objects of the input images. The block diagram shown in Figure 11 displays the process of generating fake nighttime images through unpaired CycleGAN training.
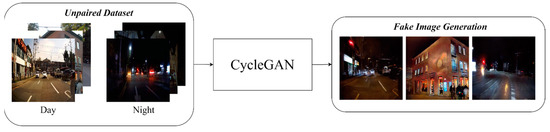
Figure 11.
Generated fake night images for pair training.
As shown in Figure 12, the night-to-day translation module used in this study first processes the daytime image using SLAT to increase the distinctness of the object shapes. The fake nighttime images generated from the unpaired training module are subsequently blurred using a bilateral filter and paired with the daytime images processed by SLAT to generate a day-night paired dataset for CycleGAN-paired training.
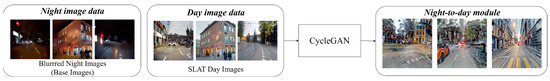
Figure 12.
Training process using the base night-to-day image translation paired dataset.
To simultaneously implement daytime conversion training and detail enhancement, SLAT processing was applied to the real daytime images corresponding to the blurred fake nighttime images to generate the paired dataset. SLAT processing is an image processing technique that increases local contrast while preserving detail regions [26]. Herein, by combining unpaired CycleGAN training, bilateral filtering, and SLAT processing to generate the paired dataset, the details were enhanced while preserving the original color of and objects in the input images.
Subsequently, paired CycleGAN training was performed using the SLAT-processed real daytime images and the fake nighttime base images generated via unpaired CycleGAN training. Therefore, the generated paired CycleGAN (base night-to-day model) effectively enhanced the local contrast of the daytime images, restored the details, and improved object identification capabilities.
The base night-to-day model enhances details and effectively represents objects but may introduce noise. Excessively enhancing details can increase the prominence of noise in the final image; therefore, applying image processing techniques that reduce noise while preserving the details is important. Therefore, as shown in Figure 13, a post-processing step is applied to reduce noise in unnecessary areas in the base night-to-day model.
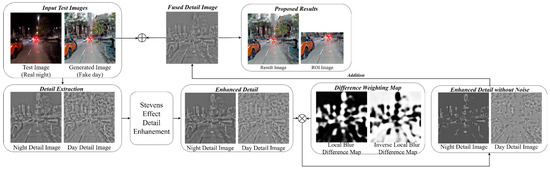
Figure 13.
Post-processing for noise-reduced images generated by the base night-to-day image translation.
Using the synthesized images from the proposed method with the base night-to-day module as test input images, the image translation process ensures that unnecessary objects, such as trees or traffic lights, are not generated during conversion. In addition to this module, the multi-scale SSR module [25], which will be addressed by the proposed method, was used to enhance the sharpness of the objects.
The key difference between the proposed method and traditional base night-to-day image translation is the generation of images through the base night-to-day translation module to determine the training direction for improving the fused images obtained from the two sensor modules. This approach enhances overall brightness while learning from nighttime to daytime. Additionally, the idea of a training module based on the SSR dataset in the detail component is adopted to further strengthen detail training and object contour identification. This is the major distinction from the previously proposed learning translation methods. As shown in Figure 14, the composition of the training dataset is different. The proposed method trains the transformation direction based on nighttime and daytime images while maintaining the basic structure of the nighttime–daytime training-paired dataset, including SSR1, SSR10, and SSR40.
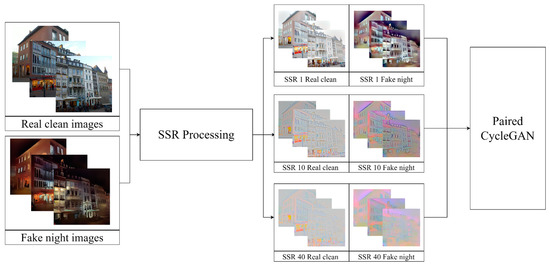
Figure 14.
Multi-layer SSR pair training for day-night detail training.
The final translated image, as shown in Figure 15, is a composition of all the output images generated from the base night-to-day and SSR night-to-day translation modules. To enhance the brightness of the night-to-day translation module, a detailed image was added based on the base image of the base night-to-day translation module. This yielded a synthesized image with better object identification compared to the previous synthesis results.
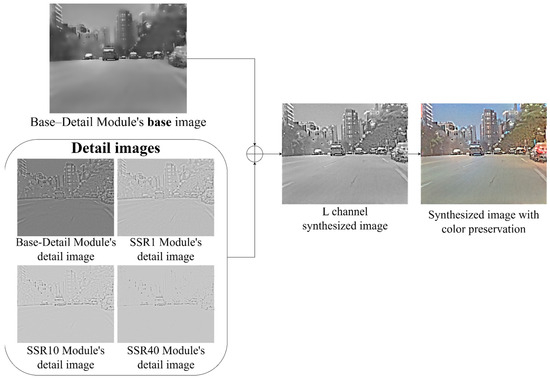
Figure 15.
Process of image translation for the synthesized images obtained through two methods using the image translation modules.
The image reconstruction depicted in Figure 15 represents the process of transforming test images using the modules trained using the proposed method. In this process, base images are generated for the base–detail night-to-day module by applying blur processing to the test images, and SSR processing is applied to each layer of the multi-layer SSR module. That is, the test process follows the same approach as that used in the training phase. Each module generates a result image, providing a total of four output images. These four generated images are subsequently synthesized into a single transformed image. Before synthesizing the layered fake images, the images are first converted to the LAB color space, and decomposition and synthesis are conducted in the luminance channel.
where represents the final image, is the base image obtained from the base night-to-day module, and represents the detailed images separated by a bilateral filter. Here, sequentially represents a total of four modules, including the base night-to-day and three SSR night-to-day modules, where i = 1 refers to BND and i = 2, 3, 4 refers to the three SSR layers. The base image of the final result is composed of the base image obtained from the night-to-day module. The base component in SSR σ1 is closer to the original than the base components in other sigma scales. Additionally, modules using high sigma scales contain increased noise and halo effects in the base image, possibly negatively impacting the synthesis results. By contrast, modules with low sigma scales minimize these effects, allowing for a large proportion of the base image information to be used when constructing the final result image. The details extracted from the sigma scale modules are combined to generate the final image, which is subsequently processed through a normalization step, mapping values between 0 and 255 to complete the final image. The details extracted from each module contribute equally to the final result via this normalization process.
Figure 16 compares the synthesized image, created by fusing visible spectrum and long-wave infrared images using the proposed method, with the corresponding image obtained via the night-to-day image translation module. The final image, processed with the day–night translation module, enhances shadowed areas by increasing their brightness, thereby improving the visibility of objects in these regions. Overall, this reconstruction approach effectively brightens the LWIR-fused image and reduces noise. To evaluate the performance of the proposed method against existing techniques, a quantitative comparison was conducted using a test set of 217 images.
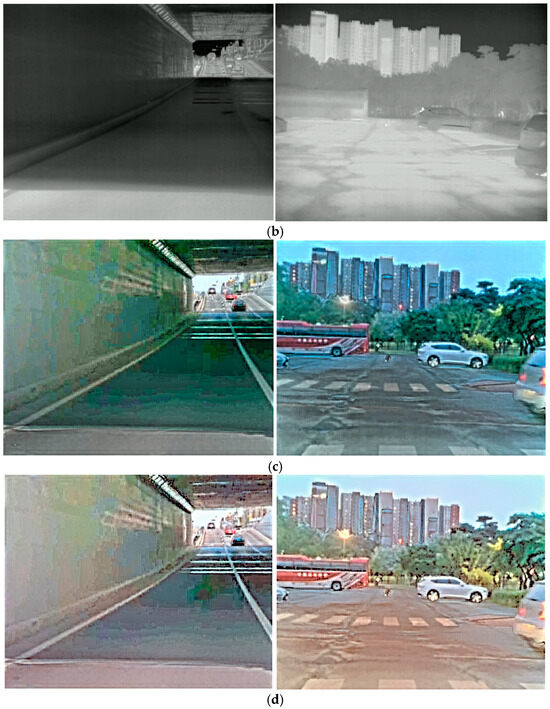
Figure 16.
Comparison of shadow region enhancement between the previously proposed method and the method with the added day–night conversion module: (a) visible light image, (b) long-wave infrared image, (c) contourlet-DCTma fusion result from the proposed method, and (d) contourlet-DCTma fusion result with the day–night conversion module integrated.
3. Simulation Results
3.1. Visible and IR Image Alignment
This study confirmed that the positions of objects in the LWIR images captured using the equipment do not align. When the positions of objects differ, obtaining accurate image fusion results becomes challenging, necessitating the implementation of an image alignment process. To address this, the ASIFT algorithm was used to align the images, using the computed homography matrix in the process [27]. LWIR images, which are thermal images, have significantly different characteristics from those of NIR and visible-light images; therefore, finding sufficient feature points for smooth alignment using the standard SIFT [28] algorithm is difficult. Hence, the ASIFT algorithm was used to extract feature points, enabling highly accurate alignment with the visible-light images.
The ASIFT algorithm is an extended version of SIFT that simulates all possible image views to extract several keypoints. ASIFT is designed to maintain invariance to affine transformations and handles two camera angle parameters, namely latitude and longitude, which are disregarded in the original SIFT algorithm. By simulating changes in the camera viewpoint from the original image, ASIFT generates multiple views and subsequently applies the SIFT algorithm to extract keypoints. ASIFT effectively handles all six affine transformation parameters by applying the SIFT method to the generated images for comparison. Therefore, ASIFT provides mathematically complete affine invariance and can extract more keypoints than standard SIFT. Figure 17 displays the resulting images when matching using the SIFT and ASIFT algorithms.
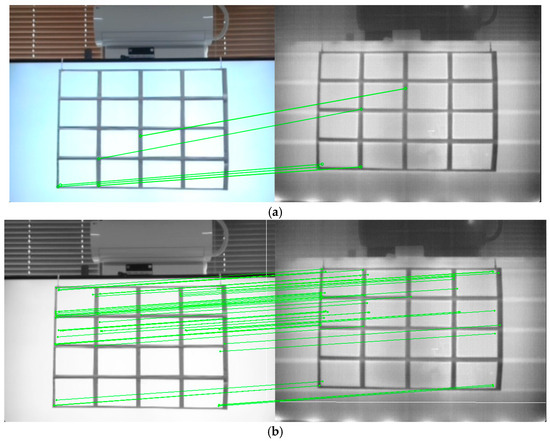
Figure 17.
Results of feature point matching using the SIFT and ASIFT algorithms: (a) SIFT and (b) ASIFT matching.
The image alignment method used for visible-light and IR images in this study is summarized as follows. ASIFT is an extended version of SIFT that provides invariance to affine transformations and demonstrates strong image-matching performance across various camera viewpoints. In particular, for aligning LWIR with visible-light images, the use of the ASIFT algorithm, instead of the standard SIFT algorithm, is essential. Although ASIFT incurs a higher computational cost than SIFT, the improvement in image-matching performance justifies this cost; therefore, ASIFT is particularly useful for aligning visible-light and IR images.
3.2. Comparison of Image Quality Assessment with Conventional Methods
Objective evaluation metrics are essential for assessing the proposed image processing methods. Herein, the enhanced images were evaluated in comparison with those obtained from existing visible-light and IR image processing methods using image quality assessment methods. The image evaluation was based on image quality and sharpness metrics. The main objective of this study is to represent objects clearly within images, making sharpness metrics crucial. Additionally, brightness and contrast were considered important evaluation factors to enhance object visibility. Therefore, relevant image quality metrics were included in the evaluation. A total of six image evaluation metrics were used, four of which were image quality metrics, two metrics were related to image distortion, two assessed image contrast, and two were sharpness metrics.
BRISQUE is a metric based on Natural Scene Statistics that evaluates image distortion by measuring the differences in pixel intensity distributions to assess image quality [29]. This metric is particularly sensitive to various image distortions and calculates the quality score using an SVM model. PIQE focuses on analyzing the pixel contrast and relative brightness of an image to evaluate the degree of distortion [30]. This metric is advantageous for detecting sharpness and noise and assessing the structural consistency of the image.
CEIQ is a metric that evaluates contrast distortion in an image [31]. CEIQ improves contrast using histogram equalization and subsequently calculates SSIM, entropy, and cross-entropy to assess quality. MCMA is a method that optimizes image contrast while minimizing artifacts, evaluating dynamic range usage, histogram shape distortion, and both global and local pixel diversity [32]. This method naturally enhances contrast without excessive contrast adjustment.
LPC-SI is a no-reference metric that evaluates image sharpness by analyzing high-frequency components and measuring local phase coherence [33,34]. Sharp images exhibit strong phase coherence in the high-frequency region, which can be used to assess sharpness. S3 is a metric that evaluates sharpness by simultaneously considering both spectral and spatial changes in the image [35]. It calculates these changes in each image block and combines them to derive the final sharpness score.
These evaluation metrics objectively assess the effectiveness of the proposed image processing method and improve image quality. Each metric uniquely evaluates image distortion and sharpness, enabling accurate quality analysis. A summary of the evaluation metrics is listed in Table 2.
Table 2.
Summary of the image evaluation metrics.
The visible-light and IR images obtained using the proposed method were compared with those obtained using the existing deep learning- and algorithm-based methods to evaluate the fusion effectiveness of the proposed method. The first comparison included the DenseFuse method, which uses dense blocks to ensure continuous information flow between layers, preserving the important features of the visible-light and IR input images.
Algorithm-based methods were included in the comparison. The Laplacian–Gaussian pyramid entropy fusion method applies the Laplacian pyramid to capture multi-scale details and subsequently combines the key features from both modalities via entropy-based fusion. This method effectively balances the details between IR and visible-light images. Similarly, the Laplacian pyramid PCA fusion method uses the Laplacian pyramid combined with PCA to reduce dimensionality, improving sharpness and contrast in the fused result while maintaining essential image features.
Another algorithm-based method, low-rank fusion, separates the image into low-rank (global structure) and saliency (local structure) components. The low-rank component is fused using a weighted average, whereas the saliency component is combined using a sum strategy, enhancing global consistency and local details.
Moreover, methods using the contourlet transform were evaluated. The contourlet-PCA method uses the contourlet transform to extract multi-directional and multi-scale features and subsequently fuses features through PCA, providing an effective means to preserve edge and texture information. The method proposed in this study, contourlet-DTC, uses DCT fusion instead of PCA. This method particularly emphasizes high-frequency components, focusing on contrast preservation and detail enhancement.
Another proposed method integrates contourlet transform and DCT fusion and enhances the fusion results by adding a CycleGAN-based day-to-night transformation module, which is highly effective in improving image visibility in low-light environments. Additionally, an SSR module is used to improve illumination handling and detail preservation. The combination of these techniques, particularly the integration of contourlet-DCT fusion and CycleGAN-SSR enhancement, provides a superior fusion method that considerably improves sharpness, contrast, and overall image clarity with respect to those obtained from existing methods. This method is particularly suitable for applications such as surveillance and navigation in low-visibility environments.
3.3. Specification and Processing Time
To perform image translation using the proposed fused images, a preprocessing step is required. After all steps are processed in parallel, analyzing the images generated at a resolution lower than SD quality (560 × 448) revealed that the most time-consuming preprocessing method, SSR processing, required approximately 0.993 s/image (with a total time of 2.98 s required for the three SSR modules). The most time-consuming task in the hierarchical SSR module, the base–detail module, required 0.254 s. Additionally, post-processing for image reconstruction required approximately 0.223 s. The total time for image translation was approximately 1.47 s. Next, the algorithm-based DCT and PCA syntheses required an average of 4.455 and 25.852 s/image, respectively, indicating that PCA synthesis required approximately five times longer than DCT synthesis.
Summing the total time required for image synthesis and image translation yielded a total processing time for image translation using DCT synthesis to be 5.925 s, whereas PCA synthesis required 27.322 s. Therefore, a significant performance difference was observed between the synthesis algorithms.
The CycleGAN-based image-to-image translation method was implemented on a personal computer with the following specifications: Intel i9-10980XE 3.00 GHz CPU, 256 GB RAM, and NVIDIA GeForce RTX 3090 GPU. The proposed deep learning network was developed using the CycleGAN framework based on PyTorch 1.11.0. Optimization was conducted using the Adam optimizer, with β parameters set to 0.5 and 0.999. The batch size was set to 1, and the learning rate was initialized at 0.0002, decreasing linearly every 100 epochs. The total number of training epochs was set to 250, and the image crop size was fixed at 256 × 256 pixels.
The unpaired dataset used to train the CycleGAN day-to-night translation module consisted of 6450 and 7744 daytime and nighttime images, respectively. Of the daytime images, 1200 were collected from the proprietary dataset, and the remaining 5250 were obtained from the Dark Zurich [36] and Adverse Conditions Dataset with Correspondences (ACDC) datasets [37]. Of the nighttime images, 5400 were collected from the proprietary dataset, and the remaining 2344 were obtained from the Dark Zurich and ACDC datasets.
The dataset used to train the base–detail model and the three different sigma scale SSR models consisted of 4852 real daytime and synthesized nighttime images each. Of the real daytime images, 1005 were collected from the proprietary dataset, and the remaining 3847 were obtained from the Dark Zurich and ACDC datasets. Tests were conducted using real images captured via the proposed camera setup, and approximately 217 images were evaluated and compared. A summary of the times required and the datasets is listed in Table 3.
Table 3.
Summary of the datasets and processing times of the CycleGAN-based deep learning modules.
3.4. Comparison of the Image Results Obtained from IR Fusion
To evaluate the individual contributions of each module in the proposed method, an ablation study was conducted focusing on four key components: (1) detail extraction method (Laplacian vs. contourlet), (2) fusion strategy (PCA vs. DCT), (3) the application of iCAM06 tone mapping, and (4) the number of sigma scales used in the SSR module during the image translation stage. The results are summarized in Table 4.
Table 4.
Ablation study of the proposed method: effects of fusion strategy, iCAM06, and SSR scales in image translation (↓: Lower values are better, ↑: Higher values are better, ○: Used, x: Not used).
First, when comparing Laplacian-PCA and contourlet-PCA, the contourlet-based method outperformed in overall quality metrics such as BRISQUE (36.545 → 34.741), PIQE (55.241 → 46.317). However, detail-specific indicators such as LPC-SI (0.876 → 0.861) and S3 (0.084 → 0.067) showed a slight decline. Although contourlet decomposition inherently captures multi-directional and multi-resolution information, the Laplacian-based approach may emphasize certain high-frequency components more strongly due to its explicit multi-scale filtering mechanism. Nonetheless, since contourlet effectively extracts directional structural features, its integration with iCAM06 tone mapping, particularly leveraging the Stevens effect, can further enhance detail representation in downstream stages.
Second, in the comparison between PCA-based fusion and DCT-based fusion strategies, the DCT approach yielded superior performance in detail preservation. Specifically, the LPC-SI score improved from 0.906 to 0.949, and the S3 score increased from 0.140 to 0.275. These results suggest that the block-based nature of DCT better retains localized structural and high-frequency information than the global projection used in PCA.
Third, the effectiveness of the iCAM06 tone mapping module was validated by applying it to contourlet-PCA fusion. With iCAM06, BRISQUE decreased from 34.741 to 30.563, PIQE from 46.317 to 31.761, and CEIQ increased from 3.120 to 3.380. These results demonstrate that iCAM06 significantly enhances local contrast and restores perceptual color consistency, especially in regions dominated by visible light.
Fourth, the effect of varying the number of sigma scales in the SSR module within the CycleGAN-based image translation stage was analyzed using 1, 2, and 3 scales. The configuration using three scales achieved the best balance between detail enhancement and halo suppression. In this setting, S3 reached the highest score of 0.214, while LPC-SI and PIQE also achieved their best values at 0.961 and 22.186, respectively. This indicates that using three parallel sigma scales effectively reinforces structural details while minimizing artifacts.
The final proposed method achieved the best performance among all configurations in PIQE and LPC-SI and demonstrated competitive results in other quality metrics such as BRISQUE and CEIQ. This confirms the method’s strength in preserving perceptual quality and fine detail. The consistently high performance across various evaluation criteria empirically validates the synergy of the proposed framework, integrating contourlet-DCT-based fusion, iCAM06 tone mapping, and a 3-scale SSR module.
To objectively compare the proposed method, LWIR images were used as an input with the proposed inverse difference map method applied, yielding results from the conventional yielding results from the conventional and proposed methods. The proposed method synthesized IR images that passed through the headlights, increasing the clarity of object separation. As shown in Figure 18, the contourlet transform effectively enhances the contours of the vehicle and the road conditions; therefore, understanding the road situation while driving becomes easy.
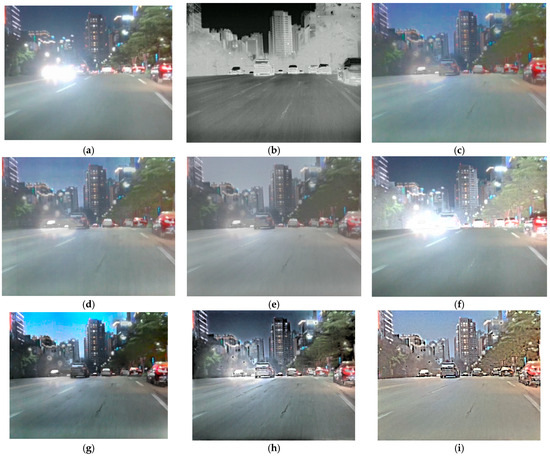
Figure 18.
Comparion of the visible-light and IR fusion images: (a) visible-light image, (b) LWIR image, (c) Laplacian–Gaussian entropy, (d) latent low rank, (e) Densefuse, (f) SWIN fusion, (g) Laplacian-PCA, (h) contourlet-PCA, and (i) proposed method for image fusion and translation.
Figure 19 depicts the improvement in the visible-light images that are obscured by strong headlights. The proposed method successfully revealed the position of the road mirror behind the headlights and enhanced contrast in tree-covered areas, improving object detection capabilities. This highlights a significant improvement in detection performance with respect to those of conventional visible-light methods.
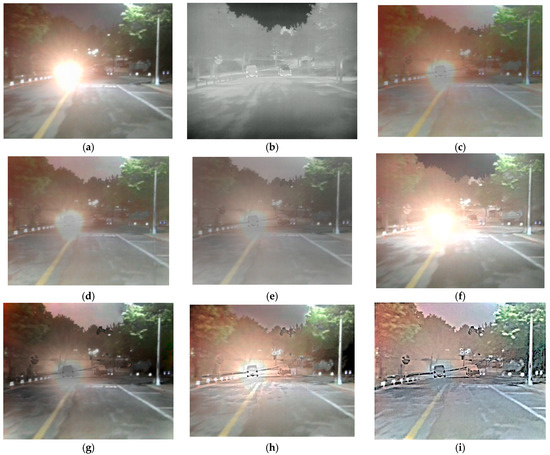
Figure 19.
Comparison of the visible-light and IR fusion images: (a) visible image, (b) LWIR image, (c) Laplacian–Gaussian entropy, (d) latent low rank, (e) Densefuse, (f) Swin fusion, (g) Laplacian-PCA, (h) contourlet-PCA, and (i) proposed method for image fusion and translation.
Figure 20 illustrates the advantages of applying the proposed method to a scenario in which sunlight directly enters a tunnel. The characteristics of the IR image allowed for the identification of vehicles inside the tunnel, and the proposed method better represented the road situation, aiding the driver. Additionally, the details of the tunnel were captured more accurately than when using the previous methods.
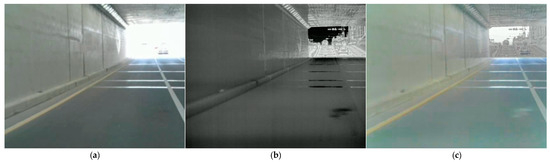
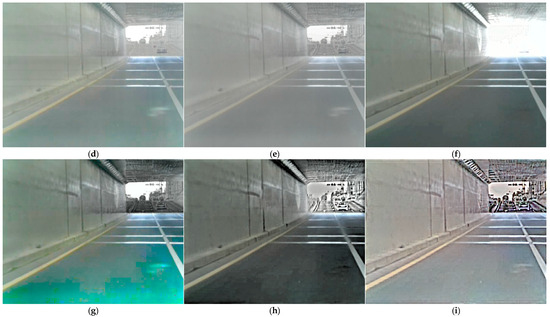
Figure 20.
Comparison of the visible-light and IR fusion images: (a) visible image, (b) LWIR image, (c) Laplacian–Gaussian entropy, (d) latent low rank, (e) Densefuse, (f) Swin fusion, (g) Laplacian-PCA, (h) contourlet-PCA, and (i) proposed method for image fusion and translation.
Figure 21 illustrates that during nighttime driving, oncoming headlights can impair the driver’s field of view, making it difficult to accurately identify pedestrians or objects in poorly lit areas. LWIR imaging, however, can capture information in these regions. The proposed method effectively fuses the advantages of both input images, enabling simultaneous object detection in both dark regions and brightly illuminated areas (e.g., headlight zones). Nonetheless, increasing the brightness in the DCT transformation process and the night-to-day translation module results in noise in dark areas (e.g., regions with trees).
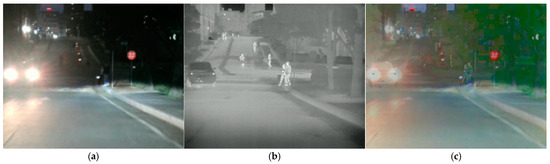
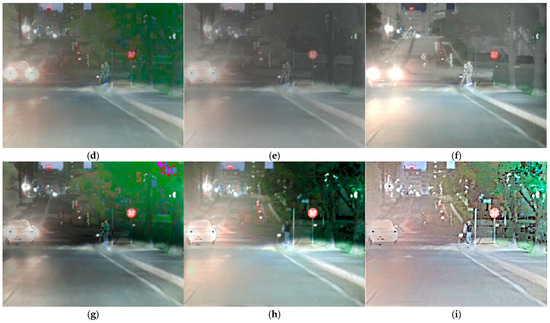
Figure 21.
Comparison of the visible-light and IR fusion images: (a) visible image, (b) LWIR image, (c) Laplacian–Gaussian entropy, (d) latent low rank, (e) Densefuse, (f) Swin fusion, (g) Laplacian-PCA, (h) contourlet-PCA, and (i) proposed method for image fusion and translation.
Figure 22 shows that in areas without streetlight illumination, pedestrians are present, and road cracks are visible. The proposed method accurately captures the contours of pedestrians as well as the road conditions, potentially providing significant support in driving scenarios.
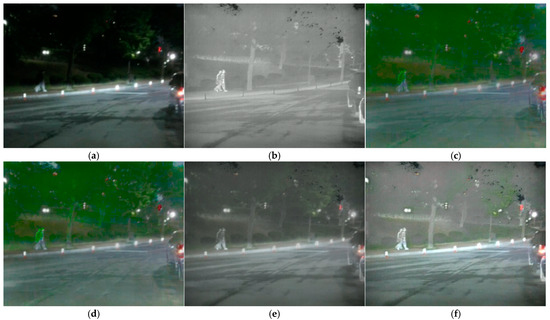
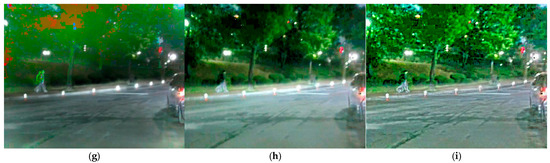
Figure 22.
Comparison of the visible-light and IR fusion images: (a) visible image, (b) LWIR image, (c) Laplacian–Gaussian entropy, (d) latent low rank, (e) Densefuse, (f) Swin fusion, (g) Laplacian-PCA, (h) contourlet-PCA, and (i) proposed method for image fusion and translation.
Figure 23 demonstrates that, in the left section of the image, the proposed method most effectively captures the surroundings of the road in areas lacking illumination. In nighttime driving scenarios, object identification is important, and the resulting image from the proposed method clearly delineates the details of obscured trees and their surrounding environment.
Figure 23.
Comparison of the visible-light and IR fusion images: (a) visible image, (b) LWIR image, (c) Laplacian–Gaussian entropy, (d) latent low rank, (e) Densefuse, (f) Swin fusion (g) Laplacian-PCA, (h) contourlet-PCA, and (i) proposed method for image fusion and translation.
Finally, Table 5 compares the scores of the result images using image quality metrics. The proposed method received the highest BRISQUE and PIQE scores, which evaluate image distortion and naturalness, and ranked second in terms of brightness and contrast metrics such as CEIQ and MCMA, demonstrating significant image improvement. Additionally, the proposed method exhibited excellent performance in terms of sharpness metrics, confirming the ability to enhance object location and contours.
Table 5.
Results comparing evaluation metrics for IR fusion and translation. (↓: Lower values are better, ↑: Higher values are better).
To validate the statistical significance of performance differences among the eight fusion methods, ANOVA and Tukey’s HSD tests were conducted using six image quality metrics: BRISQUE, PIQE, CEIQ, MCMA, LPC-SI, and S3. In all cases, the ANOVA p-values were well below 0.05 (e.g., BRISQUE: 1.83 × 10−292), indicating statistically significant differences.
The proposed method consistently demonstrated superior performance across most metrics. Tukey’s HSD test results revealed that it achieved the lowest BRISQUE and PIQE scores, with non-overlapping confidence intervals confirming statistical significance over methods such as Densefuse, SWIN fusion, and Laplacian-based approaches. For contrast-related metrics (CEIQ and MCMA), it performed comparably to contourlet-based methods while significantly outperforming other baselines. In sharpness evaluation, the proposed method ranked first in LPC-SI and second in S3, demonstrating strong preservation of both spatial and spectral details. These results, validated through ANOVA and Tukey’s HSD, confirm that the proposed approach provides statistically robust improvements in image quality compared to existing techniques. Turkey’s HSD graph is shown in Figure 24.
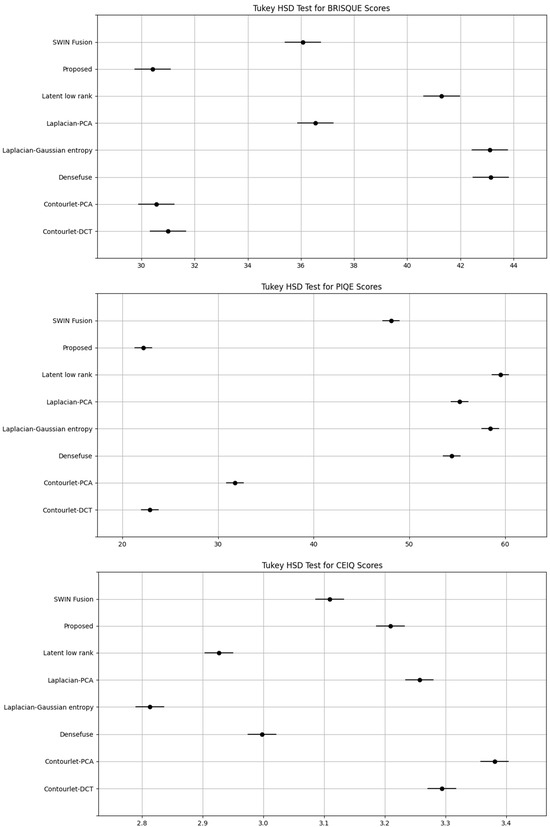
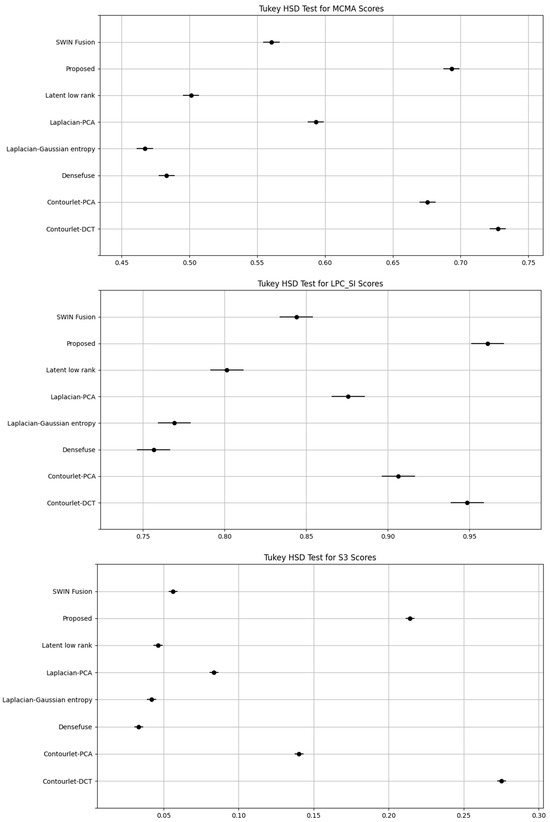
Figure 24.
Tukey’s HSD graphs for six image quality metrics: if the solid lines (representing the 95% Confidence Intervals (CI)) do not overlap, it indicates that the differences are statistically significant.
To further evaluate the effectiveness of the proposed method under diverse nighttime conditions, a comparative analysis was conducted, with a particular focus on foggy environments. As illustrated in Figure 25 and Figure 26, the evaluation was performed using the publicly available M3FD dataset [38], rather than images captured with the proposed camera system. To ensure a fair comparison, no additional preprocessing was applied to the LWIR images, and the original conditions of the M3FD dataset were preserved. Methods incorporating the contourlet transform generally exhibited superior infrared (IR) representation, enabling more accurate recovery of fine details obscured by fog compared to other techniques. Notably, the proposed method surpassed the contourlet-PCA approach by more effectively suppressing noise in sky regions while retaining essential details in fog-covered areas that are critical for object identification.
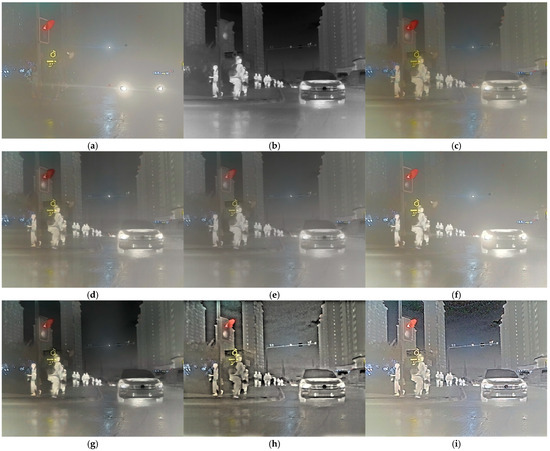
Figure 25.
Comparison of fused visible and infrared images under hazy conditions: (a) visible image, (b) LWIR image, (c) Laplacian–Gaussian entropy, (d) latent low rank, (e) Densefuse, (f) Swin fusion (g) Laplacian-PCA, (h) contourlet-PCA, and (i) proposed method for image fusion and translation.
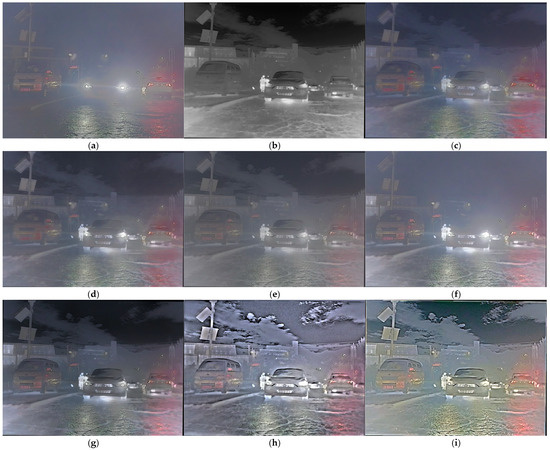
Figure 26.
Comparison of fused visible and infrared images under hazy conditions: (a) visible image, (b) LWIR image, (c) Laplacian–Gaussian entropy, (d) latent low rank, (e) Densefuse, (f) Swin fusion (g) Laplacian-PCA, (h) contourlet-PCA, and (i) proposed method for image fusion and translation.
4. Discussion
This study proposes an image processing technique that effectively enhances low-light regions in nighttime images, thereby improving object recognition and detection performance. The proposed method combines multi-band image fusion with deep learning-based image translation to enhance contrast, restore color, and recover fine details simultaneously, achieving superior image quality compared to conventional fusion methods.
In particular, quantitative evaluations using image quality metrics (BRISQUE, PIQE, CEIQ, MCMA, LPC-SI, S3), along with ANOVA-based statistical analysis, confirm that the proposed method minimizes distortion and maximizes sharpness across most indicators. These improvements are statistically significant, underscoring the effectiveness of the proposed approach.
Conventional CNN-based fusion methods, such as DenseFuse and Swin fusion primarily rely on low-level brightness information or single-scale features, which limits their ability to handle the detailed IR information, complex contrast variations, and lighting saturation commonly encountered in nighttime scenes. In contrast, the proposed method effectively separates directional and multi-resolution features via the contourlet transform and selectively retains high-frequency information using DCT-based fusion. DCT also offers lower computational complexity than PCA and better preserves local details through block-based processing. Additionally, in the image translation stage, a sigma-scale-based SSR training module enhances visibility in foggy or light-scattering regions more reliably than using CycleGAN alone.
Despite the strong performance of the proposed method, some limitations remain. SSR, used during CycleGAN training for detail enhancement, may cause halo artifacts in high-contrast areas. To address this, future work will consider halo-suppression strategies such as the contrast/residual decomposition approach. Additionally, applying low-light enhancement as a preprocessing step before fusion will be explored to improve image quality in extremely dark or unevenly illuminated conditions.
Practically, the proposed method demonstrates strong potential for applications such as driver assistance systems, CCTV surveillance, and intelligent traffic monitoring. However, combining image processing with deep learning increases overall processing time, which poses challenges for real-time deployment. To overcome this, future work will explore optimized parallel architectures and lightweight implementations using FPGA or AI SoC platforms.
Moreover, while this study focused on low-light nighttime conditions, image degradation may still occur in more complex weather scenarios such as rain or snow. Future research will aim to incorporate robust restoration modules tailored for adverse weather, such as raindrop removal or diffusion-based image translation, along with sensor upgrades that support stable multi-band imaging under such conditions.
5. Conclusions
This study presents a method for improving object recognition in low-light environments through image enhancement techniques, demonstrating potential applications in autonomous driving support systems and CCTV surveillance. Under low-light conditions, IR imaging is used to enhance images, and a new camera setup method is proposed to optimize IR wavelength capture. The resulting IR images are fused with visible-light images using a multi-band fusion technique based on contourlet transform and DCT fusion. Additionally, iCAM06-based tone mapping is employed to further enhance the quality of the fused images, and the integration of night-to-day image translation modules improves image brightness, reduces noise, and enhances details.
Image quality metrics using six image quality metrics (BRISQUE, PIQE, CEIQ, MCMA, LPC-SI, and S3) showed that the proposed method outperforms conventional methods by statistically significant margins. For example, the proposed method achieved the lowest BRISQUE and PIQE scores (30.426, 22.186) and the highest sharpness in LPC-SI metrics (0.961), as confirmed by ANOVA and Tukey’s HSD tests. These results confirm that the improvements are not only visual but also statistically robust.
Despite these advantages, the method currently requires high computational resources due to the combination of image processing and deep learning modules, limiting its suitability for real-time applications. Future work will focus on optimizing the framework using FPGA or AI SoC platforms for real-time deployment. In addition, further research will extend the robustness of the method to more challenging environmental conditions such as heavy rain, fog, or snow through the integration of specialized modules and sensor design enhancements.
Author Contributions
Conceptualization, S.-H.L.; methodology, D.-M.S. and S.-H.L.; software, D.-M.S.; validation, D.-M.S. and S.-H.L.; formal analysis, D.-M.S. and S.-H.L.; investigation, D.-M.S. and S.-H.L.; resources, D.-M.S. and S.-H.L.; data curation, D.-M.S. and S.-H.L.; writing—original draft preparation, D.-M.S.; writing—review and editing, S.-H.L.; visualization, D.-M.S.; supervision, S.-H.L.; project administration, S.-H.L.; funding acquisition, S.-H.L. All authors have read and agreed to the published version of the manuscript.
Funding
This research was supported by Korea Creative Content Agency (KOCCA) grant funded by the Ministry of Culture, Sports and Tourism (MCST) in 2024 (project name: Development of optical technology and sharing platform technology to acquire digital cultural heritage for high-quality restoration of composite materials cultural heritage, project number: RS-2024-00442410, contribution rate: 50%) and the Institute of Information & Communications Technology Planning & Evaluation (IITP)-Innovative Human Resource Development for Local Intellectualization program grant funded by the Korea government (MSIT) (IITP-2025-RS-2022-00156389, 50%).
Data Availability Statement
Dark Zurich Dataset [36]: https://www.trace.ethz.ch/publications/2019/GCMA_UIoU/, 23 April 2025. ACDC Dataset [37]: https://acdc.vision.ee.ethz.ch/, 23 April 2025. M3FD Dataset [38]: https://github.com/JinyuanLiu-CV/TarDAL/, 23 April 2025. All dataset is made freely available to academic and non-academic entities for non-commercial purposes.
Conflicts of Interest
The authors declare no conflicts of interest regarding the publication of this paper.
References
- Liang, Z.; Liu, W.; Yao, R. Contrast Enhancement by Nonlinear Diffusion Filtering. IEEE Trans. Image Process. 2016, 25, 673–686. [Google Scholar] [CrossRef] [PubMed]
- Lin, Y.H.; Lu, Y.C. Low-Light Enhancement Using a Plug-and-Play Retinex Model With Shrinkage Mapping for Illumination Estimation. IEEE Trans. Image Process. 2022, 31, 4897–4908. [Google Scholar] [CrossRef]
- Yu, S.Y.; Zhu, H. Low-Illumination Image Enhancement Algorithm Based on a Physical Lighting Model. IEEE Trans. Circuits Syst. Video Technol. 2019, 29, 28–37. [Google Scholar] [CrossRef]
- Pu, T.; Zhu, Q. Non-Uniform Illumination Image Enhancement via a Retinal Mechanism Inspired Decomposition. IEEE Trans. Consum. Electron. 2024, 70, 747–756. [Google Scholar] [CrossRef]
- Wang, S.; Luo, G. Naturalness Preserved Image Enhancement Using a Priori Multi-Layer Lightness Statistics. IEEE Trans. Image Process. 2018, 27, 938–948. [Google Scholar] [CrossRef] [PubMed]
- Li, C.; Guo, C.; Loy, C.C. Learning to Enhance Low-Light Image via Zero-Reference Deep Curve Estimation. IEEE Trans. Pattern Anal. Mach. Intell. 2022, 44, 4225–4238. [Google Scholar] [CrossRef] [PubMed]
- Pang, Y.; Lin, J.; Qin, T.; Chen, Z. Image-to-Image Translation: Methods and Applications. IEEE Trans. Multimed. 2021, 24, 3859–3881. [Google Scholar] [CrossRef]
- Isola, P.; Zhu, J.Y.; Zhou, T.; Efros, A.A. Image-to-Image Translation with Conditional Adversarial Networks. In Proceedings of the 30th IEEE Conference on Computer Vision and Pattern Recognition, CVPR 2017, Honolulu, HI, USA, 21–26 July 2017; pp. 5967–5976. [Google Scholar] [CrossRef]
- Zhu, J.-Y.; Park, T.; Isola, P.; Efros, A.A. Unpaired Image-to-Image Translation Using Cycle-Consistent Adversarial Networks. In Proceedings of the IEEE International Conference on Computer Vision, Venice, Italy, 22–29 October 2017. [Google Scholar]
- Anoosheh, A.; Sattler, T.; Timofte, R.; Pollefeys, M.; Gool, L. Van Night-to-Day Image Translation for Retrieval-Based Localization. In Proceedings of the 2019 International Conference on Robotics and Automation (ICRA), Montreal, QC, Canada, 20–24 May 2019; pp. 5958–5964. [Google Scholar] [CrossRef]
- Son, D.M.; Kwon, H.J.; Lee, S.H. Enhanced Night-to-Day Image Conversion Using CycleGAN-Based Base-Detail Paired Training. Mathematics 2023, 11, 3102. [Google Scholar] [CrossRef]
- Kwon, H.J.; Lee, S.H. Visible and Near-Infrared Image Acquisition and Fusion for Night Surveillance. Chemosensors 2021, 9, 75. [Google Scholar] [CrossRef]
- Li, H.; Wu, X.J. DenseFuse: A Fusion Approach to Infrared and Visible Images. IEEE Trans. Image Process. 2019, 28, 2614–2623. [Google Scholar] [CrossRef]
- Wang, Z.; Chen, Y.; Shao, W.; Li, H.; Zhang, L. SwinFuse: A Residual Swin Transformer Fusion Network for Infrared and Visible Images. IEEE Trans. Instrum. Meas. 2022, 71, 1–12. [Google Scholar] [CrossRef]
- Li, H.; Wu, X.-J. Infrared and Visible Image Fusion Using Latent Low-Rank Representation. arXiv 2018, arXiv:1804.08992. [Google Scholar]
- Burt, P.J.; Adelson, E.H. The Laplacian Pyramid as a Compact Image Code BT—Fundamental Papers in Wavelet Theory. Fundam. Pap. Wavelet Theory 1983, 31, 532–540. [Google Scholar]
- Vanmali, A.V.; Gadre, V.M. Visible and NIR Image Fusion Using Weight-Map-Guided Laplacian–Gaussian Pyramid for Improving Scene Visibility. Sadhana Acad. Proc. Eng. Sci. 2017, 42, 1063–1082. [Google Scholar] [CrossRef]
- Son, D.-M.; Kwon, H.-J.; Lee, S.-H. Visible and NIR Image Synthesis Using Laplacian Pyramid and Principal Component Analysis. J. Sens. Sci. Technol. 2020, 29, 133–140. [Google Scholar] [CrossRef]
- Do, M.N.; Vetterli, M. The Contourlet Transform: An Efficient Directional Multiresolution Image Representation. IEEE Trans. Image Process. 2005, 14, 2091–2106. [Google Scholar] [CrossRef]
- Son, D.-M.; Kwon, H.-J.; Lee, S.-H. Visible and Near Infrared Image Fusion Using Base Tone Compression and Detail Transform Fusion. Chemosensors 2022, 10, 124. [Google Scholar] [CrossRef]
- Ahmed, N.; Natarajan, T.; Rao, K.R. Discrete Cosine Transform. IEEE Trans. Comput. 1974, C-23, 90–93. [Google Scholar] [CrossRef]
- Naidu, V. Discrete Cosine Transform Based Image Fusion Techniques. J. Commun. Navig. Signal Process. 2012, 1, 35–45. [Google Scholar]
- Kuang, J.; Johnson, G.M.; Fairchild, M.D. ICAM06: A Refined Image Appearance Model for HDR Image Rendering. J. Vis. Commun. Image Represent. 2007, 18, 406–414. [Google Scholar] [CrossRef]
- Petro, A.B.; Sbert, C.; Morel, J.-M. Multiscale Retinex. Image Process. Line 2014, 4, 71–88. [Google Scholar] [CrossRef]
- Son, D.M.; Lee, S.H. Enhancing Surveillance Vision with Multi-Layer Deep Learning Representation. Mathematics 2024, 12, 1313. [Google Scholar] [CrossRef]
- Kwon, H.J.; Lee, S.H.; Lee, G.Y.; Sohng, K.I. Luminance Adaptation Transform Based on Brightness Functions for LDR Image Reproduction. Digit. Signal Process. A Rev. J. 2014, 30, 74–85. [Google Scholar] [CrossRef]
- Yu, G.; Morel, J.-M. ASIFT: An Algorithm for Fully Affine Invariant Comparison. Image Process. Line 2011, 1, 11–38. [Google Scholar] [CrossRef]
- Lowe, D.G. Distinctive Image Features from Scale-Invariant Keypoints. Int. J. Comput. Vision 2004, 60, 91–110. [Google Scholar] [CrossRef]
- Mittal, A.; Moorthy, A.K.; Bovik, A.C. Blind/Referenceless Image Spatial Quality Evaluator. In Proceedings of the 2011 Conference Record of the Forty Fifth Asilomar Conference on Signals, Systems and Computers (ASILOMAR), Pacific Grove, CA, USA, 6–9 November 2011; pp. 723–727. [Google Scholar]
- Venkatanath, N.; Praneeth, D.; Bh, M.C.; Channappayya, S.S.; Medasani, S.S. Blind Image Quality Evaluation Using Perception Based Features. In Proceedings of the 2015 Twenty First National Conference on Communications (NCC), Mumbai, India, 27 February–1 March 2015; pp. 1–6. [Google Scholar]
- Yan, J.; Li, J.; Fu, X. No-Reference Quality Assessment of Contrast-Distorted Images Using Contrast Enhancement. arXiv 2019, arXiv:1904.08879. [Google Scholar]
- Abdoli, M.; Nasiri, F.; Brault, P.; Ghanbari, M. Quality Assessment Tool for Performance Measurement of Image Contrast Enhancement Methods. IET Image Process. 2019, 13, 833–842. [Google Scholar] [CrossRef]
- Hassen, R.; Wang, Z.; Salama, M. No-Reference Image Sharpness Assessment Based on Local Phase Coherence Measurement. In Proceedings of the 2010 IEEE International Conference on Acoustics, Speech and Signal Processing, Dallas, TX, USA, 14–19 March 2010; pp. 2434–2437. [Google Scholar]
- Hassen, R.; Wang, Z.; Salama, M.M.A. Image Sharpness Assessment Based on Local Phase Coherence. IEEE Trans. Image Process. 2013, 22, 2798–2810. [Google Scholar] [CrossRef]
- Vu, C.T.; Chandler, D.M. S3: A Spectral and Spatial Sharpness Measure. In Proceedings of the 2009 1st International Conference on Advances in Multimedia, Colmar, France, 20–25 July 2009; pp. 37–43. [Google Scholar]
- Sakaridis, C.; Dai, D.; Van Gool, L. Guided Curriculum Model Adaptation and Uncertainty-Aware Evaluation for Semantic Nighttime Image Segmentation. In Proceedings of the 2019 IEEE/CVF International Conference on Computer Vision (ICCV), Seoul, Republic of Korea, 27 October–2 November 2019. [Google Scholar]
- Sakaridis, C.; Dai, D.; Van Gool, L.; Zürich, E. ACDC: The Adverse Conditions Dataset with Correspondences for Semantic Driving Scene Understanding. In Proceedings of the 2021 IEEE/CVF International Conference on Computer Vision (ICCV), Montreal, QC, Canada, 10–17 October 2021. [Google Scholar]
- Liu, J.; Fan, X.; Huang, Z.; Wu, G.; Liu, R.; Zhong, W.; Luo, Z. Target-Aware Dual Adversarial Learning and a Multi-Scenario Multi-Modality Benchmark to Fuse Infrared and Visible for Object Detection. In Proceedings of the IEEE/CVF Conference on Computer Vision and Pattern Recognition (CVPR), New Orleans, LA, USA, 18–24 June 2022; pp. 5802–5811. [Google Scholar] [CrossRef]
Disclaimer/Publisher’s Note: The statements, opinions and data contained in all publications are solely those of the individual author(s) and contributor(s) and not of MDPI and/or the editor(s). MDPI and/or the editor(s) disclaim responsibility for any injury to people or property resulting from any ideas, methods, instructions or products referred to in the content. |
© 2025 by the authors. Licensee MDPI, Basel, Switzerland. This article is an open access article distributed under the terms and conditions of the Creative Commons Attribution (CC BY) license (https://creativecommons.org/licenses/by/4.0/).