Article

Federated Learning for Heterogeneous Multi-Site Crop Disease Diagnosis

1
Department of Industrial and Systems Engineering, Mississippi State University, Mississippi State, MS 39762, USA
2
Department of Biological and Agricultural Engineering, Texas A&M AgriLife Research, Texas A&M University System, Dallas, TX 75252, USA
3
Department of Biochemistry, Molecular Biology, Entomology and Plant Pathology, Mississippi State University, Mississippi State, MS 39762, USA
*
Authors to whom correspondence should be addressed.
Mathematics 2025, 13(9), 1401; https://doi.org/10.3390/math13091401
Submission received: 28 February 2025 / Revised: 9 April 2025 / Accepted: 21 April 2025 / Published: 25 April 2025
(This article belongs to the Special Issue Computational Intelligence in Addressing Data Heterogeneity)

Abstract

:
Crop diseases can significantly impact crop growth and production, often leading to a severe economic burden for rice farmers. These diseases can spread rapidly over large areas, making it challenging for farmers to detect and manage them effectively and promptly. Automated methods for disease classification emerge as promising approaches for detecting and managing these diseases, provided there are sufficient data. Sharing data among farms could facilitate the development of a strong classifier, but it must be executed properly to prevent leaking sensitive information. In this study, we demonstrate how farms with vastly different datasets can collaborate through a federated learning model. The objective of this collaboration is to create a classifier that every farm can use to detect and manage rice crop diseases by leveraging data sharing while safeguarding data privacy. We underscore the significance of data sharing and model architecture in developing a robust centralized classifier, which can effectively classify multiple diseases (and a healthy state) with 83.24% accuracy, 84.24% precision, 83.24% recall, and an 82.28% F1 score. In addition, we demonstrate the importance of model design on classification outcomes. The proposed collaborative learning method not only preserves data privacy but also offers a cost-effective and communication-efficient lightweight solution for rice crop disease detection. Furthermore, this collaborative strategy can be extended to other crop disease classification tasks.

1. Introduction

Agriculture plays a vital role in ensuring food security worldwide, but it faces challenges that affect crop yields, including plant diseases and invasive weeds. Among these challenges, plant diseases pose a major threat to productivity. Rice, as one of the most commonly consumed staple foods, is especially susceptible to numerous diseases, leading to significant economic losses. The Food and Agriculture Organization (FAO) estimates that between 20–40% of global crop production is lost annually due to pests and diseases [1]. For rice, disease-related losses are a persistent issue, impacting both smallholder farmers and large-scale agricultural operations [2]. Diagnosing and managing these diseases is often complex, requiring expert knowledge, specialized tools, and substantial resources that are not always accessible in rural farming communities [3].
Diagnosing plant diseases becomes more challenging due to their uneven distribution across different geographic areas, influenced by genetic factors, environmental conditions, and climate variations [4]. Similar to healthcare, where medical conditions exhibit spatial and temporal variation, plant diseases also depend on factors such as soil type, weather, and crop genetics. This results in an uneven distribution of disease data across different farms, making it difficult for individual farmers to build comprehensive, localized models for disease diagnosis and prediction [5]. Even with advanced diagnostic tools accessible, many farmers do not have the necessary infrastructure or expertise to utilize them effectively. As a result, interventions are delayed, resulting in reduced crop yields.
The growing utilization of advanced technologies, including the Internet of Things (IoT) devices, drones, and sensors in the agricultural sector, has facilitated the generation of extensive datasets essential for precision farming and informed decision-making [6]. While this abundance of data brings exciting opportunities, it also raises some important concerns about privacy and security. Farmers’ data often contain sensitive information about crop yields, land use, and farming practices, which could be misused for competitive or commercial gain. For instance, data on crop disease diagnoses might uncover weaknesses or inefficiencies in farming methods, and other market players could leverage that information to affect a farm’s profitability [7].
Additionally, the agricultural industry is highly decentralized, with small farms often lacking the resources or technical expertise to manage data security independently. This leads to a vulnerable situation where data shared with centralized servers or third-party organizations could be exposed to unauthorized access, data breaches, or even misuse. Consequently, farmers are increasingly hesitant to share their data due to concerns about losing control over their sensitive information and the potential for misuse or exploitation.
Rice diseases, akin to various other plant diseases, are affected by numerous factors, including climate, soil composition, and crop genetics [8]. For example, the prevalence and severity of diseases such as rice blast and bacterial blight exhibit considerable variation across different geographical regions and even among fields within the same region. This geographical and environmental heterogeneity presents a significant challenge in developing accurate and generalized disease diagnosis models. A traditional approach that depends on centralized data from a singular source may fail to encapsulate the diversity of disease patterns across various farms and locations.
In this context, federated learning (FL) has emerged as an effective method to address these concerns. FL represents a decentralized machine learning technique wherein multiple clients, such as agricultural farms, collaborate to train a shared model without disclosing their local data [3]. Each farm trains its model locally with its own data and transmits only the model updates, such as gradients or weights, to a central server. The server aggregates these updates to enhance the global model. This method greatly minimizes the risks linked to data sharing while facilitating the creation of strong models. For instance, direct collaboration may require sharing information that would amount to leaking private or proprietary methods, thus removing competitive advantages. In agriculture, federated learning allows farms to work together on a common disease diagnosis model, leveraging a wide array of data while preserving privacy [9].
Additionally, collaboration among farms to train a shared model via federated learning can address the issue of data scarcity. Many individual farms, especially smallholders, possess limited data, hindering their ability to develop strong machine-learning models. By utilizing data from various farms, federated learning can establish a more thorough and generalized model that takes advantage of the diverse agricultural data available, ultimately enhancing disease detection and prediction.
This study presents a novel collaborative framework for federated learning, focusing on multi-site disease diagnosis in heterogeneous settings. Our method utilizes federated learning to allow farms to jointly train disease diagnosis models, all while safeguarding their sensitive data. Additionally, accounting for non-homogeneity greatly enhances the generalizability of the findings.
The key contributions of this work are as follows:
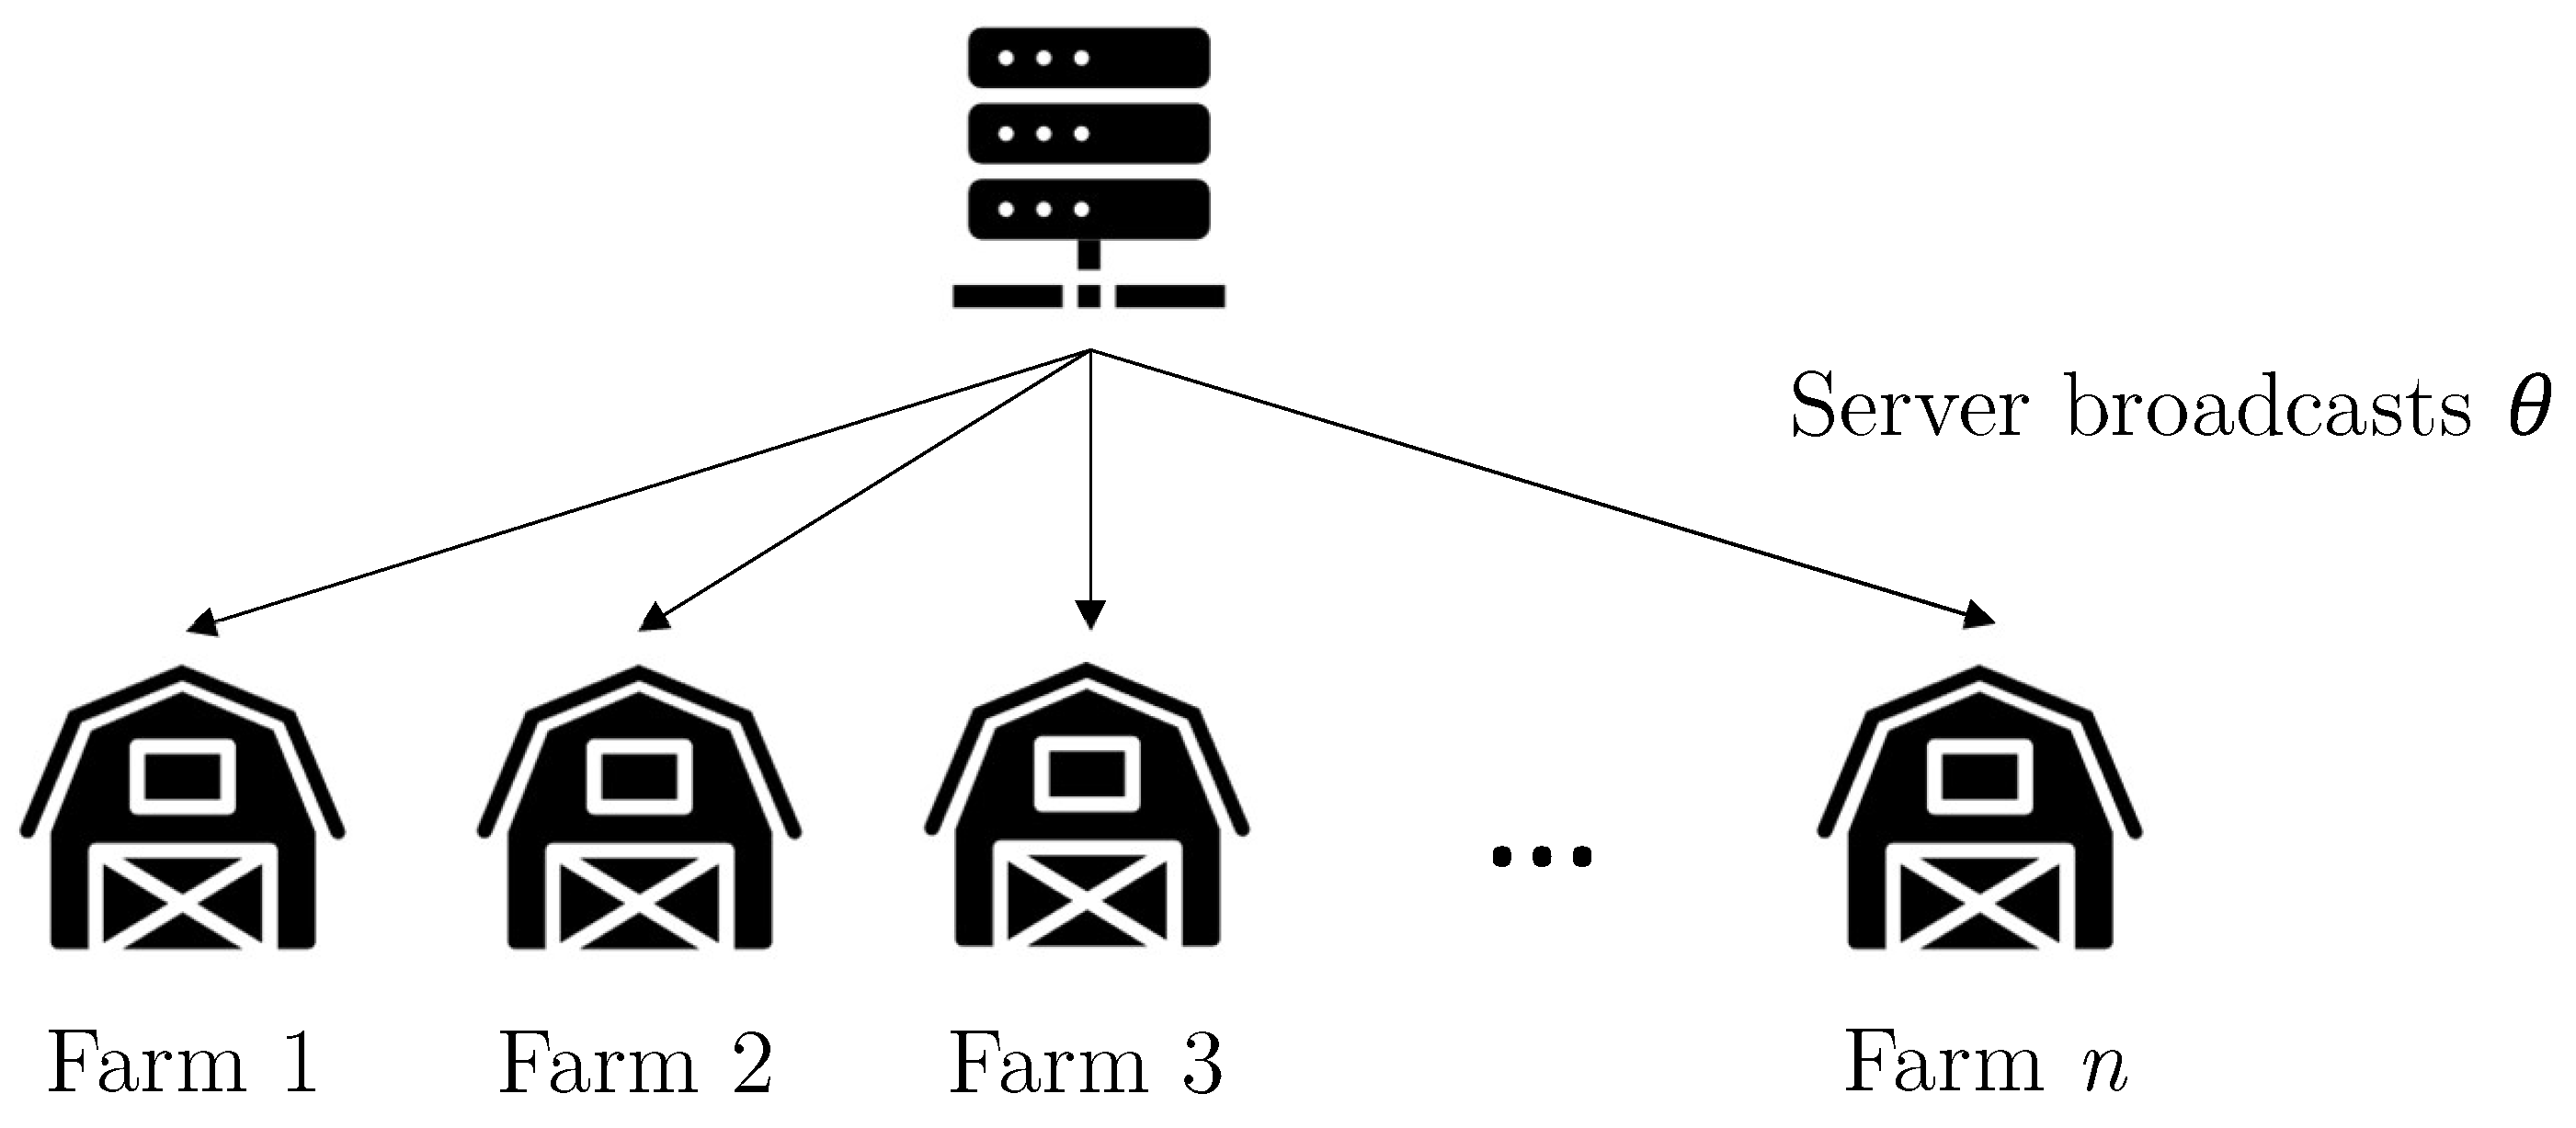
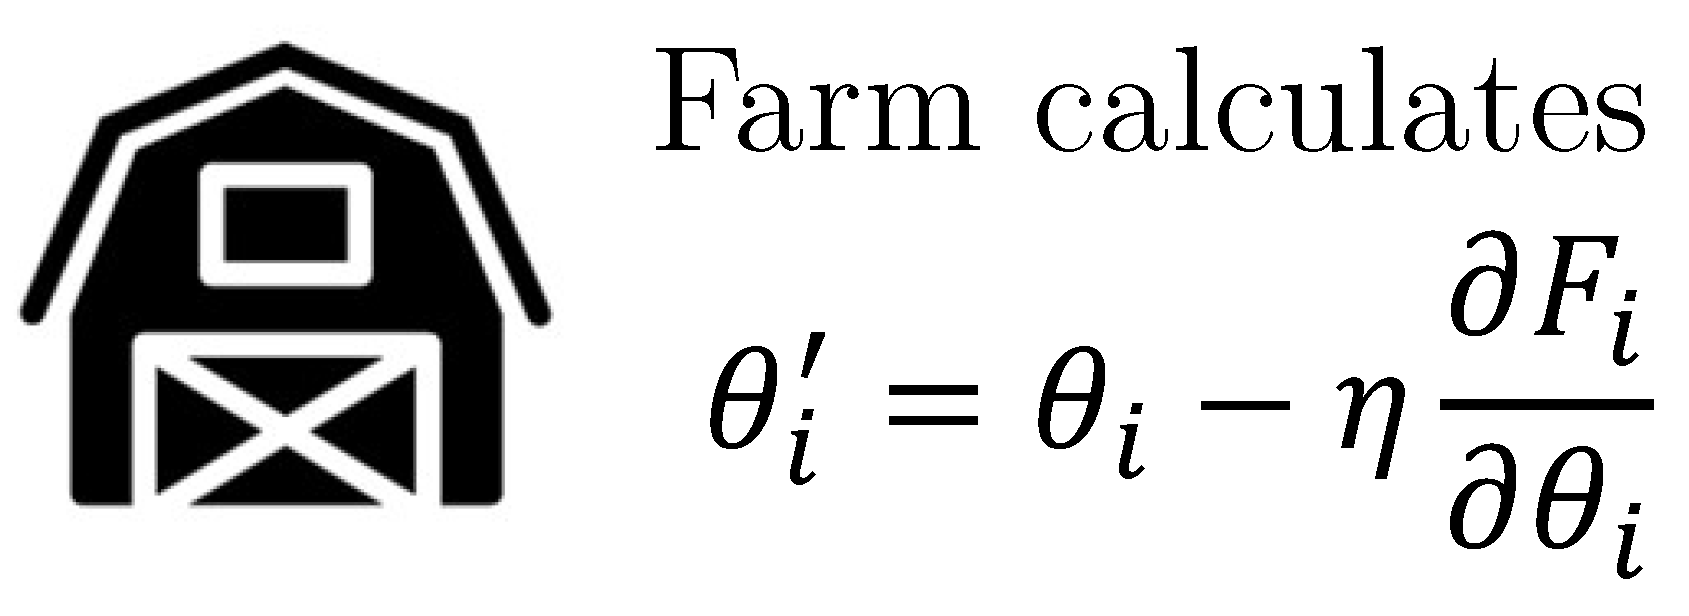
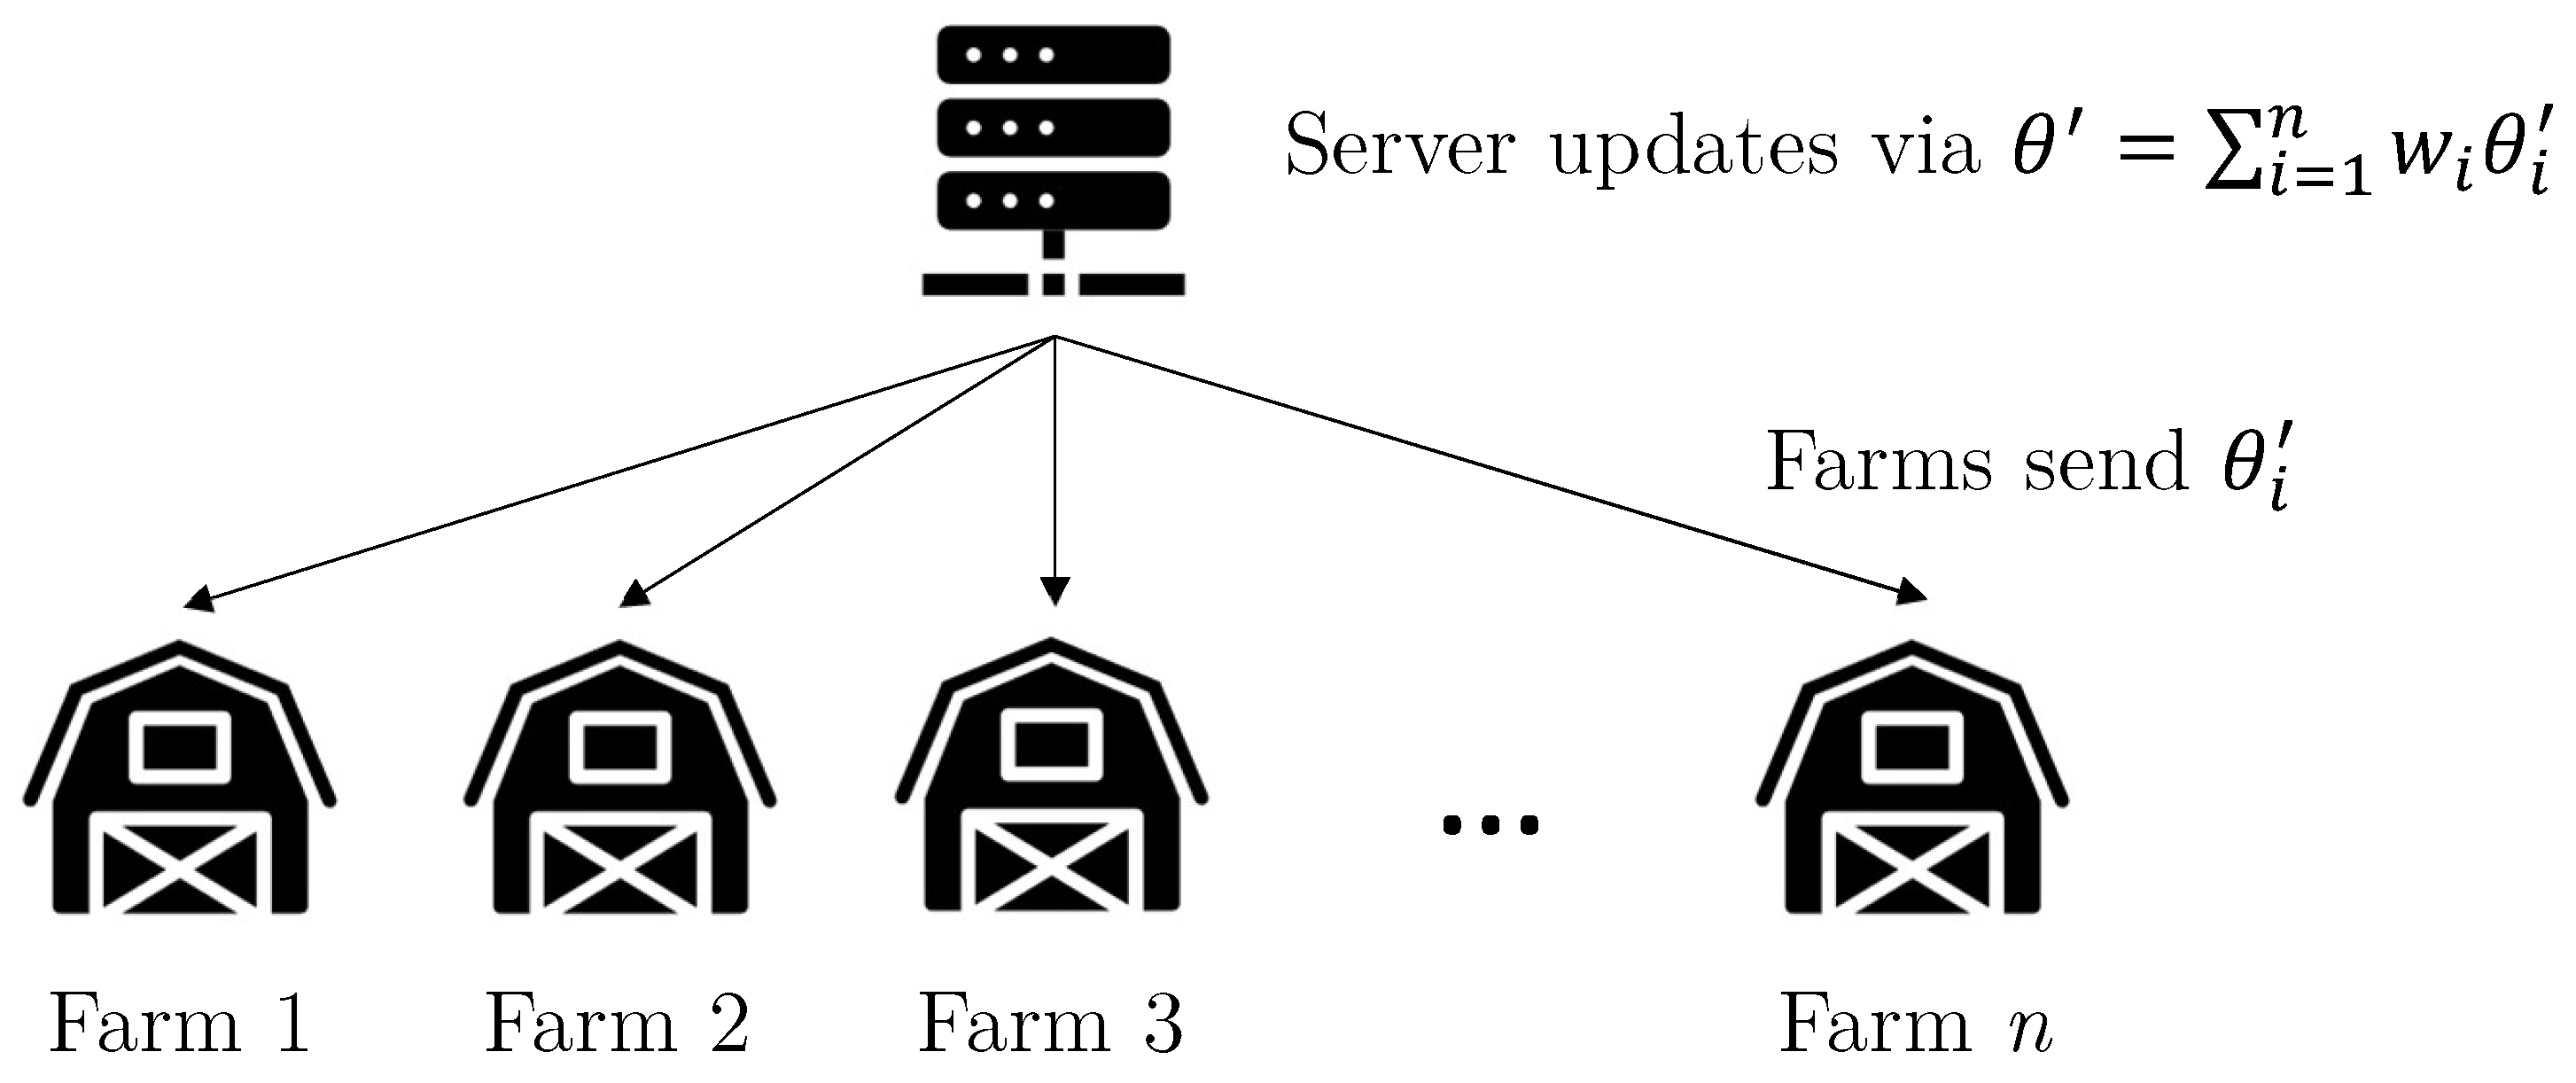
  • We propose a federated learning framework to build a centralized model that ensures the data privacy of individual farms and improves rice disease diagnosis accuracy.
  • We demonstrate how farms with limited local data can collaborate in training a global disease diagnosis model, overcoming the challenges of data scarcity.
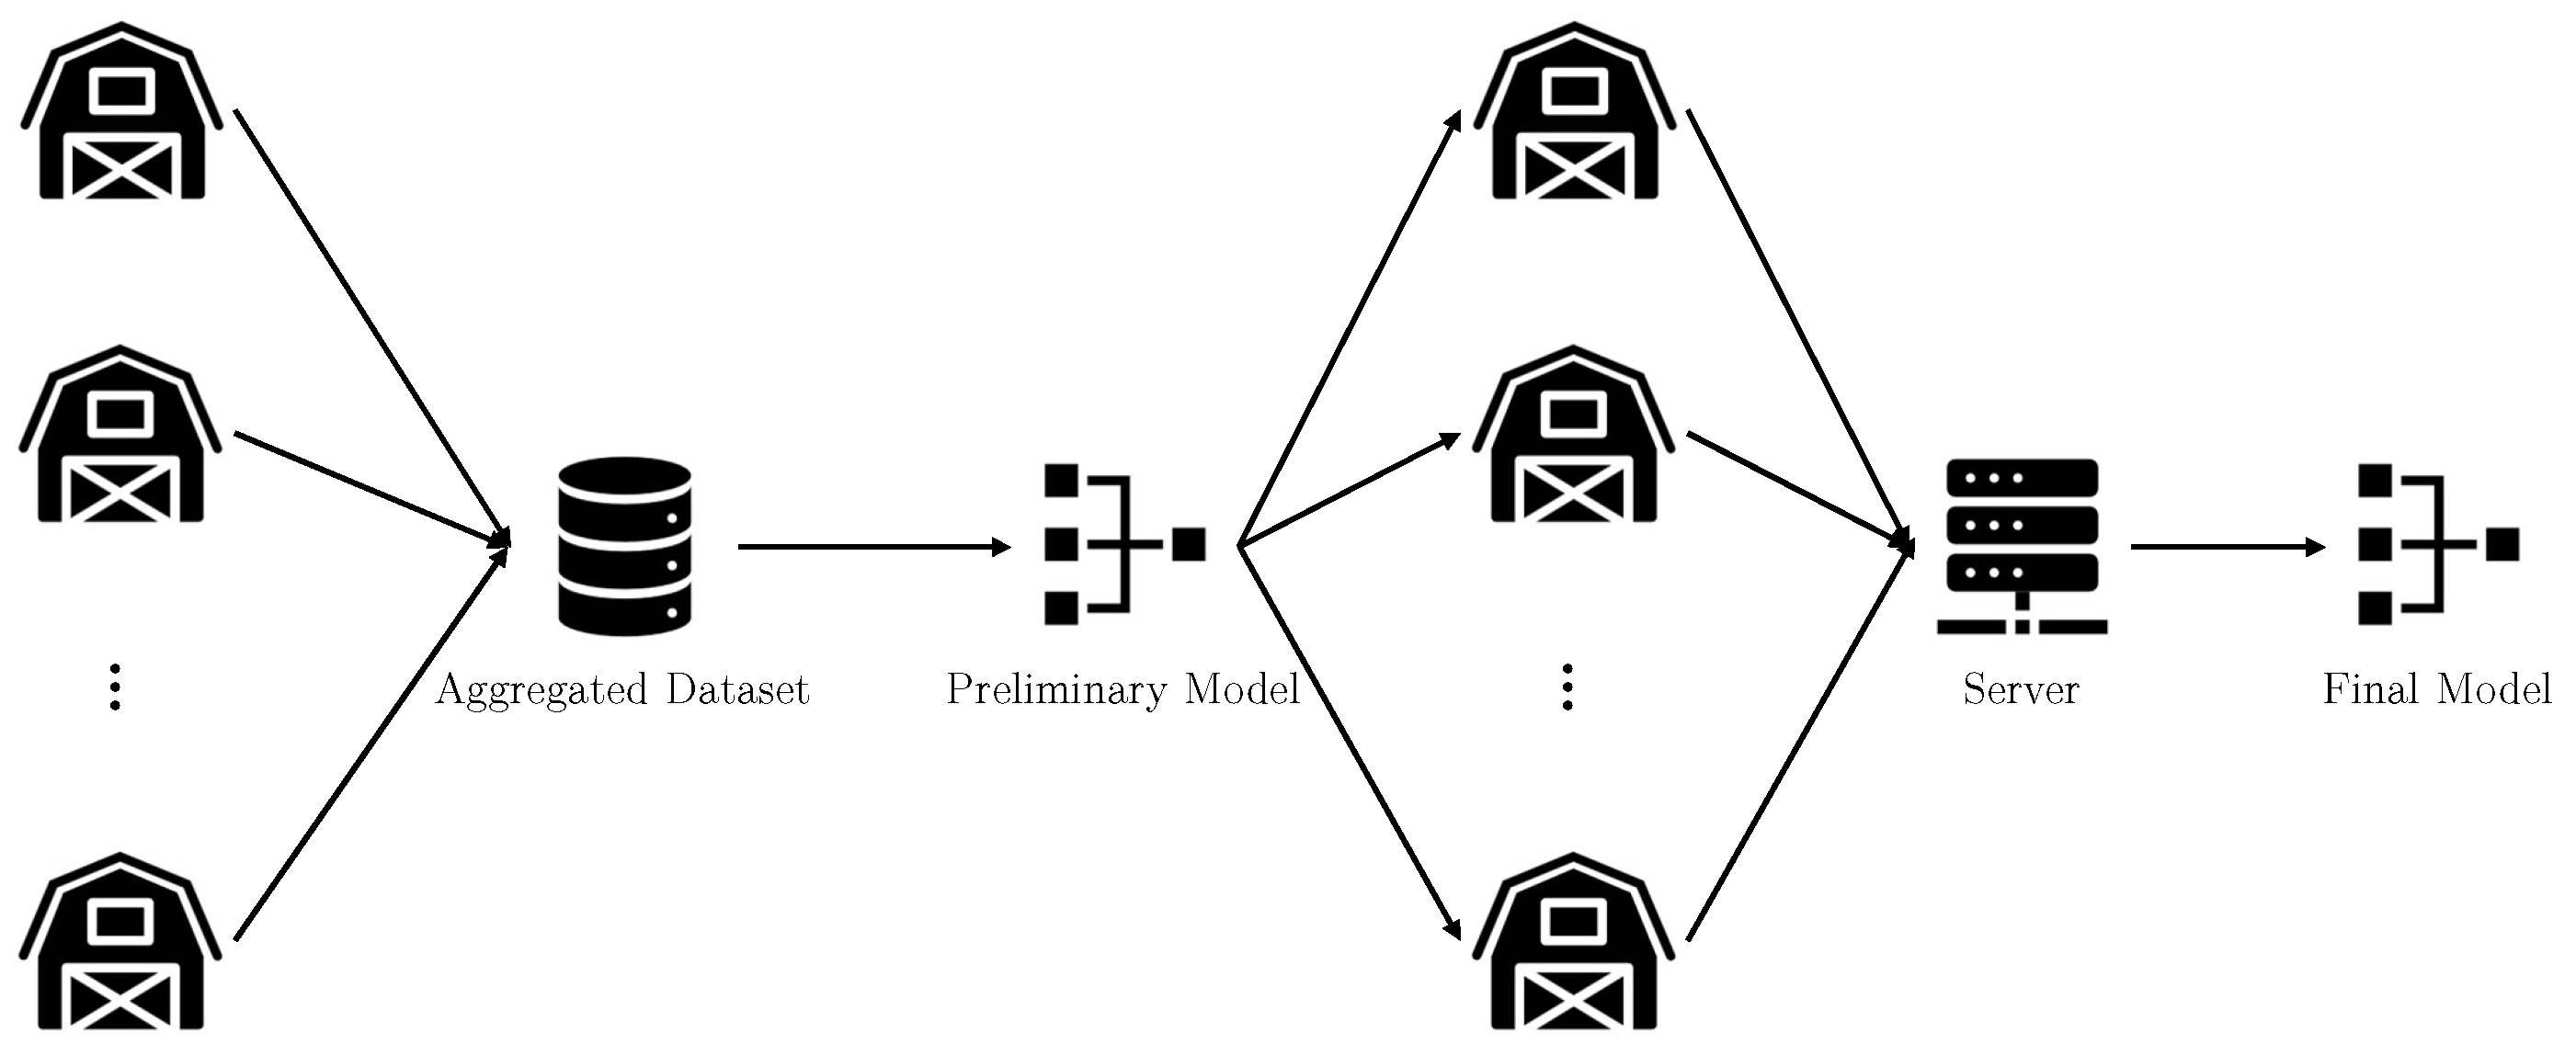
  • We also illustrate how various data-sharing approaches (for instance, large-farm, pre-training, q-fair) can be utilized to improve disease detection performance.
This paper is organized as follows: Section 2 reviews the relevant literature on rice disease detection and federated learning, Section 3 describes the methodology, Section 4 presents the experimental results, and Section 5 concludes the article.

2. Related Works

Rapid identification of plant diseases is crucial for timely treatment planning and minimizing crop losses [10]. Both traditional feature extraction approaches and deep learning approaches have been used for rice disease diagnosis. While traditional methods have achieved relatively high accuracy in disease classification, they also require significant preprocessing or feature extraction techniques. For instance, it has been shown that color correlograms and color textures can be extracted from images of crops and used in conjunction with support vector machines (SVMs) to achieve high accuracies across multiple datasets [11]. Gray-level co-occurrence matrices have also been used for feature extraction in conjunction with SVMs [12]. Saturation and hue thresholding have also been used in conjunction with extreme gradient-boosted machines for the classification of rice diseases [13].
Despite the effectiveness of traditional approaches, most are incompatible with federated learning. For instance, due to the (implicit) assumption of centralized data, feature extraction may diverge from the expectation of the classifier, leading to feature-classifier mismatch and poor performance [14]. Furthermore, traditional models are vulnerable to single-point breaches, which would impact each client in a federation [9,15]. Finally, because most traditional methods do not rely on gradient descent, it is not possible for clients to send only gradient updates to a server, further inhibiting the preservation of privacy [9,15]. In contrast, deep learning methods, which rely on gradient descent, are ideal candidates for use in federated learning.
The use of deep learning techniques in disease diagnosis allows for the objective extraction of disease features, enhancing detection practices in the field. Various convolutional neural networks (CNNs), including VGG-19, LeNet-5, and MobileNetV2, have been tested and evaluated for recognizing infections in rice plants [16]. For instance, Wang et al. [10] introduced an attention-based neural network model for diagnosing rice diseases, utilizing Bayesian optimization for hyperparameter tuning. This approach achieved a test accuracy of 94.65% and performed an analysis of model explainability by visualizing the activation maps of different layers through the trained network.
Furthermore, in one study, RGB images were transformed into HSV images to eliminate the background through hue part masking during the preprocessing stage [17]. Subsequently, a clustering method was proposed for segmenting the diseased and healthy portions of the plant. Anandhan et al. [18] investigated the use of faster R-CNN and mask R-CNN for detecting diseases in paddy rice crops, thereby demonstrating the efficacy of disease identification from real-time captured images of rice leaves. In a similar vein, a faster R-CNN algorithm was employed for the real-time detection of rice leaf diseases, achieving an impressive 99.25% test accuracy in identifying leaf infections [19]. Additionally, Deng et al. [20] developed an ensemble model that integrates three submodels, namely, DenseNet121, SEResNet50, and ResNet50, resulting in the accurate detection of rice diseases with an overall accuracy of 91%, based on an analysis of the confusion matrices.
Moreover, transfer learning techniques have been actively implemented in rice disease detection tasks. One framework involved adopting a pre-trained deep CNN as a feature extractor in conjunction with a support vector machine (SVM) classifier [21]. Similarly, a pre-trained transfer learning approach was explored in another study [22]. Li et al. [23] studied a recognition method for rice plant diseases and pest video detection using a custom CNN. They transformed the videos into frames utilized to train a still-image detector, and the frames were finally synthesized back into video format. Their performance was compared with other backbone architectures such as VGG-16, ResNet, and YOLOv3. A summary of related literature has been presented in Table 1.
In addition to rice crop diseases, other types of plant diseases, such as apple, tomato, and cotton diseases, were also investigated. Advanced learning frameworks were presented regarding the general plant disease detection discipline. Deep learning was studied to identify lesions of cotton leaves, showing the potential in diagnosing cotton pests and diseases [27]. Meta-deep learning was investigated for cotton disease identification, which performed remarkably well on the field-collected cotton dataset with an accuracy of 98.53% [32]. Patil and Patil [28] automatically identified a diseased plant from leaf images of the cotton plant and developed an IoT-based platform to collect various sensor data for detecting climatic changes. A convolutional long short-term memory (LSTM) network was studied for cotton rice disease detection [29]. Hyperspectral imaging has shown great potential in the early diagnosis of plant diseases [37].
Hu et al. [24] proposed a low-shot learning method for tea leaf disease identification with conditional deep convolutional generative adversarial networks (C-DCGAN) based data augmentation, achieving 90% classification accuracy. Wang et al. [31] employed both imaging and text information and a recognition method of vegetable diseases based on image-text collaborative representation learning (ITC-Net). It was demonstrated that ITC-Net achieved better results than both the stand-alone image model and the text model. A two-stage model that fused DeepLabV3+ and U-Net for cucumber leaf disease severity classification (DUNet) in complex backgrounds was proposed [30]. The ratio of the pixel area of disease spots over the pixel area of leaves was calculated to classify the disease severity.
Federated learning (FL) is a decentralized machine learning technique that allows models to be trained using machine learning algorithms on multiple local datasets without requiring data exchange [38,39]. FL frameworks permit many agriculture practitioners to train one machine learning model jointly for a specific identification task. Therefore, all raw field data owned by different farms is protected with a private practice that prevents data from being disclosed by other participants. Several studies investigated FL-based plant disease detection approaches. Khan et al. [40] designed scenarios that comprised four different sites connected with a global model, where different parameters for these sites were received from the local model. EfficientNet-based learning framework achieved the best accuracy score of 99.55%, identifying nine pest classes. Unmanned aerial vehicles (UAVs) were demonstrated as the most reliable data collection method during the classification of pests for the agricultural environment. Deng et al. [41] incorporated FL with faster R-CNN and ResNet-101 for multiple apple diseases and pests detection. This improved faster R-CNN detector was deployed on each edge node to detect different diseases and pests in apple orchards.
In summary, although deep learning techniques have been used in rice disease diagnosis, studies on advanced methods are minimal compared to the general plant disease detection field. Moreover, discussions on data privacy protection are still scarce. FL methods need to be applied not only to generate a more generalized model but also to build a distributed learning approach that prevents data exchange between the participants. To search for an optimized distributed model for rice disease detection, we propose a novel FL-based decentralized learning system to integrate learning systems on various private datasets.

3. Materials and Methods

3.1. Proposed Method

Let f be an arbitrary model. Suppose that n clients have labeled datasets D i = { ( x j , y j ) } j = 1 N i for 1 i n . We use ‘clients’ and ‘farms’ interchangeably throughout this article. Federated learning allows a centralized model f to be trained based on aggregations of training results on each dataset. The central model is updated based on each client’s proposed gradient or model updates (which, in the case of a single centralized model, are equivalent). Therefore, throughout the training process, privacy is maintained.
Let each client have a local model, f i , with the same architecture as the central model, f. We can define the federated objective function as follows:
min θ F ( θ ) = i = 1 n w i F i ( θ )
where F i ( θ ) is the loss of the model f i with weights θ on D i , and w i = | | D i | | j = 1 n | | D j | | . A round of federated learning consists of the following three steps: a broadcast step, a local training step, and an aggregation step. Figure 1, Figure 2 and Figure 3 provide an overview of these steps, focusing specifically on our application with farms. In the broadcast step, the current weights θ of the centralized model are sent via a server to each (or a subset of) client(s) in the federation. The users then perform some iterations of local training on their data, calculating a proposed gradient update θ i = θ i η F i θ i . Finally, in the aggregation step, the clients send their proposed model weights, which the server uses to update the centralized model based on the following:
θ = i = 1 n w i θ i
It is worth noting that throughout the training, clients do not share their data with each other or the server. Instead, the server is sent only model weight (or gradient) updates, meaning that no client has access to any other client’s data, nor does the server.
In addition to testing and presenting federated results for various baseline models, including the model proposed by Wang et al. [10], we explore recent federated learning methods to improve the fairness of the results. In particular, we use q-fair federated learning [42], where fairness is defined as a more uniform distribution of losses. Essentially, q-fair federated learning prevents clients with extensive data from overshadowing the federated learning process, which can result in unsatisfactory outcomes for clients with smaller datasets. It is important to note that rice farms can vary greatly in size, particularly across different countries where the rate of growth of farm size per year is different [43]. To ensure that a useful model is created for all farms, including smaller ones, methods such as q-fair federated learning can be utilized. The objective function that q-fair federated learning solves is as follows:
min θ F q ( θ ) = i = 1 n w i q + 1 F i q + 1 ( θ )
When q = 0 , Equation (3) reduces to the federated learning objective function as shown in Equation (1). As q increases, the emphasis on fairness will increase since more minor losses will be de-emphasized compared to larger ones. Therefore, the distribution of losses should become less disparate between clients with large amounts of data versus those with less. As a consequence of the modified objective function, the q-fair federated learning algorithm also differs from federated learning, and further details can be found in the study conducted by Li et al. [42].
In addition, we investigate two other methods of improving overall federated performance. First, we run experiments for a model trained when clients are willing to share their data. In particular, we consider that larger farms might be more willing to share data, in which case, a preliminary model can be obtained by first training on the centralized shared data before the final model can be obtained using federated learning with the remaining clients. In the second scenario, we consider that each farm may be willing to share a small portion of its data to train a preliminary model on the centralized shared data before training a federated classifier on the remaining data. Each farm randomly samples a predetermined portion of its data, with no additional requirements. This method has the advantage that the preliminary model will have been exposed to unique data from each farm, as opposed to data from a subset, which may not be representative of the training data in general.

3.2. Proposed Model

Most FL methodologies assume a standard model architecture among servers and clients. The methods under consideration in this study do not deviate from this assumption, so a model must be chosen. The choice of the model and the FL methodology affect the results; therefore, we test various FL methodologies on two different models.
We use MobileNetV2 [44] as the baseline model. MobileNets are models that rely on depth-wise separable convolutions, making them lightweight and suitable for deployment on devices with limited computing power. MobileNetV2 improves upon the original MobileNet by modifying the architecture to increase the representational power of the original model. In the remainder of this study, we use MobileNet to refer to MobileNetV2. This model choice is also deliberate from the perspective of a federated rice classifier. In particular, smaller farms may be limited with respect to the amount of computing power available and may not be able to train larger models efficiently. Therefore, using a (relatively) lightweight model would allow for more farms to be included in the federation, adding more data for training and leading to a more robust classifier. However, the lightweight model may not be able to learn complex patterns that distinguish between similar but different classes. As such, it is also necessary to investigate the performance of a more sophisticated model.
We choose our previously proposed ADSNN-BO model [10] as the more robust model to evaluate with FL methodologies. ADSNN-BO is based on the MobileNet architecture and utilizes an augmented attention mechanism and Bayesian optimization for tuning hyperparameters. Again, the choice of the model could theoretically affect data availability; therefore, it is essential to balance between a sufficiently complex model and a suitable amount of data. The ADSNN-BO model is a relevant choice since it is specialized and more complex than MobileNet. The performance of ADSNN-BO versus MobileNet can give insight into the relative performance gain in choosing a more complex and specialized model. In the following section, we discuss the experimental results in detail, and we note that choosing ADSNN-BO over MobileNet leads to significant performance gains.
Figure 4 provides an overview of the proposed methodology. To begin, farms optionally aggregate a portion of their data to create a centralized, preliminary model. If such a preliminary model is trained, it is then broadcast to all the farms to use as a starting point for federated learning. If not, the farms simply begin with federated learning. At the end of the federated training process, a federated model is obtained, which is distributed to each farm for use.

4. Experimental Results

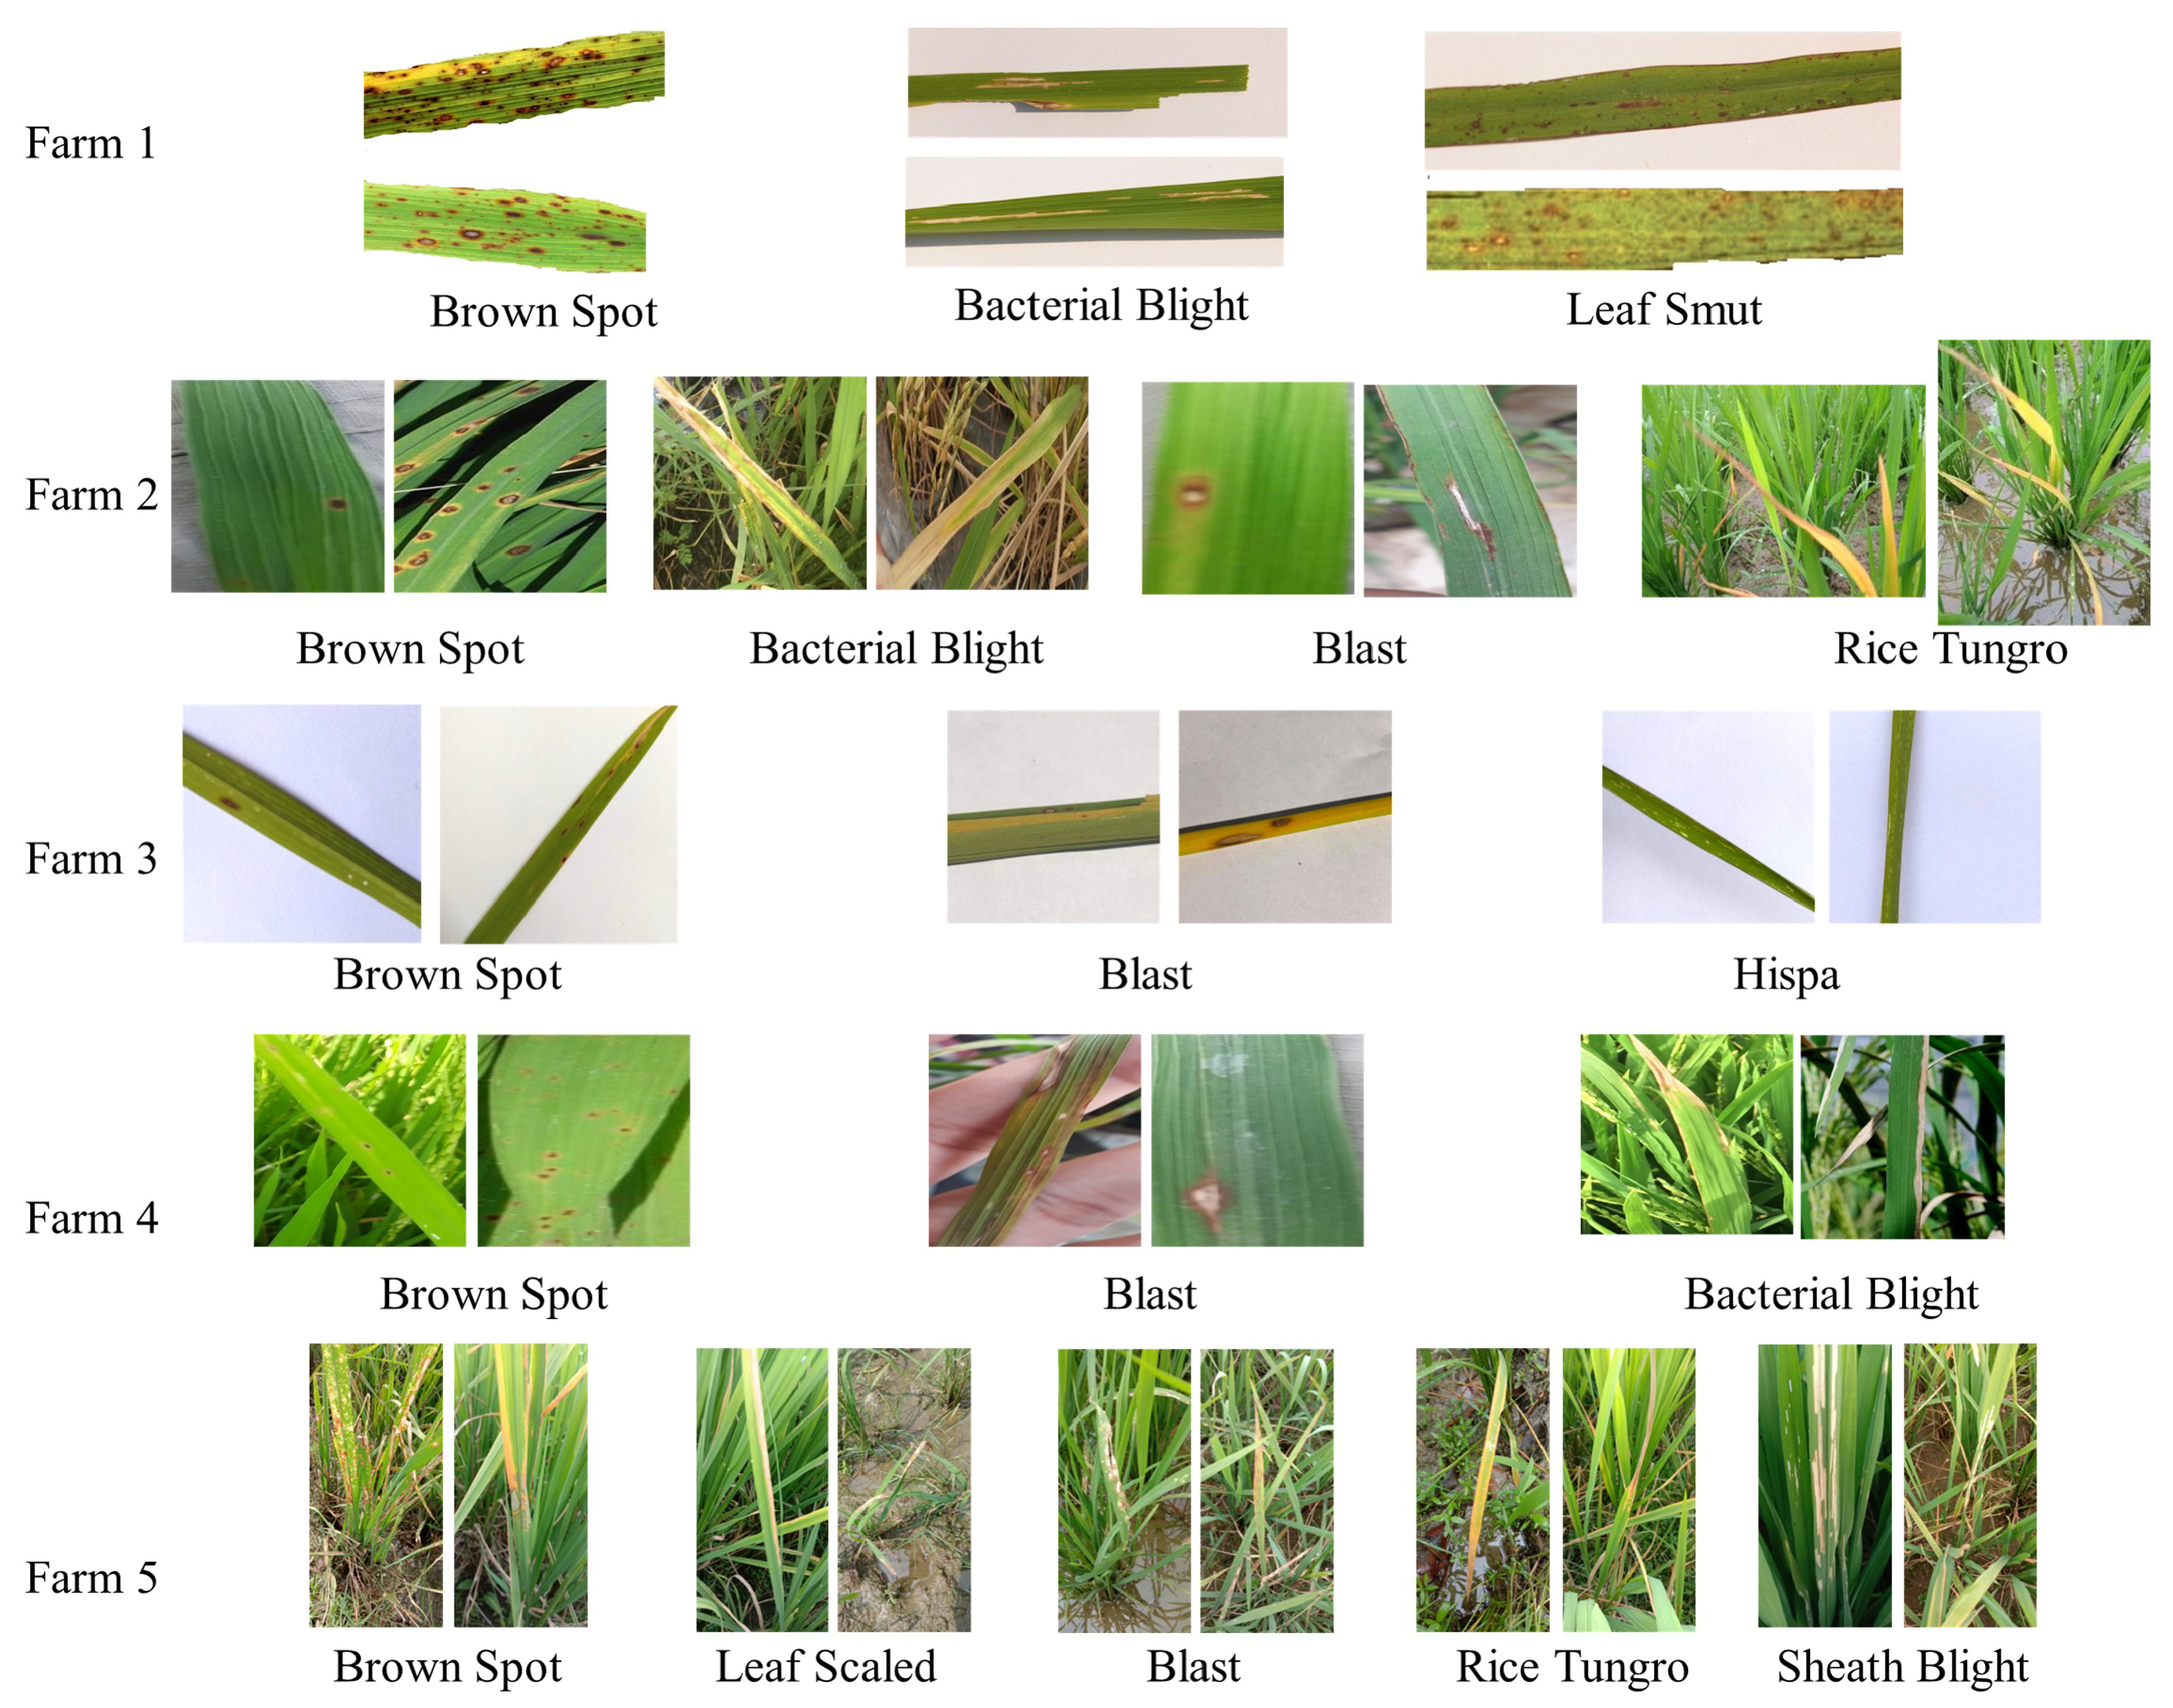
4.1. Data Description

We use datasets from five different sources [45,46,47,48,49] to simulate five different farms. Because these datasets have unique characteristics (in particular, different disease classes) and share common diseases, this accurately simulates a practical scenario where different farms may be more or less concerned about and affected by different diseases. Table 2 summarizes the data for the five different farms. We observe that the classification problem itself is imbalanced, with class sizes ranging from 40 to 2548, and additionally, we note that the data are not independently and identically distributed between the farms. The different farms have unequal amounts of data distributed across different classes. The given distribution should model practical scenarios well, where farm sizes vary, and the amount of data depends to a certain extent on farm size.
Furthermore, Figure 5 displays a sample image representing each class in the dataset. Importantly, the images feature varying backgrounds and quality. This approach more accurately reflects the challenges that a practical application of the proposed methodology would encounter. Different farms yield images of varying quality set against various backgrounds. Nonetheless, an effective model should be capable of handling all these situations, at least to some degree, if it aims to be broadly applicable across the relevant farms.

4.2. Implementation Details

All federated learning experiments were conducted using the open-source Flower framework [50], which enabled the simulation of multiple farms as clients within a single system. Custom modifications were applied to implement q-FedAvg, LF-FedAvg, and PT-FedAvg on top of the standard FedAvg setup.
All models were trained on an NVIDIA GeForce RTX 3090 GPU with 24 GB of memory on an Intel Core i9-10900K CPU with 32 GB of memory. Each input image was resized to 224 × 224 pixels. For q-FedAvg, the fairness parameter was set to q = 2 . All models were trained for 650 communication rounds using a batch size of 32. The optimizer used was stochastic gradient descent (SGD) with a learning rate of 0.01. At each round, every client trained locally for an epoch on its corresponding data partition.

4.3. Performance Evaluation

Because of the data imbalance across both farms and disease classes, we present a variety of metrics to assess the performance of each model and algorithm accurately. We report accuracy, precision, recall, and F1 score. Letting T P , F P , T N , and F N denote true positives, false positives, true negatives, and false negatives, respectively, the evaluation metrics are defined as follows:
Accuracy = T P + T N T P + F P + T N + F N Precision = T P T P + F P Recall = T P T P + F N F 1 score = 2 · Precision · Recall Precision + Recall
Additionally, models were trained using stratified five-fold cross-validation. This is due to the vastly different amounts of data between farms—in particular, the first and fourth farms had very little data. Therefore, we cross-validated to make better use of the available data.

4.4. Performance Comparison

4.4.1. Baseline Test Without FL

We conducted comparison experiments by running the MobileNetV2 model without the FL mechanism. On the one hand, the five studied datasets were combined with stratified cross-validation applied. On the other hand, two larger datasets, i.e., farm 2 and farm 3, acted as the training set, and the remaining three datasets were tested so that the test performance of the insufficient sample scenario was investigated. Bootstrapping was mainly applied to generate more than one estimate of model performance. Stratified sampling ensured that each subgroup of interest was represented and maintained. We repeated five iterations of the bootstrapping procedure. The test performance is shown in Table 3 and Table 4.
Table 3 demonstrates the performance of the MobileNetV2 model on the combined dataset (N = 10,789) without FL. The top row represents the classification performance of the combined dataset using stratified cross-validation. The remaining rows demonstrate performance on the datasets from each farm. Table 4 shows the performance of the MobileNetV2 model when it was trained on the two larger datasets (farm 2 and farm 3) and tested on the remaining three datasets from farm 1, farm 4, and farm 5.
Based on the results, the model performs well on datasets with fewer samples when trained on the combined dataset. For instance, in Table 3, when tested on the dataset from farm 1, the model obtained 99.92% accuracy. However, a significant performance drop is observed when the samples in the small datasets are not taken into account in the training (e.g., the accuracy on the dataset from farm 1 in Table 4 has dropped to 2.09%). Therefore, the FL algorithm is essential for improving the subgroup performance with a small sample size while preserving data privacy.

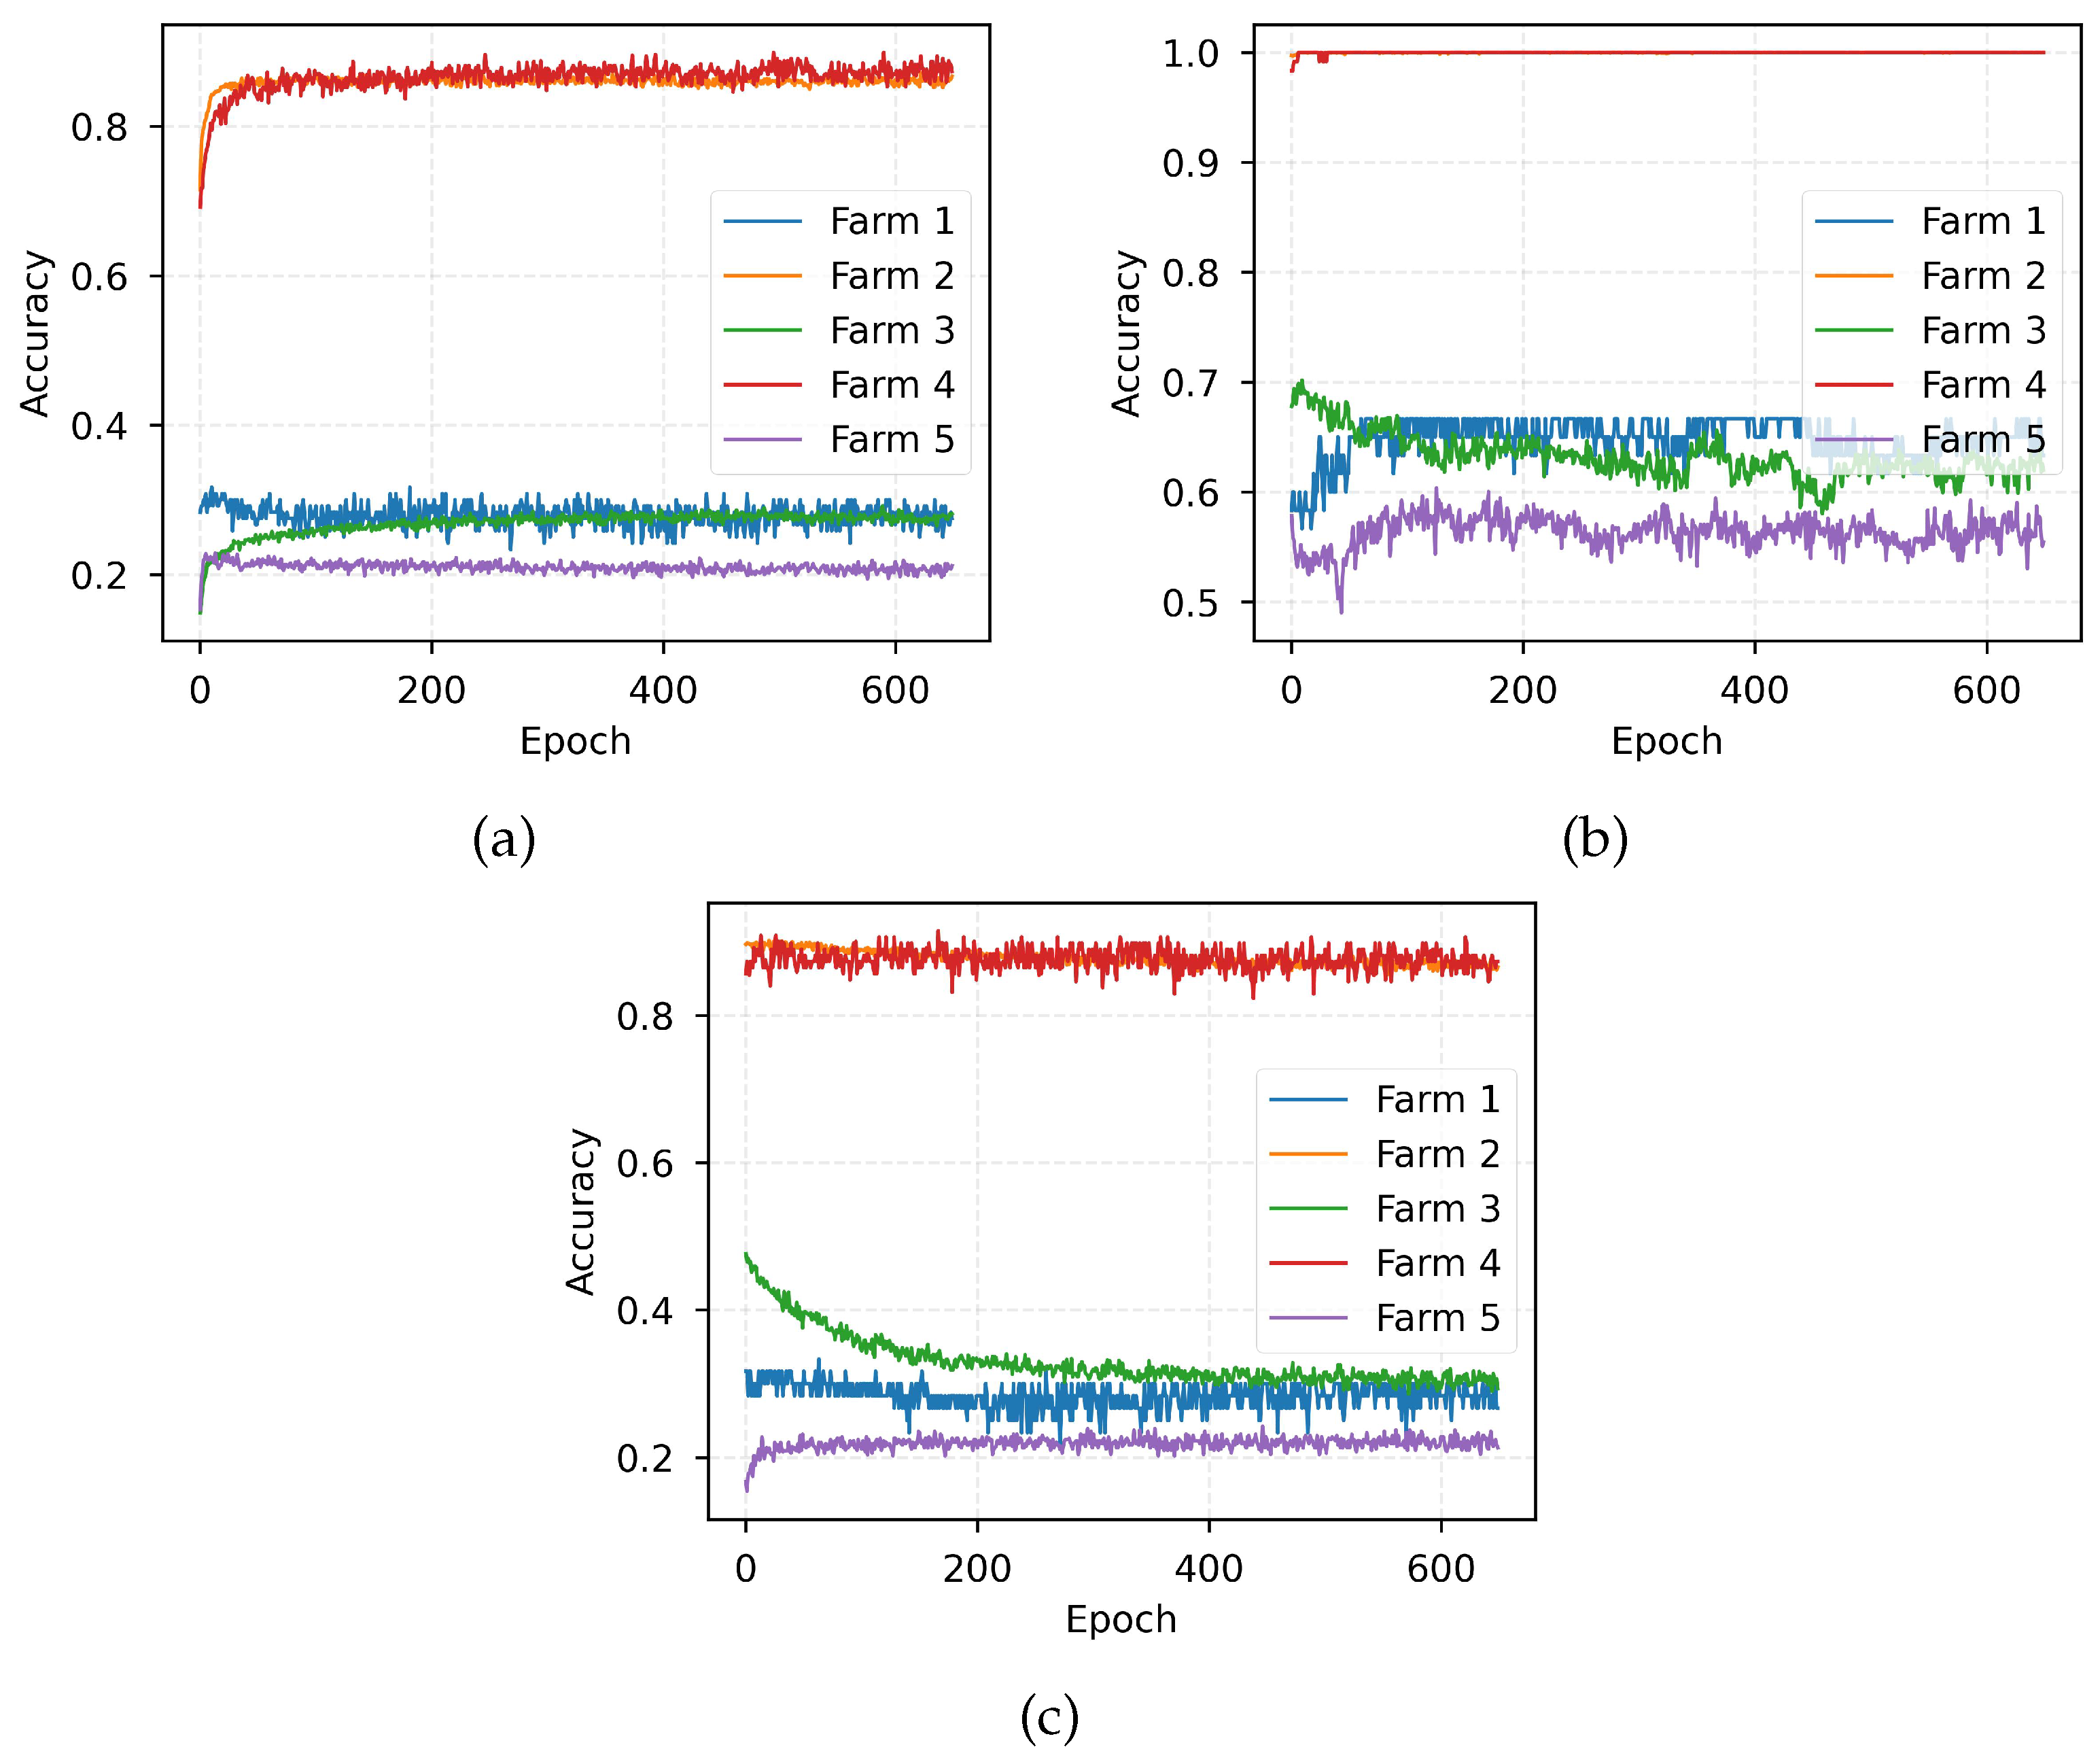
4.4.2. Comparison of FL Performance

We abbreviate the federated learning algorithm as FedAvg, the q-fair federated learning algorithm as q-FedAvg, the federated scheme where large farms share their data for a preliminary phase as LF-FedAvg, and the scheme where each farm shares a portion of their data for pretraining as PT-FedAvg.
In all cases, training and evaluation were conducted using data collected from multiple farms. The dataset was partitioned farm-wise and used for five-fold cross-validation. In each fold, the data from all farms were split such that 80% were used for training and 20% were held out as a test set. These test sets were kept completely disjoint from the training data and were used solely for final performance evaluation.
The training data varied based on the algorithm. For FedAvg and q-FedAvg, each farm trained locally on its own private 80% training data, and model updates were aggregated globally. No data were shared across farms. For LF-FedAvg, a preliminary model was trained centrally using training data only from large farms (80% of their data), followed by federated learning involving all farms with their local data. For PT-FedAvg, a specified portion (10%, 30%, or 50%) of training data from each farm was shared centrally for pretraining. The remaining training data were then used in the federated learning phase. Table 5 shows the average performance of each model and algorithm on the test sets across five cross-validation folds.
We observe that ADSNN-BO tends to perform better than MobileNet overall. There is a significant improvement for ADSNN-BO over MobileNet when using federated averaging. Interestingly, pre-training (10%, 30%, and 50%) seems to help the model improve the classification performance significantly. For instance, the PT-FedAvg algorithm achieved 83.14% accuracy compared to the FedAvg, which achieved 70.66% accuracy for the ADSNN-BO model.
When large farms use their data to train an initial model, the subsequent weight changes that make the model more amenable to smaller farms significantly hamper its accuracy on the initial data from the larger farms. Nevertheless, given that in this situation, larger farms are willing to donate some of their data for training, the larger farms could continue to use the pre-trained model, and the smaller farms can use the federated model. In this case, the overall accuracy of the ADSNN-BO model across all farms would be 64.79%.
Figure 6 shows the accuracy per client using both MobileNet (a) and ADSNN-BO (b) in conjunction with federated averaging. In both cases, farms 1, 3, and 5 have relatively low accuracies, while farms 2 and 4 perform very well. Consulting Table 2, we note that farms 2 and 4 have very similar data, and farm 2 has the most considerable data; therefore, it dominates the FL process. Nevertheless, ADSNN-BO yields better performance per client and overall in the FL process. As shown in Table 6 and Table 7, 100% accuracy, 100% precision, 100% recall, and a 100% F1 score were achieved for both farm 2 and farm 4 when the ADSNN-BO model was employed with 50% of the data used for centralized pretraining.

4.5. Discussion

Our experiments demonstrate that it is possible to effectively train a site-aware model for crop disease diagnosis across many farms. However, the performance of the model is dependent on several factors. First, we note that the model architecture is important in generating good results. As shown in Table 5, we notice that there is a drastic increase in performance when using ADSNN-BO versus MobileNet. We hypothesize that this is due to the more complex model architecture and also because ADSNN-BO was explicitly designed for rice disease diagnosis. In contrast, MobileNet was trained as a general image classification model.
It is worth noting that in a federation, larger farms tend to have more data than smaller ones. This means that during the weighted federated averaging process, the gradient updates will tend to favor the larger farms. Figure 6 provides a visual representation of this. Having a standard imaging process for rice diseases would be beneficial for larger farms, as they are more likely to encounter all types of rice diseases. This would ensure that the images produced represent the diseases encountered by small farms as well, provided there are no endemic diseases in either location or the farms are close enough for endemic diseases to be identical between them. However, the data show that images of rice diseases differ pretty drastically between farms. Instead, small farms with images different from large farms tend to suffer in the federation.
A potential solution could be q-fair federated learning, but only lightly enforcing fairness (setting q = 2 ) drastically reduces results such that the obtained classifier would not be useful for any farm. On the other hand, small farms that share the same diseases with the large farms tend to benefit, as represented by farm 4 (Figure 6 and Table 6). Farm 2 and farm 4 achieved 100% accuracy, 100% precision, 100% recall, and a 100% F1 score, suggesting that data sharing will significantly improve the classification performances for the farms with diseases shared by other farms, and with more farms sharing the data, the performance will be further improved.
Data sharing can potentially address the issue of low accuracy. In this case, farms would forego some privacy to obtain a more robust model. Although large, established farms may not face any issues in sharing data, smaller farms may find it less feasible. However, it is crucial for small farms possessing unique diseases to share their data to obtain satisfactory results. Table 4 shows that the model’s generalization to data from smaller farms is poor when trained solely on data from large farms. Therefore, data from both large and small farms need to be combined to train a classifier. However, when farms are willing to submit a fraction of their data, the classifier accuracy improves significantly when the model architecture is sufficiently suited for the task (see in particular results using ADSNN-BO with PT-FedAvg in Table 5).
It is not surprising to observe that as the amount of shared data increases, the accuracy of the classifier also improves. Therefore, while creating a classifier with a group of farms, it is crucial to decide on the amount of data that should be shared. If there are no concerns regarding privacy, then all data can be shared to achieve exceptional results similar to those mentioned in Table 3. However, in case of any privacy concerns, the farms will have to be careful about how much data they want to share to achieve the desired performance accuracy of the classifier.
After carefully examining Table 2, it was found that farm 1 had around 33% of diseases that were not shared with other farms. Farm 2 had around 22% of diseases that were not shared with other farms, and the unique disease in farm 2 had a large sample size by itself (1308 samples). Farm 3 had around 61% of diseases that were not shared with other farms, whereas farm 4 had no diseases that were unique to itself. Farm 5 had around 24% of diseases that were not shared with other farms. The overall performance showed that farm 4 and farm 2 performed better than farms 1, 3, and 5. It was observed that if a farm had diseases that other farms shared, the accuracy of the diagnosis was better (Figure 6, Table 6 and Table 7). If a large portion of a farm’s diseases were unique to itself, the diagnosis performance was poor. Therefore, it is anticipated that when more farms join the FL network and multiple farms share more diseases, the performance of FL in disease diagnosis will improve.
With federated learning, a point of active research is how to update model weights when a client fails to broadcast their proposed weights to the server (for instance [51]). This is most relevant in federations with many clients where the quality of communication cannot be guaranteed. Because the focus of this work was a collaboration amongst specialized farms with intentional collaboration, we do not foresee any broadcasting issues that would arise in the model training stage. Nevertheless, if such an approach were to be used more generally across farms irrespective of crop type, the consideration of broadcast failure would be an integral part of the model training process.
In line with the point above, a possible extension of the present work could be the creation of a more general model that can be applied across various farms with a variety of crops. However, in the context of rice, farms tend to specialize in growing rice for various reasons. Rice is a crop that relies on special soil and partial flooding, which is prohibitive for the growth of other crops [52]. Therefore, we believe that a model specialized in the diagnosis of rice diseases would be most beneficial for rice farms, which tend to be specialized in their crops.
In this study, we tested various methods to solve a modeling problem that is non-independent and identically distributed (non-i.i.d.). The definition of independent and identically distributed data is stringent—that is, data with this property have very predictable and useful qualities; however, the absence of this property encompasses a much broader set of data. Therefore, it is difficult to measure exactly how non-i.i.d. a problem is. For example, having different numbers of samples across each farm, even if they were drawn from the same distribution, may be considered non-i.i.d. However, in our case, each farm had unique data with its characteristics, size, and subset of diseases. Therefore, although both datasets would be considered non-i.i.d., we expect the results we have obtained should provide a more accurate estimate of the performance that a classifier trained on real-world data would achieve.

5. Conclusions

This study aimed to demonstrate how farms of different sizes, all with different datasets, can work together to train a central disease classifier. This classifier can then be used by individual farms, with or without sharing data. We found that selecting the right model architecture is crucial and that a simple application of federated averaging may not result in a robust classifier in this non-i.i.d. problem. We also discovered that in such a non-i.i.d. setting, q-fair FL is not a suitable solution as it may negatively impact the accuracy of the classifier. Instead, we found that farms can collaborate with minimal data sharing to create a more robust classifier. The type of data sharing is critical in ensuring that the classifier can generalize to data from all farms. Additionally, we observed that farms with diseases shared by other farms performed better in disease diagnosis than those farms with more unshared diseases when using the FL models. For farms whose diseases are all shared with other farms, even 100% accuracy, precision, recall, and F1 score were achieved. This suggests that the performance of the FL model in disease diagnosis can be further improved if more farms use the model with more shared diseases.
In addition to federated averaging and q-fair federated averaging, there are many other FL algorithms. It will be interesting to explore those algorithms in future work. Furthermore, additional data pre-processing methods may be of interest, such as using autoencoders in conjunction with FL [53]. Finally, other model architectures could also be investigated, as the choice of model architecture is crucial in determining the results.

Author Contributions

Conceptualization, W.C., Y.W., H.W. and Z.P.; methodology, W.C.; software, W.C., Y.W. and A.R.; validation, W.C. and A.R.; formal analysis, W.C. and A.R.; investigation, W.C. and A.R.; resources, W.C.; data curation, W.C.; writing—original draft preparation, W.C., Y.W. and A.R.; writing—review and editing, H.W. and Z.P.; visualization, W.C. and A.R.; supervision, H.W. and Z.P.; project administration, H.W. and Z.P.; funding acquisition, H.W. and Z.P. All authors have read and agreed to the published version of the manuscript.

Funding

This research was supported by the Mississippi State University MAFES Strategic Research Initiative (SRI) program and the Mississippi Soybean Promotion Board (08-2024). The authors gratefully acknowledge the funding support.

Data Availability Statement

Data used in this study are publicly available.

Conflicts of Interest

The authors declare that they have no known competing financial interests or personal relationships that could have appeared to influence the work reported in this paper.

References

  1. Agrios, G. Plant Pathology, 5th ed.; Elsevier: Amsterdam, The Netherlands; Academic Press: Burlington, MA, USA, 2005; pp. 79–103. [Google Scholar]
  2. He, Z.; Zhang, Z.; Valè, G.; San Segundo, B.; Chen, X.; Pasupuleti, J. Disease and pest resistance in rice. Front. Plant Sci. 2023, 14, 1333904. [Google Scholar] [CrossRef] [PubMed]
  3. Guan, H.; Yap, P.T.; Bozoki, A.; Liu, M. Federated learning for medical image analysis: A survey. Pattern Recognit. 2024, 151, 110424. [Google Scholar] [CrossRef] [PubMed]
  4. Shahjahan, A.; Duve, T.; Bonman, J. Climate and rice diseases. In Weather and Rice; International Rice Research Institute: Los Baños, Philippines, 1987; pp. 125–137. [Google Scholar]
  5. Liu, Z.; Zhao, J.; Li, Y.; Zhang, W.; Jian, G.; Peng, Y.; Qi, F. Non-uniform distribution pattern for differentially expressed genes of transgenic rice Huahui 1 at different developmental stages and environments. PLoS ONE 2012, 7, e37078. [Google Scholar] [CrossRef]
  6. Kaur, J.; Hazrati Fard, S.M.; Amiri-Zarandi, M.; Dara, R. Protecting farmers’ data privacy and confidentiality: Recommendations and considerations. Front. Sustain. Food Syst. 2022, 6, 903230. [Google Scholar] [CrossRef]
  7. Sykuta, M.E. Big data in agriculture: Property rights, privacy and competition in ag data services. Int. Food Agribus. Manag. Rev. 2016, 19, 57–74. [Google Scholar]
  8. Liu, Z.; Wu, F.; Wang, Y.; Yang, M.; Pan, X. FedCL: Federated contrastive learning for multi-center medical image classification. Pattern Recognit. 2023, 143, 109739. [Google Scholar] [CrossRef]
  9. Li, T.; Sahu, A.K.; Talwalkar, A.; Smith, V. Federated learning: Challenges, methods, and future directions. IEEE Signal Process. Mag. 2020, 37, 50–60. [Google Scholar] [CrossRef]
  10. Wang, Y.; Wang, H.; Peng, Z. Rice diseases detection and classification using attention based neural network and bayesian optimization. Expert Syst. Appl. 2021, 178, 114770. [Google Scholar] [CrossRef]
  11. Alsakar, Y.M.; Sakr, N.A.; Elmogy, M. An enhanced classification system of various rice plant diseases based on multi-level handcrafted feature extraction technique. Sci. Rep. 2024, 14, 30601. [Google Scholar] [CrossRef]
  12. Chaudhary, S.; Kumar, U. An efficient approach for automated system to identify the rice crop disease using intensity level based multi-fractal dimension and twin support vector machine. Arch. Phytopathol. Plant Prot. 2023, 56, 806–834. [Google Scholar] [CrossRef]
  13. Azim, M.A.; Islam, M.K.; Rahman, M.M.; Jahan, F. An effective feature extraction method for rice leaf disease classification. TELKOMNIKA (Telecommun. Comput. Electron. Control) 2021, 19, 463–470. [Google Scholar] [CrossRef]
  14. Wu, X.; Niu, J.; Liu, X.; Shi, M.; Zhu, G.; Tang, S. Tackling Feature-Classifier Mismatch in Federated Learning via Prompt-Driven Feature Transformation. arXiv 2024, arXiv:2407.16139. [Google Scholar]
  15. Marí, N.E.; Agripina, R.; Shen, H.; Mafukidze, B.S. Advances, Challenges & Recent Developments in Federated Learning. Open Access Libr. J. 2024, 11, e12239. [Google Scholar]
  16. Shivam, S.P.S.; Kumar, I. Rice Plant Infection Recognition using Deep Neural Network Systems. In Proceedings of the International Semantic Intelligence Conference (ISIC 2021), New Delhi, India, 25–27 February 2021; pp. 25–27. [Google Scholar]
  17. Ramesh, S.; Vydeki, D. Recognition and classification of paddy leaf diseases using Optimized Deep Neural network with Jaya algorithm. Inf. Process. Agric. 2020, 7, 249–260. [Google Scholar] [CrossRef]
  18. Anandhan, K.; Singh, A.S. Detection of paddy crops diseases and early diagnosis using faster regional convolutional neural networks. In Proceedings of the 2021 International Conference on Advance Computing and Innovative Technologies in Engineering (ICACITE), Greater Noida, India, 4–5 March 2021; IEEE: Piscataway, NJ, USA, 2021; pp. 898–902. [Google Scholar]
  19. Bari, B.S.; Islam, M.N.; Rashid, M.; Hasan, M.J.; Razman, M.A.M.; Musa, R.M.; Ab Nasir, A.F.; Majeed, A.P.A. A real-time approach of diagnosing rice leaf disease using deep learning-based faster R-CNN framework. PeerJ Comput. Sci. 2021, 7, e432. [Google Scholar] [CrossRef]
  20. Deng, R.; Tao, M.; Xing, H.; Yang, X.; Liu, C.; Liao, K.; Qi, L. Automatic diagnosis of rice diseases using deep learning. Front. Plant Sci. 2021, 12, 701038. [Google Scholar] [CrossRef] [PubMed]
  21. Shrivastava, V.K.; Pradhan, M.K.; Minz, S.; Thakur, M.P. Rice plant disease classification using transfer learning of deep convolution neural network. Int. Arch. Photogramm. Remote Sens. Spat. Inf. Sci. 2019, 42, 631–635. [Google Scholar] [CrossRef]
  22. Krishnamoorthy, N.; Prasad, L.N.; Kumar, C.P.; Subedi, B.; Abraha, H.B.; Sathishkumar, V. Rice leaf diseases prediction using deep neural networks with transfer learning. Environ. Res. 2021, 198, 111275. [Google Scholar]
  23. Li, D.; Wang, R.; Xie, C.; Liu, L.; Zhang, J.; Li, R.; Wang, F.; Zhou, M.; Liu, W. A recognition method for rice plant diseases and pests video detection based on deep convolutional neural network. Sensors 2020, 20, 578. [Google Scholar] [CrossRef]
  24. Hu, G.; Wu, H.; Zhang, Y.; Wan, M. A low shot learning method for tea leaf’s disease identification. Comput. Electron. Agric. 2019, 163, 104852. [Google Scholar] [CrossRef]
  25. Ahmad, I.; Hamid, M.; Yousaf, S.; Shah, S.T.; Ahmad, M.O. Optimizing pretrained convolutional neural networks for tomato leaf disease detection. Complexity 2020, 2020, 1–6. [Google Scholar] [CrossRef]
  26. Latif, M.R.; Khan, M.A.; Javed, M.Y.; Masood, H.; Tariq, U.; Nam, Y.; Kadry, S. Cotton leaf diseases recognition using deep learning and genetic algorithm. Comput. Mater. Contin. 2021, 69, 2917–2932. [Google Scholar]
  27. Caldeira, R.F.; Santiago, W.E.; Teruel, B. Identification of cotton leaf lesions using deep learning techniques. Sensors 2021, 21, 3169. [Google Scholar] [CrossRef]
  28. Patil, B.V.; Patil, P.S. Computational method for Cotton Plant disease detection of crop management using deep learning and internet of things platforms. In Evolutionary Computing and Mobile Sustainable Networks: Proceedings of ICECMSN 2020; Springer: Berlin/Heidelberg, Germany, 2021; pp. 875–885. [Google Scholar]
  29. Harshitha, G.; Kumar, S.; Rani, S.; Jain, A. Cotton disease detection based on deep learning techniques. In Proceedings of the 4th Smart Cities Symposium (SCS 2021), Online, 21–23 November 2021; IET: Stevenage, UK, 2021; Volume 2021, pp. 496–501. [Google Scholar]
  30. Wang, C.; Du, P.; Wu, H.; Li, J.; Zhao, C.; Zhu, H. A cucumber leaf disease severity classification method based on the fusion of DeepLabV3+ and U-Net. Comput. Electron. Agric. 2021, 189, 106373. [Google Scholar] [CrossRef]
  31. Wang, C.; Zhou, J.; Zhao, C.; Li, J.; Teng, G.; Wu, H. Few-shot vegetable disease recognition model based on image text collaborative representation learning. Comput. Electron. Agric. 2021, 184, 106098. [Google Scholar] [CrossRef]
  32. Memon, M.S.; Kumar, P.; Iqbal, R. Meta Deep Learn Leaf Disease Identification Model for Cotton Crop. Computers 2022, 11, 102. [Google Scholar] [CrossRef]
  33. Sudhesh, K.; Sowmya, V.; Kurian, S.; Sikha, O. AI based rice leaf disease identification enhanced by Dynamic Mode Decomposition. Eng. Appl. Artif. Intell. 2023, 120, 105836. [Google Scholar]
  34. Aggarwal, M.; Khullar, V.; Goyal, N.; Prola, T.A. Resource-efficient federated learning over IoAT for rice leaf disease classification. Comput. Electron. Agric. 2024, 221, 109001. [Google Scholar] [CrossRef]
  35. Ritharson, P.I.; Raimond, K.; Mary, X.A.; Robert, J.E.; Andrew, J. DeepRice: A deep learning and deep feature based classification of Rice leaf disease subtypes. Artif. Intell. Agric. 2024, 11, 34–49. [Google Scholar] [CrossRef]
  36. Padhi, J.; Mishra, K.; Ratha, A.K.; Behera, S.K.; Sethy, P.K.; Nanthaamornphong, A. Enhancing Paddy Leaf Disease Diagnosis-a Hybrid CNN Model using Simulated Thermal Imaging. Smart Agric. Technol. 2025, 10, 100814. [Google Scholar] [CrossRef]
  37. Abdulridha, J.; Ampatzidis, Y.; Kakarla, S.C.; Roberts, P. Detection of target spot and bacterial spot diseases in tomato using UAV-based and benchtop-based hyperspectral imaging techniques. Precis. Agric. 2020, 21, 955–978. [Google Scholar] [CrossRef]
  38. Konečnỳ, J.; McMahan, H.B.; Yu, F.X.; Richtárik, P.; Suresh, A.T.; Bacon, D. Federated learning: Strategies for improving communication efficiency. arXiv 2016, arXiv:1610.05492. [Google Scholar]
  39. McMahan, B.; Moore, E.; Ramage, D.; Hampson, S.; y Arcas, B.A. Communication-efficient learning of deep networks from decentralized data. In Proceedings of the 20th International Conference on Artificial Intelligence and Statistics, Fort Lauderdale, FL, USA, 20–22 April 2017; pp. 1273–1282. [Google Scholar]
  40. Khan, F.S.; Khan, S.; Mohd, M.N.H.; Waseem, A.; Khan, M.N.A.; Ali, S.; Ahmed, R. Federated learning-based UAVs for the diagnosis of Plant Diseases. In Proceedings of the 2022 International Conference on Engineering and Emerging Technologies (ICEET), Kuala Lumpur, Malaysia, 27–28 October 2022; IEEE: Piscataway, NJ, USA, 2022; pp. 1–6. [Google Scholar]
  41. Deng, F.; Mao, W.; Zeng, Z.; Zeng, H.; Wei, B. Multiple diseases and pests detection based on federated learning and improved faster R-CNN. IEEE Trans. Instrum. Meas. 2022, 71, 1–11. [Google Scholar] [CrossRef]
  42. Li, T.; Sanjabi, M.; Beirami, A.; Smith, V. Fair resource allocation in federated learning. arXiv 2019, arXiv:1905.10497. [Google Scholar]
  43. Wang, J.; Chen, K.Z.; Das Gupta, S.; Huang, Z. Is small still beautiful? A comparative study of rice farm size and productivity in China and India. China Agric. Econ. Rev. 2015, 7, 484–509. [Google Scholar] [CrossRef]
  44. Sandler, M.; Howard, A.; Zhu, M.; Zhmoginov, A.; Chen, L.C. Mobilenetv2: Inverted residuals and linear bottlenecks. In Proceedings of the IEEE Conference on Computer Vision and Pattern Recognition, Salt Lake City, UT, USA, 18–23 June 2018; pp. 4510–4520. [Google Scholar]
  45. Shah, J.; Prajapati, H.; Dabhi, V. Rice Leaf Diseases. UCI Machine Learning Repository. 2019. Available online: https://doi.org/10.24432/C5R013 (accessed on 25 February 2025).
  46. Hossain, M.F.; Abujar, S.; Noori, S.R.H.; Hossain, S.A. Dhan-Shomadhan: A Dataset of Rice Leaf Disease Classification for Bangladeshi Local Rice. In Mendeley Data; Elsevier: Amsterdam, The Netherlands, 2021. [Google Scholar] [CrossRef]
  47. Sethy, P.K. Rice Leaf Disease Image Samples. In Mendeley Data; Elsevier: Amsterdam, The Netherlands, 2020. [Google Scholar] [CrossRef]
  48. Do, H.M. Rice Diseases Image Dataset. Kaggle. 2020. Available online: https://www.kaggle.com/datasets/minhhuy2810/rice-diseases-image-dataset (accessed on 25 February 2025).
  49. Kein, A. Rice Diseases Dataset. GitHub. 2019. Available online: https://github.com/aldrin233/RiceDiseases-dataset (accessed on 25 February 2025).
  50. Beutel, D.J.; Topal, T.; Mathur, A.; Qiu, X.; Fernandez-Marques, J.; Gao, Y.; Sani, L.; Li, K.H.; Parcollet, T.; de Gusmão, P.P.B.; et al. Flower: A Friendly Federated Learning Framework. 2022. Available online: https://hal.science/hal-03601230/ (accessed on 25 February 2025).
  51. Ye, H.; Liang, L.; Li, G.Y. Decentralized federated learning with unreliable communications. IEEE J. Sel. Top. Signal Process. 2022, 16, 487–500. [Google Scholar] [CrossRef]
  52. Rice, U. How Rice Grows. Available online: https://www.usarice.com/thinkrice/discover-us-rice/how-rice-grows (accessed on 7 April 2025).
  53. Chorney, W.; Wang, H. Towards federated transfer learning in electrocardiogram signal analysis. Comput. Biol. Med. 2024, 170, 107984. [Google Scholar] [CrossRef]
Figure 1. In the first step of the federated learning process, the server broadcasts its current weights θ to the farms.
Mathematics 13 01401 g001
Figure 2. In the second step of the federated learning process, the farms copy θ i = θ and make an update based on gradient descent on their data.
Mathematics 13 01401 g002
Figure 3. Finally, the farms send θ i to the server, which updates θ based on a weighted average.
Mathematics 13 01401 g003
Figure 4. Illustration of the proposed federated learning approach. Farms optionally aggregate a portion of their data into a common dataset, which is used to train a preliminary model. After the preliminary model is trained, it is used as the starting point in a federated approach, where each farm sends model updates to a server in order to train the final model.
Mathematics 13 01401 g004
Figure 5. Sample images from each farm for each class.
Mathematics 13 01401 g005
Figure 6. Accuracy per client using federated averaging for (a) MobileNet, (b) ADSNN-BO, and (c) MobileNet with 50% of the data used for centralized pretraining.
Mathematics 13 01401 g006
Table 1. Related studies of plant disease detection using deep learning techniques.
YearMethod/TechnologyCrop SpeciesCrop DiseaseDataset SizeData PrivacyReference
2019Deep neural network with Jaya optimization algorithm (DNNJOA)RiceBacterial blight, brown spot, sheath rot and blast diseasesField self-acquired; 650 images×[17]
2019CNN with SVMRiceRice blast, bacterial leaf blight, sheath blightField self-acquired; 619 images×[21]
2019Low shot learning, conditional deep convolutional generative adversarial networks (C-DCGAN)TeaRed leaf spot, leaf blight, red scabField self-acquired; 15,000 images×[24]
2020Custom DCNN, YOLOv3, Faster-RCNNRiceRice sheath blight, rice stem borer symptoms, rice brown spotsField self-acquired; 5320 images; 4290 video frames from 5 videos×[23]
2020VGG Net, ResNet, Inception V3TomatoLate blight, septoria leaf spot, yellow-curvedLaboratory-based dataset; 2364 images×[25]
2021ResNet, Genetic algorithm, Cubic SVMCottonAreolate mildew, Myrothecium leaf spot, sore shinField self-acquired; 3000 images×[26]
2021ResNetCottonLeaf with lesionField acquired; 60,659 images×[27]
2021MobileNet-based ADSNN-BORiceBrown spot, rice hispa damage, Leaf blastPublic Kaggle dataset; 2370 images×[10]
2021Faster R-CNN, Mask R-CNNRiceBrown spot, sheath blight, Blast, leaf streak1500 self-acquired images by camera and mobile phone×[18]
2021VGG-19, LeNet-5, MobileNetV2RiceBrown Spot, hispa, Leaf Blast, Bacterial Leaf, Leaf SmutPublic dataset; 2212 images×[16]
2021Custom CNNCottonBacterial blight, Alternaria, Cercospora, gray mildew, fusarium wiltField self-acquired×[28]
2021ResNet, Conv-LSTMCottonBacterial blight, Alternaria leaf spot, gray mildew, magnesium deficiency, Cercospora, fusarium wiltPublic Kaggle dataset×[29]
2021DeepLabV3+, U-NetCucumberCucumber downy mildew, cucumber powdery mildew, cucumber virus diseaseField self-acquired; 1000 images×[30]
2021Faster R-CNNRiceBrown spot, rice hispa, rice blastField self-acquired×[19]
2021Inception-ResNet-v2, CNNRiceLeaf blast, brown spot, bacterial blightPublic dataset; 5200 images×[22]
2021Ensemble model of DenseNet-121, SE-ResNet-50, ResNeSt-50RiceBlast, false smut, neck blast, sheath blight, bacterial stripe disease, and brown spotField self-acquired; 33,026 images×[20]
2021Image text collaborative representation learning (ITC-Net)Tomato & CucumberTomato powdery mildew, early blight; Cucumber powdery mildew, virus disease, downy mildewField self-acquired; 1516 text-described images×[31]
2022Meta-learningCottonLeaf spot, nutrient deficiency, powdery mildew, target spot, verticillium wilt, leaf curlField self-acquired; 2385 images×[32]
2023DenseNet121, XceptionNet, Dynamic mode decompositionRiceBacterial blight, blast, brown spot, and tungroPublic dataset; 3416 images×[33]
2024Resource-efficient federated learningRiceBacterial leaf blight, blast, brown spot, and tungroPublic dataset; 5932 images[34]
2024Custom CNN modelRiceTungro, blast, bacterial blight, brown spotPublic dataset; 5932 images×[35]
2025Hybrid CNN modelRiceTungro, blast, bacterial blight, brown spotPublic dataset; 5932 images×[36]
-Our proposed approachRiceBlast, blight, brown spot, hispa, leaf scaled, leaf smut, tungro5 public datasets-
Table 2. Summary of the data held by each farm by class, as well as totals for each class.
ClassBlastBlightBrown SpotHealthyHispaLeaf ScaledLeaf SmutTungroTotal
Farm Number
1404040120
214401584160013085932
377952314885653355
4578296235
5272283139217911
Total254819892398148856521740130810,553
Table 3. Comparison of test performances on the combined dataset. # indicates farm serial number.
DatasetAccuracy (%)Precision (%)Recall (%)F1 Score (%)
Overall
(N = 10,789)
94.07 ± 1.0687.13 ± 1.5085.78 ± 2.0886.21 ± 1.47
Farm #1
(n1 = 120)
99.92 ± 0.0899.92 ± 0.0899.91 ± 0.0899.92 ± 0.08
Farm #2
(n2 = 5932)
93.13 ± 0.0686.84 ± 1.2385.83 ± 1.8285.76 ± 0.04
Farm #3
(n3 = 3355)
94.73 ± 1.1386.47 ± 0.0684.61 ± 1.3485.44 ± 1.03
Farm #4
(n4 = 276)
93.04 ± 1.4389.65 ± 4.8589.43 ± 5.2089.41 ± 0.49
Farm #5
(n5 = 1106)
93.03 ± 2.0789.70 ± 6.2689.48 ± 6.2489.49 ± 6.25
Table 4. Comparison of test performances on the combined dataset without using FL (training on 2 larger datasets: Site 2 (n2 = 5932) and Site 3 (n3 = 3355)). # indicates farm serial number.
DatasetAccuracy (%)Precision (%)Recall (%)F1 Score (%)
Farm #2
(n2 = 5932)
Farm #3
(n3 = 3355)
Farm #1
(n1 = 120)
2.09 ± 2.091.39 ± 1.392.09 ± 2.091.67 ± 1.67
Farm #4
(n4 = 276)
26.08 ± 1.5934.06 ± 1.5635.66 ± 0.7619.49 ± 0.25
Farm #5
(n5 = 1106)
30.53 ± 0.0814.48 ± 1.8326.90 ± 1.9014.70 ± 0.98
Table 5. Overview of aggregated experimental results. Performance metrics are reported as means over five-fold cross-validation.
ModelAlgorithmPortionAccuracy (%)Precision (%)Recall (%)F1 Score (%)
MobileNetFedAvg61.0961.0961.0961.09
q-FedAvg21.5223.1821.5218.04
LF-FedAvg50.4854.1150.4848.79
PT-FedAvg10%61.0963.0961.0959.34
PT-FedAvg30%59.6062.3659.6057.66
PT-FedAvg50%61.1662.1961.1659.51
ADSNN-BOFedAvg70.6672.6070.6671.03
q-FedAvg32.3631.5632.8131.64
LF-FedAvg64.7968.7364.7964.04
PT-FedAvg10%80.1978.7080.1978.47
PT-FedAvg30%81.7781.9581.7779.68
PT-FedAvg50%83.1484.1483.1482.17
Table 6. Performance of the ADSNN-BO model on the data from each individual farm for 50% of the data used for centralized pretraining. # indicates farm serial number.
FarmMetrics (%)Fold 1Fold 2Fold 3Fold 4Fold 5Average
Farm #1
(n1 = 120)
Accuracy66.6666.6650.0066.6666.6663.33
Precision55.5560.0060.0050.0050.0055.11
Recall66.6666.6650.0066.6666.6663.33
F1 score60.0062.9651.8555.5555.5557.18
Farm #2
(n2 = 5932)
Accuracy100.00100.00100.00100.00100.00100.00
Precision100.00100.00100.00100.00100.00100.00
Recall100.00100.00100.00100.00100.00100.00
F1 score100.00100.00100.00100.00100.00100.00
Farm #3
(n3 = 3355)
Accuracy39.4065.3764.4765.6771.6861.32
Precision43.4070.8771.1266.5773.5865.11
Recall39.4065.3764.4765.6771.6861.32
F1 score35.1259.1166.3965.4671.3159.48
Farm #4
(n4 = 276)
Accuracy100.00100.00100.00100.00100.00100.00
Precision100.00100.00100.00100.00100.00100.00
Recall100.00100.00100.00100.00100.00100.00
F1 score100.00100.00100.00100.00100.00100.00
Farm #5
(n5 = 1106)
Accuracy30.0050.9055.4560.0079.0455.08
Precision25.5750.3957.3058.1283.1554.91
Recall30.0050.9055.4560.0079.0455.08
F1 score24.1146.9852.3755.6280.1351.84
Table 7. Performance per farm for ADSNN-BO for 50% of the data used for centralized pretraining.
FarmsAccuracy (%)Precision (%)Recall (%)F1 Score (%)
Farm 1 (n1 = 120)63.3355.1163.3357.18
Farm 2 (n2 = 5932)100.00100.00100.00100.00
Farm 3 (n3 = 3355)61.3265.1161.3259.48
Farm 4 (n4 = 276)100.00100.00100.00100.00
Farm 5 (n5 = 1106)55.0854.9155.0851.84
Weighted Average83.1484.1383.1482.17
Disclaimer/Publisher’s Note: The statements, opinions and data contained in all publications are solely those of the individual author(s) and contributor(s) and not of MDPI and/or the editor(s). MDPI and/or the editor(s) disclaim responsibility for any injury to people or property resulting from any ideas, methods, instructions or products referred to in the content.

