Article

Temperature-Dependent Kinetic Modeling of Nitrogen-Limited Batch Fermentation by Yeast Species

1
Biosystems and Bioprocess Engineering, Bio2Eng, IIM-CSIC Spanish National Research Council, 36208 Vigo, Spain
2
Department of Applied Mathematics II, University of Vigo, 36310 Vigo, Spain
3
Yeastomics Laboratory, Food Biotechnology Department, IATA-CSIC Spanish National Research Council, 46980 Valencia, Spain
4
AquaBioTech, IIM-CSIC Spanish National Research Council, 36208 Vigo, Spain
*
Author to whom correspondence should be addressed.
Mathematics 2025, 13(9), 1373; https://doi.org/10.3390/math13091373
Submission received: 24 February 2025 / Revised: 9 April 2025 / Accepted: 14 April 2025 / Published: 23 April 2025
(This article belongs to the Special Issue Modeling, Identification and Control of Biological Systems)

Abstract

:
Yeast batch fermentation is widely used in industrial biotechnology, yet its performance is strongly influenced by temperature and nitrogen availability, which affect growth kinetics and metabolite production. The development of predictive models that accurately describe these effects is essential for automating and optimizing fermentation design, reducing trial-and-error experimentation, and improving process efficiency and product quality. However, most mathematical models focus on primary metabolism and lack a systematic approach to integrate the effects of temperature. Existing models often rely on empirical corrections with limited predictive power beyond specific experimental conditions. Furthermore, there is no unified framework for optimizing fermentation processes while accounting for the temperature-dependent metabolic responses. We addressed these gaps by developing a temperature-dependent kinetic model for nitrogen-limited batch fermentation by Saccharomyces cerevisiae. The modeling approach is based on advanced systems identification, integrating identifiability analyses (structural and practical), multi-experiment parameter estimation, and automated model selection to determine the most appropriate temperature dependencies for key metabolic processes. Validated across five industrial S. cerevisiae strains in an illustrative example related to wine fermentation, the model exhibited strong predictive performance (NRMSE < 10.5 % , median R2 > 0.95 ) and enabled simulation-based process optimization, including nitrogen-supplementation strategies and strain selection for improved fermentation outcomes. By providing a systematic modeling framework that accounts for temperature effects, this work bridges a critical gap in predictive modeling and advances the rational design and control of industrial fermentation processes.

1. Introduction

Yeast batch fermentation is essential for industrial biotechnology, facilitating the efficient conversion of substrates into desired products. Its relevance spans various industries including the production of biofuels, pharmaceuticals, food, food ingredients, beverages, and specialty chemicals [1,2]. The yeast Saccharomyces cerevisiae, commonly known as baker’s yeast, plays a critical role in various industrial applications. However, beyond its role in the production of industrially relevant primary metabolites (ethanol, glycerol, succinate), S. cerevisiae is also central to the synthesis of secondary metabolites of high industrial value. These compounds not only contribute to the aroma and flavor of food and beverages but also serve as key ingredients in the pharmaceutical, cosmetic, and bio-based chemical industries [1,3,4]. Understanding the production of primary and secondary metabolites is crucial for optimizing industrial fermentation processes for various applications.
Interestingly, the performance of fermentation processes is strongly related to abiotic factors such as temperature [5,6] or nitrogen availability [7,8]. The activity of S. cerevisiae is highly temperature dependent, affecting the rate at which sugars are converted to ethanol. Lower temperatures (around 10–15 °C) result in slow fermentation and can lead to a higher retention of aromatic compounds [9]. In contrast, high temperatures considerably reduce process time and might increase the yield of some higher alcohols [10]. In addition, insufficient levels of assimilable nitrogen contribute to stuck or sluggish fermentations [7]. A minimum of 120–140 m g N / L assimilable nitrogen is required to achieve a standard fermentation rate in batch fermentation. In media that may lack this key nutrient, such as in industrial wine fermentation, it has become common practice to supplement the medium with nitrogen sources during the process [11].
Mathematical modeling is a valuable tool for understanding the complexities of yeast fermentation processes, offering the potential for rational design, optimization, and control [12]. Several models have been developed to simulate batch fermentation using S. cerevisiae [13,14], each of which offers specific strengths.
However, despite significant advances in modeling, considerable gaps remain, particularly in modeling secondary metabolism. Most existing models focus on the kinetics of metabolites associated with yeast growth and energy production, capturing aspects of primary metabolism such as the production of ethanol, glycerol, and succinate. These models are formulated as sets of ordinary differential equations to describe yeast growth, nutrient uptake, and products release. Some models use the logistic growth model to describe yeast growth [15,16], explicitly incorporating temperature-dependent kinetic parameters. However, the reliance on logistic growth limits their applicability to the specific fermentation medium. More mechanistic alternatives use Monod-type formulations to describe yeast growth as limited by specific substrates (sugars and/or nitrogen) [13,14,17,18]. Coleman et al. [13] or David et al. [18] explored the role of temperature by calibrating the Monod-based model for different temperature conditions, obtaining distinct parameter sets for each temperature. Although this allows the model to fit multiple datasets, its applicability remains restricted to the specific yeast strain and tested temperature conditions.
Only a limited number of models account for the production of secondary metabolites including aromatic compounds. These models use discontinuous implementations in various phases with descriptions based on empirical formulations [19] or more mechanistic kinetic formulations [20]. Only recently, Moimenta et al. [21] proposed a continuous kinetic model that describes the production of various primary and secondary metabolites. The model incorporates an empirical representation of metabolic regulation as a clue to initiate or repress the release of specific compounds at different stages of the process. These models are well suited to explain fermentation for different yeast species. However, they are not well suited for process optimization because they do not account for the role of abiotic factors. In most cases, they have not been tested under different initial conditions (fermentation medium composition or yeast inoculum); therefore, their extrapolation capabilities have not been fully determined.
In this study, we propose a model that accounts for the role of temperature, the addition of nitrogen, and production of various secondary metabolites. A critical aspect of this study is model identification, which integrates structural and practical identifiability analyses and multi-experimental parameter estimation [22]. We also propose the formulation and solution of a mixed-integer nonlinear dynamic optimization problem to automatically select the formulation for the temperature dependence and kinetic parameters of the model.
The model was validated for an industrially relevant example: wine fermentation. We considered five industrial S. cerevisiae strains under different temperature and sugar conditions, demonstrating strong predictive performance and applicability across diverse fermentation settings. We further illustrated its ability to predict and mitigate stuck fermentations, providing insight into nitrogen limitation and temperature-induced metabolic changes that can hinder process completion. Additionally, the model facilitates multi-objective process optimization, allowing for the rational selection of yeast strains and operating conditions to achieve specific production goals, such as balancing ethanol yield, fermentation time, and secondary metabolite composition.
By providing a systematic modeling framework that integrates temperature effects into predictive modeling, this study bridges a critical gap in fermentation process modeling and advances the rational design, control, and automation of industrial yeast fermentation processes, thereby improving both efficiency and product quality. The proposed approach is relevant for understanding yeast metabolism but also provides a foundation for optimizing biotechnological processes in which temperature plays a critical regulatory role.

2. Materials and Methods

2.1. Experimental Materials and Methods

Yeast Strains and Inoculation. Five commercial Saccharomyces cerevisiae strains were used in the present study. The yeasts are denoted as Yeast1 to Yeast5. The yeasts were obtained as active dry yeast (ADY) and inoculated following the manufacturer’s rehydration protocol (15 g / hL ADY, 37 °C, 20 min) with GO-Ferm® Protect (30 g / hL ), Lallemand SA, Montreal, QC, Canada.
Fermentation medium composition. Fermentations were carried out using a medium emulating wine, synthetic grape must (SGM) adapted from [23], containing 210 g / L or 250 g / L of total sugars (glucose and fructose in equal proportions), 150 mg N / L of assimilable nitrogen in the form of amino acids and NH4Cl, and adjusted to pH 3.3. Additional components included malic acid (6 g / L ), citric acid (6 g / L ), phosphate and sulfate salts, trace elements, vitamins, and phytosterols, to support anaerobic growth.
Fermentation Conditions. Fermentations were conducted in 250 mL laboratory bottles (Schott–Duran) fitted with airlocks at three different temperatures (12 °C, 18 °C, or 25 °C). The temperatures were selected to reflect realistic industrial conditions commonly encountered in wine fermentation, particularly within the range known to significantly influence metabolic outcomes and flavor-profile formation. Wineries usually select lower temperatures (in the range of 15 °C–20 °C for white wines); we also included 25 °C to ensure a more flexible approach in predicting yeast behavior response to temperature variations and promote the formation of higher alcohols [24]. This broader range (12 °C–25 °C) allows for better process design adaptability. Fermentation kinetics were monitored by CO2 production (mass loss), and samples were collected at defined CO2 release stages (eight sampling times). Nitrogen supplementation (20 g / hL Nutrient Vit™, Lallemand SA, Montreal, QC, Canada) was applied at inoculation and at 1/3 fermentation completion.
Metabolite Analyses. Amino acids and ammonia were quantified by UPLC (Dionex Ultimate 3000) after derivatization [25]. Sugars, organic acids, and fermentation by-products were measured using HPLC (Thermo Fisher Scientific-ES, Madrid, Spain) with RI and UV detectors, using a HyperREZ XP Carbohydrate H+ column and sulfuric acid mobile phase (0.6 mL / min , 50 °C). Aromatic compounds (higher alcohols) were analyzed by gas chromatography (TRACE 1600, Thermo Fisher) using headspace solid-phase microextraction (HS-SPME) with a PDMS fiber. Separation was performed on an Agilent HP INNOWax column with helium as the carrier gas.

2.2. Theoretical Materials and Methods

The model identification process followed an iterative procedure [22], ensuring both theoretical soundness and predictive accuracy. The procedure consists of the following steps:

2.2.1. Model Formulation

The dynamics of a biological system is characterized by the vector of state variables x X R n x , which is the unique solution of the set of nonlinear ordinary differential equations.
x ˙ = f ( x , u , θ , t )
where x ˙ = d x d t , u U R n u corresponds to the external factors and θ Θ R n θ is the vector of the model parameters, where θ is the feasible parameter space and t represents time.
In addition, given an experimental scheme, with n e experiments, n o e observables per experiment e and n s e , o sampling times per experiment e and observable o, y e , o Y R n s e , o will regard the vector of n s e , o discrete-time measurements, as follows:
y e , o ( t s e , o , u , θ ) = g e , o ( x ( u , θ , t s e , o ) , θ , t ) ; s = 1 , , n s e , o
where t s e , o regards the s th sampling time for observable o in experiment e. Thus, every experimental (measured) data will be denoted as y m s e , o and, similarly, the corresponding model predictions will be denoted as y s e , o .

2.2.2. Structural Identifiability Analysis

This step, often overlooked, determines whether it is possible to assign unique values to parameters within a given model-observable pair under ideal experimental conditions, thus ensuring that the model structure allows for unambiguous parameter inference. Although the structural identifiability of general nonlinear dynamic systems remains an open question, several software tools facilitate this analysis. In this study, we consider two alternatives: GenSSI2 [26] and SIAN [27]. GenSSI2 is based on the generating series approach, and, if successful, it guarantees global identifiability, implying that the parameters can be uniquely determined within the entire feasible region. This is based on symbolic manipulation of the model equations. In contrast, SIAN is a symbolic numeric randomized algorithm that combines differential algebra and Taylor series approaches with a Monte Carlo randomized approach. Owing to the incorporation of the numeric randomized algorithm, SIAN has good scalability properties.

2.2.3. Parameter Estimation

Given the measurements, the aim is to estimate the unknown model parameters θ to minimize the distance between the data and model predictions, as measured by the widely used weighted least-squares function:
J L S Q ( θ ) = e = 1 n e o = 1 n o e s = 1 n s e , o y s e , o ( θ ) y m s e , o q s e , o 2
where q s e , o corresponds to a weighting coefficient, which in this study, corresponds to the maximum measured data q s e , o = m a x ( q s e , o ) , s .
The problem is then formulated as a nonlinear optimization problem, where the decision variables are the parameters θ , and the objective is to minimize J L S Q subject to the system dynamics in Equations (1) and (2) and the upper and lower bounds for the parameters: θ L θ θ U .

2.2.4. Practical Identifiability Analysis

Using the Fisher information matrix ( F ) [28], it is possible to quantify the uncertainty of the parameters by computing confidence intervals and identifying potential correlations between parameters that may affect reliable estimation.
The Fisher information matrix is defined as follows:
F = E ( J l s q ( θ ) θ T J l s q ( θ ) θ )
where E is the mathematical expectation for the optimal parameters values θ .
The confidence interval ( ρ i ) associated with each parameter estimate can be obtained using the covariance matrix:
± t α / 2 γ C ii
where t α / 2 γ is given by the Student’s t distribution, γ = N d η degrees of freedom, and ( 1 α ) 100 % is the confidence interval selected, typically 95 % . The covariance matrix can be approximated using the Cramèr–Rao inequality as follows:
C F ( θ )

2.2.5. Cross-Validation

The predictive capability of the model is evaluated using a leave-one-out cross-validation approach. In this methodology, independent datasets were omitted during the calibration phase and subsequently used to validate the model under untested conditions. Specifically, at each iteration, a single experiment was excluded from the training dataset, and the model was then trained on the remaining data while being tested in the excluded experiment. The root-mean-square error (NRMSE) was computed to compare the model performance between the training and testing datasets.

2.3. Numerical Methods and Tools

In this work, we used the AMIGO2 toolbox (https://sites.google.com/site/amigo2toolbox accessed on 1 April 2025, [22]) to automate model identification. The AMIGO2 toolbox is a comprehensive software package tailored for dynamic modeling, optimization, and control in systems biology. It facilitates parameter estimation, sensitivity and practical identifiability analyses, and various statistical assessments for evaluating goodness of fit.The system of ordinary differential equations (ODEs) was solved using the CVODES solver [29], which is automatically integrated into AMIGO2. CVODES is part of the SUNDIALS suite of ODE solvers, combining two numerical methods: the Adams–Moulton multistep method and the backward differentiation formula (BDF), along with the nonlinear iteration method and the capability to compute parametric sensitivities. The method implements error control, taking into account the relative and absolute integration tolerances set by the user ( r t o t / a t o t = 1.0 × 10 7 , in this work). The nonlinear optimization problem was addressed using the hybrid metaheuristic enhanced scatter search (eSS) method [30].

3. Results

3.1. Model Formulation

In this study, we formulated a temperature-dependent model to describe yeast batch fermentation, integrating both primary and secondary modeling components. The primary model captures key biological and biochemical processes, including biomass growth, nutrient uptake, and metabolite production, whereas the secondary model characterizes the temperature dependence of the kinetic parameters. 
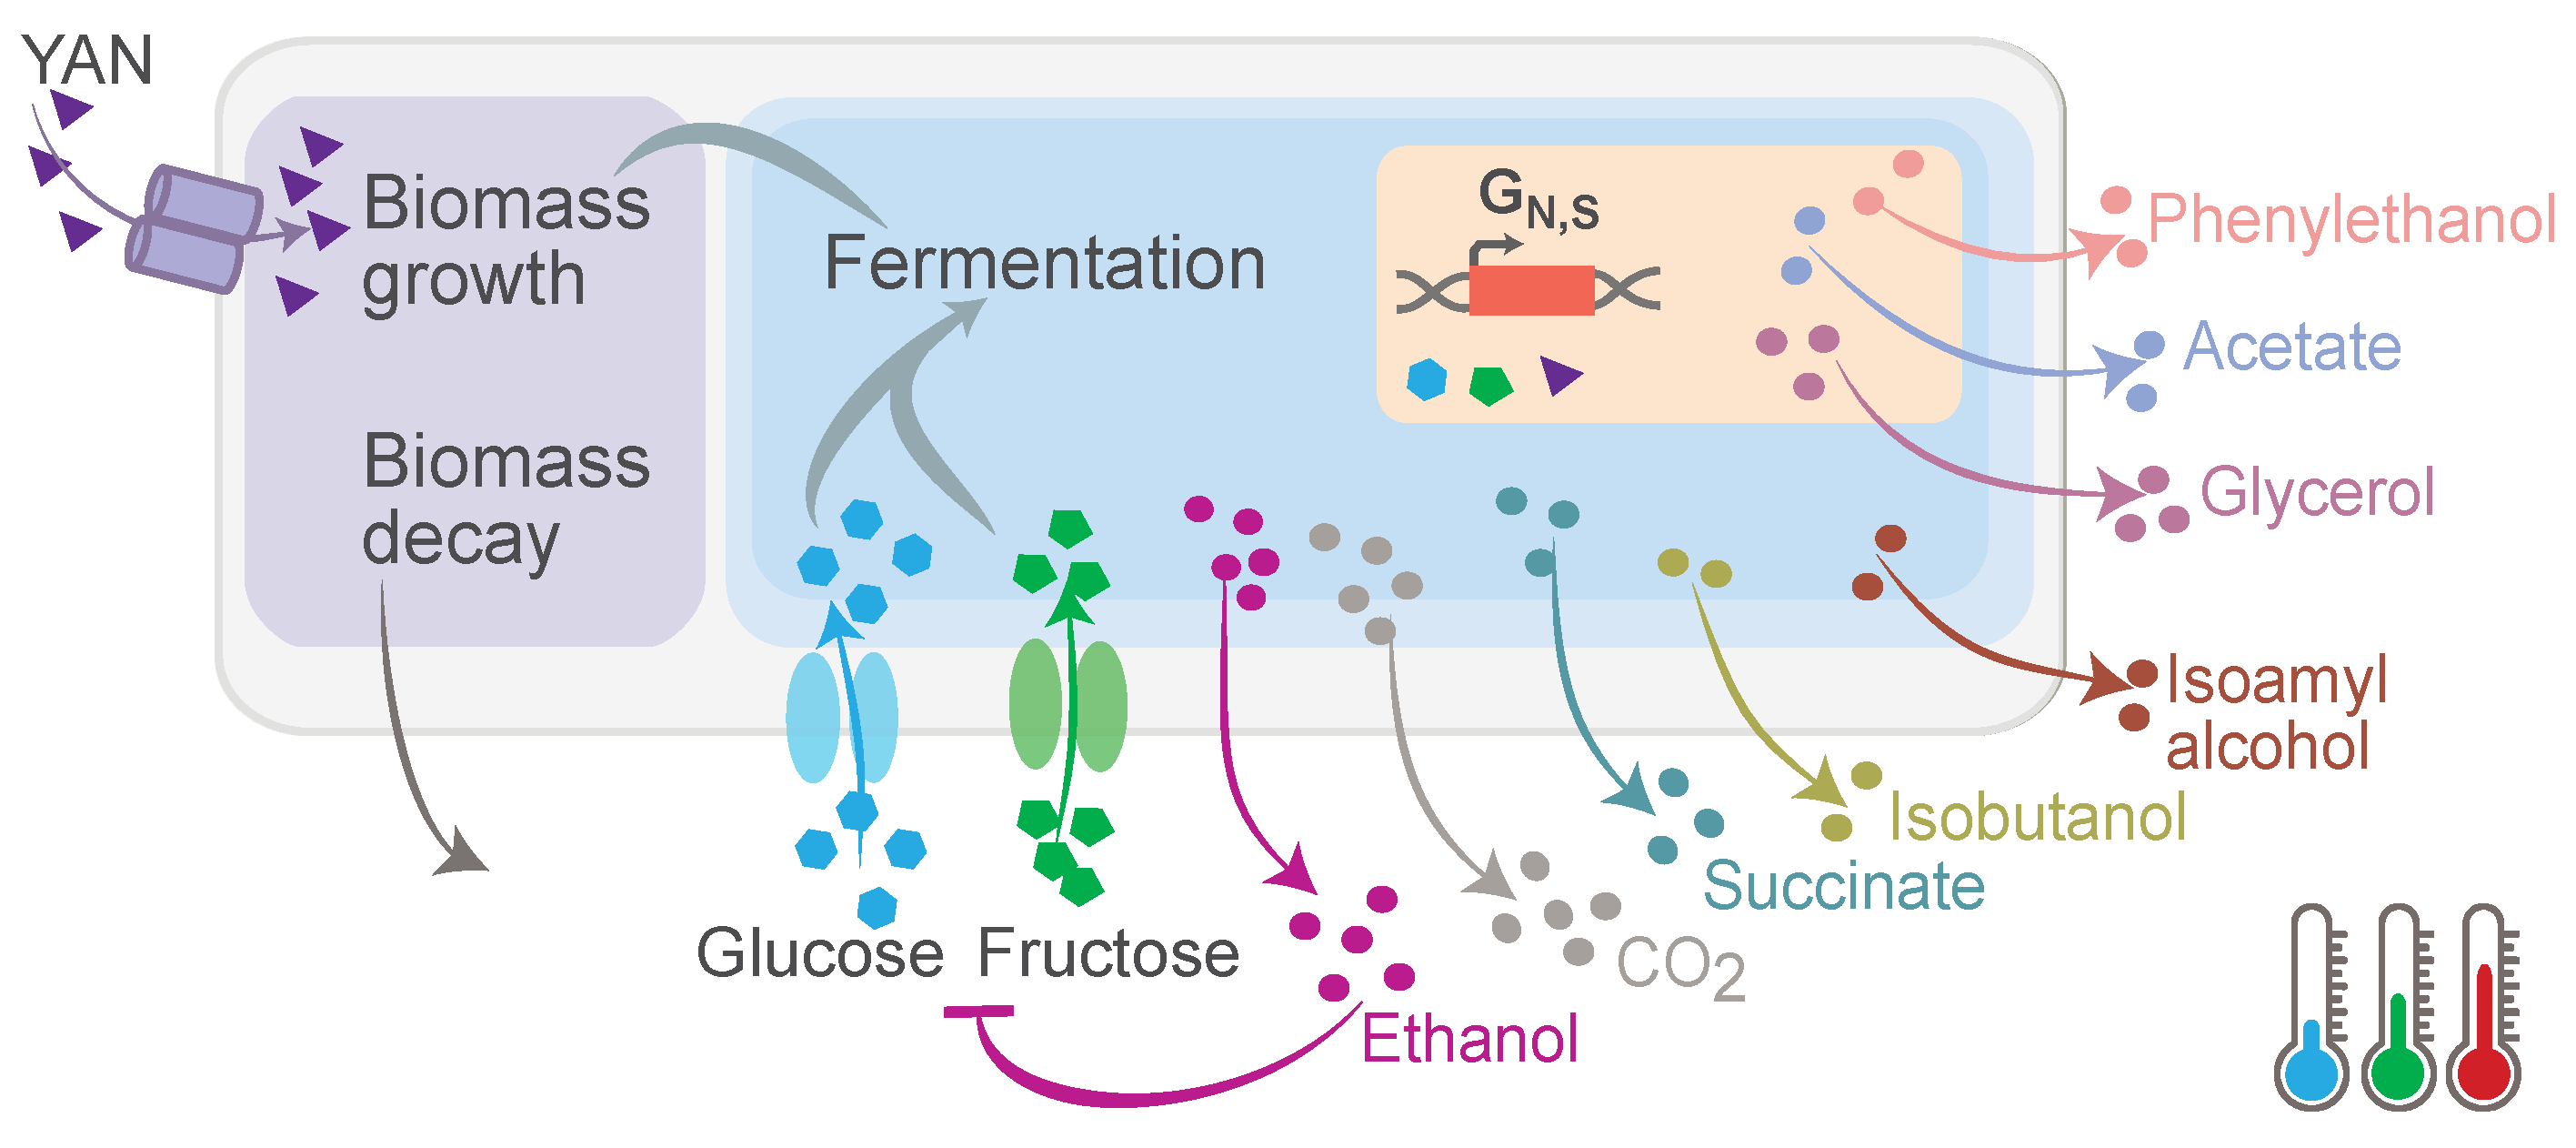
Figure 1 shows a conceptual representation of the model.
The primary model builds upon previously developed models [21] and consists of a system of ordinary differential equations (ODEs) that govern the dynamics of key state variables:
  • Cell growth and viability (X, CFU/L): describes the proliferation of viable yeast cells capable of fermentation.
  • Uptake of substrates: represents the consumption sugars ( G l x and F, g / L ) and yeast-assimilable nitrogen (YAN, g / L ) required for cellular metabolism.
  • Production of primary metabolites: includes the production of ethanol ( E t h , g / L ), carbon dioxide ( C O 2 , g / L ), glycerol ( G l y , g / L ), succinate ( S u c c , g / L ), and acetate ( A c e , g / L ).
  • Production of aromatic and secondary metabolites: includes isoamyl alcohol ( I s o a m y l o l , g / L ), isobutanol ( I s o b u t a n o l , g / L ), and 2-phenylethanol ( P h e n E t h , g / L ), which contribute to the aromatic profile.
  • Gene regulation state ( G N , S ): Represents metabolic changes in response to nitrogen and sugar starvation, influencing the production of specific metabolic products.
The model also incorporates operational inputs, such as temperature (T, °C), nitrogen supplementation, and the timing of nutrient addition ( t a d d , h). All these factors significantly impact fermentation kinetics and product composition.
To account for the role of temperature in fermentation dynamics, we introduced a secondary model that determines how the specific kinetic parameters (growth, transport, and yield) in the primary model are affected by temperature.

3.2. Primary Model: Core Fermentation Dynamics

3.2.1. Modeling Viable Biomass Formation During Nitrogen-Limited Fermentations

Viable cell dynamics was modeled using a Monod-type equation, assuming that yeast-assimilable nitrogen acts as the limiting substrate associated with cell division. The second term accounts for cellular decay, which we assume is proportional to the cellular density.
d X d t = ( μ k d ) · X
d Y A N d t = μ Y X N · X
μ = μ m a x · Y A N Y A N + k N
where μ m a x is the maximum specific growth rate in ( h 1 ); k N = 0.01 ( g N / L ) the Monod parameter as estimated by Coleman et al. [13]; k d ( h 1 ) the cell decay parameter and Y X N ( g CFU / g N ) the nitrogen to biomass yield.

3.2.2. Modeling Fermentation Rate

The sugar concentration comprises glucose and fructose, which are metabolized through the glycolytic pathway into various metabolites. Sugar uptake was described following the Michaelis–Menten model, considering the role of ethanol as a non-competitive inhibitor of sugar uptake.
d G l x d t = v m a x , G l x · X · G l x G l x + k s G l x · ϕ E t h
d F d t = v m a x , F · X · F F + k s F · ϕ E t h
v m a x , G l x ( g Glx / L CFU / Lh ) and v m a x , F ( g F / L CFU / Lh ) correspond to the maximum uptake rates for glucose and fructose, respectively, and k s G l x and k s F are the Michaelis–Menten constants in g / L .
During fermentation, glucose and fructose are uptaken by specific hexose transporters (the HXT family) via facilitated diffusion. However, as ethanol accumulates, there is a certain inhibition of transport. We assume non-competitive inhibition, that is, ethanol accumulation produces changes in the conformation of transporters, reducing transport efficiency even when glucose or fructose are available [31]. This is modeled by incorporating the inhibition term ϕ E t h as follows:
ϕ E t h = 1 1 + E t h k E i
with k E i ( g / L ) the strength of the inhibitory effect.

3.2.3. Modeling Cellular Regulation as a Consequence of Nutrients Starvation

In anaerobic fermentation, yeast metabolism is primarily governed by the availability of sugars and nitrogen sources, with regulatory mechanisms that ensure efficient energy production and survival under nutrient limitations. When nitrogen is available, yeast cells prioritize biomass formation, increasing protein synthesis, nucleotide biosynthesis, and amino-acid metabolism, which are essential for rapid growth. Once nitrogen is limited and as the sugar level decreases, cells transition to a quiescent metabolic state, known as the stationary phase, and metabolism is redirected toward the production of glycerol, acetate, or phenylethanol, ensuring redox homeostasis [20].
To account for these regulatory changes, we used an additional state G N , S whose dynamics is controlled by two empirical functions, ϕ N and ϕ S , to represent the depletion of YAN and sugar concentrations:
d G N , S d t = ( ϕ N · ϕ S G N , S ) τ G N , S
with
ϕ N = 1 Y A N Y A N + k r N
ϕ S = 1 G l x + F G l x + F + k r S
where τ G N , S is an adimensional parameter that controls the velocity of regulation; k r S and k r S are the half-saturation constants in g / L in the sigmoidal functions ( ϕ N and ϕ S ) that regulate the nitrogen and sugar concentration needed to induce the transcriptional changes associated with the stationary phase.

3.2.4. Modeling Metabolite Production During Fermentation

We modeled the production of the metabolites, assuming that their production is proportional to sugar uptake and considering that they are released into the medium at different stages. The equations read as follows:
E t h a n o l : d E t h d t = Y E t h · ( d G l x d t + d F d t )
C O 2 : d C O 2 d t = Y C O 2 · ( d G l x d t + d F d t )
S u c c i n a t e : d Succ d t = Y S u c c ( d G l x d t + d F d t )
G l y c e r o l : d G l y d t = Y G l y ( d G l x d t + d F d t ) ( 1 G N , S )
A c e t a t e : d A c e d t = Y A c e ( d G l x d t + d F d t ) ( 1 G N , S )
I s o a m y l a l c o h o l : d Isoamol d t = Y I s o a m o l ( d G l x d t + d F d t )
I s o b u t a n o l : d Isobutol d t = Y I s o b u t o l ( d G l x d t + d F d t )
P h e n y l e t h a n o l : d Pheneth d t = Y P h e n e t h ( d G l x d t + d F d t ) ( 1 G N , S )
with Y E t h , Y C O 2 , Y S u c c , Y G l y , Y A c e , Y I s o a m o l , Y I s o b u t o l and Y P h e n e t h represent the yields of each metabolite in g / g sugar . Because of the stoichiometry of the reaction, we can fix Y C O 2 = Y E t h .

3.2.5. Model Structural Identifiability

The proposed model consists of a set of 13 ordinary differential equations and 36 kinetic parameters. Note that most states in the model can be measured, with the exception of gene regulation ( G N , S ). Structural identifiability analysis using GenSSI revealed that the model is, at least, locally identifiable. The complexity of the model resulted in a highly nonlinear symbolic system of equations involving the parameters, which is not solvable by the MATLAB 2022b symbolic manipulation toolbox; therefore, global structural identifiability cannot be guaranteed. The combined symbolic–numerical approach implemented in SIAN enabled a complete analysis guaranteeing global structural identifiability.

3.3. Secondary Model: The Role of the Temperature

By integrating a temperature-dependent secondary model, we ensured that the primary model is dynamically adapted to different temperature conditions, allowing for an improved prediction of fermentation kinetics across a range of environmental settings. We considered two alternative formulations for temperature dependence: (1) the Arrhenius-based model that describes the exponential relationship between reaction rates and temperature, which is commonly used for biochemical kinetics ( θ i , f A = A i + B i e x p ( C i / T ) ); and (2) the quadratic function model ( θ i , f Q F = A i + B i T + C i T 2 ) inspired by the Ratkowsky model [32], which captures nonlinear temperature effects and offers flexibility in describing yeast metabolic responses within the operational temperature range.
To automatically select the best temperature-dependent model, we defined the biological parameters as follows:
θ i ( T ) = w θ i θ i , f A + 1 w θ i θ i , f Q F
where θ i ( T ) are the set of parameters that could depend on temperature; θ i , f A and θ i , Q F refer to the secondary models Arrhenius (A) and quadratic (QF), respectively; w θ i regards a binary parameter equal to 1 for Arrhenius and 0 for the quadratic function model.
The optimal secondary model for each parameter along with its corresponding unknown parameters were estimated by solving a mixed-integer nonlinear optimization problem. The objective was to simultaneously identify the structure of the model and its associated parameters, minimizing the discrepancy between the experimental data and the predictions of the model.
Given the measurements, the aim is to estimate some or all of the parameters θ plus the model-selection parameters ω θ to minimize the distance between the data and model predictions, as measured by the widely used weighted least-squares function:
J L S Q ( θ , ω θ ) = e = 1 n e o = 1 n o e s = 1 n s e , o y s e , o ( θ , ω θ ) y m s e , o q s e , o 2
where q s e , o corresponds to a weighting coefficient that, in this study, corresponds to the maximum measured data q s e , o = m a x ( q s e , o ) , s .
The problem is then formulated as a mixed-integer nonlinear optimization problem, where the decision variables are the parameters [ θ , ω θ ] and the objective is to minimize J L S Q subject to the system dynamics in Equations (1) and (2) and the upper and lower bounds for the parameters: θ L θ θ U and ω θ = [ 0 , 1 ] . To solve the problem, we used a metaheuristic enhanced scatter search (eSS) [30] as implemented in the AMIGO2 toolbox [22].

3.4. Model Selection and Validation

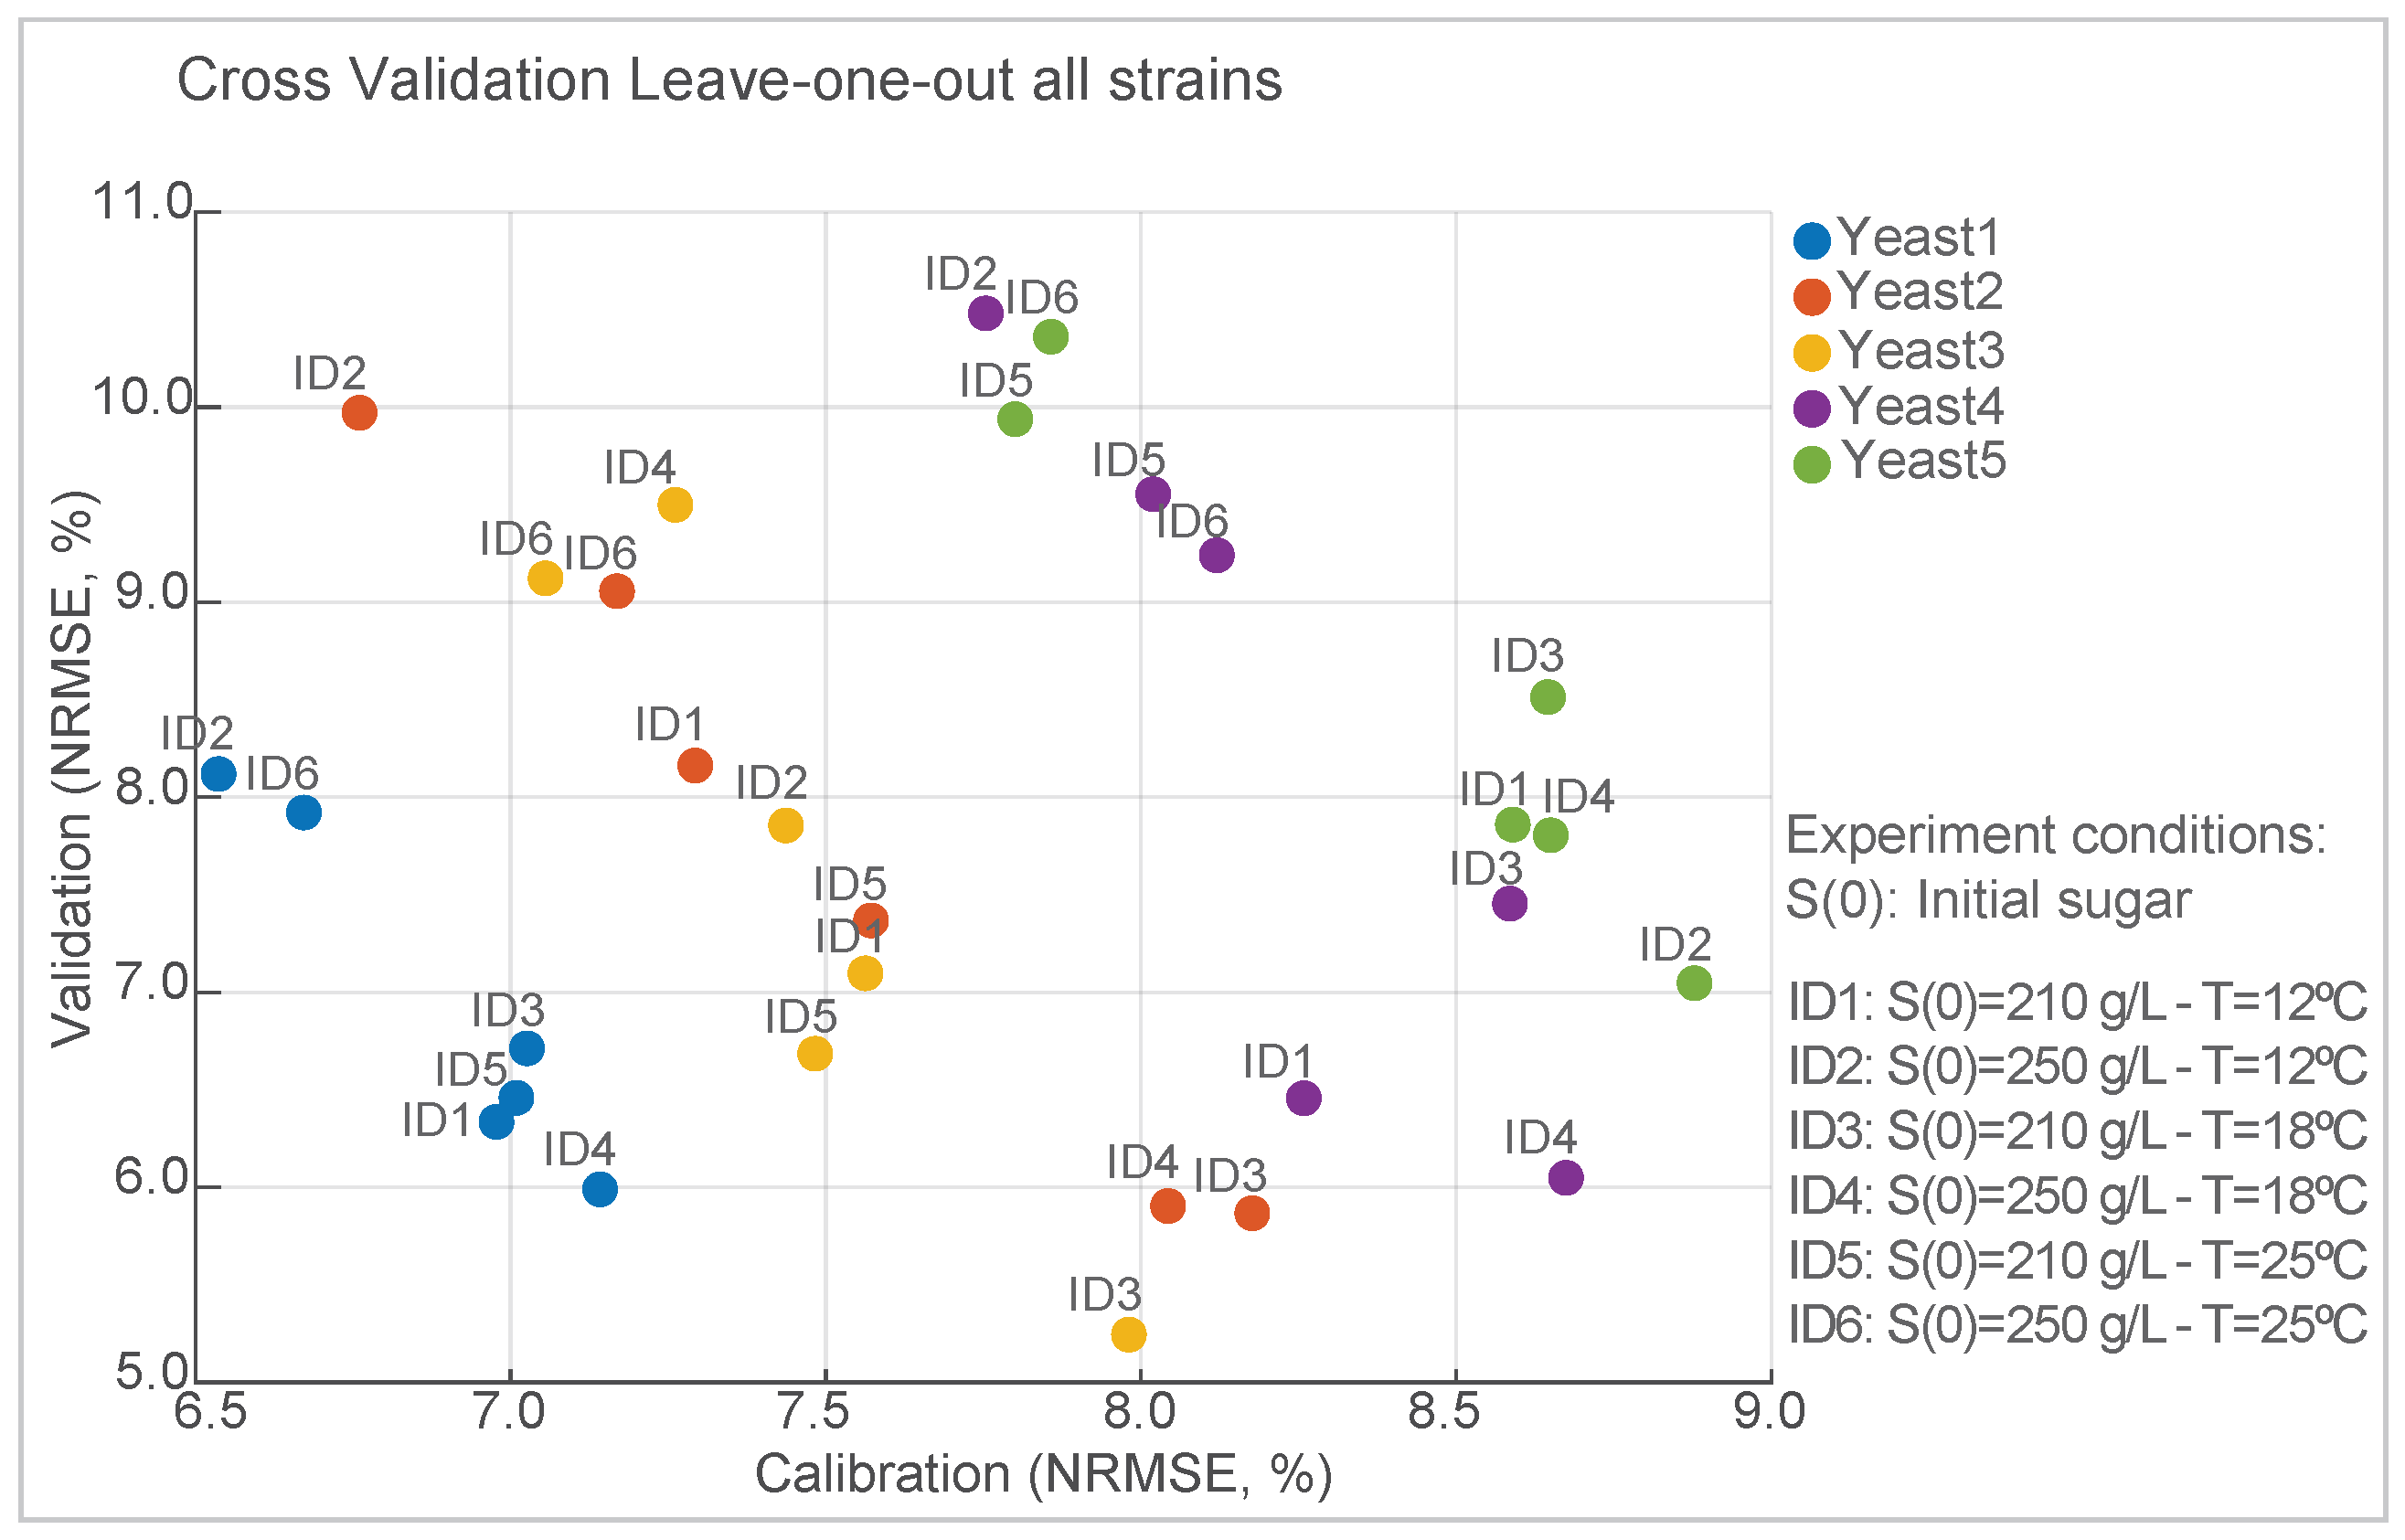
We used a multi-experiment calibration scheme to select the best combination of the primary and secondary models and estimate the corresponding parameters. For each of the five yeast species, we used six different time-series datasets corresponding to different experimental conditions: three isothermal temperature conditions (12, 18, and 25 °C) and two different fermentation media with different initial sugar concentrations, 210 and 250 g / L . Two nitrogen supplements were added in all experiments. One at the beginning of the process and another at the first 47 or 47.5 h, depending on the initial sugar concentration (210 or 250 g / L ), respectively. Remark that time-series data are available for glucose, fructose, CO2, ethanol, succinate, glycerol, acetate, isoamyl alcohol, isobutanol and 2-phenylethanol. Time-series data for Y A N were obtained using time-series data for ammonia and amino acids. Initial biomass is also available.
Figure 2 shows the normalized root-mean-square error (NRMSE) values for the calibration and validation datasets during the leave-one-out cross-validation process for each strain. The data points represent individual cross-validation experiments. Each experiment was identified by an ID identifier, representing a specific dataset excluded during cross-validation. For calibration, the best scenario corresponds to Yeast1 (ID2) with NRMSE = 6.5 % , and the worst corresponds to Yeast5 (ID2) with NMRSE = 8.9 % . Yeast3 (ID3) showed the lowest NMRSE value of 5.2 % for the validation. In contrast, Yeast4 (ID2) resulted in an NMRSE value of 10.5 % . The NRMSE is on the order of magnitude of the experimental error, which underscores the good predictive performance of the model under varying validation conditions, and ensures robustness across species.
We also calculated the mean and median of R 2 for all strains and measured variables (see Supplementary Table S1). The median values for all species are above 0.95 . The quality of fit is visually good (see Supplementary File Figures S1–S10), and the model effectively captures the temperature dependence for almost all observables, even when using independent datasets to verify the predictive capabilities.
In terms of R 2 , the model shows a lower precision for isoamyl alcohol with values ranging from 0.78 to 0.88 depending on the yeast species and the experiment. We obtained R 2 values lower than 0.8 for some species or experimental conditions, in particular for the predictions of isobutanol, 2-phenylethanol, and acetate. However, these values were obtained for cases with a significant noise-to-signal ratio (with experimental errors exceeding 100% in some sampling times). This experimental variability arises from the volatile nature of these compounds, which inherently introduces significant measurement uncertainty.
Table 1 and Table 2 present the optimal parameter values, associated confidence intervals, and secondary models for two representative strains, Yeast1 and Yeast4. The corresponding data for the other species are provided in Supplementary Table S2. The optimal parameter values indicate that the maximum growth rate depends on temperature, in accordance with the Arrhenius model, whereas most of the transport and yield coefficients exhibit quadratic temperature dependence. A few exceptions were observed, where the temperature dependence was linear, such as the succinate yield for both strains and the isoamyl alcohol and isobutanol yields for Yeast1. The ethanol yield appeared to be temperature independent for all yeasts considered in this study. Note that the practical identifiability analysis concluded that the mechanism of transport inhibition due to ethanol production was not relevant and could be removed from the model without affecting the quality of fit.

3.5. Species-Specific Response

Temperature-dependent parameters provide valuable insights into strain-specific differences during fermentation. 
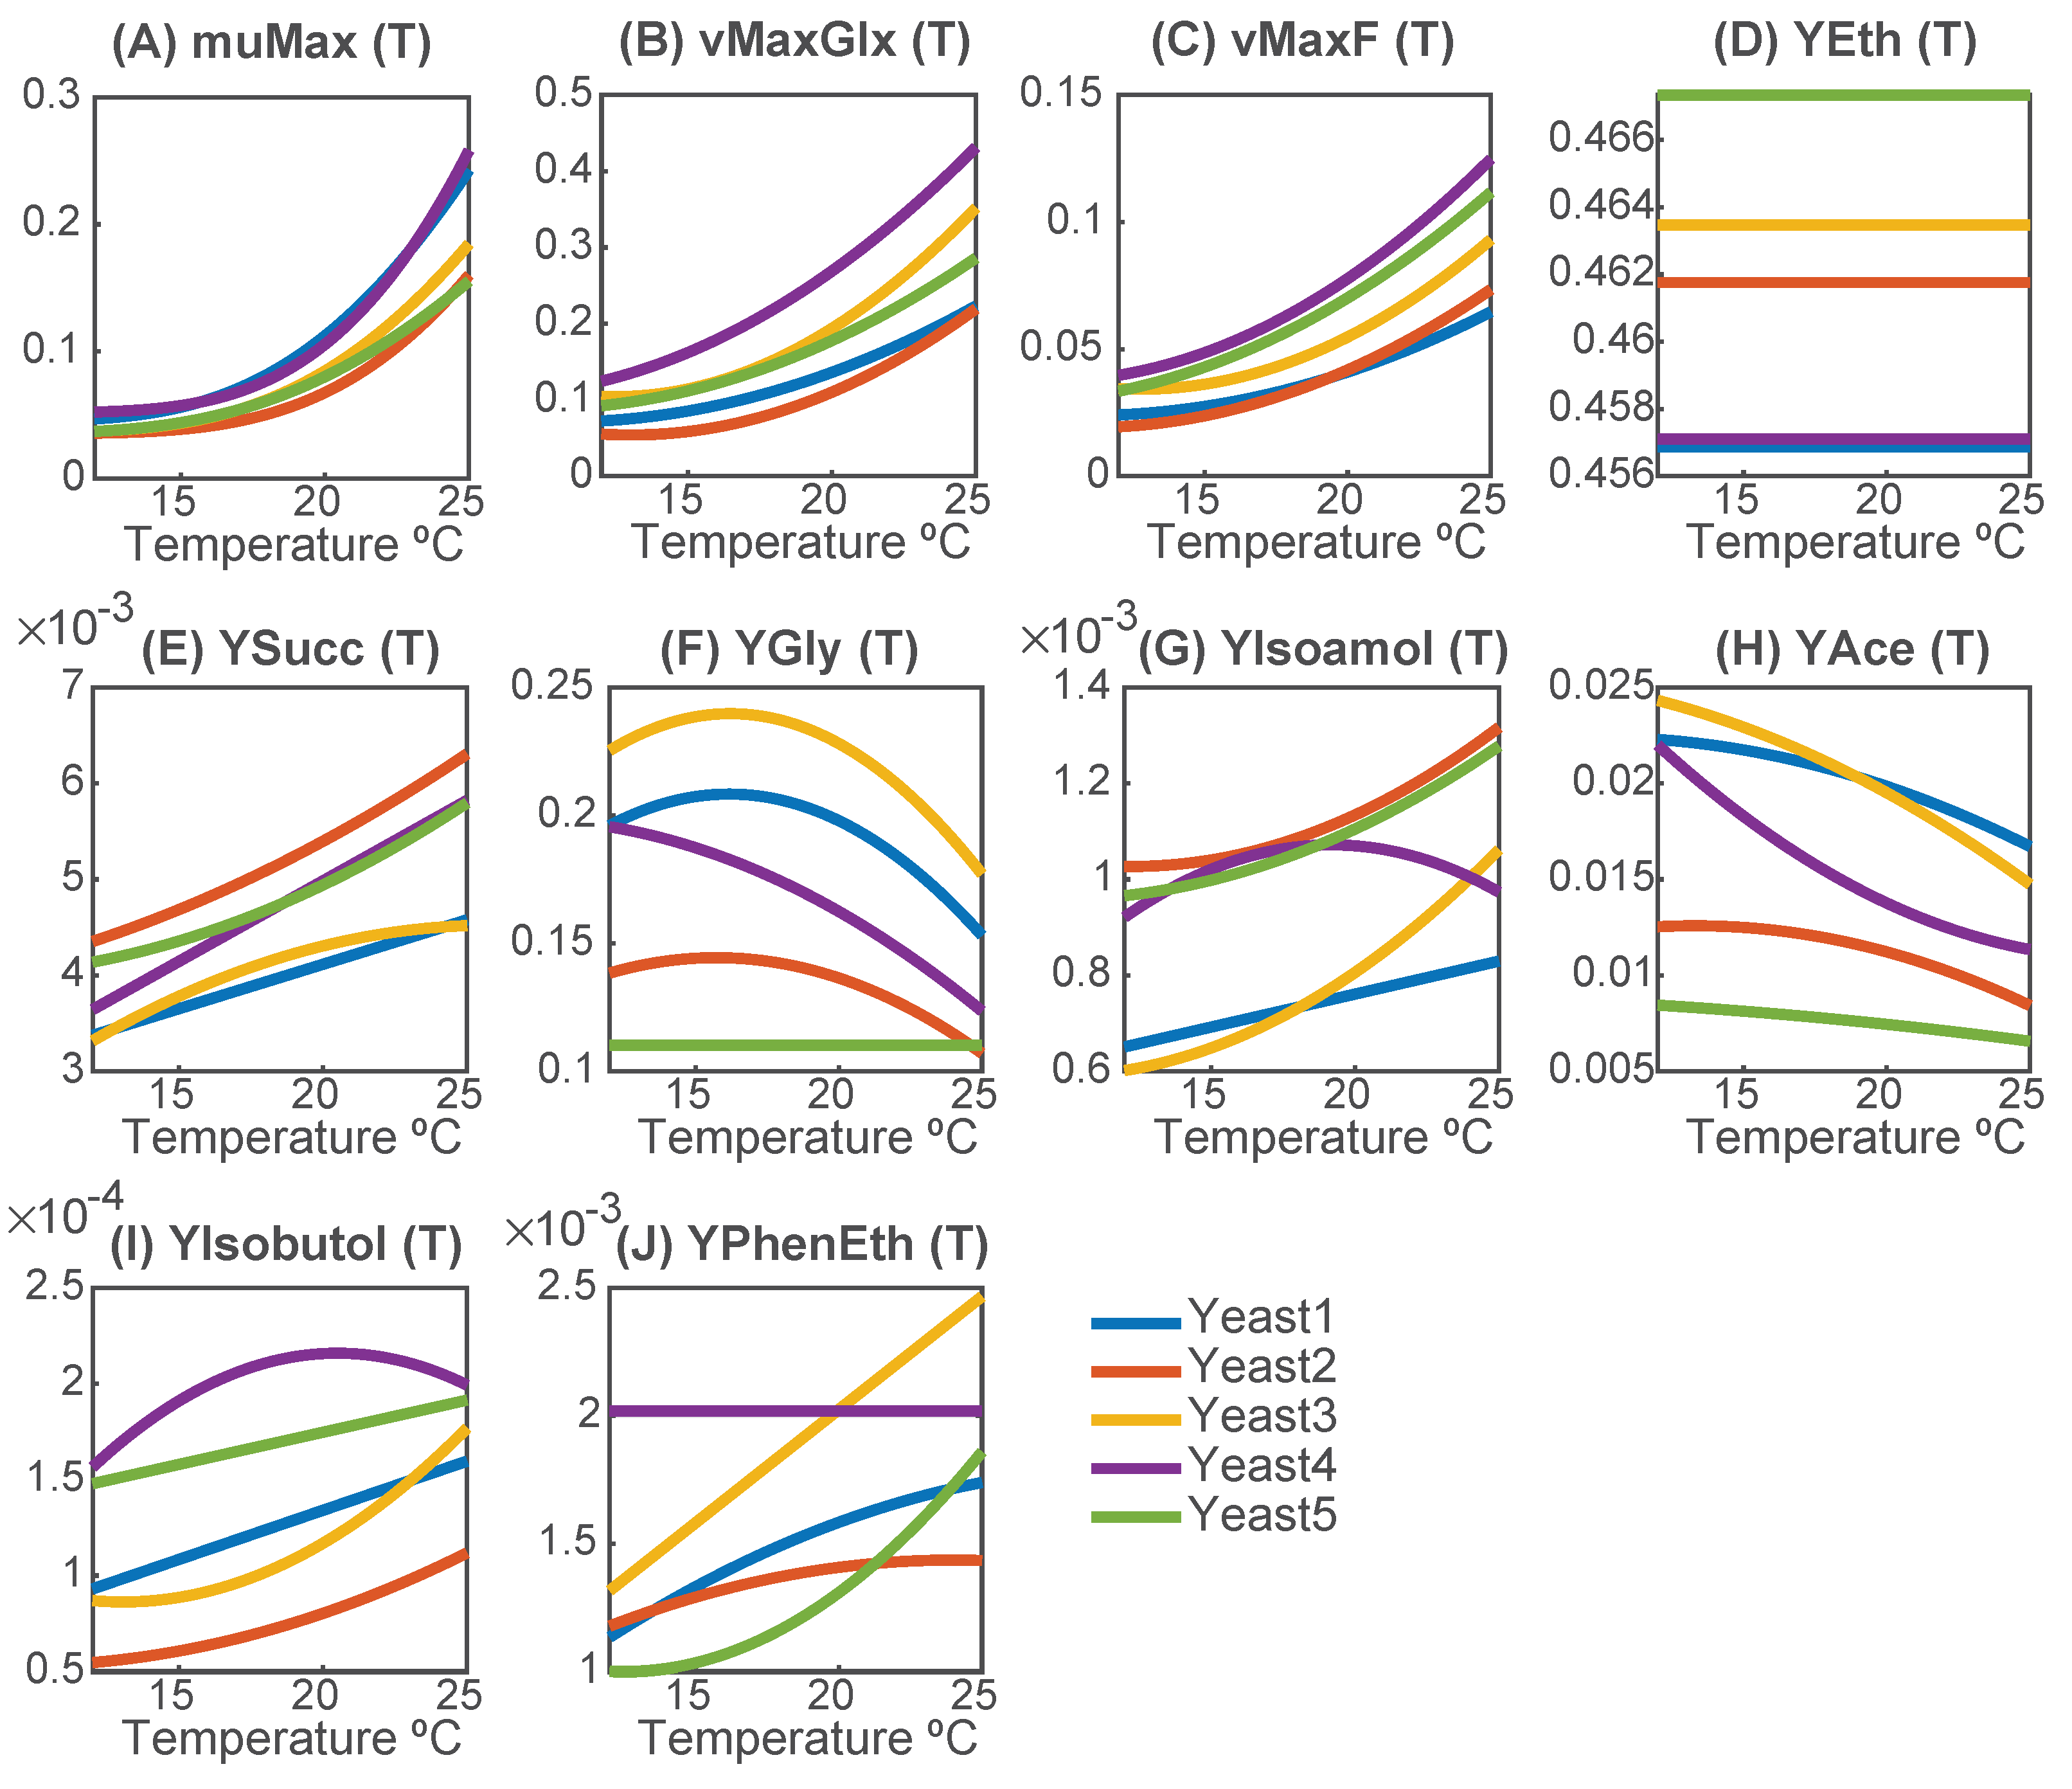
Figure 3 illustrates the temperature dependence of key metabolic parameters for all yeast strains.
The specific growth rate ( μ M a x ) follows the Arrhenius equation and increases with temperature for all species. However, at 25 °C, strain-dependent differences become more pronounced, suggesting varying levels of thermal adaptability. Yeast3 and Yeast4 show the highest adaptability, with growth rates increasing around 5.0-fold. Yeast5 exhibits the lowest relative increase (4.2-fold), indicating a lower thermal sensitivity.
The maximum sugar uptakes ( v M a x G l x and v M a x F ) follow a convex parabolic shape, with temperature playing a critical role. Glucose is consistently preferred over fructose, and both are fully consumed at the end of fermentation. Yeast4 shows the highest increase in sugar uptake, suggesting a superior ability to accelerate fermentation at higher temperatures.
The ethanol yield ( Y E t h ) remains constant for all strains, with only slight differences between them (<2.25%). The highest ethanol yield is observed for Yeast5 ( Y E t h = 0.467 g Eth / g Sugar ), while the lowest is observed for Yeast1 ( Y E t h = 0.457 g Eth / g Sugar ).
Strain-dependent differences become more evident in the production of glycerol, acetate, or succinate. In terms of glycerol yield, except for Yeast5, all strains follow a QF function, indicating temperature-dependent regulation. Optimal glycerol production temperatures vary between strains: Yeast3 ( T o p t = 16.2 °C) exhibits the highest glycerol yield ( Y G l y , m a x = 0.208 g Gly / g Sugar ), while Yeast5 maintains a nearly constant yield. Notably, Yeast4 displays an optimal glycerol production temperature below the studied range ( T o p t = 8.6 °C), suggesting a preference for cold fermentations. In most strains, the acetate yield decreased with temperature, following a QF function, whereas a linear decrease was sufficient for Yeast5. Yeast3 and Yeast1 exhibit the highest acetate production at lower temperatures, while Yeast5 is the least efficient producer. The succinate yield increases with temperature, with a linear or QF trend. The highest succinate production is observed at 25 °C, with Yeast2 being the most efficient producer and Yeast1 the least.
Temperature plays a crucial role in the production of isoamyl alcohol, isobutanol, and 2-phenylethanol, generally following a QF function, although simplifications to linear trends were possible for some strains. Production increases sharply with temperature, with maximum rates typically achieved above 25 °C. Yeast4 diverges from this trend, showing optimal production at lower temperatures: isoamyl alcohol at 19.2 °C and isobutanol at 20.5 °C, suggesting that it could be advantageous for cold fermentations.

3.6. Model Applications: Simulation Case Studies

3.6.1. Managing Stuck Fermentations

Here, we demonstrate the capacity of the model to manage and mitigate stuck/sluggish fermentations. An extreme scenario was considered, where the initial level of assimilable yeast nitrogen (YAN) is 70 mg / L , while the sugar concentration in the medium was set under normal conditions (210 g / L ). The fermentation process was simulated at 20 °C, using Yeast4 as an illustrative example. As shown in Figure 4, the model predicts that fermentation does not reach completion, leaving a residual sugar concentration of 29.60 g / L after 900 h. This nutrient limitation affects yeast metabolism, preventing sufficient sugar uptake and leading to prolonged fermentation times and reduced ethanol production.
In industrial settings, nitrogen supplementation (in organic and/or inorganic forms) is a common strategy to prevent fermentation failures. By simulating various supplementation scenarios before fermentation begins, it is possible to tailor nitrogen-management strategies to specific conditions. To illustrate this capability, we used the model to examine the impact of different nitrogen supplementation timing.
Figure 4A presents model predictions under different nitrogen-supplementation strategies, comparing the stuck fermentation case (no nitrogen addition) with fermentations where nitrogen was added at three different times: at the beginning of the process ( t a d d = 0 h), during the stationary phase ( t a d d = 45 h), and after the stationary phase ( t a d d = 100 h). Without nitrogen supplementation, fermentation failed to reach t 90 (time to deplete 90 % of initial sugars), confirming the persistence of stuck fermentation conditions.
Model simulations suggest that nitrogen addition significantly influences the duration of fermentation. Adding nitrogen 56 mg N / L at t a d d = 0 h results in the shortest fermentation time ( 377.1 h), demonstrating that early intervention accelerates fermentation kinetics more effectively. Later additions at t a d d = 45 h and t a d d = 100 h still enhance fermentation completion but with lower efficiency, reaching 383.1 h and 408.7 h, respectively.
In addition to fermentation duration, the final metabolite concentrations are also influenced by the timing of nitrogen addition. Figure 4A shows that ethanol production is highest when nitrogen is added at t a d d = 0 h (10.95% v/v), while it remains lower in the stuck fermentation case (10.45% v/v). Similarly, glycerol concentration increases with early nitrogen addition (5.027 g / L at t a d d = 0 h vs. 4.116   g / L in the stuck case), suggesting that early nitrogen supplementation improves glycerol synthesis. Succinate and acetate concentrations are also affected, with higher levels of succinate observed in supplemented fermentations ( 0.9432   g / L at t a d d = 45 h vs. 0.8993   g / L in the stuck case). Acetate also achieves the maximum concentration for the case of early supplementation ( 0.4264   g / L ). The production of higher alcohols, such as isoamyl alcohol and isobutanol, exhibits minor differences between conditions, although a notable increase in 2-phenylethanol is observed when nitrogen is added at t a d d = 0 h (0.06249 g / L ) compared to stuck fermentation (0.05116 g / L ).
Figure 4B compares the concentration dynamics of YAN, glucose, fructose, and ethanol for stuck and early supplemented fermentations. Continuous lines represent fermentation with early nitrogen supplementation ( t a d d = 0 h), showing a significant improvement in sugar consumption and ethanol production. In contrast, dashed lines represent the stuck fermentation scenario, where sugar depletion is severely delayed and ethanol yield remains low due to nitrogen limitation. These results highlight the importance of early nitrogen supplementation in preventing fermentation failure and optimizing metabolic performance.

3.6.2. Selecting the Best Starter for Wine Fermentation

To demonstrate the application of our model in designing and automating the selection of fermentation processes, we present an industrial case study that simulates wine fermentation. The aim is to decide which is the best yeast strain and operating temperature to optimize the process. The evaluation criteria includes the duration of fermentation (measured by the time required to reach a residual sugar level of 2 g / L ), the minimization of ethanol production, and sensory quality indicators.
With respect to sensory quality indicators, we considered the metabolites that contribute both positively and negatively to the sensorial attributes. Glycerol is a key contributor to the smoothness, texture, and body of wine, which makes it particularly important for low-body wines. Higher alcohols (isoamyl alcohol, isobutanol and 2-phenylethanol) are desirable at concentrations below 300 mg / L , imparting pleasant fruity and floral notes. However, levels above 400 mg / L introduce pungent, undesirable aromas [33]. Acetic acid, a critical component that affects wine quality, is generally acceptable within the range of 200 to 700 mg / L , with levels above 800 mg / L leading to perceptible and undesirable vinegar-like aromas [33].
Therefore, the multi-objective optimization problem aimed to minimize ethanol production and maximize glycerol production, while satisfying the sensory constraints of maintaining higher alcohol concentrations below 300 mg / L and acetic acid levels below 700 mg / L . Among the feasible alternatives, the fermentation process with the shortest duration will be chosen.
To provide a practical and interpretable means of solving the optimization problem, we used a simulation-based approach. The simulation replicates a grape-must composition of 250 mg / L yeast-assimilable nitrogen (YAN) and 210 g / L sugar, inoculated with an initial yeast cell density of 1 × 10 6 cells/mL. Fermentation was evaluated over a temperature range of 12–25 °C in 1 °C increments for all yeast strains (Supplementary File Figures S11 and S12 show all results).
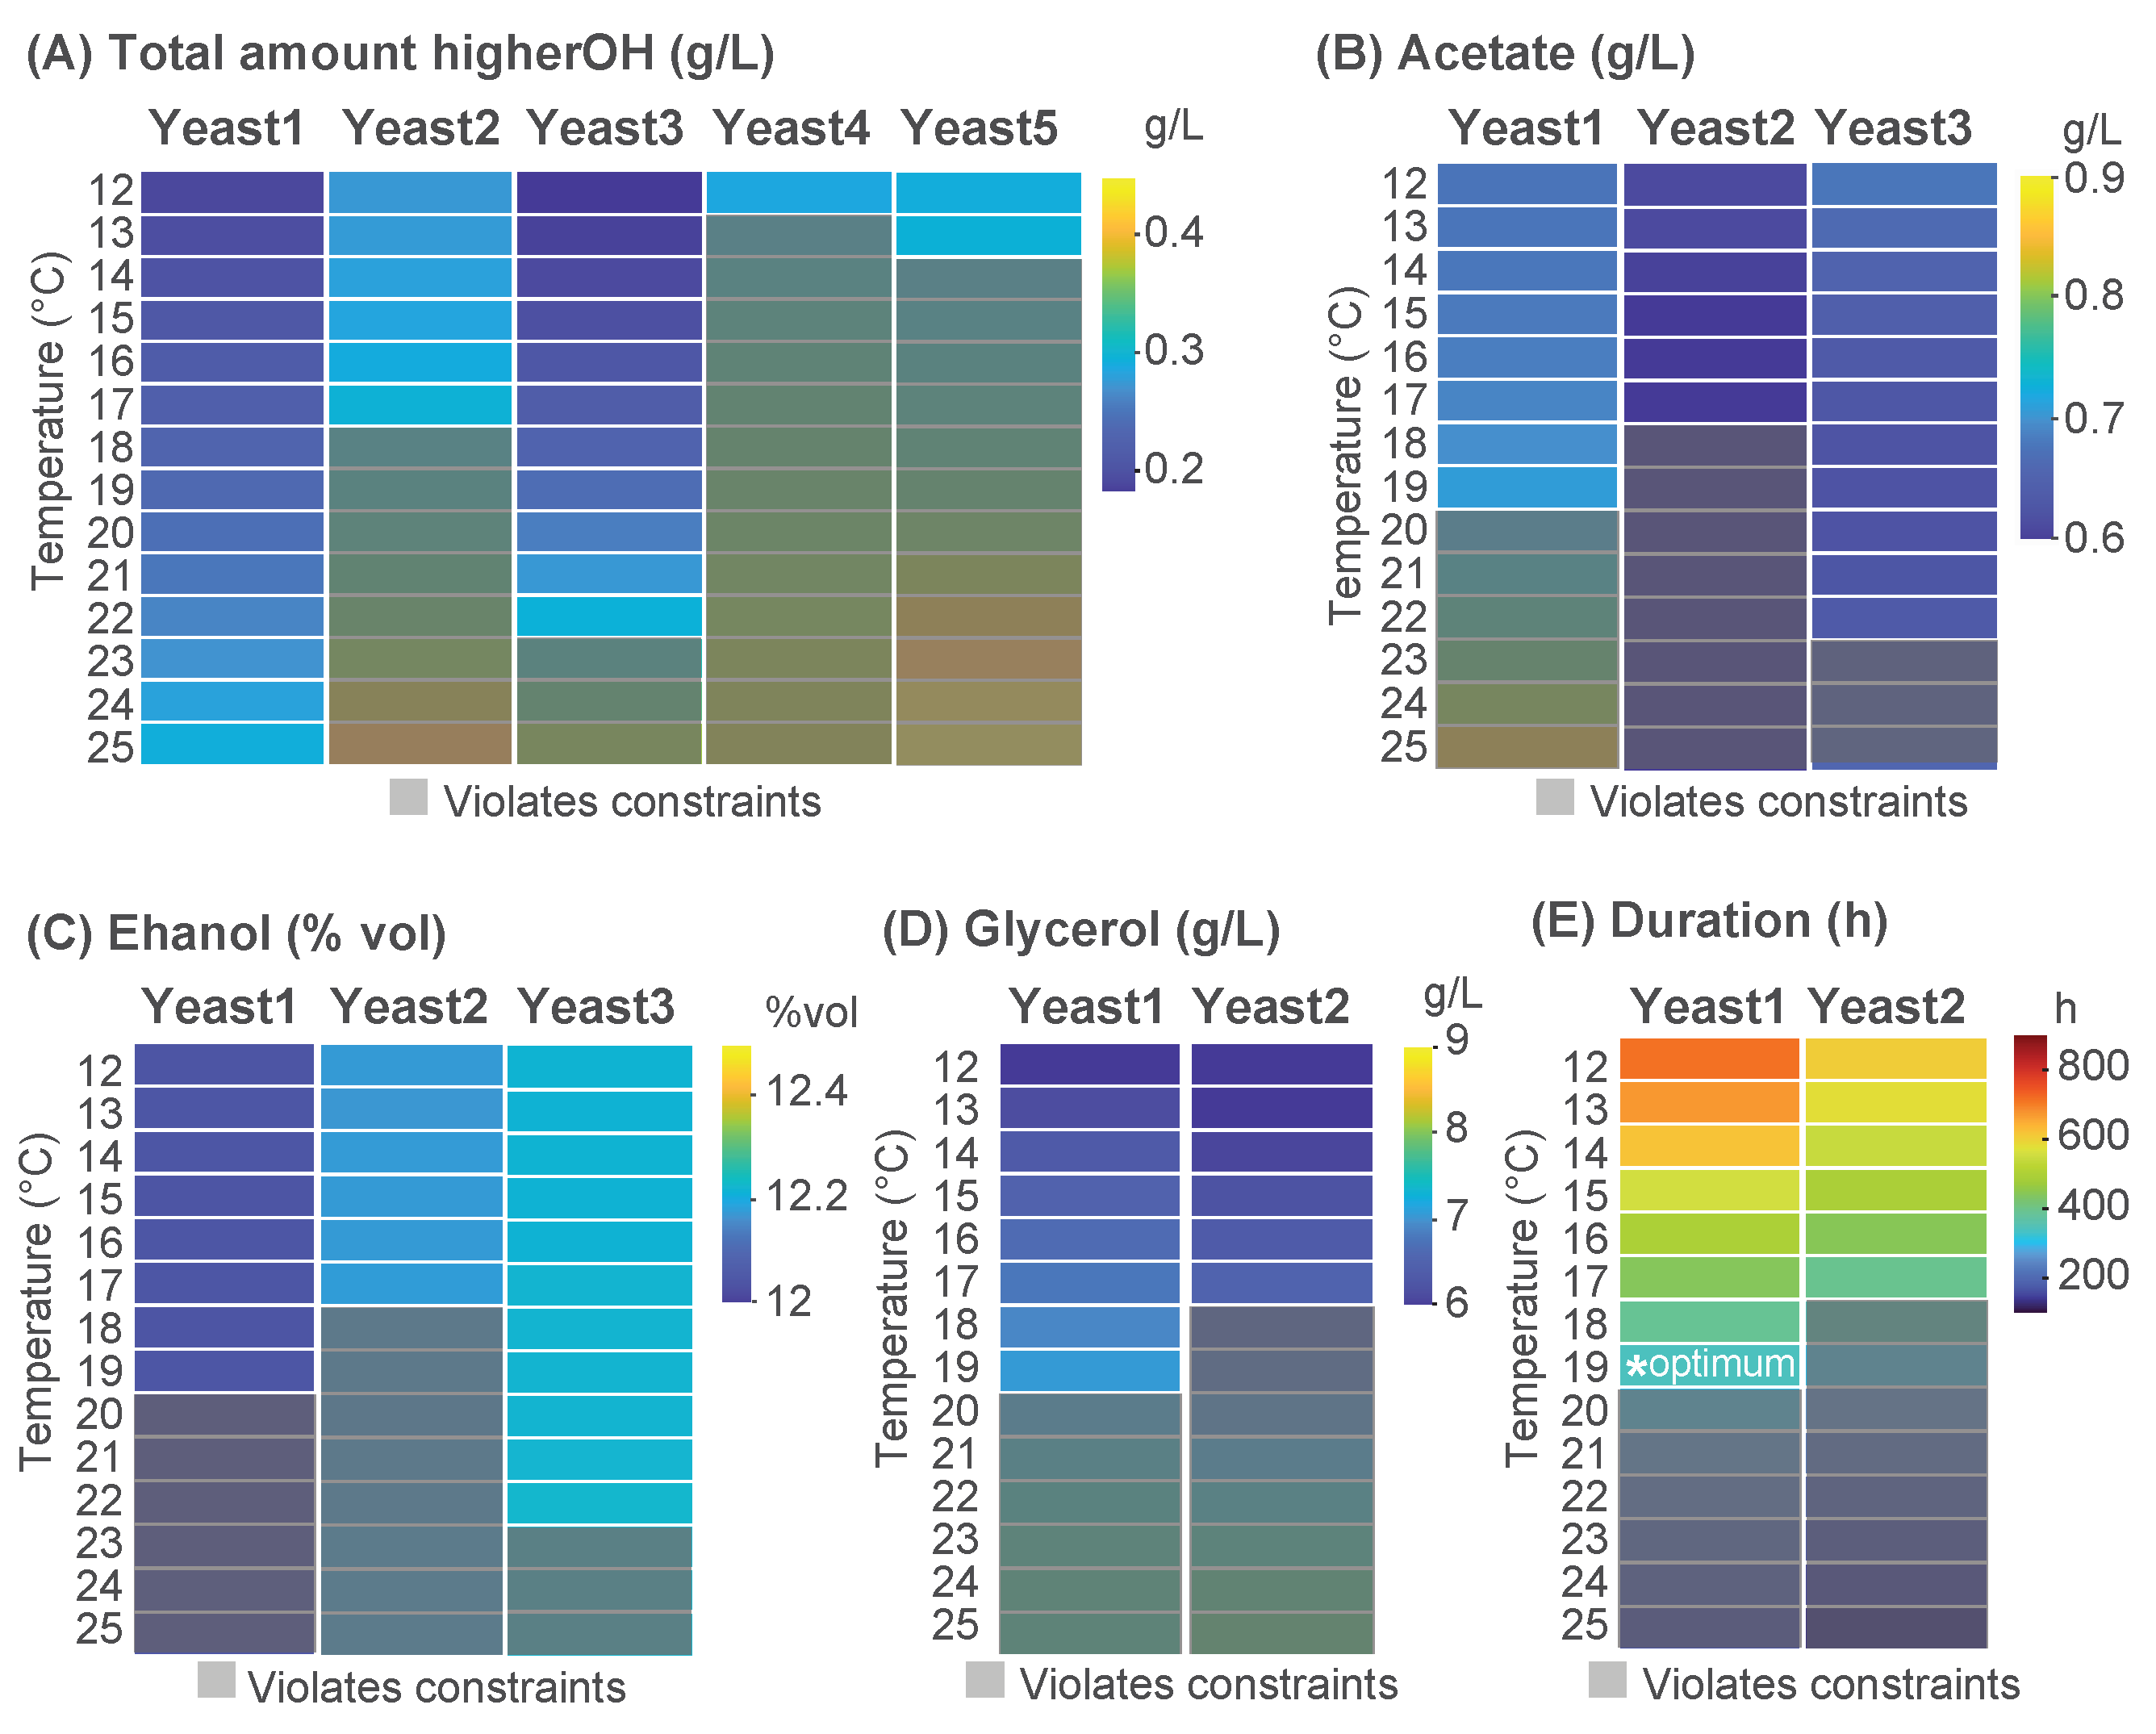
Figure 5 provides an overview of the yeast-selection process. Most yeast strains produced substantial levels of higher alcohols, exceeding the acceptable threshold. In contrast, Yeast1, Yeast2, and Yeast3 satisfied the constraint within specific temperature ranges. Subsequent analysis indicated that to meet the constraints on higher alcohols and acetic acid, fermentations led by Yeast1 should be operated within 12–19 °C, Yeast2 between 12–17 °C, and Yeast3 within 12–22 °C.
Among these possibilities, the production of ethanol and glycerol was evaluated. Yeast1 exhibited the lowest ethanol yield (~12% vol) while generating a higher amount of glycerol compared to Yeast2 within the temperature range of 16–19 °C. In terms of the duration of fermentation, Yeast1 completed the process more rapidly at 19 °C, achieving fermentation in approximately 400 h. Consequently, Yeast1 was determined to be the most suitable option for the optimized fermentation process (Yeast1 at 19 °C).

4. Discussion

Temperature is a critical factor that influences yeast fermentation, affecting both primary and secondary metabolism. Previous studies have demonstrated its impact on fermentation kinetics, metabolite production, and yeast physiology [5,6]. In the context of mathematical modeling, the work by Coleman et al. [13] remains one of the most comprehensive attempts to account for the effects of temperature in yeast fermentation. However, their approach relied on experimental-condition-specific parameters, limiting its predictive power in broader applications. Henriques et al. [16] proposed a temperature-dependent model using a multi-experiment parameter estimation approach. The production of ethanol, glycerol, and acetate was considered. However, the model did not account for nitrogen uptake, and thus the biomass model followed a logistic growth, which limits its applicability to that specific fermentation medium.
In this study, we develop a generalized model that integrates temperature dependence into a mechanistic description of nitrogen-limited batch fermentation for multiple yeast strains. By combining multi-experiment parameter estimation with a systematic model-selection approach, we have formulated a model that not only explains the role of temperature but also accounts for the production of key secondary metabolites such as isoamyl alcohol, isobutanol, and 2-phenylethanol—compounds that contribute significantly to the sensory profile of fermented products [33]. Unlike empirical and discontinuous models [19], our formulation mechanistically links secondary metabolite production to nitrogen and sugar availability through regulatory effects [21]. This enables a more accurate and predictive framework for understanding how fermentation conditions shape aroma profiles.
The model successfully described fermentation for five industrially relevant Saccharomyces cerevisiae strains under a range of temperatures (12–25 °C). Our leave-one-out cross-validation results confirmed the robustness of the model, with normalized root-mean-square error (NRMSE) values below 10.5% and median R 2 values above 0.95, supporting its predictive capability. The model accurately captured sugar consumption, ethanol production, and primary metabolite dynamics, even when tested against independent datasets. R 2 values for some secondary metabolites, particularly isoamyl alcohol, isobutanol, and 2-phenylethanol, showed greater variability. Although the statistical indicator R 2 may appear to reflect a lack of adequacy of the model, the underlying noise in the experimental data reduces the potential of any model to achieve a significantly better fit. This highlights the challenge of modeling systems with inherently high variability and suggests that alternative evaluation metrics, such as the normalized mean-squared error, are better suited to assess the performance of the model.
Parameter identifiability analysis revealed that sugar transport inhibition by ethanol played a negligible role, allowing us to remove the inhibition term from the model for all strains without impacting the quality of fit. This is reasonable, as all the strains considered are highly efficient fermentors, producing substantial concentrations of ethanol and thus adapting to its presence [34]. Note that this inhibition might be necessary for other fermenting species such as S. uvarum [21] or less tolerant non-Saccharomyces species. However, note that certain decay is observed in all strains that might be the result of ethanol-induced stress [35].
Our results highlight strain-specific differences in fermentation behavior, particularly in response to temperature. Although all strains exhibited an Arrhenius-type relationship for growth rate, other metabolic parameters followed quadratic or linear temperature dependencies, suggesting complex regulatory mechanisms beyond simple kinetic effects. The ethanol yield remained largely temperature independent in all strains, indicating that the efficiency of sugar-to-ethanol conversion is robust to temperature fluctuations, consistent with previous findings in S. cerevisiae [35]. In contrast, glycerol production was highly temperature dependent, with strain-specific optimal temperatures for maximal yield, reflecting variations in redox balance at different temperatures in agreement with previous results for Saccharomyces species [20]. Similarly, higher alcohols and acetate showed strain-specific trends, with some strains favoring lower temperatures for their production, a characteristic that could be exploited for cold fermentations to enhance aromatic complexity [9]. These findings underscore the importance of strain selection in optimizing fermentation for specific sensory and production goals.
One of the primary applications of this model is its ability to simulate and prevent stuck fermentations, a common issue in winemaking and bioethanol production. Our simulations demonstrated that when nitrogen levels were insufficient (70 mg/L), fermentation failed to reach completion, leaving significant residual sugars, in good agreement with previous results by Bely et al. and Bell et al. [23,36] who identified a minimum requirement of 140 mg N / L assimilable nitrogen content necessary for reliable completion of alcoholic fermentation.
By testing different nitrogen supplementation strategies, we found that early nitrogen addition (t = 0 h) resulted in the shortest fermentation duration while increasing the yields of ethanol and glycerol. Later additions (t = 45 h and t = 100 h) also improved fermentation kinetics, but were less effective than early supplementation. In particular, metabolite profiles shifted according to nitrogen availability, and early supplementation favored the production of glycerol, acetate, and 2-phenylethanol. These findings align with previous studies [36,37] and emphasize the importance of nitrogen management in fermentation.
In contrast, the production of ethanol, succinate, isoamyl alcohol, and isobutanol remained largely unaffected by the timing of nitrogen supplementation. This outcome may be a a consequence of the model not explicitly accounting for the distribution of nitrogen uptake into biomass and the production of individual aroma compounds. Further refinement of the model, incorporating detailed nitrogen-uptake mechanisms, could enhance its ability to predict the role of specific nitrogen sources in the biosynthesis of aromatic compounds. Addressing this question is beyond the scope of this study, and remains an avenue for future research.
We also used this model for multi-objective strain selection in a practical example related to wine fermentation. By simulating different yeast strains at various temperatures, we provide a practical and interpretable means of assessing the interaction between key factors and identifying optimal conditions based on fermentation duration, ethanol yield, glycerol production, and sensory quality constraints (higher alcohol and acetic acid thresholds). These simulations were performed using constant temperature profiles, which are in agreement with standard industrial winemaking practices. Yeast1 at 19 °C emerged as the best candidate for balancing ethanol production, glycerol production, and acceptable levels of higher alcohols and acetic acid. Yeast2 and Yeast3 were also viable options but required stricter temperature control to meet sensory constraints. Yeast4 and Yeast5 consistently exceeded the acceptable higher alcohol levels, making them less suitable for this application. Our results in the context of the wine fermentation case study demonstrated the potential of the proposed model-based approach for selecting yeast strains tailored to specific grape must composition and production goals, enabling practitioners to optimize process performance and efficiency while maximizing product quality.

5. Conclusions

This study presents a temperature-dependent kinetic model for nitrogen-limited yeast fermentation validated for five industrially relevant strains. The model accurately describes fermentation dynamics and provides a predictive framework for preventing stuck fermentations, optimizing nitrogen management, and selecting yeast strains for specific applications. By integrating this model into fermentation control systems, industry stakeholders can enhance production efficiency, improve product quality, and reduce operational costs. Future research should focus on novel experimental designs to elucidate the role of different nitrogen sources in metabolism. An expanded description of nitrogen metabolism could further improve predictive accuracy and provide greater flexibility for process optimization.

Supplementary Materials

The following supporting information can be downloaded at: https://www.mdpi.com/article/10.3390/math13091373/s1, Table S1. R2 values as obtained for the different measured variables; Table S2. Optimal parameter values and relative confidence interval in % for all the strains; Figure S1. Best fit to the data for Yeast1: uptake of nitrogen and sugars, production of ethanol and CO2; Figure S2. Best fit to the data for Yeast1: glycerol, acetate, succinate, isoamyl alcohol, isobutanol and 2-phenylethanol; Figure S3. Best fit to the data for Yeast2: uptake of nitrogen and sugars, production of ethanol and CO2; Figure S4. Best fit to the data for Yeast2: glycerol, acetate, succinate, isoamyl alcohol, isobutanol and 2-phenylethanol; Figure S5. Best fit to the data for Yeast3: uptake of nitrogen and sugars, production of ethanol and CO2; Figure S6. Best fit to the data for Yeast3: glycerol, acetate, succinate, isoamyl alcohol, isobutanol and 2-phenylethanol; Figure S7. Best fit to the data for Yeast4: uptake of nitrogen and sugars, production of ethanol and CO2; Figure S8. Best fit to the data for Yeast4: glycerol, acetate, succinate, isoamyl alcohol, isobutanol and 2-phenylethanol; Figure S9. Best fit to the data for Yeast5: uptake of nitrogen and sugars, production of ethanol and CO2; Figure S10. Best fit to the data for Yeast5: glycerol, acetate, succinate, isoamyl alcohol, isobutanol and 2-phenylethanol; Figure S11. Simulation results obtained from the temperature modification analysis: process duration, and production of ethanol, glycerol and succinate; Figure S12. Simulation results obtained from the temperature modification analysis: production of acetic acid and higher alcohols.

Author Contributions

Conceptualization, E.B.-C.; modeling, A.R.M., D.H. and E.B.-C.; model identification and validation, A.R.M.; formal analysis, A.R.M. and E.B.-C.; data generation, R.M.; experimental design: A.Q.; supervision: E.B.-C. and A.Q.; writing—original draft preparation, A.R.M. and E.B.-C.; funding acquisition, E.B.-C. and A.Q. All authors have read and agreed to the published version of the manuscript.

Funding

This work has received funding from MCIN/AEI/10.13039/501100011033 and the EU NextGenerationEU/PRTR grant PLEC2021-007827, CIU/AEI/FEDER: PID2021-126380OB-C31, PID2021-126380OB-C32; Xunta de Galicia (IN607B 2023/04). EBC and ARM also acknowledge funding from the EU-Next Generation, in the framework of the General Invitation of the Spanish Government’s public business entity Red.es to participate in talent attraction and retention programs within Investment 4 of Component 19 of the Recovery, Transformation, and Resilience Plan (Grant Number MMT24-IIM-01).

Data Availability Statement

The original contributions presented in this study are included in the Supplementary Materials.

Conflicts of Interest

The authors declare no conflicts of interest.

References

  1. Parapouli, M.; Vasileiadis, A.; Afendra, A.S.; Hatziloukas, E. Saccharomyces cerevisiae and its industrial applications. AIMS Microbiol. 2020, 6, 1–31. [Google Scholar] [CrossRef] [PubMed]
  2. Lu, S.Y.; Skory, C.D.; El Enshasy, H.A.; Liu, S. Fermentative production of alternative antimicrobial peptides and enzymes. Biocatal. Agric. Biotechnol. 2021, 37, 102189. [Google Scholar] [CrossRef]
  3. Siddiqui, S.A.; Erol, Z.; Rugji, J.; Taşçı, F.; Kahraman, H.A.; Toppi, V.; Musa, L.; Giacinto, G.D.; Bahmid, N.A.; Mehdizadeh, M.; et al. An overview of fermentation in the food industry—Looking back from a new perspective. Bioresour. Bioprocess 2023, 10, 85. [Google Scholar] [CrossRef]
  4. Joshi, H.; Pant, G.; Pant, M.; Kumar, G. Food Fermentation: Role of Microorganism in Food Production. In Food Microbial Sustainability: Integration of Food Production and Food Safety; Karnwal, A., Mohammad Said Al-Tawaha, A.R., Eds.; Springer Nature Singapore: Singapore, 2023; pp. 69–90. [Google Scholar]
  5. Arroyo-López, F.N.; Orlić, S.; Querol, A.; Barrio, E. Effects of temperature, pH and sugar concentration on the growth parameters of Saccharomyces cerevisiae, S. kudriavzevii and their interspecific hybrid. Int. J. Food Microbiol. 2009, 131, 120–127. [Google Scholar] [CrossRef]
  6. Rollero, S.; Bloem, A.; Camarasa, C.; Sanchez, I.; Ortiz-Julien, A.; Sablayrolles, J.M.; Dequin, S.; Mouret, J.R. Combined effects of nutrients and temperature on the production of fermentative aromas by Saccharomyces cerevisiae during wine fermentation. Appl. Microbiol. Biotechnol. 2015, 99, 2291–2304. [Google Scholar] [CrossRef]
  7. Bisson, L. Stuck and sluggish fermentations. Am. J. Enol. Viticult. 1999, 50, 107–119. [Google Scholar] [CrossRef]
  8. Scott, W.T.; van Mastrigt, O.; Block, D.E.; Notebaart, R.A.; Smid, E.J.; Cuomo, C.A. Nitrogenous Compound Utilization and Production of Volatile Organic Compounds among Commercial Wine Yeasts Highlight Strain-Specific Metabolic Diversity. Microbiol. Spectr. 2021, 9, e00485-21. [Google Scholar] [CrossRef]
  9. Torija, M.J.; Beltran, G.; Novo, M.; Poblet, M.; Guillamón, J.M.; Mas, A.; Rozès, N. Effects of fermentation temperature and Saccharomyces species on the cell fatty acid composition and presence of volatile compounds in wine. Int. J. Food Microbiol. 2003, 85, 127–136. [Google Scholar] [CrossRef]
  10. Querol, A.; Pérez-Torrado, R.; Alonso-Del-Real, J.; Minebois, R.; Stribny, J.; Oliveira, B.M.; Barrio, E. New Trends in the Uses of Yeasts in Oenology. In Advances in Food and Nutrition Research; Toldrá, F., Ed.; Academic Press: Cambridge, MA, USA, 2018; Volume 85, pp. 177–210. [Google Scholar]
  11. Tesnière, C.; Brice, C.; Blondin, B. Responses of Saccharomyces cerevisiae to nitrogen starvation in wine alcoholic fermentation. Appl. Microbiol. Biotechnol. 2015, 99, 7025–7034. [Google Scholar] [CrossRef]
  12. Nelson, J.; Boulton, R. Models for Wine Fermentation and Their Suitability for Commercial Applications. Fermentation 2024, 10, 269. [Google Scholar] [CrossRef]
  13. Coleman, M.; Fish, R.; Block, D. Temperature-Dependent Kinetic Model for Nitrogen-Limited Wine Fermentation. Appl. Environ. Microbiol. 2007, 73, 5875–5884. [Google Scholar] [CrossRef] [PubMed]
  14. Hanly, T.J.; Henson, M.A. Dynamic metabolic modeling of a microaerobic yeast co-culture: Predicting and optimizing ethanol production from glucose/xylose mixtures. Biotechnol. Biofuels 2013, 6, 44. [Google Scholar] [CrossRef]
  15. Malherbe, S.; Fromion, V.; Hilgert, N.; Sablayrolles, J.M. Modeling the effects of assimilable nitrogen and temperature on fermentation kinetics in enological conditions. Biotechnol. Bioeng. 2004, 86, 261–272. [Google Scholar] [CrossRef]
  16. Henriques, D.; Alonso-del Real, J.; Querol, A.; Balsa-Canto, E. Saccharomyces cerevisiae and S. kudriavzevii Synthetic Wine Fermentation Performance Dissected by Predictive Modeling. Front. Microbiol. 2018, 9, 88. [Google Scholar] [CrossRef]
  17. Sainz, J.; Pizarro, F.; Pérez-Correa, J.R.; Agosin, E. Modeling of yeast metabolism and process dynamics in batch fermentation. Biotechnol. Bioeng. 2003, 81, 818–828. [Google Scholar] [CrossRef]
  18. David, R.; Dochain, D.; Mouret, J.R.; Vande Wouwer, A.; Sablayrolles, J.M. Nitrogen-backboned modeling of wine-making in standard and nitrogen-added fermentations. Bioprocess Biosyst. Eng. 2014, 37, 5–16. [Google Scholar] [CrossRef]
  19. Mouret, J.; Farines, V.; Sablayrolles, J.; Trelea, I. Prediction of the production kinetics of the main fermentative aromas in winemaking fermentations. Biochem. Eng. J. 2015, 103, 211–218. [Google Scholar] [CrossRef]
  20. Henriques, D.; Minebois, R.; Mendoza, S.; Macías, L.; Pérez-Torrado, R.; Barrio, E.; Teusink, B.; Querol, A.; Balsa-Canto, E. A multiphase multiobjective dynamic genome-scale model shows different redox balancing among yeast species of the Saccharomyces genus in fermentation. mSystems 2021, 6, 10-1128. [Google Scholar] [CrossRef]
  21. Moimenta, A.R.; Troitiño-Jordedo, D.; Henriques, D.; Contreras-Ruíz, A.; Minebois, R.; Morard, M.; Barrio, E.; Querol, A.; Balsa-Canto, E. An integrated multiphase dynamic genome-scale model explains batch fermentations led by species of the Saccharomyces genus. mSytems 2025, 10, e0161524. [Google Scholar] [CrossRef]
  22. Balsa-Canto, E.; Henriques, D.; Gabor, A.; Banga, J. AMIGO2, a toolbox for dynamic modeling, optimization and control in systems biology. Bioinformatics 2016, 32, 3357–3359. [Google Scholar] [CrossRef]
  23. Bely, M.; Sablayrolles, J.; Barre, P. Automatic detection of assimilable nitrogen deficiencies during alcoholic fermentation in oenological conditions. J. Ferment. Bioeng. 1990, 70, 246–252. [Google Scholar] [CrossRef]
  24. Tarko, T.; Duda, A. Volatilomics of Fruit Wines. Molecules 2024, 29, 2457. [Google Scholar] [CrossRef]
  25. Contreras-Ruiz, A.; Minebois, R.; Alonso-del Real, J.; Barrio, E.; Querol, A. Differences in metabolism among Saccharomyces species and their hybrids during wine fermentation. Microb. Biotechnol. 2024, 17, e14476. [Google Scholar] [CrossRef]
  26. Ligon, T.S.; Fröhlich, F.; Chiş, O.T.; Banga, J.R.; Balsa-Canto, E.; Hasenauer, J. GenSSI 2.0: Multi-experiment structural identifiability analysis of SBML models. Bioinformatics 2018, 34, 1421–1423. [Google Scholar] [CrossRef]
  27. Hong, H.; Ovchinnikov, A.; Pogudin, G.; Yap, C. SIAN: Software for structural identifiability analysis of ODE models. Bioinformatics 2019, 35, 2873–2874. [Google Scholar] [CrossRef]
  28. Walter, E.; Pronzato, L. Identification of Parametric Models from Experimental Data; Springer: New York, NY, USA, 1997. [Google Scholar]
  29. Hindmarsh, A.C.; Brown, P.N.; Grant, K.E.; Lee, S.L.; Serban, R.; Shumaker, D.E.; Woodward, C. SUNDIALS: Suite of Nonlinear and Differential/Algebraic Equation Solvers. ACM Trans. Math. Softw. 2005, 31, 363–396. [Google Scholar] [CrossRef]
  30. Egea, J.A.; Vazquez, E.; Banga, J.R.; Marti, R. Improved scatter search for the global optimization of computationally expensive dynamic models. J. Glob. Opt. 2009, 43, 175–190. [Google Scholar] [CrossRef]
  31. Hjersted, J.; Henson, M.; Mahadevan, R. Genome-scale analysis of Saccharomyces cerevisiae metabolism and ethanol production in fed-batch culture. Biotechnol. Bioeng. 2007, 97, 1190–1204. [Google Scholar] [CrossRef]
  32. Ratkowsky, D.; Lowry, R.; McMeekin, T.; Stokes, A.; Chandler, R. Model for bacterial culture growth rate throughout the entire biokinetic temperature range. J. Bacteriol. 1983, 154, 1222–1226. [Google Scholar] [CrossRef]
  33. Carpena, M.; Fraga-Corral, M.; Otero, P.; Nogueira, R.A.; Garcia-Oliveira, P.; Prieto, M.A.; Simal-Gandara, J. Secondary Aroma: Influence of Wine Microorganisms in Their Aroma Profile. Foods 2021, 10, 51. [Google Scholar] [CrossRef]
  34. Albergaria, H.; Arneborg, N. Dominance of Saccharomyces cerevisiae in alcoholic fermentation processes: Role of physiological fitness and microbial interactions. Appl. Microbiol. Biotechnol. 2016, 100, 2035–2046. [Google Scholar] [CrossRef]
  35. Sahana, G.R.; Balasubramanian, B.; Joseph, K.S.; Pappuswamy, M.; Liu, W.C.; Meyyazhagan, A.; Kamyab, H.; Chelliapan, S.; Joseph, B.V. A review on ethanol tolerance mechanisms in yeast: Current knowledge in biotechnological applications and future directions. Process Biochem. 2024, 138, 1–13. [Google Scholar] [CrossRef]
  36. Bell, S.J.; Henschke, P. Implications of nitrogen nutrition for grapes, fermentation and wine. Aust. J. Grape Wine Res. 2005, 11, 242–295. [Google Scholar] [CrossRef]
  37. Godillot, J.; Sanchez, I.; Perez, M.; Picou, C.; Galeote, V.; Sablayrolles, J.; Farines, V.; Mouret, J. The Timing of Nitrogen Addition Impacts Yeast Genes Expression and the Production of Aroma Compounds During Wine Fermentation. Front. Microbiol. 2022, 13, 829786. [Google Scholar] [CrossRef]
Figure 1. A conceptual representation of the proposed model. This model describes yeast batch fermentation dynamics and captures key metabolic and physiological processes. Biomass growth is influenced by yeast assimilable nitrogen (YAN); glucose and fructose serve as primary substrates for fermentation. The conversion of sugars through fermentation leads to the production of ethanol and carbon dioxide along with various metabolic by-products, including succinate, isobutanol, isoamyl alcohol, glycerol, acetate, and 2-phenylethanol. The model also incorporates a regulatory component ( G N , S ) representing gene-expression changes associated with nitrogen and sugar availability, which impact metabolic fluxes and fermentation efficiency. The model takes into account the role of temperature in the process dynamics.
Mathematics 13 01373 g001
Figure 2. A comparison of normalized root-mean-square error (NRMSE) values for validation and calibration during leave-one-out cross-validation procedure. Data points represent the experiments excluded during validation, with identifiers (IDs) ranging from 1 to 6, corresponding to the experiment left out in each cross-validation iteration. The results show that the NRMSE is between 6.5 % and 9 % in calibration and between 5 % and 10.5 % in validation.
Mathematics 13 01373 g002
Figure 3. Temperature dependence of key metabolic parameters across yeast strains. The figure presents the dependence of model parameters on temperature for five different yeast strains. (A) The specific growth rate ( μ M a x , ( h 1 )) follows an Arrhenius-type behavior, with Yeast3 and Yeast4 demonstrating the highest adaptability at higher temperatures. (B) The maximum glucose uptake rate ( v M a x G l x , ( g Glx / L CFU / Lh )) follows a convex parabolic trend, increasing with temperature, with Yeast4 exhibiting the highest uptake capacity. (C) The maximum fructose uptake rate ( v M a x F , ( g F / L CFU / Lh )) follows a similar trend, confirming glucose preference across all strains. (D) The ethanol yield ( Y E t h , ( g Eth / g sugar )) remains constant across temperatures, with minor strain-dependent differences. (E) Succinate yield ( Y S u c c , ( g Succ / g sugar )) increases with temperature, with 2 being the most efficient producer at 25 °C. (F) Glycerol yield ( Y G l y , ( g Gly / g sugar )) follows a QF function for most strains, with Yeast3 achieving the highest yield at T o p t = 16.2 °C, while Yeast5 maintains a stable production across all temperatures. (G) Isoamyl alcohol yield ( Y I s o a m o l , ( g Isoamol / g sugar )) increases with temperature for most strains, but Yeast4 shows optimal production at a lower temperature ( T o p t = 19.2 °C). (H) Acetate yield ( Y A c e , ( g Ace / g sugar )) generally decreases with temperature, following a QF trend, except for Yeast5, where a linear decrease suffices. (I) Isobutanol yield ( Y I s o b u t o l , ( g Isobutol / g sugar )) increases with temperature, except for Yeast4, which displays optimal production at T o p t = 20.5 °C. (J) 2-phenylethanol yield ( Y P h e n E t h , ( g PhenEth / g sugar )) follows a QF trend, with a sharp increase at higher temperatures.
Mathematics 13 01373 g003
Figure 4. Impact of nitrogen addition on fermentation dynamics. (A) Model predictions for different nitrogen supplementation strategies: no addition (stuck fermentation), and additions at t a d d = 0 h, t a d d = 45 h, and t a d d = 100 h. The results indicate that early nitrogen supplementation significantly reduces fermentation duration. The stuck fermentation case results in incomplete sugar depletion after 900 h. (B) A comparison of the fermentation dynamics between the stuck fermentation (dashed lines) and the scenario with early nitrogen addition at t a d d = 0 h (continuous lines). Sugar depletion and ethanol production are significantly improved when nitrogen is available from the start, showing how early supplementation assists in preventing fermentation failure.
Mathematics 13 01373 g004
Figure 5. Multi-objective yeast-selection process for wine fermentation. The figure presents simulated values obtained at different temperatures ranging from 12 °C to 25 °C, with increments of 1 °C. (A) Higher alcohol concentrations for all available yeast starters, showing that Yeast4 and Yeast5 exceeded the predefined maximum for most temperature values. (B) Acetic acid production for the three most promising yeasts (Yeast1, Yeast2, and Yeast3), ensuring compliance with the defined sensory thresholds. (C) Ethanol production, highlighting that Yeast1 and Yeast2 are the lowest ethanol producers. (D) Glycerol production for the most promising yeasts, Yeast1 and Yeast2. (E) Fermentation duration, comparing process times for Yeast1 and Yeast2 to identify the most efficient option. Yeast strains violating constraints are marked with gray shadows, and the optimal selection (Yeast1 at 19 °C) is highlighted.
Mathematics 13 01373 g005
Table 1. Temperature-independent parameters of the model for Yeast1 and Yeast4: optimal values and associated confidence intervals (%). Confidence intervals marked with the symbol “—” correspond to parameters whose values were fixed during optimization.
Yeast1Yeast4
θ Description ( θ ) CI (%) ( θ ) CI (%)
k N Monod parameter ( g / L ) 0.01 0.01
k d Cellular decay ( h 1 ) 2.08 · 10 3 48.12 2.23 · 10 3 34.79
Y x N Biomass yield ( cell g N L ) 1.00 · 10 12 56.92 4.58 · 10 11 65.50
k s G l x Michaelis–Menten glucose half saturation ( g / L ) 100.00 78.20 70.47 68.25
k s F Michaelis–Menten fructose half saturation ( g / L ) 24.51 85.95 13.30 102.19
τ G N , S Gene-regulation parameter 0.062 40.31 0.047 27.64
k r N Nitrogen repression half saturation ( g / L ) 0.50 104.81 0.52 61.92
k r S Sugar repression half saturation ( g / L ) 1000.00 49.06 1000.00 25.79
Table 2. Temperature-dependent parameters of the model for Yeast1 and Yeast4. The best secondary model is reported with the optimal parameters value plus their associated uncertainty. The best fit corresponds to a temperature-independent yield of ethanol. Dependency in some cases appears to be linear.
Yeast1Yeast4
ParameterDescription θ * θ *(%)2nd θ * θ *(%)2nd
Model Model
μ m a x A ( T ) Max specific μ m a x A A = 0.045 14.9 A μ m a x A A = 0.052 23.75 A
μ m a x A B = 14.85 67.99 μ m a x A B = 44.53 104.97
growth rate μ m a x A C = 107.96 11.67 μ m a x A C = 134.33 15.84
v M a x G l x ( T ) Max glucose v M a x G l x A = 7.25 · 10 14 87.38 QF v M a x G l x A = 1.11 · 10 13 108.77 QF
v M a x G l x B = 1.52 · 10 12 107.88 v M a x G l x B = 1.74 · 10 12 175.09
uptake rate v M a x G l x C = 1.51 · 10 11 94.84 v M a x G l x C = 1.74 · 10 11 148.50
v M a x F ( T ) Max fructose v M a x F A = 2.01 · 10 14 72.08 QF v M a x F A = 3.59 · 10 14 78.36 QF
v M a x F B = 4.31 · 10 13 86.49 v M a x F B = 6.75 · 10 13 100.36
uptake rate v M a x F C = 4.69 · 10 12 74.51 v M a x F C = 7.00 · 10 12 89.82
Y E t h ( T ) Ethanol yield cte cte
Y E t h C = 0.457 2.26 Y E t h C = 0.457 2.06
Y G l y ( T ) Glycerol yield Y G l y A = 7.10 · 10 4 58.50 QF Y G l y A = 2.80 · 10 4 105.27 QF
Y G l y B = 2.30 · 10 2 50.41 Y G l y B = 4.90 · 10 3 217.08
Y G l y C = 2.30 · 10 2 50.41 Y G l y C = 1.80 · 10 1 49.78
Y A c e ( T ) Acetate yield Y A c e A = 2.47 · 10 5 146.74 QF Y A c e A = 4.20 · 10 5 56.88 QF
Y A c e B = 4.84 · 10 4 234.65 Y A c e B = 2.37 · 10 3 41.61
Y A c e C = 2.00 · 10 2 61.56 Y A c e C = 4.40 · 10 2 28.54
Y S u c c ( T ) Succinate yield Y S u c c A = 0 Linear Y S u c c A = 0 Linear
Y S u c c B = 9.27 · 10 5 24.16 Y S u c c B = 1.68 · 10 4 15.16
Y S u c c C = 2.30 · 10 3 17.28 Y S u c c C = 1.60 · 10 3 26.94
Y I s o a m y l o l ( T ) Isoamylol yield Y I s o a m o l A = 0 Linear Y I s o a m o l A = 2.92 · 10 6 12.89 QF
Y I s o a m o l B = 1.38 · 10 5 32.77 Y I s o a m o l B = 1.12 · 10 4 7.50
Y I s o a m o l C = 4.85 · 10 4 17.74 Y I s o a m o l C = 2.92 · 10 6 12.89
Y P h e n E t h ( T ) PhenEth yield Y P h e n E t h A = 1.92 · 10 6 114.03 QF Y P h e n E t h A = 0 cte
Y P h e n E t h B = 1.18 · 10 4 58.81 Y P h e n E t h B = 0
Y P h e n E t h C = 1.92 · 10 6 114.03 Y P h e n E t h C = 2.02 · 10 3 26.40
Y I s o b u t o l ( T ) Isobutanol yield Y I s o b u t o l A = 0 Linear Y I s o b u o l A = 8.22 · 10 7 44.07 QF
Y I s o b u t o l B = 5.13 · 10 6 15.39 Y I s o b u t o l B = 3.37 · 10 5 39.77
Y I s o b u t o l C = 3.15 · 10 5 43.79 Y I s o b u t o l C = 1.30 · 10 4 88.05
Disclaimer/Publisher’s Note: The statements, opinions and data contained in all publications are solely those of the individual author(s) and contributor(s) and not of MDPI and/or the editor(s). MDPI and/or the editor(s) disclaim responsibility for any injury to people or property resulting from any ideas, methods, instructions or products referred to in the content.

