Abstract
The abundance level of the lambda phage repressor is randomly fluctuated by the influence of multiple ligand signals, inducing its phenotypic diversity. However, the mechanism of how the memory lag of fluctuations and the nonlinear structure of the expression system regulate the phenotypic diversity is still obscure. Here, we try to investigate a prototypical regulatory network coupled with random fluctuations (noise) and nonlinear structures to focus on the impact of protein abundance fluctuations within bacteriophages on cellular phenotypic transitions and energy dissipation throughout the process. Our findings reveal that there exists a threshold of the CI protein abundance to regulate the switching from the lysogenic to lytic states of the lambda phage, influencing its reproductive strategy. Specifically, an increase in the memory lag of multiplicative noise leads to a delayed transition from the lysogenic to lytic states. Additive noise exerts an effect that is nearly the opposite of that of multiplicative noise. Furthermore, we reconstruct the effective equivalent topological network to calculate the energy consumption cost of these switching. It is indicated that it only dissipates the lower energy to achieve the bimodality in a low-noise environment. In contrast, it needs to dissipate more energy to maintain the stability of the expression system in larger fluctuations. Comprehensive analysis suggests that lambda phages can optimize their survival strategies by modulating the cellular microenvironment, specifically through adjusting noise intensity and memory lag.
MSC:
92C05; 92B05
1. Introduction
The lambda phage is a temperate bacteriophage capable of infecting Escherichia coli. Upon infection, it exhibits a dual fate: it can either enter the lytic cycle resulting in self-replication and eventual lysis and demise of the host bacterium, or incorporate its genome into that of the host replicating in tandem with the host genome and coexisting with the host cell in a lysogenic state [1,2]. The CI protein, produced by the cI gene, plays a crucial role in determining the phage’s fate. As a key regulatory protein in E. coli lambda phages, the CI protein maintains the lysogenic state by inhibiting the transcription from the (right promoter) and (left promoter) and preventing premature activation of the lytic cycle, thereby ensuring harmonious coexistence between the phage genome and the host cell [3,4]. Although the lysogenic state of the host cell remains relatively stable, specific fluctuations (noise) and genetic cues can still trigger the destruction of the host cell’s DNA, resulting in lysogenic induction and promoting the shift toward the lytic phase of the lambda phage. These random fluctuations, categorized as either intrinsic or extrinsic noise based on their source, exhibit significant autocorrelation times that are similar to the duration of the cell cycle and are often referred to as memory lag [5,6,7]. Therefore, the precise mechanisms of memory lag regulate the transition of the lambda phage from a steady lysogenic phase to a lytic phase, along with its specific role in modulating host cell immunity—whether it weakens or enhances immunity, and whether there is the regulation of threshold effects—remains to be fully elucidated.
The decision-making process governing the cell fate of the E. coli lambda phage is frequently influenced by noise, arising from a variety of factors. Firstly, the random switching of the gene promoter regions between “active” and “inactive” states, coupled with stochastic variations in mRNA and protein synthesis, introduces significant noise into the system [8]. Moreover, alterations in the host cell’s condition, including various phases of the host cell cycle, variations in metabolic processes, and the influence of external environmental stressors, can likewise contribute to the diversity of cellular responses [9]. Upon substantial environmental shifts that cause DNA damage within the host cell and activate the SOS response, the CI repressor protein undergoes degradation [10]. If the CI protein concentration dips below a crucial threshold, the lysogenic stability of the E. coli phage lambda becomes jeopardized, precipitating a swift shift to the lytic state. Concurrently, the interaction of the CI protein dimer with the (right maintenance promoter) can enhance further transcription of the gene [11]. This positive feedback mechanism maintains the concentration of the repressor protein, enabling the host cell to transmit this state to its daughter cells following division and facilitating the phenomenon of memory lag [12]. The presence of this memory mechanism implies that fluctuations exhibit a nonzero correlation time, violating the memoryless property of Markov processes and giving rise to non-Markovian dynamics. The steady-state generalized chemical master equation offers an effective framework for addressing non-Markovian processes, while the Novikov theorem facilitates the direct transformation of nonzero autocorrelation noise (color noise) into the theoretical framework of classical Markov processes [13,14]. This framework facilitates a deeper understanding of how memory lag modulates phenotypic diversity and state switching under nonequilibrium conditions, including the associated energetic costs. Consequently, it provides valuable insights into the impact of time delays on the phenotypic switching of Escherichia coli lambda phage.
The realization of biological functions typically requires the expenditure of free energy. For instance, the multi-step biochemical reactions within the lambda phage of Escherichia coli operate far from thermodynamic equilibrium to effectively regulate intracellular processes, thereby necessitating the consumption of free energy [15,16]. According to Landauer’s principle, the rate of entropy generation serves as a quantifier for the dissipation of free energy, which is primarily attributed to the system’s irreversibility and its nonequilibrium state [17]. In the multi-stable system of repressor gene expression in phage lambda, the memory effect induces fluctuations in the concentration of the lambda repressor. Moreover, the memory of each state modifies the transition rates between different states. Therefore, a pressing and crucial question is as follows: How is the transition between different states realized, and what is the associated energy cost of this process? Therefore, we try to construct an effective topological network through the redefinition of the effective transition rates among attractors to calculate the entropy production rate to measure the energy cost among these switches [18]. In addition, elucidating the influence of time delays on the energy dissipation associated with phenotypic switching in host cells is a central objective.
Motivated by recent experimental findings regarding the interactions between the CI protein and the Rex-A and Rex-B proteins of phage lambda [19], we propose a gene regulatory model that incorporates memory-induced delay fluctuations. The model seeks to explore the influence of memory lag in the phenotypic switching of host cells. Different from prior studies for stochastic resonance, our research delves into the correlation between phenotypic switching of host cells and energy consumption to elucidate the threshold effect of molecular memory regulation. Through detailed analysis of the model and the construction of an equivalent network, we identified a critical point for extrinsic noise intensity. When noise intensity exceeds this critical point, host cells lose their immune state; however, the presence of molecular memory partially mitigates the impact of noise intensity. Furthermore, the interaction between two noise sources has a dual effect on regulating the life cycle dynamics of the Escherichia coli lambda phage. Specifically, positively correlated noise promotes lytic behavior, while negatively correlated noise enhances lysogenic stability. The mean first passage time also provides additional evidence for the regulatory effects of noise intensity and memory lag. Notably, time delay mitigates the lytic growth effect induced by noise intensity. Furthermore, we reconstructed an effective topological network for circulation decomposition revealing that energy dissipation is predominantly influenced by noise intensity. At lower noise intensities, energy dissipation is minimal; conversely, higher noise intensities necessitate greater energy dissipation to maintain system stability.
In summary, phenotypic switching in Escherichia coli serves as a hallmark of host cell immune development. Investigating how multiplicative and additive noise influences the state transitions of host cells, as well as the associated energetic costs, is crucial for understanding the immune dynamics of host cells. When these distinct types of noise interact, their effects on state transitions become particularly significant.
2. Model and Methods
We first introduce a streamlined model based on the feedback regulatory loop of the repressor in phage lambda to decipher the regulatory mechanisms of the phage lambda repressor gene on CI protein level fluctuations under the influence of colored noise, and its critical role in determining the fate of the host Escherichia coli cell [20], as illustrated in Figure 1. In this model, the promoters , , and contain three sites for binding: , , and (, and are operator sites). Assuming site is inactive, we examine the dynamic behavior of the leftover two regulatory sites, and . The gene encodes the repressor protein CI, forming dimers that subsequently bind to its promoter to regulate its expression. In this system, these dimers can bind to either or . Attachment to boosts transcription and occludes the binding site of , thus preventing further regulation by . Conversely, binding inhibits gene expression.
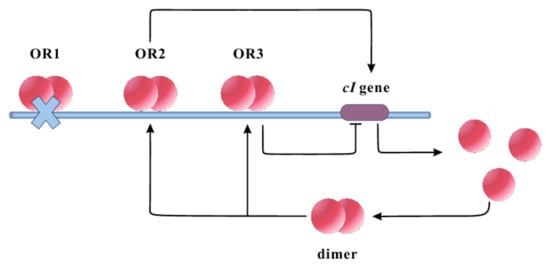
Figure 1.
Illustration of the reaction pathway of the lambda repressor promoter. The gene encodes the repressor protein CI, which forms dimers and binds to specific operator sites to regulate its expression. In the absence of the site, when the lambda repressor binds to , it functions as an activator, enhancing the transcription level of the gene and masking the inhibitory effect of the site. Conversely, when the lambda repressor binds to , it exerts a repressive effect on the expression of the gene .
We hypothesize that the phenotype of the host cell is reflected through the expression of the marker gene . The CI protein, acting as a dimer, regulates its promoter activity resulting in the formation of a positive feedback loop, maintaining transcriptional levels [20]. The varying expression levels of the lambda repressor generate a fluctuating environment, leading to changes in CI protein concentration and causing it to deviate from equilibrium or transition across two stable states. Our main attention is directed toward the biological function of gene regulation under fluctuating conditions and the associated energetic costs required to achieve such regulation. These fluctuations influence the entire process of gene expression.
The gene regulatory interactions described herein can be categorized into two types of chemical processes: fast reactions and slow reactions. Fast reactions are composed of the binding and dissociation of molecular species, characterized by time constants on the order of a few seconds. In contrast, the slow reactions occur often on the order of several minutes or longer. According to the quasi-steady assumption, the fast reactions are assumed to be in quasi-equilibrium [18]. Let , , and denote the concentrations of the repressor monomer, the repressor dimer (), and the free DNA promoter, respectively. The corresponding chemical reactions in Figure 1 can be mathematically formulated as follows:
where and denote the states where the dimer is bound to the and sites of the promoter, respectively; represent the states where the dimer are simultaneously bound to both and ; and and represent the forward and reverse reaction rate constants, respectively. Rescale the parameters, is defined as the equilibrium constant corresponding to these reactions. Denote and , where and indicate the relative binding affinities of and complexes compared to .
In contrast to the rapid processes of molecular binding and dissociation described earlier, mRNA transcription and degradation, as well as protein synthesis, are typically slow processes. Gene expression is activated only when the site of the promoter binds to the dimer, thereby enabling protein expression. Assuming that each activated promoter on average produces n proteins, the production and degradation of proteins can be mathematically represented by the following biochemical reaction equation:
Let , , , , , and denote concentrations of different reactants, respectively. The equation describing the concentration change of the inhibitor is then given by:
where denotes the fundamental production rate of protein CI. Equation (3) is not closed. To express and as functions of , the quasi-equilibrium assumption is employed. Given that all reactions in Equation (1) are rapid processes, it is assumed that these reactions rapidly attain a quasi-equilibrium state, where the forward and reverse reaction rates are in parity, leading to the following relationship:
By solving the above relationship, we can derive the dependence of , , and on the CI protein concentration :
Furthermore, the overall concentration of DNA promoters is consistently stable and is denoted as , that is,
Utilizing Equations (5) and (6), and can be articulated as functions of ,
By substituting into Equation (3), we derive the following ordinary differential equation, which elucidates the dynamics of CI protein concentration:
Equation (8) describes the dynamics of CI protein concentration in the system and contains nine parameters. Notably, some of these parameters appear in pairs. To facilitate further analysis, it is essential to perform nondimensionalization on Equation (8), reducing the number of independent parameters.
Without loss of generality, and are used to denote the dimensions of concentration and time, respectively. All quantities representing molecular concentrations have a dimension . Furthermore, and are dimensionless parameters, and the dimensions of the remaining parameters are listed below:
It can be observed that the product possesses the dimension of concentration , whereas has the dimension of time . By adopting and as the characteristic scales for concentration and time, respectively, and introducing new dimensionless variables and , Equation (8) is able to be reformulated into the following dimensionless form:
where and represent dimensionless parameters, ,.
In Equation (10), the parameter represents the self-regulation capability of the lambda repressor gene, demonstrating the ratio of the maximum protein production rate achieved through feedback regulation to the basal production rate. The parameter denotes the basal level. The parameters and represent the relative binding strengths between complexes. Experimental evidence has shown that and can be set to and [21]. Therefore, the parameters and serves as the primary regulatory parameters governing the reaction channel of the lambda repressor gene in Equation (10).
To investigate the relationship between the equilibrium state of Equation (10) and the parameters, we set . That is, the equilibrium condition of the system is ascertained by the solution to the algebraic equation:
Numerical simulations reveal that for a given value of , there exist two critical thresholds, and , such that when or , the system manifests a singular stable equilibrium state. In contrast, when , three equilibrium states are observed. This behavior is consistent for a fixed value as well. Specifically, it can be found that when and , the system exhibits bi-stability, characterized by the coexistence of two stable states: high CI protein concentration and low CI protein concentration (refer to Figure 2).
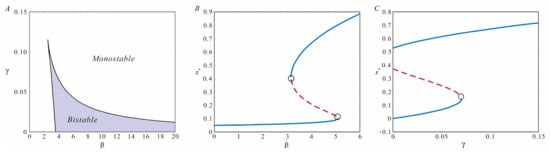
Figure 2.
(A) The bifurcation diagram in the plane. (B) Illustrates the bond between the equilibrium status of the system and the parameter , with . (C) Illustrates the interaction between the equilibrium status and the parameter , with . The circles represent bifurcation points, the blue solid line indicates that the corresponding equilibrium point is stable, and the red dashed line indicates that the corresponding equilibrium point is unstable. In both panels, the parameters are set as and .
The deterministic potential function associated with can be substantiated to be
Derived from the deterministic potential function, the system is characterized by bistability (refer to Figure 3). Specifically, the system is bimodal, featuring two stable attractors and one transient attractor .
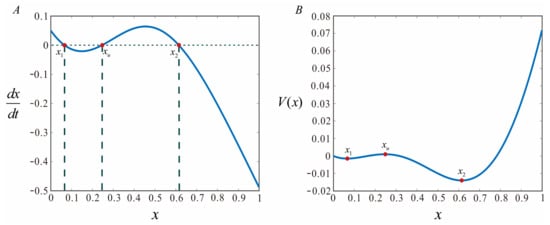
Figure 3.
Deterministic potential functions from Equations (10) and (11). (A) Implementation of Equation (10). (B) Implementation of Equation (11). Other parameters: , , , .
Furthermore, the fluctuation in lambda phage repressor gene expression can simulate a colored noise environment for the marker protein CI. Investigating the impact of noise intensity (NI) and memory lag (ML) on the phenotypic transitions of host Escherichia coli cells, as well as the costs associated with transitions between different steady states, is a topic of significant interest. Considering the sources of noise, we denote the multiplicative noise as , and the additive noise as [22,23,24]. Equation (10) will be reformulated in the following stochastic framework:
Here, and with mean 0 and variances and respectively denote Gaussian colored noises, and the correlation variance is . The parameters , , , and respectively represent the memory lag (ML) and noise intensity (NI) of and , and , indicate the associative memory (AM) and associative intensity (AI) between the two noises.
Of note, the existence of memory delay implies that the expression process described by Equation (10) no longer follows a Markov process. However, when ML and AM approach zero, i.e., , the equation reverts to the regime of classical statistical mechanics [25]. Interestingly, we prefer to emphasize the biological functions of ML/AM, specifically their function in inducing phase transitions and the associated costs of such transitions.
3. Results
3.1. Stationary Probability Distribution
To examine the effects of ML/AM and NI/AI on the CI protein concentration in the E. coli lambda phage, we employ the Novikov theorem to determine the stationary probability distribution [26,27,28]. Based on Equation (12), we derive the following approximate Fokker–Planck equation (for further information, see Supplementary Materials Section S1):
Here, and highlight the significant impact of memory effects and nonlinear dynamics on the probability density.
with
Based on Equations (13)–(15), the steady-state distribution is elicited under the boundary condition ,
where denotes the normalization constant. The following is the stochastic potential function :
Notably, Equation (17) should account for the effects of ML/AM and NI/AI, which is the absence of Equation (11), implying that even if NI is fixed at a particular point, the memory lag of the colored noise can still modulate the potential function. Furthermore, it provides valuable insights into the relative stability of equilibrium states by quantifying the potential barrier between attractors, analogous to Equation (11) [29,30]. The stochastic bifurcation can be identified by determining the extremum of the stationary distribution function . For the lambda repressor gene expression system, the extremum satisfies the following algebraic equation:
It is important to note that the condition (Equation (18)) comprises two components: the first component originates from the deterministic force, and the second component elucidates the regulatory influence of two correlated noise sources on the mechanism transition.
3.2. The Mechanism Transition Induced by the Interaction Between ML/AM and NI/AI
Gene expression is a complex biological process that manifests diverse phenotypes in response to environmental fluctuations. Compared with the traditional white noise model, colored noise provides a more accurate representation of the impacts of environmental changes on gene expression [31]. The presence of ML/AM in colored noise enables temporal regulation of gene expression, facilitating the achievement of phenotypic diversity in the lambda phage repressor gene expression through modulation of ML/AM.
Equations (13)–(18) demonstrate that the steady-state distribution is influenced by ML()/NI() of the multiplicative noise, ML()/NI() of the additive noise, and AM()/AI(). To investigate the effects of ML/AM and NI/AI from different noise sources on phenotypic switching and to visualize the steady-state distribution, we fixed parameters and (where denotes the self-regulation capacity of the lambda repressor gene and represents the basal expression level). Figure 4 specifically illustrates the influence of the interaction between ML/AM and NI/AI on host cell phenotypes. We can see that Equation (11) in Figure 3B exhibits a bistable structure for specific parameter values (refer to Figure 3). However, when the intensity of multiplicative noise is increased to 0.5, the stochastic potential function transitions from a double-well to a single-peak configuration, leading to the vanish of the high-stability state. In a word, increasing NI() attenuates the double-well structure, promoting the lysis of host Escherichia coli cells and causing them to lose their immune response. Furthermore, when the ML() of multiplicative noise increases from 0 to 2, the stochastic potential function reverts to a double-well configuration, as illustrated in Figure 4a,b. These phenomena indicate that ML can facilitate the system’s transition to a higher steady state. From a temporal standpoint, an increase in ML stimulates CI protein synthesis even if all other conditions are constant, thus allowing the lambda phage to sustain its lysogenic state. Moreover, we can note that altering either the ML() or NI() of additive noise does not significantly affect the stochastic potential function (refer to Figure 4c). As a result, the bimodal characteristics remain stable, indicating that additive noise has a negligible effect on the fluctuations of CI protein levels.
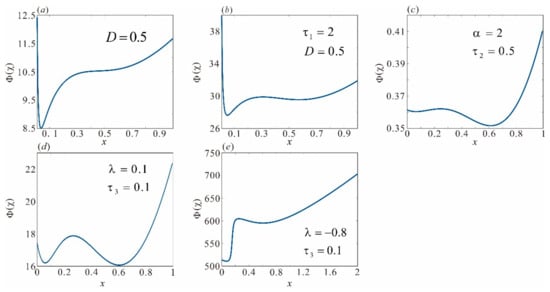
Figure 4.
Influence of different noise types on phenotypic transitions. When only multiplicative noise is considered, (a) increasing to 0.5 causes the random potential function to become unimodal, (b) fixing and increasing results in a bimodal random potential function; when only additive noise is considered, (c) the random potential function remains bimodal. When both noises are considered simultaneously with fixed, the random potential function exhibits different characteristics depending on AI (d) and (e). Other parameters , , , .
Next, we deepen our investigation into the regulatory effect of the association between two types of noise, which exhibit distinct regulatory effects for positive correlation (AI() > 0) and negative correlation (AI() < 0). It is indicated that the fluctuations in CI protein levels tend to be relatively stable if the noises exhibit a positive correlation. On the contrary, the fluctuations become more intense in the case of negatively correlated environments, leading to greater variability in CI protein levels and a rightward shift of the high-stable state.
Furthermore, we explore the mechanism underlying the phenotypic transformation of host cells. Following Equation (18), about the mutual regulation between the lambda repressor gene and protein CI, we have constructed the stochastic bifurcation diagram shown in Figure 5 and Figure 6. Indeed, the two figures illustrate that the lambda repressor gene achieves phenotypic diversification by modulating ML/AM and NI/AI. Fixed parameters at , , , and trigger a gradual change from high CI protein concentration to low CI protein concentration in the system by increasing the NI of two noise resources and forming the classical stochastic bistable region. This phenomenon indicates that binding the dimer to the site and activating the transcription of the and promoters can induce lysogeny. When the CI protein concentration drops below a critical threshold, the E. coli lambda phage rapidly switches to the lytic state. Conversely, as the ML grows, the system gradually transitions from a state of low CI protein concentration to one of high CI protein concentration, shrinking the bistable region. This shift reduces the low CI protein concentration region and enlarges the high CI protein concentration region, delaying lysis and maintaining the lysogenic state to keep the host E. coli stable.
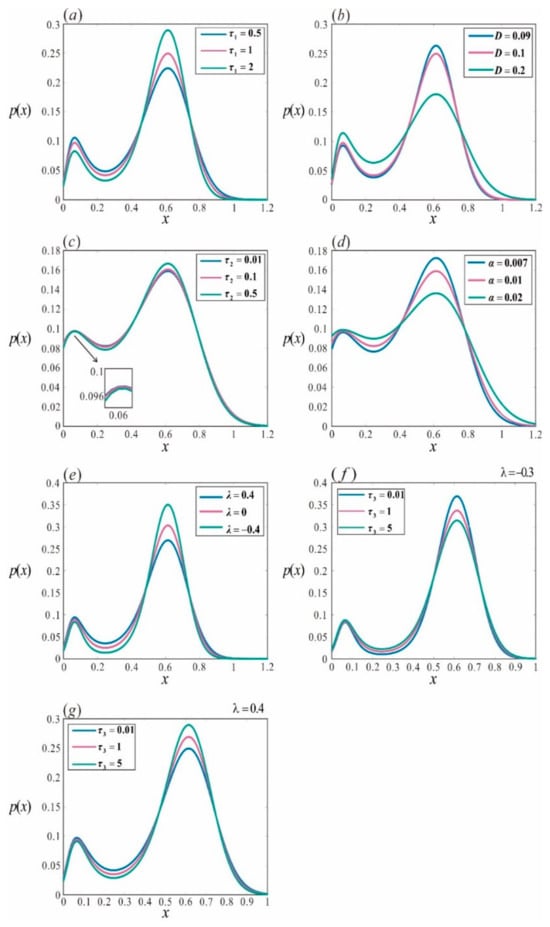
Figure 5.
Stationary probability distribution of the repressor lambda under the combined influence of multiplicative and additive noise. (a) With , ML() increases from 0.5 to 2; (b) with , NI() increases from 0.09 to 0.2; (c) with , ML() increases from 0.01 to 0.5; (d) with , NI() increases from 0.007 to 0.02; (e) with , AI() varies from −0.4 to 0.4; (f) with = −0.3, AM() increases from 0.01 to 5; (g) with , AM() increases from 0.01 to 5. Other parameters are set as
, , , , , and .
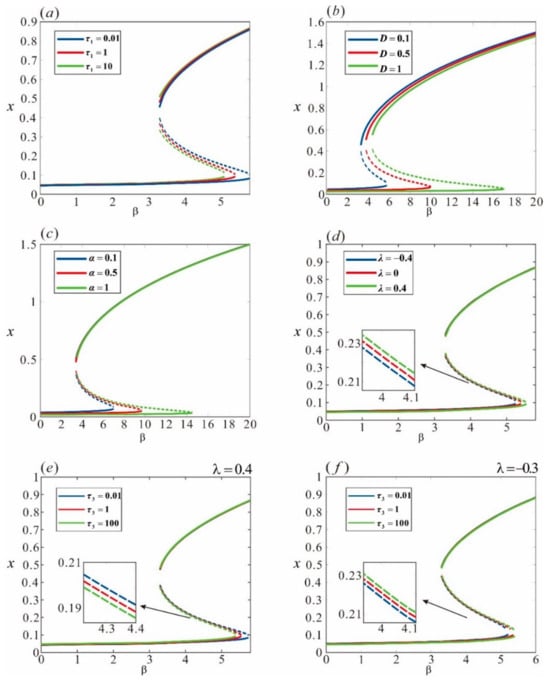
Figure 6.
Random bifurcation of the repressor lambda under the combined influence of multiplicative and additive noise. (a) ML() increases from 0.01 to 10; (b) NI() increases from 0.1 to 1; (c) NI() increases from 0.1 to 1; (d) with AM() = 1, AI() varies from −0.4 to 0.4; (e) with AI() = 0.4, AM() increases from 0.01 to 100; (f) with AI() = −0.3, AM() increases from 0.01 to 100. The solid lines indicate that the corresponding equilibrium points are stable, and the dashed lines indicate that the corresponding equilibrium points are unstable. Other parameters are set as , , , , and .
Finally, we examined the impact of the AM/AI on the phenotypic diversity of the phage lambda. There exists a switch from high CI protein concentration to low CI protein concentration with increasing AI from −0.4 to 0.4, illustrated in Figure 5 and Figure 6 (other parameters remain unchanged). This observation indicates that AI can facilitate a reduction in CI protein concentration. In other words, it promotes the binding of the dimer to the site if the association between two noises shifts from negative to positive, inhibiting gene expression and reducing CI protein concentration. Moreover, we regulate AM to decipher the phenotype switch and find that the diversity of distribution has an opposite effect depending on whether the two noise sources are positively or negatively correlated (refer to Figure 5f,g). If the two noises are positively correlated, CI protein concentration transitions from low to high, reducing in the bistable region. However, the two noises are negatively correlated, CI protein concentration shifts from high to low, an expansion of the bistable region. This implies that under varying correlation states, whether positive or negative, the binding sites () that enhance protein activity differ, leading to distinct outcomes.
4. The Impact of ML on MFPT
To further explore the impact of ML on the life activities of the lambda phage, we analyze the mean first-passage time (MFPT) of transitions between high and low CI protein states in the system [32]. Initially, we derive the landscape potential energy function and subsequently calculate the MFPT of the system. By employing Kramers’ formula [33,34], we obtain the MFPT for transitioning from one stable attractor to another attractor , where denotes .
Similarly, the inverse process denotes
where denotes the noise intensity (NI), and , represents the effective potential energy given by Equation (17). is Equation (11). denotes the system’s low stable state, and represents the high stable state. Notably, the theoretical results are subject to specific constraints: , that is, the NI of both noise sources must be less than the energy barrier. This imposes limitations on the parameters (i.e., , , and ), and the subsequent findings are valid only within the effective region.
Focusing on the biological function of the repressor gene under CI protein fluctuations, we gain the MFPT switching between high and low CI protein concentration regulated by ML of various noise sources to elucidate the changing trend of the lambda phage reproduction mode shown in Figure 7. Figure 7a,b illustrate the regulation of the MFPT by ML() of the multiplicative noise. Figure 7a depicts the phenotypic transition from the highly stable state to the low stable state . If the noise intensity (NI) is fixed (each colored line), the MFPT increases with the rise in ML(), indicating that increasing the ML() of multiplicative noise promotes the lambda phage’s development toward the lysogenic state, and maintains intracellular stability within the host Escherichia coli cells. Furthermore, as the NI() climbs, the MFPT exhibits a decreasing trend. This indicates that higher NI() facilitates the transition from the high CI protein concentration to the low CI protein concentration; that is, increasing multiplicative noise intensity promotes phenotypic diversity in cells and accelerates the switching from the lysogenic to lytic states. In Figure 7b, the situation is almost the reverse. The MFPT decreases as the ML() of multiplicative noise increases, and the MFPT increases as NI() grows (from the blue line to the green line). These indicate that during the shift from the low CI protein concentration to the high CI protein concentration, ML() suppresses the increase in low CI protein concentration, and NI() mitigates this suppression, suggesting a potential compromise between ML and NI [35].
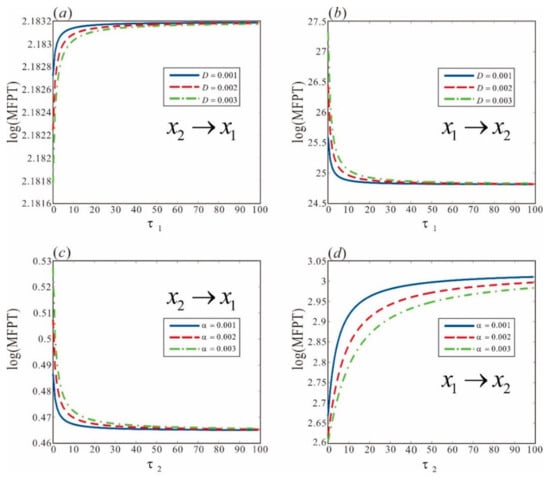
Figure 7.
Illustration of the MFPT between different CI protein concentrations in phage lambda regulated by ML. (a,b) show MFPT under ML() regulation of multiplicative noise, and (c,d) show MFPT under ML() regulation of additive noise. Specifically, (a,c) depict the change from high CI protein concentration to low CI protein concentration, and (b,d) depict the change from low CI protein concentration to high CI protein concentration. Other parameters: , , , .
As demonstrated in Figure 7c,d for additive noise, increasing the ML() prolongs the MFPT from the low CI concentration to the high CI concentration and reduces the MFPT from the high CI concentration to the low CI concentration. Furthermore, if the NI() is fixed at 10, increasing the NI() reduces the MFPT from the low CI protein level to the high CI protein level and increases the MFPT from the high CI protein level to the CI protein level. These observations also indicate a potential compromise between the ML and NI of additive noise. In the presence of both two noises, a trade-off relationship still exists between them. This suggests that the intensity of colored noise and memory lag have a mutual offsetting effect on host cell phenotype transitions.
5. Impact of Noise Interactions on Energy Dissipation
Finally, we will assess the balance of gains and losses between phenotypic switching of host cells and energy dissipation under ML/AM and NI/AI to elucidate the mechanisms by which state switching is achieved during lambda phage development. From a thermodynamic perspective, fluctuating environments induce the system to deviate from equilibrium and disrupt the detailed balance resulting in energy dissipation of phenotypic transitions or particles to leap from one attractor to another [16]. Therefore, measuring energy dissipation not only quantifies the cost of phenotypic transitions but also serves as an indicator of system stability. For bimodal biological systems, this metric is crucial for segmenting the system’s circulation flow into two components: the entropy flow rate and the irreversible entropy production. These components respectively quantify the dissipative processes and deviation from detailed balance. Moreover, for a state i of the Markov process, if the stationary probability distribution is denoted as , where is the Boltzmann constant and is temperature, the transition energy is given by in detailed balance. By this means, the shift rates in the Markov process can be compared to the rates at which particles leap between different energy levels [36].
However, the ML/AM of colored noise introduces an autocorrelated time delay into the expression process; that is, the expression of the repressor gene in a fluctuating environment (Equation (12)) exhibits time-autocorrelation. It means that the expression of the gene cI deviates from Markov dynamics and has memory lag. This characteristic complicates the decomposition of circulation flow, and it is essential for elucidating the irreversibility or degree of nondetailed balance in non-Markov processes. It is well established that the development of the fluctuation–dissipation theorem concerning nonequilibrium steady states has reached a high level of maturity grounded in the chemical master equation (CME) for noncontinuous systems [14,18]. In bistable systems, the observed dynamics are not governed by Equation (11) but by random leaps across separate states characterized by sinks. Determining the equilibrium probability distribution of these sinks plays a key role in the breakdown of the circulation flow within non-Markov dynamics.
Furthermore, from the perspectives of deterministic processes, multiplicative noise, additive noise, and the correlation between these two types of noise, four distinct time scales emerge. To effectively integrate these time scales and quantify the mechanistic effects of various environmental factors, it is imperative to develop a comprehensive strategy. Therefore, we propose the topology equivalent network.
The bistable system is capable of being similarly portrayed as a random hopping process occurring between two stable sinks: (representing the low stable sink or “off” sink) and (representing the high stable sink or “on” sink), as illustrated in Figure 8. According to Kramers’ formula [32], should the transition rate among these sinks equate to the inverse of the MFPT, it becomes feasible to reconstitute the positive feedback loop in its stochastic representation for reaction (1). The molecular reaction network in biology is susceptible to being characterized by the ensuing CME (for further particulars, consult Supplementary Materials Section S2):
where and and the factorial probabilities and , respectively, convey the probability of having gene products at the time as the promoters are in an inactive sink (“off” or low sink) and an active mode (“on” or high sink). denotes the overall probability and provides the probability distribution for the two sinks. Equation (21) describes a Markov process that characterizes the switching and dwelling behavior between neighboring stable attractors [37,38].
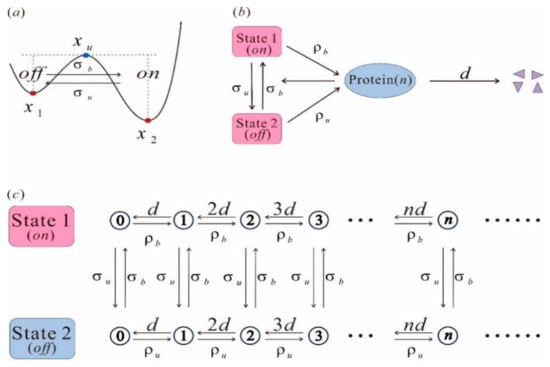
Figure 8.
State transition and equivalent network structure. (a) The system transitions from one steady equilibrium state to another; (b) the topologically equivalent network, which includes change between the off state and the on state; (c) the stochastic jump process between different states, forming a cyclic flow.
Owing to the memory lag introduced by positive feedback, accurately estimating parameters such as feedback strength, transition rate, production rate, and decomposition rate poses significant challenges. To address this complexity, we employed a linear mapping approximation approach. By integrating conditional mean-field approximation and Magnus expansion, we obtain transient or steady-state distributions of gene products [39]. Set the equilibrium moment equation to zero, with the powerful transition rate denoted as . That is,
Therefore, Equation (16) can be expressed as
The equilibrium solution for this equation is provided by the following expression:
where
and denotes the generating function of the relevant probability distribution.
Based on the construction principles of topological networks, two network Equations (13) and (23) are considered equivalent if they exhibit identical stationary probability distributions. Therefore, classical nonlinear fitting can be employed to match the empirical information (Equation (13)) to secure effective value estimates with accuracy. The stationary probability distribution can be decomposed into factorial probabilities, representing the residence probabilities of each attractor to calculate the circulation flow. According to Equation (23), a Markov process can be formulated, where denotes the state measurement, signifies the state transition rate, represents the stationary probability distribution, and the entropy production (also referred to as energy dissipation, denoted as ED) is calculated according to the subsequent formula:
Utilizing the known distribution of gene products, we derive the formula for calculating energy cost:
Here, Equation (27) clarifies the energy dissipation associated with Markov dynamics, representing the nondetailed balance of transitions from one state to another.
Furthermore, we present results on power dissipation to more accurately approximate the expenses of phenotypic transitions triggered by ML/AM and NI/AI, as shown in Figure 9. These findings illustrate that fluctuating environments can reshape energy costs in diverse manners.
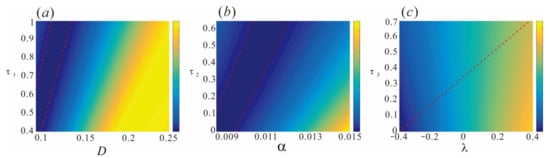
Figure 9.
Energy consumption for transitions between different phenotypes of the lambda repressor in a colored fluctuating environment. (a) The impact of NI()/ML() on ED; (b) the impact of NI()/ML() on ED; (c) interaction of both noises. Other parameters: , , , , , .
Figure 9 illustrates that the phenotypic switching of host cells requires the dissipation of different levels of energy in different noise environments, suggesting the presence of hedging relationships in terms of cost during the regulatory process. In multiplicative noise environments, energy consumption increases with rising NI() levels. However, the presence of ML() can mitigate this increase. That is, when NI() is low, adjusting ML() can reduce energy consumption and minimize overall costs. This complex dynamic indicates a clear hedging relationship concerning phenotypic switching. It is evident within the region bounded by the two red lines in Figure 9a. Similarly, additive noise environments exhibit a region of minimal energy consumption, as shown in Figure 9b. Compared to multiplicative noise, this region shifts slightly to the right and remains relatively stable, indicating that ML() and NI() in additive noise can also induce phenotypic switching in host cells. When the two types of noise are combined, the energy consumption exhibits distinct characteristics, as illustrated in Figure 9c. Along the red dashed line from right to left, decreasing AI() results in lower energy requirements. It is well established that higher energy consumption generally correlates with greater system stability or a higher likelihood of maintaining the intended state, analogous to particle fluctuations within a system attractor. These findings suggest that in complex colored noise environments, genes may utilize multiple pathways to achieve phenotypic transitions while consuming less energy. Moreover, an optimal path exists that can be achieved by modulating noise intensity and memory lag.
6. Conclusions
The biochemical pathways of cells form a complex network to decode diverse extracellular signals and elicit phenotypic responses for enhanced survival. In the lambda phage repressor gene expression, entwined positive (PFL) and negative (NFL) feedback loops give rise to ML/AM between intrinsic and extrinsic noise, indicating that fluctuations during gene expression create a colored noise environment [6,7]. Here, we developed a synthetic gene regulatory model under multiplicative and additive noise environments to investigate the effects of variations in the density of the repressor CI protein on the stable state structure of gene expression. Upon examination of the model, it was ascertained that the predominant influence on the vital functions of the Escherichia coli lambda phage is attributable to multiplicative noise. Notably, AI() exhibits a dual role in lambda phage development, depending on its sign: positive AI() (greater than zero) indicates a positive correlation between the two noises, promoting gene expression, while negative AI(less than zero) indicates a negative correlation, inhibiting gene expression. Furthermore, ML can either reduce or prolong the MFPT depending on different conditions. These phenomena suggest that regulating ML can help maintain the original phenotype of the host cells. Moreover, gene self-regulation mediated by NI and ML breaks detailed balance by sacrificing increased energy expenditure. By reconstructing the functional topological structure, we find that bimodality becomes more pronounced with lower energy consumption when NI is low. Conversely, when NI is high, the energy cost increases, indicating greater energy expenditure to keep the regulatory effects of ML. Our findings significantly contribute to a deeper understanding of the influence exerted by colored noise on the vital processes of the Escherichia coli lambda phage and provide elucidation on the pivotal functions that ML/AM and NI/AI play in the modulation of gene expression.
The existence of memory lag offers additional regulatory mechanisms for controlling gene phenotypes, specifically through variable NI/AI and ML/AM parameters (denoted as , , , , , ). To provide an in-depth clarification on the interdependence between variable values and state switching, we formulate the function that quantifies the trade-offs between costs and benefits as follows: , where and are weighting coefficients (), is the inverse of the variable magnitudes encompassed within the probabilistic distribution region, and MFPT represents the mean first passage time. This formulation allows us to quantify the sensitivity effect (see Supplementary Materials Section S3 for details). It is important to note that the scales of these two indicators differ substantially. To address this discrepancy, we rescale each trajectory by dividing it by its minimum value and plot Figure 10 based on their relative multiples. Since the absolute value of AM() is the smallest, it serves as the reference point (as detailed in Supplementary Materials Section S3). Indeed, Figure 10 demonstrates significant variations in the sensitivity indices of the regulatory parameters concerning phenotypic diversity.
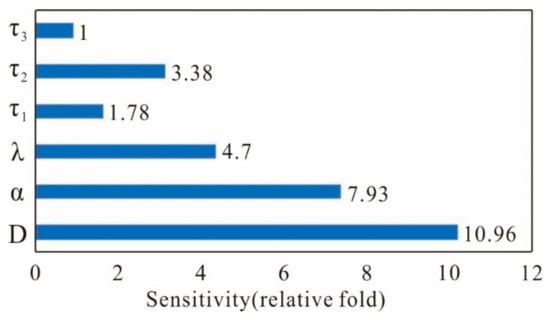
Figure 10.
The cost-benefit function of the sensitivity effect is stipulated as the weighted sum of the probabilistic distribution and MFPT of the variable parameters (for further details, see Supplementary Materials Section S3).
As the NI() of multiplicative noise displays an elevation, the maximum sensitivity effect can reach approximately 10.96-fold, indicating that the system exhibits greater sensitivity to multiplicative noise compared to additive noise. With increasing ML(), the maximum sensitivity effect of ML/AM regulation can reach approximately 3.38-fold, suggesting that adjusting ML() requires less cost than adjusting ML() (used as the benchmark) and ML() (approximately 1.78-fold) to achieve phase switching, as illustrated in Figure 4, Figure 5 and Figure 6. This indicates that ML/AM acts as a fine-tuner, while NI/AI governs the regulatory process based on the type of noise and their interactions. In fact, the color noise within cells (extrinsic noise) coexists with gene expression noise (intrinsic noise) and can sharpen the gene expression boundaries in the zebrafish hindbrain [40]. Moreover, the fluctuations in the translation rate () and transcription rate () of multiplicative noise contribute the most to total noise [41]. Figure 10 demonstrates that multiplicative noise shows heightened sensitivity to phase switching compared to other noise sources, implying that the system may preferentially select multiplicative noise for its functions due to its heightened sensitivity to nonlinear effects.
From a biological perspective, gene expression must conform to the principles of optimal evolutionary adaptability for survival. This suggests that gene expression is the outcome of a delicate balance between local and global constraints [42,43]. An important constraint on gene expression is adaptability. Different from white noise, the colored noise decoded by cells is crucial for forming adaptive coupling feedback loops, an effective mechanism for regulating gene phenotypes. This finding highlights the potential advantages of system adaptability in fluctuating environments. Another key constraint is the minimization of energy dissipation. Our analysis of cellular phenotypes and their associated energy costs reveals that energy expenditure is primarily concentrated during phase transitions rather than in maintaining relative stability. This suggests that systems typically maintain a stable state, a fundamental characteristic of gene expression, unless external environmental fluctuations force changes, which are often accompanied by significant energy costs [44]. By integrating the concepts of “adaptability” and “minimizing energy consumption”, we can infer the existence of an adaptive potential landscape, providing a promising avenue for future research.
Supplementary Materials
The following supporting information can be downloaded at: https://www.mdpi.com/article/10.3390/math13071154/s1, Section S1: Approximation Fokker-Planck Equation (aFPE) for General Langevin Equation; Section S2: Linear Mapping Approximation (LMA); Section S3: Analysis of Sensitivity Effect; Section S4: Supplementary Graphics. References cited in Supplementary Materials [27,28,39,45,46,47,48,49,50].
Author Contributions
Conceptualization, F.C., S.W. and H.W.; methodology, F.C., S.W., S.L. and H.W.; software, F.C., S.W. and H.W.; formal analysis, H.W.; investigation, F.C., S.W. and H.W.; writing—original draft preparation, F.C., S.W., S.L. and H.W. All authors have read and agreed to the published version of the manuscript.
Funding
The work was supported by the National Natural Science Foundation of China (Grant No. 12261028, 12361105), the Hainan Province Science and Technology Special Fund (No. ZDYF2021SHFZ231), the Natural Science Foundation of Hainan Province (Grant No. 122QN215), Open Project of Key Laboratory of Engineering Modeling and Statistical Computation of Hainan Province (HNGCTJ2401), and the Specific Research Fund of the Innovation Platform for Academician of Hainan Province.
Data Availability Statement
Data sharing is not applicable to this article as no new data were created or analyzed in this study.
Conflicts of Interest
The authors declare no conflict of interest.
References
- Makky, S.; Dawoud, A.; Safwat, A.; Abdelsattar, A.S.; Rezk, N.; El-Shibiny, A. The bacteriophage decides own tracks: When they are with or against the bacteria. Curr. Res. Microb. Sci. 2021, 2, 100050. [Google Scholar] [PubMed]
- Azulay, G.; Pasechnek, A.; Stadnyuk, O.; Ran-Sapir, S.; Fleisacher, A.M.; Borovok, I.; Sigal, N.; Herskovits, A.A. A dual-function phage regulator controls the response of cohabiting phage elements via regulation of the bacterial SOS response. Cell Rep. 2022, 39, 110723. [Google Scholar] [PubMed]
- Lee, S.; Lewis, D.E.A.; Adhya, S. The Developmental Switch in Bacteriophage λ: A Critical Role of the Cro Protein. J. Mol. Biol. 2018, 430, 58–68. [Google Scholar] [CrossRef]
- Shao, Q.; Trinh, J.T.; Zeng, L. High-resolution studies of lysis–lysogeny decision-making in bacteriophage lambda. J. Biol. Chem. 2019, 294, 3343–3349. [Google Scholar] [CrossRef]
- Gershman, S.J. The molecular memory code and synaptic plasticity: A synthesis. Biosystems 2023, 224, 104825. [Google Scholar]
- Elowitz, M.B.; Levine, A.J.; Siggia, E.D.; Swain, P.S. Stochastic Gene Expression in a Single Cell. Science 2002, 297, 1183–1186. [Google Scholar] [CrossRef]
- Sanchez, A.; Golding, I. Genetic Determinants and Cellular Constraints in Noisy Gene Expression. Science 2013, 342, 1188–1193. [Google Scholar]
- Ozbudak, E.M.; Thattai, M.; Kurtser, I.; Grossman, A.D.; van Oudenaarden, A. Regulation of noise in the expression of a single gene. Nat. Genet. 2002, 31, 69–73. [Google Scholar]
- Kærn, M.; Elston, T.C.; Blake, W.J.; Collins, J.J. Stochasticity in gene expression: From theories to phenotypes. Nat. Rev. Genet. 2005, 6, 451–464. [Google Scholar]
- Memar, M.Y.; Yekani, M.; Celenza, G.; Poortahmasebi, V.; Naghili, B.; Bellio, P.; Baghi, H.B. The central role of the SOS DNA repair system in antibiotics resistance: A new target for a new infectious treatment strategy. Life Sci. 2020, 262, 118562. [Google Scholar] [PubMed]
- Vohradsky, J. Lambda phage genetic switch as a system with critical behavior. J. Theor. Biol. 2017, 431, 32–38. [Google Scholar] [PubMed]
- Pedraza, J.M.; Paulsson, J. Effects of Molecular Memory and Bursting on Fluctuations in Gene Expression. Science 2008, 319, 339–343. [Google Scholar] [PubMed]
- Łuczka, J. Non-Markovian stochastic processes: Colored noise. Chaos 2005, 15, 26107. [Google Scholar] [PubMed]
- Vainstein, M.H.; Rubí, J.M. Gaussian noise and time-reversal symmetry in nonequilibrium Langevin models. Phys. Rev. E Stat. Nonlinear Soft. Matter. Phys. 2007, 75, 031106. [Google Scholar] [CrossRef]
- Young, R. Phage lysis: Three steps, three choices, one outcome. J. Microbiol. 2014, 52, 243–258. [Google Scholar]
- Yang, X.; Chen, Y.; Zhou, T.; Zhang, J. Exploring dissipative sources of non-Markovian biochemical reaction systems. Phys. Rev. E 2021, 103, 052411. [Google Scholar] [CrossRef]
- Bérut, A.; Arakelyan, A.; Petrosyan, A.; Ciliberto, S.; Dillenschneider, R.; Lutz, E. Experimental verification of Landauer’s principle linking information and thermodynamics. Nature 2012, 483, 187–189. [Google Scholar]
- Ao, P. Emerging of Stochastic Dynamical Equalities and Steady State Thermodynamics from Darwinian Dynamics. Commun. Theor. Phys. 2008, 49, 1073–1090. [Google Scholar]
- Thomason, L.C.; Schiltz, C.J.; Court, C.; Hosford, C.J.; Adams, M.C.; Chappie, J.S.; Court, D.L. Bacteriophage λ RexA and RexB functions assist the transition from lysogeny to lytic growth. Mol. Microbiol. 2021, 116, 1044–1063. [Google Scholar]
- Hasty, J.; Isaacs, F.; Dolnik, M.; McMillen, D.; Collins, J.J. Designer gene networks: Towards fundamental cellular control. Chaos 2001, 11, 207–220. [Google Scholar]
- Hasty, J.; Pradines, J.; Dolnik, M.; Collins, J.J. Noise-based switches and amplifiers for gene expression. Proc. Natl. Acad. Sci. USA 2000, 97, 2075–2080. [Google Scholar] [PubMed]
- Raser, J.M.; O’Shea, E.K. Control of Stochasticity in Eukaryotic Gene Expression. Science 2004, 304, 1811–1814. [Google Scholar] [CrossRef] [PubMed]
- Sneppen, K.; Ringrose, L. Theoretical analysis of Polycomb-Trithorax systems predicts that poised chromatin is bistable and not bivalent. Nat. Commun. 2019, 10, 2133. [Google Scholar] [PubMed]
- Wang, B.; Yan, S. Correlation function of an optical bistable system with cross-correlated additive white noise and multiplicative colored noise. Chin. Opt. Lett. 2009, 7, 838–840. [Google Scholar]
- Duan, W.L.; Fang, H. The unified colored noise approximation of multidimensional stochastic dynamic system. Phys. A 2020, 555, 124624. [Google Scholar]
- Fox, R.F. Numerical simulations of stochastic differential equations. J. Stat. Phys. 1989, 54, 1353–1366. [Google Scholar]
- Frank, T.D. Delay Fokker-Planck equations, Novikov’s theorem, and Boltzmann distributions as small delay approximations. Phys. Rev. E Stat. Nonlinear Soft. Matter. Phys. 2005, 72, 011112. [Google Scholar]
- Zhu, P. Associated relaxation time and intensity correlation function of a bistable system driven by cross-correlation additive and multiplicative colored noise sources. Eur. Phys. J. B 2007, 55, 447–452. [Google Scholar]
- Fang, X.; Liu, Q.; Bohrer, C.; Hensel, Z.; Han, W.; Wang, J.; Xiao, J. Cell fate potentials and switching kinetics uncovered in a classic bistable genetic switch. Nat. Commun. 2018, 9, 2787. [Google Scholar] [CrossRef]
- Houchmandzadeh, B.; Vallade, M. Exact results for a noise-induced bistable system. Phys. Rev. E Stat. Nonlinear Soft. Matter. Phys. 2015, 91, 022115. [Google Scholar]
- Aquino, G.; Rocco, A. Bimodality in gene expression without feedback: From Gaussian white noise to log-normal colored noise. Math. Biosci. Eng. 2020, 17, 6993–7017. [Google Scholar] [CrossRef] [PubMed]
- Zhang, H.Q.; Xu, W.; Xu, Y. The study on a stochastic system with non-Gaussian noise and Gaussian colored noise. Phys. A. 2009, 388, 781–788. [Google Scholar] [CrossRef]
- Fox, R.F. Laser-noise analysis by first-passage-time techniques. Phys. Rev. A Gen. Phys. 1986, 34, 3405–3408. [Google Scholar] [CrossRef] [PubMed]
- Hänggi, P.; Bartussek, R.; Talkner, P.; Łuczka, J. Noise-induced transport in symmetric periodic potentials: White shot noise versus deterministic noise. Europhys. Lett. 1996, 35, 315. [Google Scholar] [CrossRef]
- Liu, P.; Yuan, Z.; Wang, H.; Zhou, T. Decomposition and tunability of expression noise in the presence of coupled feedbacks. Chaos 2016, 26, 043108. [Google Scholar] [CrossRef]
- Jia, C.; Grima, R. Small protein number effects in stochastic models of autoregulated bursty gene expression. J. Chem. Phys. 2020, 152, 084115. [Google Scholar] [CrossRef]
- Kumar, N.; Platini, T.; Kulkarni, R.V. Exact Distributions for Stochastic Gene Expression Models with Bursting and Feedback. Phys. Rev. Lett. 2014, 113, 268105. [Google Scholar] [CrossRef]
- Shahrezaei, V.; Swain, P.S. Analytical distributions for stochastic gene expression. Proc. Natl. Acad. Sci. USA 2008, 105, 17256–17261. [Google Scholar] [CrossRef]
- Cao, Z.; Grima, R. Linear mapping approximation of gene regulatory networks with stochastic dynamics. Nat. Commun. 2018, 9, 3305. [Google Scholar] [CrossRef]
- Zhang, L.; Radtke, K.; Zheng, L.; Cai, A.Q.; Schilling, T.F.; Nie, Q. Noise drives sharpening of gene expression boundaries in the zebrafish hindbrain. Mol. Syst. Biol. 2012, 8, 613. [Google Scholar] [CrossRef]
- Shahrezaei, V.; Ollivier, J.F.; Swain, P.S. Colored extrinsic fluctuations and stochastic gene expression. Mol. Syst. Biol. 2008, 4, 196. [Google Scholar]
- Qian, H. The mathematical theory of molecular motor movement and chemomechanical energy transduction. J. Math. Chem. 2000, 27, 219–234. [Google Scholar]
- Schwanhäusser, B.; Busse, D.; Li, N.; Dittmar, G.; Schuchhardt, J.; Wolf, J.; Chen, W.; Selbach, M. Global quantification of mammalian gene expression control. Nature 2011, 473, 337–342. [Google Scholar]
- Joshi, H. Mechanistic insights of COVID-19 dynamics by considering the influence of neurodegeneration and memory trace. Phys. Scr. 2024, 99, 035254. [Google Scholar]
- Liang, G.Y.; Cao, L.; D. Wu, J. Approximate Fokker–Planck equation of system driven by multiplicative colored noises with colored cross-correlation. Phys. A-Stat. Mech. 2004, 335, 371–384. [Google Scholar]
- Chen, F.F. Introduction to Kinetic Theory. In Introduction to Plasma Physics; Springer: Boston, MA, USA, 1995; Volume 7, pp. 199–239. [Google Scholar]
- Shenton, L.R.; Bowman, K.O. A bivariate model for the distribution of b1 and b2. J. Am. Stat. Assoc. 1977, 72, 206–211. [Google Scholar]
- Wu, D.J.; Li, C.; Kang, S.Z. Bistable kinetic model driven by correlated noises: Steady-state analysis. Phys Rev E. 1994, 4, 2496. [Google Scholar]
- Hanggi, P.; Mroczkowski, T.J.; Moss, F.; Mcclintock, P. Bistability driven by colored noise: Theory and experiment. Phys. Rev. A Gen. Phys. 1985, 32, 695–698. [Google Scholar] [CrossRef]
- Liu, P.; Wang, H.; Huang, L.; Zhou, T. The dynamic mechanism of noisy signal decoding in gene regulation. Sci. Rep. 2017, 7, 42128. [Google Scholar]
Disclaimer/Publisher’s Note: The statements, opinions and data contained in all publications are solely those of the individual author(s) and contributor(s) and not of MDPI and/or the editor(s). MDPI and/or the editor(s) disclaim responsibility for any injury to people or property resulting from any ideas, methods, instructions or products referred to in the content. |
© 2025 by the authors. Licensee MDPI, Basel, Switzerland. This article is an open access article distributed under the terms and conditions of the Creative Commons Attribution (CC BY) license (https://creativecommons.org/licenses/by/4.0/).