Article

A Modified Nonlinear Lorentz Model for Third-Order Optical Nonlinearity

Division of Physics, Engineering, Mathematics, and Computer Science, Delaware State University, Dover, DE 19901, USA
*
Author to whom correspondence should be addressed.
Mathematics 2025, 13(8), 1354; https://doi.org/10.3390/math13081354
Submission received: 8 March 2025 / Revised: 18 April 2025 / Accepted: 19 April 2025 / Published: 21 April 2025

Abstract

:
In this study, we propose a new nonlinear polarization model that modifies the polarization equation to account for the material’s nonlinear response. Specifically, the nonlinear restoring force in our model is reformulated as an electric field-dependent function, derived from the nonlinear Lorentz model. Additionally, we perform a comparative analysis of the Kerr model, the Duffing model, the nonlinear Lorentz model, and our modified nonlinear Lorentz model (MNL) by solving Maxwell’s equations using the finite-difference time-domain (FDTD) method. This research focuses on the third-order nonlinearity of these models under varying light intensities and different ratios of resonant frequency to carrier frequency. First, in the example we studied, our results show that the MNL model produces results closer to the Kerr model when the light intensity is significantly high. Second, the comparison under different resonant frequencies reveals that all models converge to the Kerr model when the carrier frequency is much lower than the resonant frequency. However, when the carrier frequency significantly exceeds the resonant frequency, the differences between the Kerr model and the other models become more noticeable. The third-order nonlinearity of our MNL model aligns more closely with the Kerr model than the nonlinear Lorentz and Duffing models do when the ratio of resonant frequency to carrier frequency is between 1 and 2.

1. Introduction

The third-order nonlinear optical effect, arising from the third-order susceptibility χ ( 3 ) , plays a critical role in many advanced optical applications, such as optical communication [1,2,3,4,5], supercontinuum generation [6], and the analysis of material structures [7,8]. The third-order susceptibility gives rise to the Kerr effect [7], where the refractive index becomes intensity-dependent. In optical fibers, a balance between dispersion and the Kerr effect enables optical solitons to propagate over long distances without distortion [9,10], which is critical for long-haul optical communication. For optical imaging utilizing high-intensity pulsed lasers, proper consideration of nonlinear effects is essential. This is particularly important for advanced techniques, including statistical gating methods [11] and refractive index matched scanning [12]. Since extensive research has been conducted in this area, many nonlinear models have been proposed, including the Kerr model [9,10,13], the Duffing model [14,15,16], and the nonlinear Lorentz model [17,18,19].
The Kerr model primarily describes instantaneous, intensity-dependent changes in the refractive index resulting from third-order nonlinearity, without explicitly accounting for the frequency-dependent variation of the refractive index, known as dispersion [7]. The Kerr model focuses on the third-order nonlinear response of materials, making it crucial for understanding and predicting various nonlinear optical phenomena, such as self-focusing, soliton formation, and self-phase modulation [7]. Recent studies also highlight the importance of polarization control in enhancing optical focusing. For example, Wang [20] developed a full-Stokes metalens via inverse design, enabling compact, polarization-resolved high-resolution imaging. To account for dispersion and nonlinear effects, applying the auxiliary differential equation (ADE) method to polarization is a useful approach [10].
The linear Lorentz model is a foundational framework for modeling dispersive media [21,22], as evidenced by recent advancements in numerical simulations. For example, Xie [23] utilized a multiterm-modified Lorentz model to simulate electromagnetic wave propagation in various linear dispersive media. To better capture the nonlinear response of materials under high-intensity fields, researchers have extended the Lorentz framework by incorporating third-order nonlinearities. One well-known approach is the Duffing model, which is derived by adding the nonlinear Duffing oscillator to the linear Lorentz model [16,24]. The main advantage of using the nonlinear Duffing oscillator is its inherent ability to describe both linear and nonlinear dispersion [16]. Another advantage is that the Duffing oscillator exists in various forms, such as exponential, rational, and polynomial, with the exponential and rational forms exhibiting saturation effects [25,26]. However, since the Duffing nonlinearity is introduced by adding nonlinear restoring forces, it can lead to instabilities in time-domain simulations [19,24].
The nonlinear Lorentz model is another representative extension of the linear Lorentz model, incorporating higher-order polarization terms to account for the material’s nonlinear response to an electric field. This model captures both dispersion and nonlinear effects, establishing a direct relationship between the numerical susceptibility parameters χ ( n ) and those commonly used in nonlinear perturbative optics, which are typically derived from measurements or preliminary calculations [7]. Additionally, the nonlinear Lorentz model not only effectively describes higher-order polarization effects [27] but also provides a clear mechanistic understanding of nonlinear phenomena [28]. Moreover, a modified strong-field Lorentz model (SNL) was introduced in [17], but it requires the carrier frequency to be significantly smaller than the resonant frequency [17].
Accurate modeling of third-order optical nonlinearity is crucial for advancing photonic technologies, yet existing models often suffer from numerical instability or limited frequency applicability. In this study, we propose a modified nonlinear Lorentz (MNL) model to describe third-order optical nonlinearity. In the Duffing model, nonlinearity is introduced by adding a nonlinear restoring force, f ( P ) , where P is the polarization. In contrast, the nonlinear Lorentz model incorporates nonlinearity by introducing a nonlinear source, which depends on the electric field E. Our MNL model bridges these two approaches: it follows the Duffing framework by modifying the restoring force, but redefines f as a function of E, derived from the nonlinear Lorentz model. This design enables the MNL model to capture electric field-dependent nonlinear behavior while preserving the dispersion effect. Note that our model focuses specifically on nonlinear effects and differs from the modified linear Lorentz models discussed in [23,29,30,31]. We implement our model in the finite-difference time-domain (FDTD) framework. The FDTD method, originally introduced in [32], is a powerful and flexible technique for numerically solving Maxwell’s equations of electrodynamics. Our model is validated through numerical simulations. We also investigate the influence of light intensity on third-order nonlinearity by comparing models under varying light intensities. We also compare the third-order nonlinear behavior under different ratios of resonant frequency ( ω 0 ) to carrier frequency ( ω ) .
This paper is structured as follows: In Section 2, we present the polarization function and the update equation for each model with details. In Section 3, we present simulation results to validate our model and compare the performance of various other models. Finally, a conclusion is given in Section 4.

2. Models

In this section, we start by presenting Maxwell’s equations,
· D = ρ f ,
· B = 0 ,
                          t B = × E ,
                                    t D = × H J f .
These equations were discovered by James Clerk Maxwell in 1861 [33] and describe the relationship between the electric and magnetic fields and how these two fields relate to the source, influence each other, and evolve over time. Equations (1) and (2) represent Gauss’s laws for the electric and magnetic fields, respectively, while Equation (3) is Faraday’s law, and Equation (4) is Ampere’s law. In these equations, D is the electric flux density, B is the magnetic flux density, E is the electric field, H is the magnetic field, J f is the free current density, ρ f is the free charge density, ϵ is the permittivity, and μ is the permeability.
In Maxwell’s Equations, the displacement field D accounts for polarization effects
D = ϵ 0 E + P ,
where P represents the polarization. In this study, different models correspond to distinct polarization equations. In this study, all the simulations are conducted using Equations (1)–(5) with different polarization equations. Therefore, in this section, we focus on presenting the polarization equation for each model, including Kerr, Duffing, nonlinear Lorentz, SNL, and MNL.
With the exception of the Kerr model, all other nonlinear third-order models are derived from the linear Lorentz model. The standard linear Lorentz model oscillator is described in [7],
2 P 2 t + 2 δ P t + w 0 2 P = ϵ 0 χ ( 1 ) w 0 2 E ,
where δ is the damping factor, w 0 denotes the resonant frequency, and χ ( 1 ) represents the linear susceptibility of a material. The solution in the Fourier domain is given by,
P ˜ ( ω ) = ϵ 0 ω 0 2 ω 0 2 ω 2 + 2 i δ ω χ ¯ ( 1 ) E ˜ ( ω ) ,
where the polarization response depends on the carrier frequency w relative to the resonant frequency w 0 .

2.1. The Kerr Model

The Kerr effect results in a refractive index that depends on the light intensity, expressed as [13]:
n ( w ) = n 0 + n 2 I ( w ) .
Here, n denotes the refractive index, n 0 is the linear refractive index, I ( w ) denotes the light intensity at frequency w, and n 2 characterizes the nonlinear response of the material. The sign of n 2 indicates whether the Kerr nonlinearity of the material is positive or negative. This model assumes an instantaneous response with no frequency dependence [7].
The polarization function in the Kerr model is given by [28]:
P = ϵ 0 ( n 0 2 1 ) E + 2 ϵ 0 n 0 n 2 I E .
Here, P denotes the polarization, E represents the electric field, and the intensity is defined as I = | E | 2 / ( 2 η ) , where η is the wave impedance of the material. The term ( n 2 I ( t ) ) 2 is neglected in the calculation of the relative permittivity, ϵ r = ( n 0 + n 2 I ) 2 . Hence, the polarization function can be written as:
P = ϵ 0 ( n 0 2 1 ) + ϵ 0 n 0 n 2 η E 3 .
The polarization update equation in the Kerr model can be derived as follows:
P n = ϵ 0 ( n 0 2 1 ) E n + ϵ 0 n 0 n 2 η ( E n ) 3 ,
where P n and E n denote the polarization and electric field at the n-th iteration in the FDTD numerical method.

2.2. The Duffing Model

The Duffing equation is obtained by adding nonlinear restoring forces to the Lorentz model, making it suitable for nonlinear dispersive materials. The polarization equation takes the form [28]
2 P 2 t + 2 δ P t + w 0 2 f ( P ) P = ϵ 0 χ 1 w 0 2 E .
In this equation, χ 1 is the linear susceptibility of a material, which is n 0 2 1 . Equation (12) can be discretized as follows:
P n + 1 2 P n + P n 1 Δ t 2 + 2 δ P n + 1 P n 1 2 Δ t + w 0 2 f ( P n ) P n = ϵ 0 Δ χ e w 0 2 E n .
Solving for P n + 1 , the corresponding polarization update equation is given by:
P n + 1 = Δ t 2 ϵ 0 Δ χ e w 0 2 E n 1 + δ Δ t ( w 0 2 Δ t 2 f ( P n ) 2 ) P n 1 + δ Δ t 1 δ Δ t 1 + δ Δ t P n 1 .
The Duffing model, which is generalized from the Lorentz equation, incorporates both nonlinear and dispersive effects. In this model, f ( P ) denotes the nonlinear restoring forces. When f ( P ) = 1 , the nonlinear dispersive effects are disregarded, reducing the Duffing model to the Lorentz linear model. Various forms of f ( P ) are used to account for different types of nonlinearity. One such form is the exponential form, expressed as [25]:
f ( P ) = e α P 2 .
Here, α is a crucial nonlinear coefficient that encompasses higher-order terms, and it is calculated as [25]
α = n 0 n 2 ϵ 0 2 χ 1 η .
If only the first two terms of the Taylor expansion of the exponential form are considered, then the polynomial form can be obtained [25] as below:
f ( P ) = 1 + α P 2 .
Another form, known as the rational form [26] is shown as follows:
f ( P ) = ( 1 + γ P 2 ) 3 / 2 ,
where γ is the corresponding nonlinearity coefficient and γ = 2 3 α [25].

2.3. The Nonlinear Lorentz Model

Nonlinear contributions to the polarization density are intuitively introduced by adding the nonlinear source terms [18]:
2 P 2 t + 2 δ P t + w 0 2 P = ϵ 0 w 0 2 ( χ ( 1 ) E + χ ( 2 ) E 2 + χ ( 3 ) E 3 + ) .
To differentiate from the strong-field nonlinear Lorentz model, Equation (19) is referred to as the original nonlinear Lorentz model (ONL) in this paper. For centrosymmetric materials, χ ( 2 ) = 0 , the polarization equations of the strong-field nonlinear Lorentz (SNL) model in the under-resonant limit ( w w 0 ) are introduced in [17]. For the case of negative Kerr, the polarization equation is:
2 P 2 t + 2 δ P t + w 0 2 P = w 0 2 ϵ 0 χ ( 1 ) ( 1 1 + χ ( 3 ) E 2 / χ ( 1 ) ) E .
For positive Kerr, the strong-field nonlinear Lorentz model (SNL) is:
2 P 2 t + 2 δ P t + w 0 2 P = w 0 2 ϵ 0 χ ( 1 ) ( 2 1 1 + χ ( 3 ) E 2 / χ ( 1 ) ) E .
Discretizing Equation (21), the following equation is obtained:
P n + 1 2 P n + P n 1 Δ t 2 + 2 δ P n + 1 P n 1 2 Δ t + w 0 2 P n = w 0 2 ϵ 0 χ ( 1 ) ( 2 1 1 + χ ( 3 ) E n 2 / χ ( 1 ) ) E n .
Solving for P n + 1 , the update equation for polarization P can be obtained as follows:
P n + 1 = Δ t 2 w 0 2 ϵ 0 ( 2 χ ( 3 ) E n 2 + χ ( 1 ) ) E n ( 1 + δ Δ t ) ( 1 + χ ( 3 ) E n 2 / χ ( 1 ) ) + ( 2 w 0 2 Δ t 2 ) P n 1 + δ Δ t 1 δ Δ t 1 + δ Δ t P n 1 .
Similarly, the update equation for negative Kerr can be obtained by solving Equation (20):
P n + 1 = Δ t 2 w 0 2 ϵ 0 χ ( 1 ) E n ( 1 + δ Δ t ) ( 1 + χ ( 3 ) E 2 / χ ( 1 ) ) + ( 2 w 0 2 Δ t 2 ) P n 1 + δ Δ t 1 δ Δ t 1 + δ Δ t P n 1 .

2.4. Modified Nonlinear Lorentz Model

In the nonlinear Lorentz Model, if we only consider the linear and third-order nonlinearities, then Equation (19) becomes:
2 P 2 t + 2 δ P t + w 0 2 P = w 0 2 ϵ 0 ( χ ( 1 ) E + χ ( 3 ) E 3 ) .
Dividing w 0 2 on both sides of Equation (25), the following equation is obtained:
1 w 0 2 2 P 2 t + 2 δ w 0 2 P t + P = ϵ 0 ( χ ( 1 ) E + χ ( 3 ) E 3 ) .
Here, we assume w 0 , then Equation (26) is equivalent to:
P = ϵ 0 ( χ ( 1 ) E + χ ( 3 ) E 3 ) .
The following equation is obtained:
1 ( 1 + χ ( 3 ) / χ ( 1 ) E 2 ) P = ϵ 0 χ ( 1 ) E .
Here, we assume χ ( 3 ) > 0 . In the Duffing model, the nonlinearity is introduced by adding a nonlinear restoring force, which is f ( P ) in Equation (12), and has various forms. Here, we consider f ( P ) = 1 1 + χ ( 3 ) / χ ( 1 ) E 2 in the Duffing model to obtain:
2 P 2 t + 2 δ P t + w 0 2 ( 1 + χ ( 3 ) / χ ( 1 ) E 2 ) P = ϵ 0 χ ( 1 ) w 0 2 E .
Equation (29) is referred to as the modified nonlinear Lorentz (MNL) model. The discretization of Equation (29) leads to the updated equation for the third-order nonlinearity of the MNL model:
P n + 1 = Δ t 2 ϵ 0 χ ( 1 ) w 0 2 E n 1 + δ Δ t ( w 0 2 Δ t 2 2 ( 1 + χ ( 3 ) / χ ( 1 ) E n 2 ) ) P n ( 1 + δ Δ t ) ( ( 1 + χ ( 3 ) / χ ( 1 ) E n 2 ) ) 1 δ Δ t 1 + δ Δ t P n 1 .

3. Results

This study does not include Raman nonlinearity, meaning only instantaneous nonlinear effects are considered. The Kerr model serves as a reference for comparison. In this study, we use the simulation parameters χ ( 1 ) = 5 × 10 4 and χ ( 3 ) = 1.6 × 10 25 m 2 / V 2 , with a damping coefficient of δ = 0 . The simulation space domain is 100 μ m with a spatial discretization of 5 nm . The standard finite-difference time-domain (FDTD) method is employed with a time step of Δ t = 10 × 10 18 s . The simulation runs from 0 to 0.4 ps . A Gaussian-modulated sinusoidal light source is used, defined as
E ( t ) = E 0 sin ( ω t ) exp ( t t 0 ) 2 t w 2 ,
where E 0 = 2 I 0 c 0 ε 0 n 0 is the initial electric field amplitude, I 0 is the light intensity, c 0 is the speed of light in vacuum, ω is the angular frequency of the wave, t 0 is the central time of the pulse, and t w determines the temporal width of the Gaussian envelope. Since the differences among various Duffing models are minimal in this case, we focus on the exponential form of the Duffing model, corresponding to Equation (15).

3.1. Comparison Under Different Light Intensities

To investigate third-order nonlinearity under varying light intensities, we present the results in Figure 1. The simulation uses a wavelength of λ = 800 nm . The inset image in Figure 1 is a magnified view of the area indicated by the red line. Figure 1a shows that at very low intensity, third-order nonlinearity is negligible. The inset in Figure 1a confirms that all models exhibit nearly identical linear behavior. Figure 1d reveals that at higher intensities, the third-order nonlinearity of the MNL model is closer to that of the Kerr model, even at the fifth and seventh harmonic order. Comparing all subfigures in Figure 1, it is evident that as light intensity increases, third-order nonlinear effects become more pronounced.

3.2. Comparison Under Different Ratios Between Wave Frequency and Resonant Frequency

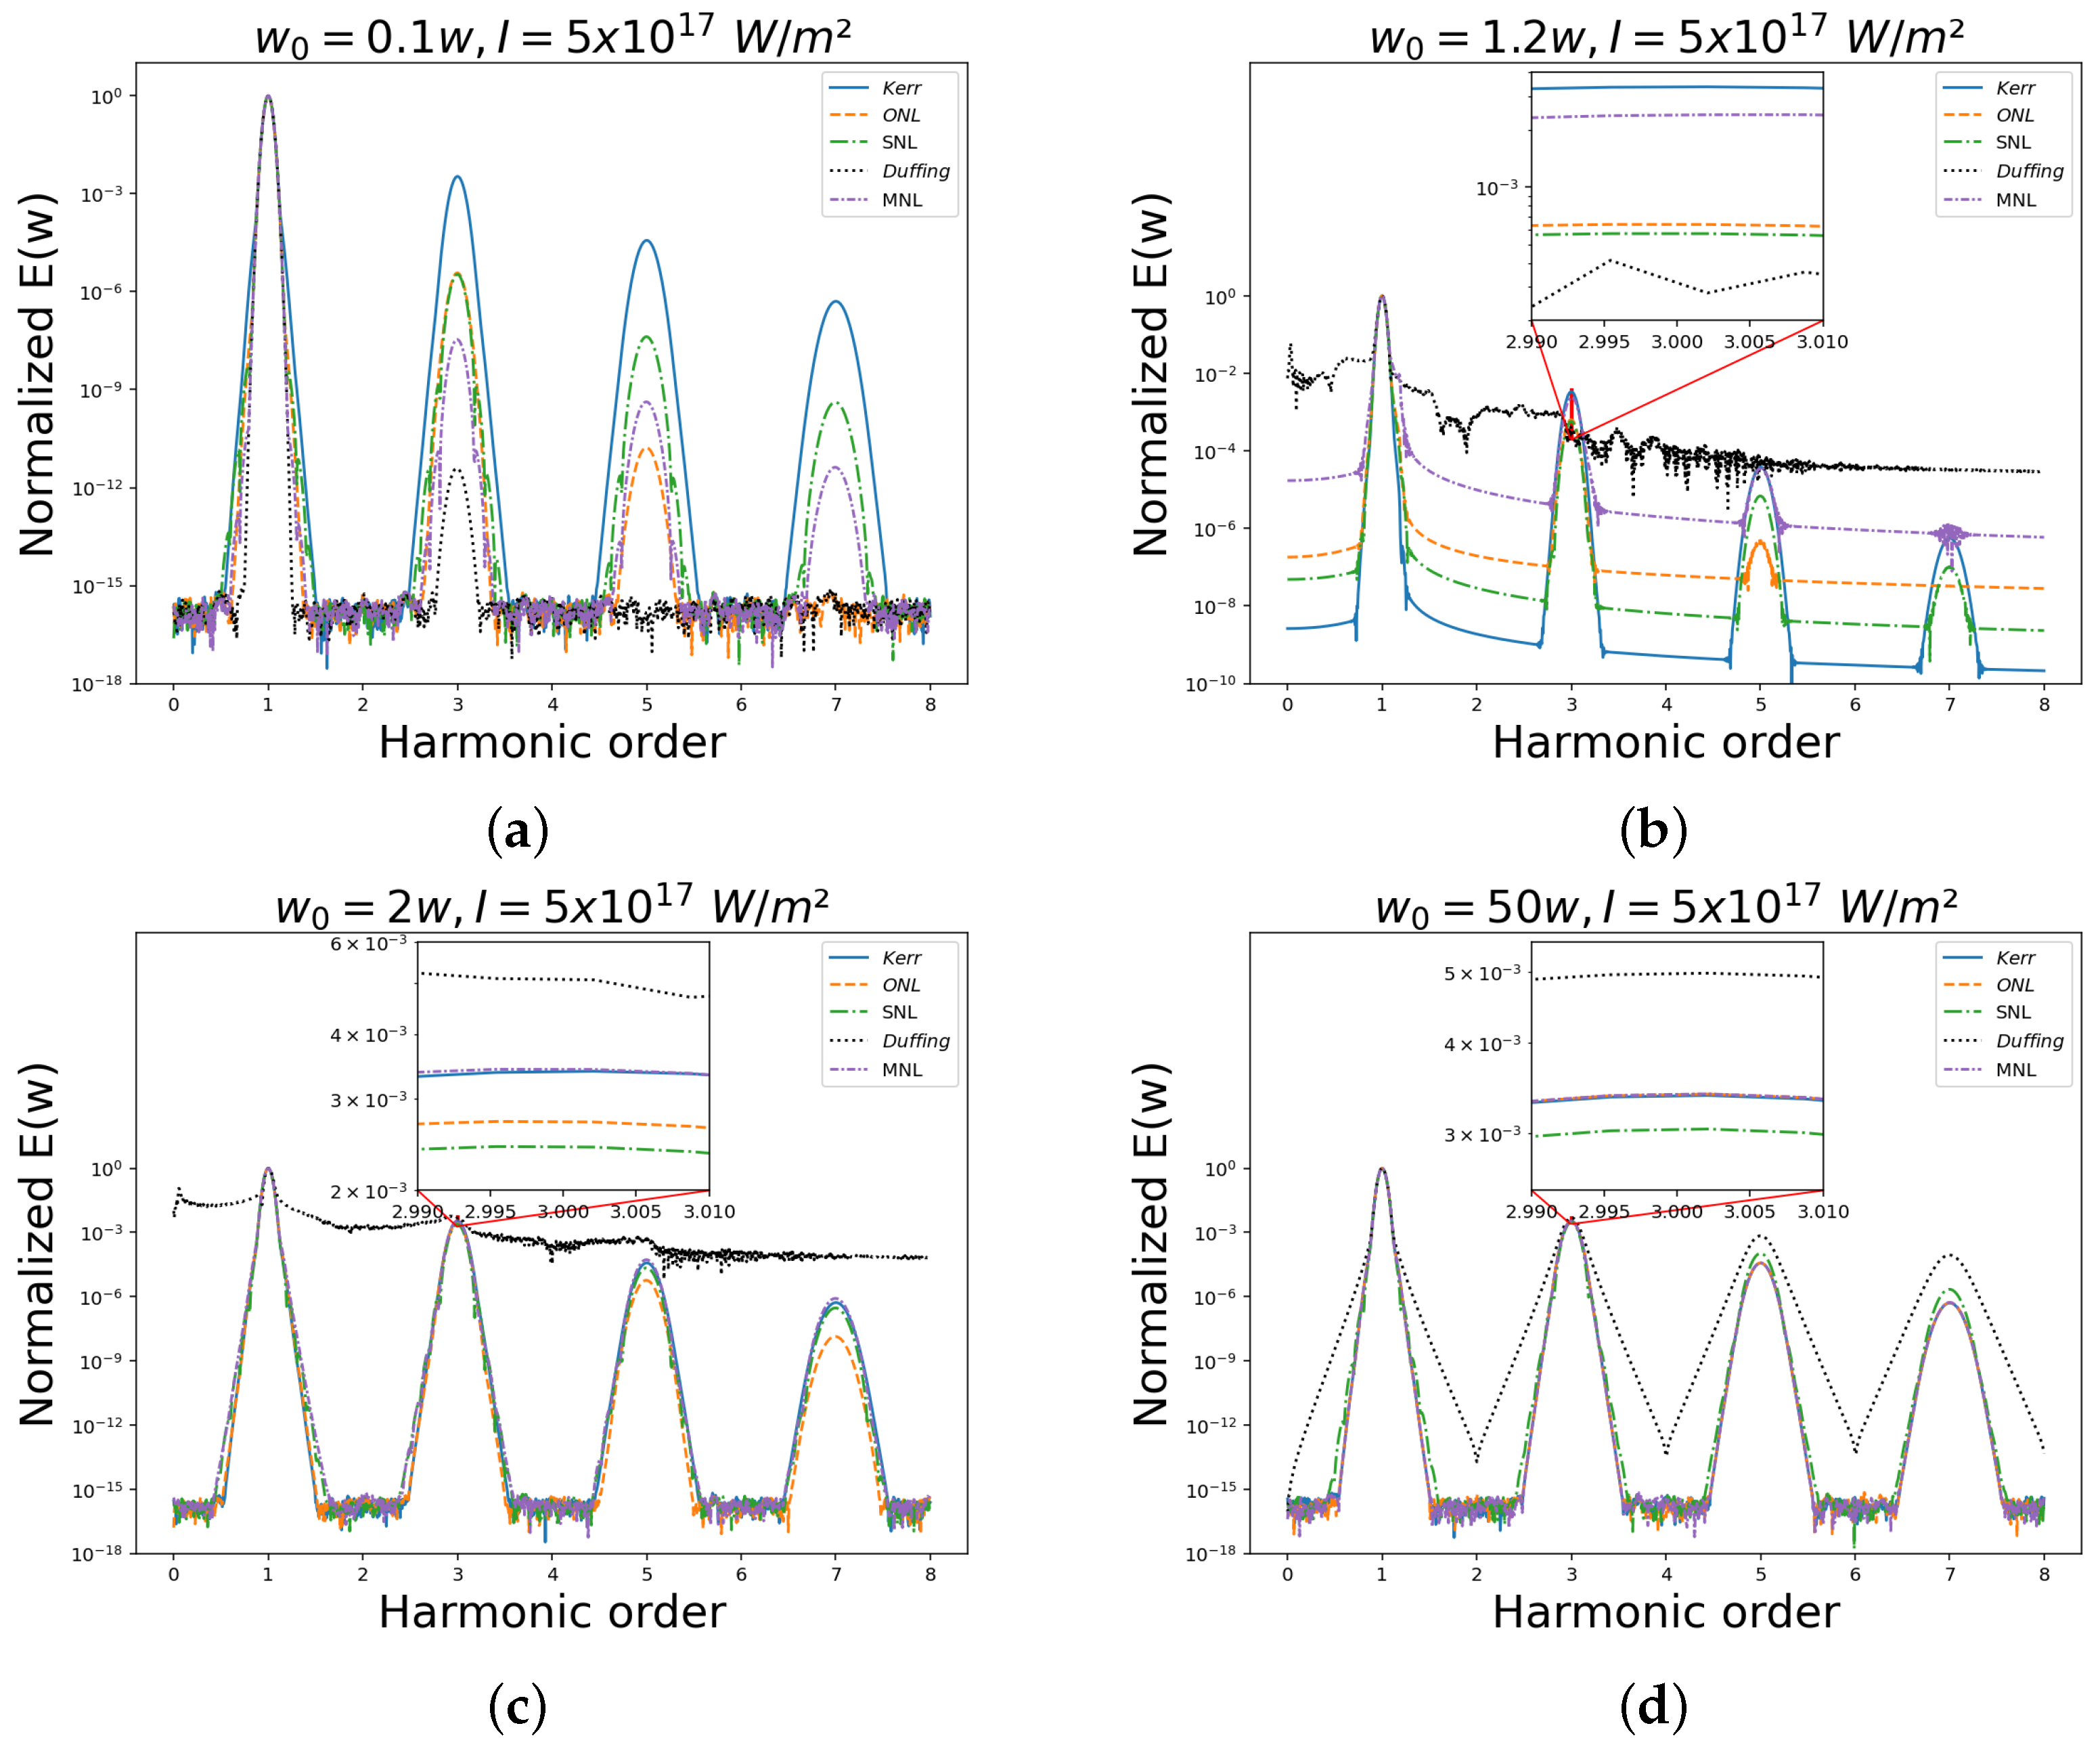
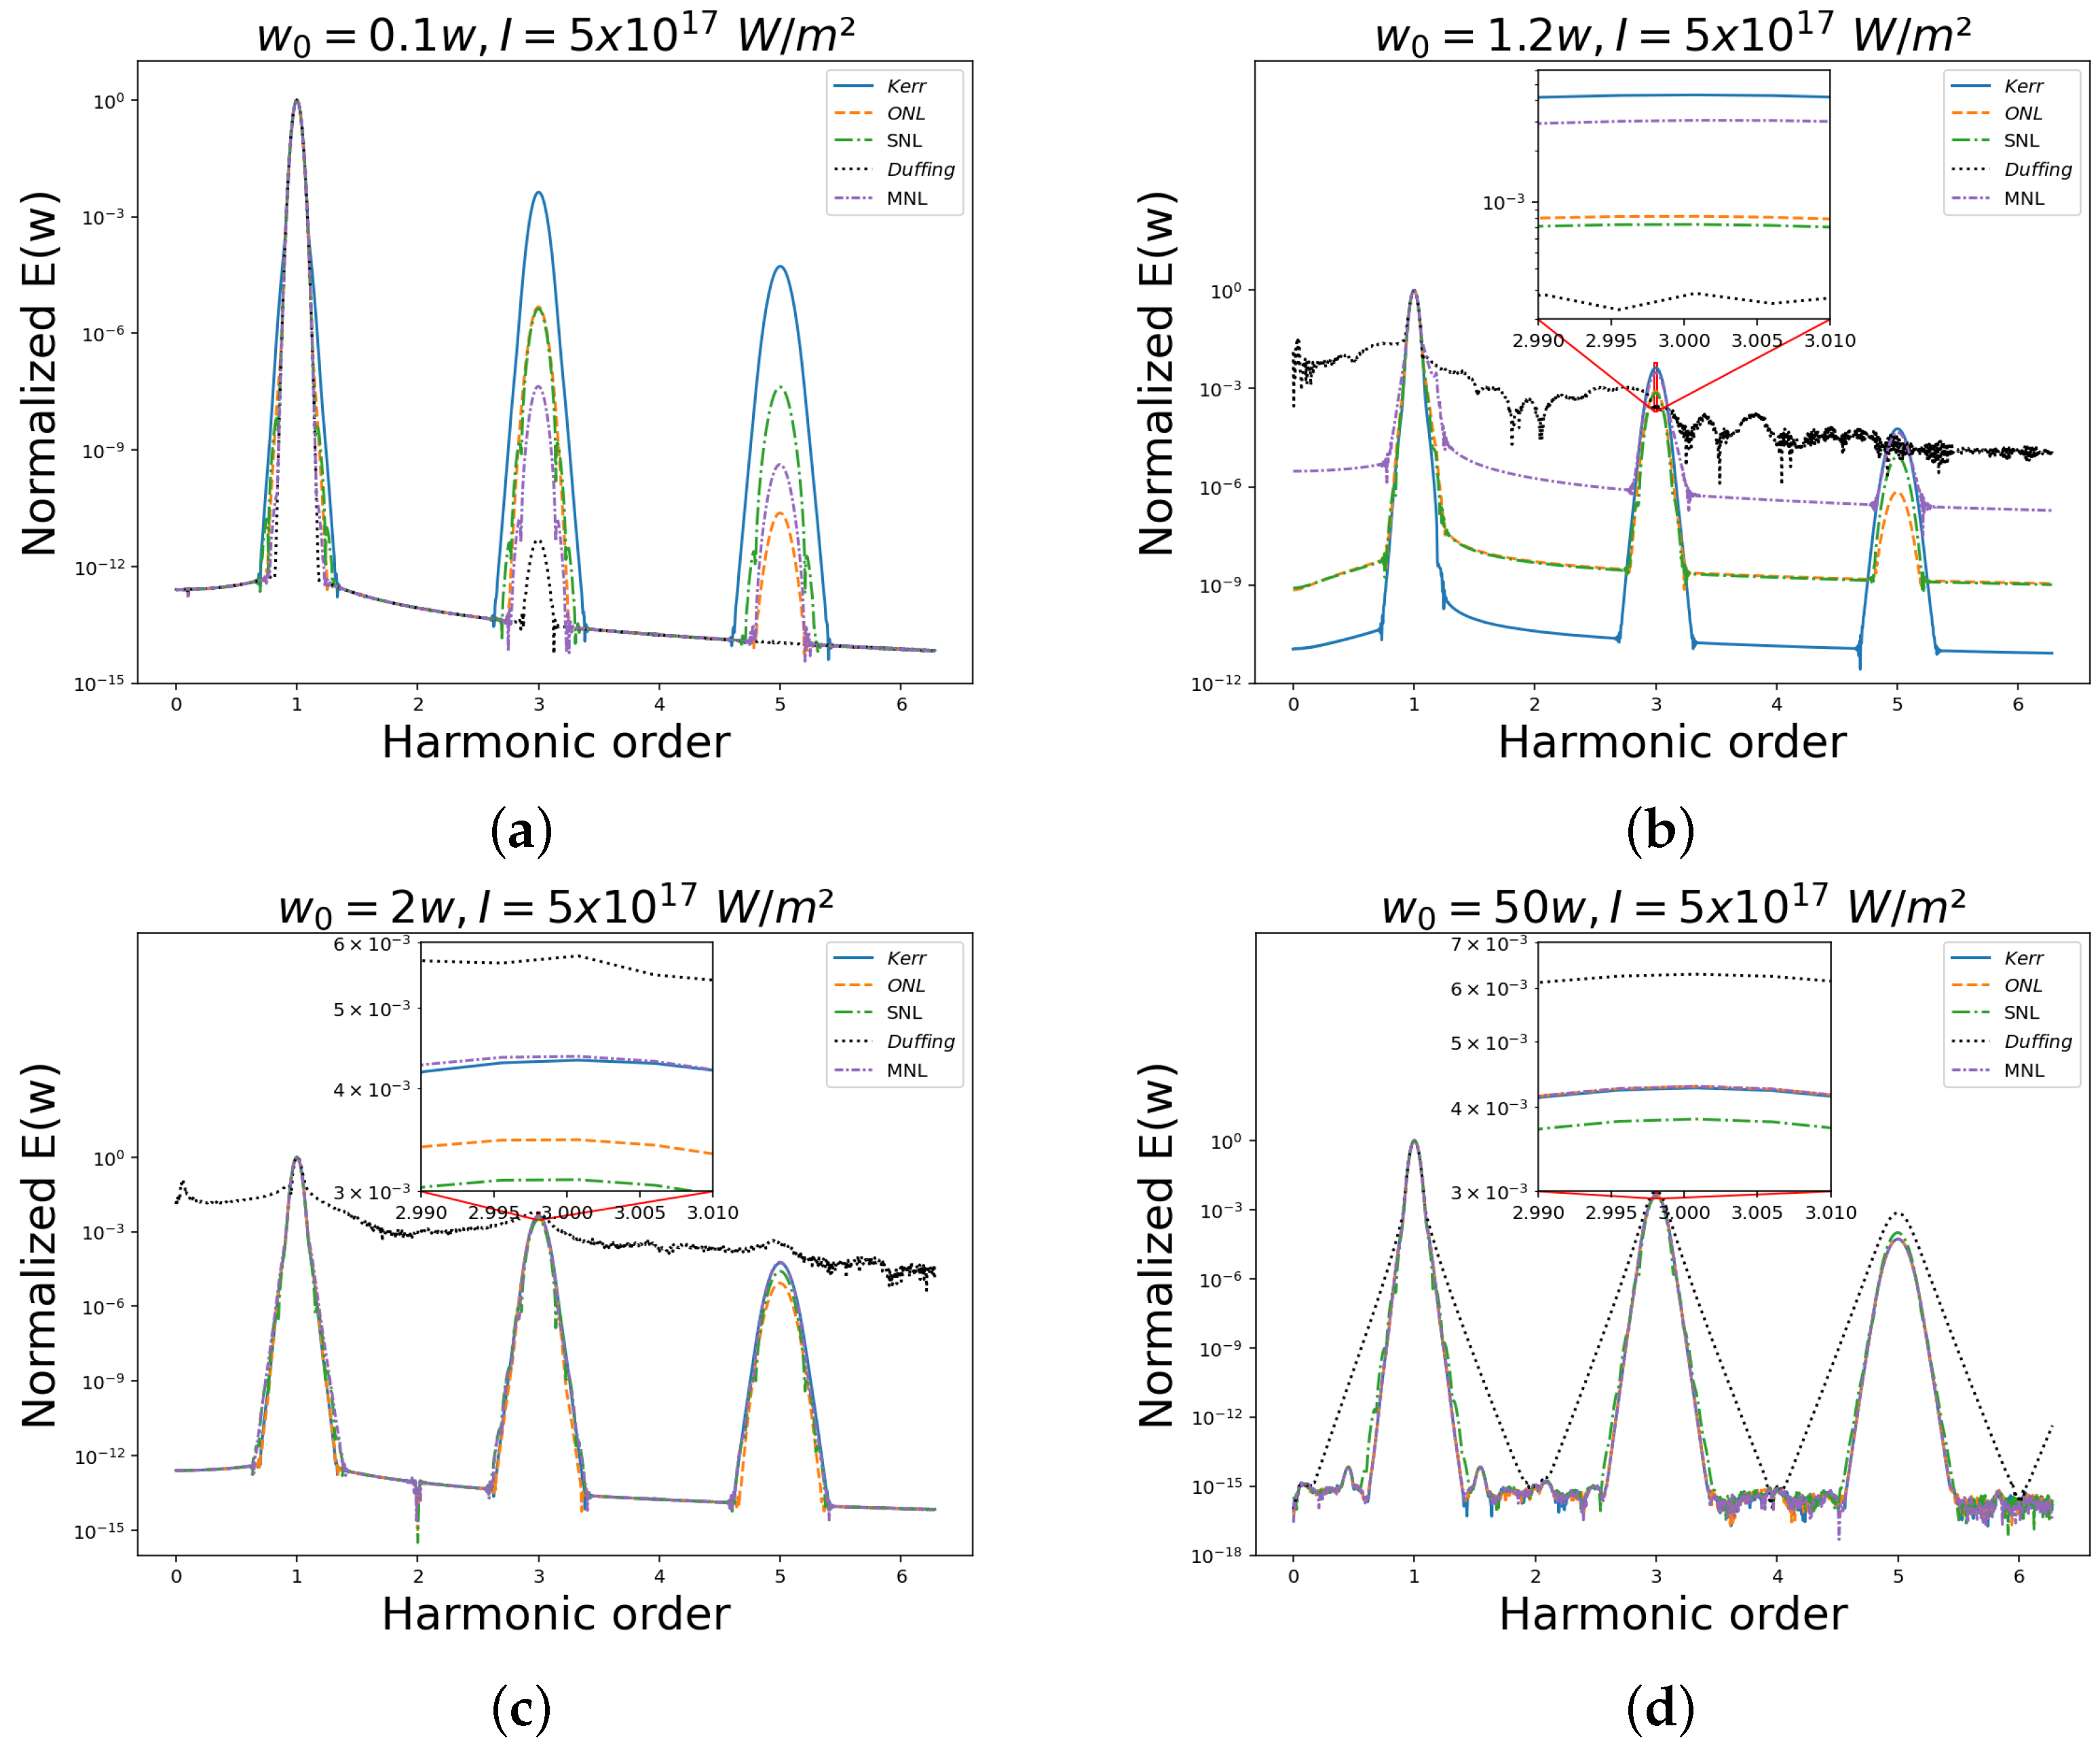
To examine third-order nonlinearity across different values of the ratio of wave frequency ω to resonant frequency ω 0 , we present Figure 2, Figure 3, Figure 4 and Figure 5. Figure 2 shows results for λ = 800 nm and I = 5 × 10 11 W / m 2 . In Figure 2a, when ω 0 / ω = 0.1 , third-order nonlinearity is significantly lower in all models compared to the Kerr model. The MNL model is closer to the Kerr model than the Duffing model, while the SNL and ONL models are even more aligned with the Kerr model. Figure 2b,c show that when ω 0 / ω = 1.2 and ω 0 / ω = 2 , the third-order nonlinearity of the MNL model closely follows the Kerr model. Figure 2d demonstrates that when ω 0 / ω = 50 , all models exhibit third-order nonlinearities closely matching the Kerr model.
Figure 3 maintains λ = 800 nm but increases the light intensity to I = 5 × 10 17 W / m 2 . Comparing Figure 3a and Figure 2a, we can see that at high intensity, third-order nonlinearity in all models remains much weaker than in the Kerr model. However, the third-order nonlinearity of the Duffing model becomes observable when ω 0 / ω = 0.1 . Comparing Figure 2b,c and Figure 3b,c, we observe that the MNL model consistently approximates the Kerr model as intensity changes. Notably, the Duffing model introduces excessive noise when ω 0 is close to ω . Figure 3d confirms that at ω 0 / ω = 50 , all models closely align with the Kerr model, regardless of intensity.
In Figure 4, the wavelength is changed to λ = 628 nm , while the light intensity remains I = 5 × 10 11 W / m 2 , as in Figure 1. The results in Figure 4 confirm that the trends observed in Figure 1 hold across different wavelengths. Specifically, the MNL model continues to get closer to the Kerr model when ω 0 / ω = 1.2 and ω 0 / ω = 2 .
In Figure 5, λ = 628 nm and I = 5 × 10 17 W / m 2 . Comparing Figure 2, Figure 3, Figure 4 and Figure 5, we observe that for ω 0 / ω = 0.1 , all models exhibit obvious differences from the Kerr model, regardless of intensity or wavelength. In contrast, Figure 2d, Figure 3d, Figure 4d and Figure 5d show that the third-order nonlinearity is much closer to the Kerr model when ω 0 / ω = 50 for all models. Moreover, the subfigures (b) and (c) in Figure 2, Figure 3, Figure 4 and Figure 5 show that the MNL model remains closest to the Kerr model across different intensities and wavelengths when ω 0 / ω = 1.2 and ω 0 / ω = 2 .

3.3. Quantitative Comparison

The relative errors of the ONL, SNL, Duffing, and MNL models with respect to the Kerr model are evaluated across resonant-to-wave frequency ratios ( ω 0 / ω ) ranging from 0.1 to 50. The relative error, defined as:
ϵ model = E model E Kerr E Kerr ,
quantifies the relative difference between each model’s electric field strength ( E model ) and that of the Kerr model ( E Kerr ). Results are reported for two wavelengths ( λ = 800 nm and λ = 628 nm ) and two intensities ( I 0 = 5 × 10 11 W / m 2 and 5 × 10 17 W / m 2 ), as detailed in Table 1, Table 2, Table 3 and Table 4.
For Table 1 ( λ = 800 nm , I 0 = 5 × 10 11 W / m 2 ), at low ratios ( ω 0 / ω 0.8 ), all models, including ONL, SNL, Duffing, and MNL, exhibit relatively large errors compared to the Kerr model, indicating significant deviations at lower frequency ratios. In the moderate range ( 1 < ω 0 / ω 2.0 ), the errors of ONL and SNL gradually decrease to 0.2014, while MNL achieves a notably smaller error of 0.0658 at ω 0 / ω = 2.0 . This represents a 13.56% reduction in error compared to ONL and SNL and an 83.16% improvement over the Duffing model, highlighting MNL’s closer alignment with the Kerr model in this range. As ω 0 / ω increases further ( 2 < ω 0 / ω < 50 ), the relative errors of all models continue to decrease, converging toward the Kerr model. For example, at ω 0 / ω = 50 , the relative errors of ONL and SNL drop to 0.0036, while Duffing and MNL exhibit slightly larger errors of 0.0048 and 0.0040, respectively. This trend demonstrates that at high-frequency ratios, all models become more accurate.
For Table 2 ( λ = 800 nm ), the intensity is significantly higher at I 0 = 5 × 10 17 W / m 2 . At low ratios ( ω 0 / ω 0.8 ), the ONL and SNL models yield errors approximately 0.1% smaller than those of the Duffing and MNL models. However, all models continue to exhibit large errors, indicating significant deviations from the Kerr model. In the range 1 < ω 0 / ω 2.0 , the relative errors of all models drop significantly, with the MNL model showing the smallest error. For example, at ω 0 / ω = 2.0 , the relative error of ONL decreases to 0.2013, and SNL to 0.2854, while Duffing fluctuates between 0.9186 and 0.4649. Meanwhile, MNL reaches 0.0082. This demonstrates that the relative error of MNL is 45.67% smaller than that of Duffing, 19.27% smaller than ONL, and 27.72% smaller than SNL. At high ω 0 / ω , the relative errors of ONL fall to 0.0044, SNL decreases to 0.101, Duffing reduces to 0.4745, and MNL drops to 0.0050, demonstrating convergence under higher intensities.
Table 3 uses a different wavelength ( λ = 628 nm ) while keeping the intensity the same as in Table 1. The results are similar to those in Table 1, despite the change in wavelength. At low ratios ( ω 0 / ω 0.8 ), all models again exhibit large relative errors. In the moderate range ( 1 < ω 0 / ω 2.0 ), the MNL model consistently achieves the lowest relative error, particularly at ω 0 / ω = 2.0 , showing approximately a 13% improvement over ONL/SNL and an 86% improvement over Duffing. At higher frequency ratios, all models continue to show decreasing errors and convergence toward the Kerr model.
In Table 4, where the intensity remains high at I 0 = 5 × 10 17 W / m 2 , but with λ = 628 nm , the overall trends follow those of Table 2, though with slightly different magnitudes. At low ratios ( ω 0 / ω 0.8 ), all models again exhibit large relative errors. In the moderate range ( 1 < ω 0 / ω 2.0 ), the MNL model demonstrates a smaller absolute difference from the Kerr model. Particularly at ω 0 / ω = 2.0 , the relative error of MNL is about 19% lower than ONL/SNL and 28% lower than Duffing, suggesting that wavelength variations have minimal impact compared to MNL’s advantage. At higher frequency ratios, all models continue to show decreasing errors and convergence towards Kerr.
Across all conditions, MNL exhibits smaller errors in the range 1 < ω 0 / ω 2.0 , particularly at ω 0 / ω = 2.0 , compared to ONL, SNL, and Duffing. Building on MNL’s performance at ω 0 / ω = 2.0 across varying frequencies and intensities in Table 1, Table 2, Table 3 and Table 4, further analysis at this fixed ratio across a broader intensity range is presented in Table 5 and Table 6. Since the third-order nonlinearity of all models is very weak when the intensity I 5 × 10 8 W / m 2 , the light intensities in Table 5 and Table 6 start at 5 × 10 8 W / m 2 and end at 1 × 10 18 W / m 2 , as the Duffing model appears unstable when I > 1 × 10 18 W / m 2 .
In Table 5 ( λ = 800 nm , ω 0 / ω = 2 ), errors remain stable, especially at lower intensities. At I 0 = 5 × 10 8 W / m 2 , the relative error of MNL is about 13% lower than ONL and SNL and 83% lower than Duffing. This trend holds from 5 × 10 9 W / m 2 to 5 × 10 16 W / m 2 , with MNL maintaining similar improvements. At 5 × 10 17 W / m 2 , the relative error of MNL ( ϵ MNL ) drops to 0.0082, a 19% improvement over ONL, 27% over SNL, and 45% over Duffing. At 1 × 10 18 W / m 2 , MNL still shows a 15% improvement over ONL, 30% over SNL, and 60% over Duffing, demonstrating robustness across intensities.
Table 6 ( λ = 628 nm ) exhibits a similar trend to Table 5. The relative error of MNL remains approximately 13% lower than ONL and SNL and 83% lower than Duffing. This pattern holds over the range 5 × 10 9 W / m 2 to 5 × 10 16 W / m 2 . At 5 × 10 17 W / m 2 , ϵ MNL drops to 0.0108, improving 19% over ONL, 27% over SNL, and 45% over Duffing. At 1 × 10 18 W / m 2 , MNL continues to outperform ONL, SNL, and Duffing, confirming its stability across different intensities and wavelengths.

4. Conclusions

In conclusion, the third-order nonlinearity under different light intensities and various ratios of resonant frequency to wave frequency across different models has been compared in this study. Our examples show that the MNL model’s third-order nonlinearity is closer to the Kerr model than other models at higher laser intensities, even at the fifth and seventh orders. Furthermore, this study reveals that at low ratios ( ω 0 / ω 0.8 ), all models, including ONL, SNL, Duffing, and MNL, exhibit relatively large errors compared to the Kerr model. In the moderate range ( 1 < ω 0 / ω 2.0 ), the MNL model is closer to the Kerr model than other models. Particularly at ω 0 / ω = 2.0 , the MNL model’s relative error ( ϵ MNL ) is lower than that of the ONL, SNL, and Duffing models by a factor greater than four across different intensities and wavelengths. At higher ratios ( ω 0 / ω > 5), all models show a decreasing error trend and convergence to the Kerr model. The proposed model can be adopted into existing FDTD software packages, such as the open-source software MEEP [34]. In the future, we plan to extend our proposed model to two-dimensional (2D) and three-dimensional (3D) scenarios. Moreover, we are interested in exploring the numerical energy stability of the nonlinear Lorentz models.

Author Contributions

Methodology, Y.X. and J.L.; Writing—original draft, Y.X.; Writing—review & editing, Y.X. and J.L. All authors have read and agreed to the published version of the manuscript.

Funding

This research received no external funding.

Data Availability Statement

The original contributions presented in this study are included in the article. Further inquiries can be directed to the corresponding author.

Conflicts of Interest

The authors declare no conflicts of interest.

References

  1. Zhou, Q.; Huang, Z.; Sun, Y.; Triki, H.; Liu, W.; Biswas, A. Collision dynamics of three-solitons in an optical communication system with third-order dispersion and nonlinearity. Nonlinear Dyn. 2023, 111, 5757–5765. [Google Scholar] [CrossRef]
  2. Agrawal, G.P. Nonlinear fiber optics. In Nonlinear Science at the Dawn of the 21st Century; Springer: Berlin/Heidelberg, Germany, 2000; pp. 195–211. [Google Scholar]
  3. Zhou, Y.; Lin, X.; Xu, Z.; Lu, Z.; Huang, Y.; Luo, Z.; Chi, N. Beyond 600Gbps Optical Interconnect Utilizing Wavelength Division Multiplexed Visible Light Laser Communication. Chin. Opt. Lett. 2025, 23. [Google Scholar]
  4. Ma, P.; Yao, T.; Liu, W.; Pan, Z.; Chen, Y.; Yang, H.; Chen, Z.; Wang, Z.; Zhou, P.; Chen, J. A 7-kW narrow-linewidth fiber amplifier assisted by optimizing the refractive index of the large-mode-area active fiber. High Power Laser Sci. Eng. 2024, 12, e67. [Google Scholar] [CrossRef]
  5. Xu, Z.; Lin, X.; Luo, Z.; Lin, Q.; Zhang, J.; Wang, G.; Wang, X.; Jiang, F.; Li, Z.; Shi, J.; et al. Flexible 2 × 2 multiple access visible light communication system based on an integrated parallel GaN/InGaN micro-photodetector array module. Photonics Res. 2024, 12, 793–803. [Google Scholar] [CrossRef]
  6. Dudley, J.M.; Genty, G.; Coen, S. Supercontinuum generation in photonic crystal fiber. Rev. Mod. Phys. 2006, 78, 1135–1184. [Google Scholar] [CrossRef]
  7. Boyd, R.W.; Gaeta, A.L.; Giese, E. Nonlinear optics. In Springer Handbook of Atomic, Molecular, and Optical Physics; Springer: Berlin/Heidelberg, Germany, 2008; pp. 1097–1110. [Google Scholar]
  8. Stegeman, G.I.; Stegeman, R.A. Nonlinear Optics: Phenomena, Materials and Devices; John Wiley & Sons: Hoboken, NJ, USA, 2012; Volume 78. [Google Scholar]
  9. Goorjian, P.M.; Taflove, A.; Joseph, R.M.; Hagness, S.C. Computational modeling of femtosecond optical solitons from Maxwell’s equations. IEEE J. Quantum Electron. 1992, 28, 2416–2422. [Google Scholar] [CrossRef]
  10. Fujii, M.; Tahara, M.; Sakagami, I.; Freude, W.; Russer, P. High-order FDTD and auxiliary differential equation formulation of optical pulse propagation in 2-D Kerr and Raman nonlinear dispersive media. IEEE J. Quantum Electron. 2004, 40, 175–182. [Google Scholar] [CrossRef]
  11. Li, C.; Miao, P. Single-frame statistical gating in a speckle pattern generated by the dynamic scattering in disordered medium. Appl. Phys. Lett. 2025, 126, 043701. [Google Scholar] [CrossRef]
  12. Yu, Y.; Chen, F.; Gu, Y.; Zhang, Y.; Cui, C.; Liu, J.; Qiu, Z.; Wang, P. Optimization of 3D reconstruction of granular systems based on refractive index matching scanning. Opt. Laser Technol. 2025, 186, 112662. [Google Scholar] [CrossRef]
  13. Brzozowski, L.; Sargent, E.H. Optical signal processing using nonlinear distributed feedback structures. IEEE J. Quantum Electron. 2000, 36, 550–555. [Google Scholar] [CrossRef]
  14. Maimistov, A.I.; Caputo, J.G. Propagation of extremely short pulses in nonresonant media: The total Maxwell–Duffing model. Phys. D Nonlinear Phenom. 2004, 189, 107–114. [Google Scholar] [CrossRef]
  15. Kazantseva, E.V.; Maimistov, A.I.; Caputo, J.G. Reduced Maxwell-Duffing description of extremely short pulses in nonresonant media. Phys. Rev. E—Stat. Nonlinear Soft Matter Phys. 2005, 71, 056622. [Google Scholar] [CrossRef] [PubMed]
  16. Scalora, M.; Vincenti, M.A.; de Ceglia, D.; Cojocaru, C.; Grande, M.; Haus, J. Nonlinear Duffing oscillator model for third harmonic generation. JOSA B 2015, 32, 2129–2138. [Google Scholar] [CrossRef]
  17. Varin, C.; Emms, R.; Bart, G.; Fennel, T.; Brabec, T. Explicit formulation of second and third order optical nonlinearity in the FDTD framework. Comput. Phys. Commun. 2018, 222, 70–83. [Google Scholar] [CrossRef]
  18. Varin, C.; Bart, G.; Fennel, T.; Brabec, T. Nonlinear Lorentz model for the description of nonlinear optical dispersion in nanophotonics simulations. Opt. Mater. Express 2019, 9, 771–778. [Google Scholar] [CrossRef]
  19. Varin, C.; Bart, G.; Emms, R.; Brabec, T. Saturable Lorentz model for fully explicit three-dimensional modeling of nonlinear optics. Opt. Express 2015, 23, 2686–2695. [Google Scholar] [CrossRef]
  20. Wang, Y.; Wang, Y.; Yu, A.; Hu, M.; Wang, Q.; Pang, C.; Xiong, H.; Cheng, Y.; Qi, J. Non-interleaved shared-aperture full-stokes metalens via prior-knowledge-driven inverse design. Adv. Mater. 2025, 37, 2408978. [Google Scholar] [CrossRef]
  21. Taflove, A.; Hagness, S.C.; Piket-May, M. Computational electromagnetics: The finite-difference time-domain method. Electr. Eng. Handb. 2005, 3, 15. [Google Scholar]
  22. Born, M.; Wolf, E. Principles of Optics: Electromagnetic Theory of Propagation, Interference and Diffraction of Light; Elsevier: Amsterdam, The Netherlands, 2013. [Google Scholar]
  23. Xie, G.; Hou, G.; Xu, K.; Niu, K.; Feng, N.; Li, Y.; Huang, Z.; Elsherbeni, A.Z. Extension of FLOD-FDTD method for multiterm modified Lorentz model. IEEE Trans. Antennas Propag. 2023, 71, 8830–8840. [Google Scholar] [CrossRef]
  24. Gordon, D.F.; Helle, M.H.; Peñano, J.R. Fully explicit nonlinear optics model in a particle-in-cell framework. J. Comput. Phys. 2013, 250, 388–402. [Google Scholar] [CrossRef]
  25. Janyani, V.; Vukovic, A.; Paul, J.D.; Sewell, P.; Benson, T.M. Time domain simulation in photonics: A comparison of nonlinear dispersive polarisation models. Opt. Quantum Electron. 2005, 37, 3–24. [Google Scholar] [CrossRef]
  26. Conti, C.; Di Falco, A.; Assanto, G. Optical parametric oscillations in isotropic photonic crystals. Opt. Express 2004, 12, 823–828. [Google Scholar] [CrossRef] [PubMed]
  27. Boyd, R.W. Nonlinear Optics, 3rd ed.; Academic Press, Inc.: Orlando, FL, USA, 2008. [Google Scholar]
  28. Shen, Y.R. Principles of Nonlinear Optics; Wiley-Interscience: New York, NY, USA, 1984. [Google Scholar]
  29. Deinega, A.; John, S. Effective optical response of silicon to sunlight in the finite-difference time-domain method. Opt. Lett. 2011, 37, 112–114. [Google Scholar] [CrossRef] [PubMed]
  30. Prokopidis, K.P.; Zografopoulos, D.C. An ADI-FDTD formulation with modified Lorentz dispersion for the study of plasmonic structures. IEEE Photonics Technol. Lett. 2014, 26, 2267–2270. [Google Scholar] [CrossRef]
  31. Choi, H.; Baek, J.W.; Jung, K.Y. Comprehensive study on numerical aspects of modified Lorentz model-based dispersive FDTD formulations. IEEE Trans. Antennas Propag. 2019, 67, 7643–7648. [Google Scholar] [CrossRef]
  32. Yee, K. Numerical solution of initial boundary value problems involving Maxwell’s equations in isotropic media. IEEE Trans. Antennas Propag. 1966, 14, 302–307. [Google Scholar]
  33. Jackson, J.D. Classical Electrodynamics; John Wiley & Sons: Hoboken, NJ, USA, 2021. [Google Scholar]
  34. Oskooi, A.F.; Roundy, D.; Ibanescu, M.; Bermel, P.; Joannopoulos, J.D.; Johnson, S.G. MEEP: A flexible free-software package for electromagnetic simulations by the FDTD method. Comput. Phys. Commun. 2010, 181, 687–702. [Google Scholar] [CrossRef]
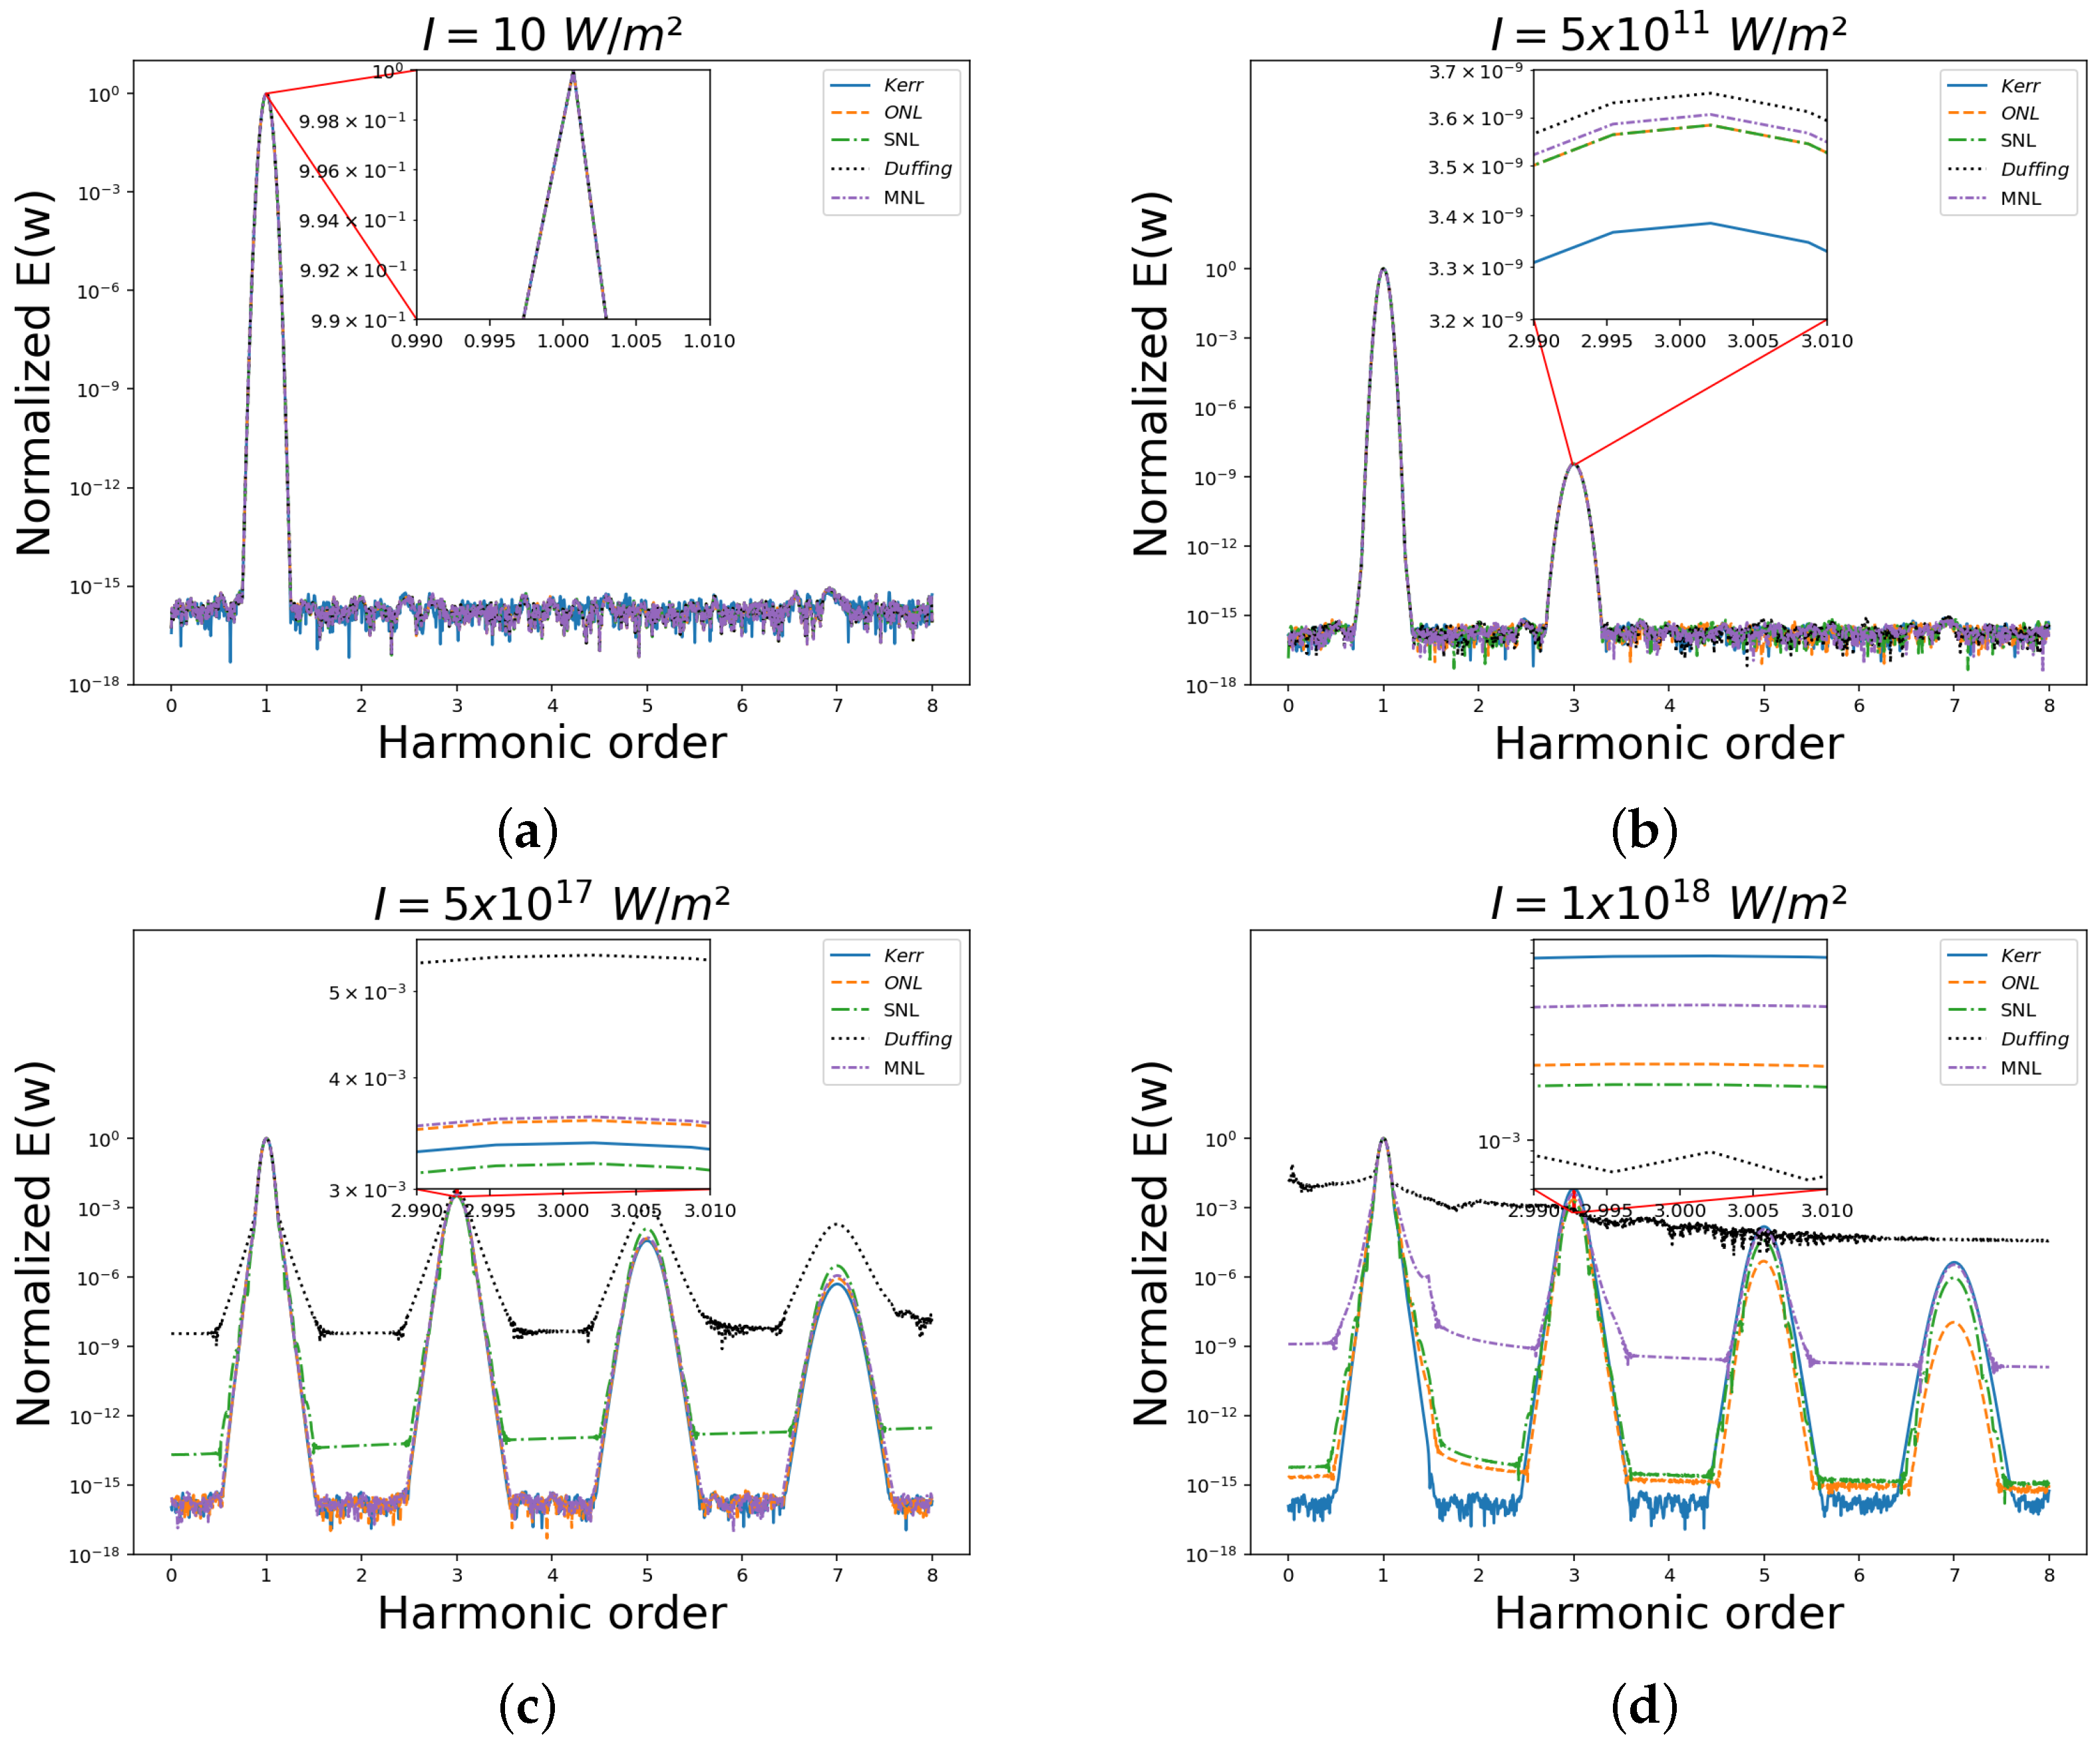
Figure 1. Comparison of nonlinearity among different models under varying light intensities with the parameters λ = 800 nm ,   χ 1 = 5 × 10 4 ,   χ ( 3 ) = 1.6 × 10 25 m 2 / V 2 ,   w 0 = 3 × 10 16 rad / s . The light intensities are (a) 10 W / m 2 , (b) 5 × 10 11 W / m 2 , (c) 5 × 10 17 W / m 2 , and (d) 1 × 10 18 W / m 2 .
Mathematics 13 01354 g001
Figure 2. Comparison of third-order nonlinearity under different ratios of w 0 / w , with parameters λ = 800 nm ,   I 0 = 5 × 10 11 W / m 2 . Specifically, (a) w 0 / w = 0.1 , (b) w 0 / w = 1.2 , (c) w 0 / w = 2 , and (d) w 0 / w = 50 .
Mathematics 13 01354 g002
Figure 3. Comparison of third-order nonlinearity under different ratios of w 0 / w , with parameters λ = 800 nm ,   I 0 = 5 × 10 17 W / m 2 . Specifically, (a) w 0 / w = 0.1 , (b) w 0 / w = 1.2 , (c) w 0 / w = 2 , and (d) w 0 / w = 50 .
Mathematics 13 01354 g003
Figure 4. Comparison of third-order nonlinearity under different ratios of w 0 / w , with parameters λ = 628 nm ,   I 0 = 5 × 10 11 W / m 2 . Specifically, (a) w 0 / w = 0.1 , (b) w 0 / w = 1.2 , (c) w 0 / w = 2 , and (d) w 0 / w = 50 .
Mathematics 13 01354 g004
Figure 5. Comparison of third-order nonlinearity under different ratios of w 0 / w , with parameters λ = 628 nm ,   I 0 = 5 × 10 17 W / m 2 . Specifically, (a) w 0 / w = 0.1 , (b) w 0 / w = 1.2 , (c) w 0 / w = 2 , and (d) w 0 / w = 50 .
Mathematics 13 01354 g005
Table 1. The relative error of different models compared to the Kerr model in third-order nonlinearity for various ratios of ω 0 / ω , with parameters λ = 800 nm and I 0 = 5 × 10 11 W / m 2 .
w 0 / w ϵ ONL = E ONL E Kerr E Kerr ϵ SNL = E SNL E Kerr E Kerr ϵ Duffing = E Duffing E Kerr E Kerr ϵ MNL = E MNL E Kerr E Kerr
0.10.99890.99891.00000.9999
0.20.99550.99551.00000.9998
0.30.98990.98990.99990.9990
0.40.98190.98190.99990.9966
0.50.97150.97150.99890.9905
0.60.95840.95840.99260.9765
0.70.94250.94250.94890.9444
0.80.92350.92350.56500.8622
1.20.81000.81005.89030.3667
1.30.76910.76912.44830.4299
1.40.72190.72191.39040.4296
1.50.66710.66710.95510.3989
1.60.60300.60300.76350.3471
1.70.52770.52770.69560.2765
1.80.43830.43830.70530.1865
1.90.33130.33130.77430.0741
2.00.20140.20140.89740.0658
4.01.28861.28861.77861.4415
5.00.56340.56340.76750.6286
6.00.33380.33380.45160.3720
7.00.22530.22530.30360.2508
8.00.16380.16380.22020.1823
9.00.12510.12510.16790.1392
10.00.09900.09900.13270.1101
15.00.04170.04170.05580.0464
20.00.02300.02300.03080.0256
50.00.00360.00360.00480.0040
Table 2. The relative error of different models compared to the Kerr model in third-order nonlinearity for various ratios of ω 0 / ω , with parameters λ = 800 nm and I 0 = 5 × 10 17 W / m 2 .
w 0 / w ϵ ONL = E ONL E Kerr E Kerr ϵ SNL = E SNL E Kerr E Kerr ϵ Duffing = E Duffing E Kerr E Kerr ϵ MNL = E MNL E Kerr E Kerr
0.10.99890.99901.00000.9999
0.20.99550.99601.00000.9998
0.30.98990.99100.99990.9991
0.40.98190.98380.99990.9970
0.50.97140.97440.99900.9917
0.60.95830.96270.99300.9797
0.70.94240.94850.95870.9532
0.80.92350.93160.79760.8897
1.20.81010.83000.91860.2869
1.30.76920.79350.86030.3997
1.40.72200.75120.78010.4191
1.50.66700.64450.73620.4001
1.60.60290.64470.62270.3576
1.70.52750.57730.41640.2962
1.80.43820.49730.23060.2164
1.90.33120.40160.06890.1162
2.00.20130.28540.46490.0082
4.01.28711.04675.86171.5992
5.00.56380.40111.91720.6737
6.00.33420.19431.39490.3963
7.00.22590.09711.09640.2664
8.00.16450.04210.92760.1933
9.00.12580.00750.80900.1476
10.00.09970.01590.73370.1167
15.00.04240.06720.57470.0495
20.00.02380.08390.52510.0276
50.00.00440.10130.47450.0050
Table 3. The relative error of different models compared to the Kerr model in third-order nonlinearity for various ratios of ω 0 / ω , with parameters λ = 628 nm and I 0 = 5 × 10 11 W / m 2 .
w 0 / w ϵ ONL = E ONL E Kerr E Kerr ϵ SNL = E SNL E Kerr E Kerr ϵ Duffing = E Duffing E Kerr E Kerr ϵ MNL = E MNL E Kerr E Kerr
0.10.99890.99891.00000.9999
0.20.99550.99551.00000.9998
0.30.98990.98990.99990.9990
0.40.98190.98190.99990.9965
0.50.97140.97140.99890.9905
0.60.95830.95830.99260.9765
0.70.94240.94240.94870.9444
0.80.92340.92340.56520.8626
1.20.80950.80955.79500.3704
1.30.76880.76882.42580.4312
1.40.72150.72151.38170.4301
1.50.66660.66660.95100.3989
1.60.60240.60240.76150.3468
1.70.52690.52690.69470.2760
1.80.43740.43740.70520.1856
1.90.33010.33010.77490.0729
2.00.19980.19980.89880.0674
4.01.28531.28531.77391.4377
5.00.56240.56240.76610.6275
6.00.33330.33330.45090.3714
7.00.22500.22500.30320.2505
8.00.16360.16360.21990.1821
9.00.12500.12500.16770.1391
10.00.09890.09890.13250.1100
15.00.04170.04170.05570.0463
20.00.02300.02300.03070.0256
50.00.00360.00360.00480.0040
Table 4. The relative error of different models compared to the Kerr model in third-order nonlinearity for various ratios of ω 0 / ω , with parameters λ = 628 nm and I 0 = 5 × 10 17 W / m 2 .
w 0 / w ϵ ONL = E ONL E Kerr E Kerr ϵ SNL = E SNL E Kerr E Kerr ϵ Duffing = E Duffing E Kerr E Kerr ϵ MNL = E MNL E Kerr E Kerr
0.10.99890.99901.00000.9999
0.20.99550.99601.00000.9998
0.30.98990.99090.99990.9991
0.40.98190.98380.99990.9969
0.50.97140.97440.99900.9916
0.60.95820.96260.99300.9797
0.70.94230.94840.95840.9532
0.80.92340.93150.79480.8895
1.20.80970.82970.93530.2939
1.30.76870.79300.85510.4012
1.40.72130.75060.76360.4191
1.50.66620.70130.66500.3995
1.60.60180.64370.61810.3566
1.70.52620.57610.52090.2949
1.80.43650.49590.25210.2147
1.90.32910.39980.05620.1140
2.00.19870.28310.29180.0108
4.01.28121.04175.45711.5870
5.00.56260.40001.84990.6718
6.00.33380.19441.47490.3953
7.00.22580.09741.08080.2660
8.00.16460.04250.91810.1933
9.00.12600.00790.80190.1476
10.00.10000.01540.72920.1169
15.00.04280.06660.57190.0498
20.00.02420.08330.52290.0280
50.00.00480.10070.47290.0054
Table 5. The relative error of different models compared to the Kerr model in third-order nonlinearity for various light intensities, with parameters λ = 800 nm and a fixed ratio of ω 0 = 2 ω .
I 0 (W/ m 2 ) ϵ ONL = E ONL E Kerr E Kerr ϵ SNL = E SNL E Kerr E Kerr ϵ Duffing = E Duffing E Kerr E Kerr ϵ MNL = E MNL E Kerr E Kerr
5 × 10 8 0.20130.20140.89760.0659
5 × 10 9 0.20140.20140.89740.0658
5 × 10 10 0.20140.20140.89740.0658
5 × 10 11 0.20140.20140.89740.0658
5 × 10 12 0.20140.20140.89740.0658
5 × 10 13 0.20140.20140.89750.0658
5 × 10 14 0.20140.20150.89780.0657
5 × 10 15 0.20140.20230.90120.0651
5 × 10 16 0.20140.21060.93730.0594
5 × 10 17 0.20130.28540.46490.0082
1 × 10 18 0.20120.35440.60510.0383
Table 6. The relative error of different models compared to the Kerr model in third-order nonlinearity for various light intensities, with parameters λ = 628 nm and a fixed ratio of ω 0 = 2 ω .
I 0 (W/ m 2 ) ϵ ONL = E ONL E Kerr E Kerr ϵ SNL = E SNL E Kerr E Kerr ϵ Duffing = E Duffing E Kerr E Kerr ϵ MNL = E MNL E Kerr E Kerr
5 × 10 8 0.18620.18620.92050.0830
5 × 10 9 0.19840.19840.90100.0690
5 × 10 10 0.19960.19960.89910.0676
5 × 10 11 0.19980.19980.89880.0674
5 × 10 12 0.19980.19980.89890.0674
5 × 10 13 0.19980.19980.89890.0674
5 × 10 14 0.19980.19990.89920.0674
5 × 10 15 0.19980.20070.90260.0668
5 × 10 16 0.19970.20890.93870.0612
5 × 10 17 0.19870.28310.29180.0108
1 × 10 18 0.19760.35170.66640.0349
Disclaimer/Publisher’s Note: The statements, opinions and data contained in all publications are solely those of the individual author(s) and contributor(s) and not of MDPI and/or the editor(s). MDPI and/or the editor(s) disclaim responsibility for any injury to people or property resulting from any ideas, methods, instructions or products referred to in the content.