
An Investigation of Subsidy Policies on Recycling and Remanufacturing System in Two-Echelon Supply Chain for Negative Binomial Distribution


Abstract
1. Introduction
2. Literature Review
3. Problem Description
- (1)
- What is the optimal production run time?
- (2)
- What is the optimal recycling subsidy per return?
- (3)
- How to reduce the production cost and optimize recovery rate?
4. Model Formulation
4.1. Notation
| set-up cost | |
| selling price per unit item | |
| number of required components for a green finished product | |
| production rate of semi-finished products in units per unit time, where and | |
| assembly rate of the green finished product in units per unit time | |
| production rate of the returned product | |
| return rate of reusable product | |
| coefficient of social cost of work stress | |
| purchasing cost of FSC material per unit | |
| holding cost of semi-finished products per unit time, where | |
| holding cost of green finished product per unit time | |
| defect rate of semi-finished products | |
| defect rate of green finished product | |
| time period prior to depletion of inventory of semi-finished products | |
| time period prior to depletion of inventory of green finished product | |
| production run time of green finished product | |
| length of cycle | |
| maximum inventory level of semi-finished products | |
| maximum inventory level of green finished product | |
| maximum inventory level of reusable product | |
| the production run time of semi-finished products (decision variables) | |
| unit recycling subsidy per return (decision variables) | |
| recovery rate of reusable product (decision variables) |
4.2. Assumptions
- To avoid the situation where one stage starves due to a lack of input from the previous stage, it is necessary that the minimum production rate in Stage 1, the assembly rate in Stage 2, and demand rate satisfy the following condition: .
- Process quality is assumed to be independent in the two stages, and the inspection time is so short that it can be disregarded. The rework time for defective items is also disregarded.
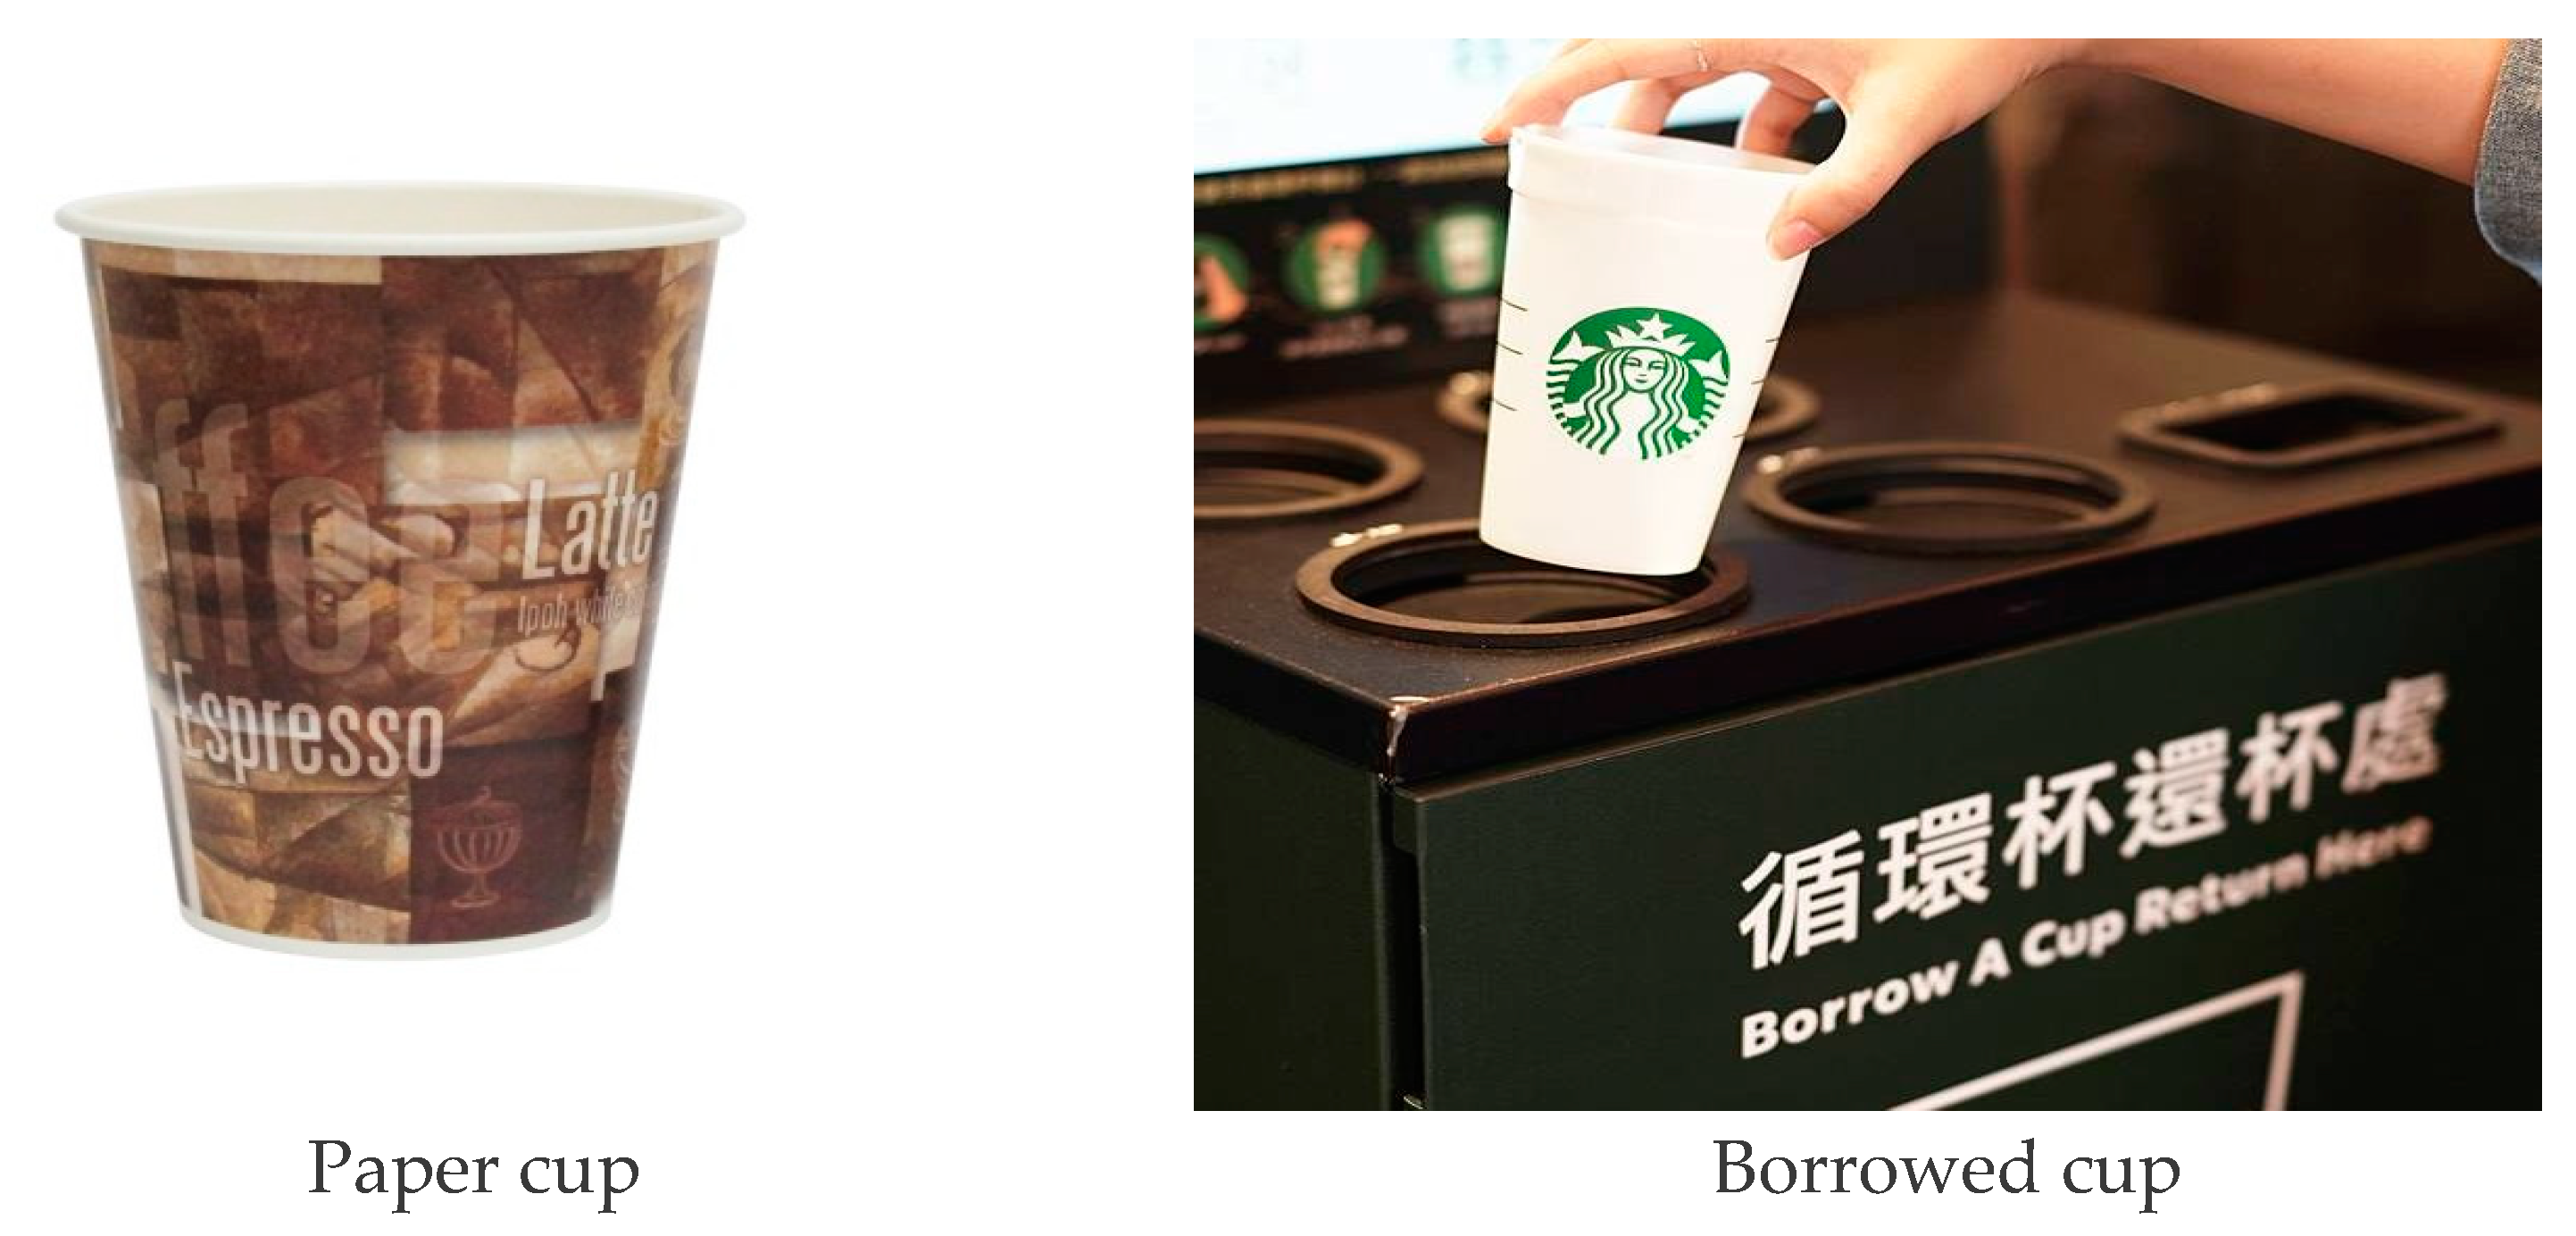
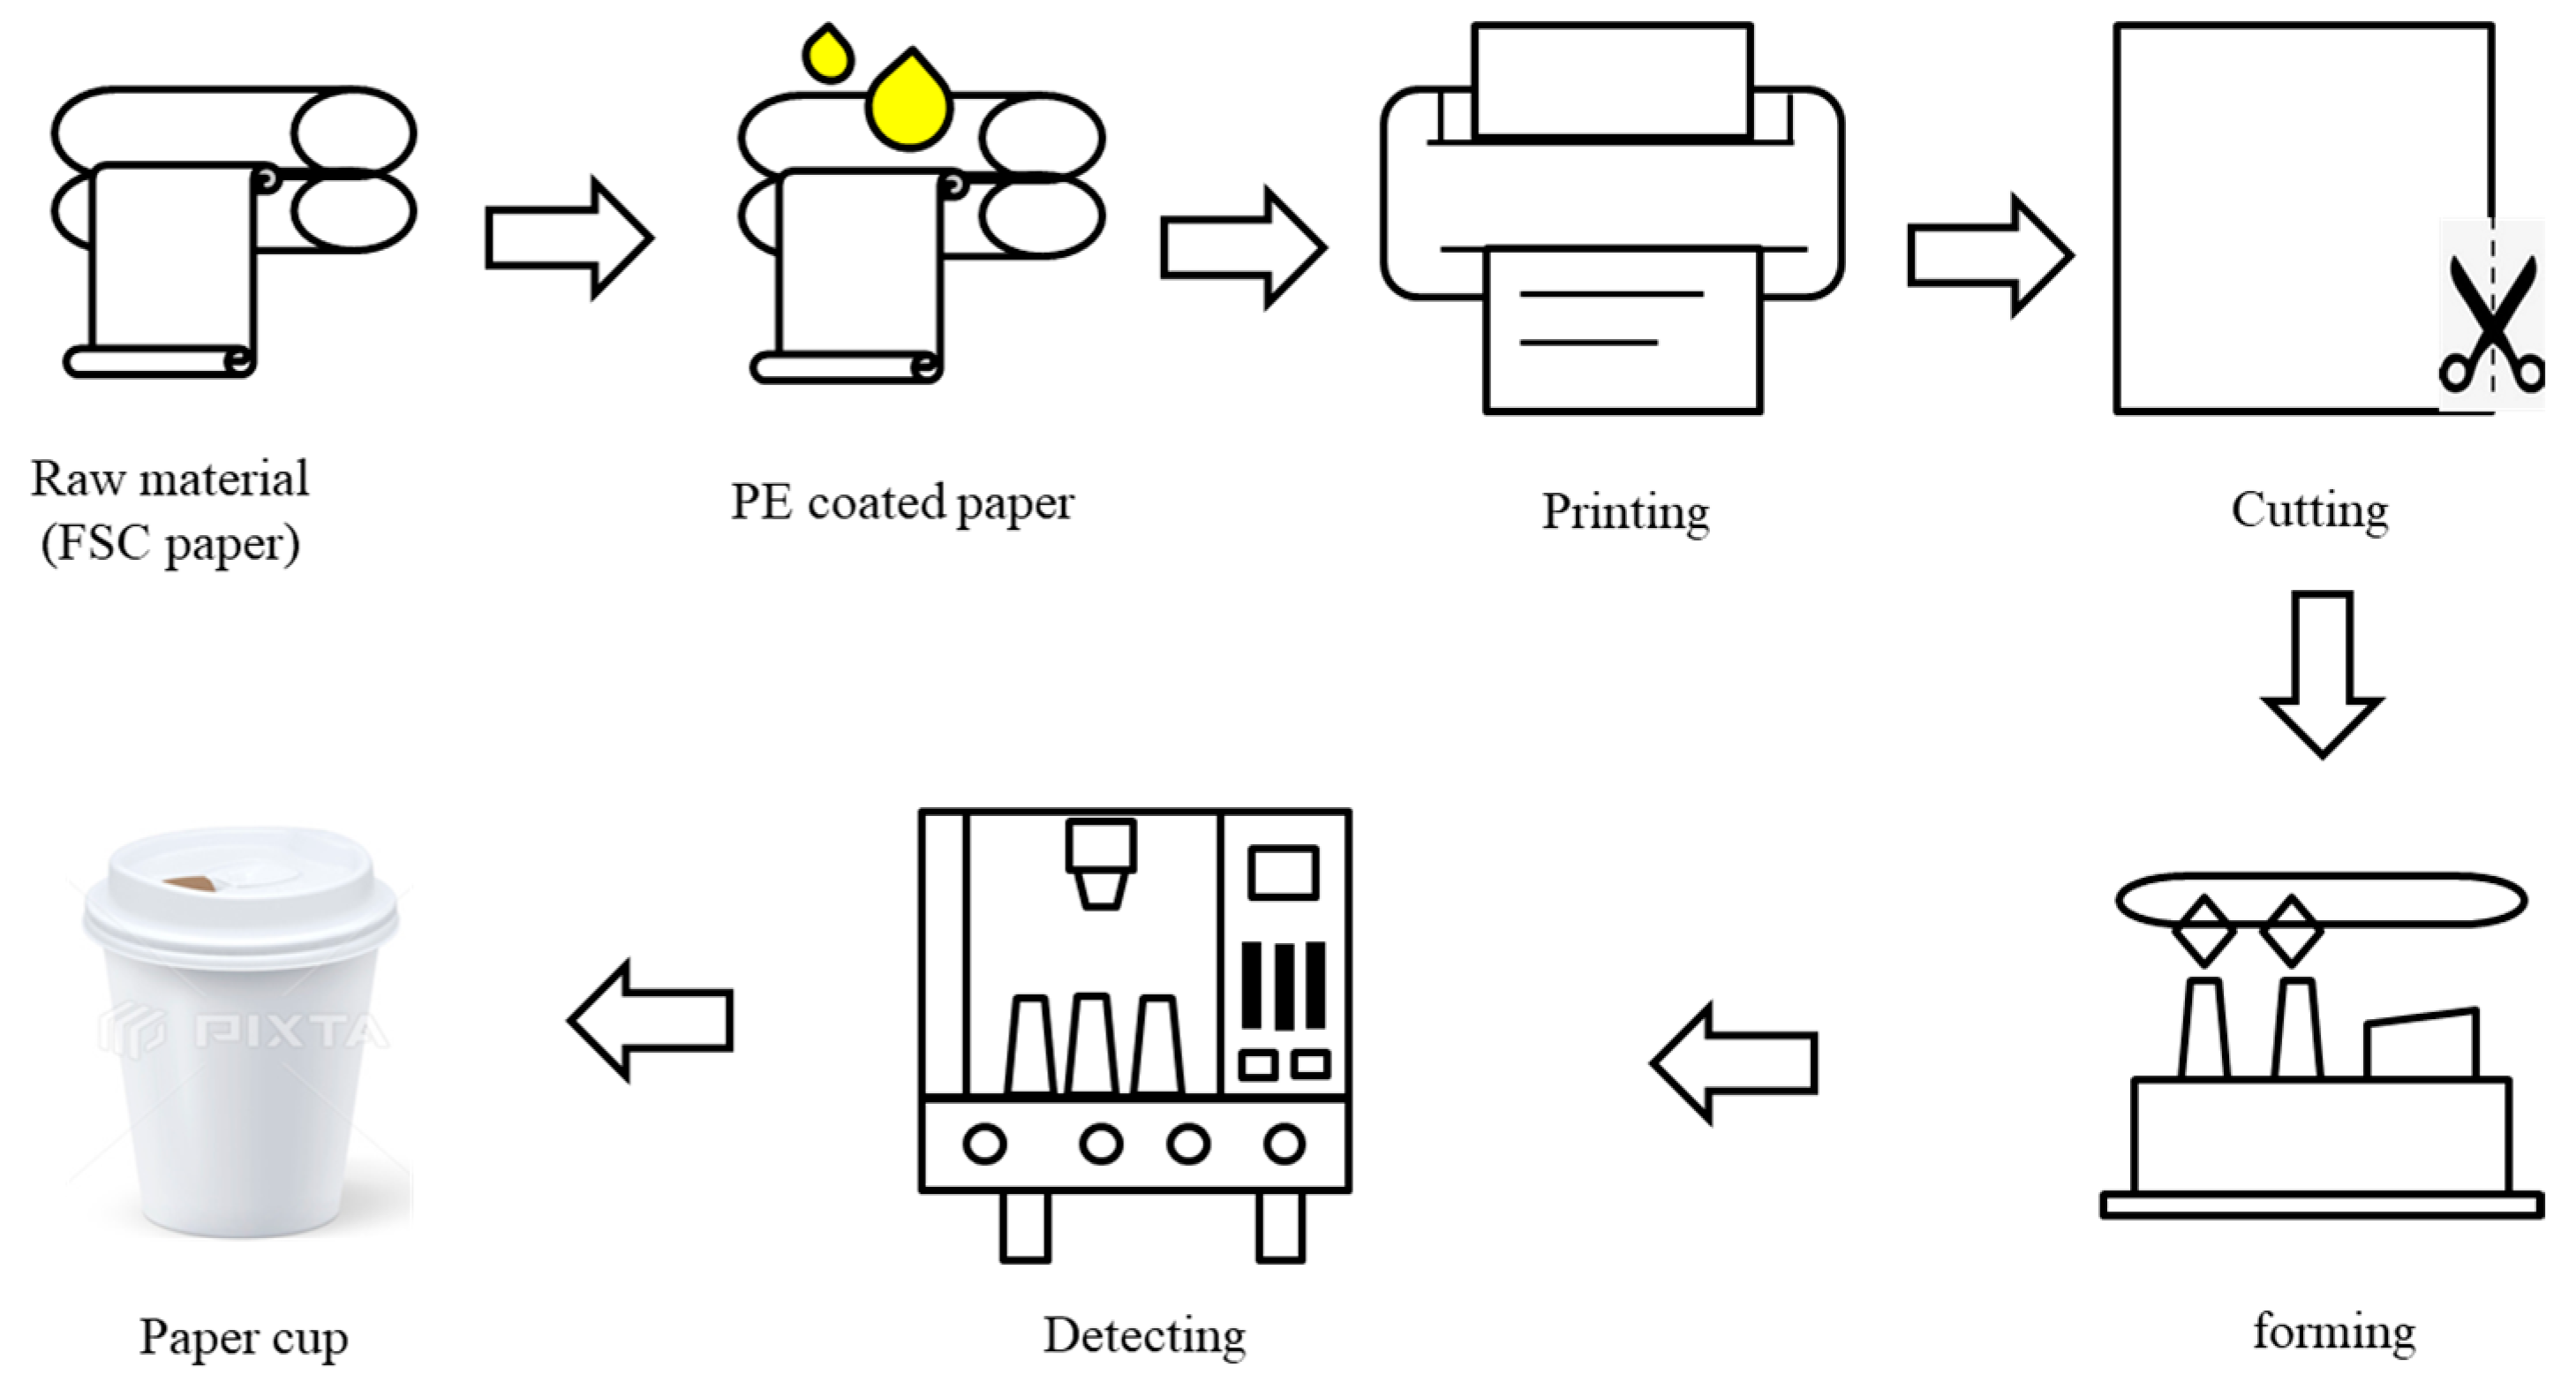
- To reduce the usage of disposable cups, provide a reusable cup rental service by improving one’s corporate image. This inevitably requires investment, including the fixed costs for equipment per cycle (e.g., reusable cup vending machine service, APPs) and variable costs per unit time of operations (e.g., material, water, and labor).
- To extend the demand pattern proposed by Modak et al. [33], demand is affected by selling price, recycling subsidy, and investment in borrow-and-return cup programs. Figure 1 presents the relationship between the impact of two sustainable product activities and customer demand. Model formulation was facilitated by assuming that demand is a simple linear function, , where is the market potential, is the elasticity factor of selling price, is the elasticity factor of manufacturer recycling subsidy, and is investing in a fund for borrow-and-return cup programs, where is the frequency of investment decisions; is the probability of success in a borrow-and-return cup program investment. In the current paper, we set as Return on Investment (ROI) to determine whether the investment in borrow-and-return cup program is indeed advantageous. Further, it is common that ODMs company decides the optimal recovery rate instead of adjusting the selling price due to carbon price to maximize profit. Therefore, the selling price is assumed to be a given parameter in this model.
- When estimating the carbon footprint of a mechanical product at the conceptual design stage, a carbon footprint calculation model is firstly needed. According to the definition of carbon footprint (PAS-2050 [34]) and product life cycle, the contribution of carbon footprint could be classified into five stages for the entire life cycle of a product: acquisition of raw materials stage (design stage ), manufacturing stage (finished product ; components ; scrap returns ), transportation stage, usage stage, and recycle and disposal stage (He et al. [35]).
- R1. The volume of required components, end product yield, and total demand do not change within a given cycle; i.e.,andwhere
- R2. The maximum inventory level of component can be written as
- R3. The maximum inventory level of the finished product can be described as follows:
- R4. The maximum inventory level of the returned product can be described as follows:
- (a)
- Sales revenue (denoted by SR): The sales revenue is equal to the actual operating revenue, , multiplied by the total demand, , as follows:
- (b)
- Design cost (denoted by DC): In the design stage, the total carbon footprint, , which includes the costs associated with changing tools or molds, moving materials or components, and checking the initial output.
- (c)
- (c-1)
- Holding cost of finished product (denoted by HCf): Figure 1 presents the per cycle holding cost of the end product, which is calculated as follows:
- (c-2)
- Holding cost of all components (denoted by HCs): Similarly, the total holding cost for n components per cycle is calculated as follows:
- (c-3)
- Holding cost of scrap returns (denoted by HCr):
- (d)
- Return cost (denoted by RC): To extend the return cost proposed by Soleymanfar et al. [36], the total quantity of the return products in a cycle is
- (e)
- Investment to reduce the amount of waste in landfill (denoted by IC): The investment cost is the sum of fixed cost, (annual investment amount for disposable cups reduction per cycle, such as machines equipment), and variable cost, (reduce the use of consumable, such as cleaning and logistics costs), (ROI of investment in borrow-and-return cup program), that is
- (f)
- Purchasing cost of SFP material (denoted by PC): This cost is the unit purchasing cost multiplied by the ordering quantity of SFP material, which is:
- (a)
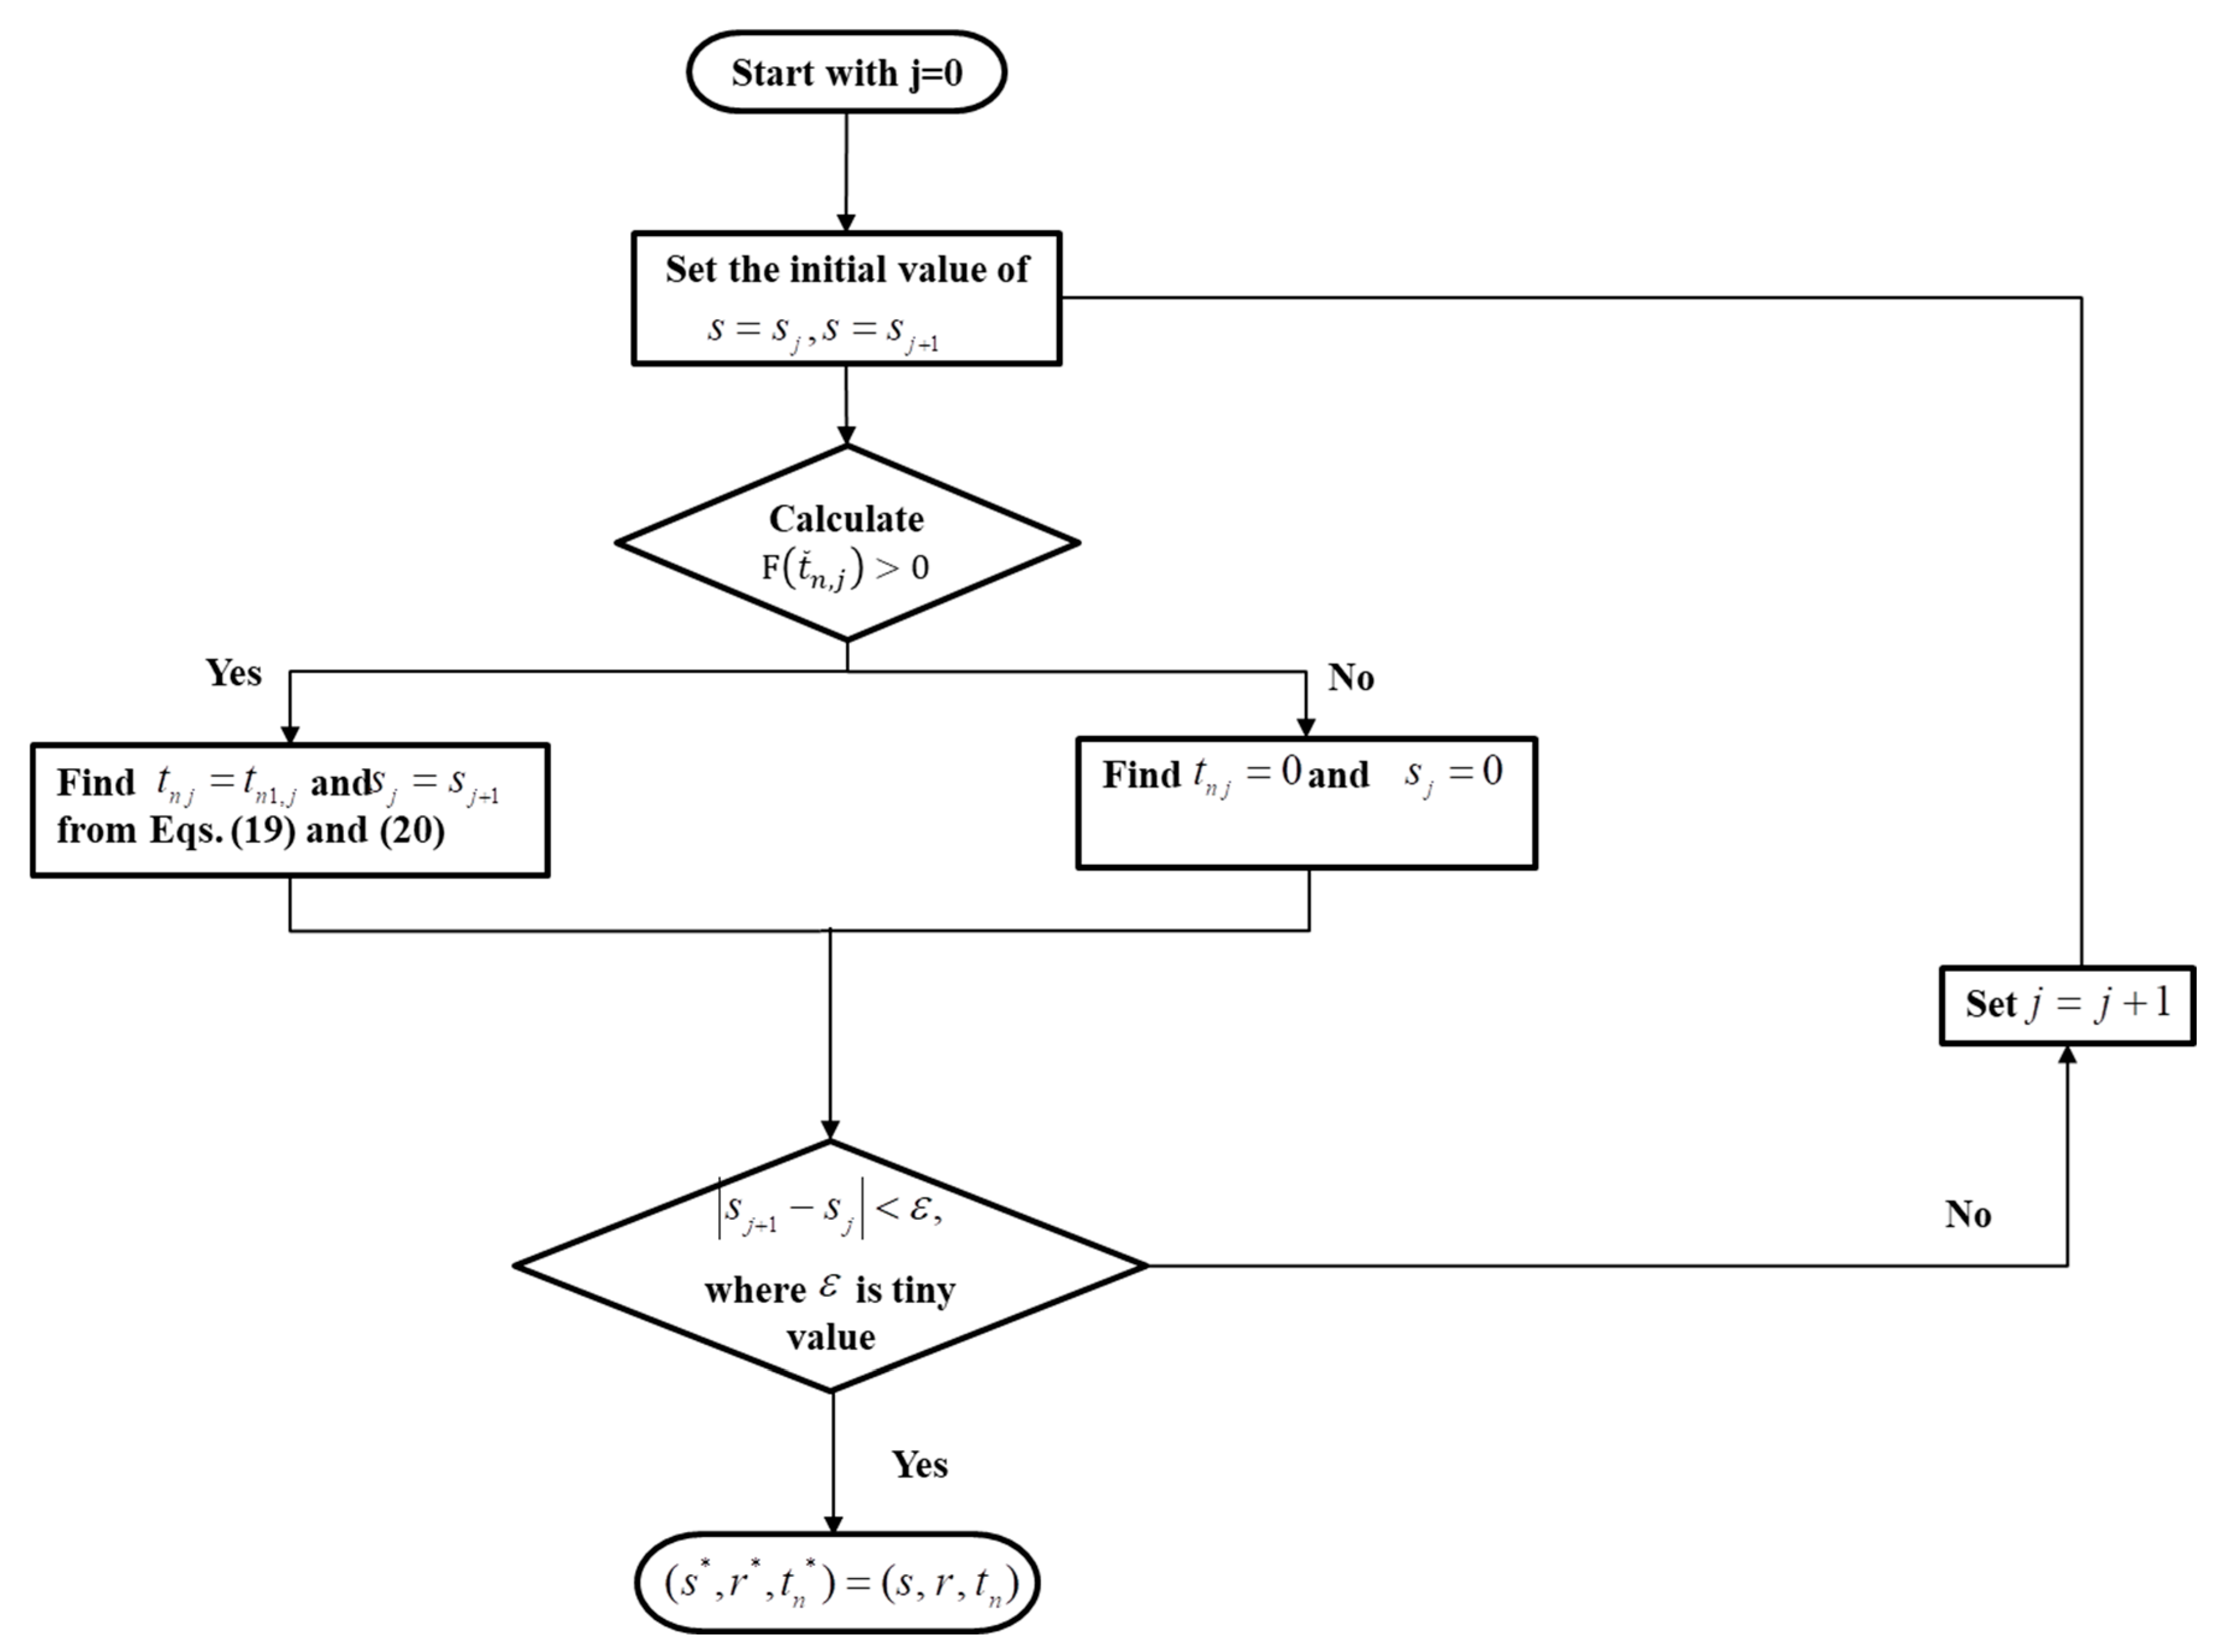
- If , the optimal solution is and given in Equations (17) and (18).
- (b)
- If , the optimal solution is and given in Equations (17) and (18).
- (a)
- (b)
| Algorithm 1: the optimal solution of |
|
5. Application Example
5.1. Lend System
- When purchasing a drink, consumers can pick up a reusable cup from the borrowing area, which is recommended to be located next to the counter.
- Consumers scan to borrow a cup at the scanning station. When borrowing, log the borrowing time using a credit card tap or electronic payment. The borrowing period for reusable cups is limited to 5 days. If exceeded, a deposit of TWD 50 will be charged to the account.
- Scan the QR code at the bottom of the cup when borrowing.
5.2. Return System
- Consumers scan to return the cup at the scanning station. If returned late, the electronic payment registered when borrowing will incur a TWD 49 deposit payment.
- For every 40 cups collected, FamilyMart logistics will transport them to the logistics center. ABC will arrange freight to transport the reusable cups back to the logistics center for cleaning. After cleaning, disinfection, and inspection, they will be returned to the logistics center.
- Cross-platform system, allowing cup borrowing and return between different brand stores. When borrowing a cup from Brand A, you can return it to Brand B. Lidian will charge Brand A as a reusable cup service fee (the fee is based on the brand from which the cup was borrowed; for example, if borrowed from FamilyMart, the fee is charged to FamilyMart). Brand B will assist Lidian in reverse logistics back to the Distribution Center (DC), and Lidian will subsidize Brand B for the reverse logistics costs (0.3 yuan per cup).
5.3. Numerical Examples
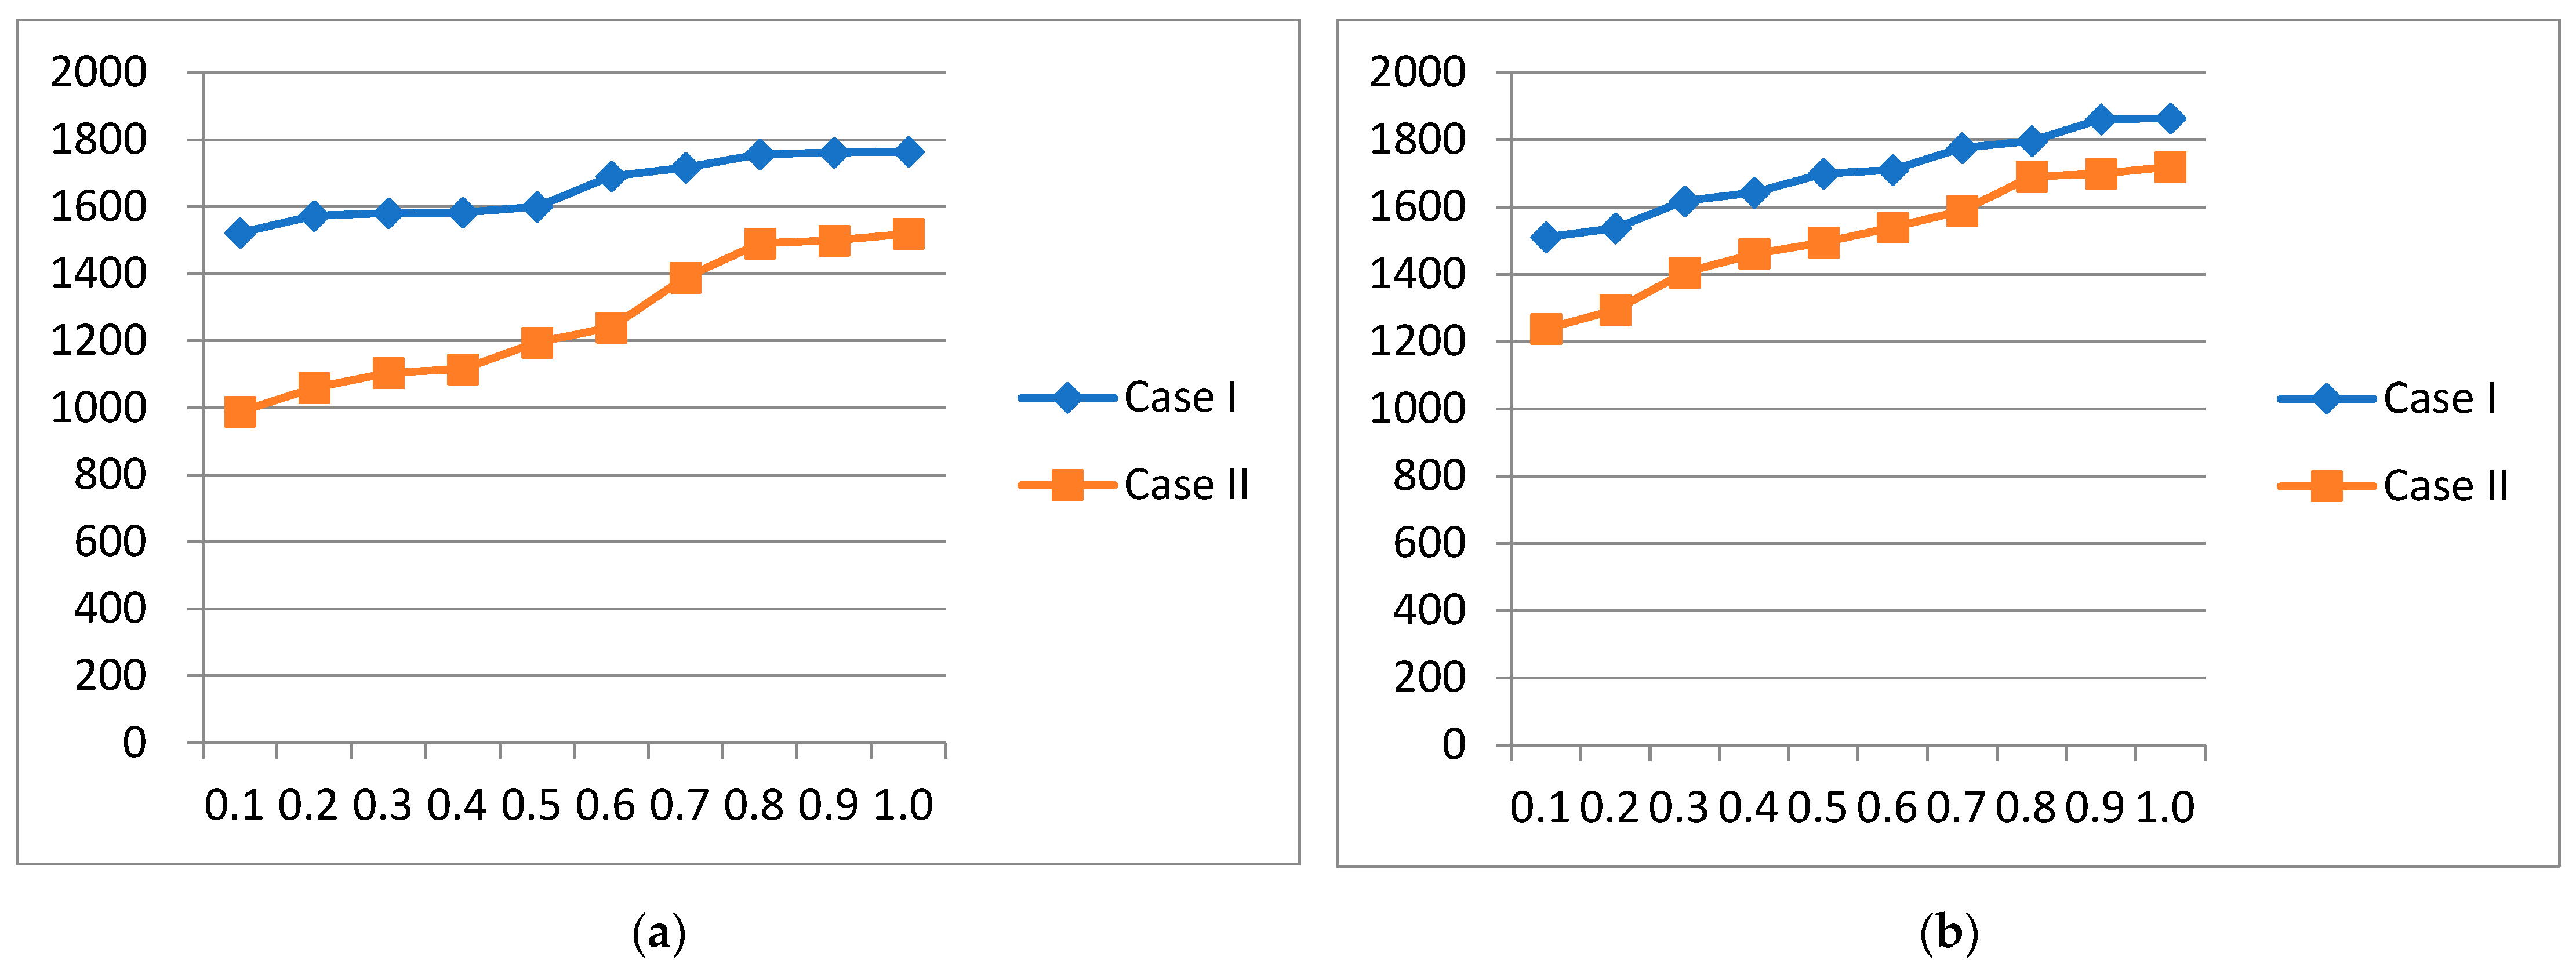
5.4. Sensitivity Analysis
- Case(a) ()
- Case(b) ()
6. Conclusions
- The study examined the impact of increased consumer preference for a borrow-and-return cup program on the profitability of the reverse supply chain for end-of-life vehicles. Two scenarios were analyzed: government subsidies for remanufacturers and consumer subsidies. The findings suggest that when designing subsidy policies, the government should prioritize supporting and incentivizing productivity enhancements driven by technological advancements. Furthermore, the borrow-and-return cup program provides a convenient recycling service for consumers handling end-of-life vehicles, and consumer preference has facilitated its integration into recycling practices.
- The effect of government subsidies on the reverse supply chain depends on the level of subsidies and consumer preferences. Lower subsidy levels favor subsidizing remanufacturers to increase recycling, while higher levels favor subsidizing consumers. The goal of subsidies is to boost recycling rates and promote remanufacturing. For reverse supply chain profitability, subsidizing remanufacturers is better at lower-to-middle subsidy levels, and subsidizing consumers is better at higher levels.
- This study suggests some areas for future research. Researchers could look at how government subsidies affect online recyclers, how subsidies and regulations impact remanufacturers, and how consumer preferences influence recycling of used vehicles. The study also looked at how government financial incentives and penalties affect remanufacturing firms. Additionally, it examined the pros and cons of recycled paper and plastic containers under policies limiting plastic use.
Author Contributions
Funding
Data Availability Statement
Acknowledgments
Conflicts of Interest
References
- Khalid, M.Y.; Arif, Z.U.; Ahmed, W.; Arshad, H. Recent trends in recycling and reusing techniques of different plastic polymers and their composite materials. Sustain. Mater. Technol. 2021, 31, e00382. [Google Scholar] [CrossRef]
- Lai, C.; Fan, K.; Cai, Q.; Ye, Q.; Wu, X. Low carbon and cost-effective pathways for specialty paper production in China. Sustain. Prod. Consum. 2023, 39, 556–568. [Google Scholar] [CrossRef]
- Suarez, A.; Ghosh, A.; Paulsen, F.; Hart, P.W. Hart life cycle carbon analysis of packaging products containing nonwood residues: A case study on linerboard and corrugating medium. Tappi J. (TAPPI) 2024, 23, 131–142. [Google Scholar] [CrossRef]
- White, C.D.; Masanet, E.; Rosen, C.M.; Beckman, S.L. Product recovery with some byte: An overview of management challenges and environmental consequences in reverse manufacturing for the computer industry. J. Clean. Prod. 2003, 11, 445–458. [Google Scholar] [CrossRef]
- Priyono, A. Identifying unique characteristics of disassembly for various product recovery methods with a focus on remanufacturing. In Proceedings of the 2017 6th International Conference on Transportation and Traffic Engineering (ICTTE 2017), Hong Kong, China, 1–3 July 2017. [Google Scholar] [CrossRef]
- Kuik, S.S.; Nagalingam, S.V.; Amer, Y. Sustainable supply chain for collaborative manufacturing. J. Manuf. Technol. Manag. 2011, 22, 984–1001. [Google Scholar] [CrossRef]
- Lee, H.M.; Gay, R.; Lu, W.F.; Song, B. The framework of information sharing in end-of-life for sustainable product development. In Proceedings of the 2006 IEEE International Conference on Industrial Informatics, Singapore, 16–18 August 2006; pp. 73–78. [Google Scholar] [CrossRef]
- Liu, Z.; Li, K.W.; Juan Tang, J.; Gong, B.; Huang, J. Optimal operations of a closed-loop supply chain under a dual regulation. Int. J. Prod. Econ. 2021, 223, 107991. [Google Scholar] [CrossRef]
- Batzias, D.F. Determination of optimal subsidy for materials saving investment through recycle/recovery at industrial level. AIP Conf. Proc. 2009, 1148, 617–624. [Google Scholar] [CrossRef]
- Chang, X.; Wu, J.; Li, T.; Fan, T.J. The joint tax-subsidy mechanism incorporating extended producer responsibility in a manufacturing-recycling system. J. Clean. Prod. 2019, 210, 821–836. [Google Scholar] [CrossRef]
- Shih, H.S.; Cheng, C.B.; Chen, H.Y. Recycling fund management for a cleaner environment through differentiated subsidy rates. J. Clean. Prod. 2019, 240, 118146. [Google Scholar] [CrossRef]
- Yuan, H.; He, L.L.; Wu, H.; Zuo, J. Differentiated subsidy mechanism for promoting construction and demolition waste recycling. J. Clean. Prod. 2023, 405, 137051. [Google Scholar] [CrossRef]
- Yu, H.; Chang, X.; Liu, W. Cost-based subsidy and performance-based subsidy in a manufacturing-recycling system considering product eco-design. J. Clean. Prod. 2021, 327, 129391. [Google Scholar] [CrossRef]
- Taft, E.W. The most economical production lot. Iron Age 1918, 101, 1410–1412. [Google Scholar]
- Su, R.H.; Weng, M.W.; Yang, C.T. Effects of corporate social responsibility activities in a two-stage assembly production system with multiple components and imperfect processes. Eur. J. Oper. Res. 2021, 293, 469–480. [Google Scholar] [CrossRef]
- Taleizadeh, A.A.; Naghavi-Alhoseiny, M.S.; Cardenas-Barron, L.E.; Amjadian, A. Optimization of price, lot size and backorder level in an EPQ inventory model with rework process. Rairo-Oper. Res. 2024, 58, 803–819. [Google Scholar] [CrossRef]
- Pando, V.; San-José, L.A.; Sicilia, J.; Alcaide-López-de-Pablo, D. An inventory model with price- and stock-dependent demand and time- and stock quantity-dependent holding cost under profitability maximization. Comput. Oper. Res. 2024, 164, 106520. [Google Scholar] [CrossRef]
- Saraswat, A.; Sharma, A. Inventory model for the growing items with price dependent demand, mortality and deterioration. Int. J. Oper. Res. 2023, 47, 534–546. [Google Scholar] [CrossRef]
- Tsoularis, A.; Wallace, J. An optimal inventory pricing and ordering strategy subject to stock and price dependent demand. Int. J. Math. Models Methods Appl. Sci. 2021, 15, 166–170. [Google Scholar] [CrossRef]
- San-José, L.A.; Sicilia, J.; González-de-la-Rosa, M.; Febles-Acosta, J. Optimal price and lot size for an EOQ model with full backordering under power price and time dependent demand. Mathematics 2021, 9, 1848. [Google Scholar] [CrossRef]
- Singer, G.; Khmelnitsky, E. A production-inventory problem with price-sensitive demand. Appl. Math. Model. 2021, 89, 688–699. [Google Scholar] [CrossRef]
- Widyadana, I.G.A.; Wang, K.J.; Sutapa, I.N. An optimal inventory model for a retailer with price dependent demand and unavailability supply. KnE Life Sci. 2020, 2020, 110–118. [Google Scholar] [CrossRef]
- Lin, Y.J.; Lin, H.J. Integrated supply chain model with price-dependent demand and product recovery. J. Appl. Sci. Eng. 2015, 18, 213–222. [Google Scholar] [CrossRef]
- Karim, R.; Nakade, K. A literature review on the sustainable EPQ model, focusing on carbon emissions and product recycling. Logistics 2022, 6, 55. [Google Scholar] [CrossRef]
- Hallak, B.K.; Nasr, W.W.; Jaber, M.Y. Re-ordering policies for inventory systems with recyclable items and stochastic demand-outsourcing vs. in-house recycling. Omega 2021, 105, 102514. [Google Scholar] [CrossRef]
- Parsa, M.; Nookabadi, A.S.; Atan, Z.; Malekian, Y. An optimal inventory policy for a multi-echelon closed-loop supply chain of postconsumer recycled content products. Oper. Res. 2022, 22, 1887–1938. [Google Scholar] [CrossRef]
- Karmakar, S.; Das, P. An economic production quantity model with refurbishment policy in dual-channel logistics. J. Clean. Prod. 2022, 377, 134201. [Google Scholar] [CrossRef]
- Liao, H.; Deng, Q.; Wang, Y. Optimal acquisition and production policy for end-of-life engineering machinery recovering in a joint manufacturing/remanufacturing system under uncertainties in procurement and demand. Sustainablity 2017, 9, 338. [Google Scholar] [CrossRef]
- Rabta, B. An economic order quantity inventory model for a product with a circular economy indicator. Comput. Ind. Eng. 2020, 140, 106215. [Google Scholar] [CrossRef]
- Huang, Y.F.; Weng, M.W.; Fu, C.J. A two-stage sustainable production-inventory model with carbon credit demand. Int. J. Ind. Eng. Manag. 2024, 15, 96–108. [Google Scholar] [CrossRef]
- Tseng, H.Y.; Huang, Y.F.; Fu, C.J.; Weng, M.W. Optimal Carbon Pricing and Carbon Footprint in a Two-Stage Production System Under Cap-and-Trade Regulation. Mathematics 2024, 12, 3567. [Google Scholar] [CrossRef]
- Yu, J.C.P.; Chen, J.M.; Wu, C.H. Pricing strategy for product reuse with multiple quality levels and price- and availability-dependent demand. Int. J. Inf. Manag. Sci. 2014, 25, 51–66. [Google Scholar] [CrossRef]
- Modak, N.M.; Kazemi, N.; Cárdenas-Barrón, L.E. Investigating structure of a two-echelon closed-loop supply chain using social work donation as a corporate social responsibility practice. Int. J. Prod. Econ. 2019, 207, 19–33. [Google Scholar] [CrossRef]
- PAS 2050:2011. Specification for the Assessment of the Life Cycle Greenhouse Gas Emissions of Goods and Services. Available online: https://www.ditan.com/static/upload/file/20240613/1718256889188999.pdf (accessed on 10 April 2025).
- He, B.; Mao, H.; Li, T.; Xiao, J. A closed-loop digital twin modeling method integrated with carbon footprint analysis. Comput. Ind. Eng. 2015, 182, 109389. [Google Scholar] [CrossRef]
- Soleymanfar, V.R.; Makui, A.; Taleizadeh, A.A.; Tavakkoli-Moghaddam, R. Sustainable EOQ and EPQ models for a two-echelon multi-product supply chain with return policy. Environ. Dev. Sustain. 2022, 24, 5317–5343. [Google Scholar] [CrossRef]
- Su, R.H.; Weng, M.W.; Yang, C.T.; Li, H.T. An imperfect production–inventory model with mixed materials containing scrap returns based on a circular economy. Processes 2021, 9, 1275. [Google Scholar] [CrossRef]


| Authors (Year) | Model Type | Product Reuse | Recycling Fund | Recovery Rate | Price- and Stock- Dependent Demand |
|---|---|---|---|---|---|
| Taleizadeh et al. [16] | EPQ | √ | |||
| Saraswat and Sharma [18] | EPQ | √ | |||
| Tsoularis and Wallace [19] | EPQ | √ | |||
| San-José et al. [20] | EOQ | √ | |||
| Pando et al. [17] | EOQ | √ | |||
| Singer and Khmelnitsky [21] | EPQ | √ | |||
| Widyadana et al. [22] | EPQ | √ | |||
| Yu et al. [32] | EOQ | √ | √ | √ | |
| Lin and Lin [23] | EOQ | √ | √ | ||
| Present model | EOQ | √ | √ | √ | √ |
| Parameter | |||||||
|---|---|---|---|---|---|---|---|
| +50% | 101.6558 | 0.7824 | 1836.04 | 99.9612 | 0.6122 | 1619.08 | |
| +25% | 114.6177 | 0.9823 | 1607.02 | 108.1411 | 0.6958 | 1116.26 | |
| −25% | 124.6938 | 1.1824 | 1235.06 | 113.4821 | 0.7067 | 1092.94 | |
| −50% | 124.7319 | 1.2822 | 1004.08 | 113.4911 | 0.7505 | 995.59 | |
| ACT | 5.0191 | 6.9280 | 7.1254 | 6.8913 | 7.8341 | 9.1245 | |
| +50% | 124.1880 | 1.2556 | 1590.13 | 113.9012 | 0.7442 | 1351.11 | |
| +25% | 124.2240 | 1.1646 | 1589.25 | 113.8112 | 0.6247 | 1140.12 | |
| −25% | 124.2940 | 0.9828 | 1587.49 | 113.9621 | 0.4991 | 1133.55 | |
| −50% | 124.3300 | 0.8920 | 1586.61 | 113.0211 | 0.4770 | 1131.08 | |
| ACT | 4.2345 | 5.1236 | 6.3412 | 7.3451 | 7.5412 | 8.8712 | |
| +50% | 124.1110 | 1.4535 | 1592.05 | 113.8711 | 1.3430 | 1132.90 | |
| +25% | 124.1850 | 1.2635 | 1590.21 | 113.8901 | 1.1474 | 1129.47 | |
| −25% | 124.3330 | 0.8841 | 1586.53 | 113.9711 | 0.8661 | 1118.84 | |
| −50% | 124.4070 | 0.6947 | 1584.69 | 113.9921 | 0.3937 | 1109.78 | |
| ACT | 5.7811 | 6.0712 | 7.8901 | 5.7810 | 5.9102 | 6.9102 | |
| +50% | 124.0341 | 1.6516 | 1593.97 | 113.1701 | 1.3263 | 1167.22 | |
| +25% | 124.1471 | 1.3624 | 1591.17 | 113.1811 | 1.1393 | 1163.31 | |
| −25% | 124.3710 | 0.7854 | 1585.57 | 113.2701 | 0.8709 | 1124.68 | |
| −50% | 124.4840 | 0.4977 | 1582.78 | 113.3711 | 0.7901 | 1117.00 | |
| ACT | 6.7189 | 6.8901 | 7.5671 | 8.1901 | 8.5671 | 9.1014 | |
| +50% | 124.4771 | 0.1135 | 1583.00 | 113.2711 | 0.1101 | 1119.12 | |
| +25% | 124.3970 | 0.5175 | 1584.95 | 113.1631 | 0.3541 | 1122.57 | |
| −25% | 124.0020 | 1.9357 | 1594.74 | 113.0011 | 1.3541 | 1159.57 | |
| −50% | 123.4511 | 3.5689 | 1608.52 | 111.1711 | 2.3541 | 1219.57 | |
| ACT | 7.1892 | 5.1631 | 7.8914 | 7.2561 | 7.8951 | 8.9182 | |
| +50% | 127.2591 | 1.0731 | 1618.37 | 119.0121 | 1.0141 | 1311.21 | |
| +25% | 125.1490 | 1.0734 | 1608.37 | 117.1103 | 1.0142 | 1301.91 | |
| −25% | 122.1290 | 1.0740 | 1538.36 | 114.0112 | 1.0145 | 1109.31 | |
| −50% | 120.1561 | 1.0743 | 1518.36 | 112.0011 | 1.0149 | 1102.21 | |
| ACT | 5.6718 | 5.8910 | 6.7241 | 6.7451 | 7.8192 | 8.2791 | |
| +50% | 126.7841 | 1.1932 | 1690.86 | 118.8711 | 1.0541 | 1240.08 | |
| +25% | 125.7341 | 1.0926 | 1599.59 | 116.5401 | 1.0312 | 1194.83 | |
| −25% | 121.6345 | 1.0313 | 1581.04 | 111.4011 | 1.0241 | 1104.28 | |
| −50% | 120.5846 | 1.0206 | 1572.77 | 109.5812 | 1.0141 | 1058.98 | |
| ACT | 6.7810 | 6.9123 | 7.1235 | 8.9901 | 9.1682 | 9.6781 | |
| +50% | 161.6844 | 1.0910 | 1537.32 | 151.6221 | 1.0525 | 1238.18 | |
| +25% | 141.6843 | 1.0819 | 1564.14 | 131.5512 | 1.0233 | 1293.89 | |
| −25% | 101.6843 | 1.0619 | 1618.38 | 100.3112 | 1.0149 | 1405.22 | |
| −50% | 91.6842 | 1.0418 | 1643.39 | 81.1512 | 0.9566 | 1460.84 | |
| ACT | 6.0012 | 6.5532 | 6.5611 | 8.5191 | 7.2451 | 7.4511 | |
| +50% | 124.7128 | 1.0614 | 804.591 | 112.5801 | 1.0565 | 792.261 | |
| +25% | 124.6986 | 1.0717 | 1204.95 | 112.0412 | 1.0753 | 1120.95 | |
| −25% | 124.1711 | 1.0822 | 1670.68 | 112.0121 | 1.0829 | 1778.12 | |
| −50% | 124.1558 | 1.0854 | 1804.04 | 112.0008 | 1.0917 | 1806.61 | |
| ACT | 6.9011 | 6.9801 | 7.0011 | 7.2912 | 7.6712 | 8.8911 | |
| +50% | 124.0545 | 1.0792 | 1598.07 | 111.7011 | 1.0579 | 1594.21 | |
| +25% | 124.1551 | 1.0808 | 1591.06 | 111.8112 | 1.0633 | 1481.72 | |
| −25% | 124.6564 | 1.0840 | 1576.02 | 111.8261 | 1.0794 | 1385.32 | |
| −50% | 124.6571 | 1.0856 | 1536.01 | 111.8311 | 1.0811 | 1191.01 | |
| ACT | 6.9151 | 6.8751 | 7.2351 | 7.5619 | 7.8765 | 8.1023 | |
| +50% | 101.6558 | 1.0524 | 1806.04 | 99.0311 | 0.9932 | 1614.90 | |
| +25% | 111.1558 | 1.0624 | 1706.04 | 100.9051 | 1.0486 | 1368.03 | |
| −25% | 142.6557 | 1.0924 | 1306.04 | 121.5121 | 1.3599 | 1329.61 | |
| −50% | 161.1557 | 1.1124 | 1206.04 | 141.1211 | 1.3661 | 1308.21 | |
| ACT | 7.6711 | 7.8901 | 8.0123 | 8.9112 | 9.1231 | 10.2121 | |
Disclaimer/Publisher’s Note: The statements, opinions and data contained in all publications are solely those of the individual author(s) and contributor(s) and not of MDPI and/or the editor(s). MDPI and/or the editor(s) disclaim responsibility for any injury to people or property resulting from any ideas, methods, instructions or products referred to in the content. |
© 2025 by the authors. Licensee MDPI, Basel, Switzerland. This article is an open access article distributed under the terms and conditions of the Creative Commons Attribution (CC BY) license (https://creativecommons.org/licenses/by/4.0/).
Share and Cite
Hsieh, Y.-T.; Shen, C.-Y.; Huang, Y.-F.; Weng, M.-W. An Investigation of Subsidy Policies on Recycling and Remanufacturing System in Two-Echelon Supply Chain for Negative Binomial Distribution. Mathematics 2025, 13, 1303. https://doi.org/10.3390/math13081303
Hsieh Y-T, Shen C-Y, Huang Y-F, Weng M-W. An Investigation of Subsidy Policies on Recycling and Remanufacturing System in Two-Echelon Supply Chain for Negative Binomial Distribution. Mathematics. 2025; 13(8):1303. https://doi.org/10.3390/math13081303
Chicago/Turabian StyleHsieh, Yi-Ta, Chiu-Yen Shen, Yung-Fu Huang, and Ming-Wei Weng. 2025. "An Investigation of Subsidy Policies on Recycling and Remanufacturing System in Two-Echelon Supply Chain for Negative Binomial Distribution" Mathematics 13, no. 8: 1303. https://doi.org/10.3390/math13081303
APA StyleHsieh, Y.-T., Shen, C.-Y., Huang, Y.-F., & Weng, M.-W. (2025). An Investigation of Subsidy Policies on Recycling and Remanufacturing System in Two-Echelon Supply Chain for Negative Binomial Distribution. Mathematics, 13(8), 1303. https://doi.org/10.3390/math13081303