Abstract
This paper introduces a novel spatial angle index method for evaluating industrial spatial structure upgrading, drawing on a review and critique of existing approaches, including the traditional proportional method, industrial structure hierarchy coefficient, the production efficiency method and the cosine angle method. The proposed method integrates both local and projected spatial angle indices, accounting for the actual industry proportions of specific regions and assessing the deviation of these indices from extreme states. This approach effectively captures spatial spillover effects between regions and the combined influence of local and projected points on industrial spatial structure upgrading. Utilizing firm survival big data from 96 sub-industries across 284 cities in China from 1978 to 2022, the paper evaluates the upgrading levels of industrial spatial structure in these cities and examines their spatiotemporal evolution patterns using kernel density estimation. The study reveals that although different spatial weight matrices (commuting distance, latitude–longitude distance, and commuting time) produce slightly different results, the differences are not substantial. Notably, the analysis shows that the tertiary sector consistently demonstrates superior upgrading levels, while the secondary sector has underperformed, particularly since 1992. The primary sector, however, has experienced significant improvements, at times even surpassing the tertiary sector. The findings further suggest that while significant changes in industrial spatial structure upgrading occurred before 1987, the pace of change has stabilized since 1988.
Keywords:
industrial spatial structure upgrading; the cosine angle method; spatial angle indices; projected points; kernel density estimation; firm survival big data MSC:
91B82; 62P20
1. Introduction
China’s economic development is undergoing profound changes in its spatial structure, with central cities emerging as key hubs that drive economic growth. Industrial development is the lifeblood of economic progress, and upgrading industrial structures serves as both a critical planning tool and a starting point for accelerating modernization. As core engines of economic activity and hubs for production and innovation resources, cities play a vital role in the nation’s overall development. Urban development must prioritize comprehensive planning of space, scale, and industry—ensuring not only the steady expansion of the economy but also the optimal spatial distribution and efficient movement of economic resources. Thus, advancing the industrial spatial structure should be a central focus in the broader process of industrial upgrading, effectively driving improvements in the industrial structure.
As the term suggests, industrial spatial structure upgrading refers to the process of achieving industrial transformation and advancement within a spatial framework. Specifically, upgrading the industrial spatial structure is a complex and multi-dimensional process involving interactions at various levels. At the micro level, firms must focus on optimizing spatial layouts and resource allocation. At the meso level, attention should be given to industrial spatial arrangements and the coordinated development of regional economies. At the macro level, it involves formulating evidence-based industrial development strategies and policies to promote the optimization of the national economic landscape. These three interconnected levels of influence, which both complement and constrain one another, together form a comprehensive framework for upgrading the industrial spatial structure. However, academic attention in this area remains limited, with a notable gap in specialized research on industrial spatial structure, particularly in terms of assessing the upgrading of industrial spatial structure at the city level.
To address this gap, this paper introduces an innovative approach for assessing the level of industrial spatial structure upgrading, based on a novel spatial angle index. Building on a review and adaptation of traditional methods for evaluating industrial structure upgrading [1,2], the core of this method is to expand the evaluation focus from local industrial structures to encompass both local and projected spatial points. The level of upgrading is measured by quantifying how much the actual industrial structure deviates from extreme scenarios, such as one industry dominating the entire structure or all industry categories being perfectly evenly distributed. Additionally, a MATLAB program will be developed to implement this method, with potential influencing factors on the evaluation results simulated through random sampling. The industrial spatial structure upgrading levels of 284 prefecture-level cities in China from 1978 to 2022 will be assessed across 96 sub-industries and their major sectors, including the primary, secondary, and tertiary industries, by integrating survival big data on enterprises at both regional and industry levels. Finally, the spatiotemporal characteristics of these upgrading levels will be analyzed using kernel density estimation. The completion of this paper will contribute to the development of an innovative framework for evaluating the level of industrial spatial structure upgrading, offering both theoretical and practical value. It will provide a clearer understanding of the current state of industrial spatial structure upgrading nationwide, while also offering valuable insights for China’s industrial spatial structure.
2. Literature Review
The industrial spatial structure inherently defines the organizational framework of economic activities within geographical spaces, encompassing elements such as industrial agglomeration points, development axes, clustering areas, and their interconnected networks [3,4]. This structure reflects the spatial distribution patterns, combinations, scale, and morphology of industrial economic activities, along with their interactions and evolutionary dynamics. As such, it forms a comprehensive representation and material expression of regional economic activities in space. The upgrading of industrial spatial structure involves not only the structural refinement of industries or firms in spatial layouts but also the optimization of the spatial distribution of industrial elements. The former focuses on the spatial agglomeration of industries or firms in predefined forms, such as point-axis, zonal, or networked patterns, following specific rules [5,6]. The goal is to facilitate industrial chain coordination or clustering, thereby achieving economies of scale. The latter emphasizes the spatial projection and structural optimization of the industrial mix, addressing spatial spillover effects or the advanced structuring of industrial systems within spatial relationships.
Upgrading the industrial spatial structure requires a comprehensive approach that encompasses both the refinement of micro-level firm distribution and the macro-level spatial configuration of industrial structures. Efforts to optimize the industrial spatial structure are typically grounded in the optimization of both industrial and spatial structures. Internationally, scholarly research on industrial structure optimization and spatial structure traces its origins to seminal studies in regional economics, human geography, urban economics, and spatial economics. These studies have contributed to a vast body of literature exploring various facets of the topic [7,8]. Key theoretical frameworks in this field include the Theory of Industrial Location, the Theory of Agglomeration Externalities, New Economic Geography Theory, Evolutionary Economic Geography Theory, Gradient Shift Theory, and the Growth Poles Theory. Contemporary academic discourse on industrial structure upgrading predominantly revolves around economic and environmental considerations [9]. Recent research has focused on defining the connotations of industrial structure optimization, measurement methods, influencing factors, external effects, and pathways to realization [10,11]. Regarding spatial structure, recent studies primarily examine its evolution, influencing factors, and effects [12,13]. Despite the extensive research on industrial structure and spatial structure optimization, there remains a significant gap in studies specifically focusing on the optimization of industrial spatial structure.
Cities are not only centers of population aggregation but also vibrant hubs for cultural exchange, technological innovation, and industrial development. The upgrading of industrial spatial structures within specific cities reflects the profound shifts occurring in the spatial dimensions of urban economic development. It also represents a crucial response to broader industrial growth trends, facilitating the coordination of industrial transformation and upgrading across both temporal and spatial dimensions [14,15]. Currently, China’s urban economic development faces various challenges, such as incomplete industrial chains, technological and talent bottlenecks, and the misallocation of financial resources. These issues have contributed to insufficient momentum and significant delays in the industrial structure upgrading process [16]. Addressing these industrial development issues has attracted sustained attention from numerous scholars. However, existing research on urban industrial development primarily focuses on areas such as industrial synergy [17], industrial agglomeration [18,19], green industry development [20], industrial carbon emissions [21,22], and the impact of the digital economy on industrial development [23]. Yet, there remains a notable gap in specialized research on industrial spatial structure, particularly with regard to evaluating the upgrading of industrial spatial structure at the city level.
3. The Core Foundations of the New Approaches
3.1. Overview of Evaluation Methods for Industrial Structure Upgrading
3.1.1. Traditional Proportional Method
Industrial structure upgrading is a key indicator of industrial development. Early assessments largely relied on Clark’s Law and the ratio of non-agricultural output to measure the level of industrial structure upgrading. Typically, during industrial development, an increase in the proportion of non-agricultural output has been a prominent trend. However, since the 1970s, advancements in information technology have triggered significant shifts in the industrial structure of traditional industrial countries, giving rise to trends like “economic serviceization”, which refers to the increasing share of the service sector in economic and industrial development. As a result, using the non-agricultural output ratio as a benchmark for industrial structure upgrading has become less accurate. In response, an alternative method has emerged: using the ratio of tertiary to secondary sector output [24,25]. This approach assumes that, during the process of “economic serviceization”, the growth rate of the tertiary sector will significantly surpass that of the secondary sector. By evaluating the industrial structure through this ratio, the method effectively captures the economy’s shift toward service-oriented growth. A rising ratio indicates that the economy is transitioning towards service-driven industrial development, signaling an upgrading of the industrial structure.
3.1.2. Industrial Structure Hierarchy Coefficient
Traditional methods of measuring industrial structure upgrading, such as using the share of non-agricultural industries or the ratio of tertiary to secondary industry output, often overlook issues like the exclusion of the primary industry or the improper weighting of industry shares. In reality, industrial structure upgrading represents a dynamic process of industrial transformation, capturing the shift from a lower to a higher level of economic development. To overcome the limitations of traditional methods, scholars have increasingly turned to the industrial structure hierarchy coefficient as a more accurate indicator of industrial structure upgrading [26,27], as illustrated in Equation (1).
In Equation (1), represents the share of the added value of the m-th industry in region at time in the region’s gross domestic product. denotes both the industry’s serial number and the weight of its share, while represents the level of industrial structure upgrading for region at time , calculated using the industrial structure hierarchy coefficient.
3.1.3. The Production Efficiency Method
The level of industrial structure upgrading, calculated using the hierarchical coefficient of the industrial structure, not only accounts for the proportions of the primary, secondary, and tertiary industries but also addresses the issue of determining the weights for each industry’s share. However, the method of directly assigning industry serial numbers as weights for industrial shares is inherently flawed. To address this, the academic community has begun to determine the weights of industrial shares in conjunction with labor productivity, leading to the development of an effective approach to measuring industrial structure upgrading through the production efficiency method [28,29]. This is demonstrated by Formula (2).
In Formula (2), represents the level of the industrial structure upgrading in region during period as computed through the production efficiency method. still indicates the proportion of the added value of the m-th industry in region during period to its regional gross domestic product. pertains to the labor productivity of the m-th industry in region during period , which is determined by the ratio of the added value of this industry to the proportion of the number of employees in the industry, precisely.
In contrast, the level of industrial structure upgrading calculated using the production efficiency method takes into account both the proportional relationships among industries and the improvement in labor productivity throughout the industrial development process. Furthermore, this method uses labor productivity improvement as the weight for the industrial share. This approach reflects the need for the ongoing strengthening of industries’ coordinated development, the continuous enhancement of industrial interconnections, and the constant improvement of resource utilization efficiency in the context of industrial structure upgrading.
3.1.4. The Cosine Angle Method
The level of industrial structure upgrading measured using the production efficiency method places greater emphasis on the qualitative aspects of the upgrading process. This approach has been found to be more accurate compared to methods such as the traditional proportional method and the industrial structure hierarchy coefficient. However, when assessing industrial structure upgrading in smaller-scale or lower-level administrative regions, the production efficiency method may present challenges, such as incomplete data or difficulties in data collection. This is particularly evident when attempting to obtain data on the number of employees in various industries, where the method tends to be less effective. Additionally, this method does not consider a standard or ideal industrial structure at the top level, nor does it account for an ultimate industrial structure at the bottom level. In light of these limitations, scholars have begun to adopt the cosine angle method to measure industrial structure upgrading [1,30], as demonstrated in Formula (3).
In Formula (3), refers to the level of the industrial structure upgrading in region during period , calculated using the cosine angle method. refers to the proportion of the m-th industry in region during period relative to the regional gross domestic product of that region. represents the industry serial number, corresponding to the primary, secondary, and tertiary industries, respectively. represents the degree to which the industrial structure deviates from the ultimate industrial structure. The ultimate industrial structure is conceptualized as the worst-case scenario, expressed as a matrix , where , , and represent the extreme cases of the industrial structure in which the primary, secondary, and tertiary industries each account for 100%, respectively. is the l-th element in , . In the extreme cases of the industrial structure, only one industry—either primary, secondary, or tertiary—dominates, making these scenarios the most extreme or “worst-case” in terms of industrial structure. The angle represents the deviation of the m-th industry in region during period from the ultimate industrial structure. The larger these angles, the better the industrial structure is considered to be. Thus, a larger value of indicates a higher degree of industrial structure upgrading.
3.2. Advancing Evaluation Approaches for Industrial Spatial Structure Upgrading: Core Foundations
The cosine angle method, employed to assess the level of industrial structure upgrading, assumes a worst-case scenario for the industrial structure and measures the extent to which the actual structure deviates from this baseline to determine the level of upgrading. Compared to earlier methods, this approach is more scientifically robust. Building on the cosine angle method, this paper introduces a new approach using spatial angle indices, as illustrated in Equations (4) to (7), to assess the level of upgrading in industrial spatial structure.
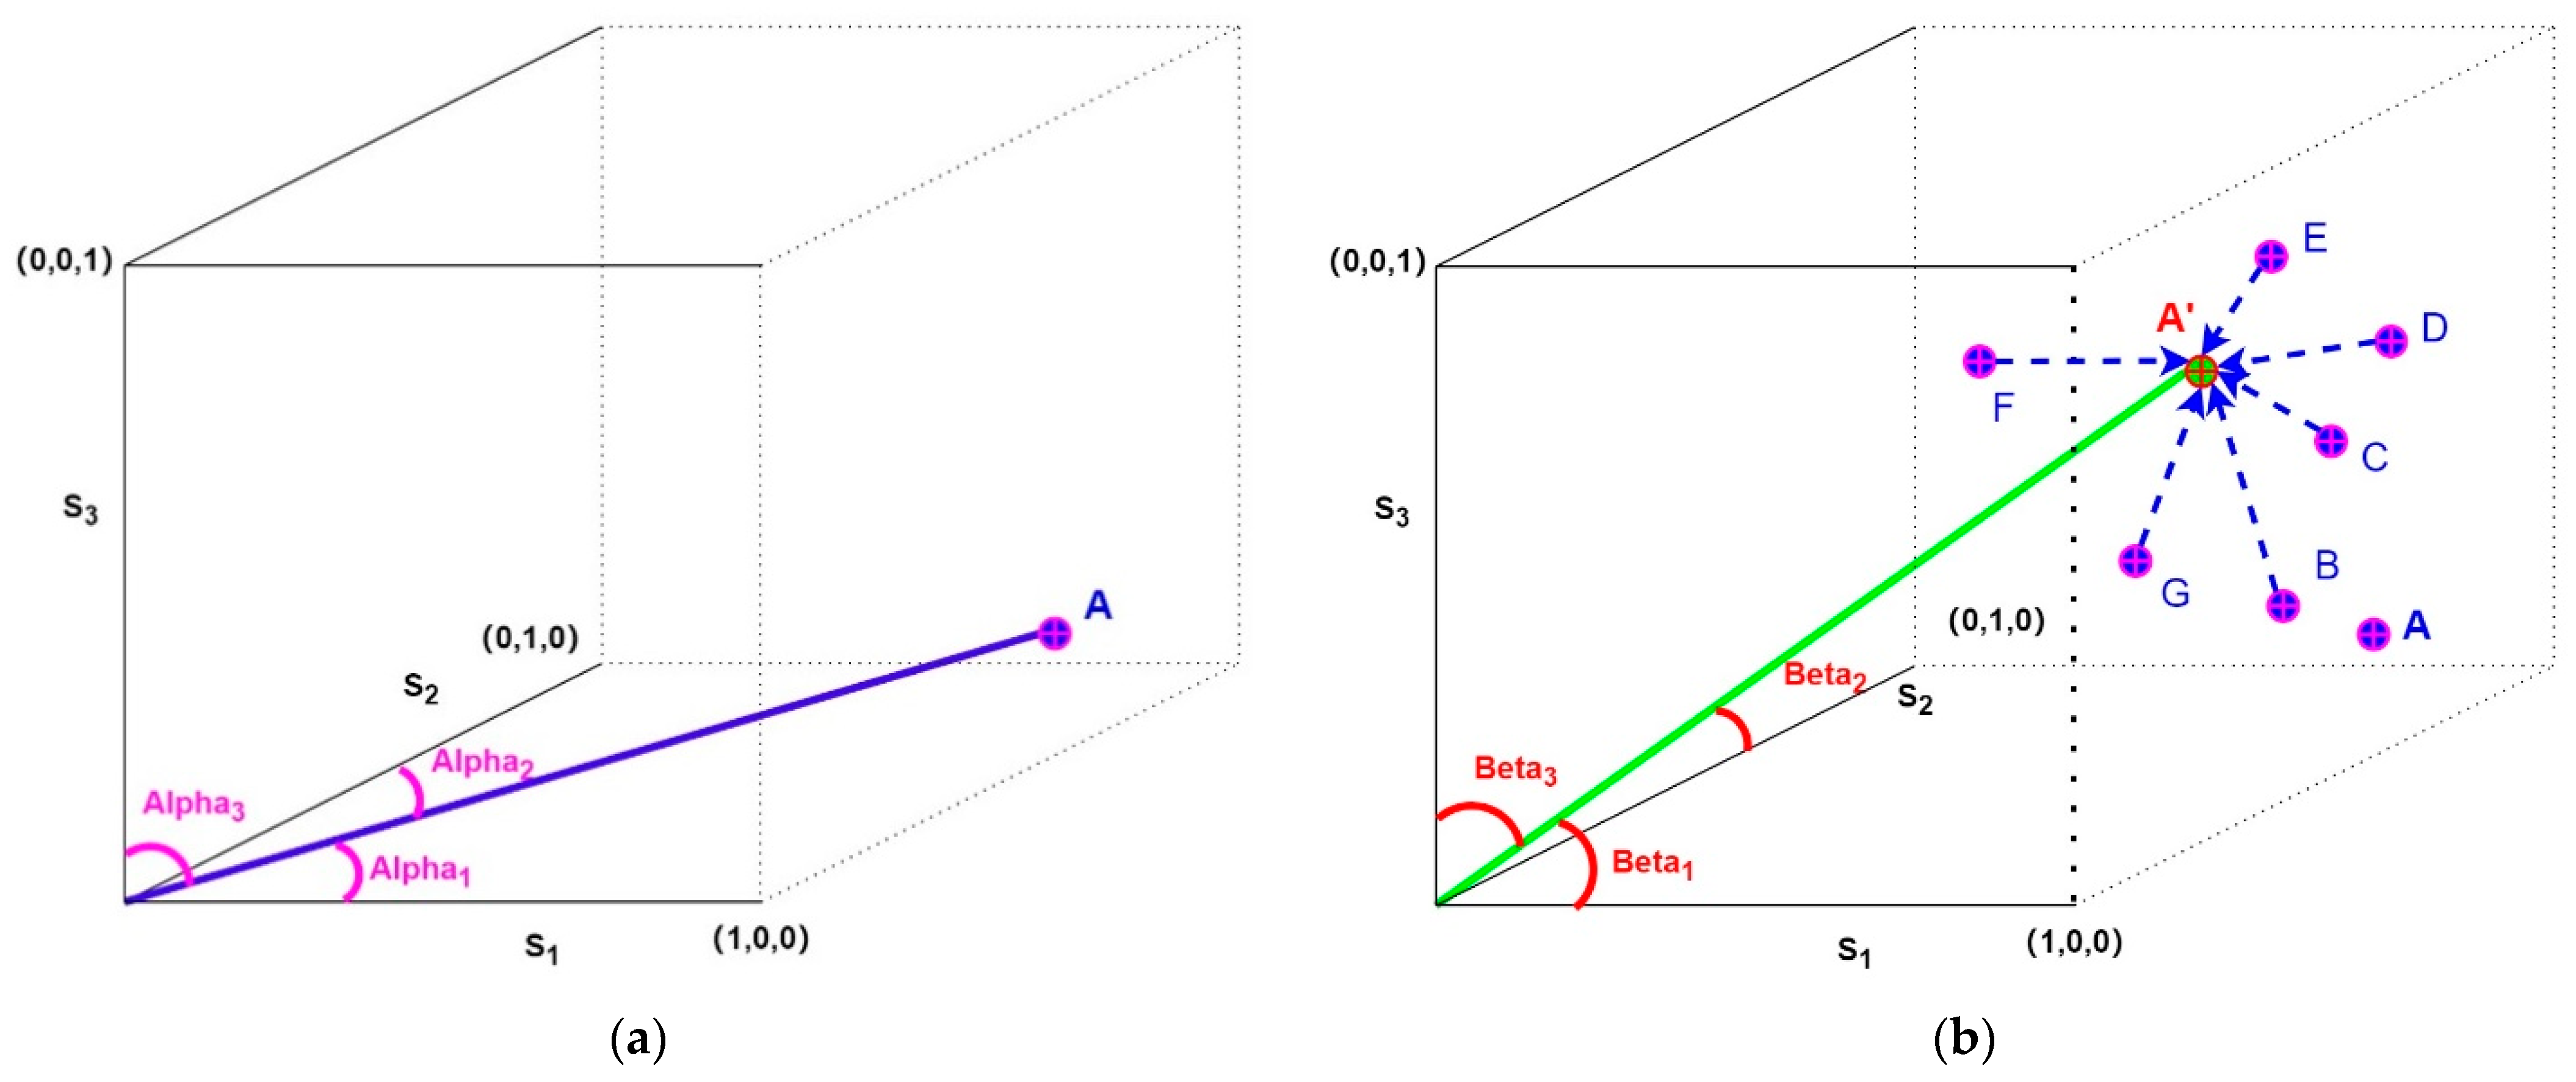
Based on the cosine angle method, Equation (4) defines the cosine angle value for the -th industry category at region during period . The definition of in Equation (4) is similar to that of in Equation (3), except that in Equation (4), the industrial categories are divided into sectors, whereas in Equation (3), they are divided into the three main sectors (primary, secondary, and tertiary industries). In Equation (4), represents a dimensional identity matrix, is the transposed matrix of the -th column vector of matrix , and is the -th element of matrix , where and correspond to the industry sector, , . Figure 1a shows the cosine angles for the primary, secondary, and tertiary industries in a specific region during a specific period when is set to 3. In this case, the industry categories at point A are divided into the primary, secondary, and tertiary industries, with , , and representing the extreme states where the proportions of the three industries at point A are 100%, respectively. When changes from 3 to another value, , , …, represent the cases where the proportions of different industries at point A are 100%.

Figure 1.
The Spatial angles for evaluating industrial spatial structure upgrading at local and projected points. (a) Illustration of the Local Spatial Angle Index; (b) Illustration of the Projected Point Spatial Angle Index. Compiled by the authors using Xunjie Flowchart software V4.6.4.0.
In this paper, we extend the evaluation of industrial structure upgrading to the assessment of industrial spatial structure upgrading by introducing the cosine angle values of projection points, as shown in Figure 1b. In this figure, is the projection of point A, capturing the spatial spillover effects from all other points (including point A itself) onto point A through the spatial weight matrix. As illustrated in Figure 1b, if point A is influenced by spatial effects from points A, B, C, D, E, F, and G, its projection point will depend not only on the industrial structures of these seven points but also on their spatial spillover effects on point A. In this case, the spatial spillover effects are represented by the spatial weight matrix. This matrix is a matrix, where the diagonal elements are 0, and the off-diagonal elements reflect the structural impact of all points that influence point A through spillover effects. Consequently, the spatial weight matrix must be standardized such that the sum of each row equals 1.
According to Figure 1b, Equation (5) defines the cosine angle value for the -th industry category at region during period from a projection perspective. In Equation (5), the definitions of and remain consistent with those in Equation (4). is a matrix formed by the ratio of the added value of different industry categories to the regional gross domestic product (GDP) for all regions in period . The rows of the matrix correspond to the total number of regions, and the columns correspond to the total number of industry categories. is the spatial weight matrix that represents the spatial spillover effects between all pairs of regions. Its rows and columns correspond to the total number of regions. represents the industrial structure ratios for the projection points of each region, where denotes the proportion of the added value of the -th industry at the projection point of region , relative to the total added value of all industries at that projection point.
After defining the cosine angle values for all regions and their projection points based on Equations (4) and (5), this paper uses Equation (6) to define the initial value for evaluating the level of industrial spatial structure upgrading. In Equation (6), represents the initial evaluation value of the level of industrial spatial structure upgrading for region during period , and are defined as in previous sections, and represents a vector where all elements are 1. The definitions of and are similar to , representing matrices of cosine angle values for all industry categories in all regions and for the corresponding industry categories at their projection points, respectively. Both matrices have rows equal to the total number of regions and columns equal to the total number of industry categories.
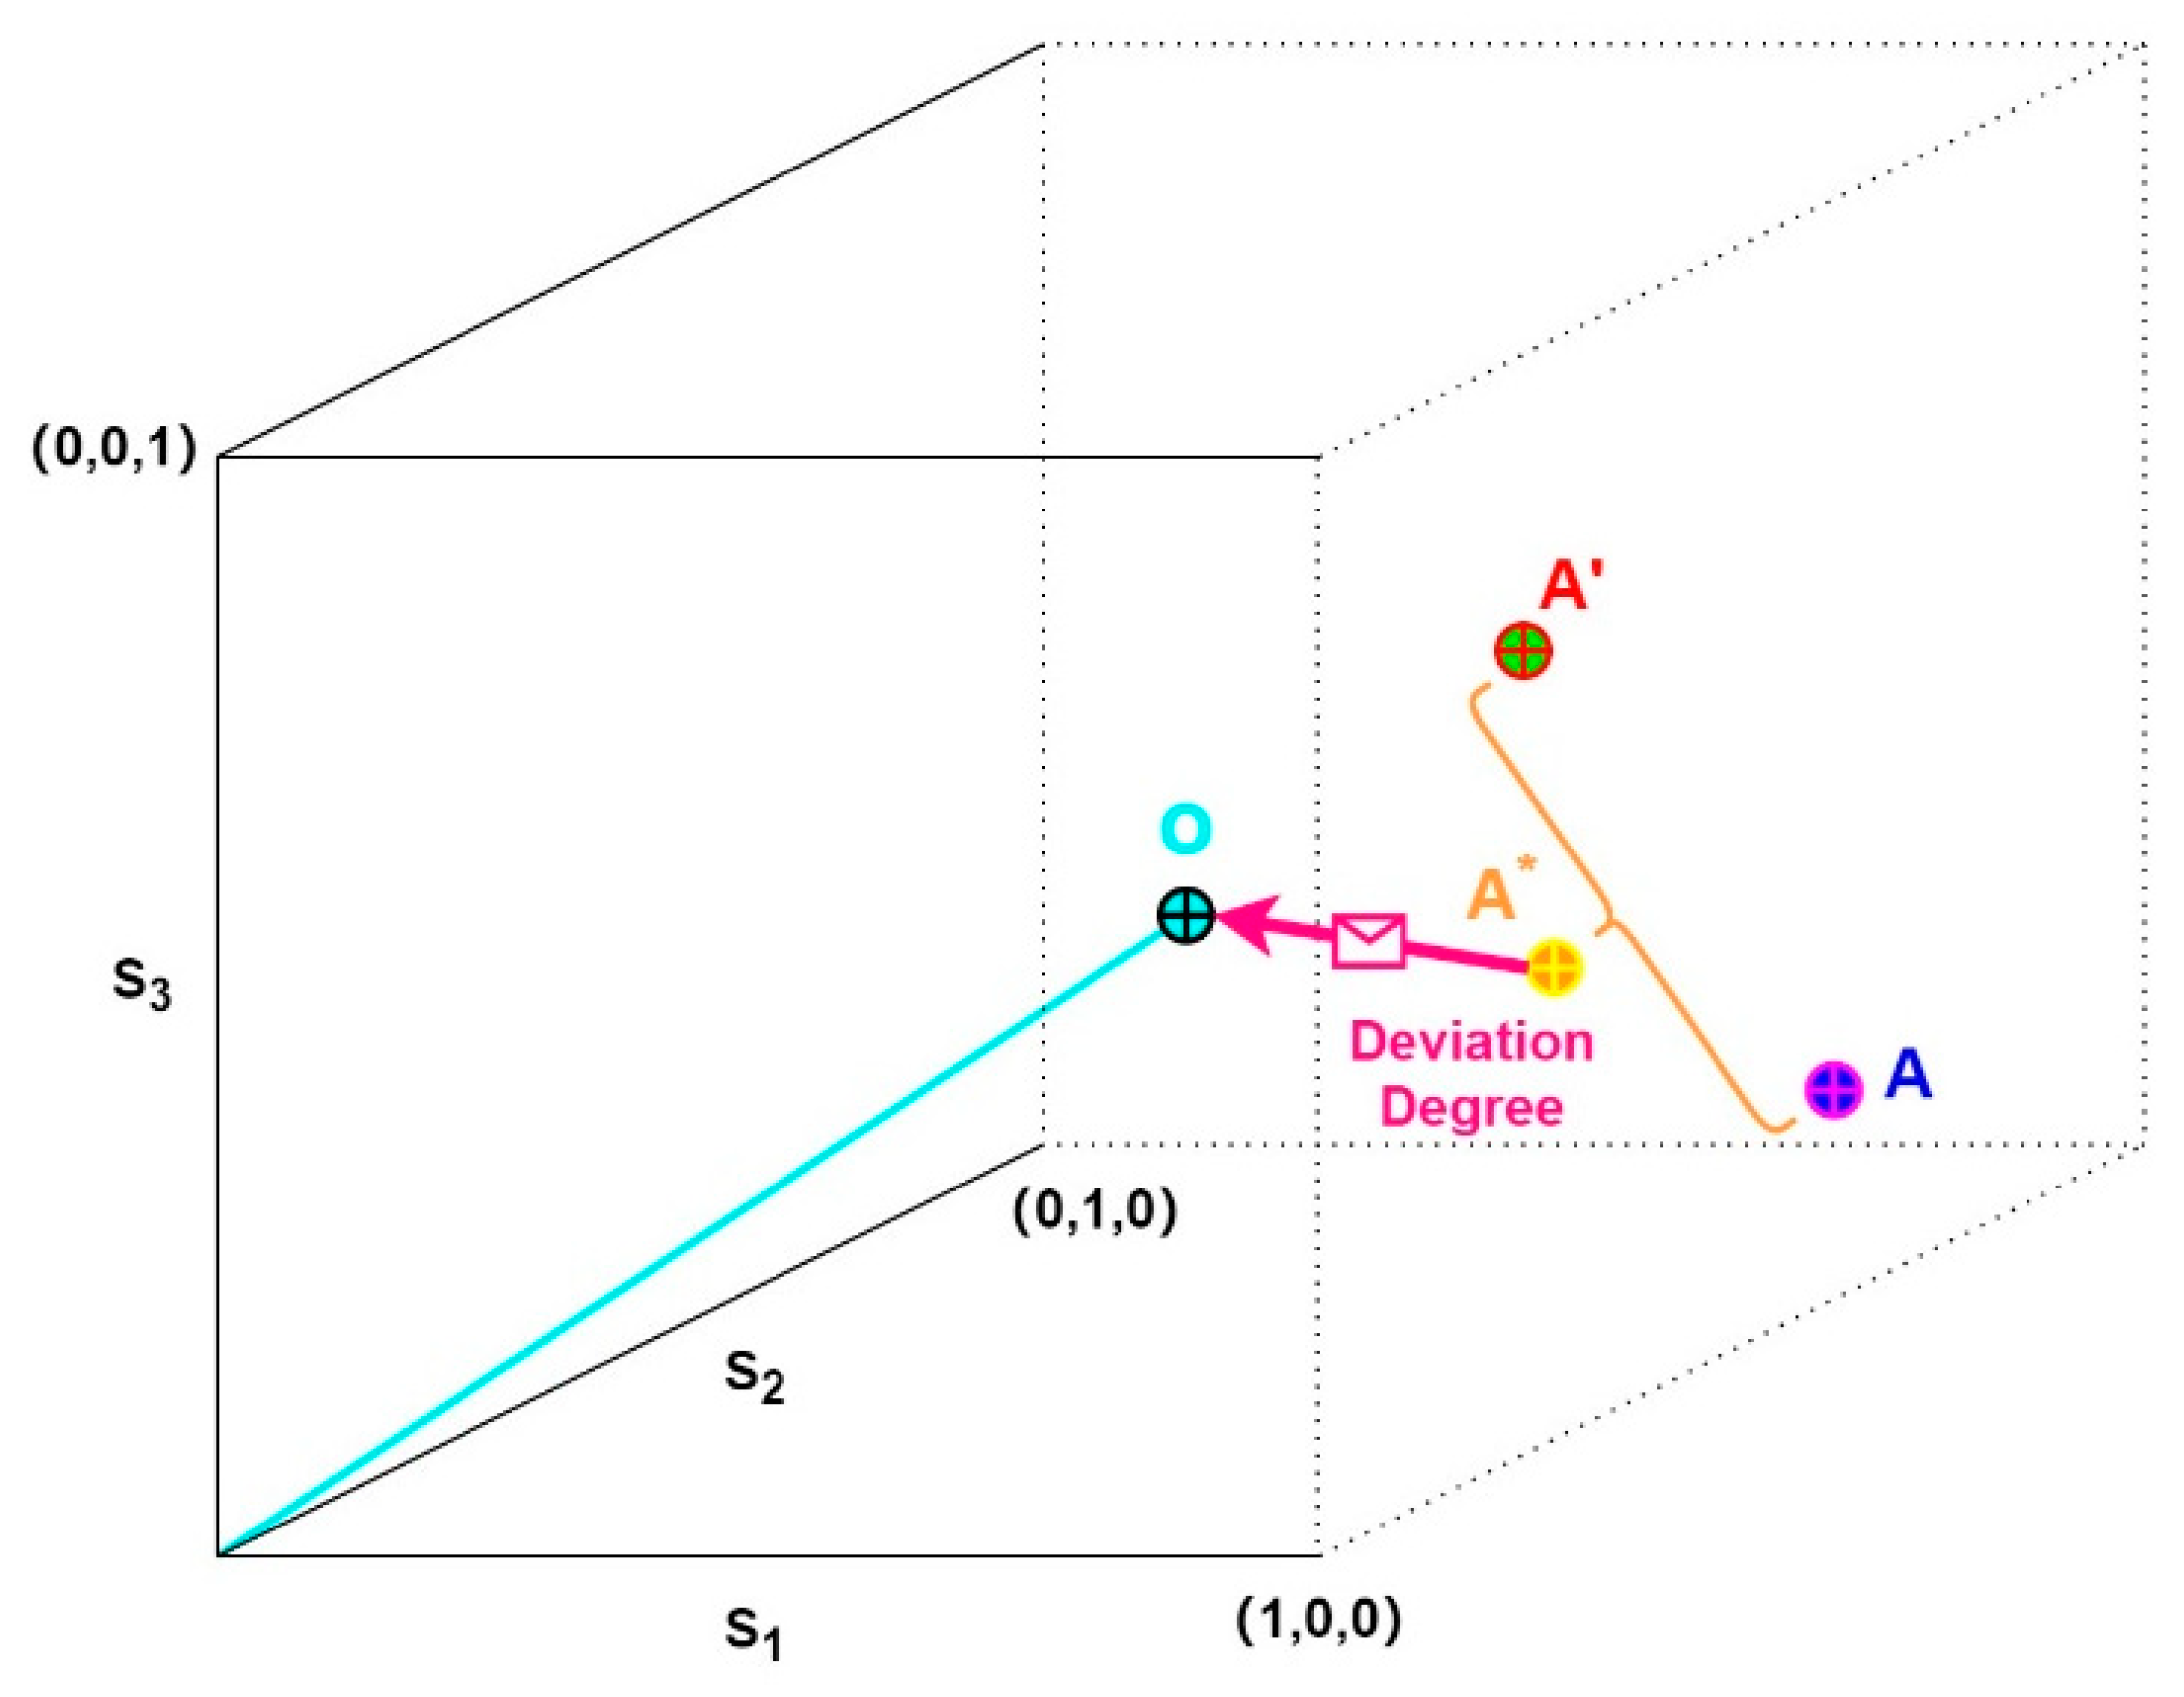
In Equation (6), we preliminarily assess the industrial spatial structure upgrading level of region based on the cosine angle values of point A and its projection point . This evaluates the deviation of the industrial structure in each region and its projection point from the extreme case where the proportion of all industry categories is 100%. In fact, there is another possible extreme scenario in regional industrial development, where the proportions of all industry categories are perfectly equal, as illustrated by point O in Figure 2. We examine this case of equally distributed industrial development and denote its industrial spatial structure upgrading level as , calculating using Equations (4) to (6) under the condition of equal industry proportions. Finally, we determine the final evaluation level of the industrial spatial structure upgrading level for each region () by measuring the deviation of the initial evaluation value from , as shown in Equation (7). Additionally, we denote as the mean level of industrial spatial structure upgrading for all the regions during period .
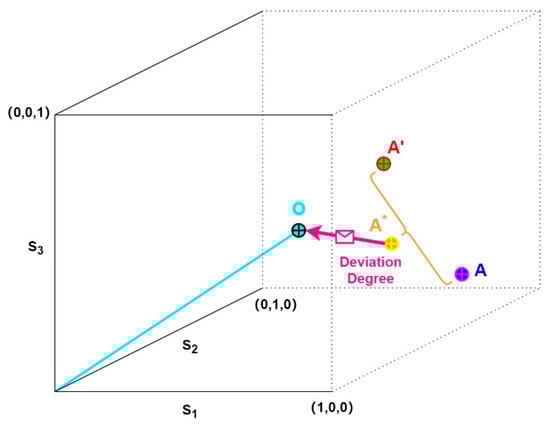
Figure 2.
The degree of deviation of the industrial spatial structure at a specific region from its virtual average industrial structure. Compiled by the authors using Xunjie Flowchart software.
3.3. Sensitivity Analysis of the New Approach: Algorithmic Simulation Through Sampling
To analyze the potential factors influencing the evaluation of the level of industrial spatial structure upgrading based on the new approach, we conducted algorithmic simulations of the method as outlined in Section 3.2 through sampling. Two key issues will be addressed: First, does the setting of the spatial weight matrix affect the evaluation results of industrial spatial structure upgrading? Second, under the same spatial weight matrix setting, do variations in the total number of evaluated regions, the number of evaluation periods, and the number of industrial categories impact the evaluation results of industrial spatial structure upgrading?
3.3.1. Sensitivity Analysis Under Different Spatial Weight Matrix Settings
First, we investigate whether the choice of spatial weight matrix setting influences the evaluation results. With 284 regions, 45 periods (assuming 1978–2022), and 3 industrial categories, we examine two types of spatial weight matrix configurations. The first is a 0-1 element setting, where the off-diagonal elements of the spatial weight matrix are either 0 or 1. The second is based on the inverse square of distance, where the off-diagonal elements are determined by the inverse square of randomly sampled distances.
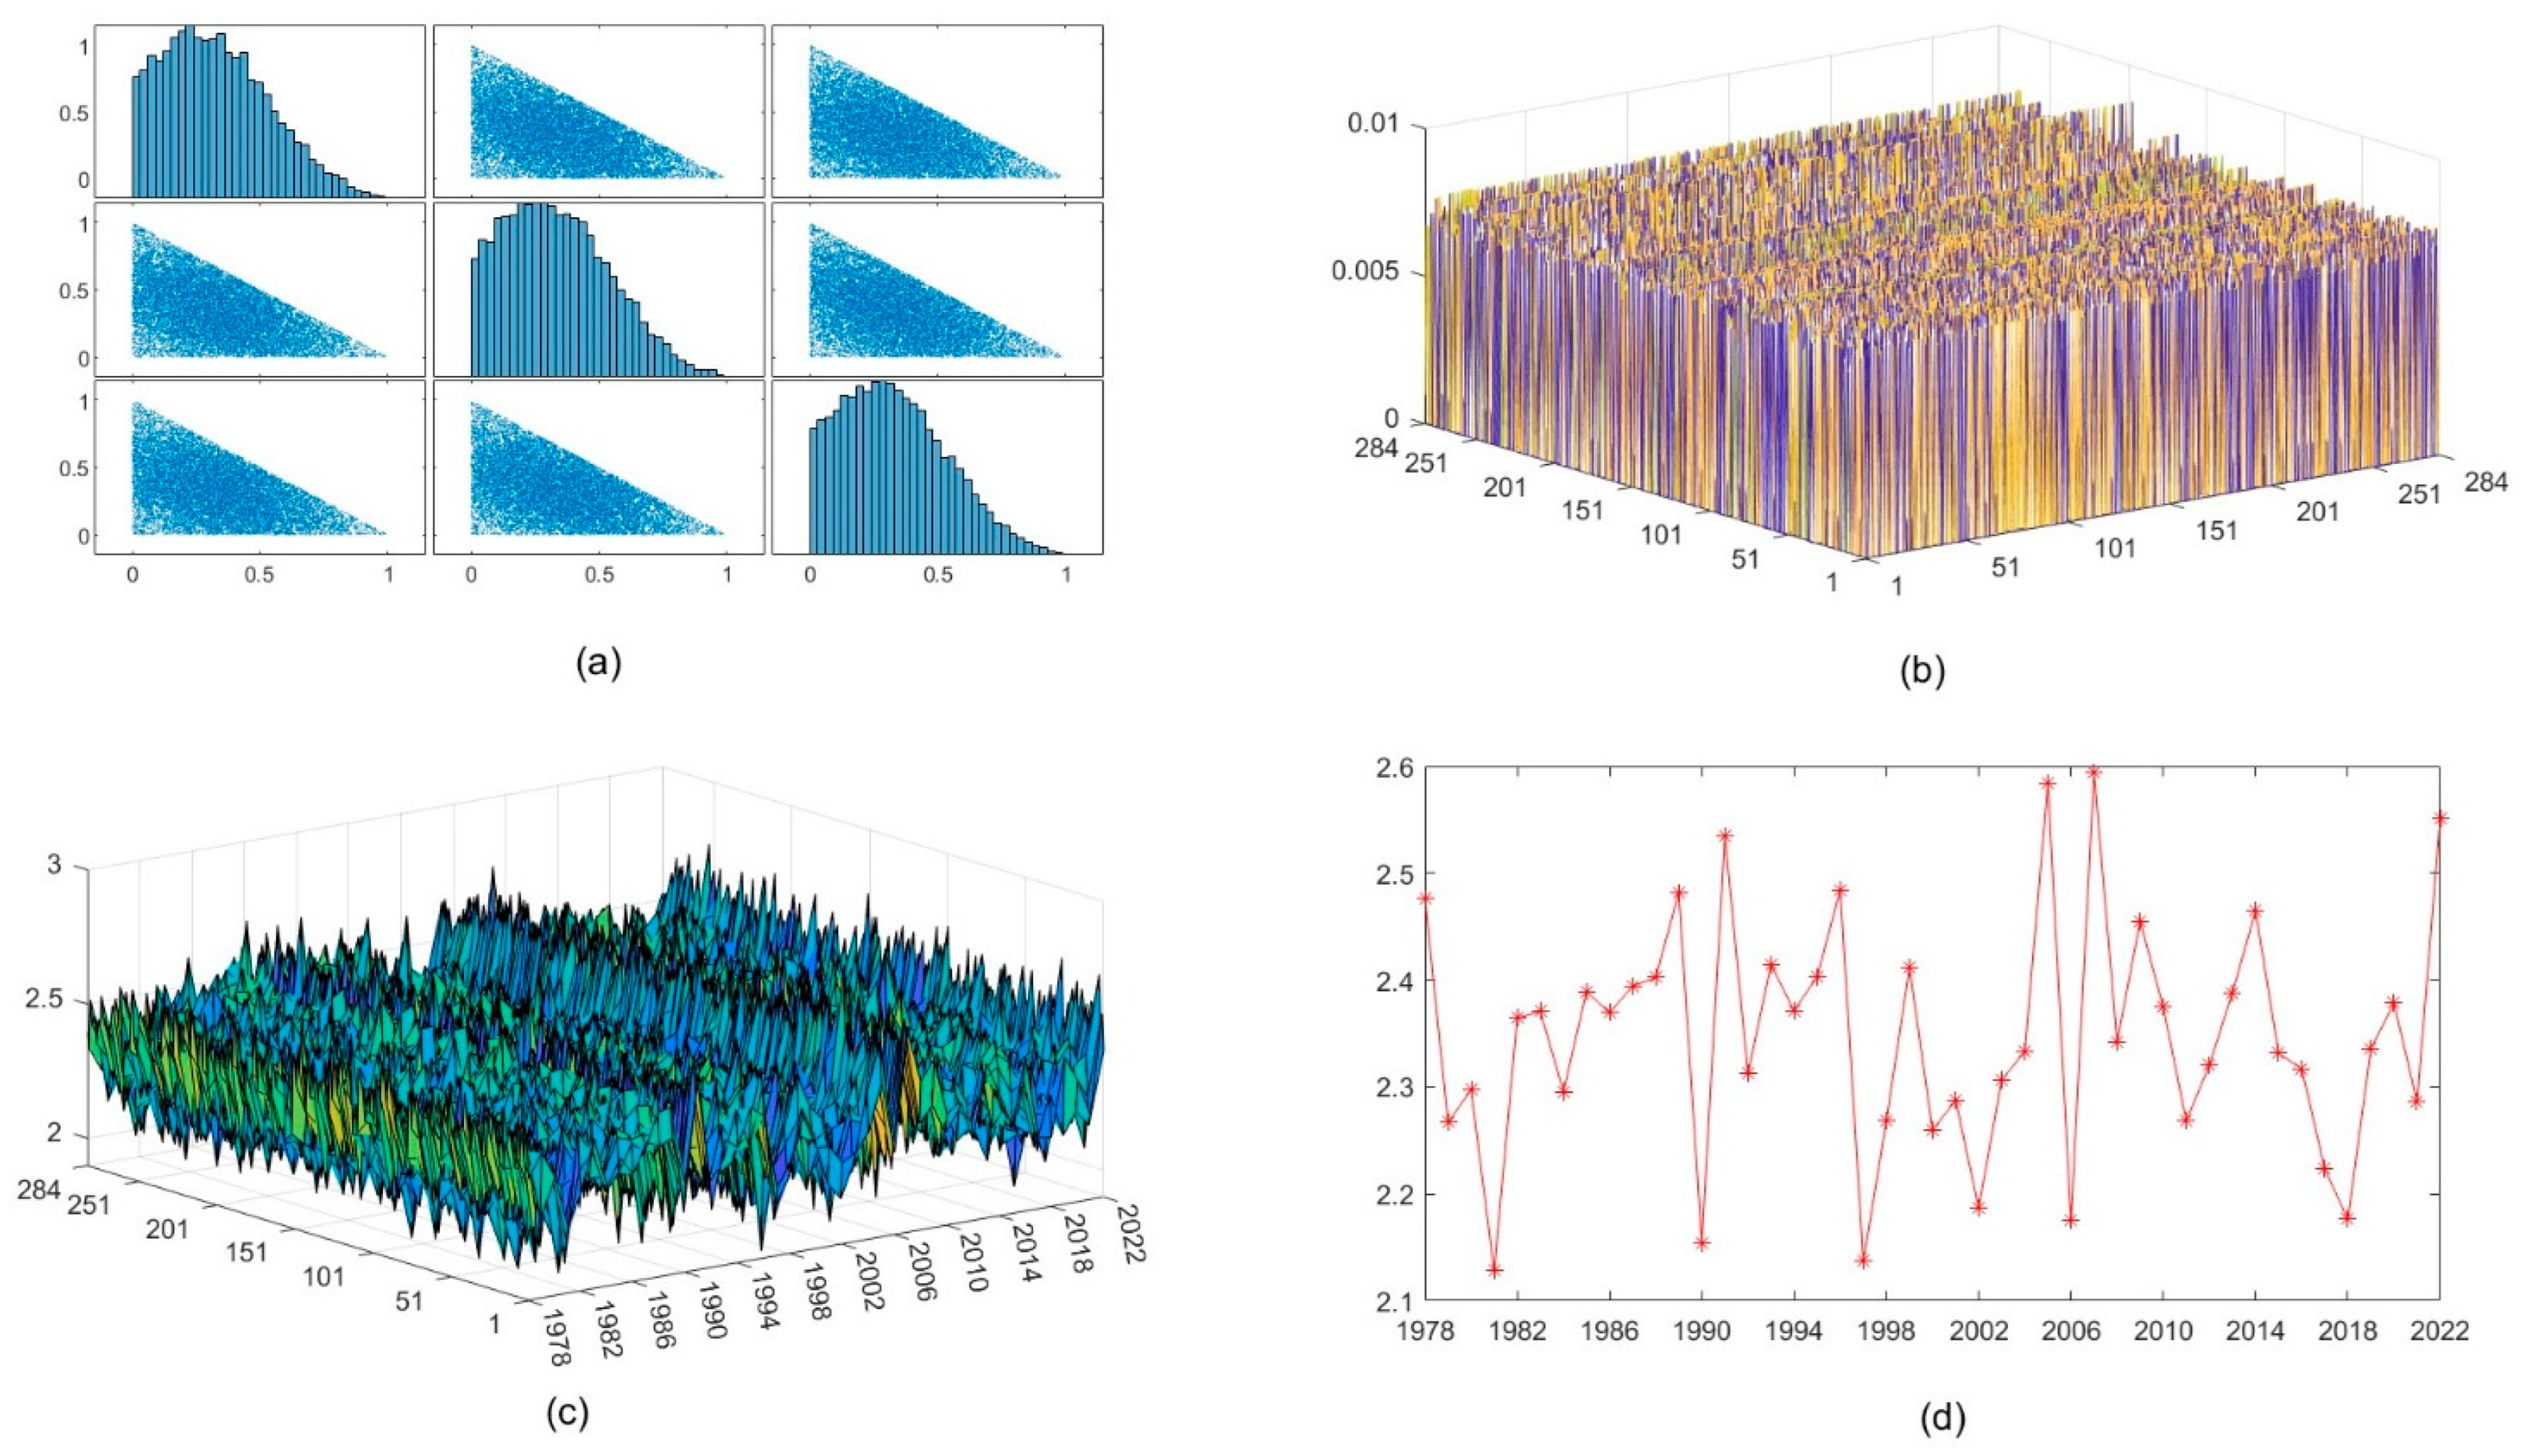
During the sampling process, we follow three steps. In the first step, we randomly sample the industrial added value ratio for all regions and periods. The sampling method used is , and after taking the absolute values, the data are normalized so that the row sums equal 1. This step determines the industrial added value ratios for the three sectors, and their corresponding plot matrices are shown in Figure 3a and Figure 4a. In the second step, we randomly sample the spatial weight matrix, which represents the spatial spillover effects between regions. The sampling method used is . All elements are reduced by 1, and the diagonal elements are replaced with 0. The matrix is then normalized so that the row sums equal 1, resulting in a spatial weight matrix based on the 0-1 method, as shown in Figure 3b.

Figure 3.
Evaluation of the level of industrial spatial structure upgrading based on sampling data. (a) Plot matrix of randomly generated industrial structure data for 284 regions from 1978 to 2022; (b) spatial weight matrix randomly generated for 284 regions using the 0-1 method; (c) evaluation of the level of industrial spatial structure upgrading for 284 regions from 1978 to 2022 based on the sampling data; (d) average evaluation of the level of industrial spatial structure upgrading for regions from 1978 to 2022 based on the sampling data. Compiled by the authors using MATLAB R2024a software and custom programs.
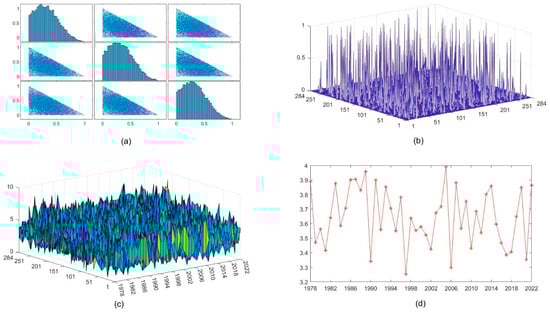
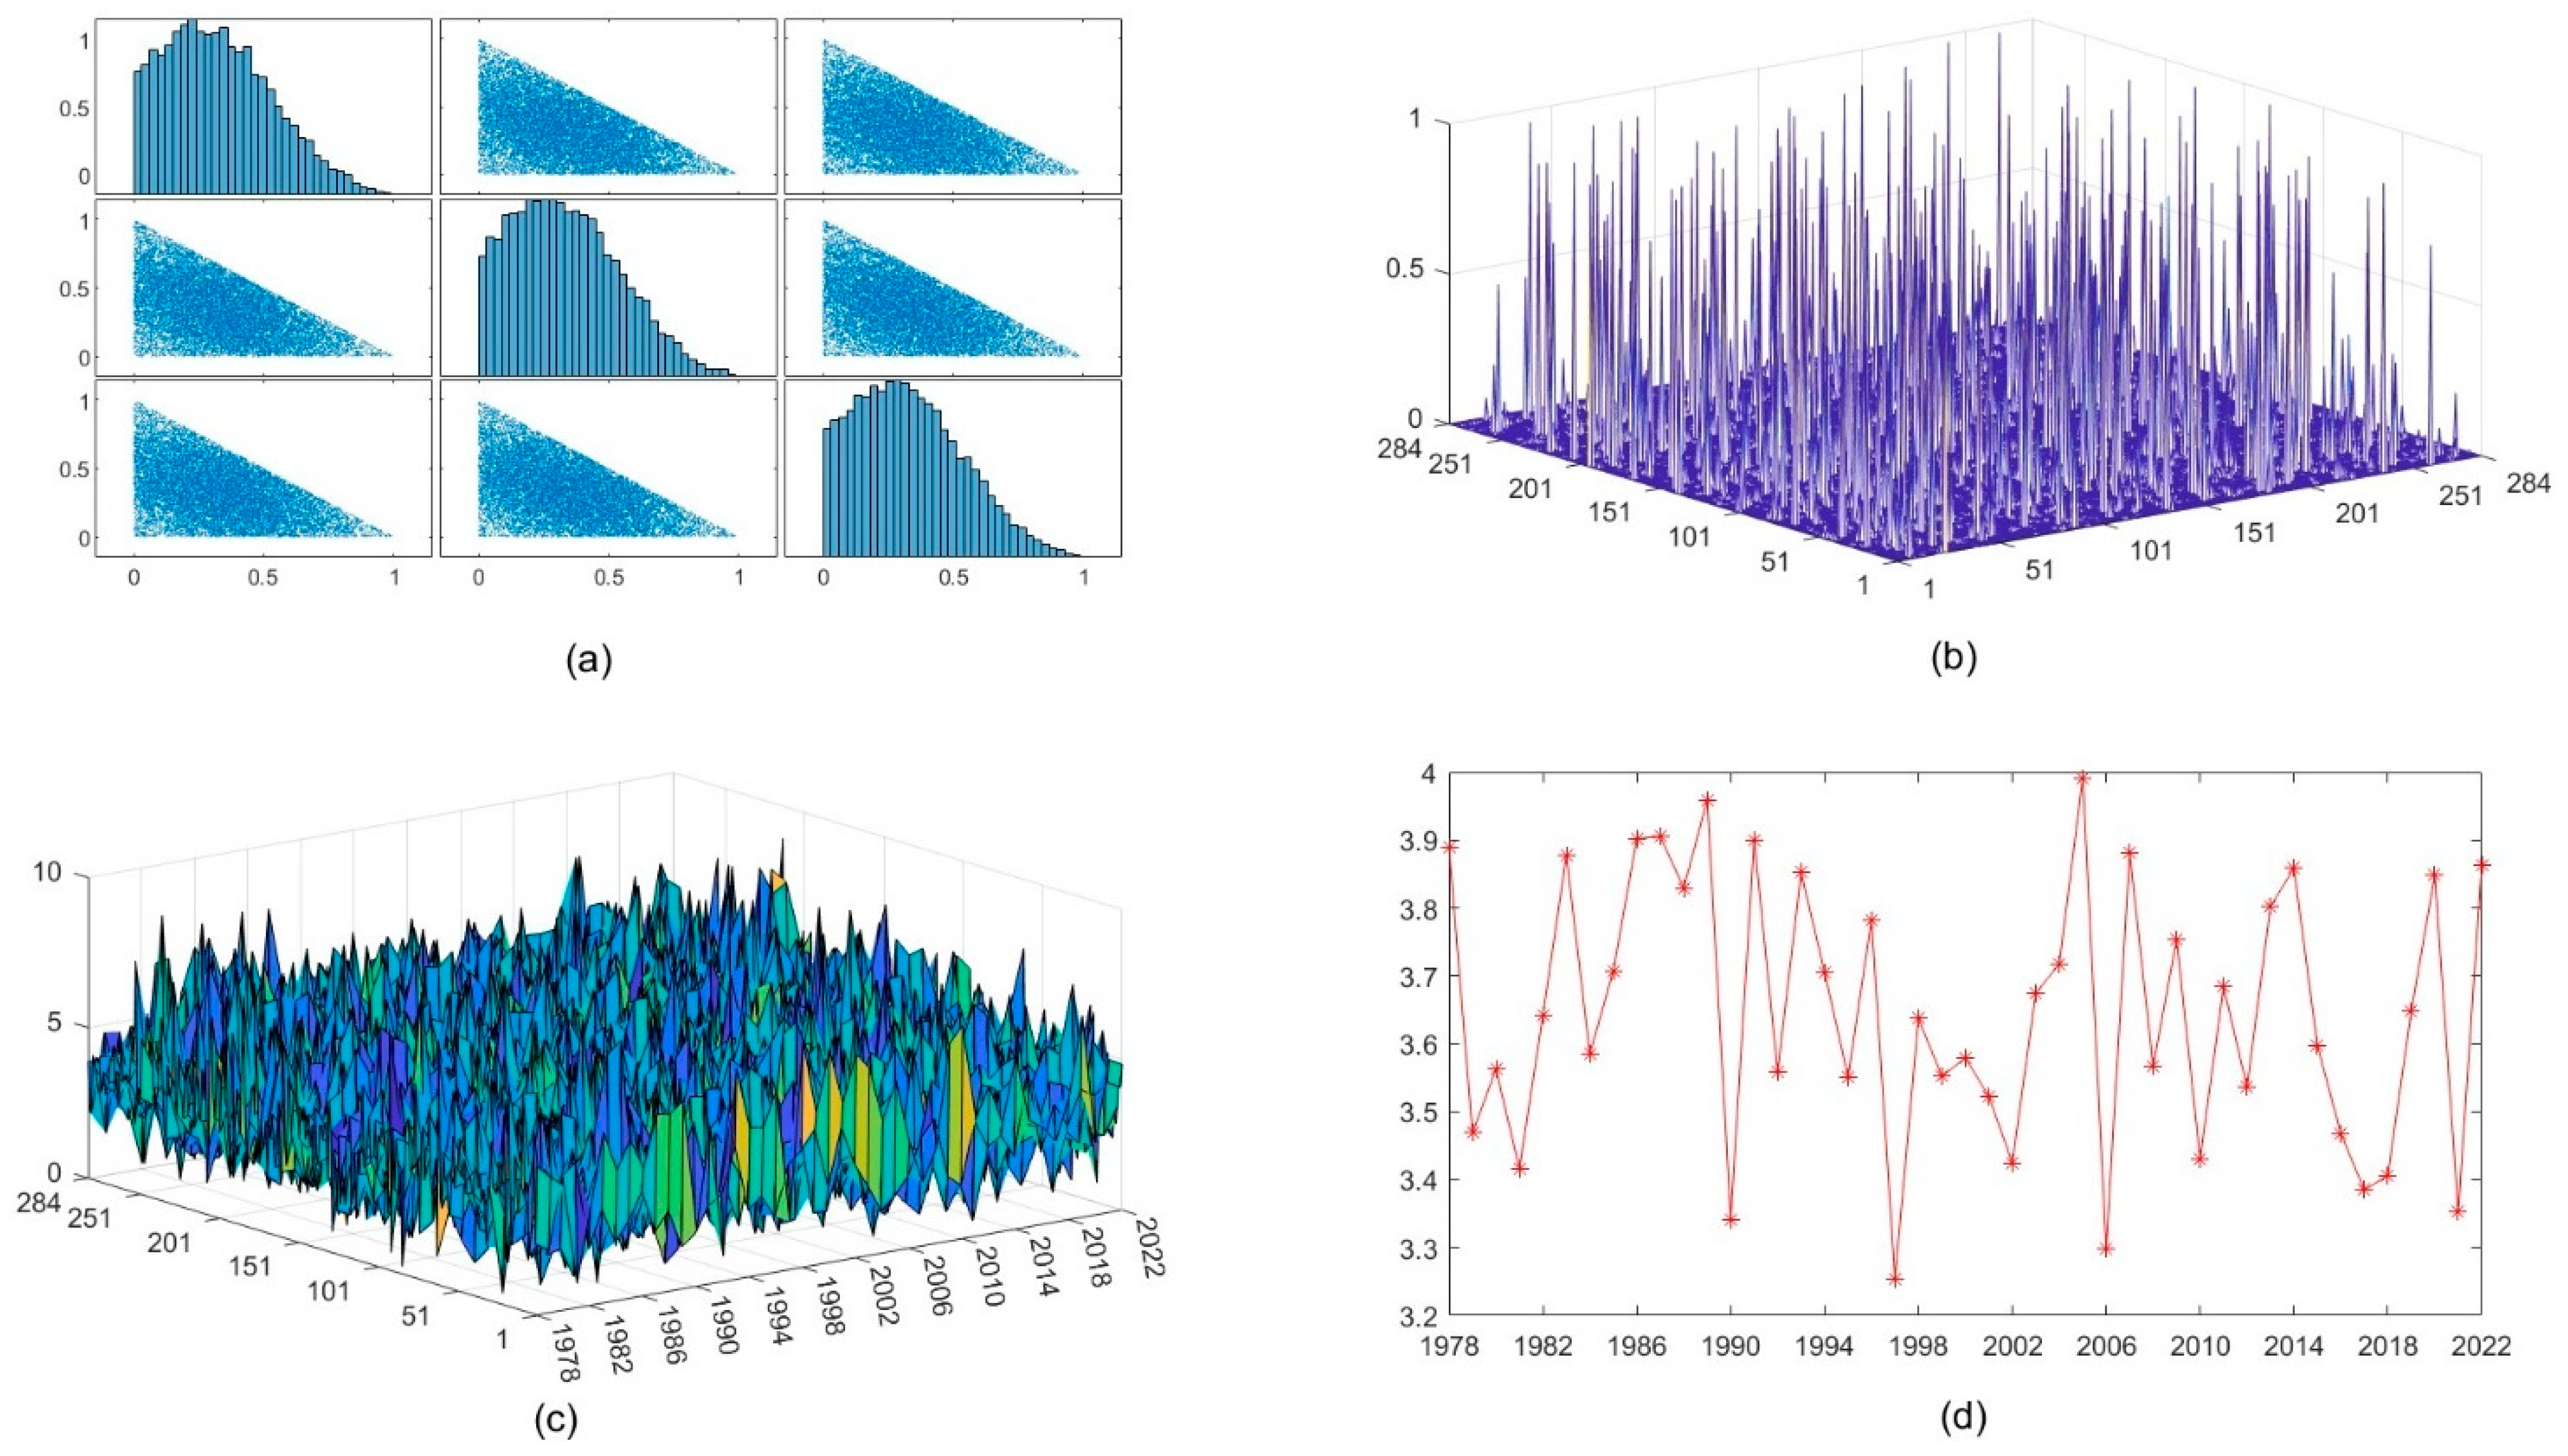
Figure 4.
Evaluation of the level of industrial spatial structure upgrading using different sampling methods for the spatial weight matrix. Subfigures (a–d) are similar to those in Figure 3, with (a) maintaining the same data as in Figure 3a, (b) displaying the spatial weight matrix generated based on the inverse square of the sampling distance, and (c) and (d) showing the evaluation values and average evaluation values for the level of industrial spatial structure upgrading, respectively. Compiled by the authors using MATLAB R2024a software and custom programs.
In the third step, we randomly sample the spatial weight matrix again. The sampling method used is . Each element is multiplied by 1000, and its absolute value is taken to determine the distances between regions. Then, the inverse square of the distances is used to calculate the initial elements of the spatial weight matrix. The matrix is subsequently normalized to ensure that the row sums equal 1, resulting in a spatial weight matrix based on the second method, as shown in Figure 4b.
Next, using the sampled industrial added value ratios and the two different spatial weight matrices, we evaluate the industrial spatial structure upgrading levels for 284 regions over 45 years with the evaluation method outlined in Equations (4) to (7). The results are shown in Figure 3c and Figure 4c. From these results, it is evident that even with the same initial industrial added value ratios, different spatial weight matrix settings led to different evaluation outcomes. Furthermore, we also assess the average industrial spatial structure upgrading levels based on the two spatial weight matrices over the assumed time periods. These results are presented in Figure 3d and Figure 4d. The conclusions from Figure 3d and Figure 4d further confirm that different spatial weight matrix settings result in varying evaluation values for the industrial spatial structure upgrading level.
3.3.2. Sensitivity Analysis with Varying Numbers of Regions, Periods, and Industrial Categories
This paper will next examine whether the inclusion of varying numbers of regions, periods, and industry categories in the evaluation of industrial spatial structure upgrading influences the results. To address this question, three key aspects must be considered: First, when the numbers of periods and industry categories are fixed, whether the number of regions included in the analysis affects the evaluation results of industrial spatial structure upgrading; second, when the numbers of regions and industry categories are fixed, whether the number of periods included in the analysis affects the evaluation results; third, when the numbers of regions and periods are fixed, whether the number of industry categories influences the evaluation outcomes.
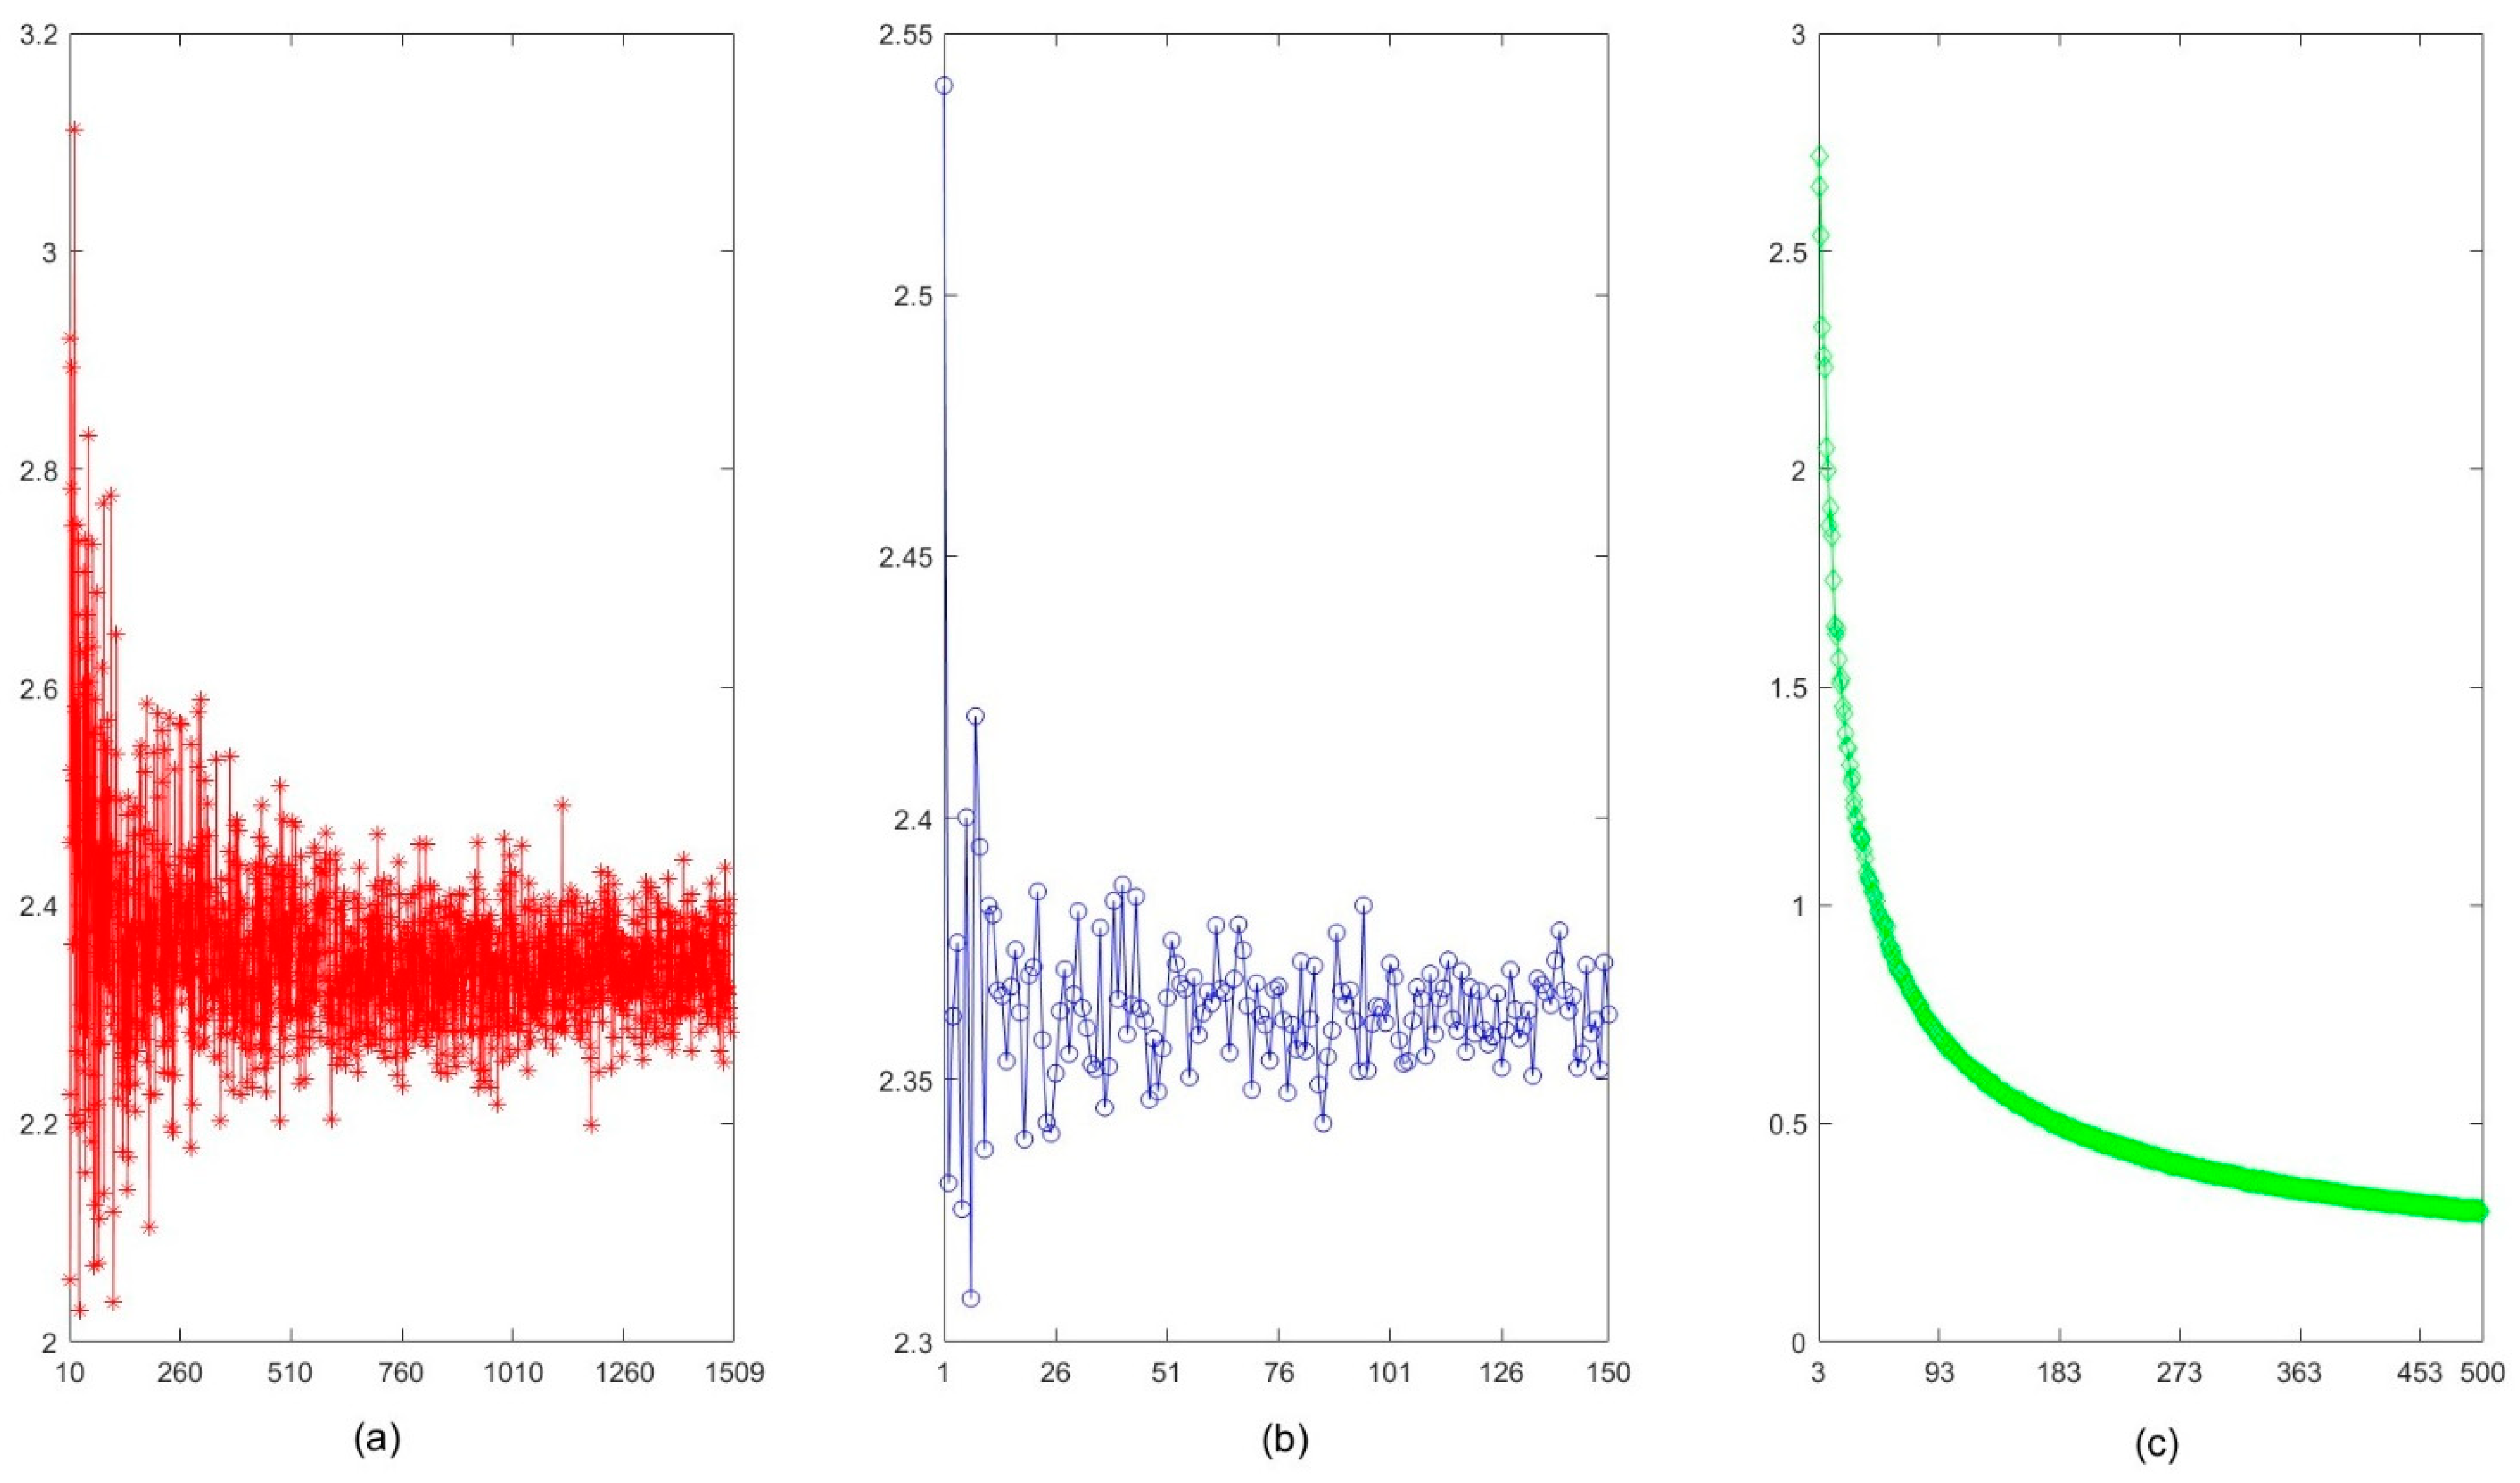
In examining the first aspect, this paper assumes that the number of periods is 1 and the number of industry categories is 3. Based on this, it explores how the level of industrial spatial structure upgrading changes as the number of regions increases from 10 to 1509. The mean evaluation results are presented in Figure 5a. In the examination of the second aspect, the paper assumes the number of regions is 284 and the number of industry categories is 3. It then investigates how the level of industrial spatial structure upgrading changes as the number of periods increases from 1 to 150. The mean evaluation results are shown in Figure 5b. For the third aspect, the paper assumes the number of regions is 284 and the number of periods is 1. It examines how the level of industrial spatial structure upgrading varies as the number of industry categories increases from 3 to 500. The mean evaluation results are displayed in Figure 5c. It is important to note that the detailed analysis of these aspects is based on the first type of spatial weight matrix, meaning that the design of the spatial weight matrix for these examinations relies on random sampling using the 0-1 method described earlier.
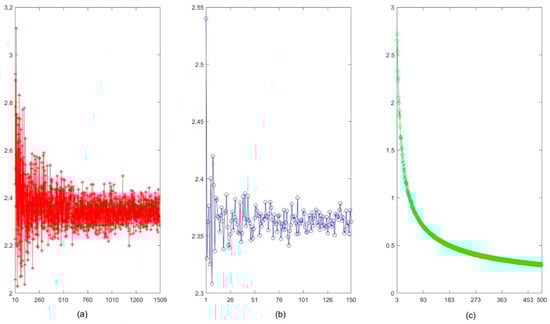
Figure 5.
Sensitivity analysis of the evaluation values for the level of industrial spatial structure upgrading (ISSU) across different regional totals (), time periods (), and industrial classification categories (). (a) Average evaluation values of ISSU as the total number of regions increases from 10 to 1509, with and ; (b) Average evaluation values of ISSU as the total number of time periods increases from 1 to 150, with and ; (c) Average evaluation values of ISSU as the number of industrial classification categories increases from 3 to 500, with and . Compiled by the authors using MATLAB R2024a software and custom programs.
Figure 5a–c show the trends in the mean evaluation results of industrial spatial structure upgrading under varying numbers of regions, periods, and industry categories, based on random sampling of spatial weight matrix elements using the 0-1 method. The trends observed in the three subfigures reveal that the evaluation results exhibit heterogeneity across different combinations of regions, periods, and industry categories. However, as the number of regions, periods, and industry categories included in the analysis increases, the mean evaluation results tend to converge. This convergence is clearly evident in all three subfigures of Figure 5.
4. Application of the New Method: An Evaluation Using Firm Survival Big Data from 284 Chinese Cities Across 96 Industry Categories (1978–2022)
4.1. Defining Evaluation Details
Building on the aforementioned novel method and leveraging firm survival big data from 96 industries across 284 Chinese cities from 1978 to 2022, this paper conducts a comprehensive evaluation of industrial spatial structure upgrading in these cities over the same period. The evaluation process comprises five key aspects:
- (1)
- Definition of the 284 cities: This study focuses on cities at or above the prefecture level within the 31 provinces, autonomous regions, and municipalities of mainland China, as listed in Table 1. It is worth noting that, according to the China Statistical Yearbook (2024) [31], there are a total of 297 cities at or above the prefecture level in Mainland China, including the four municipalities directly under the central government: Beijing, Tianjin, Shanghai, and Chongqing. For the sake of data completeness, this study selects 284 prefecture-level cities, as shown in Table 1, while the remaining 13 cities are excluded from the analysis framework due to issues such as administrative restructuring or incomplete data during the analysis period.
 Table 1. Cities included in the evaluation and their corresponding order.
 - (2)
- Definition of the time period: The study selects 1978 as the starting year, given its significance as the beginning of China’s reform and opening-up, a milestone in the country’s industrial transformation. As data beyond 2023 in all the cities have not yet been updated, the study period extends until 2022.
- (3)
- Industry classification: The evaluation of industrial spatial structure upgrading across 284 cities from 1978 to 2022 is based on data from 96 sub-industries, classified according to the Chinese national standard GB/T 4754-2017 [32], as detailed in Table 2.
Table 2. Industry categories, corresponding numbers, and their major groupings.
- (4)
- Determination of industrial proportions: The study quantifies each city’s industrial proportion based on the share of surviving firms in a given industry relative to the total number of firms in that city for a specific period. To achieve this, Python 3.12 was used to collect firm registration data from the “Tianyancha” website, covering all registered firms in China, with data collection conducted from July to September 2024. The survival status of firms was determined based on their registration and operational years, allowing attribution to specific years and cities. Using each firm’s industry classification, the number of surviving firms across 96 sub-industries in 284 cities from 1978 to 2022 was determined. Finally, the industrial proportion for each city in a given year was calculated as the ratio of surviving firms in a specific industry to the total surviving firms across all industries in that city.
- (5)
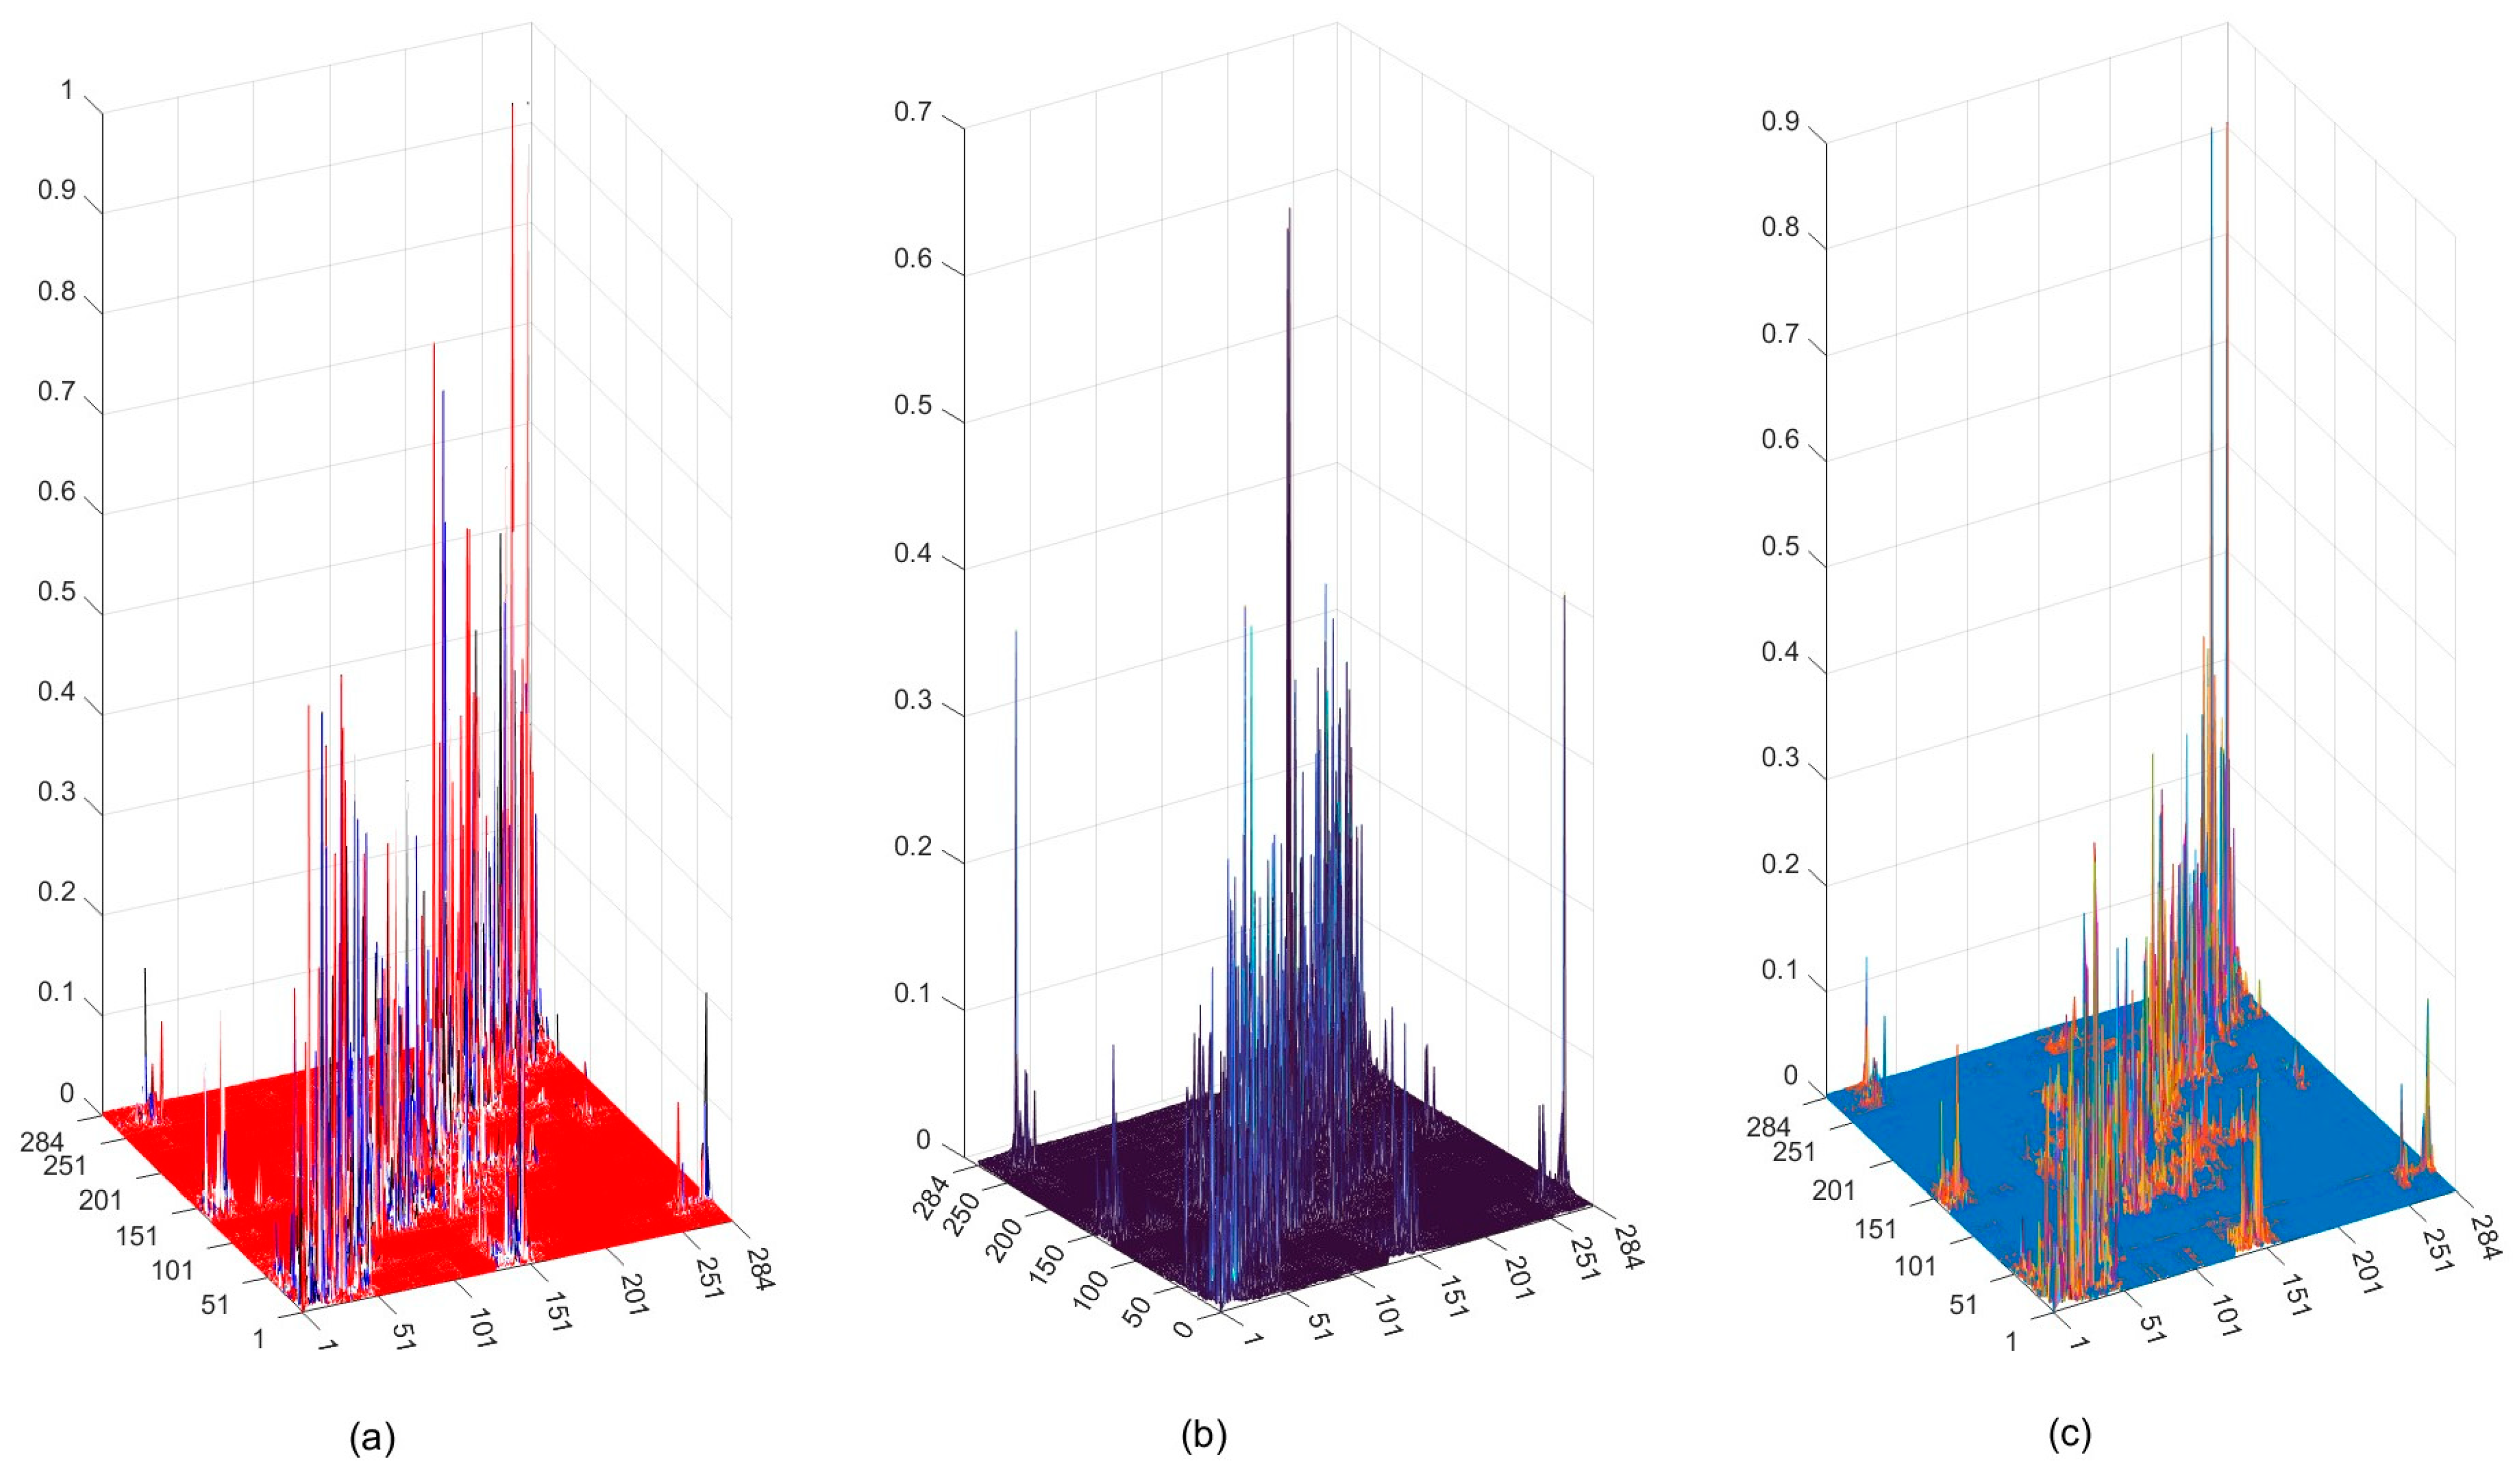
- Construction of spatial weight matrices: To analyze spatial spillover effects among the 284 cities, this study constructs three types of spatial weight matrices. W1 is based on the inverse square of commuting distance between cities, W2 on the inverse square of geodetic distance, and W3 on the inverse square of commuting time. Commuting distances and times between cities are derived from municipal government locations, obtained using Python and the Gaode Map API. Geodetic (latitude–longitude) distances between cities are calculated using ArcGIS 10.8The three types of spatial weight matrices are illustrated in Figure 6.
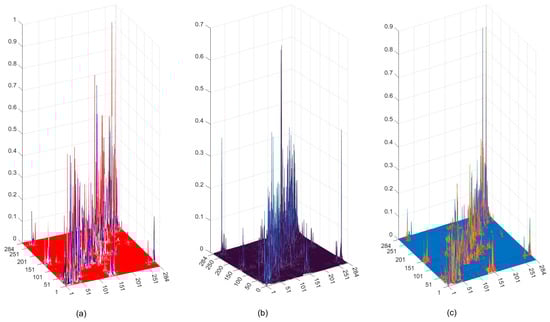 Figure 6. The three types of spatial weight matrices for 284 cities. (a) W1, based on commuting distance; (b) W2, based on geodetic distance; (c) W3, based on commuting time. Compiled by the authors using MATLAB R2024a software and custom programs.
4.2. Evaluation Results of Industrial Spatial Structure Upgrading Levels and Their Dynamic Evolution for 284 Cities in China (1978–2022)
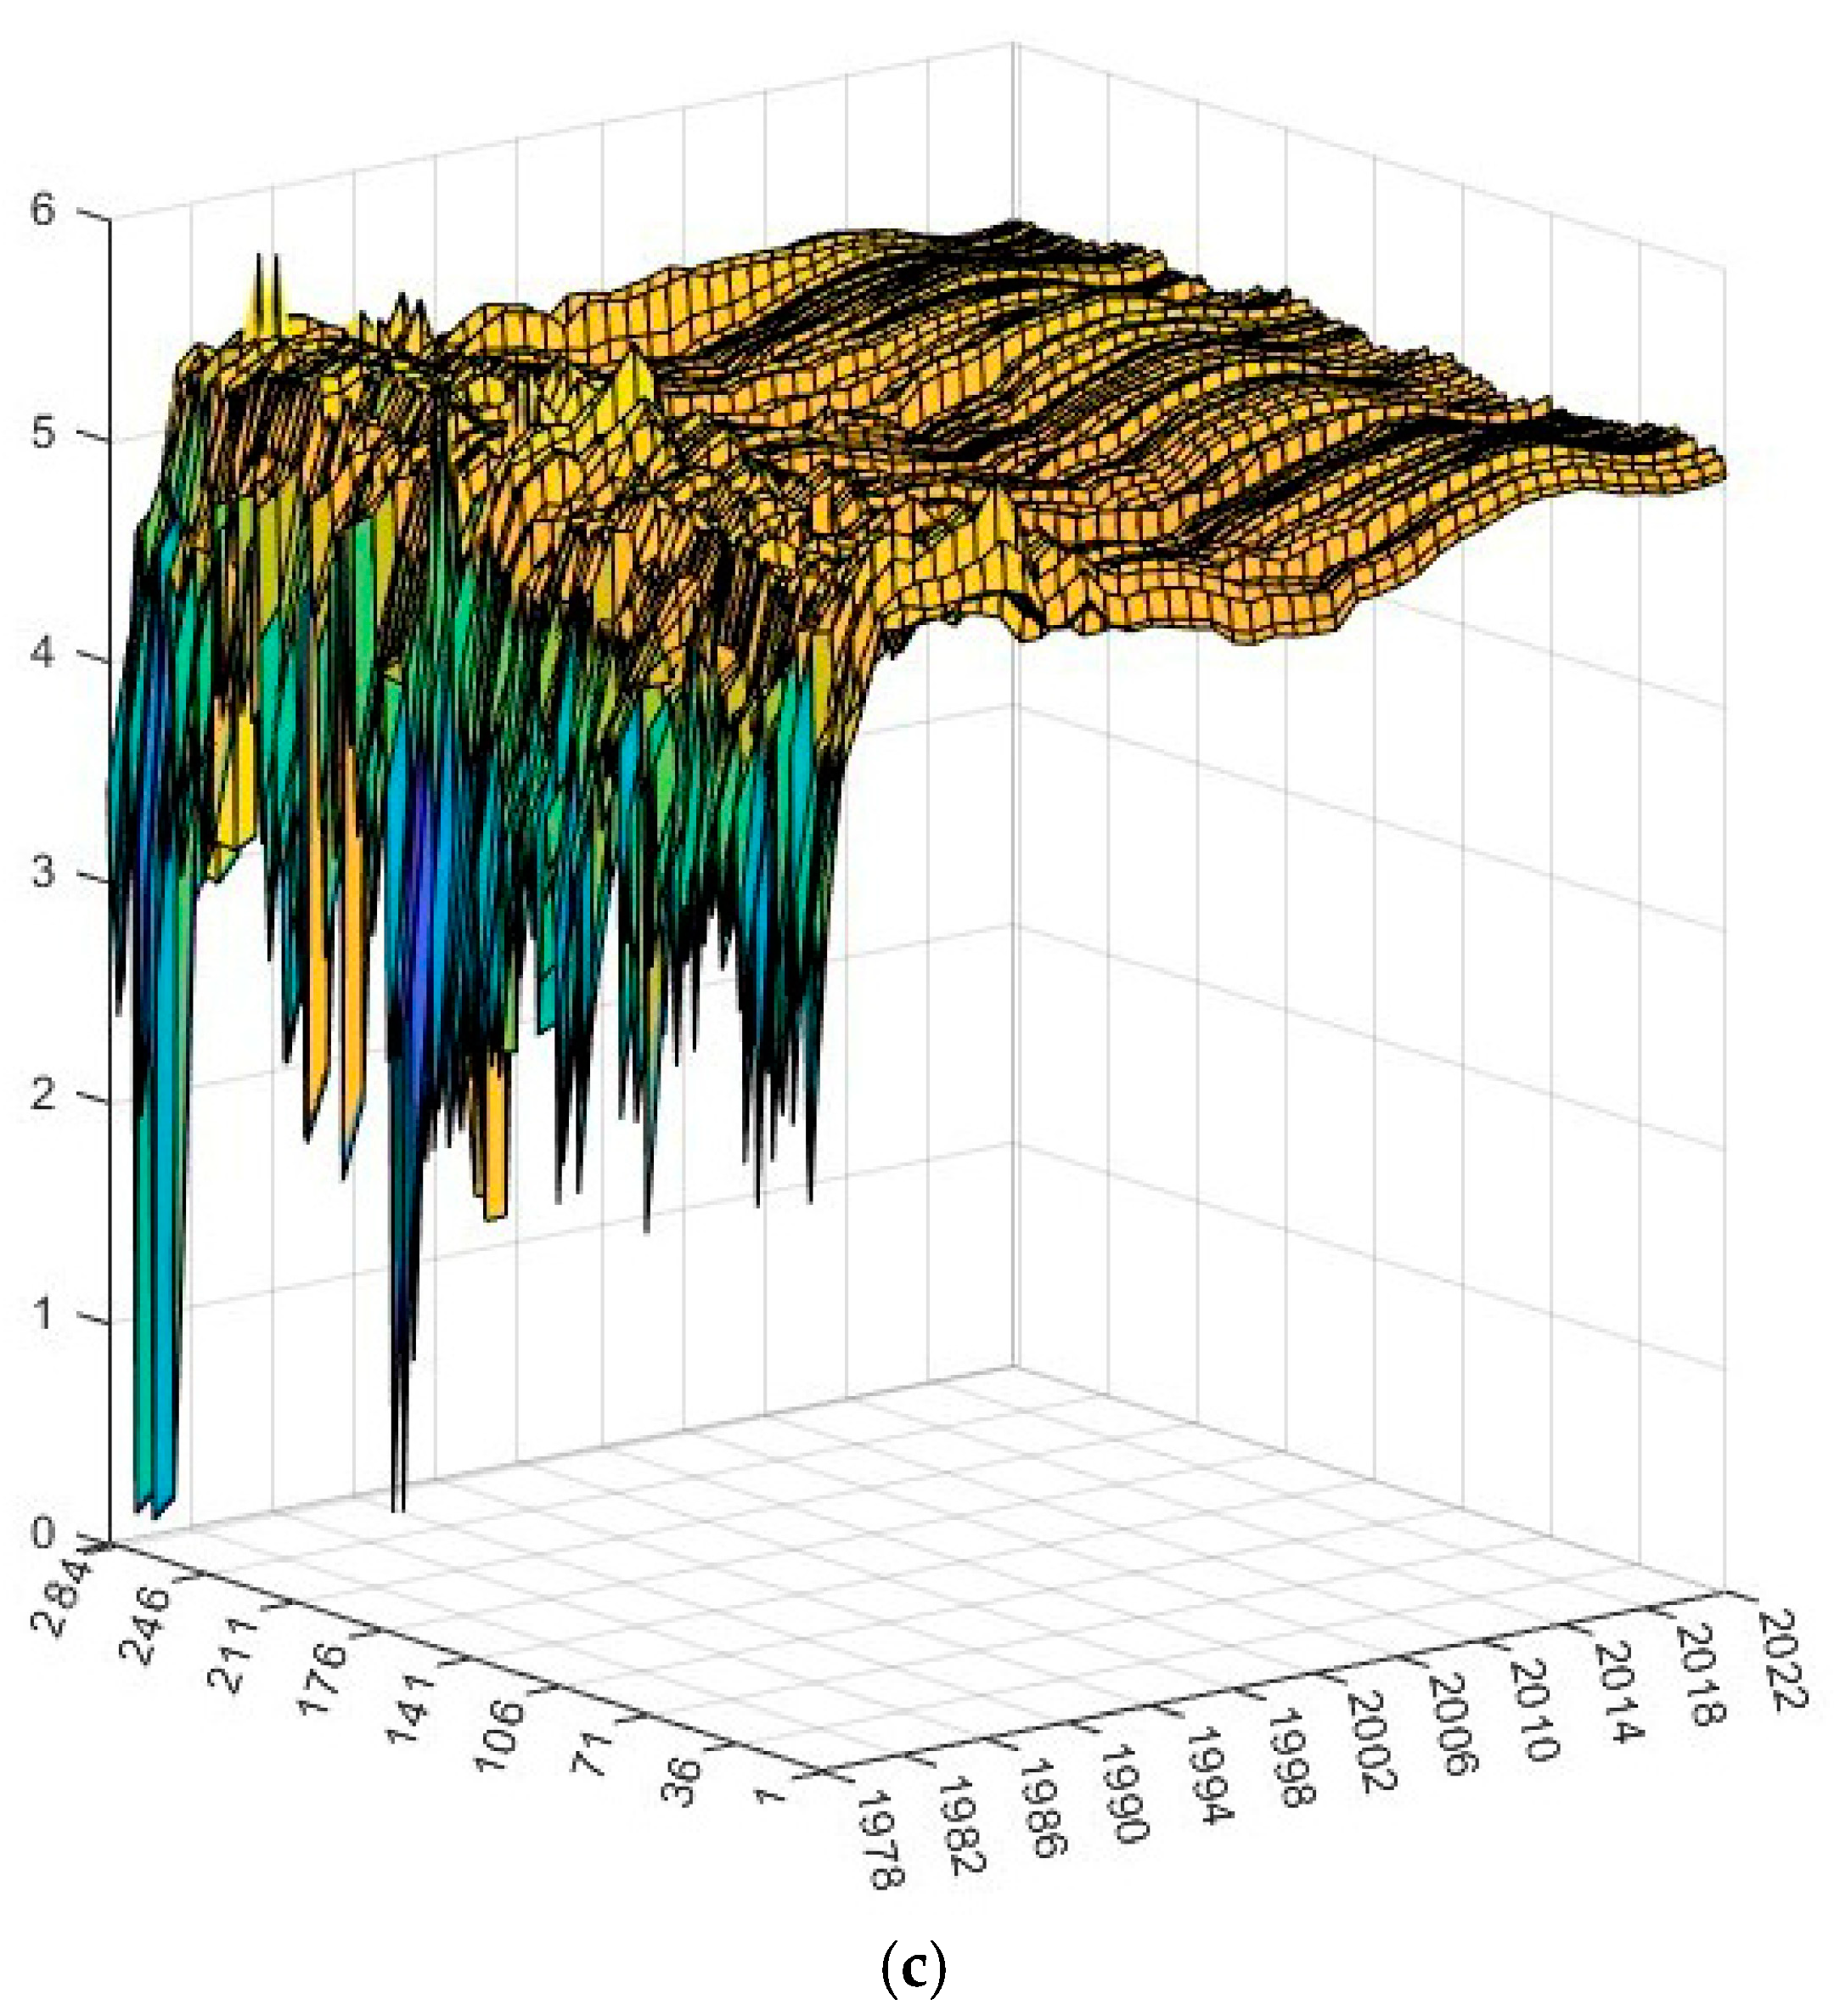
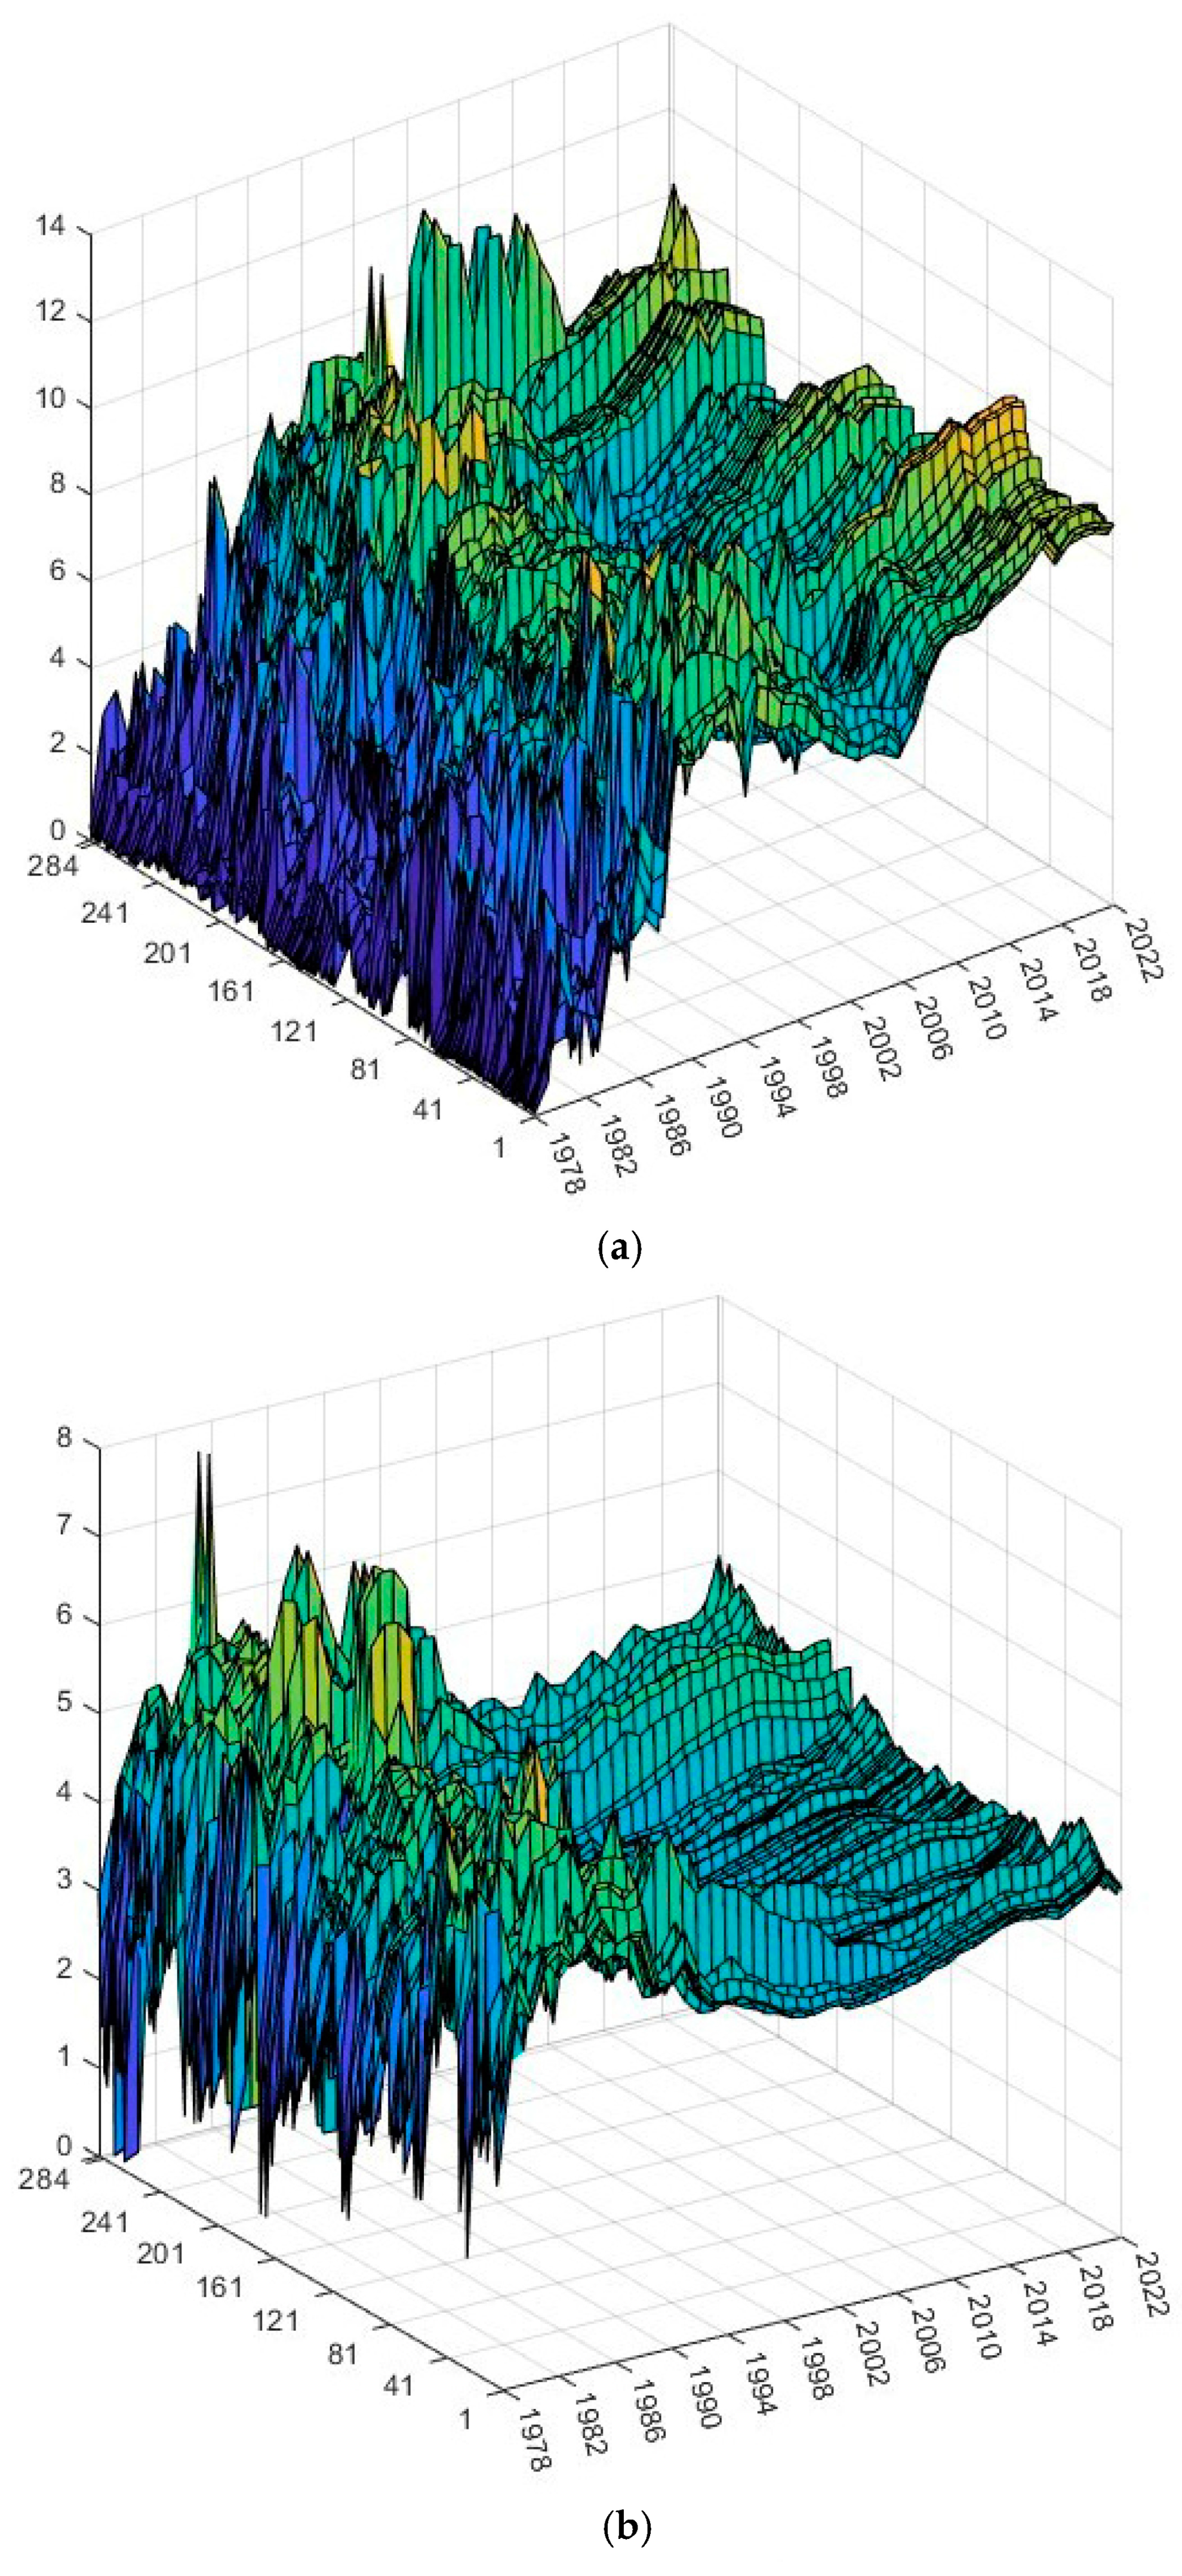
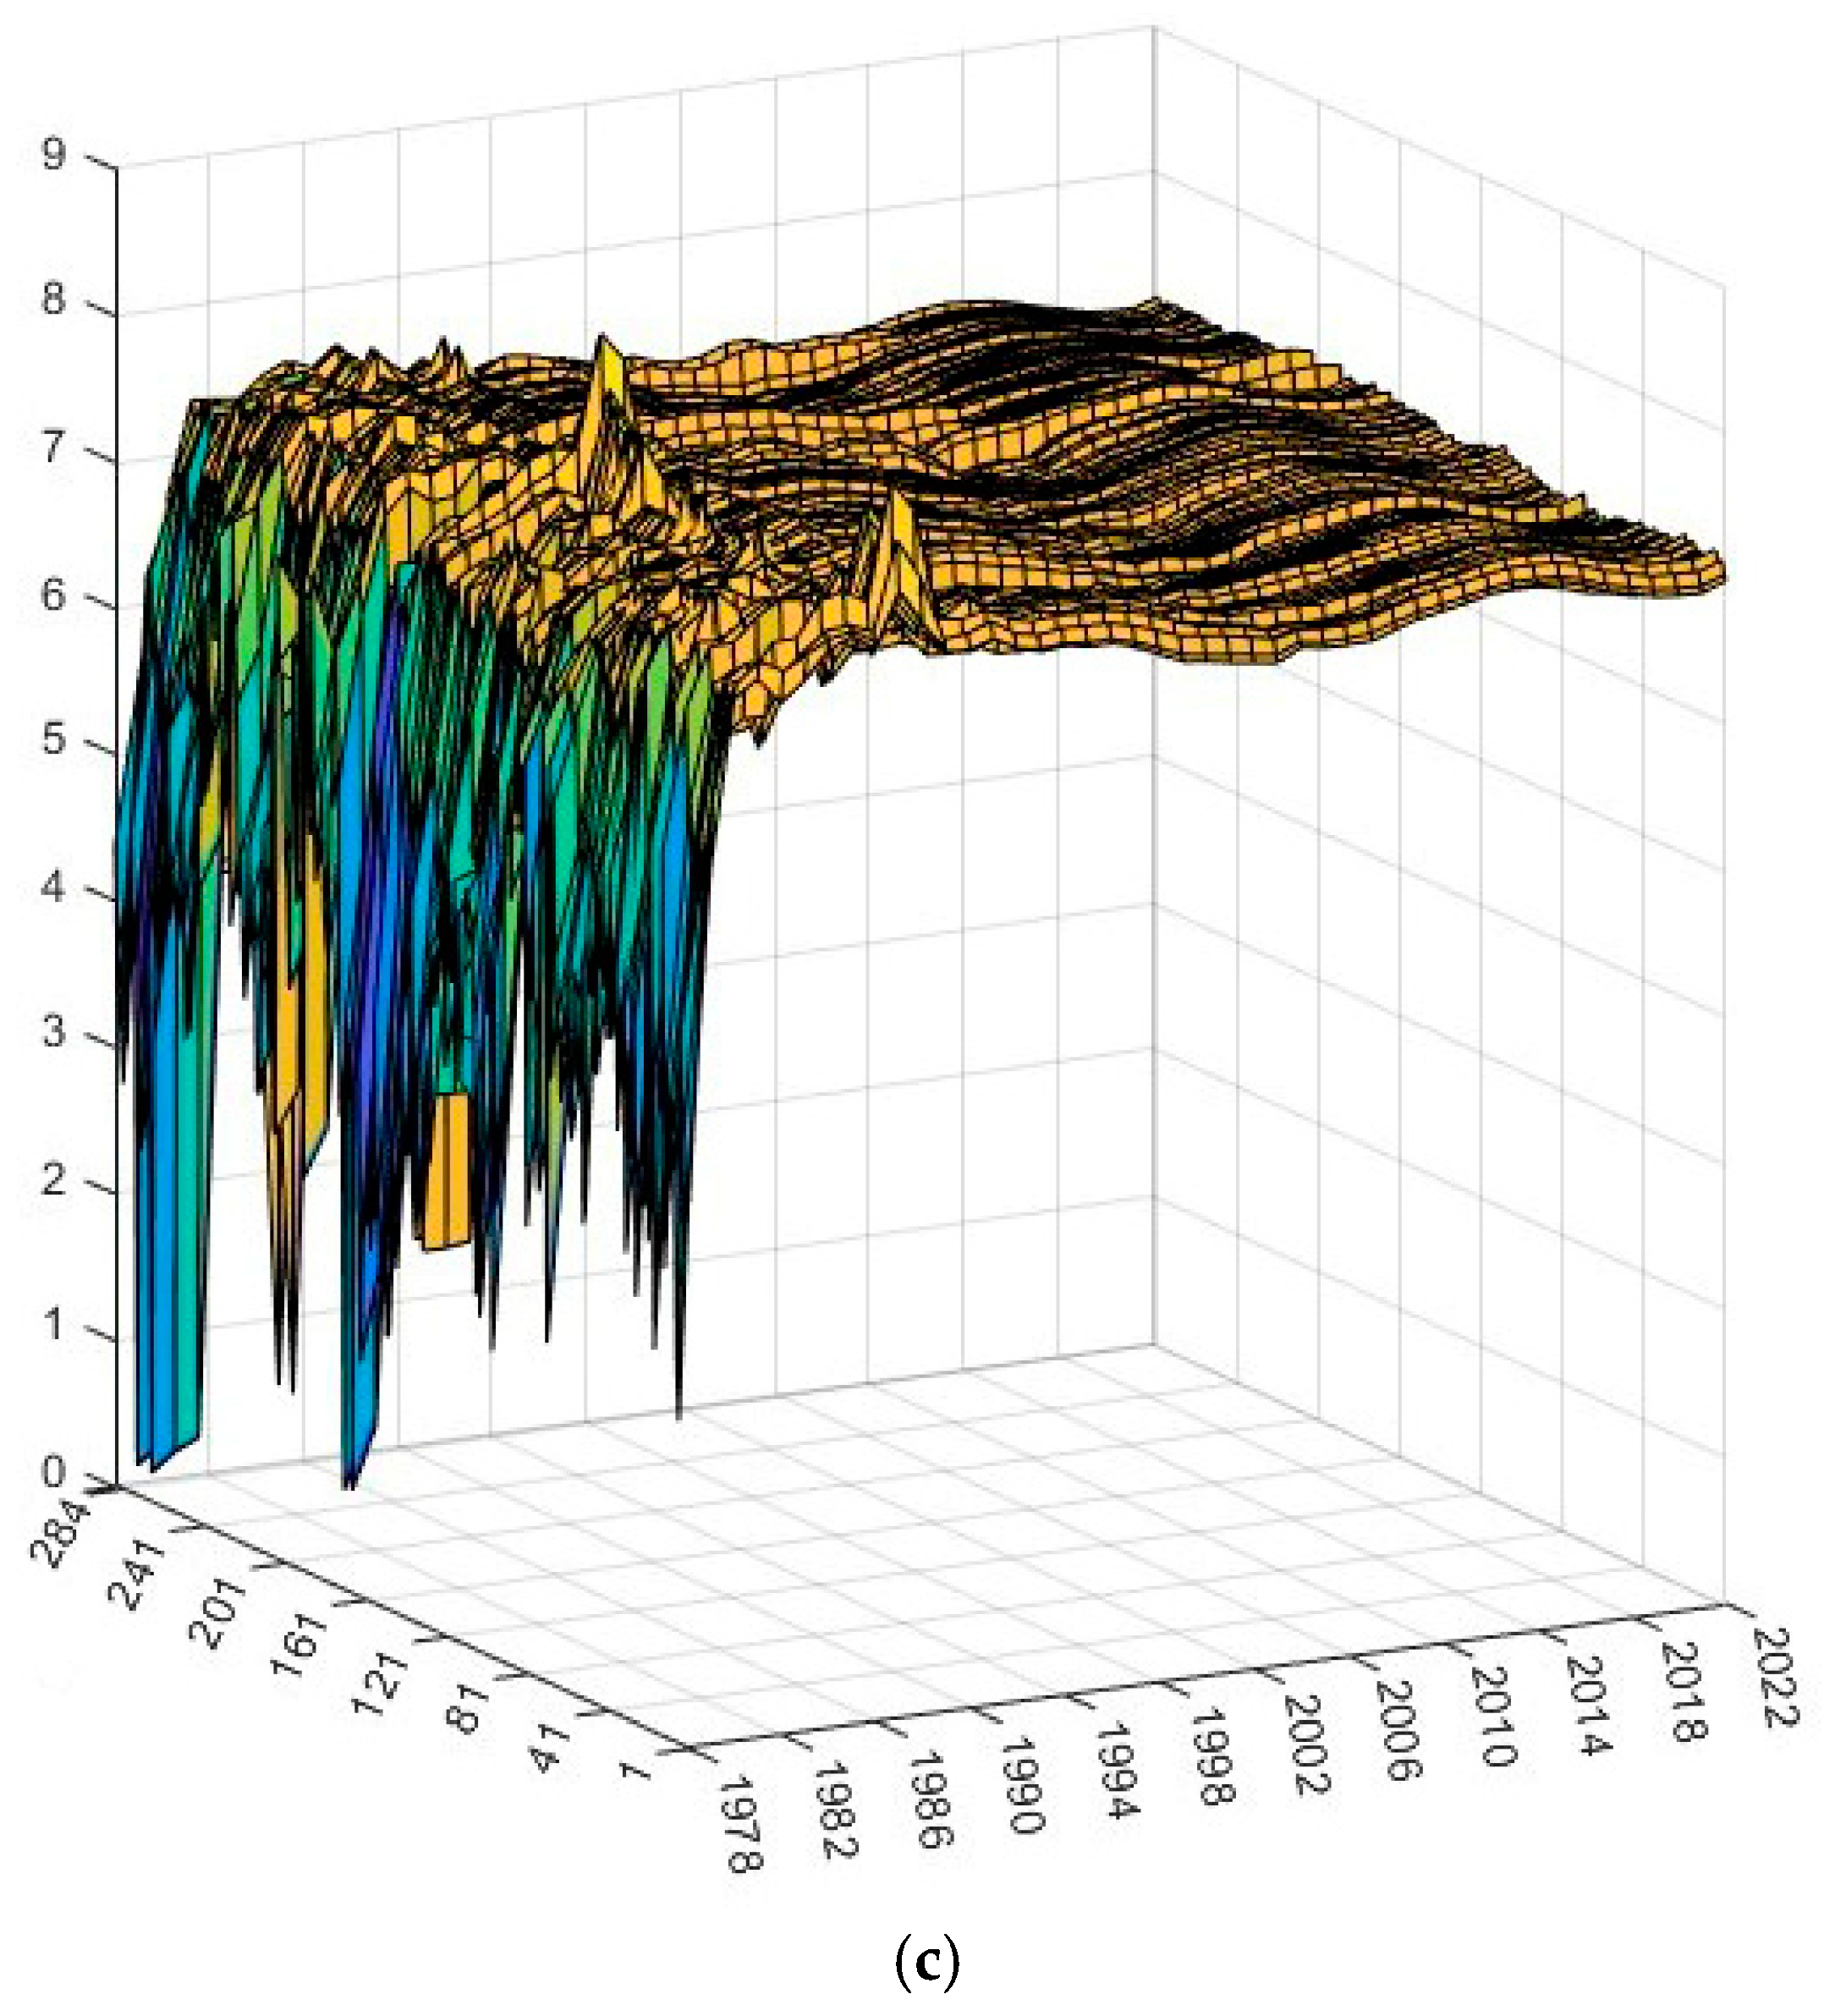
Based on the three types of spatial weight matrices shown in Figure 6 and leveraging big data on firm survival, this study assesses the average level of industrial spatial structure upgrading across 284 cities in China from 1978 to 2022, as depicted in Figure 7. The figure presents the evaluation results under three distinct spatial weight matrix settings: Figure 7a illustrates the results based on a matrix constructed using commuting distances between cities, Figure 7b displays results derived from geographic (latitude and longitude) distances, and Figure 7c showcases findings based on commuting times.
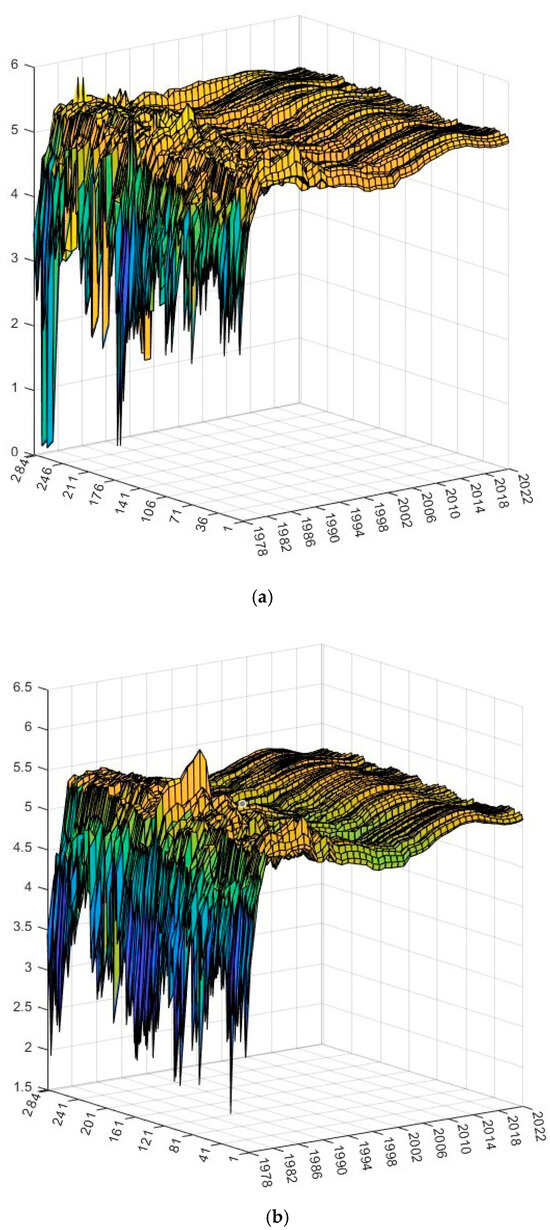
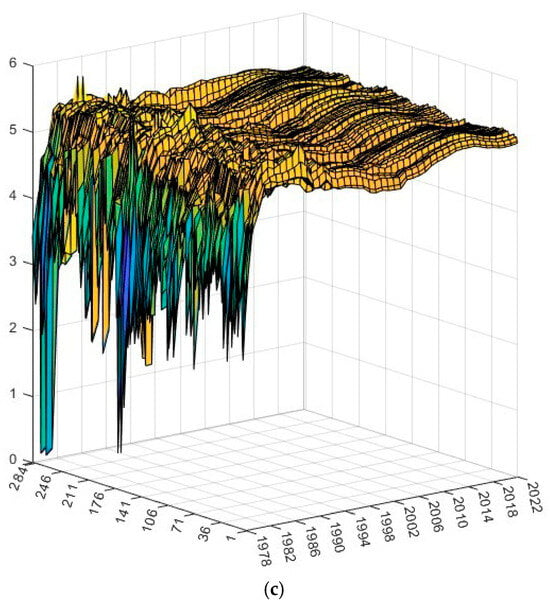
Figure 7.
Evaluation of industrial spatial structure upgrading for 284 Chinese cities (1978–2022). (a) results based on W1; (b) results based on W2; (c) results based on W3. Compiled by the authors using MATLAB R2024a software and custom programs.
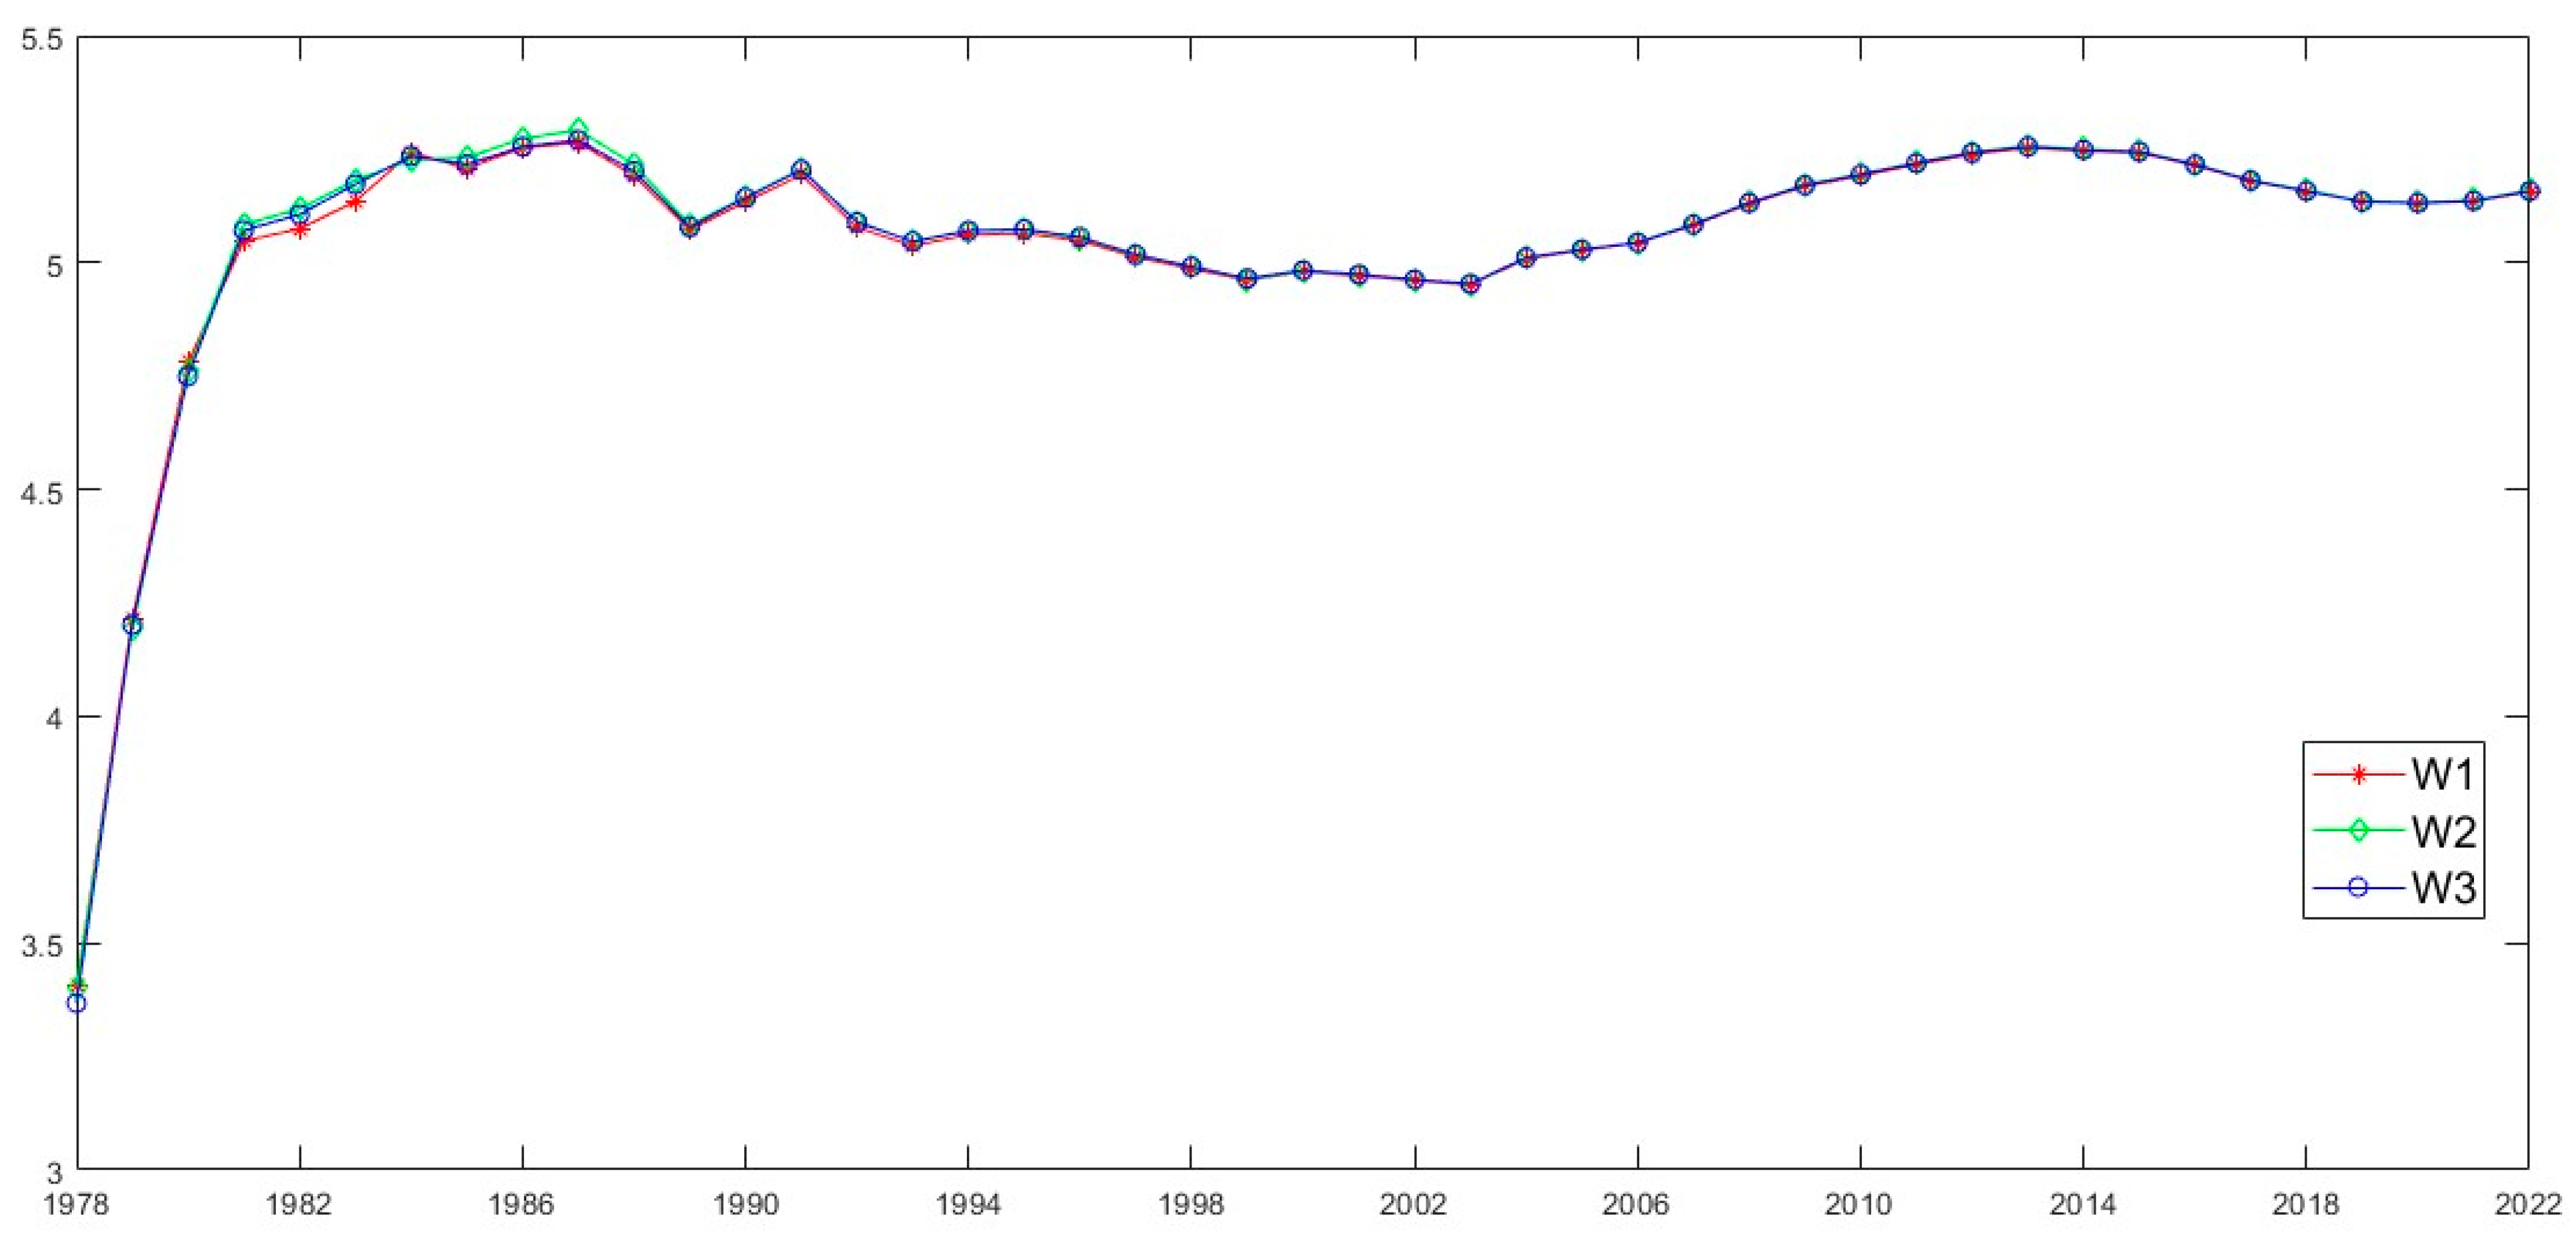
A closer look at the three subfigures in Figure 7 reveals that China’s industrial spatial structure upgrading underwent significant fluctuations during the early stages of the reform and opening-up period, exhibiting pronounced volatility. However, in the latter half of the evaluation period, the magnitude of these fluctuations diminished considerably. Figure 8 further illustrates the average industrial spatial structure upgrading levels across 284 cities from 1978 to 2022. The observed trends indicate a distinct upward trajectory from 1978 to 1987, followed by noticeable oscillations between 1988 and 1991. From 1992 to 2003, a slight decline emerged, which was subsequently reversed after 2003, leading to a sustained growth trend until 2013. Between 2014 and 2020, a mild downward trend was observed, followed by a slight reversal in 2021 and 2022.
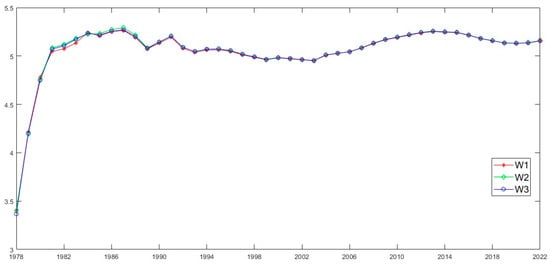
Figure 8.
Comparison of the averages of industrial spatial structure upgrading evaluation results across three spatial weight matrices. Compiled by the authors using MATLAB R2024a software and custom programs.
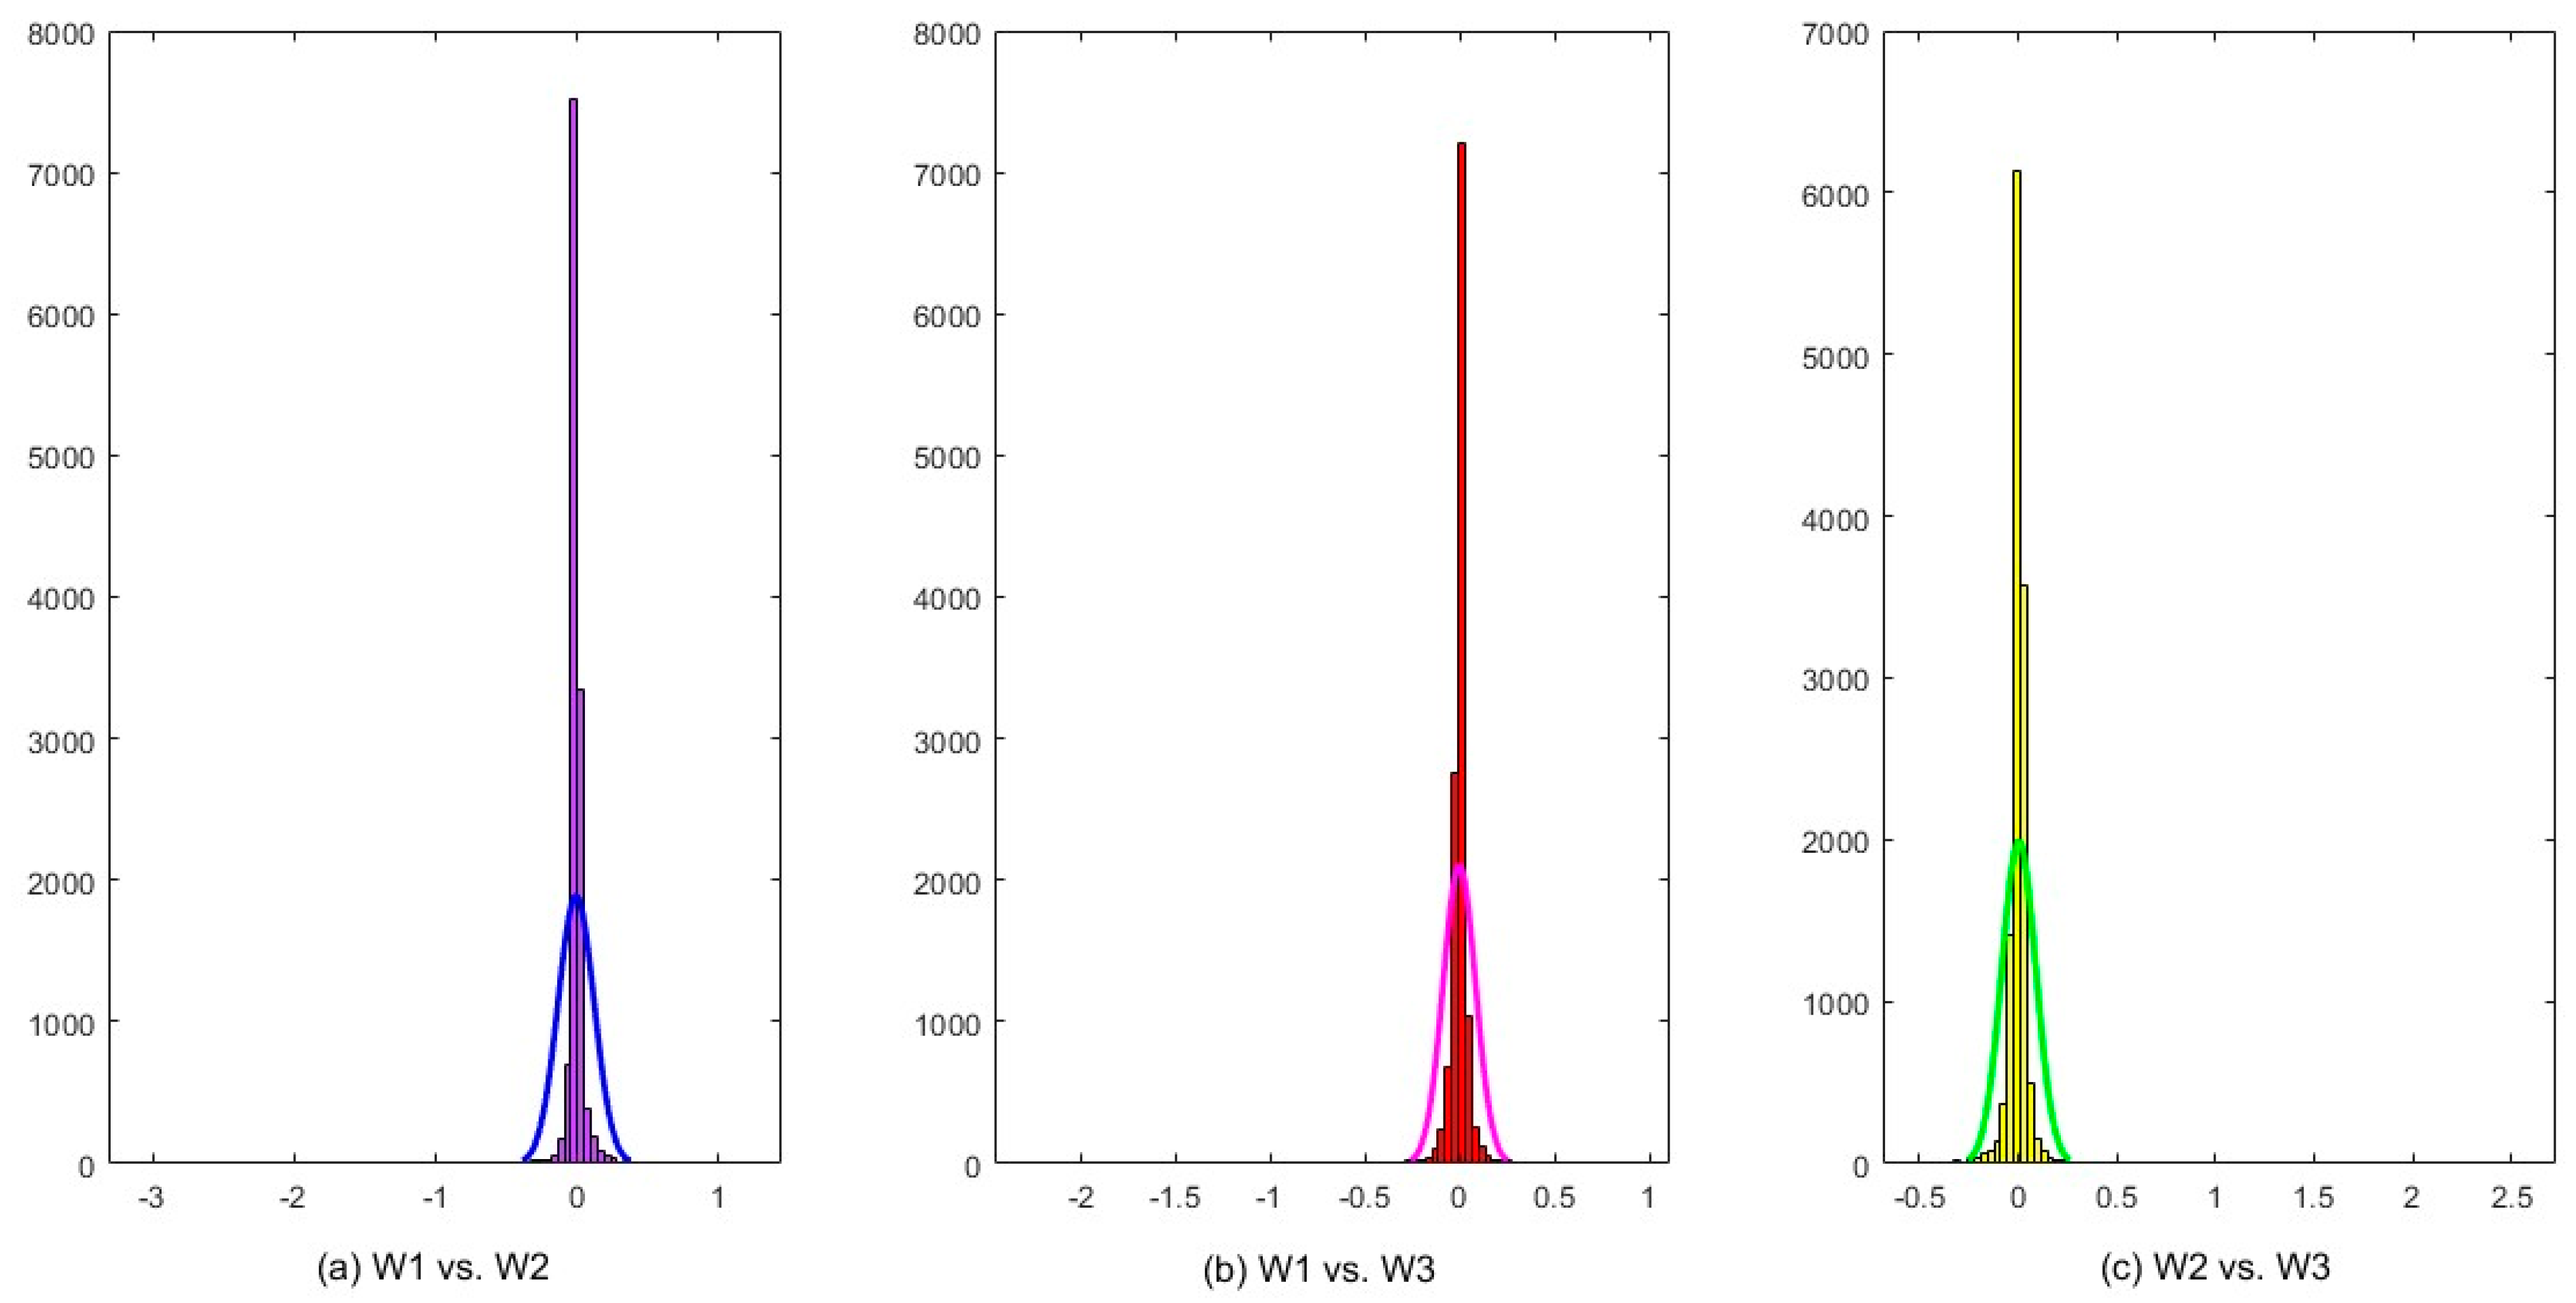
As shown in Figure 8, the mean evaluation levels of China’s industrial spatial structure upgrading under the three spatial weight matrices are virtually identical. To further reinforce this conclusion, this study compares the evaluation results of industrial spatial structure upgrading across 284 cities from 1978 to 2022 using the three spatial weight matrices, as illustrated in Figure 9. Specifically, Figure 9a shows the histogram fit of the differences in evaluation results between the two spatial weight matrices, W1 and W2, while Figure 9b,c depict the histogram fit of the differences between W1 and W3, and between W2 and W3, respectively. From the three subfigures in Figure 9, it is clear that the differences in evaluation results under the three spatial weight matrices are minimal, with a substantial proportion of the difference values concentrated around zero in the histogram fits.
Figure 9.
Comparison of industrial spatial structure upgrading evaluation results using three different spatial weight matrices. Panels (a–c) present histfit plots illustrating the differences in the evaluation results of industrial spatial structure upgrading. Specifically, panel (a) compares the results based on W1 and W2, panel (b) compares W1 and W3, and panel (c) compares W2 and W3. Compiled by the authors using MATLAB R2024a software and custom programs.
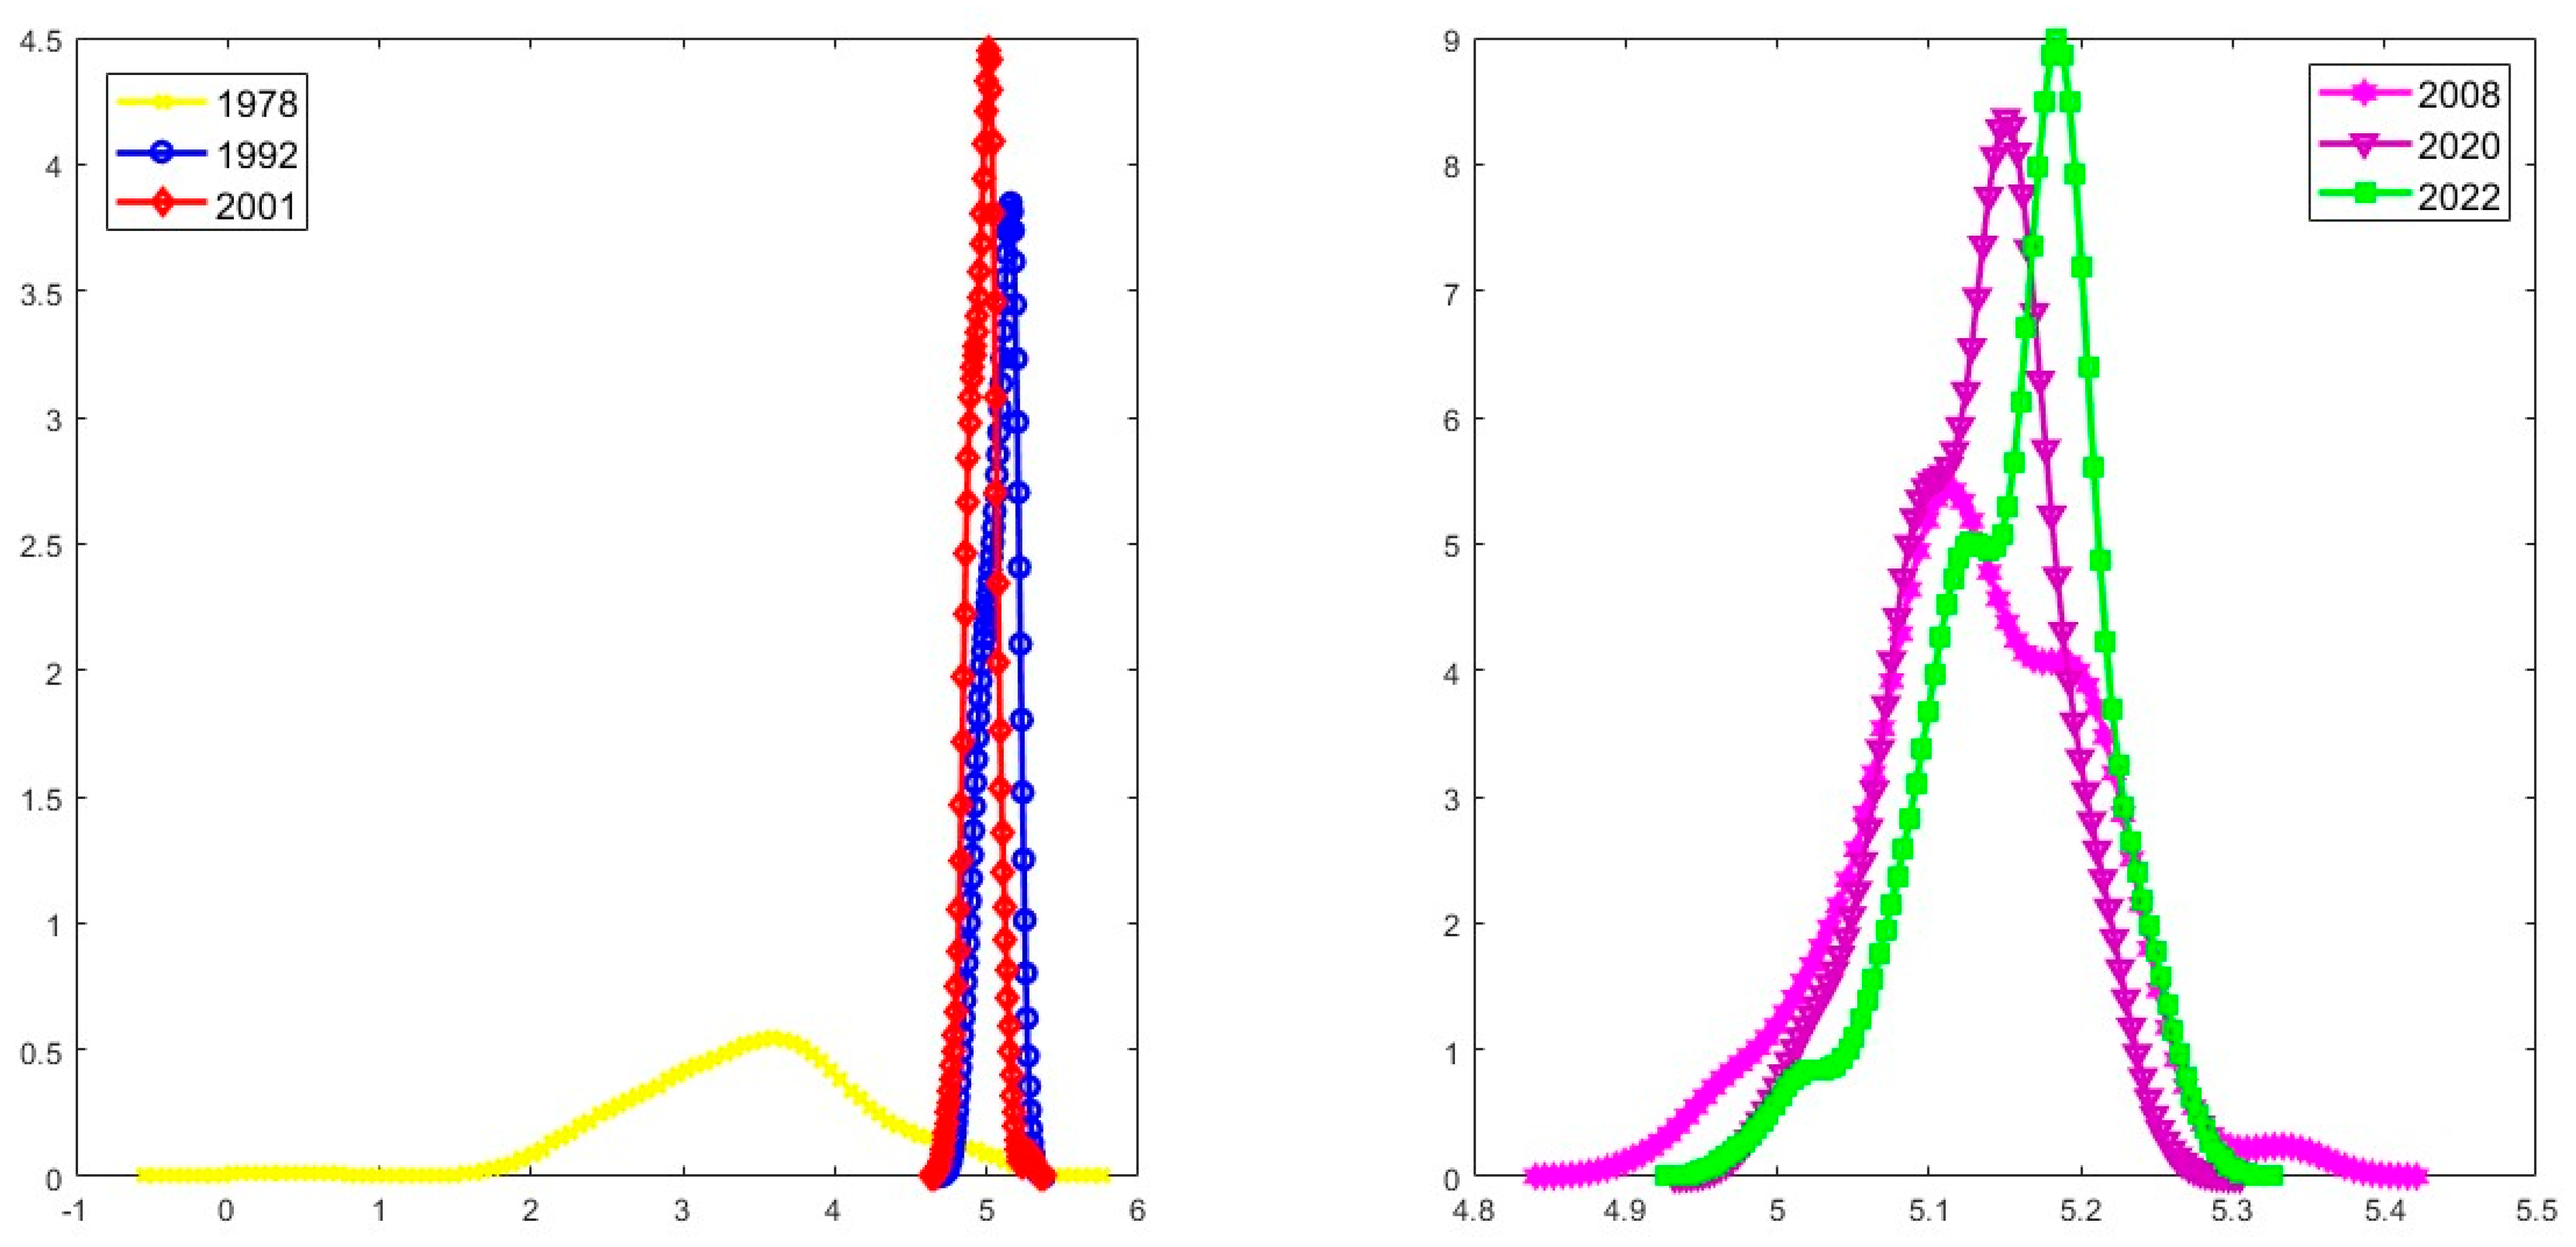
Given that the mean evaluation results of industrial spatial structure upgrading under the three spatial weight matrices are nearly identical, this study focuses on the evaluation results based on commuting distances between cities. Using the kernel density estimation method [33], the study examines the dynamic evolution patterns, with the findings presented in Figure 10. Figure 10 compares the kernel density estimation results at several key time points in Chinese cities. These include 1992, the year of Deng Xiaoping’s landmark “Southern Tour” speech, in which he, as the chief architect of China’s reform and opening-up, played a pivotal role; 2001, when China joined the WTO; 2008, marking the onset of the global financial crisis; 2020, when the COVID-19 pandemic rapidly spread; and 1978 and 2022, which mark the beginning and end of the analysis period, respectively.
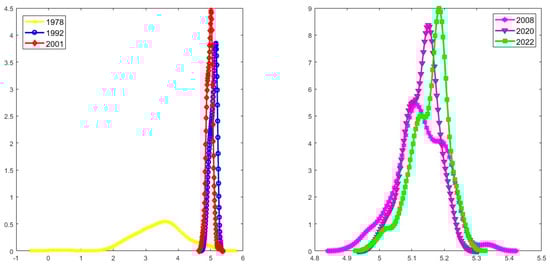
Figure 10.
Kernel density estimation of industrial spatial structure upgrading evaluation results for key years. Compiled by the authors using MATLAB R2024a software and custom programs.
In Figure 10, in the left subfigure, compared to 1978, the kernel density curve in 1992 is generally narrower, with noticeable changes in both the left and right tails. The peak corresponds to an increase in the industrial spatial structure upgrading level of cities, and the density curve becomes significantly thicker. Compared to 1992, the kernel density curve in 2001 remains almost unchanged in shape, with the left and right tails maintaining similar forms. However, the industrial spatial structure upgrading level of cities at the peak slightly decreases, although the density curve at the peak shows a noticeable increase. In the right subfigure, compared to 2008, the “bimodal” feature of the kernel density curve in 2020 remains largely unchanged, with both the left and right tails clearly narrowing. The left peak, corresponding to the industrial spatial structure upgrading level of cities, and its density curve remain mostly stable. The right peak shows a slight decrease in the upgrading level of cities, but the density curve becomes noticeably thicker. Compared to 2020, the kernel density curve in 2022 still retains the “bimodal” feature, with the left and right tails slightly elongated. The left peak shifts rightward, and the density curve becomes thinner, while the right peak also shifts rightward, accompanied by a slight increase in the density curve.
4.3. Further Evaluation: Levels of Industrial Spatial Structure Upgrading and Their Dynamic Evolution for 284 Cities in China from the Perspective of the Primary, Secondary, and Tertiary Industries (1978–2022)
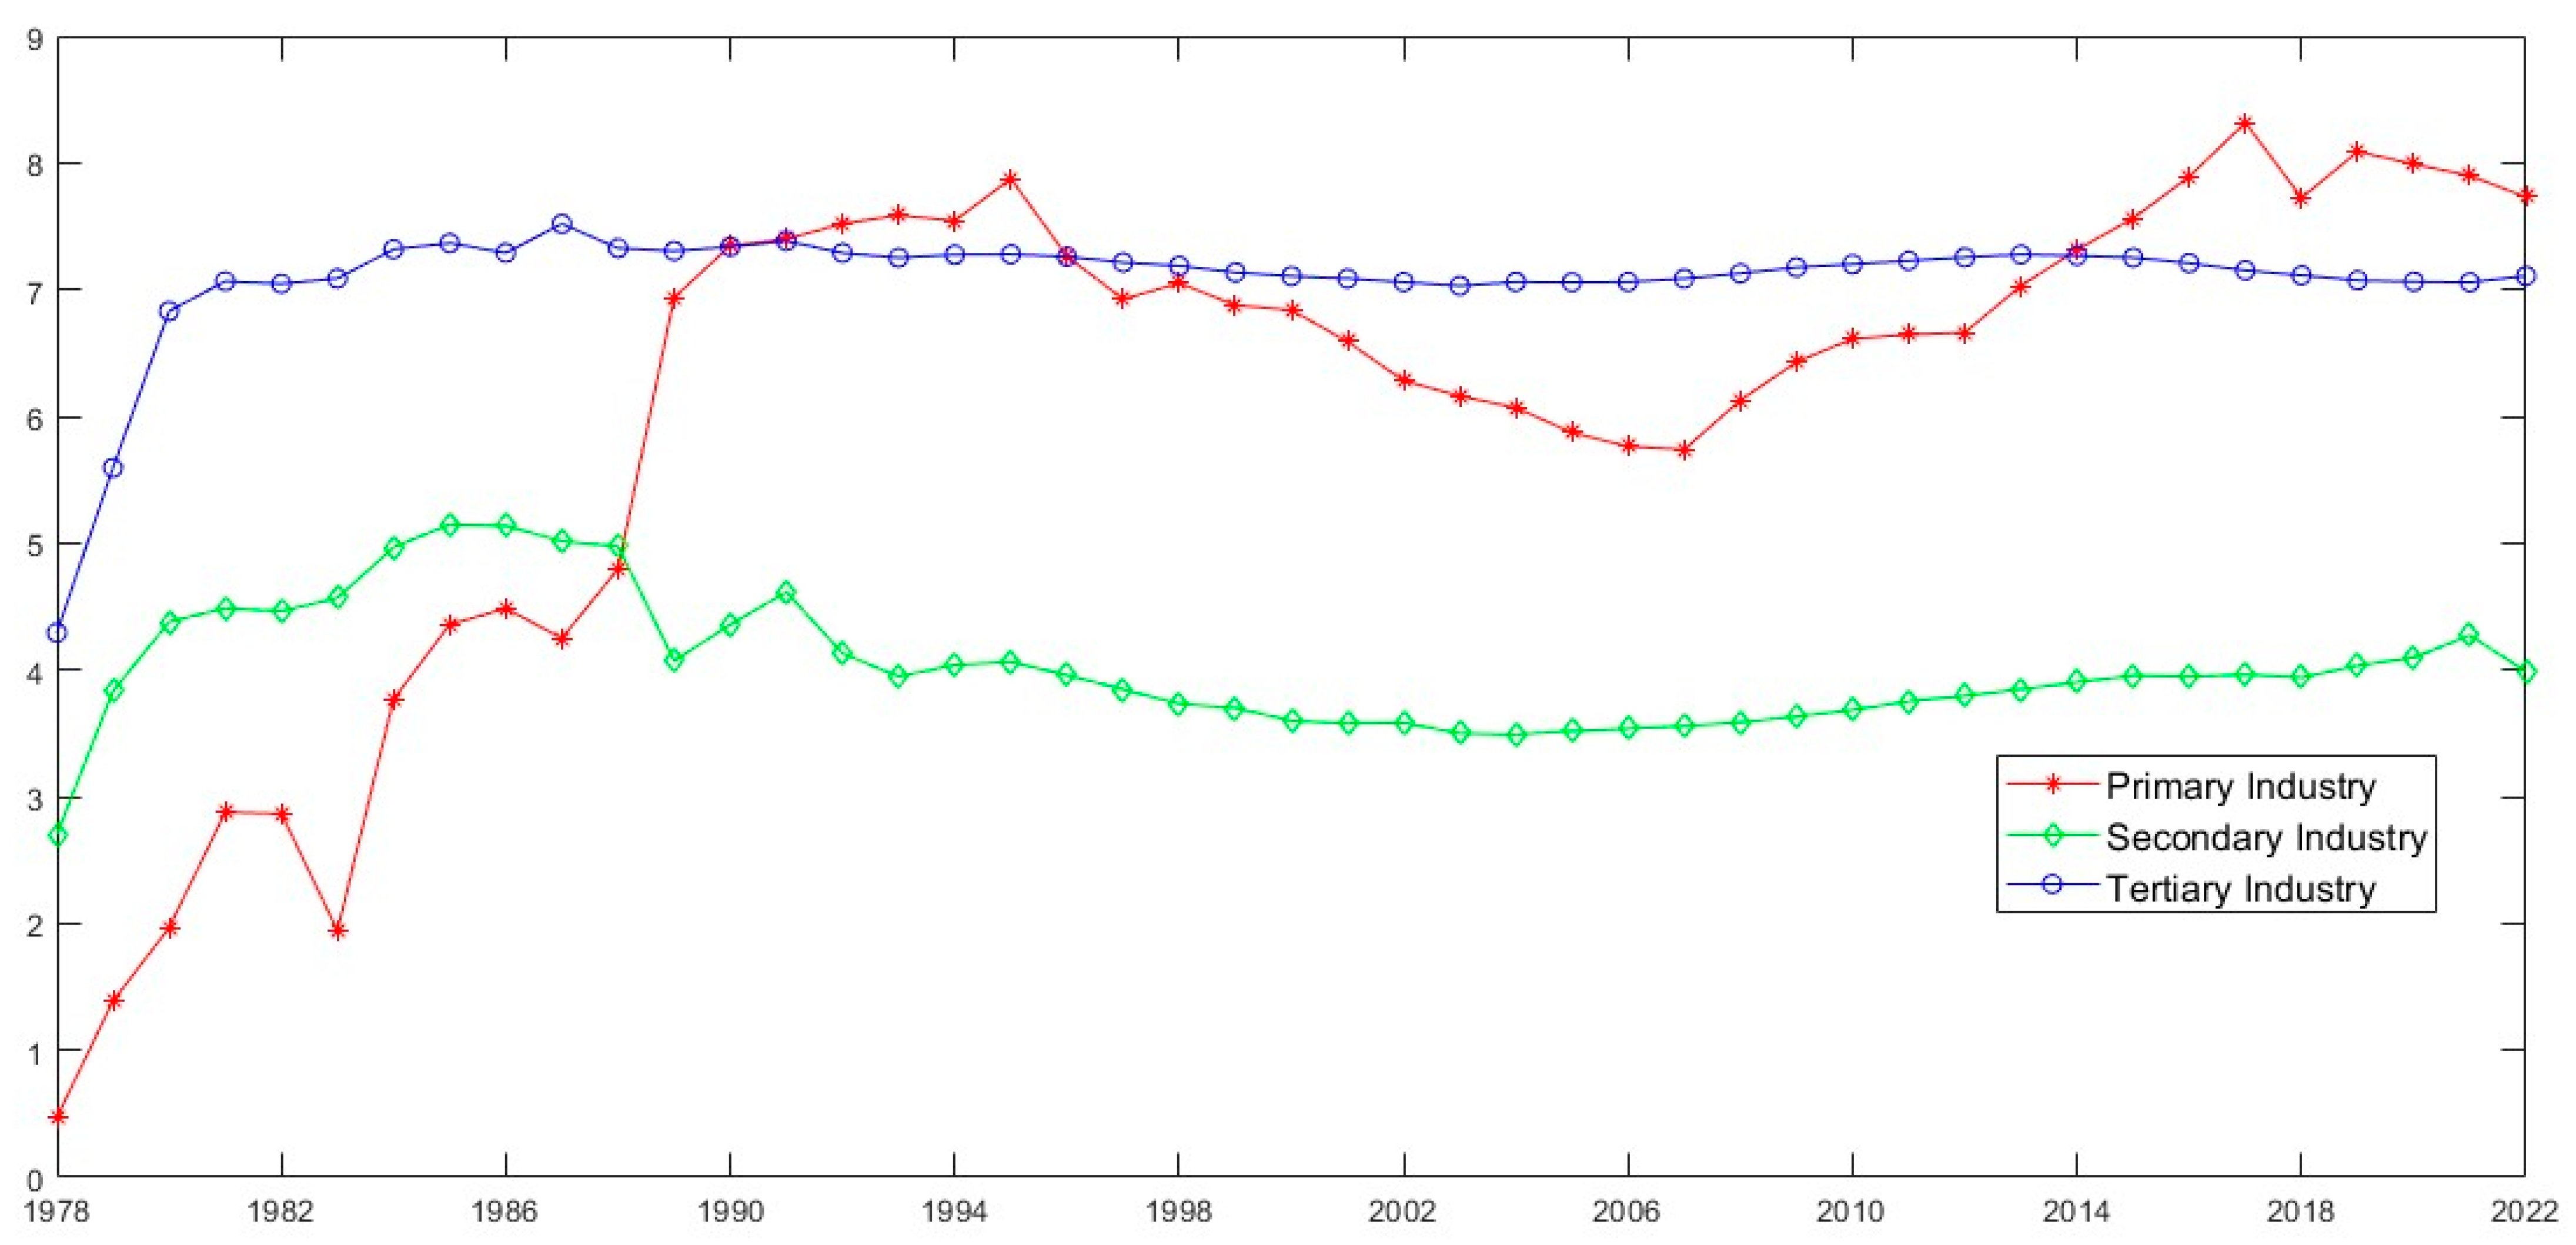
To gain a deeper understanding of the levels of industrial spatial structure upgrading within the primary, secondary, and tertiary industries, this paper measures the upgrading levels for 284 cities in China from the perspective of each of these three sectors, based on the industry segmentation shown in Table 2. The results are presented in Figure 11. In evaluating industrial spatial structure upgrading within the three industries, the spatial weight matrix used is designed based on commuting distances between the 284 cities, as depicted in Subfigure (a) of Figure 6. Furthermore, according to the segmentation outlined in Table 2, the primary industry consists of 5 sub-sectors, the secondary industry includes 45 sub-sectors, and the tertiary industry comprises 46 sub-sectors. In Figure 11, Subfigures (a), (b), and (c) show the measurement results for the levels of industrial spatial structure upgrading in the primary, secondary, and tertiary industries of the 284 cities in China from 1978 to 2022, respectively.


Figure 11.
Evaluation of industrial spatial structure upgrading for subdivided industries in 284 chinese cities (1978–2022). (a) Results for the primary industry; (b) results for the secondary industry; (c) results for the tertiary industry. Compiled by the authors using MATLAB R2024a software and custom programs.
From the results in Figure 11, it is visually clear that the levels of industrial spatial structure upgrading within the primary, secondary, and tertiary industries are not the same. Among these, the assessment results for the upgrading of industrial spatial structure within the tertiary industry exhibit relatively smaller fluctuations in the latter half of the evaluation period. To further compare the assessment results for the upgrading levels across the three industries, this paper calculates the differences in these results, with the histogram fitting displayed in Figure 12. In Figure 12, Subfigure (a) presents the histogram fitting for the differences in the assessment results between the primary and secondary industries, Subfigure (b) shows the histogram fitting for the differences between the primary and tertiary industries, and Subfigure (c) illustrates the histogram fitting for the differences between the secondary and tertiary industries. In terms of the range of these differences, the difference in upgrading levels between the primary and secondary industries falls between −8 and 8, the difference between the secondary and tertiary industries ranges from −7.5 to 5, and the difference between the primary and tertiary industries spans from −5 to 7.5. Furthermore, based on the histogram fitting of these differences, the shapes of the histograms for the differences between the primary and secondary industries are similar to those between the primary and tertiary industries. However, the range of the latter, as shown in the histogram in Figure 12b, is somewhat wider.
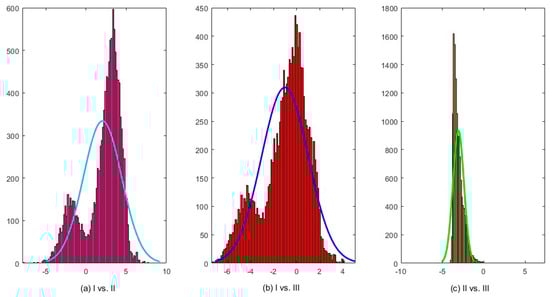
Figure 12.
Comparison of industrial spatial structure upgrading evaluation results for subdivided industries based on W1: I, II, and III represent the primary, secondary, and tertiary industries, respectively. Panels (a–c) display histfit plots showing the differences in the evaluation results of industrial spatial structure upgrading across the primary, secondary, and tertiary industries. Specifically, panel (a) compares the primary and secondary industries, panel (b) the primary and tertiary industries, and panel (c) the secondary and tertiary industries. Compiled by the authors using MATLAB R2024a software and custom programs.
Consistent with the analysis logic presented earlier, this paper also examines the average level of industrial spatial structure upgrading across all cities in China from 1978 to 2022, as shown in Figure 13 below. In Figure 13, the average level of industrial spatial structure upgrading for China’s primary, secondary, and tertiary industries varies across different time periods. From 1978 to 1988, the average level of upgrading in the industrial spatial structure positioned the tertiary industry above the secondary industry, with the primary industry ranked last. After 1989, the secondary industry consistently ranked lowest in terms of the average level of industrial spatial structure upgrading. Between 1989 and 2022, the ranking of the industrial spatial structure upgrading levels between the primary and tertiary industries changed. During the periods of 1991–1996 and 2014–2022, the primary industry had a higher level of upgrading than the tertiary industry, while in other periods, the tertiary industry consistently had a higher average level of upgrading than the primary industry.
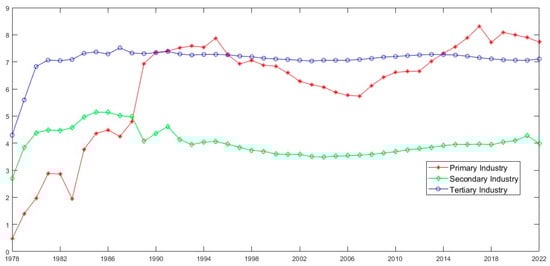
Figure 13.
Averages of industrial spatial structure upgrading evaluation results across different industry categories in 284 cities. Compiled by the authors using MATLAB R2024a software and custom programs.
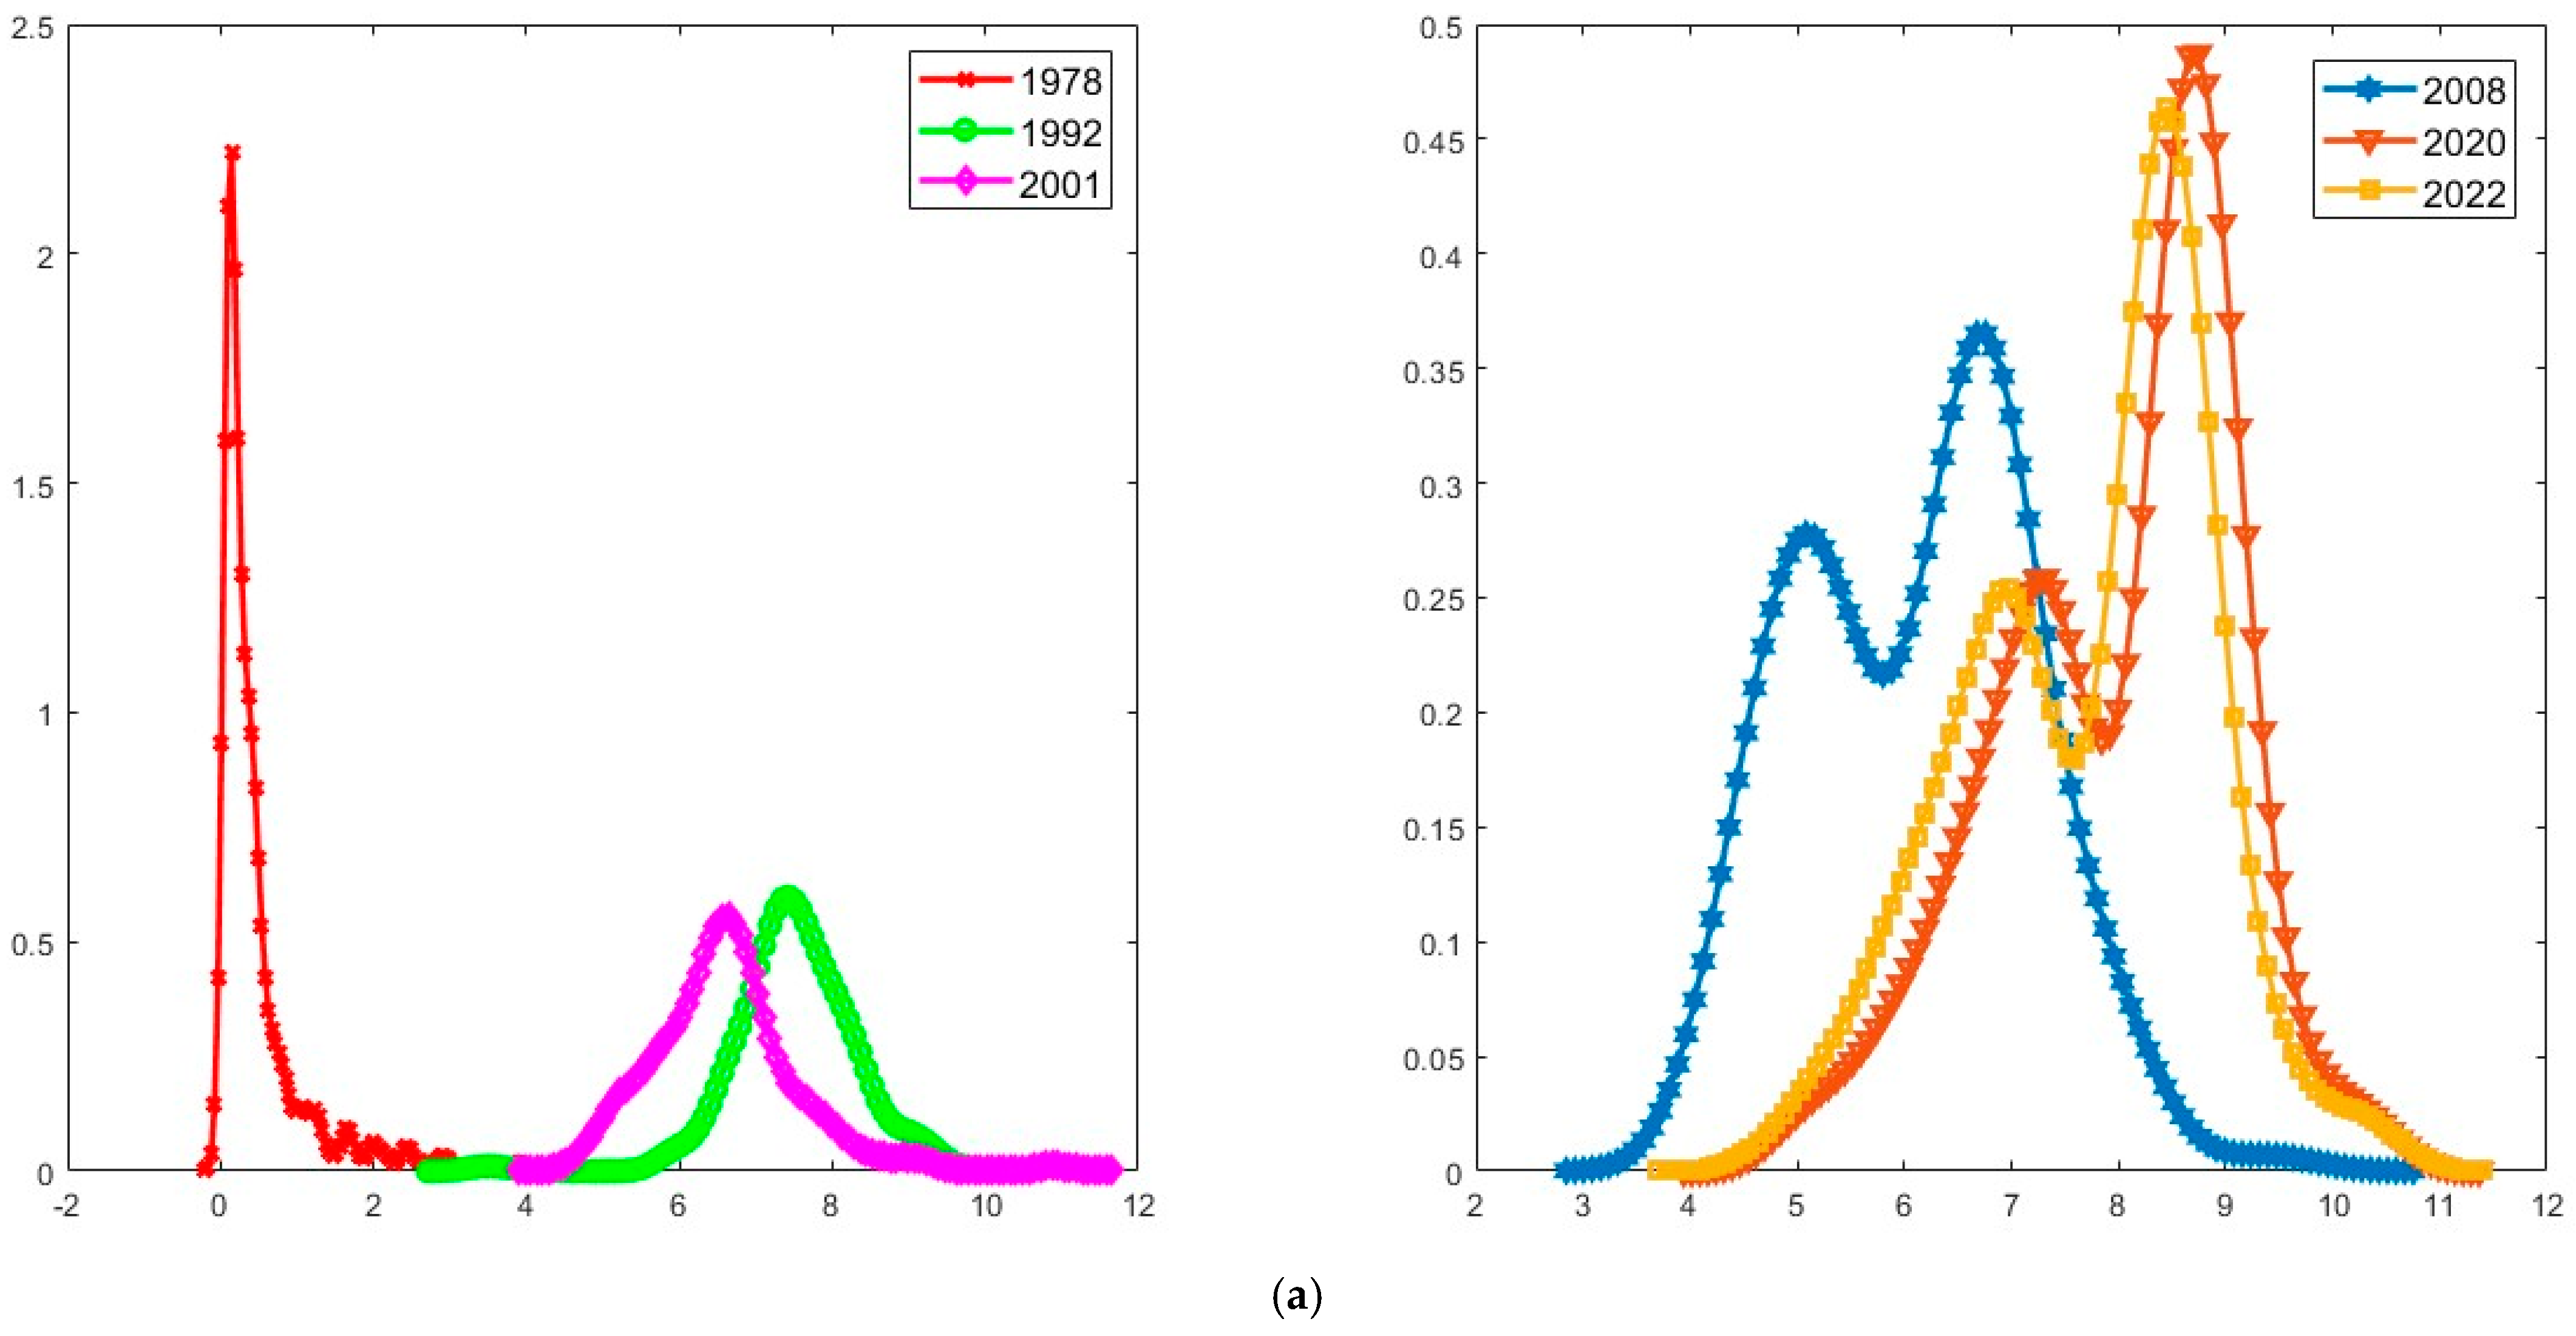
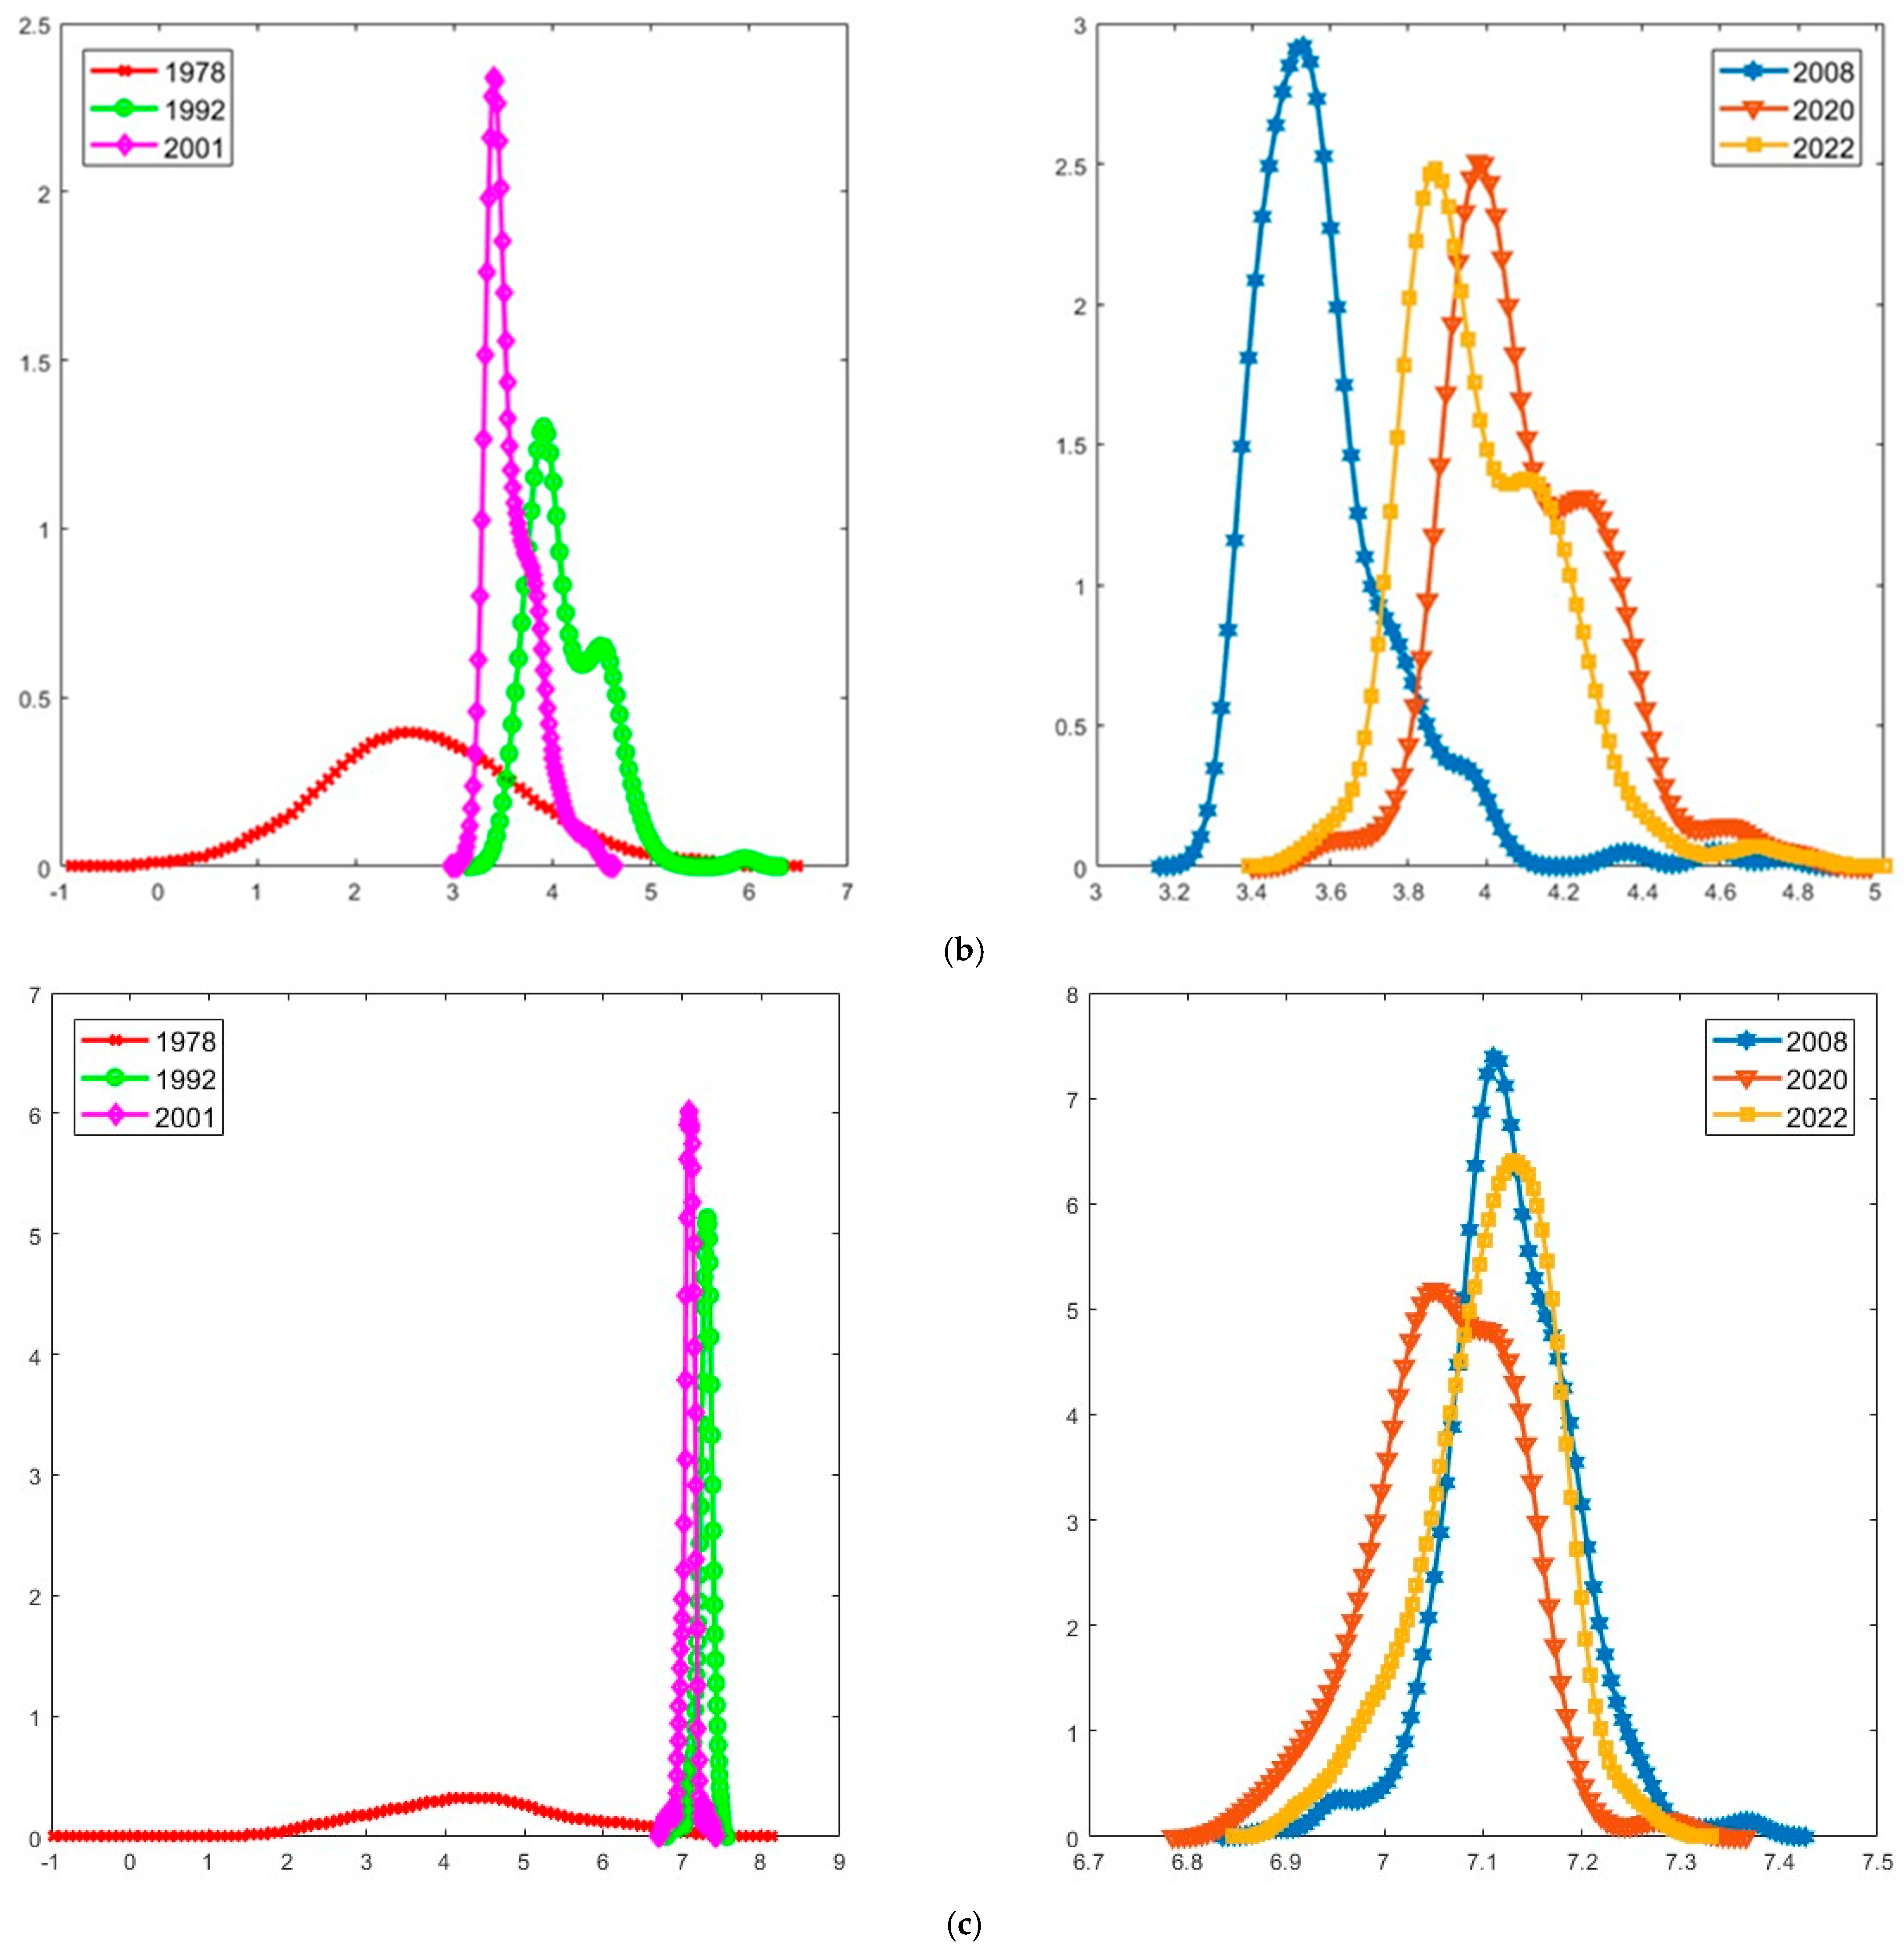
In line with the analytical approach in Figure 10, this paper also employs kernel density estimation to analyze the dynamic evolution of industrial spatial structure upgrading levels within the three major industries in Chinese cities from 1978 to 2022, as shown in Figure 14. The selection of key time points is consistent with those in Figure 10. In Figure 14, Subfigure (a) presents the kernel density estimation of industrial spatial structure upgrading levels in the primary industry of Chinese cities for key years. From the left plot in Figure 14a, compared to 1978, the kernel density curve in 1992 has clearly shifted to the right, with a noticeable right-tailed phenomenon. The density curve at the peak becomes thinner, but the corresponding level of industrial spatial structure upgrading in cities has significantly increased. Compared to 1992, the kernel density curve in 2001 shows a narrowing of the left tail but a noticeable extension of the right tail. The density curve at the peak is slightly thinner, and the corresponding level of industrial spatial structure upgrading has also slightly decreased. From the right plot in Figure 14b, compared to 2008, the kernel density curve in 2020 has clearly shifted to the right, maintaining the bimodal characteristic. The density curve at the left peak becomes slightly thinner, while at the right peak, the density curve becomes noticeably thicker. Compared to 2020, the density curve in 2022 has shifted slightly to the left, with the bimodal characteristic still maintained. The industrial spatial structure upgrading levels at both the left and right peaks have experienced a slight decline.
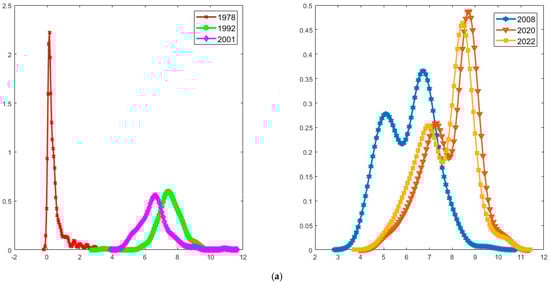

Figure 14.
Kernel density estimation of industrial spatial structure upgrading levels for subdivided industries in 284 Chinese cities: (a) primary industry; (b) secondary industry; (c) tertiary industry. Compiled by the authors using MATLAB R2024a software and custom programs.
Figure 14b shows the kernel density estimation of the industrial spatial structure upgrading levels within the secondary industry of Chinese cities. From the left plot of Figure 14b, compared to 1978, it can be observed that the kernel density curve in 1992 has clearly shifted to the right, changing from a unimodal characteristic to a bimodal characteristic. The left tail has notably narrowed, and the density curves at both the left and right peaks have significantly thickened, with a clear improvement in the industrial spatial structure upgrading levels at both the left and right peaks in the corresponding cities. Compared to 1992, the kernel density curve in 2001 has shifted slightly to the left, with a narrowing of the right tail. The bimodal characteristic has also transformed into a unimodal characteristic. The upgrading level at the peak has slightly decreased, but the density curve at the peak has noticeably thickened. From the right plot of Figure 14b, compared to 2008, the kernel density curve in 2020 has clearly shifted to the right, displaying a distinct bimodal characteristic. The density curves at both the left and right peaks have noticeably thinned, yet the industrial spatial structure upgrading levels at both peaks have significantly improved. In contrast to 2020, the kernel density curve in 2022 has shifted slightly to the left, with the bimodal characteristic somewhat maintained. The density curve at the left peak remains almost unchanged, although the corresponding industrial spatial structure upgrading level has slightly decreased. The density curve at the right peak has thickened, and the corresponding industrial spatial structure upgrading level has experienced a slight decline.
Figure 14c shows the industrial spatial structure upgrading levels within the tertiary industry of Chinese cities. From the left plot of Figure 14c, compared to 1978, the kernel density curve in 1992 has clearly narrowed and shifted significantly to the right. The density curve at the peak has noticeably thickened, and the corresponding industrial spatial structure upgrading level at the peak has significantly improved. Compared to 1992, the kernel density curve in 2001 has slightly shifted to the left. The industrial spatial structure upgrading level at the peak has slightly decreased, but the density curve at the peak has thickened. From the right plot of Figure 14c, compared to 2008, it can be observed that the kernel density curve in 2020 exhibits a bimodal characteristic, with the curve shifting slightly to the left. The left tail extends, while the right tail narrows. The density curves at both the left and right peaks have thinned. The upgrading level at the left peak has noticeably decreased, while the upgrading level at the right peak remains almost unchanged. Compared to 2020, the kernel density curve in 2022 has shifted slightly to the right, with the bimodal characteristic transforming into a unimodal one. The density curve at the peak has thickened, and the corresponding industrial spatial structure upgrading level has improved to some extent. Both the left and right tails have narrowed slightly.
5. Conclusions and Remarks
Building on a review and critique of existing methods for evaluating industrial structure upgrading, this paper introduces a novel spatial angle index method to assess the level of industrial spatial structure upgrading, drawing on the cosine angle method. It also investigates potential influencing factors in the upgrading process using random sampling. By integrating firm survival big data from 96 sub-industries across 284 cities in China from 1978 to 2022, the paper evaluates the levels of industrial spatial structure upgrading in these cities. Additionally, it examines the upgrading levels within the primary, secondary, and tertiary industries in these cities over the same period. The main research conclusions are summarized as follows:
First, based on the literature review, this paper highlights that existing research on industrial spatial structure upgrading mainly focuses on industrial structure upgrading and spatial structure optimization. However, there is a notable gap in direct studies addressing industrial spatial structure upgrading from a macro and conceptual perspective, particularly in terms of evaluating industrial spatial structure upgrading. This gap forms the foundation and core value of this study.
Second, methods for evaluating industrial structure upgrading primarily include the traditional proportional method, industrial structure hierarchy coefficient, the production efficiency method, and the cosine angle method. Each of these methods has its strengths and weaknesses, with the cosine angle method being the most effective at accurately assessing the level of industrial structure upgrading and the most widely accepted by scholars. Building upon this method, this paper introduces a new approach to evaluate the level of industrial spatial structure upgrading. It incorporates the spatial angle index of both local and projected points, derived from the actual industry proportions of specific regions. The new method assesses the deviation of the spatial angle index from two extreme states outlined earlier, considering both spatial spillover effects between regions and the joint influence of local and projected points in determining the industrial spatial structure upgrading level. This approach offers a more scientifically rigorous framework.
Third, from the perspective of the algorithmic logic used to evaluate industrial spatial structure upgrading based on the spatial angle index, factors such as the design of the spatial weight matrix and the total number of industry categories included in the evaluation may influence the results. However, since the evaluation results for industrial spatial structure upgrading levels across different regions and periods are assessed independently, these factors are unlikely to be key determinants of the outcomes. From the perspective of industrial spatial structure upgrading evaluation based on random sampling, the design of the spatial weight matrix, the number of industry categories considered, and the indicators used to calculate industry proportions can affect the assessment of upgrading levels. Nevertheless, as the total number of regions, periods, and industry categories included in the analysis increases, the average evaluation results for industrial spatial structure upgrading will tend to converge.
Fourth, this paper utilizes firm survival big data from 96 industries across 284 cities in China, covering the period from 1978 to 2022. The data were obtained through a web crawler from the “Tianyancha” website using Python software. Based on these data and the new method developed in this study, the industrial spatial structure upgrading levels of 284 cities in China from 1978 to 2022 are assessed, and the spatiotemporal evolution patterns of these upgrading levels are examined using kernel density estimation. The evaluation results show that when firm big data from all 96 industries are included, spatial weight matrices designed based on commuting distance, latitude–longitude distance, and commuting time lead to slightly different results for industrial spatial structure upgrading. However, the differences between these three approaches are not substantial. When the assessment is based on enterprise big data from different industries within the primary, secondary, and tertiary sectors, the spatial weight matrix designed using commuting distance yields significantly different results for the upgrading levels within these three sectors. In terms of the overall evaluation of industrial spatial structure upgrading in Chinese cities from 1978 to 2022, substantial changes occurred before 1987, after which the rate of change became relatively steady from 1988 to 2022. Regarding the spatiotemporal evolution of upgrading levels within the three sectors, the tertiary sector generally demonstrates superior upgrading levels, while the secondary sector has underperformed since 1992. The primary sector, on the other hand, has shown significant improvements, even surpassing the tertiary sector’s upgrading levels in certain years.
It should be noted that when applying the methodology proposed in this paper to assess the industrial spatial structure upgrading level of a specific region, several important issues require careful consideration. First, the evaluation of a region’s industrial spatial structure upgrading is influenced by its industrial development environment, the composition of industries, and their specific distribution. Therefore, the evaluation cannot rely solely on the method outlined in this paper; a more comprehensive and systematic approach is needed, one that integrates multiple factors. Second, the scientific formulation of the spatial weight matrix plays a crucial role in determining the accuracy of the evaluation results. The methods employed in the case study, such as those based on latitude–longitude, commuting distance, and commuting time, are temporary solutions driven by data constraints. For more precise evaluations of the advanced level of industrial spatial structure upgrading, it is necessary to account for dynamic changes and endogenous influences in spillover effects, including those arising from shifts in commuting patterns, infrastructure improvements, and other factors. This highlights the importance of further research into the design of dynamic spatial weight matrices. These challenges emphasize the need for ongoing progress in research within the relevant fields and sustained attention from the academic community.
Author Contributions
Conceptualization, Q.F.; methodology, Q.F.; software, Q.F., and Z.Z.; validation, Q.F., and Z.Z.; formal analysis, Q.F., N.L., and Z.Z.; data curation, N.L., and Z.Z.; writing—original draft preparation, Q.F., N.L., and Z.Z.; writing—review and editing, Q.F.; visualization, N.L.; supervision, Q.F.; funding acquisition, Q.F. All authors have read and agreed to the published version of the manuscript.
Funding
This research was supported by the Soft Science Special Project of Gansu Basic Research Plan under Grant No. 24JRZA033.
Data Availability Statement
The data presented in this study are available on request from the corresponding author. These data are not publicly available due to restrictions arising from ongoing collaborative research and the necessity for further analysis.
Conflicts of Interest
The authors declare no conflicts of interest.
References
- Fu, L. An Empirical Research on Industry Structure and Economic Growth. Stat. Res. 2010, 27, 79–81. [Google Scholar]
- Yang, L.; Shao, J. Re-estimation of optimization of regional industrial structure in China. J. Quant. Technol. Econ. 2018, 35, 59–77. [Google Scholar]
- Fujita, M.; Krugman, P.; Venables, A.J. The Spatial Economy: Cities, Regions, and International Trade; The MIT Press: Cambridge, MA, USA, 1999. [Google Scholar]
- Krugman, P.P.; Obstfeld, M. International Economics: Theory and Policy; Pearson-Addison: New York, NY, USA, 2002. [Google Scholar]
- Christaller, W. Central Places in Southern Germany; Prentice-Hall: Englewood Cliffs, NJ, USA, 1933. [Google Scholar]
- Perroux, F. Economic Space: Theory and Applications. Q. J. Econ. 1950, 64, 89–104. [Google Scholar] [CrossRef]
- Tian, X.; Gao, W.; Liu, Y.; Xu, M. Secondary resource curse’s formation and transmission mechanism based on environmental externality theory. Resour. Conserv. Recycl. 2020, 161, 104958. [Google Scholar] [CrossRef]
- Shi, K.; Wang, J. The influence and spatial effects of high-speed railway construction on urban industrial upgrading: Based on an industrial transfer perspective. Socio-Econ. Plan. Sci. 2024, 93, 101886. [Google Scholar] [CrossRef]
- Feng, T.; Liu, B.; Wei, Y.; Xu, Y.; Zheng, H.; Ni, Z.; Zhu, Y.; Fan, X.; Zhou, Z. Research on the low-carbon path of regional industrial structure optimization. Energy Strategy Rev. 2024, 54, 101485. [Google Scholar] [CrossRef]
- Zhang, Q.; Zhao, X. Can the digital economy facilitate the optimization of industrial structure in resource-based cities? Struct. Change Econ. Dyn. 2024, 71, 405–416. [Google Scholar] [CrossRef]
- Zhou, X.; Ji, J. A multi-objective optimization approach for interprovincial carbon emission reduction in China: Considering industrial structure and ownership attributes. J. Environ. Manag. 2025, 373, 123646. [Google Scholar] [CrossRef]
- Fan, P.; Yue, W.; Zhang, J.; Huang, H.; Messina, J.; Verburg, P.H.; Qi, J.; Moore, N.; Ge, J. The spatial restructuring and determinants of industrial landscape in a mega city under rapid urbanization. Habitat Int. 2020, 95, 102099. [Google Scholar] [CrossRef]
- Chen, Z.; Zhang, S. The spatial correlation between green investment and energy-structure optimization: Evidence from China. Energy Strategy Rev. 2024, 53, 101391. [Google Scholar] [CrossRef]
- Meijers, E.J.; Burger, M.J. Spatial structure and productivity in US metropolitan areas. Environ. Plan. A 2010, 42, 1383–1402. [Google Scholar] [CrossRef]
- Chen, H.; Yu, J.; Ma, S.; Zhang, W. Urban scale, production efficiency, and dynamic development paths. Cities 2023, 143, 104566. [Google Scholar] [CrossRef]
- Xu, L.; Tan, J. Financial development, industrial structure and natural resource utilization efficiency in China. Resour. Policy 2020, 66, 101642. [Google Scholar] [CrossRef]
- Lin, B.; Teng, Y. The effect of industrial synergy and division on energy intensity: From the perspective of industrial chain. Energy 2023, 283, 128487. [Google Scholar] [CrossRef]
- Fan, C.C.; Scott, A.J. Industrial agglomeration and development: A survey of spatial economic issues in East Asia and a statistical analysis of Chinese regions. Econ. Geogr. 2003, 79, 295–319. [Google Scholar] [CrossRef]
- Zhang, L.; He, X.; Jia, Z. Industrial agglomeration, public services and city size: Evidence from 286 cities in China. Land Use Policy 2023, 131, 106758. [Google Scholar] [CrossRef]
- Hao, X.; Li, Y.; Ren, S.; Wu, H.; Hao, Y. The role of digitalization on green economic growth: Does industrial structure optimization and green innovation matter? J. Environ. Manag. 2023, 325, 116504. [Google Scholar] [CrossRef]
- Cheng, Z.; Li, L.; Liu, J. Industrial structure, technical progress, and carbon intensity in China’s provinces. Renew. Sustain. Energy. Rev. 2018, 81, 2935–2946. [Google Scholar] [CrossRef]
- Cheng, Y.; Geng, X.; Tian, W. Achieving low-carbon production: Impacts of land misallocation and industrial structure in urban China. Appl. Energy 2025, 378, 124791. [Google Scholar] [CrossRef]
- Shen, H.; Qin, M.; Li, T.; Zhang, X.; Zhao, Y. Digital finance and industrial structure upgrading: Evidence from Chinese counties. Int. Rev. Financ. Anal. 2024, 95, 103442. [Google Scholar] [CrossRef]
- Gan, C.; Zheng, R.; Yu, D. An empirical study on the effects of industrial structure on economic growth and fluctuations in China. Econ. Res. J. 2011, 46, 4–16&31. [Google Scholar]
- Jiang, M.; Luo, S.; Zhou, G. Financial development, OFDI spillovers and upgrading of industrial structure. Technol. Forecast. Soc. Chang. 2020, 155, 119974. [Google Scholar] [CrossRef]
- Yuan, H.; Zhu, C. Do national high-tech zones promote the transformation and upgrading of China’s industrial structure. China Ind. Econ. 2018, 8, 60–77. [Google Scholar] [CrossRef]
- Ren, X.; Zeng, G.; Gozgor, G. How does digital finance affect industrial structure upgrading? Evidence from Chinese prefecture-level cities. J. Environ. Manag. 2023, 330, 117125. [Google Scholar] [CrossRef] [PubMed]
- Liu, W.; Zhang, H.; Huang, Z. A study of industry structure degree, industrialization process and regional difference in China. Econ. Perspect. 2008, 11, 4–8. [Google Scholar]
- Chang, H.; Ding, Q.; Zhao, W.; Hou, N.; Liu, W. The digital economy, industrial structure upgrading, and carbon emission intensity—empirical evidence from China’s provinces. Energy Strategy Rev. 2023, 50, 101218. [Google Scholar] [CrossRef]
- Wu, N.; Liu, Z. Higher education development, technological innovation and industrial structure upgrade. Technol. Forecast. Soc. Change 2021, 162, 120400. [Google Scholar] [CrossRef]
- National Bureau of Statistics of China. China Statistical Yearbook (2024); China Statistics Press: Beijing, China, 2024. [Google Scholar]
- GB/T 4754—2017; Industrial Classification for National Economic Activities (UNSD: 2006, International Standard Industrial Classification of All Economic Activities, NEQ). National Standards of the People’s Republic of China: Beijing, China, 2017.
- Xiang, X.; Fan, Q. Advancing Green TFP Calculation: A Novel Spatiotemporal Econometric Solow Residual Method and Its Application to China’s Urban Industrial Sectors. Mathematics 2024, 12, 1365. [Google Scholar] [CrossRef]


Disclaimer/Publisher’s Note: The statements, opinions and data contained in all publications are solely those of the individual author(s) and contributor(s) and not of MDPI and/or the editor(s). MDPI and/or the editor(s) disclaim responsibility for any injury to people or property resulting from any ideas, methods, instructions or products referred to in the content. |
© 2025 by the authors. Licensee MDPI, Basel, Switzerland. This article is an open access article distributed under the terms and conditions of the Creative Commons Attribution (CC BY) license (https://creativecommons.org/licenses/by/4.0/).