Article

Performance Evaluation of Beluga Whale Optimization–Long Short-Term Memory–Random Forest Networks for Trajectory Control and Energy Optimization in Excavator Systems

1
Graduate School of Mechanical and Automotive Engineering, University of Ulsan, Ulsan 44610, Republic of Korea
2
School of Mechanical Engineering, University of Ulsan, Ulsan 44610, Republic of Korea
*
Author to whom correspondence should be addressed.
Mathematics 2025, 13(7), 1177; https://doi.org/10.3390/math13071177
Submission received: 3 March 2025 / Revised: 25 March 2025 / Accepted: 27 March 2025 / Published: 2 April 2025
(This article belongs to the Section E2: Control Theory and Mechanics)

Abstract

:
Over the past few years, reducing energy consumption in hydraulic excavators has gained increasing attention, driving significant research in this field. One effective strategy involves integrating hydrostatic transmission (HST) and hydraulic pump/motor (HPM) systems into hydraulic excavators. However, challenges like disturbances, throttling-induced pressure drops, and fluid leakage often hinder both positional accuracy and energy efficiency. To tackle these issues, our study proposes a sophisticated dynamic forecasting model for positional control, integrating beluga whale optimization (BWO), long short-term memory (LSTM), and random forest (RF) techniques. The approach begins with dynamic data evaluation using Pearson’s correlation analysis to identify tuning parameters that have moderate to strong correlations with control variables, which are then used as inputs for predictive modeling. Initially, a standalone LSTM framework is developed to estimate the system’s positional output, with BWO optimizing four key tuning parameters. Subsequently, a hybrid BWO-enhanced LSTM-RF system is deployed to capture complex nonlinear patterns, improving the accuracy of motion trajectory predictions. Simulations and experiments confirm that our approach achieves a positional error below 3 mm, ensuring precise tracking and providing reliable data for operators. Compared to conventional proportional–integral–derivative (PID) controllers, standalone LSTM-RF, and a hybrid controller combining particle swarm optimization (PSO), LSTM, a gated recurrent unit (GRU), and PID (PSO-LSTM-GRU-PID), our method achieves superior tracking precision and energy savings of 12.46%, 8.98%, and 3.97%, respectively.

1. Introduction

The escalating pressures of resource scarcity and environmental degradation have heightened the demand for innovative solutions in energy-intensive industries such as infrastructure and agriculture, where heavy machinery, notably hydraulic excavators (HEs), significantly contributes to global energy consumption and greenhouse gas emissions [1]. HEs, indispensable in these sectors, account for a substantial share of operational energy use, making them critical targets for advancements in energy efficiency and sustainability [2]. Current hybrid architectures, integrating an internal combustion engine (ICE) with advanced powertrains, aim to enhance energy efficiency in HEs. For instance, Do et al. [3] proposed an electric hybrid hydraulic excavator that optimizes ICE–hydraulic pump synergy, improving efficiency across diverse conditions. However, this approach struggles with torque management under high loads due to the limited capacity of the hydraulic pump. Similarly, Nguyen et al. [4] introduced a hydrostatic transmission paired with a planetary gear system, expanding the ICE’s operational range and enhancing adaptability, yet it falls short in delivering precise actuator control essential for operational accuracy and safety. These limitations, namely insufficient adaptability to dynamic conditions and high computational complexity, highlight the need for novel control strategies that effectively balance energy efficiency and robust performance in challenging HE scenarios.
Recent advancements in machine learning and metaheuristic optimization have spurred the development of intelligent control systems to tackle these challenges. Within the last five years, significant contributions include Ben Hazem et al. [5], who optimized an adaptive neuro-fuzzy inference system (ANFIS) using an enhanced particle swarm optimization (PSO) algorithm for improved actuator precision, and Song et al. [6], who employed a hybrid adaptive quantum PSO (HAQPSO) to tune PID parameters, achieving notable accuracy gains. Nguyen et al. [7] advanced this field with a PSO-LSTM-GRU-PID model, integrating PSO with LSTM and GRU networks to achieve positional errors below 3 mm and energy savings of up to 10.89%. However, its computational complexity hinders real-time applicability under rapidly shifting conditions. Likewise, Xuanyu et al. [8] proposed a beluga whale optimization–long short-term memory–gated recurrent unit (BWO-LSTM-GRU) framework for dynamic trajectory prediction, yet its reliance on GRU- and PID-like elements limits adaptability and increases processing demands, reducing its effectiveness in high-stakes hydraulic environments.
Despite these strides, existing methods often fail to reconcile precision, adaptability, and computational efficiency. The PSO-LSTM-GRU-PID model, for instance, integrates particle swarm optimization with a combination of LSTM and GRU networks alongside a PID controller, resulting in a highly complex architecture. This complexity not only increases the computational burden and makes real-time processing challenging but also complicates hyperparameter tuning. As a result, performance may be less robust under the pronounced nonlinearity, time delays, and noise typical of hydraulic environments. Similarly, the BWO-LSTM-GRU framework, while improving tracking accuracy, lacks the flexibility to handle abrupt operational shifts due to its dependence on GRU components. To address these shortcomings, this study proposes the beluga whale optimization–long short-term memory–random forest (BWO-LSTM-RF) framework. By replacing the GRU and traditional PID elements with a random forest (RF) module, this approach reduces computational complexity while enhancing adaptability to dynamic behaviors. Leveraging BWO to optimize four key LSTM-RF hyperparameters, the proposed model achieves boom cylinder trajectory errors below 3 mm and energy savings of up to 12.46%, outperforming conventional PID, LSTM-RF, and PSO-LSTM-GRU-PID systems by 12.46%, 8.98%, and 3.97%, respectively. Validated through AMESim simulation and experimental trials on a physical platform, this model-free design minimizes processing demands, offering a scalable, efficient solution for hybrid hydraulic excavators (HHEs).
To address these challenges with the proposed BWO-LSTM-RF framework, it is essential to first understand the system setup and its operational dynamics, which are detailed in the next section. The remainder of this paper is organized as follows: Section 2 outlines the system setup, Section 3 details the hybrid algorithmic control principles, Section 4 evaluates performance through simulation and experimental analysis, Section 5 examines economic implications, and Section 6 concludes with key findings and future directions.

2. Overview of the Setup

2.1. Drivetrain Analysis

To improve power conservation, this work builds on its established success in hydraulic applications as demonstrated in [4], as depicted in Figure 1. At the core of its functionality, the HST and HPM regulate the planetary gear’s output shaft, enabling seamless integration with the HM and ensuring smooth transitions between ′boom-up’ and `boom-down’ modes under varying conditions. Leveraging this proven framework, we implement the BWO-LSTM-RF controller to enhance positional accuracy and energy efficiency across a range of speeds and operational scenarios. This algorithm-driven approach actively enhances the system’s intrinsic advantages, delivering an effective solution for practical HE operations.
Within this system framework, the motor, engine, and hydrostatic transmission components align with the sun, carrier, and ring gears, respectively, forming the core of the planetary gear arrangement. To understand the system’s dynamic performance, it is crucial to analyze the rotational speeds of these gears, which are governed by Equation (1) [4], providing the mechanical foundation that underpins the efficacy of the BWO-LSTM-RF control strategy.
ω r × d r = ω ca × d r + d s ω s × d s
where the diameter and speed are considered, denoted as d r and ω r for the ring gear and d s and ω s for the sun gear. The carrier’s speed is indicated by ω ca .
The HST ratio is described by Equation (2).
i hst = ω r ω hpm
where ω hpm represents the speed of the pump while i hst reflects the transmission ratio of the HST. Equation (3) governs these parameters, ensuring that the system’s operational dynamics are effectively captured.
ω hpm = q c D hpm η v
where η v represents the volumetric efficiency of the HPM and q c indicates its flow rate. By applying Equations (2) and (3), the appropriate HPM displacement and HST ratio can be identified based on the necessary flow rate. This approach leads to numerous potential combinations for the ICE and EMG speeds, as described by Equation (1).
Equation (4) determines the torque for each gear [4].
T r : T s : T ca = d r : d s : d r + d s
where T ca , T s , and T r represent the torque values associated with the carrier, sun, and ring gears, respectively. The torque generated by the HPM is determined by the pressure at its output, as outlined in Equation (5).
T hpm = p c D hpm 2 π η m = i hst T r
where T hpm signifies the torque produced by the HPM while p c reflects the pressure at the HPM’s output. Furthermore, D hpm defines the displacement of the HPM and η m indicates its hydro-mechanical performance. The torque generated by the HPM, denoted as T hpm , impacts the torque of the ring gear.
By applying Equations (4) and (5), it is possible to determine T ca and T s , which are subsequently presented in Equations (6) and (7).
T ca = d r + d s p c D hpm 2 π i hst d r η m η hst
T s = d s p c D hpm 2 π i hst d r η m η hst
where p c represents the critical pressure in the system, essential for analyzing the hydraulic performance and efficiency.

2.2. Analysis of Critical Parameters

Table 1 summarizes the key specifications of the system’s primary components. In this configuration, a main pump is utilized, which plays a vital role in system operation. The ICE and EMG deliver essential energy, with their efficiency characteristics detailed in [4]. Furthermore, the battery’s energy capacity is evaluated; to prolong its durability by avoiding severe depletion and excessive charging, the working range is generally kept within 30–90% of full capacity [9].

2.3. Energy Management Strategy

As highlighted previously, the EMS plays a pivotal role in determining the system’s overall energy performance. To further improve performance, we utilize an ECMS, which we specifically designed to identify operating conditions that minimize fuel consumption in HEs. Given the unique attributes of our system, we adopted the ECMS as an optimal strategy to implement an effective EMS. The underlying cost function, detailed in Equation (8), provides a quantitative framework for enhancing fuel economy [4].
m ˙ Σ = m ˙ eng + s ( t ) × m ˙ mot
where m ˙ Σ signifies the overall fuel usage while m ˙ eng and m ˙ mot denote the energy consumption rates for the engine and the motor, respectively. The s ( t ) mechanism converts electrical energy consumption into its fuel equivalent, as delineated by Equation (9) [10].
s ( t ) = 1 η eng × η eng × η mge × 1 S O C S O C a 4 × S O C max S O C min 3 , ω s T s > 0 η mot × η d η eng × 1 S O C S O C a 0.5 × S O C max S O C min 3 , ω s T s 0
where η eng corresponds to the efficiency of the engine; η mge indicates the power generation performance of the motor; η mdr signifies the operational efficiency of the motor in driving mode; η d and η ch represent the discharging and charging performance metrics of the battery, respectively. Additionally, S O C max signifies the maximum state of charge, S O C min denotes the minimum state of charge, and S O C a indicates the average state of charge, calculated over a specific operational cycle.
Equation (10) determines the SOC for a battery [11], taking into account multiple parameters: the starting SOC init , the charge transfer efficiency η bat , the energy output P mot , and the battery’s rated energy storage E bat .
SOC = SOC init + o t P mot 3600 η bat E bat d t
where P mot can be expressed by Equation (11):
P mot = ω s T s 9550
In the ECMS, m ˙ eng and m ˙ mot can be expressed by Equations (12) and (13) [12].
m ˙ eng = o t ω ca T ca 9550 η eng
m ˙ mot = o t ω s T s 9550 × η mge η bat , P mot > 0 o t ω s T s η mot η bat 9550 , P mot 0
where η eng , η mot , and η bat indicate the performance metrics of the engine, motor, and battery, respectively, while m ˙ eng and m ˙ motor represent the energy outputs of the ICE and the battery’s equivalent contribution.
With the system setup and energy management strategy established, the next section delves into the core principles of the hybrid BWO-LSTM-RF control algorithm.

3. Core Principles of Hybrid Algorithmic Control

To improve both positional accuracy and power efficiency within the system, this study employs the BWO-LSTM-RF controller to orchestrate the interplay of its key components. Specifically, we refined cylinder positioning through precise valve adjustments that modulated the control valve’s aperture. Meanwhile, the HST optimized energy usage by regulating system dynamics. We depict this synergistic approach, facilitated by the BWO-LSTM-RF framework, in Figure 2, with its operational details elaborated in the subsequent section. Within this schematic, x d represents the desired command (for instance, a specified position or speed), while y r denotes the measured output, providing feedback to ensure that the system’s response closely follows x d and minimizes any deviation.

3.1. Beluga Whale Optimization (BWO) Algorithms

Zhong et al. [13] introduced the beluga whale optimization (BWO) algorithm, which mimics the hunting patterns of beluga whale groups along with the phenomenon of whale fall. This algorithm is primarily structured into three phases: exploration, exploitation, and whale fall, with detailed procedures outlined as follows:
Step 1: Define the position matrix for beluga whales in the search space:
Y = y 1 , 1 y 1 , 2 y 1 , d y 2 , 1 y 2 , 2 y 2 , d y n , 1 y n , 2 y n , d
where n represents the population size of beluga whales and d indicates the dimensionality of the variables. The associated fitness value for each beluga whale is as follows:
F Y = f y 1 , 1 , y 1 , 2 , , y 1 , d f y 2 , 1 , y 2 , 2 , , y 2 , d f y n , 1 , y n , 2 , , y n , d
Subsequently, the transition from the exploration phase to the exploitation phase hinges on the equilibrium factor B f , formulated as follows:
B f = B 0 1 t 2 T
Here, t signifies the current iteration number, T denotes the maximum number of iterations, and B 0 is a random value between 0 and 1. A value of B f > 0.5 indicates that the population is in the exploration phase, while B f 0.5 signifies the exploitation phase.
Step 2: The exploration phase of the algorithm is modeled based on the swimming patterns of beluga whales. The position update equation for beluga whales is as follows:
Y i , j t + 1 = Y i , p j t + Y r , p 1 t Y i , p j t 1 + r 1 sin 2 π r 2 , j = even Y i , j t + 1 = Y i , p j t + Y r , p 1 t Y i , p j t 1 + r 1 cos 2 π r 2 , j = odd
where Y i , j t + 1 indicates the position of the i-th beluga whale in the j-th dimension, P j represents a random index within the d-dimensional space, and Y i , p j t denotes the current position of the i-th beluga whale. The random numbers r 1 and r 2 , ranging from ( 0 , 1 ) , enhance the stochastic nature of the update. The terms sin 2 π r 2 and cos 2 π r 2 reflect the fin orientations of beluga whales in odd or even dimensions, capturing their synchronized or mirrored movements during swimming or diving.
Next, Step 3 involves the exploitation phase of the algorithm, modeled after the foraging behavior of beluga whales, incorporating the Levy flight strategy to boost convergence, expressed as follows:
Y i t + 1 = r 3 Y best t r 4 Y i t + C 1 · L F · Y r t Y i t
where Y best t is the optimal position found, r 3 and r 4 are random numbers between 0 and 1, Y i t denotes the current position of the i-th beluga whale, and Y r t indicates the position of a randomly selected beluga whale. The parameter C 1 = 2 r 4 1 t / T max measures the intensity of random jumps in the Levy flight.
The Levy flight function L F is defined as follows:
L F = 0.05 × u × σ | v | 1 / β
σ = Γ ( 1 + β ) × sin ( π β / 2 ) Γ ( ( 1 + β ) / 2 ) × β × 2 ( β 1 ) / 2 1 / β
where u and v are random numbers following a normal distribution, with β set to 1.5.
Step 4: Model the whale-fall phase when a beluga whale faces threats, updating the position equation as follows:
Y i t + 1 = r 5 Y i t r 6 Y r t + r 7 Y step
where r 5 , r 6 , and r 7 are random numbers between 0 and 1.
The whale-fall step size Y step is formulated as follows:
Y step = u b l b exp C 2 t T
where C 2 = 2 W f × n represents the step factor linked to the whale-fall probability and population size and u b and l b are the upper and lower boundaries of the variables.
The whale-fall probability W f is given by the following:
W f = 0.1 0.05 t / T

3.2. Long Short-Term Memory (LSTM) Algorithm

LSTM [14,15,16] is a notable variant of recurrent neural networks (RNNs) that mitigates the vanishing gradient problem common in conventional RNNs. It accomplishes this by utilizing three primary gates: the discard gate, the input gate, and the output gate. These gates operate in concert to selectively capture and update long-term information, thereby enabling the network to model dependencies across lengthy sequences. In practical applications, LSTM has been effectively applied to various time-series prediction tasks, including forecasting crude oil prices and estimating the operational lifespan of electronic components such as power MOSFET devices. More specifically, the discard gate employs a logistic activation to determine the proportion of historical data to retain, where a value of 1 signifies full retention of past information while 0 indicates complete removal. Figure 3 illustrates the internal structure of an LSTM cell, showcasing how these gates coordinate to manage data flow and preserve long-range dependencies.
g f = sigmoid W f · h t 1 , x t + b f
The forget gate within an LSTM cell controls the extent to which past information is retained in the cell state, thus managing the retention of historical data. This process is mathematically described as follows:
g i = sigmoid W i · h t 1 , x t + b i
S ˜ t = tanh W s · h t 1 , x t + b s
S t = g f · S t 1 + g i · S ˜ t
The output gate calculates its result by integrating the prior state with the present input, which can be expressed mathematically as follows:
g o = sigmoid W o · h t 1 , x t + b o
h t = g o · tanh S t
In this framework, x t represents the input vector at the current time step. The weight matrices W f , W i , and W o , along with their corresponding bias terms b f , b i , and b o , are associated with the forget, input, and output gates, respectively. The prior hidden state is indicated by h t 1 . The outputs from these gates are denoted as g f , g i , and g o . Moreover, S t signifies the current cell state while S ˜ t denotes the candidate state. Lastly, the parameters W s and b s govern the integration of new information into the temporary cell memory.

3.3. Random Forest (RF) Technique

The random forest (RF) is an ensemble learning approach developed by Breiman to address classification challenges [17]. It mitigates overfitting by aggregating numerous decision trees, each constructed from distinct bootstrap samples of the dataset [18]. These trees are grown to their fullest depth or halted by a termination condition, employing a randomly chosen subset of features at each node to reduce impurity, typically assessed via the Gini index:
G ( t ) = 1 k = 1 K p k 2
where p k represents the fraction of samples belonging to class k. Each tree produces a predicted class y ˜ i ( x ) for an input x, and the final RF prediction is derived through a majority vote across all tree predictions y ˜ ( x ) .
y ˜ ( x ) = majority y ˜ 1 ( x ) , y ˜ 2 ( x ) , , y ˜ N ( x )
where “majority” refers to the most common class among the classifications from all trees. This method not only curtails overfitting but also enhances generalization capabilities, positioning the RF as a robust and dependable tool for classification tasks [19]. Figure 4 depicts the structure of the RF classification framework.

3.4. Assessment Metrics for Controller Effectiveness

In this study, we evaluate the performance of the proposed controller using two key metrics: positional accuracy and system energy usage. To measure positional accuracy, the cylinder displacement error is assessed through the root mean square error (RMSE) and the mean absolute error (MAE). These metrics facilitate a quantitative comparison between the proposed controller and other controllers, allowing for well-informed conclusions regarding their ability to achieve precise and accurate control of the cylinder’s position. The RMSE and MAE are defined as follows:
R M S E = 1 m j = 1 m e j 2
M A E = 1 m j = 1 m | e j |
where m denotes the total number of displacement error samples e ( e j , where j = 1 , 2 , 3 , , m ).

4. Performance Evaluation and Experimental Analysis

To rigorously evaluate the effectiveness of the proposed control approach, this study conducted comprehensive assessments across multiple scenarios using both simulations and experimental trials.
The performance and precision of the BWO-LSTM-RF algorithm were validated through data collected from a test bench designed to replicate boom cylinder dynamics. Integrated with an ECMS for energy management, the algorithm was implemented and controlled via Simulink, enabling precise trajectory tracking and optimized energy usage. Concurrently, a simulation model incorporating BWO-LSTM-RF and an ECMS was developed and tested in Python 3.8.8, with its lifting performance benchmarked against experimental results from the test bench. The close correspondence between simulation predictions and experimental outcomes underscores the algorithm’s accuracy, with only minor deviations observed between the virtual and real-world data.

4.1. Development of the Simulation Environment

4.1.1. Model Configuration

A simulation environment was constructed using AMESim (version 2310), as depicted in Figure 5. This setup was designed to assess the controllability of the system and validate its potential for energy savings.

4.1.2. Evaluation of Simulation Outcomes and Discussion

Figure 6 illustrates a comparative analysis of the boom cylinder’s position along with its tracking error profiles during both the upward and downward movements. Both the LSTM-RF and BWO-LSTM-RF controllers outperform the PID controller in tracking precision, with the BWO-LSTM-RF variant achieving enhanced accuracy and faster convergence by fine-tuning four key hyperparameters of the LSTM-RF framework. To ensure an objective evaluation, the mean absolute error (MAE) and root mean square error (RMSE) for all three controllers are presented in Figure 7a,b. Table 2 shows that BWO-LSTM-RF consistently delivers a lower RMSE, reduced to approximately 8.59% of that of PSO-LSTM-GRU-PID, 36.97% of that of LSTM-RF, and 60.7% of that of PID, with MAE values following a similar trend, being reduced to 7.33% of that of PSO-LSTM-GRU-PID, 36.54% of that of LSTM-RF, and 60.69% of that of PID, consistently favoring the BWO-enhanced controller. These findings underscore the marked improvement in tracking accuracy attributable to optimized hyperparameter settings.
In most instances, the controller that we developed exhibits exceptional positional accuracy, primarily due to the effective integration of its system components. To further evaluate the system’s performance, the ICE’s operational characteristics, including speed and torque, are analyzed in Figure 8a, which illustrates the ICE’s speed profile, Figure 8b, which depicts the torque characteristics, and Figure 8c, which outlines the energy consumption metrics. Beyond positional accuracy, energy usage remains a vital performance indicator. A mode-by-mode analysis reveals that the BWO-LSTM-RF controller achieves energy consumption reductions of 3.301 kJ, 7.304 kJ, and 10.997 kJ compared to the PSO-LSTM-GRU-PID, LSTM-RF, and PID controllers, respectively. Collectively, these findings affirm that the proposed controller offers remarkable energy efficiency.
In conclusion, the simulation results provide a thorough assessment of the BWO-LSTM-RF controller’s effectiveness in the system. Even amid complex noise, this controller sustains exceptional positional accuracy while achieving notable energy reductions across various operating conditions. Remarkably, it delivers energy savings of 3.69% compared to the PSO-LSTM-GRU-PID controller, 7.83% compared to the LSTM-RF controller, and 11.33% compared to the PID controller, as validated by statistical tests. Moreover, the improved efficiency is further corroborated by the comparative data summarized in Table 3.
To further validate the energy savings reported in Table 3, we conducted statistical tests to compare the energy consumption of the BWO-LSTM-RF controller against each baseline controller (PSO-LSTM-GRU-PID, LSTM-RF, and PID). Time-series energy consumption data were extracted from Figure 8c, providing 70 paired samples per controller (assuming a 1 s sampling interval over 69.49 s). The Shapiro–Wilk test indicated non-normal distributions for all differences (e.g., p = 0.0130 for BWO-LSTM-RF vs. PSO-LSTM-GRU-PID, p < 0.05 ), so we performed Wilcoxon signed-rank tests. All comparisons showed statistically significant energy savings with p-values far below the 0.05 threshold ( p < 10 4 ), meaning that the probability of these savings occurring by chance is extremely low (less than 0.01%):
  • BWO-LSTM-RF vs. PSO-LSTM-GRU-PID: 3.69% savings ( p < 10 4 ).
  • BWO-LSTM-RF vs. LSTM-RF: 7.83% savings ( p < 10 4 ).
  • BWO-LSTM-RF vs. PID: 11.33% savings ( p < 10 4 ).
An analysis of algorithm runtimes, as detailed in Table 4, indicates that the PSO-LSTM-GRU-PID controller requires the highest training duration at 1977.65 s, with the BWO-LSTM-RF and LSTM-RF controllers requiring 1680.93 and 1185.45 s, respectively. The incorporation of PSO markedly extends the training period compared to the less computationally intensive LSTM-RF, while PID, owing to its simplicity, requires no training phase. Notably, all algorithms share an identical testing time of 69.49 s, suggesting uniform testing efficiency despite their varying training complexities.

4.2. Experimental Setup and Methodology

4.2.1. System Configuration and Instrumentation

A dedicated experimental testbed was constructed to assess the real-world performance of the BWO-LSTM-RF controller within the system. As depicted in Figure 9, this setup was engineered to replicate the operating conditions of a hydraulic excavator boom in a laboratory environment. The controller was deployed using MATLAB/Simulink software R2023a and connected via Simulink Desktop Real-Time. Communication with system components was facilitated through a PCI card that transmitted signals to an electrical enclosure managing the ICE (1) along with other key elements. For data acquisition, sensors measuring speed and torque were affixed to the ICE shaft to monitor energy consumption, while a sensor on the cylinder was employed to assess tracking performance.
In the experimental phase, four controllers were evaluated side-by-side to emphasize the practical advantages of the proposed method. Additionally, during cylinder extraction, the efficiency map of the ICE (illustrated in Figure 10) confirms that performance is a function of both torque and speed.
A robust control framework was developed using MATLAB/Simulink, as shown in Figure 11, to govern the real-time operation of a hydraulic actuator. This framework not only replicates the system dynamics for validation of the proposed control strategy but also actively manages the experimental setup, ensuring precise actuator positioning and enhanced energy efficiency.
By utilizing this MATLAB/Simulink-based control framework, we implemented the BWO-LSTM-RF model. Table 5 presents an overview of the key parameters and features of the algorithm used in our research, describing the model’s structure, input sequence duration, activation mechanisms, and application of the Adam optimizer. Furthermore, the table specifies how BWO is utilized for hyperparameter optimization, with the goal of reducing the mean squared error (MSE).

4.2.2. Performance Evaluation and Analysis

Figure 12 and Figure 13 illustrate the tracking performance metrics for the three controllers evaluated in this study. The data indicate that the proposed BWO-LSTM-RF controller consistently outperforms the PID, LSTM-RF, and PSO-LSTM-GRU-PID controllers, maintaining a maximum positioning error of less than 0.02 m (see Figure 12). Additionally, the BWO-LSTM-RF controller exhibits faster response times and more rapid convergence across various operational conditions, including different raising and lowering scenarios with variable speeds and loads, thanks to its optimized control parameters. Table 6 and Figure 13a,b demonstrate that BWO-LSTM-RF consistently achieves the lowest error metrics, reducing its RMSE to approximately 9.41% of PSO-LSTM-GRU-PID’s, 34.88% of LSTM-RF’s, and 61.34% of PID’s, while lowering MAE values to 6.55% of PSO-LSTM-GRU-PID’s, 33.66% of LSTM-RF’s, and 60.86% of PID’s. This superiority underscores the enhanced performance of the BWO-enhanced controller.
By analyzing the recorded torque and speed data, the efficiency for each operating point is estimated using the engine efficiency map shown in Figure 14. This estimation is then employed to calculate the energy consumption of the engine.
Owing to the enhanced performance of the proposed controller, the ICE undergoes a rapid acceleration between 10.5 and 11 s, as illustrated in Figure 15a. During this phase, the ICE attains a peak speed of 282 rpm, which, in turn, facilitates a more prompt cylinder response and a swifter decrease in displacement error.
Figure 15c depicts the energy consumption comparison across four working modes, highlighting the superior efficiency of the BWO-LSTM-RF controller. This approach yields reduced energy usage, securing savings of 12.46% relative to the PID controller, 8.98% relative to the LSTM-RF controller, and 3.97% relative to the PSO-LSTM-GRU-PID controller.
Moreover, the enhanced efficiency is further corroborated by the comparative data summarized in Table 7.
To validate the energy savings reported in Table 7, we conducted statistical tests using time-series energy consumption data extracted from Figure 15c, providing 70 paired samples per controller (assuming a 1 s sampling interval over 69.49 s). The Shapiro–Wilk test indicated non-normal distributions for all differences (p < 0.05), so we performed Wilcoxon signed-rank tests. All comparisons showed statistically significant energy savings with p-values far below the 0.05 threshold ( p < 10 4 ), meaning that the probability of these savings occurring by chance is extremely low (less than 0.01%):
  • BWO-LSTM-RF vs. PSO-LSTM-GRU-PID: 3.97% savings ( p < 10 4 ).
  • BWO-LSTM-RF vs. LSTM-RF: 8.98% savings ( p < 10 4 ).
  • BWO-LSTM-RF vs. PID: 12.46% savings ( p < 10 4 ).
A comparative evaluation of algorithm runtimes, as presented in Table 8, indicates that the PSO-LSTM-GRU-PID controller demands the longest training duration at 2005.22 s, followed by the BWO-LSTM-RF controller at 1702.15 s and the LSTM-RF controller at 1201.87 s. The inclusion of PSO substantially extends the training phase compared to the more streamlined LSTM-RF, whereas the PID controller, due to its straightforward design, requires no training. All algorithms exhibit an identical testing time of 69.49 s, demonstrating uniform testing performance despite their diverse training requirements. In a MATLAB environment, these training durations are anticipated to closely align with those from Python-based simulations, owing to the similarities in their core processing frameworks and model structures.
The results indicate that the BWO-LSTM-RF controller effectively mitigates challenges such as acoustic disturbances, throttling-induced pressure losses, and fluid leakage while simultaneously achieving outstanding positional accuracy and efficient power management throughout the system. Experimental evaluations further confirm its robust performance, particularly in enhancing boom excavator operations. Moreover, as detailed in Table 9, the minimal discrepancies in energy consumption between simulation and experimental trials underscore the controller’s consistency and reliability in practical applications.
The experimental results presented above demonstrate the superior performance of the proposed BWO-LSTM-RF controller in terms of trajectory accuracy, energy efficiency, and operational consistency across various working conditions. To further contextualize these findings within the broader landscape of hydraulic excavator control, a comparative analysis with recent studies is essential. Table 10 provides a comprehensive comparison of the proposed controller against state-of-the-art methods reported in the literature, focusing on both trajectory control accuracy (measured by RMSE) and energy efficiency (measured by energy saving percentage). This comparison highlights the advancements achieved by BWO-LSTM-RF over existing approaches, reinforcing its potential for practical applications in hydraulic excavator systems.

5. Economic Analysis of Proposed Algorithm

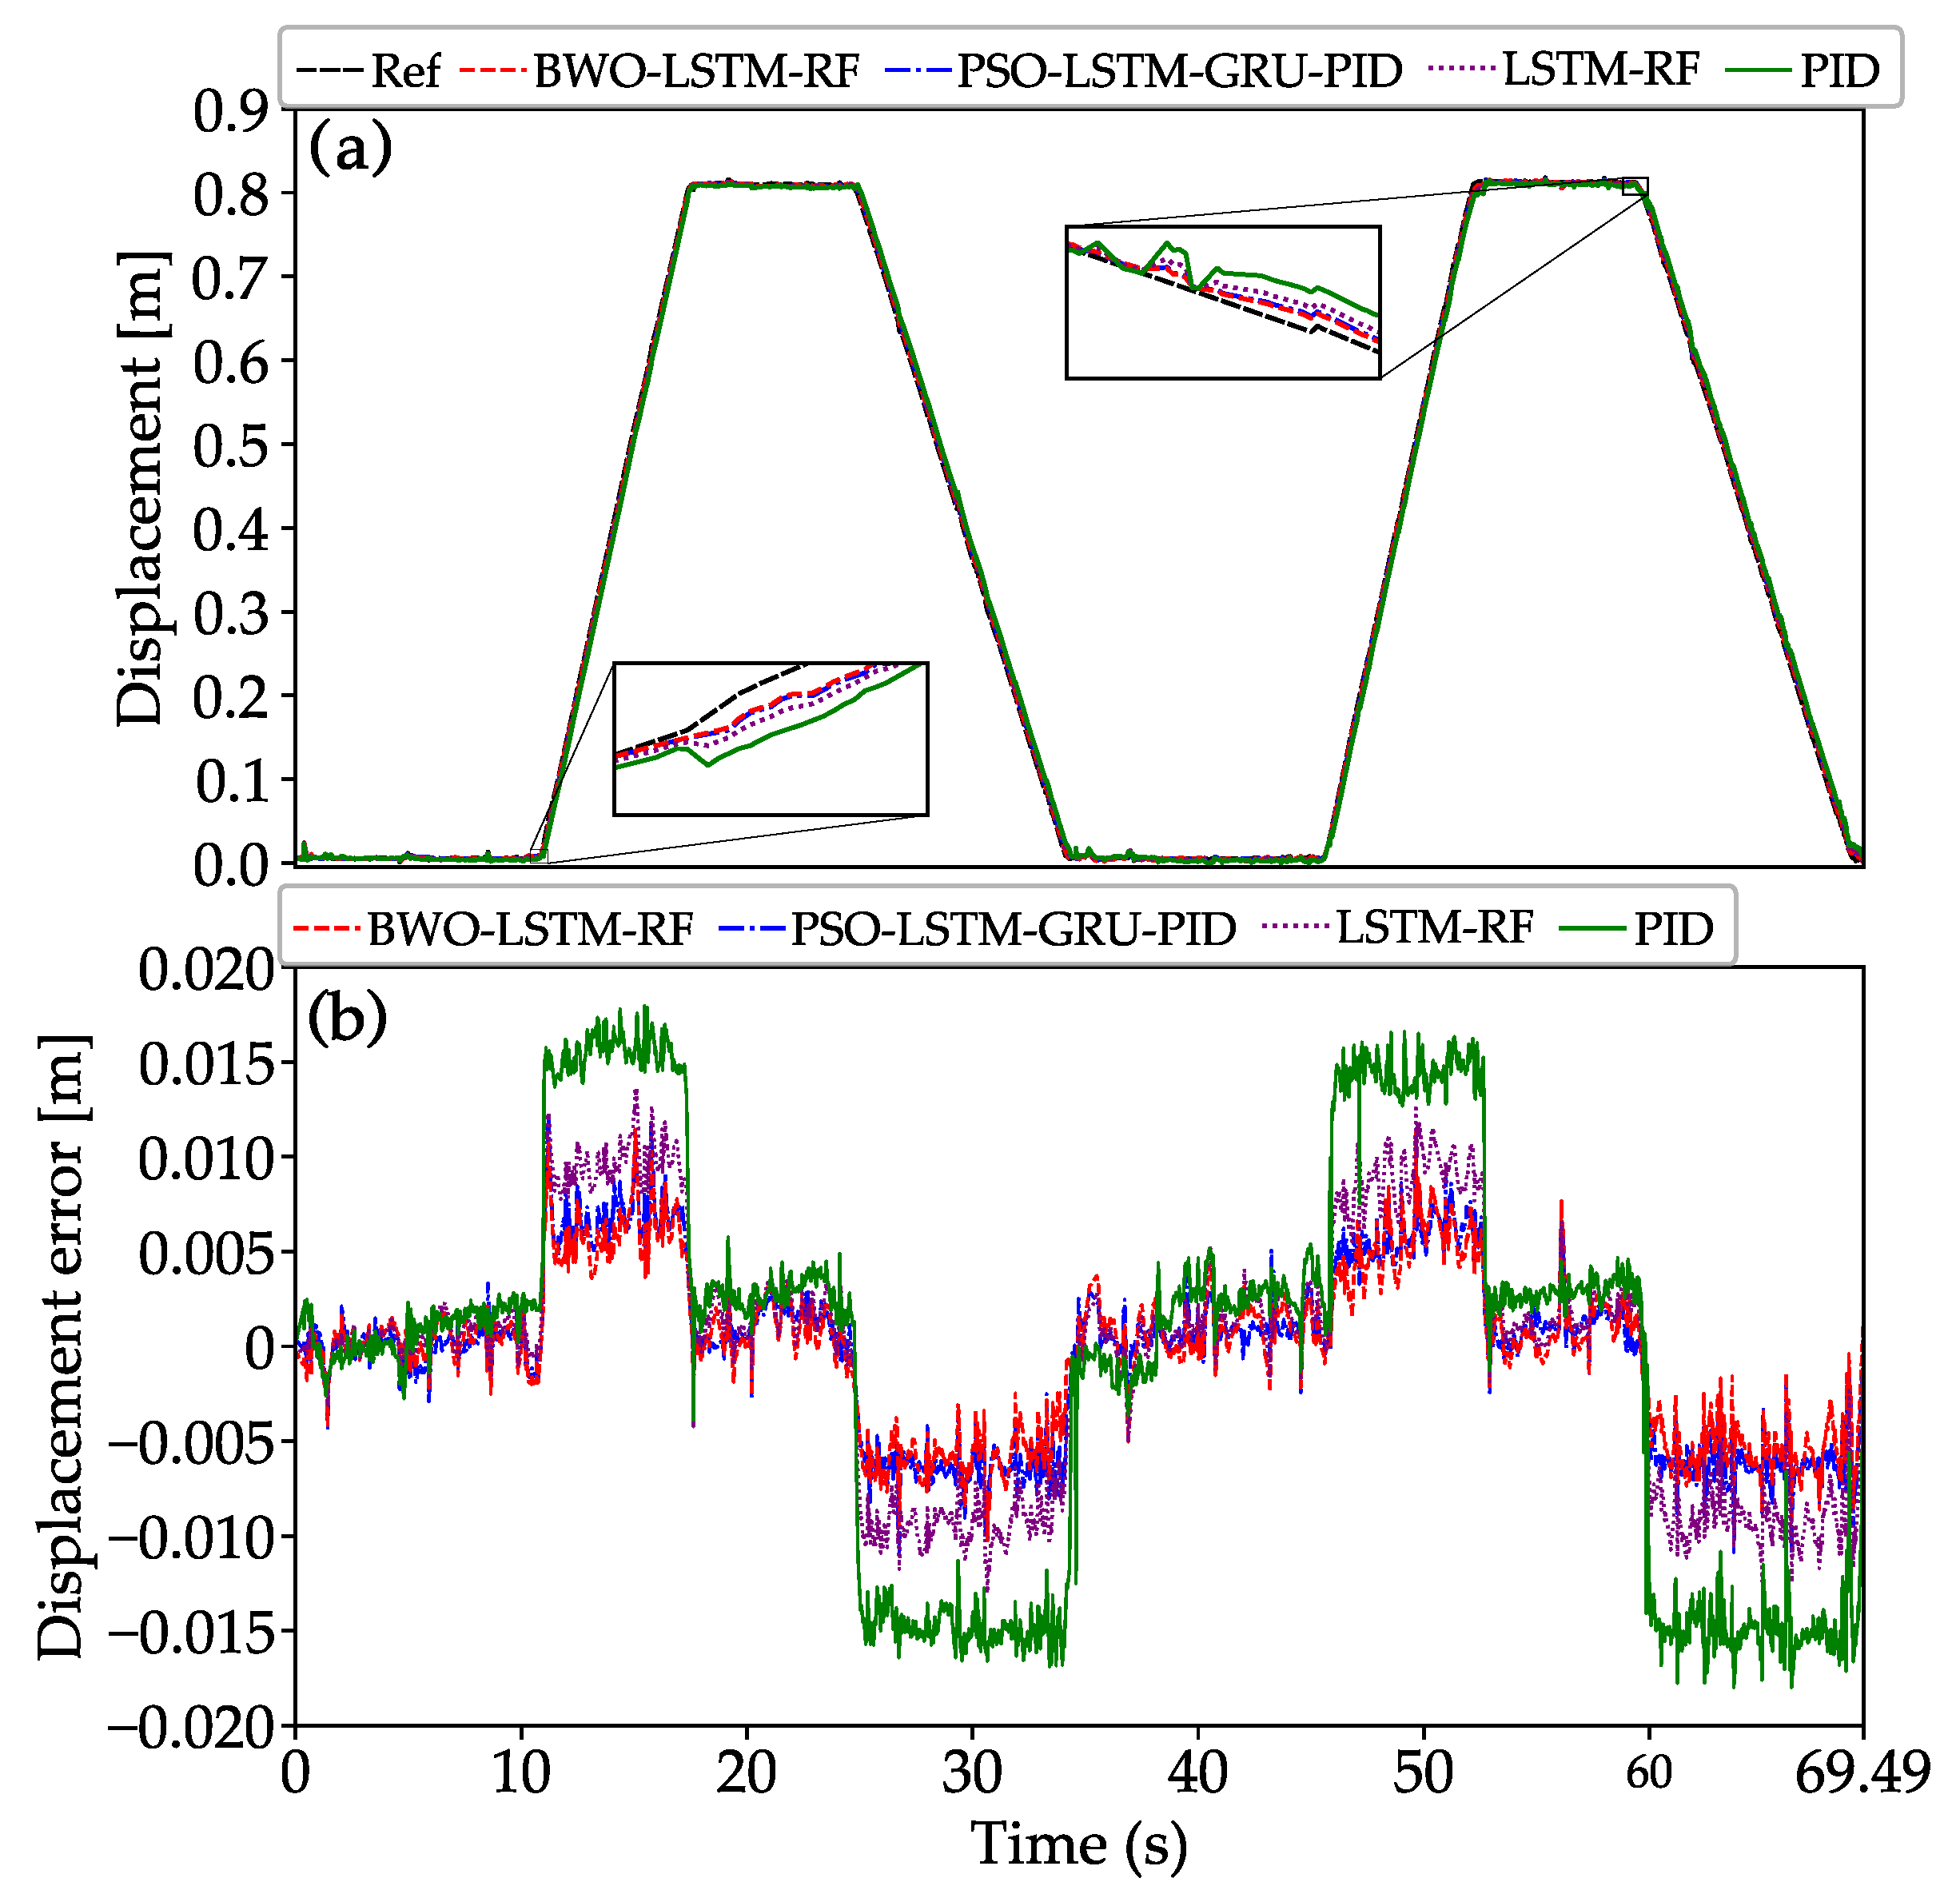
The BWO-LSTM-RF framework offers considerable potential to reshape the design and operation of future hydraulic excavators, while delivering notable economic and environmental benefits. In terms of design, the framework’s ability to achieve positional accuracy below 3 mm and energy savings of up to 12.46% compared to traditional PID controllers could reduce the reliance on oversized hydraulic components, often used to compensate for control inaccuracies. This advancement may enable manufacturers to develop lighter, more compact excavators, lowering material costs and enhancing mobility without compromising performance. Operationally, the improved control precision and responsiveness, demonstrated in both simulation and experimental results (e.g., the RMSE reduced to 9.41% of PSO-LSTM-GRU-PID, 34.88% of LSTM-RF, and 61.34% of PID, as shown in Figure 13), could enhance productivity. These improvements minimize downtime and optimize trajectory tracking in dynamic construction environments.
Economically, the energy efficiency gains translate into substantial cost savings for operators. For instance, a 12.46% reduction in energy consumption, as evidenced in Table 11, could save approximately USD 3332 annually per 48 t excavator in fuel costs, particularly in large-scale construction projects where fleets of machines operate for extended periods. This estimate assumes that an excavator operates 10 h per day for 250 days per year, with a load scaled from 800 kg in the experiment to 48 t in real conditions, and uses diesel priced at USD 1.20 per liter as of March 2025. Environmentally, these energy savings contribute to sustainability efforts by reducing greenhouse gas emissions. With the same operational assumptions, the 12.46% decrease could reduce CO2 emissions by approximately 7.3 tons per machine annually, based on a carbon dioxide emission factor of 2.63 kg per liter of diesel [21].
Given the global scale of the construction industry, the proposed framework has significant potential for widespread impact. Based on annual sales data and market trends, the global fleet of hydraulic excavators is estimated to be approximately 6.5 million units in 2025, despite a projected 8% decline in global construction equipment sales to 1.08 million units in that year [22]. With a forecasted recovery in sales to 1.2 million units by 2028, the global fleet is projected to grow to around 6.8 million units by that year [22]. If the BWO-LSTM-RF framework were adopted across this global fleet, the cumulative fuel savings and CO2 reductions could be substantial. For example, applying the per-machine savings to the estimated 6.5 million units in 2025 could result in annual fuel cost savings of approximately USD 21.66 billion and a CO2 emission reduction of around 47.47 million tons, potentially increasing to USD 22.65 billion and 49.66 million tons by 2028. Furthermore, the control precision and energy efficiency improvements offered by the BWO-LSTM-RF framework could be adapted to other construction machines, such as forklifts, further amplifying its potential to reduce fuel consumption and emissions on a global scale.

6. Conclusions

This study introduces the BWO-LSTM-RF control framework to enhance positional accuracy and energy efficiency in boom excavator operations. The key findings are summarized as follows:
  • The BWO-LSTM-RF controller delivers exceptional accuracy, robustness, and responsiveness across diverse operating conditions, effectively handling disturbances such as leakage, pressure drops, and noise, as validated by both simulations and experiments.
  • By leveraging the BWO algorithm, the framework optimizes four critical LSTM-RF hyperparameters, ensuring adaptable and robust operation under varying external conditions.
  • The proposed framework outperforms benchmark controllers in tracking accuracy and energy savings, achieving significant reductions in energy consumption compared to PID, LSTM-RF, and PSO-LSTM-GRU-PID.
Future directions: future efforts will focus on reducing the delay in cylinder actuation to further improve tracking precision in HEs. Additionally, upcoming studies will investigate techniques to recover and reuse potential energy from weight displacement, thereby enhancing overall efficiency. To further validate the universal applicability of the proposed BWO-LSTM-RF framework, we plan to apply and test it under real-world operational conditions, encompassing all phases of excavator tasks and multi-actuator coordination.

Author Contributions

V.H.N. conducted the complete research and methodological design, developed and verified the model and control algorithm through AMESim simulation and Python, organized the experimental setup, and drafted the initial manuscript while also assisting with the setup and reviewing the manuscript. K.K.A. provided overall project leadership and financial support, offering critical guidance and oversight throughout the study as well as contributing to the review and refinement of the manuscript. All authors have read and agreed to the published version of the manuscript.

Funding

This work was supported by “Regional Innovation Strategy (RIS)” through the National Research Foundation of Korea (NRF) funded by the Ministry of Education (MOE), South Korea (2021RIS-003).

Data Availability Statement

Data are contained within the article.

Conflicts of Interest

The authors declare no conflict of interest.

Abbreviations

HEsHydraulic excavators
HHEsHybrid hydraulic excavators
EERSsElectric energy regeneration systems
HERSsHydraulic energy regeneration systems
ICEInternal combustion engine
EMGElectric motor/generator
BATBattery
HSTHydrostatic transmission
HPMHydraulic pump/motor
HMHydraulic motor
EHCVPElectrical hydraulic continually variable powertrain
EMSEnergy management strategy
ECMSEquivalent consumption minimization strategy
A-ECMSAdaptive equivalent consumption minimization strategy
SOCState of charge
BCCylinder
VBControl valve of cylinder
RVRegeneration valve of cylinder
CVCheck valve
CEClutch of engine
CMClutch of electric motor/generator
CP (DbC)Clutch of HPM (double clutch)
CH (DbC)Clutch of HM (double clutch)
RingRing gear
SunSun gear
STSensor torque
SSSensor speed
SDSensor displacement
SVSensor velocity
PSOParticle swarm optimization
LSTMLong short-term memory
GRUGated recurrent unit
PIDProportional–integral–derivative
BWOBeluga whale optimization
RFRandom forest

References

  1. Ding, R.; Zhang, J.; Xu, B.; Cheng, M.; Pan, M. Energy efficiency improvement of heavy-load mobile hydraulic manipulator with electronically tunable operating modes. Energy Convers. Manag. 2019, 188, 447–461. [Google Scholar] [CrossRef]
  2. Chen, M.; Zhao, D. The gravitational potential energy regeneration system with closed-circuit of boom of hydraulic excavator. Mech. Syst. Signal Process. 2017, 82, 178–192. [Google Scholar] [CrossRef]
  3. Do, T.C.; Dinh, T.Q.; Yu, Y.; Ahn, K.K. Innovative powertrain and advanced energy management strategy for hybrid hydraulic excavators. Energy 2023, 282, 128951. [Google Scholar] [CrossRef]
  4. Nguyen, V.H.; Do, T.C.; Ahn, K.K. Hybrid powertrain with dual energy regeneration for boom cylinder movement in a hydraulic excavator. Autom. Constr. 2025, 171, 105974. [Google Scholar] [CrossRef]
  5. Ben Hazem, Z.; Guler, N.; Altaif, A.H. A study of advanced mathematical modeling and adaptive control strategies for trajectory tracking in the Mitsubishi RV-2AJ 5-DOF Robotic Arm. Discov. Robot. 2025, 1, 2. [Google Scholar] [CrossRef]
  6. Song, H.; Li, G.; Li, Z.; Xiong, X. Trajectory Control Strategy and System Modeling of Load-Sensitive Hydraulic Excavator. Machines 2023, 11, 10. [Google Scholar] [CrossRef]
  7. Nguyen, V.H.; Do, T.C.; Ahn, K.K. Implementing PSO-LSTM-GRU Hybrid Neural Networks for Enhanced Control and Energy Efficiency of Excavator Cylinder Displacement. Mathematics 2024, 12, 3185. [Google Scholar] [CrossRef]
  8. Xuanyu, L.; Mengting, J.; Wenshuai, Z.; Yudong, W. Intelligent real-time prediction for shield machine position on the basis of BWO-LSTM-GRU. Eng. Res. Express 2024, 6, 015105. [Google Scholar] [CrossRef]
  9. Hu, B.; Li, J. A Deployment-Efficient Energy Management Strategy for Connected Hybrid Electric Vehicle Based on Offline Reinforcement Learning. IEEE Trans. Ind. Electron. 2022, 69, 9644–9654. [Google Scholar] [CrossRef]
  10. Wei, C.; Chen, Y.; Sun, X.; Zhang, Y. Optimal Equivalent Consumption Minimization Strategy for Plug-In Hybrid Electric Vehicle with Improved Genetic Algorithm. SAE Int. J. Electrified Veh. 2020, 9, 143–154. [Google Scholar] [CrossRef]
  11. Zhou, D.; Al-Durra, A.; Matraji, I.; Ravey, A.; Gao, F. Online Energy Management Strategy of Fuel Cell Hybrid Electric Vehicles: A Fractional-Order Extremum Seeking Method. IEEE Trans. Ind. Electron. 2018, 65, 6787–6799. [Google Scholar] [CrossRef]
  12. Yang, C.; Du, X.; Wang, W.; Yuan, L.; Yang, L. Variable optimization domain-based cooperative energy management strategy for connected plug-in hybrid electric vehicles. Energy 2024, 290, 130206. [Google Scholar] [CrossRef]
  13. Zhong, C.; Li, G.; Meng, Z. Beluga whale optimization: A novel nature-inspired metaheuristic algorithm. Knowl.-Based Syst. 2022, 251, 109215. [Google Scholar] [CrossRef]
  14. Hochreiter, S.; Schmidhuber, J. Long Short-Term Memory. Neural Comput. 1997, 9, 1735–1780. [Google Scholar] [CrossRef]
  15. Ibrahim, M.S.; Abbas, W.; Waseem, M.; Lu, C.; Lee, H.H.; Fan, J.; Loo, K.H. Long-Term Lifetime Prediction of Power MOSFET Devices Based on LSTM and GRU Algorithms. Mathematics 2023, 11, 3283. [Google Scholar] [CrossRef]
  16. Kim, G.I.; Jang, B. Petroleum Price Prediction with CNN-LSTM and CNN-GRU Using Skip-Connection. Mathematics 2023, 11, 547. [Google Scholar] [CrossRef]
  17. Breiman, L. Random Forests. Mach. Learn. 2001, 45, 5–32. [Google Scholar] [CrossRef]
  18. Wang, X.; Zhai, M.; Ren, Z.; Ren, H.; Li, M.; Quan, D.; Chen, L.; Qiu, L. Exploratory study on classification of diabetes mellitus through a combined Random Forest Classifier. BMC Med. Inform. Decis. Mak. 2021, 21, 105. [Google Scholar] [CrossRef]
  19. Hechifa, A.; Lakehal, A.; Nanfak, A.; Saidi, L.; Labiod, C.; Kelaiaia, R.; Ghoneim, S.S.M. Improved intelligent methods for power transformer fault diagnosis based on tree ensemble learning and multiple feature vector analysis. Electr. Eng. 2024, 106, 2575–2594. [Google Scholar] [CrossRef]
  20. Nguyen, T.H.; Do, T.C.; Phan, V.D.; Ahn, K.K. Working Performance Improvement of a Novel Independent Metering Valve System by Using a Neural Network-Fractional Order-Proportional-Integral-Derivative Controller. Mathematics 2023, 11, 4819. [Google Scholar] [CrossRef]
  21. Yu, Y.; Do, T.C.; Park, Y.; Ahn, K.K. Energy saving of hybrid hydraulic excavator with innovative powertrain. Energy Convers. Manag. 2021, 244, 114447. [Google Scholar] [CrossRef]
  22. Sleight, C. Global Construction Equipment Market Expected. 2024. Available online: https://offhighwayresearch.com/491.article (accessed on 1 March 2025).
Figure 1. Schematic overview of the system’s architecture.
Mathematics 13 01177 g001
Figure 2. Schematic overview of the proposed position forecasting system.
Mathematics 13 01177 g002
Figure 3. Schematic depiction of the LSTM cell architecture.
Mathematics 13 01177 g003
Figure 4. Classification structure of the RF algorithm.
Mathematics 13 01177 g004
Figure 5. Schematic representation of the simulation environment developed with AMESim.
Mathematics 13 01177 g005
Figure 6. Simulation-based assessment of the boom cylinder’s position tracking performance. (a) Displacement of the boom cylinder (b) Displacement error.
Mathematics 13 01177 g006
Figure 7. Comparison of RMSE and MAE metrics across different simulation operating modes. (a) RMSE (b) MAE.
Mathematics 13 01177 g007
Figure 8. Performance assessment of the ICE: subfigure (a) shows speed, (b) displays torque, and (c) illustrates energy consumption.
Mathematics 13 01177 g008
Figure 9. Experimental test bench, comprising (1) PC, (2) electrical box, (3) clutch carrier, (4) HPM, (5) load, (6) hydraulic system, (7) HM, (8) double clutch, (9) HPM, (10) ICE, (11) EMG, (12) clutch electric motor/generator, and (13) clutch engine.
Mathematics 13 01177 g009
Figure 10. Efficiency contour illustrating the operational performance of the engine.
Mathematics 13 01177 g010
Figure 11. MATLAB/Simulink representation of the experimental system configuration.
Mathematics 13 01177 g011
Figure 12. Experimental assessment of the system’s tracking performance, highlighting displacement accuracy and error dynamics. (a) Displacement of the boom cylinder (b) Displacement error.
Mathematics 13 01177 g012
Figure 13. Experimental comparison of RMSE and MAE metrics across various operating modes. (a) RMSE (b) MAE.
Mathematics 13 01177 g013
Figure 14. Efficiency map delineating the operational points of the ICE in the system.
Mathematics 13 01177 g014
Figure 15. Performance assessment of the ICE: subfigure (a) shows speed, (b) displays torque, and (c) illustrates energy consumption.
Mathematics 13 01177 g015
Table 1. Technical specifications for key system elements [4].
ElementCharacteristicMeasured ValueUnit
Boom cylinderPiston diameter50mm
Rod diameter28mm
Stroke0.75m
HPMDisplacement30cc/rev
Pressure250bar
HMDisplacement10cc/rev
Pressure120bar
HSTDisplacement33cc/rev
Pressure270bar
EMGRate power5.5kW
ICERate power7.5kW
BatteryVoltage range per cell2.5–4.2V
Cells in parallel configuration1cell
Cells in series arrangement3cell
Table 2. Tracking performance metrics and improvements in controllers.
ControllerRMSEMAE
BWO-LSTM-RF4.043.16
PSO-LSTM-GRU-PID4.42 (−8.59%)3.41 (−7.33%)
LSTM-RF6.41 (−36.97%)4.98 (−36.54%)
PID10.28 (−60.7%)8.04 (−60.69%)
Table 3. Simulation controller performance metrics.
AlgorithmTotal TimeEnergy ConsumptionEnergy Savingp-Value
BWO-LSTM-RF69.49 s85.942 kJ--
PSO-LSTM-GRU-PID69.49 s89.243 kJ3.69% p < 10 4
LSTM-RF69.49 s93.236 kJ7.83% p < 10 4
PID69.49 s96.939 kJ11.33% p < 10 4
Table 4. Comparison of algorithm running times.
AlgorithmReal TimeTraining TimeUnit
BWO-LSTM-RF69.491680.93second
PSO-LSTM-GRU-PID69.491977.65second
LSTM-RF69.491185.45second
PID69.49-second
Table 5. Summary of BWO-LSTM-RF model configuration and hyperparameter optimization parameters.
BWO-LSTM-RF Model Overview
Model ArchitectureStacked LSTM and random forest with BWO optimization
Sequence LengthVariable
Activation FunctionsReLU for LSTM layers, linear for output dense layer
Loss FunctionMean squared error (MSE)
OptimizerAdam (with learning rates: 0.1, 0.01, 0.001)
NormalizationStandardScaler for input features
Training Data NoiseNot explicitly defined
Data Split Ratio80% training, 20% testing
Dropout RateNot explicitly defined in BWO-LSTM-RF
Evaluation MetricMSE on validation/test set, R2 score
BWO Hyperparameter Optimization
Optimization TechniqueBeluga whale optimization (BWO)
Parameters OptimizedLSTM units
Population Size50 beluga whales
Iterations100
Best SolutionOptimal parameters minimizing MSE
Table 6. Tracking performance metrics and improvements in controllers.
ControllerRMSEMAE
BWO-LSTM-RF3.282.15
PSO-LSTM-GRU-PID3.51 (−9.41%)3.28 (−6.55%)
LSTM-RF4.94 (−34.88%)4.78 (−33.66%)
PID8.38 (−61.34%)5.48 (−60.86%)
Table 7. Experimental controller performance metrics.
AlgorithmTotal TimeEnergy
Consumption
Energy Savingp-Value
BWO-LSTM-RF69.49 s90.384 kJ--
PSO-LSTM-GRU-PID69.49 s94.122 kJ3.97% p < 10 4
LSTM-RF69.49 s99.310 kJ8.98% p < 10 4
PID69.49 s103.240 kJ12.46% p < 10 4
Table 8. Comparison of algorithm running times.
AlgorithmReal TimeTraining TimeTime
BWO-LSTM-RF69.491702.15second
PSO-LSTM-GRU-PID69.492005.22second
LSTM-RF69.491201.87second
PID69.49-second
Table 9. Comparison of energy consumption between simulation and experimental trials.
AlgorithmSimulationExperimentalPercent Difference
BWO-LSTM-RF85.942 kJ90.384 kJ4.91%
PSO-LSTM-GRU-PID89.243 kJ94.122 kJ5.18%
LSTM-RF93.236 kJ99.310 kJ6.11%
PID96.939 kJ103.240 kJ6.10%
Table 10. Performance comparison of control algorithms and systems for hydraulic excavator trajectory and energy saving.
RefAlgorithmSystemRMSEEnergy Saving (%)
[6] (2023)HAQPSO-PIDLS8.1798 (boom)N/A
QPSO-PIDLS8.3153 (boom)N/A
PSO-PIDLS10.0977 (boom)N/A
ZN-PIDLS12.9459 (boom)N/A
[7] (2024)PSO-LSTM-GRU-PIDAEHCVP4.7810.89
LSTM-GRU-PIDAEHCVP6.78.3
PIDAEHCVP9.270
[20] (2023)NNFOPIDNIMV15.9529.25
FOPIDNIMV22.167.71
PIDNIMV23.850
This studyProposedAEHCVP3.2812.46
PSO-LSTM-GRU-PIDAEHCVP3.518.83
LSTM-RFAEHCVP4.943.81
PIDAEHCVP8.380
Table 11. Comparative performance metrics of proposed controllers for a 48 t excavator.
AlgorithmTimeConsumptionSavingTest Bench
BWO-LSTM-RF69.49 s90.384 kJ12.46%
PSO-LSTM-GRU-PID69.49 s94.122 kJ8.83%
LSTM-RF69.49 s99.310 kJ3.81%
PID69.49 s103.240 kJ-
BWO-LSTM-RF1 h0.1300 L12.46%
PSO-LSTM-GRU-PID1 h0.1354 L8.83%
LSTM-RF1 h0.1429 L3.81%
PID1 h0.1485 L-
AlgorithmTimeConsumptionSaving48 t Excavator
BWO-LSTM-RF1 year19,509 L12.46%
PSO-LSTM-GRU-PID1 year20,317 L8.83%
LSTM-RF1 year21,437 L3.81%
PID1 year22,285 L-
AlgorithmTimePriceSaving
BWO-LSTM-RF1 year23,411 $12.46%
PSO-LSTM-GRU-PID1 year24,380 $8.83%
LSTM-RF1 year25,724 $3.81%
PID1 year28,093 $-
AlgorithmTimeCO2 ConsumptionSaving
BWO-LSTM-RF1 year51,309 t12.46%
PSO-LSTM-GRU-PID1 year53,434 t8.83%
LSTM-RF1 year56,379 t3.81%
PID1 year58,609 t-
Disclaimer/Publisher’s Note: The statements, opinions and data contained in all publications are solely those of the individual author(s) and contributor(s) and not of MDPI and/or the editor(s). MDPI and/or the editor(s) disclaim responsibility for any injury to people or property resulting from any ideas, methods, instructions or products referred to in the content.

