Article

MSTransBTS—A Novel Integration of Mamba with Swin Transformer for 3D Brain Tumour Segmentation

by
Jia Qin Ngu
1,
Humaira Nisar
1,* and
Chi-Yi Tsai
2
1
Department of Electronic Engineering, Faculty of Engineering and Green Technology, Universiti Tunku Abdul Rahman, Kampar 31900, Malaysia
2
Department of Electrical and Computer Engineering, Tamkang University, No. 151, Yingzhuan Road, Tamsui District, New Taipei City 251, Taiwan
*
Author to whom correspondence should be addressed.
Mathematics 2025, 13(7), 1117; https://doi.org/10.3390/math13071117
Submission received: 6 February 2025 / Revised: 14 March 2025 / Accepted: 21 March 2025 / Published: 28 March 2025

Abstract

:
This study focuses on the major challenges in ensuring the timely assessment and accurate diagnosis of brain tumors (BTs), which are essential for effective patient treatment. Hence, in this paper, a time-efficient, automated, and advanced deep learning (DL) solution, the Mamba Swin Transformer BT Segmentation (MSTransBTS) model, is introduced. This model employs the advanced Swin Transformer architecture, which is renowned for capturing long-range information and incorporates the latest Mamba approach for efficient long-range dependency modelling. Through meticulous customization and fine-tuning, the MSTransBTS achieves notable improvements in Dice scores, with scores of 89.53% for whole tumours (WTs), 80.09% for enhancing tumours (ETs), and 84.75% for tumour cores (TCs), resulting in an overall average Dice score of 84.79%. The employment of Test-Time Augmentation (TTA) further enhances performance and marks a significant advancement in BT segmentation accuracy. These findings not only address the critical need for timely assessment and diagnosis, but also emphasize the potential to enhance patient care through the automation of BT detection. By combining the features of Swin Transformer and Mamba techniques, this approach delivers a promising solution for accurate and efficient BT segmentation, which contributes to advancements in medical imaging.

1. Introduction

A BT is defined as an abnormal cluster of cells in the brain that can develop into both benign and malignant tumours. These tumours may vary depending on their origin and location. Primary BTs correspond to those that grow within the brain, irrespective of whether they are cancerous. Gliomas and medulloblastomas are two of the most typical varieties of malignant BTs. Secondary BTs, on the other hand, are triggered by malignant cells that have spread from different organs and are established in the brain, where they proceed to develop and reproduce. The most prevalent tumours resulting in brain metastases are breast cancer, lung cancer, skin cancer, and other malignancies [1].
Depending on the size, shape, location, and overall structure of the tumour in the brain, the diagnosis of BTs is regarded as a complex and arduous task. According to Saif and Pallab [2], early-stage BT diagnosis poses particular difficulties due to limited information on tumour dimensions and the poor resolution of image-based detection, affecting patients’ outcomes and prognosis. When malignancies are recognized and addressed in their initial stages, optimal patient outcomes are achievable as they will have the best possible prognosis. Hence, the rapid diagnosis and accurate classification of tumours are essential in determining the therapy efficacy and accuracy.
Several medical imaging modalities, such as Magnetic Resonance Imaging (MRI), Computerized Tomography (CT) scan, Ultrasound, Positron Emission Tomography (PET), Simple Photon Emission Computed Tomography (SPECT), and X-ray, are extensively employed in BT analysis. By incorporating these techniques, it is possible to acquire comprehensive insights into tumours. However, MRI is still the most extensively utilized medical imaging technology due to its outstanding ability in providing superior contrast and high-resolution images of the brain and malignant tissues compared to other imaging modalities.
Across various age groups, the annual incidence of brain cancer ranges from 7 to 11 cases per 100,000 individuals. According to the Global Burden of Disease (GBD), this disease claims 227,000 lives each year, and approximately 7.7 million BT survivors experience some kind of impairment. The early detection of brain cancer not only increases the chances of survival but also reduces the risk of disabilities. The timely assessment of BTs minimizes the needs of invasive treatment and surgical interventions in the brain, which is the most complex organ of the body.
Furthermore, the manual assessment of the BT requires the expertise of a radiologist to capture 3D images for preliminary insight, followed by the engagement of an experienced specialist for image evaluation and treatment planning. According to reports by Johnson et al. [3], the assessment of the manual BT diagnosis often exhibits inter-rater variability. The maximum degree of agreement among the experts in manually identifying BTs is reported to be in the range of 90% to 95%. However, regarding mixed tumour classifications, such as mixed glioma and medulloblastoma, the degree of agreement among the specialists drops even lower to 77% and 58%, respectively [4]. Hence, we can conclude that there are challenges associated with manual assessment, which highlight the demand for more sophisticated and consistent BT diagnostics procedures.
Numerous researchers have explored various algorithms to detect and classify BTs with higher accuracy and reduced errors. DL approaches have gained widespread adoption in the development of autonomous systems that are capable of precisely segmenting and classifying BT in a shorter period. DL facilitates the application of pre-trained convolutional neural network (CNN) models that are specifically designed for medical imagery [5] and BT classification, including models like GoogLeNet, AlexNet, and ResNet-34. It consists of a multi-layered deep neural network that implements the backpropagation algorithm to minimize the discrepancies between the goal and actual values. Nonetheless, as the number of layers in artificial neural network (ANN) models increases, the work of development becomes progressively more complex [6].
This research focuses on improving BT segmentation by employing DL techniques. The main goals of this project are as follows: Firstly, to develop a DL model that is accurate and efficient, making it easier to evaluate BTs and ultimately improving patient prognoses. Secondly, to automate the identification of different BT regions that are visible in MRI scans. Thirdly, improving the effectiveness of the selected model in accurately locating and segmenting these regions.
To achieve these goals, this study presents the Mamba Swin Transformer Brain Tumour Segmentation (MSTransBTS) model. This proposed model combines CNN, Swin Transformer Unet [7], and Mamba Unet [8] components to address existing difficulties in BT segmentation with an innovative approach. This unique combination enables the model to capture local and global contextual information from 3D MRI images. Specifically, the inclusion of two CNN encoder layers facilitates the extraction and down-sampling of input features, which are then processed in parallel through the Swin-UNET and Mamba blocks. This parallel configuration enhances the model’s ability to learn from diverse feature representations and reduces the computational burden during training.
Furthermore, the concatenation of features extracted from the Swin-Unet and Mamba blocks occurs seamlessly, before being passed to the decoder for final segmentation. This strategy distinguishes MSTransBTS from existing state-of-the-art approaches, such as Swin-UNETR and SegMamba, which rely on a single-block architecture—either the Swin Transformer or the Mamba block. This limitation restricts their ability to capture local and global contextual information. Additionally, a finely tuned Asymmetrical Unified Focal Loss function is applied to mitigate class imbalance within the dataset, thereby improving segmentation accuracy. Overall, the MSTransBTS framework enables a highly automated segmentation process that simplifies user engagement.

2. Literature Review

This section provides an overview of the various state-of-the-art DL architectures employed in this work, which were integral to developing our method.

2.1. CNN

Convolutional neural networks (CNNs) [9] are very efficient techniques in medical image segmentation. An exemplary architecture in this domain is the U-Net model. This architecture includes a symmetric encoder–decoder structure, with the addition of skip connections, which improves the preservation of details. This model has attracted substantial attention and frequently serves as the preferred option among researchers due to its strong performance in accurately segmenting medical images [10].
Although CNN-based approaches have remarkable representation capabilities, they encounter challenges while explicitly capturing long-range dependencies. This occurs due to the confined receptive fields of convolution kernels. Consequently, convolution methods face difficulty in capturing the complete global semantic information, which is crucial for tasks involving dense predictions like segmentation. This constraint is a substantial barrier in attaining an in-depth understanding and precise depiction of intricate patterns within medical images. This leads to the incorporation of attention mechanisms into CNN models to tackle the issue of capturing long-range dependencies and the evolution of Transformers.

2.2. Residual Connection

Residual connections, depicted in the ResNet architecture [11], tackle this issue via shortcut connections that skip one or more layers. By incorporating these connections depicted in Figure 1, the network acquires the ability to learn residual mappings, which are the differences between the input and output of a given layer. This means that even if a layer fails to learn meaningful features, information from the input may be transmitted directly to subsequent layers, allowing the network to learn effectively even when gradients are vanishing. As a result, through the inclusion of residual connections and convolutional block stacks with down-sampling, the resulting feature space F effectively captures detailed local 3D context features and is fed into the SwinUnet and Mamba encoder parallelly.

2.3. Transformer

Driven by the success of attention mechanisms in natural language processing (NLP), attention mechanisms were introduced into CNN models to capture long-range dependencies. Initially developed for sequence-to-sequence tasks, the Transformer framework is notable for its ability to model relationships between points within a sequence. In contrast to conventional CNN-based methods, the Transformer utilizes self-attention processes and completely removes the necessity for convolutions. This architecture exhibits exceptional proficiency in capturing the whole context and remarkable effectiveness in subsequent tasks, especially when pre-trained on extensive datasets [12].
Transformers process inputs as 1D sequences and focus on global context modelling, which results in low-resolution features. The conventional up-sampling of these features is insufficient to fully recover the lost degree of detail. On the other hand, a hybrid technique that merges CNN and Transformer encoders has greater potential. This approach effectively enhances the high-resolution spatial information captured by CNNs while simultaneously taking advantage of the global context offered by Transformers [13]. Therefore, the Transformer in 3D CNN for 3D MRI Brain Tumour Segmentation (TransBTS) model is proposed by Wang et al. [12].
The TransBTS model improves the existing encoder–decoder architecture to deal with volumetric data. The network’s encoder initially uses 3D CNNs to extract spatial features from the input 3D images while simultaneously down-sampling them. This approach delivers condensed volumetric feature maps that effectively localizes 3D contextual information; subsequently, every volume is reshaped into a vector (known as a token) and fed into a Transformer for global feature modelling. On the decoder side, a 3D CNN decoder utilizes the feature embedding acquired from the Transformer to gradually up-sample the resolution and anticipate the whole segmentation map. This hybrid methodology integrates the advantages of both CNNs and Transformers, facilitating the effective processing of volumetric data while including local and global contexts for precise segmentation outcomes.
TransBTS has remarkable average Dice scores of 78.73% for enhancing tumours (ETs), 90.09% for whole tumours (WTs), and 81.73% for tumour cores (TCs) for the BraTS2020 dataset. These scores indicate the model’s exceptional ability to efficiently segment various tumour locations, proving its efficacy in 3D BT segmentation.

2.4. Swin Transformer

Transferring strong performance from language tasks to the visual domain poses major challenges due to differences between the two modalities. One notable distinction is the scale. Unlike word tokens, which serve as the fundamental processing units in language Transformers, visual components exhibit significant variations in scale. This issue is especially apparent in object detection. Since tokens have a fixed scale, current Transformer-based models are not suited for vision applications. In addition, images have a superior pixel resolution compared to words in text passages. Tasks involving vision, such as semantic segmentation, need precise predictions at the pixel level. However, Transformers struggle with performing this task on high-resolution images as the computational complexity of self-attention increases quadratically with image size, which makes it impractical.
A flexible framework called the Swin Transformer is implemented to solve the above issues. This methodology creates hierarchical feature maps with linear computational complexity compared to the image size.
By using these hierarchical feature maps, the Swin Transformer model may effectively integrate techniques for dense prediction, such as U-Net. The Swin Transformer achieves linear computational complexity by performing self-attention calculations locally within non-overlapping windows that partition an image. The quantity of patches within each window remains consistent, leading to a complexity that increases proportionally with the size of the image. The features of Swin Transformer make it very suitable as an adaptable framework for many visual tasks. In contrast to previous Transformer-based designs, which produce feature maps with a single resolution and have a quadratic complexity, this approach is unique and distinct. Additionally, an important aspect of the Swin Transformer’s architecture is its shifting of the window partition between successive self-attention levels
Beginning with the first layer, a standard window partitioning approach is implemented, and self-attention is calculated within each window. In the next layer, the window partitioning is varied, resulting in additional windows. The self-attention computation in these new windows extends beyond the bounds of the preceding windows in the first layer, thereby establishing connections between them [14].
In general, transferring high-performance Transformer features from language tasks to the visual domain presents major problems, arising from the discrepancies in scale and resolution. The Swin Transformer framework is proposed to solve these issues, providing hierarchical feature maps with a linear computational complexity. Furthermore, the Swin Transformer has a dynamic window partitioning mechanism that establishes connections between feature maps at different scales. In the next subsection, a specific model constructed with the Swin Transformer is introduced to justify the effectiveness of the Swin Transformer in vision tasks.
The architecture of Swin Transformers is highly suitable for a wide range of downstream activities as it allows for the extraction of multi-scale features that can be used for further processing [15]. To utilize this capability, an innovative design known as Swin UNETR (Swin U-Net Transformers) is proposed. Swin UNETR employs a U-shaped network structure and a Swin Transformer, serving as the encoder and connected to a CNN-based decoder at distinct resolutions through skip connections.
The model’s input consists of 3D multi-modal MRI scans with four channels. The Swin UNETR model first splits the input data into non-overlapping patches and leverages a patch partition layer to establish windows of the necessary size to carry out self-attention calculations. Subsequently, the encoded feature representations generated by the Swin Transformer are fed to a CNN-based decoder through skip connections at different resolutions. Ultimately, the segmentation outputs are computed through a convolutional layer followed by a sigmoid activation function. The resulting segmentation output consists of three output channels, each representing the ET, WT, and TC sub-regions.
According to the findings reported by Hatamizadeh and colleagues (2022) [16], the SwinUNETR framework exhibits exceptional performance on the BraTS2021 training dataset. Notably, it attains average Dice scores of 85.30% for ET, 92.70% for WT, and 87.60% for TC segmentation. These outcomes highlight the efficacy of SwinUNETR in precisely identifying tumour areas in multi-modal MRI imaging. In summary, the outstanding performance demonstrated by SwinUNETR highlights the potential of integrating the Swin Transformer with U-net as a promising approach for medical image segmentation. In the following year, He and his teammates [7] enhanced the SwinUNETR model to a greater extent and named it as SwinUNETR-V2. The improved version incorporates the stagewise convolutions with window-based self-attention in each stage, which provides a stronger backbone for the feature extraction. It is also the main component in our proposed model, and the integration method is elucidated in the Materials and Methods Section.
A 3D convolutional patch embedding layer (with a stride = 2,2,2 and kernel size = 2,2,2) is implemented in SwinUNETR-V2 to convert patches into tokens. Subsequently, the outputs undergo four stages of Swin Transformer blocks and patch merging to encode the input patches. At Swin block j, given an input tensor of size ( B , C , H , W , D ) , the Swin Transformer block partitions the tensor into windows of size H M , W M , D M . The mechanism of two successive Swin Transformer blocks is depicted and shown in Figure 2.
Based on Figure 2, it is clear to state that four computations are conducted as Equations (1)–(4) [14].
Z ^ s j = W-MSA ( LN ( Z s j 1   ) ) + Z s j 1
Z s j = MLP ( LN ( Z ^ s j ) ) + Z ^ s j
Z ^ s j + 1 = SW-MSA ( LN ( Z s j ) ) + Z s j
Z s j + 1 = MLP ( LN ( Z ^ s j + 1 ) ) + Z ^ s j + 1
where Z ^ s j   = output elements of the SW-MSA module; Z s j   = output of the MLP module; W-MSA = window-based multi-head self-attention partitioning function; SW-MSA = shifted-window based multi-head self-attention partitioning function; MLP = multilayer perceptron function; LN = layer normalization function, j = j   { 0 , 1 , , S 1 } ; and S = number of Swin Transformer blocks in each stage.
To halve each spatial dimension, a patch merging layer is placed after the Swin Transformer blocks in each stage. In addition, at the beginning of each stage, the input tokens are reshaped to restore their original 3D volume form. Next, a Residual Convolution block is used, which consists of two sets of 3 × 3 × 3   convolutions, instance normalization, and leaky rectified linear unit (ReLU) activations. It has the same architecture as the residual connection in Figure 1, except for the ReLU having been changed to leaky ReLU and layer normalization to instance normalization. The resulting output proceeds to a series of subsequent Swin Transformer blocks with depths of ( 2 ,   2 ,   2 ,   2 ) . Notably, three Residual Convolution blocks are incorporated across the three stages [7].

2.5. Mamba

CNNs are extensively used in image processing, especially techniques such as Fully Convolutional Networks (FCNs), which are exceptionally effective at extracting hierarchical features. Transformers, initially developed for NLP and subsequently extended for visual tasks via architectures such as Vision Transformers (ViT) and Swin Transformer, are highly effective at capturing global information. Their incorporation into CNN frameworks has resulted in the development of hybrid models such as SwinUNETR, which greatly enhances the representation of long-range connections [15].
Transformers, despite being effective at capturing long-range dependencies, encounter challenges because of their high computational cost. This is mainly due to the self-attention mechanism, which scales quadratically with the input size. This impact is particularly obvious in high-resolution biomedical images. Recent advancements in State Space Models (SSMs), notably Structured SSMs (S4), present a promising solution for efficiently processing large sequences. The Mamba model further improves S4 by incorporating selective mechanisms and hardware optimization, resulting in exceptional performance in dense data domains [17].
Introduce SegMamba, a novel design that integrates the U-shape structure with Mamba to effectively capture global contexts at different scales over the entire volume. SegMamba consists of three primary components: (1) A 3D feature encoder that includes multiple tri-orientated spatial Mamba blocks to capture global information at various scales. (2) A 3D decoder that leverages convolution layers to predict segmentation outcomes. (3) Skip connections are established between the global multi-scale features and the decoder. These connections allow for the reuse of features. The SegMamba framework is utilized in our proposed model, and the integration process is described in the Materials and Methods Section.
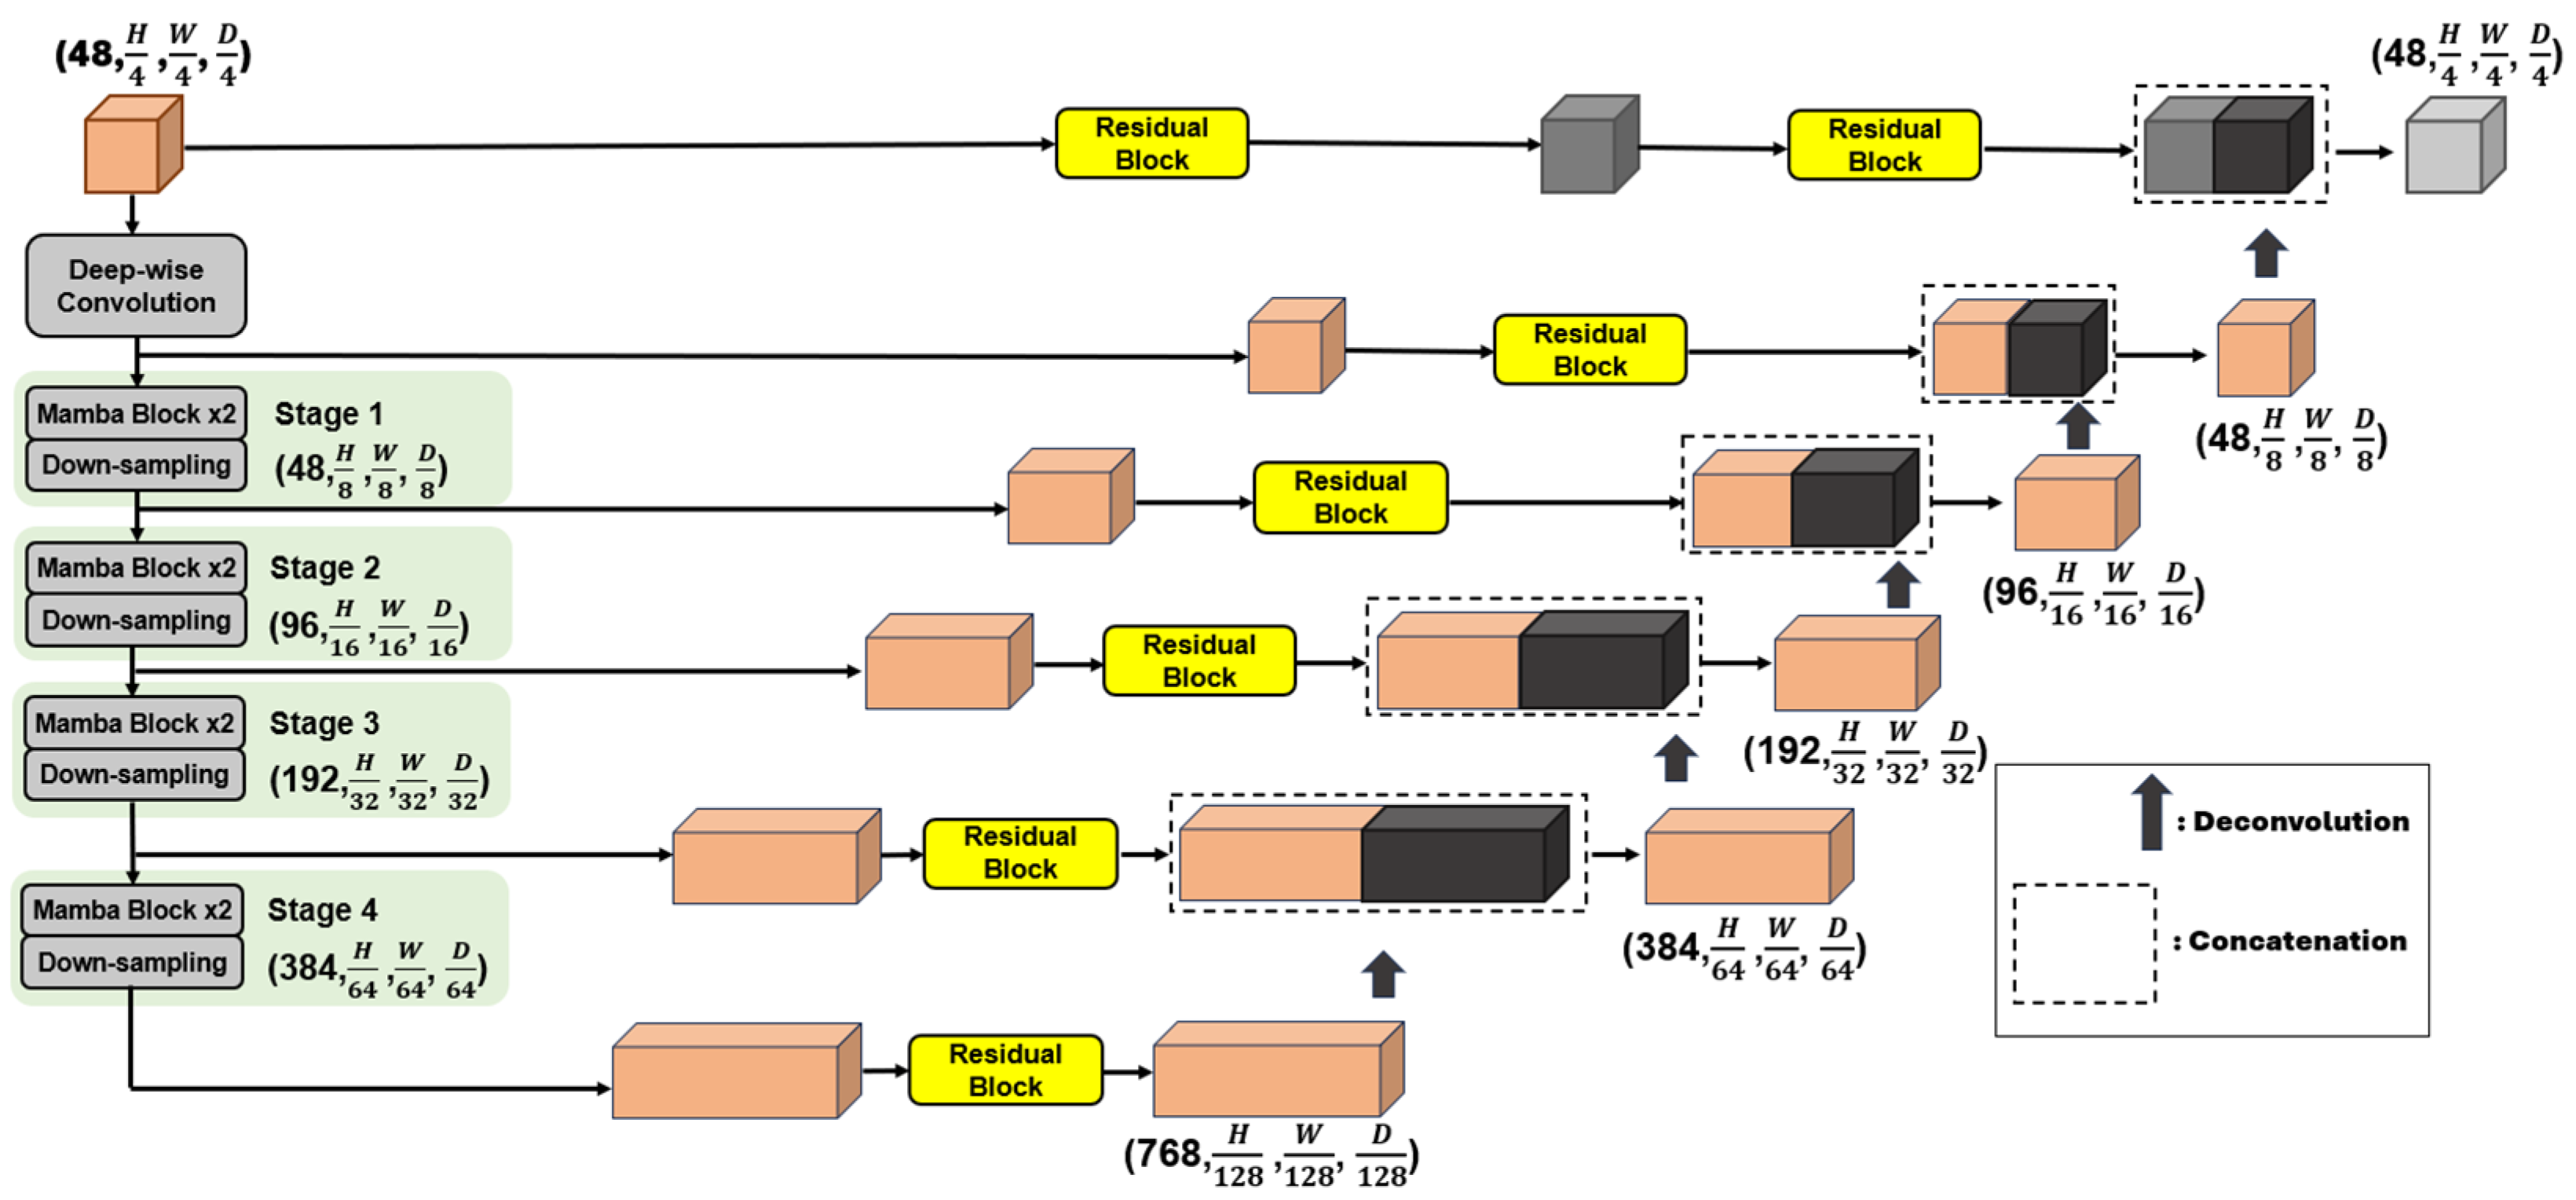
The encoder in SegMamba consists of a Depth-Wise Convolution layer and multiple Mamba blocks. The Depth-Wise convolution is built with a 7 × 7 × 7 kernel size, 3 × 3 × 3 padding, and 2 × 2 × 2 stride. Given a 3D input image, the Depth-Wise Convolution layer further extracts the input features into a size of Z 0     R C × H 2 × W 2 × D 2   ( C = 48 ) . Subsequently, Z 0 proceeds through each Mamba block and its corresponding down-sampling layers. The computation process for the m t h   Mamba block is as shown in Equations (5)–(7) [8]:
Z ¯ m j = G S C ( Z m j )
Z ~ m j = T o M L N Z ¯ m j + Z ¯ m j
Z ~ m j + 1 = M L P ( L N Z ~ m j ) + Z ~ m j
where G S C = Gated Spatial Convolution function; T o M = Tri-orientated Mamba function; M L P = multilayer perceptron function; L N = layer normalization function; j = j   { 0 ; 1 ; ; M 1 } ; and M = number of Mamba blocks in each stage.
The GSC mechanism is depicted in Figure 3. The GSC module is integrated before Mamba layer processing to enhance feature extraction and capture spatial relationship. This module first passes the input 3D features through two convolution blocks, each of which contains a convolution operation, instance normalization, and a non-linear layer. The convolution blocks contain kernel sizes of 3 × 3 × 3 and 1 × 1 × 1. Subsequently, the outputs of these blocks are element-wise multiplied to modulate information flow which is identical to a gate function. An additional convolution block is used to perform further feature fusion, which is enriched by a residual connection that recovers the initial features. This design is essential for efficiently extracting spatial dependencies before proceeding to the Mamba layer.
In the Mamba block, the importance lies in its ability to comprehensively capture global information from high-dimensional features. This is accomplished by implementing a Tri-orientated Mamba (ToM) module that computes feature dependencies from three different directions. As illustrated in Figure 4, the process involves flattening the 3D input features into three sequences, allowing the operation of feature interaction from distinct directions [8]. As a result, this approach facilitates the generation of fused 3D features, which strengthens the model’s capability to comprehend and employ intricate spatial relationships within the data.
In 3D medical image segmentation, the inclusion of global features and multi-scale features is of utmost importance. Transformer architectures are highly effective in extracting global information, but they encounter difficulties in terms of computational burden when dealing with extremely long feature sequences. To handle this issue, techniques such as SwinUNETR employ the direct down-sampling of the 3D input to effectively decrease the length of the sequence. However, this method undermines the encoding of multi-scale characteristics that are essential for precise segmentation predictions. To address this constraint, the TSMamba block is designed to enable the concurrent modelling of multi-scale and global features while ensuring efficient performance during both training and inference.
Based on the findings presented by Xing et al. [8], the SegMamba framework demonstrates exceptional performance on the BraTS2023 training dataset. It obtains remarkable average Dice scores of 87.71% for ET, 93.61% for WT, and 92.65% for TC segmentation. The results highlight the effectiveness of SegMamba in precisely identifying tumour areas in multi-modal MRI imaging. The results of SegMamba show that combining Mamba with U-net may give excellent results for medical image segmentation.

3. Materials and Methods

In this paper, the primary objective is to devise a DL model that is capable of localizing and segmenting the BT regions in different modalities. Before delving into these essential stages, it is essential for the dataset to be prepared and allocated well since it plays a pivotal role in determining a great outcome.
The initial focus is dedicated to BT segmentation, where the objective is to segment tumours into three different classes: the whole tumour (WT), the enhanced tumour (ET), and the tumour core (TC). Therefore, a cutting-edge model is proposed by integrating Mamba, the Swin Transformer, and the CNN. The implementation of customized loss function and TTA further improves the model.
Subsequently, the performance metrics for the model are evaluated and the results are presented. If the model fails to achieve the expected Dice score, it is further fine-tuned to optimize the results. The project flow is shown in Figure 5.

3.1. Dataset Preparation

The preparation of the dataset plays a pivotal role in the semantic segmentation task. In this project, three phases are identified in the dataset preparation, which are dataset acquisition, dataset splitting, and dataset augmentation.

3.1.1. Dataset Acquisition

The BraTS2020 [18] and BraTS2023 [19,20,21] datasets were obtained through the Kaggle and Synapse platforms, respectively. Specifically, the BraTS2020 dataset includes MRI scans from 369 patients in the training set and 127 patients in the testing set. In contrast, the BraTS2023 dataset provides a larger training set, consisting of MRI scans from 1251 patients. Each MRI scan is delivered in an NIfTI file format (.nii.gz), which includes volumes for native T1, post-contrast T1-weighted (T1Gd), T2-weighted (T2), and T2-FLAIR sequences.
All MRI scans had been meticulously segmented manually by one to four raters who complied with a consistent annotation protocol, with annotations being reviewed and approved by experienced neuroradiologists. The annotations consist of Gadolinium-enhancing tumour (ET), peritumoural edema (ED), and necrotic and non-enhancing tumour cores (NCR/NET). Prior to distribution, the data are pre-processed with co-registration to a common anatomical template, interpolation to a uniform resolution 1   m m 3 , and skull-stripping to eliminate non-brain tissues [18]. This meticulous pre-processing assures high standards of accuracy and uniformity for the dataset for reliable analysis and research purposes. Given the lack of ground truth masks in the testing data, the training dataset has been designated as the primary dataset, which includes both training and testing data.

3.1.2. Dataset Splitting

Dataset splitting is a very important phase in DL and data analysis. This procedure is critical for assessing the performance and generalizability of DL models. Typically, the dataset is divided into three subsets: the training set, which is used to train the model; the validation set, which is utilized to tune hyperparameters and assess model performance during training; and the test set, which is reserved for evaluating the final model’s performance on unseen data. Proper dataset splitting is critical for avoiding overfitting and ensuring that the model’s performance metrics accurately reflect its actual performance.
In this study, both datasets are split into training, validation, and testing sets with a ratio of 7:1:2. For clarity, Table 1 summarizes this allocation and includes explicit information on the number of samples assigned to each set.

3.1.3. Dataset Augmentation

Dataset augmentation is an essential technique in DL, especially when dealing with limited training data. It includes artificially expanding the dataset by performing various transformations on existing samples such as rotation, flipping, scaling, cropping, or incorporating noise. This technique is particularly valuable when the training dataset is scarce or lacking in diversity. By introducing additional variations in the original data, dataset augmentation aids to mitigate overfitting and strengthen the model’s ability to generalize to unseen examples. In fields where large, diverse datasets are exorbitantly costly or impractical, such as medical imaging or rare event prediction, dataset augmentation is essential for enhancing model performance and robustness.
Both datasets confront a similar challenge of inadequate information for each region of interest. Therefore, three augmentation strategies are employed to enrich the dataset’s variability. These augmentation techniques include random cropping, random mirroring, and random intensity shift. To have a better understanding of the augmentation approaches, some instances of the original and augmented masks are visualized in Table 2.

3.2. MSTransBTS Model Overview

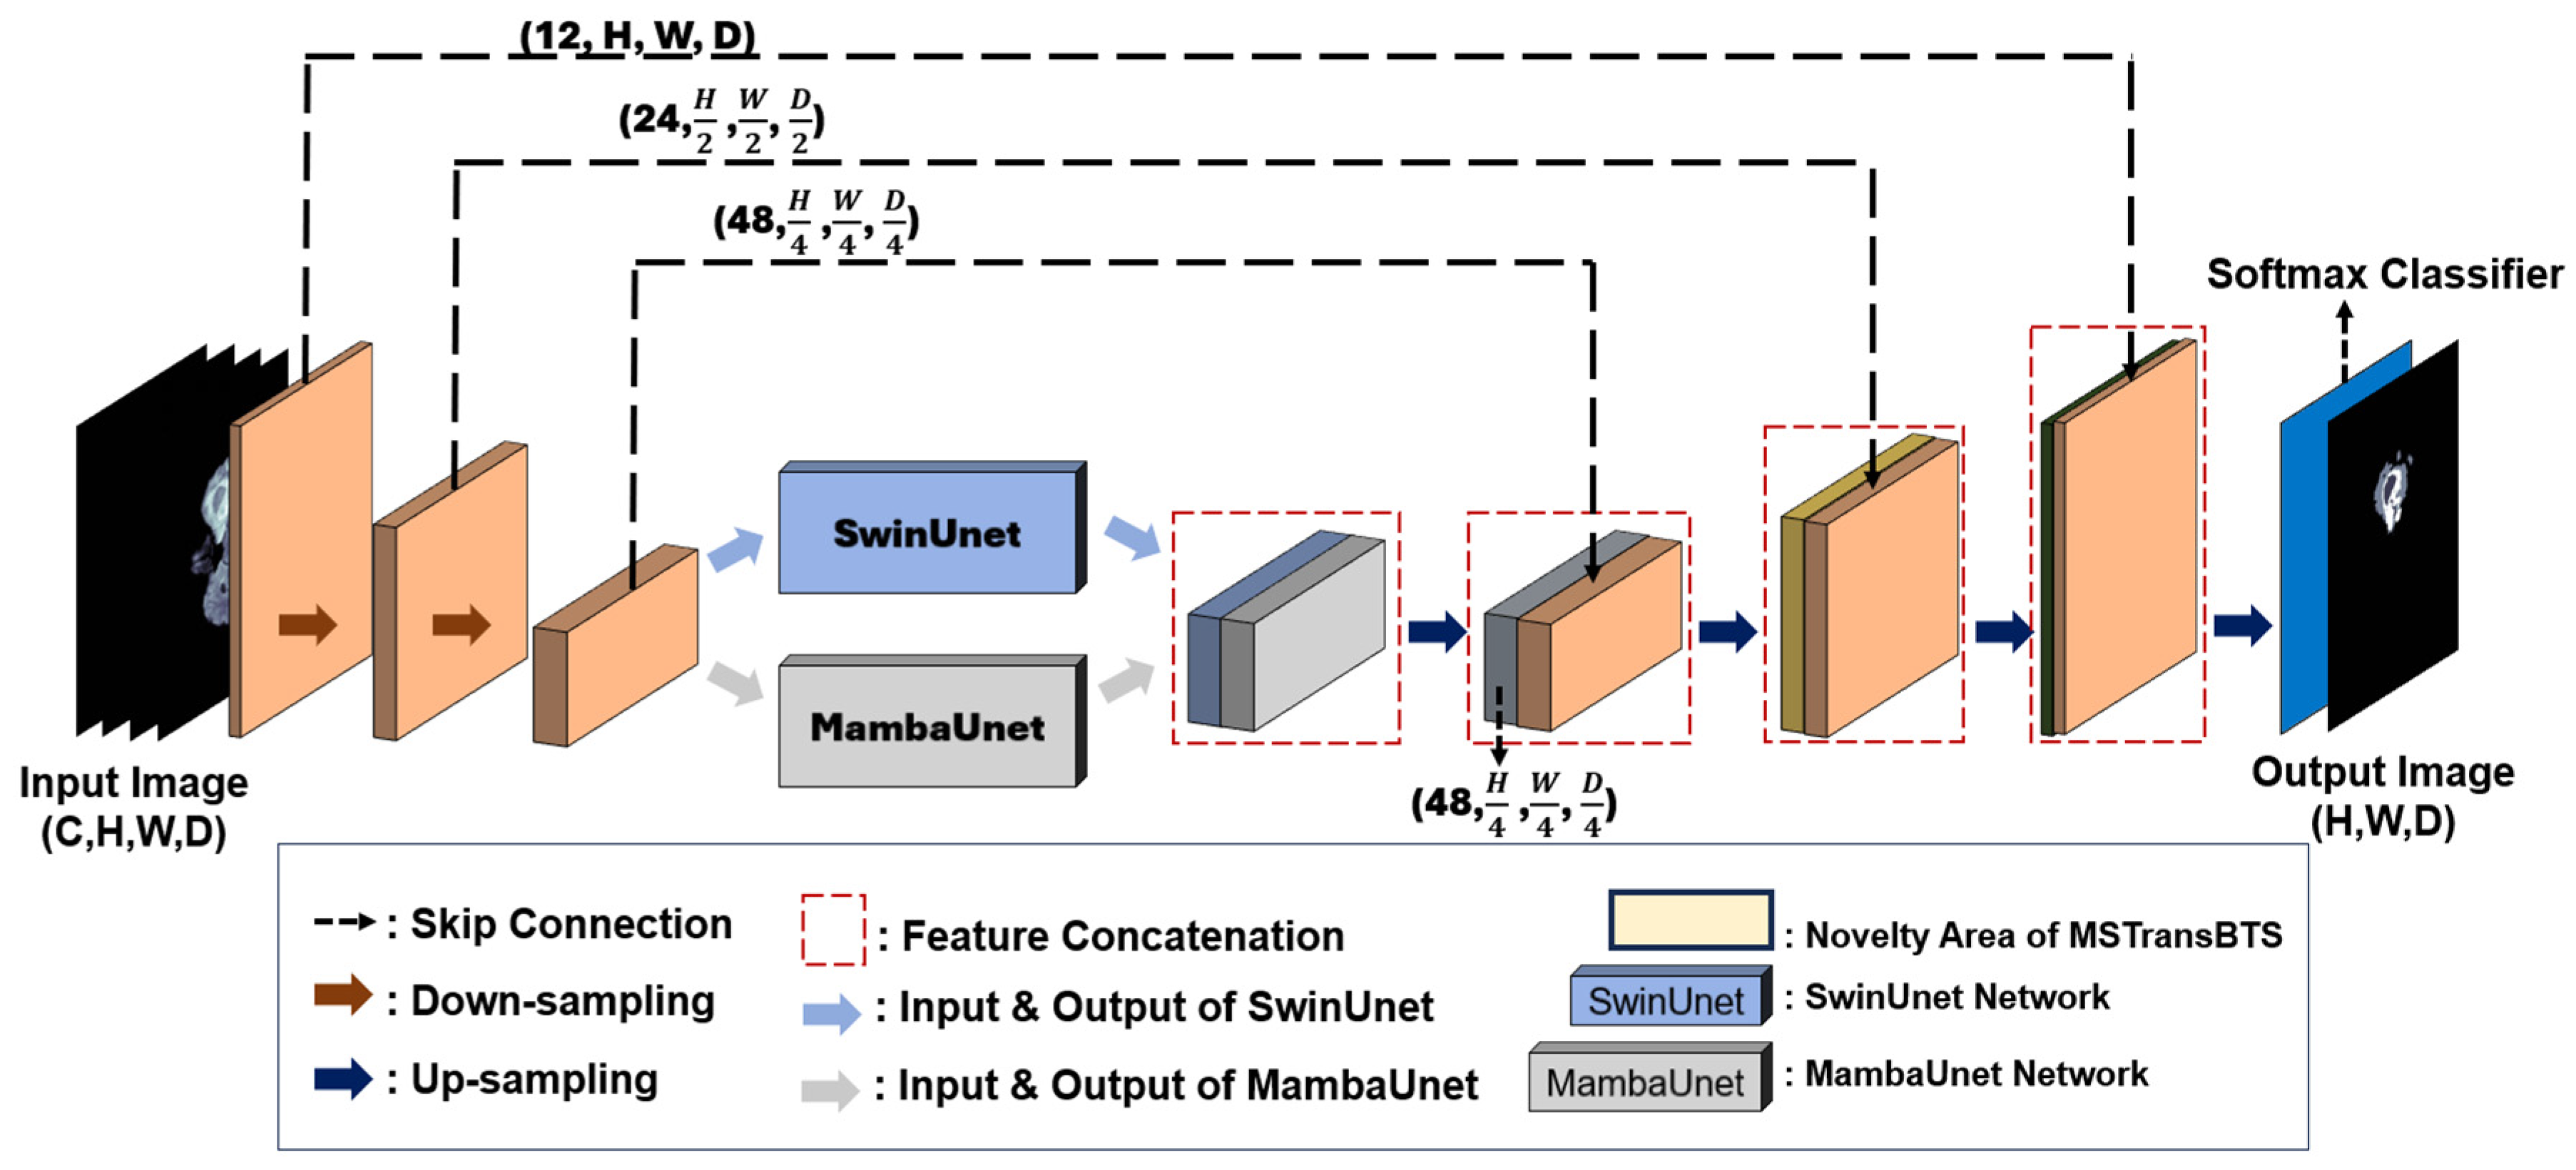
In this section, an overview of the proposed DL model for 3D BT segmentation is discussed and is depicted in Figure 6.
The framework depicted in Figure 6 combines the state of the art of CNNs, the Swin Transformer, and Mamba. It introduces a novel approach that integrates the features of Mamba and the Swin Transformer with the ordinary Unet. The architecture firstly employs CNNs to effectively process 3D medical imaging data and extract meaningful spatial and depth features. Then, the extracted features from the CNNs are processed in parallel with the SwinUnet and MambaUnet networks instead of providing the raw information of the medical images. Subsequently, the output from the SwinUnet and MambaUnet networks are concatenated and processed through two stacks of up-sampling layers to gradually deliver a high-resolution and accurate segmentation outcome. Finally, a Softmax classifier is placed at the last layer of the architecture to perform voxel-wise predictions, indicating the likelihood of each voxel belonging to a different class.

3.3. Network Encoder–Decoder

The network of the MSTransBTS model is mainly composed of three key encoder–decoder pairs: (1) the CNN, (2) MambaUnet, and (3) SwinUnet.

3.3.1. CNN’s Encoder

The 3 × 3 × 3 convolutional blocks with down-sampling (stride convolutions with a stride of 2) are stacked together to gradually encode input images into a high-level feature representation F ϵ   R C × H 4 × W 4 × D 4   C = 48 . This representation preserves rich contextual information while reducing the dimensions of the data to 1 / 4   of their original size in terms of height, width, and depth (overall stride of 4). With the intention to facilitate effective neural network training and address the challenge of vanishing gradients, residual connections have been strategically incorporated into the architecture.

3.3.2. MambaUnet’s and SwinUnet’s Encoder–Decoder

Given a 3D extracted feature from the CNN’s encoders F ϵ   R C × H 4 × W 4 × D 4   C = 48 , where C represents the number of input channels, the Depth-Wise Convolution layer in MambaUnet and the 3D convolutional patch embedding layer in SwinUnet further extract the features simultaneously utilizing their respective mechanisms. To provide further clarity, the architectures of both models are shown in Figure 7 and Figure 8.
Within the SwinUnet and MambaUnet framework, a similar decoding approach is implemented, where convolution blocks are initially employed to extract outputs from each stage. The extracted features are up-sampled by deconvolutional layers and concatenated with higher-resolution features (long-skip connection). Eventually, the features are mapped to a segmentation map using a final convolution layer with 1 × 1 × 1 kernels [10].

3.3.3. CNN’s Decoder

Since there are two intermediate outputs produced from the SwinUnet and MambaUnet networks, both outputs process through concatenation to merge the distinct extracted features, following with convolution to reshape the concatenated features back to the feature map Z     R C × H 4 × W 4 × D 4   ( C = 48 ) . After feature mapping, Z is subjected to cascaded up-sampling and convolution blocks to achieve full resolution segmentation. Ultimately, the feature map Z     R C × H × W × D   ( C = 4 ) proceeds to the Softmax classifier layer to output a probability distribution over the possible classes, and a high precision segmentation result is produced.

3.4. Loss Function

In order to tackle the class imbalance issue in the dataset, a specialized loss function is designed and implemented to enhance the performance of multi-class segmentation. The loss function is referred to as Asymmetrical Unified Focal Loss (AUFL), and it integrates Dice-based and cross entropy-based loss function into a unified framework [22]. The representation of the Dice-based loss function is the Asymmetrical Focal Tversky Loss (AFTL) function, and the related Equations (8)–(11) are defined as
T v e r s k y   I n d e x   T I = T P   T P + α × F N + 1 α ×   F P
B G _ T v e r s k y _ L o s s = 1 T I ( l a b e l B G )
F G _ T v e r s k y _ L o s s = 1 T I l a b e l x × 1 T I l a b e l x β x
A F T L = B G _ T v e r s k y _ L o s s + x = 1 N F G _ T v e r s k y _ L o s s ( l a b e l x )
where T P = true positive; F N = false negative; F P = false positive; B G = background; FG = foreground; x = FG classes; α = weight assigned to false positives and false negatives, facilitating optimization for class imbalance; and β x = degree of focus for each label, with its configuration depending on the label’s quantity. The setting of β < 1 enhances the focus on scarce labels or harder examples, and N = total FG labels.
Furthermore, the cross entropy-based loss function is represented as the Asymmetrical Focal Loss (AFL) function, with its corresponding equations outlined as follows:
C r o s s E n t r o p y   ( C E ) = i = 0 I y i × log p i
B G _ F o c a l _ L o s s = 1 p B G β × C E l a b e l B G
F G _ F o c a l _ L o s s = C E l a b e l x  
A F L = α × B G _ F o c a l _ L o s s + γ x × x = 1 N F G _ F o c a l _ L o s s ( l a b e l x )
where I = total of voxels; y i = probability of the ground truth; p i = probability of the predicted output; β   = degree of focusing (>1); α = weight assigned for the background label ( 0 < α < 1 ) ;   and γ x = weight assigned for the foreground label 0 < γ x < 1 .
β is required to be greater than 1 to suppress the significance of the background class. Typically, the magnitude of γ x will be greater than α in order to enhance the significance of the foreground class while suppressing the background class.
In the summation of the AFTL and AFL, there is an additional weight α that controls the proportion of AFTL and AFL. The equation is defined as
A U F L =   α × A F T L + 1 α × A F L
where α = proportion of significance of AFTL or AFL in the total loss function and α = 0.5 is the degree of importance of AFTL and AFL is identical to each other.

3.5. Model Training and Validation

When training a DL model, each epoch requires iterating through the training dataset to update the model’s parameters. The training module starts by shifting the model to training mode and initializing some metres to track metrics such as training loss, accuracy, Dice score (DSC), and Intersection over Union (IoU). It iterates through the training loader, which generates batches of augmented input data and targets. During each iteration, the learning rate is adjusted via a scheduler to stabilize the learning process and enhance the generalization of the model.
The initial learning rate of 0.002 was selected based on systematic experimentation and hyperparameter tuning. Various initial learning rates ranging from 0.1 to 0.0001 were tested, and the selection was guided by the model’s convergence behaviour and segmentation performance. Higher learning rates (e.g., >0.002) led to unstable training and poor segmentation results as the optimizer was taking excessively large steps, causing the model to oscillate around local minima or even diverge. Lower learning rates (e.g., <0.002) resulted in excessively slow convergence, where the model struggled to learn fine details within a reasonable number of epochs. This significantly impacted the final segmentation accuracy. Through empirical evaluation, 0.002 was found to achieve a balance between stability and convergence speed, allowing the model to learn fine details effectively while avoiding divergence.
Additionally, a polynomial learning rate decay was employed instead of step or exponential decay. This decision was based on the need for a smooth and gradual reduction in the learning rate to facilitate stable convergence. Specifically, a decaying power of 0.9 was chosen, ensuring that the learning rate decreases progressively while maintaining sufficient updates to refine the segmentation quality. In contrast, step decay could cause sudden drops in the learning rate, potentially leading to suboptimal convergence, while exponential decay might reduce the learning rate too aggressively in the later stages of the training. By using polynomial decay with an initial learning rate of 0.002, the model achieved consistent convergence and superior segmentation performance, as evidenced by the quantitative improvements observed during training. The model utilizes the input data to perform training and make predictions. After obtaining the model’s predictions, the loss between the predicted outputs and actual targets is computed with an established criterion. This loss value is then propagated back through the network, and the optimizer adjusts the model’s parameters accordingly. In addition, distinct performance metrics such as accuracy, Dice score, and IoU are calculated to monitor the model’s performance while training. These metrics are updated based on the current batch of predictions and target outputs. Finally, the average values of training loss, accuracy, DSC, and IoU across all batches processed are computed for the training epoch.
In contrast, the validation module evaluates the model’s performance on a validation dataset. Similarly to the training function, it switches the model to evaluation mode and initializes metres for recording performance metrics. Next, it iterates through the validation loader and processes batches of validation data and their corresponding targets. The model makes predictions based on the input data. The loss between predicted outputs and actual targets is calculated using the identical criterion as in the training. Performance metrics including validation loss, accuracy, DSC, and IoU are calculated using the model’s predictions and targets. These metrics are updated based on the current batch of predictions and targets. Ultimately, the average values of validation loss, accuracy, DSC, and IoU for all batches processed are computed for each validation epoch.
In short, the training process iterates through the training dataset and updates the model’s parameters, while the validation code assesses the model’s performance on a separate validation dataset. Both functions compute the same performance metrics, like loss, accuracy, DSC, and IoU, to track the model’s progress and ensure its effectiveness in learning from the data. The configurations specified in the training process are tabulated in Table 3.

3.6. Test-Time Augmentation (TTA)

With the intention to enhance the segmentation results, the test-time augmentation (TTA) strategy is employed in the testing phase [23]. This strategy incorporates four procedures: test image augmentation, augmented prediction, prediction dis-augmentation, and merging all the processed images.
Firstly, test image augmentations are executed, and these are similar to the augmentations previously employed on the training dataset. However, here, only the augmentations of flipping the testing image in three dimensions are carried out. The testing image goes through eight types of flipping augmentations. Secondly, each type of flipped image proceeds through the trained model to generate the prediction result. Since the prediction results have different augmented orientation, dis-augmentation is carried out in order to align all the augmented images to a unifying orientation in the third step. Lastly, all the dis-augmented images with identical orientation are merged into a single image, and the resultant image proceeds to the evaluation phase.
Figure 9 elucidates the mechanics of the TTA strategy. The results from each augmentation and the comparison outcome are depicted in Table 4 and Table 5.

4. Results and Discussion

To assess the effectiveness of the proposed MSTransBTS model, several metrics are evaluated, such as loss, accuracy, Intersection over Union (IoU), and Dice score, for both training and validation phases.

4.1. Loss, Accuracy, IoU, and Dice Score of MSTransBTS Model

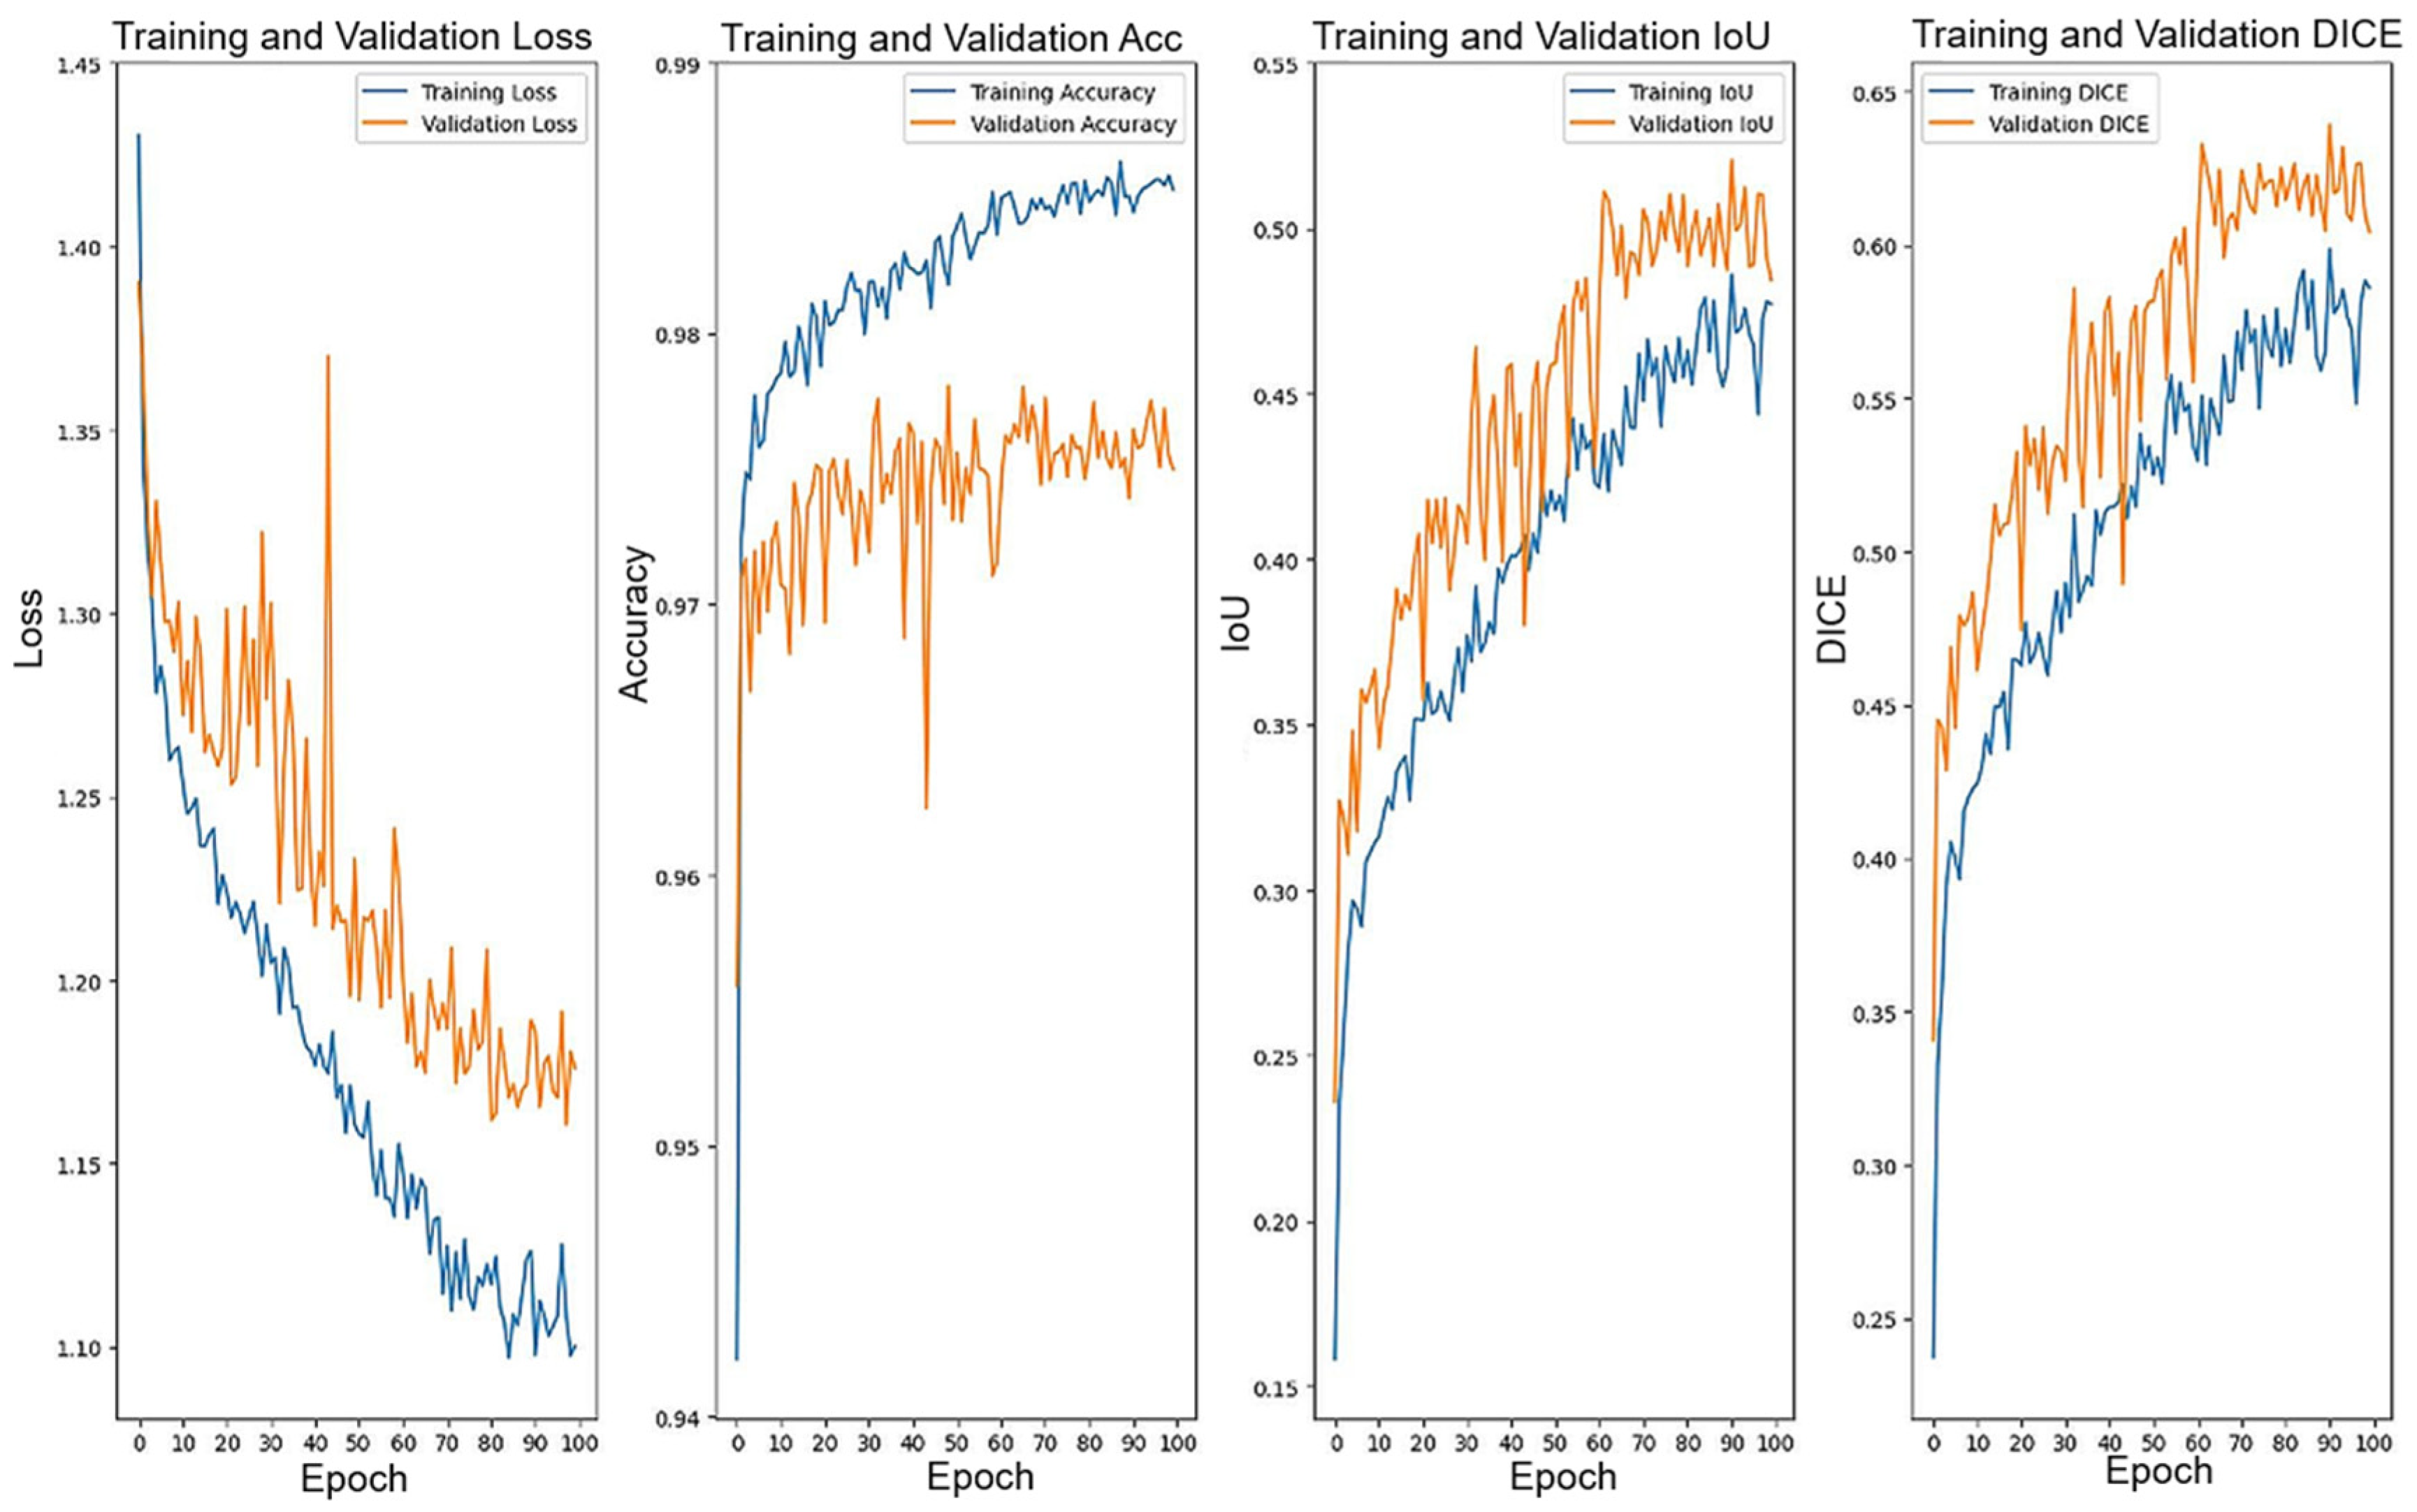
In this study, the Mamba Swin Transformer BT Segmentation (MSTransBTS) model is proposed and implemented for the BT segmentation task. The proposed model undergoes training and evaluation using the BraTS2020 dataset. Within the performance evaluation phase, the key metrics analyzed include loss, accuracy, IoU, and Dice score for both the training and validation phases of the proposed model. From Figure 10 and Table 6, observing the trends of the loss, it is evident that the model starts to stabilize due to the reducing gradient of the curves. This phenomenon suggests that the model has achieved convergence, indicating that more training epochs will result in diminishing improvements. Furthermore, the analysis of the training and validation loss curves reveals that neither overfitting nor underfitting is observed, as the losses have reached a stable state.
Additionally, an MSTransBTS model with high training and validation accuracy indicates that the model has learned to identify and differentiate different regions within the images accurately. The training accuracy is consistently higher than the validation accuracy. This is primarily due to the inherent characteristics of the learning process in DL models. During the training process, the model is fine-tuned to closely match the training data by minimizing a certain loss function. As the training advances, the model acquires a more refined ability to accurately depict the patterns and structures existing within the training data. As a result, the training accuracy gradually improves as the model acquires more experience in predicting the labels of the training instances. However, the validation accuracy evaluates the extent to which the trained model can effectively apply its learned knowledge to new and unfamiliar data. Although the model is fine-tuned to achieve high performance on the training data, its capacity to apply its knowledge to new examples may be restricted, particularly if it has excessively adapted to the training data. Therefore, while the training accuracy generally improves during the training process, the validation accuracy may not exhibit the same level of improvement or may even decline if the model begins to overfit the training data. As a result, it is commonly observed that the accuracy of the training data is greater than the accuracy of the validation data.
In addition, throughout the training process, the model achieved good IoU and Dice scores, which indicates its capability to precisely segment the BT regions in MRI images. The IoU and Dice scores show a significant increase during the validation phase compared to the training phase. This phenomenon may be attributed to several factors. Firstly, the validation dataset consists of unseen instances that the model has not been directly trained on. This allows for a more objective evaluation of the model’s generalization ability. Next, several regularization strategies employed during training, such as dropout or weight decay, might introduce small fluctuations that prevent the model from overfitting to the training data, resulting in slightly lower training IoU and Dice scores. Additionally, the validation set may include examples that are comparatively simpler to segment compared to the training set, leading to improved performance metrics. Furthermore, the inclusion of affine and pixel-level transformations for each batch of training data in every iteration introduces extra variability, which improves the model’s ability to withstand changes and probably contributes to the observed better validation IoU and Dice scores. Overall, the consistently strong performance of the MSTransBTS model across both training and validation phases underscores its robustness and effectiveness in accurately segmenting BTs.
In order to evaluate the efficacy of the MSTransBTS model in accurately segmenting the three main ROIs, which are the WT, ET, and TC, the Dice score for each ROI is computed and averaged. Initially, without TTA, the model achieves Dice scores of 89.24% for the WT, 79.81% for the ET, and 84.14% for the TC, resulting in an average Dice score of 84.40%. To further enhance segmentation effectiveness, TTA is implemented. TTA involves transforming testing images into different orientations or variabilities, then reversing these transformations for each image, and finally merging them into a composite image. This methodology allows the model to consider different perspectives of the input data, decreasing misclassifications and enhancing segmentation accuracy. As shown in Table 7, the MSTransBTS model with TTA achieves higher average Dice scores for the WT, ET, and TC, i.e., 89.53%, 80.09%, and 84.75%, respectively, resulting in an overall average Dice score of 84.79%. These findings highlight the effectiveness of TTA in improving the segmentation performance of the MSTransBTS model, which shows potential for more precise BT segmentation in clinical settings.
Although TTA enhances segmentation performance, it also incurs a significant drawback in terms of processing resources and testing time. When TTA is employed, the testing time increases significantly compared to testing without TTA. According to Table 8, the process of testing the MSTransBTS model with TTA extended the time to 8.17 min, but testing without TTA only took 1.24 min. This significant increase in the testing duration may present difficulties in clinical situations that require immediate or time-critical diagnosis. Furthermore, the increased computational resources needed for TTA may restrict its practical usability in systems with restricted processing capabilities or resource constraints. While TTA provides significant enhancements in segmentation accuracy, its trade-off with longer testing time necessitates careful evaluation, especially in situations where efficiency and speed are vital.
To further evaluate the effectiveness of the proposed model, visual representations of the segmentation results for three randomly chosen indices and slices are displayed in Table 9. The table presents the segmentation outcomes for three discrete ROIs, as well as their combined output, for both the ground truth and the predicted output produced by the proposed model. To facilitate the identification of different BT regions, each of the ROIs was colour-coded: yellow represents the whole tumour, blue indicates the tumour core, and grey depicts the enhanced tumour. In the first instance, featuring index 162 with slice 59, a clear correspondence between the predicted output and the ground truth is observed in terms of ROI shape, structure, and size. Similarly, in the subsequent instances, the predicted outputs of the enhanced tumour and tumour core closely resemble the ground truth, with minor differences observed in the whole tumour region, where a small area is misclassified in the predicted output. Overall, these visualizations offer compelling evidence of the model’s accuracy and capacity to precisely segment BT regions, which confirms its practicality and reliability for healthcare applications.

4.2. Ablation Study

With the intention to validate the effectiveness of the MSTransBTS model and justify its design choices, three extensive ablation experiments are carried out: (i) encoder layer: one pair of CNN encoder-decoder layers is added, while one pair of SwinUnet and MambaUnet encoder-decoder layers is removed; (ii) the impact of the integration of MambaUnet on MSTransBTS is investigated; and (iii) the impact of the incorporation of SwinUNet in MSTransBTS is explored.
In pursuit of justifying the effectiveness of the MSTransBTS model and validating its design decisions, a series of extensive ablation studies is carried out. The purpose of these studies is to examine the individual contributions of particular architectural components and integration decisions in the MSTransBTS framework. Firstly, the analysis focuses on the effects of altering the encoder layers, involving the addition of one pair of CNN encoder–decoder layers while concurrently removing one pair of encoder–decoder layers from both the SwinUNet and MambaUNet blocks. Secondly, the impact of incorporating the SwinUNet architecture into the MSTransBTS model is analyzed, focusing on its implications for segmentation performance. Lastly, the investigation examines the impact of integrating the MambaUNet structure into MSTransBTS to determine its influence on the overall accuracy and efficiency of segmentation. Through these comprehensive ablation experiments, a deeper understanding of the MSTransBTS model’s architecture and its constituent elements is achieved, which facilitates informed design choices and optimization approaches for enhanced BT segmentation.
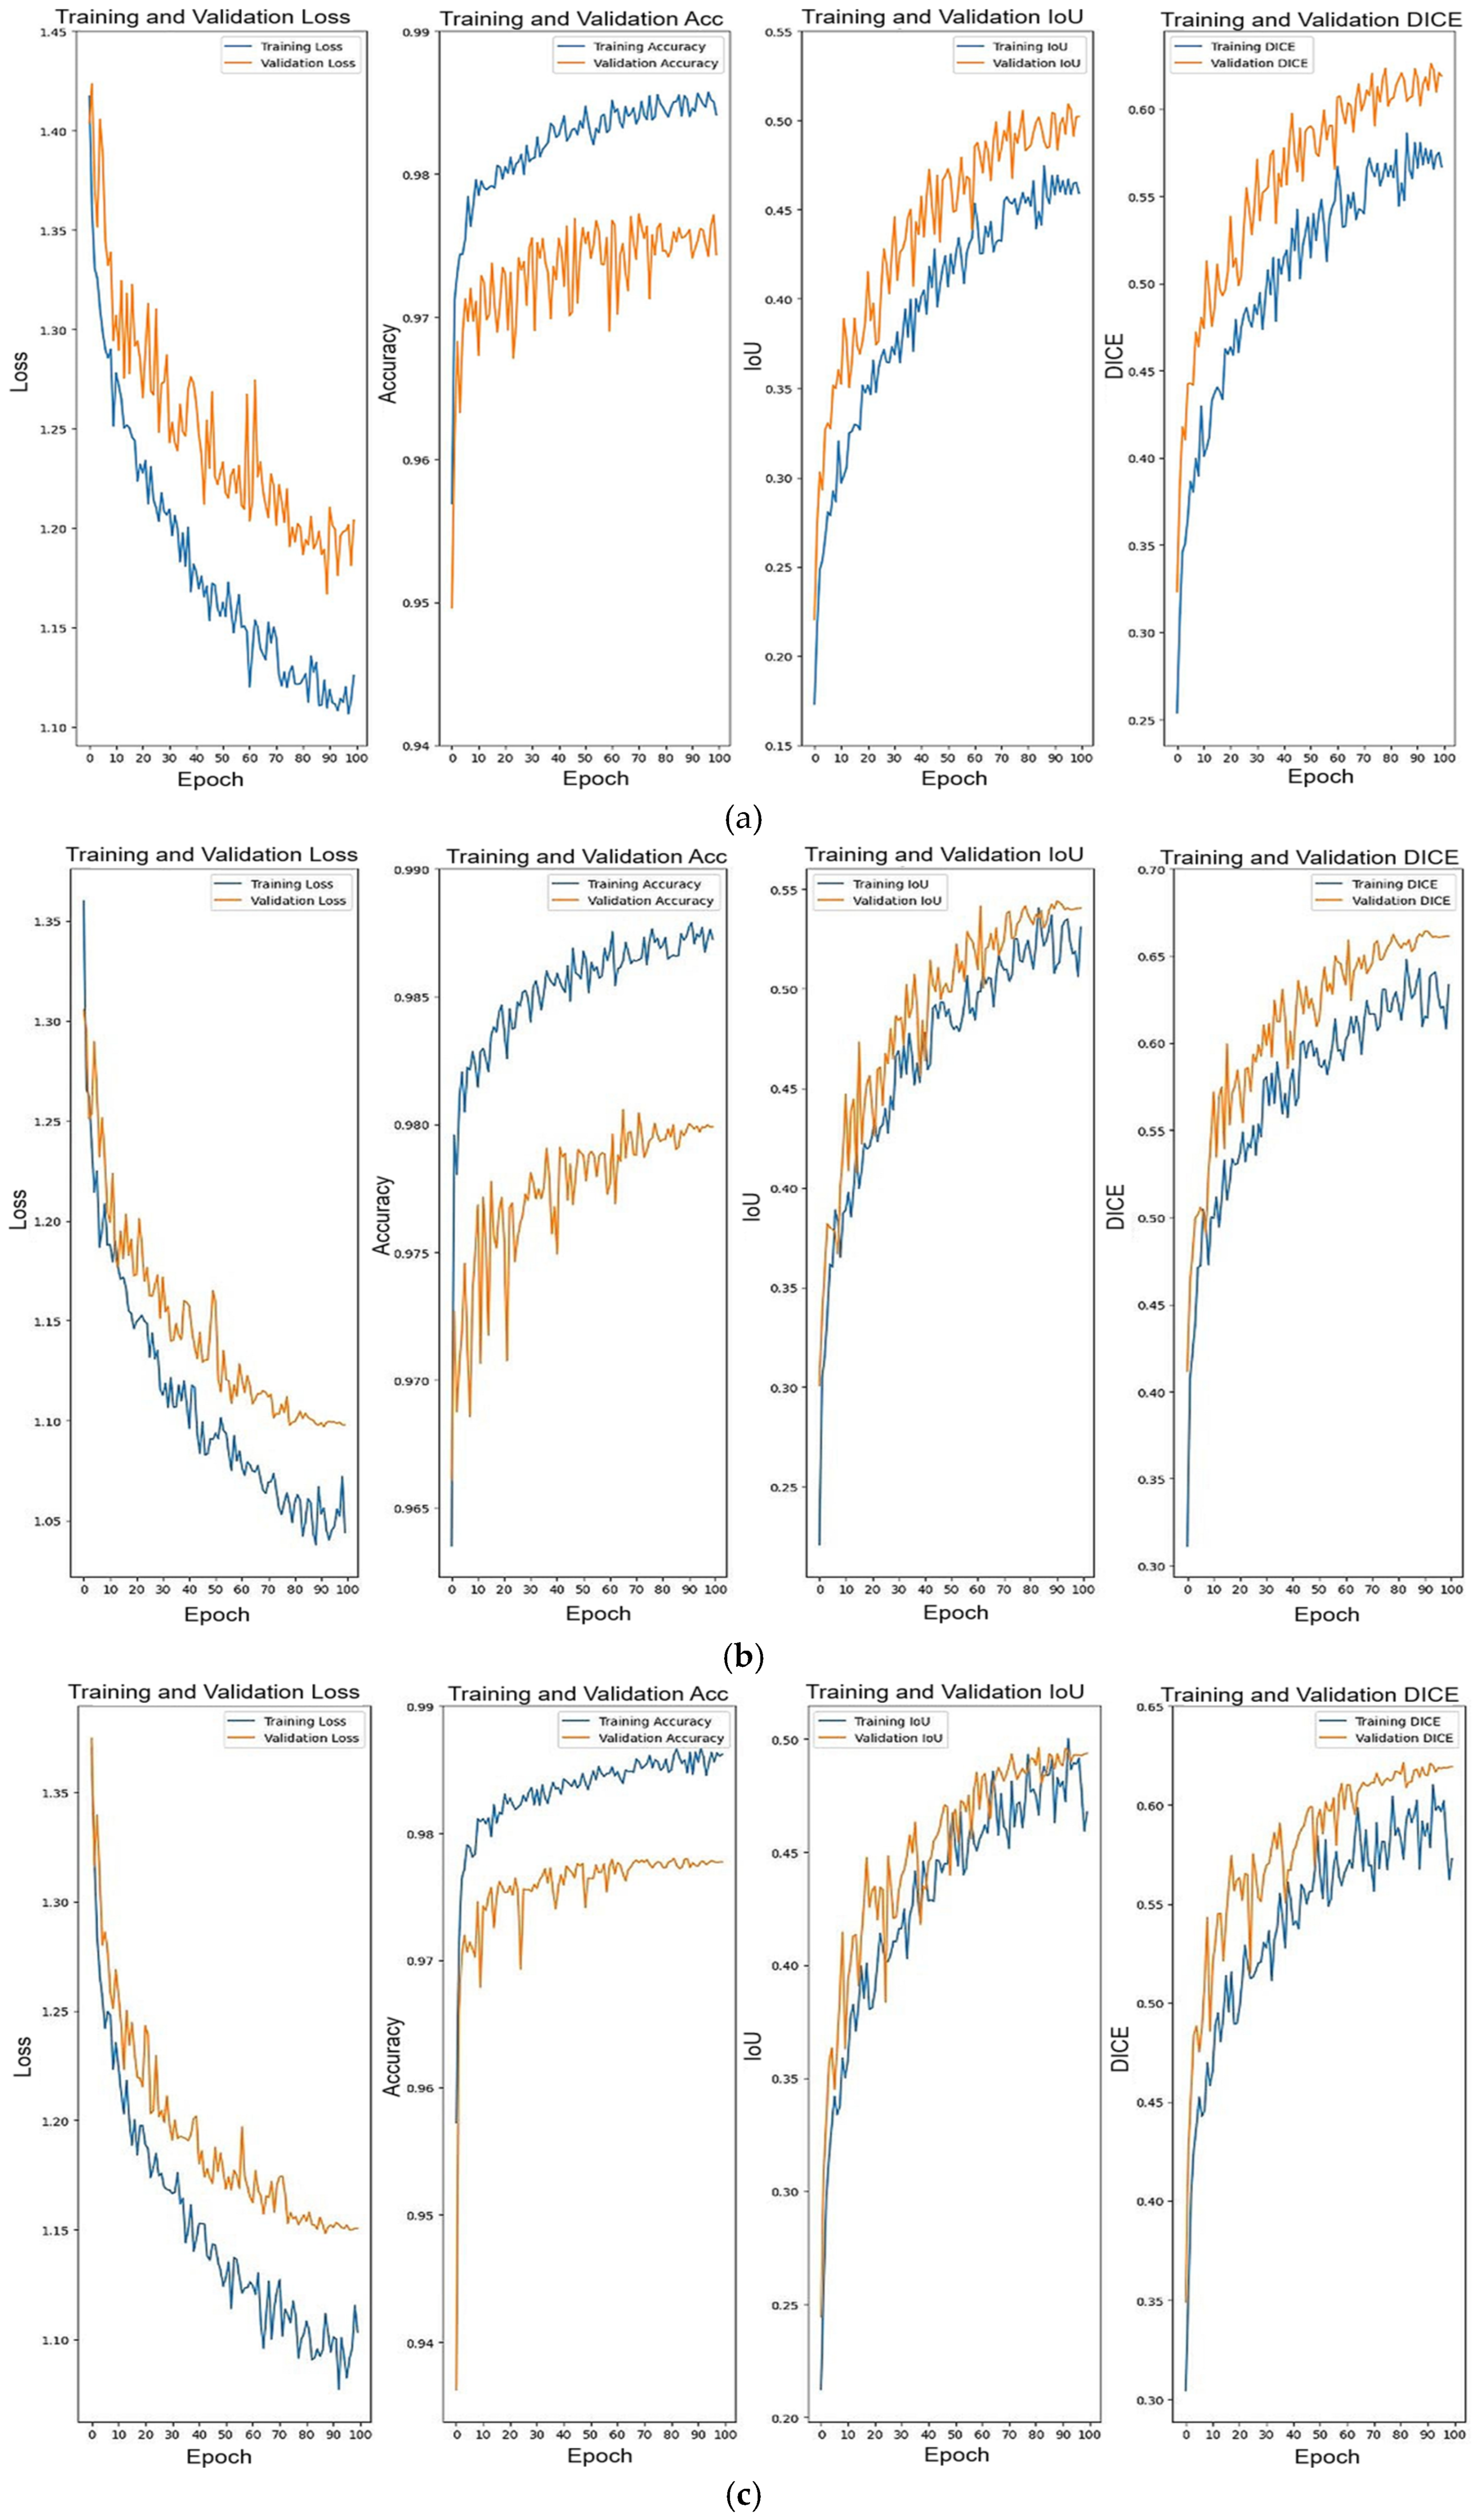
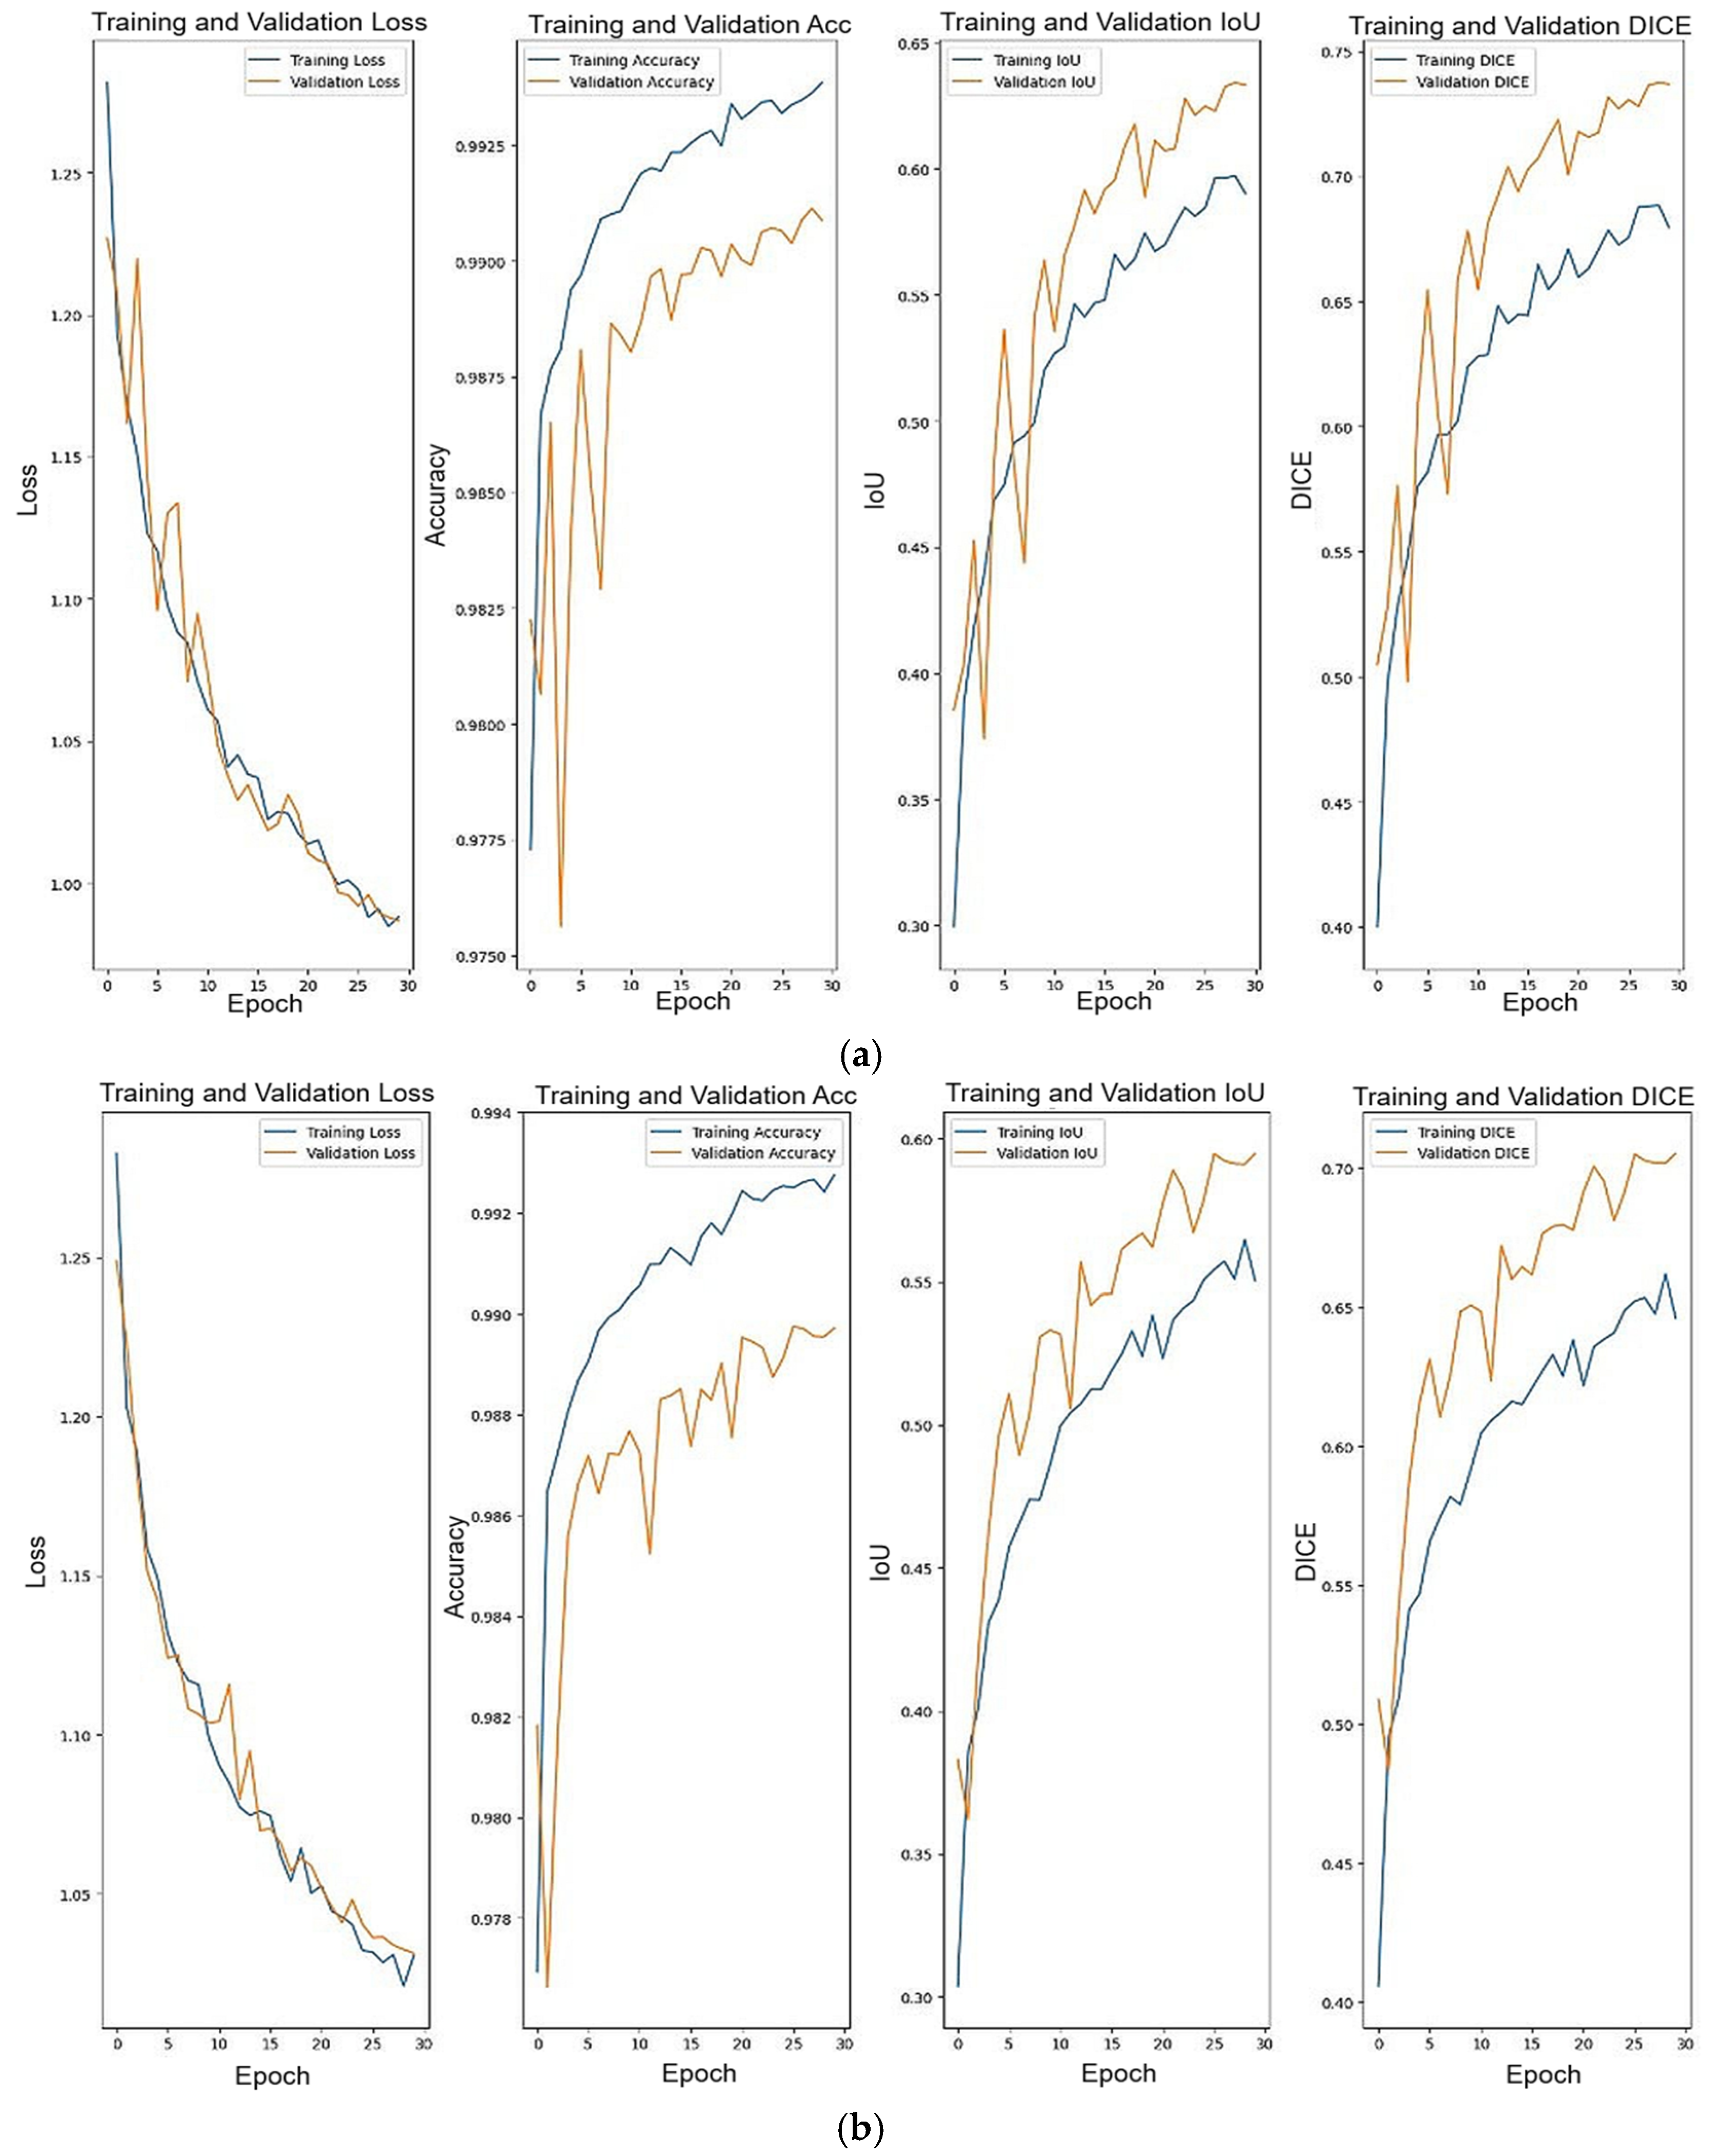
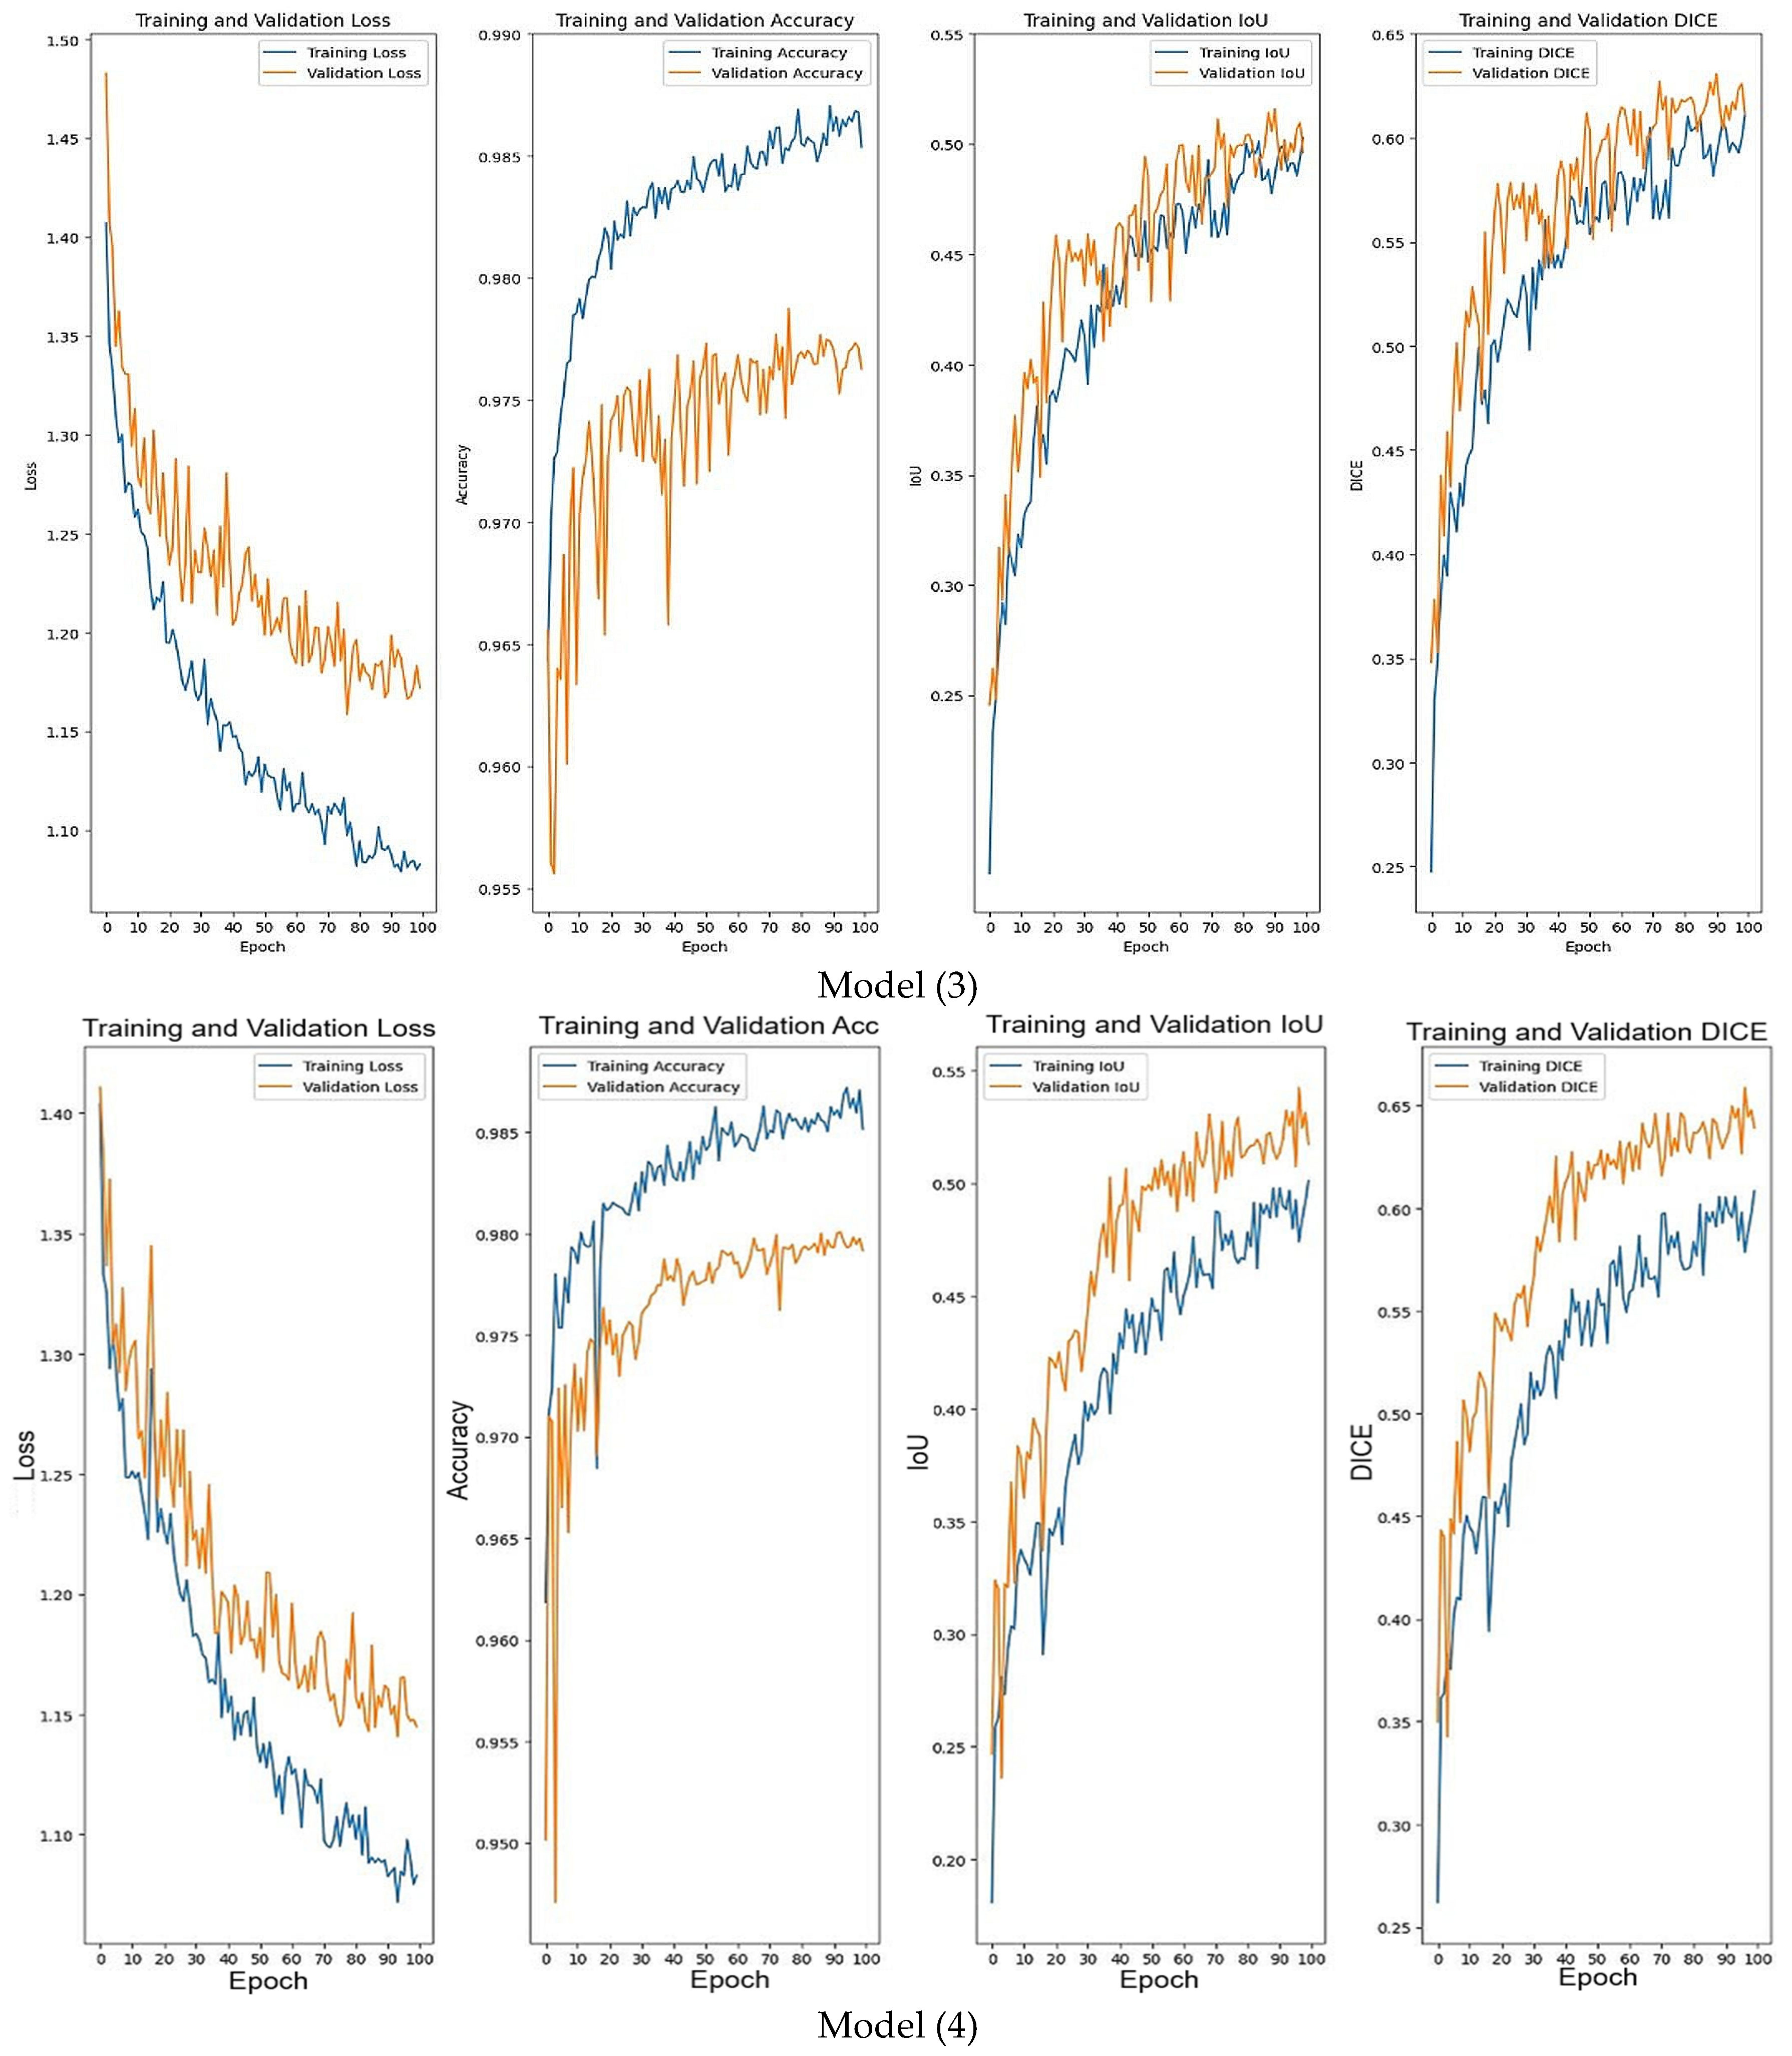
With the intention to clearly differentiate between each study, the model variant employed in the first ablation study is labelled as MSTransBTS*, the second study is referred to as SwinTransBTS, and the third study is denoted as MambaBTS. According to the comparison of the data in Figure 10 and Figure 11, as presented in Table 10, the proposed model consistently outperforms other alternatives across various metrics. It attains the lowest loss and the highest levels of accuracy, IoU, and overall Dice score, both during the training and validation phases. The outstanding performance of this model is evidence of the meticulous optimization of its architecture, which successfully establishes a balance between complexity and efficiency, resulting in superior accuracy in segmentation. In addition, based on Table 11, the proposed model also achieves the highest Dice scores for each ROI, i.e., WT, ET, and TC, as well as attaining the highest average Dice score accuracy. By meticulously fine-tuning each architectural element, the proposed model shows its capacity to precisely segment BT regions.
Although the proposed model exhibits remarkable accuracy in segmentation, it also has a large parameter count of 138.62 million, as shown in Table 12. The comprehensive architecture of this system results in longer durations for training, testing, and inference compared to other options. The extended processing durations may hinder the execution of time-sensitive applications, hence restricting the model’s practicality in some situations. Moreover, the large number of parameters raises the likelihood of overfitting, especially when trained on small datasets. Therefore, although the suggested model performs well, its resource-intensive characteristics require thorough assessment and optimization before it may be deployed in real-world scenarios.
During the last stage of the ablation study, the visualization outcomes of the four models are depicted in Table 13 and compared for the three modalities of the WT, ET, and TC and their combined output. Although the proposed model showed the most promising results and outperformed the alternatives in terms of segmentation performance, a closer analysis identifies areas that require additional work as there are some misclassified spots in the visualization results. The presence of these misclassifications highlights the intricate nature of the BT segmentation task and emphasizes the necessity for the ongoing improvement and optimization of the proposed model’s structure.
Let MSTransBTS, MSTransBTS*, SwinTransBTS, and MambaBTS denote investigated models (1), (2), (3), and (4), respectively.

4.3. Comparison of MSTransBTS with Related SOTA (TransBTS, SwinUNETR, and SegMamba)

In this section, a holistic comparison between the proposed MSTransBTS model and some state-of-the-art models in BT segmentation, including TransBTS, SwinUNETR, and SegMamba, is presented. It is essential to clarify that all related SOTA models are trained using the same configurations as the proposed MSTransBTS model, with differences merely being attributed to variations in the model framework. Through comparisons to established standards, the effectiveness of MSTransBTS is assessed. It provides insights into the extent to which MSTransBTS performs compared to other cutting-edge techniques in the discipline of BT segmentation.
Based on the comparison of trends shown in Figure 10 and Figure 12, as detailed in Table 14, when comparing the training and validation metrics of the proposed MSTransBTS, TransBTS [12], SwinUNETR [7], and SegMamba [8], it is evident that SwinUNETR outperforms the others in terms of loss rates in both training and validation, along with greater training IoU and overall Dice scores. Nevertheless, the proposed MSTransBTS consistently demonstrates superior accuracy in both the training and validation phases. Although SwinUNETR exceeds in certain evaluations, the accuracy of MSTransBTS highlights its efficiency in precisely identifying the BT areas. The observed discrepancies in performance can be related to the architectural disparities across the models as they employ identical training procedures and configurations. When analyzing the average Dice score for the WT, ET, and TC in Table 15, it is clear that SwinUNETR obtains a higher Dice score for the ET. However, its scores for the WT, the TC, and the overall average are lower than those of the proposed methodology. This implies that SwinUNETR may perform well in certain areas and that MSTransBTS provides better overall segmentation performance.
Aside from assessing the performance metrics, the computational complexity of the models is also evaluated and tabulated in Table 16, including parameters such as training time, testing time, and inference time. While it is true that our model has 138.62 million parameters, which may initially suggest high computational complexity, we have implemented several strategies that allow the model to achieve efficient performance in terms of training time, memory usage, and inference speed.
One key factor contributing to this efficiency is the use of an additional down-sampling step early in the pipeline. By encoding and down-sampling the input image twice before processing it through the parallel Swin-UNET and SegMamba blocks, we significantly reduce the size of the input data that the model processes. This down-sampling reduces the number of computations required during both the forward and backward passes of training, thus lowering the memory usage and improving the processing speed. As a result, the model can handle larger images without excessive computational resource requirements, despite the high number of parameters.
In contrast, the competing architectures, such as TransBTS, Swin-UNETR, and SegMamba, process the original, high-dimensional MRI images directly without such down-sampling. This direct processing requires more memory and computational power, especially when working with high-dimensional data such as 128 × 128 × 128 MRI volumes. Additionally, the high-dimensional inputs lead to longer training times and increased inference latency, as the model needs to extract features from larger images, often resulting in more computations per image and per training epoch. Furthermore, the down-sampling step in our model not only helps to reduce the computational complexity but also speeds up training and inference. The model’s ability to process the images at a lower resolution in the early stages means that it can focus on learning essential features more efficiently, thus speeding up convergence during training and reducing inference time. Despite having a larger number of parameters, these optimizations lead to a more efficient training process, lower memory usage, and faster inference speeds compared to models that do not utilize such down-sampling strategies.
Hence, while the model has a relatively high number of parameters, the use of down-sampling, along with the efficient parallel processing in the Swin-UNET and SegMamba blocks, allows our model to maintain competitive performance in terms of both segmentation accuracy and computational efficiency. Upon examining the visualization results in Table 17, it is apparent that the predicted results from the proposed model substantially match the results from SwinUNETR, with only slight differences noticed, particularly in the WT section. However, when compared to TransBTS and SegMamba, the suggested model consistently achieves superior performance in all segmented regions. Notably, in the TransBTS model, it is evident that there is a specific inability to detect particular tumour core labels, which suggests that there may be constraints in precisely defining some tumour locations. Similarly, the SegMamba model inaccurately identifies a significant portion of the enhanced tumour areas, which underscores the difficulties in accurately categorizing these areas. These insights provide a clear understanding of the strengths and drawbacks of each model, with the proposed model showcasing strong segmentation abilities. Although there are some small differences compared to SwinUNETR, the proposed approach demonstrates greater performance and validates its reliability in identifying BT locations.
Let MSTransBTS, TransBTS, SwinUNETR, and SegMamba denote the investigated models (proposed, [12], [7], and [8], respectively). All the related SOTA models are trained using the same configurations as the proposed MSTransBTS model, differing only in the model architecture.

4.4. Extension Result for BraTS2023

In this section, a larger portion of the BraTS2023 dataset is used to evaluate the effectiveness of the proposed MSTransBTS model. Contrasting with the BraTS2020 dataset, the BraTS2023 dataset includes 1251 MRI image samples and is split into training, validation, and testing sets in a 7:1:2 ratio. However, due to a shift in the labelling of enhancing tumours in the BraTS2023 dataset, which is labelled as 3 compared to label 4 in BraTS2020, certain adjustments are required to be conducted.
To validate the model’s performance on the BraTS2023 dataset, several key metrics such as loss, accuracy, Intersection over Union (IoU), and Dice score are evaluated during both the training and validation phases. According to the loss curves illustrated in Figure 13, as detailed in Table 18, this phenomenon demonstrates the model’s convergence, indicating no sign of overfitting or underfitting. High training and validation accuracy also implies that the model is capable of accurately identifying and localizing the BT location. Additionally, the model attains desirable IoU and Dice scores, which claims that the model has the capability to precisely segment each ROI.
Similarly, Dice scores for each ROI are computed and averaged utilizing the proposed model, presenting in Table 19 Notably, the proposed MSTransBTS model outperforms, yielding Dice scores of 90.38% for the WT, 81.59% for the ET, and 85.73% for the TC, with an overall average of 85.90%. Additionally, the integration of the TTA strategy further enhances the Dice scores to 90.60% for the WT, 82.27% for the ET, and 86.39% for the TC, with an average of 86.43%. These results unequivocally show the efficacy and effectiveness of TTA in improving segmentation accuracy across diverse datasets. With the intention to provide a comprehensive assessment of the model’s segmentation capabilities, Table 20 showcases visualizations of three distinct slices of BraTS2023 data. A comparison with ground truth reveals the model’s accuracy in localizing and segmenting regions of interest. By comparing the predicted output with the ground truth, it is evident that the model performs well as it manages to localize and segment the desired ROI accurately.
With the intention to validate the effectiveness of the proposed model on the more recent BraTS dataset, the BraTS2023 dataset is utilized for training, validating, and testing the proposed model. Due to the greater volume of the BraTS2023 dataset, the models are trained within 30 epochs.

4.5. Comparison of MSTransBTS with Related SOTA (SwinUNETR and SegMamba) on BraTS2023 Dataset

Although the proposed MSTransBTS model shows desirable results, conducting a comparison between the proposed model and the state of the art (SOTA) is highly indispensable. This comparison is essential as it uncovers the distinct features of the proposed model and highlights the distinctions between them. Similarly, all related models are trained using equivalent configurations to the proposed model.
According to the results gathered from Figure 14 and shown in Table 21, it is evident that the proposed model exhibits the greatest loss while achieving the highest accuracy, IoU, and Dice score for both the training and validation phases. A lower loss indicates that the proposed model accurately classifies each label and identifies their respective locations. Overall, these results conclude that the proposed model demonstrates better segmentation capabilities than the related SOTA, as its outcomes are more desirable.
Furthermore, the average Dice scores of the WT, ET, and TC for these models are computed and tabulated in Table 22. Through these results, it is clear that the proposed model outperforms its alternatives, except for SwinUNETR, which exhibits better segmentation accuracy for the ET. The superior Dice scores obtained by the proposed model demonstrate exceptional segmentation performance as the predicted segmented outputs align closely with the ground truth mask. Ultimately, the visualization results of index 1657 with slice 53 for the investigated models are presented in Table 23. Upon observing the predicted segmented outputs, it is evident that the proposed model obtains more advanced segmentation capability than its alternatives as the misclassification areas are substantially reduced in the results of the proposed model.
Overall, the proposed MSTransBTS model is capable of identifying and segmenting the desired regions accurately in two datasets. These results further demonstrate the robustness of the proposed model as it is able to cope with diverse variations of BTs, marking a significant advancement in precision medicine.
Let MSTransBTS, SwinUNETR, and SegMamba denote the investigated models (proposed, [7], and [8], respectively). All the related SOTA models are trained using the same configurations as the proposed MSTransBTS model, differing only in the model architecture. Additionally, the BraTS2023 dataset is harnessed instead of the BraTS2020 dataset in this section.
To further evaluate the performance of MSTransBTS, a comparison was conducted with two recently published state-of-the-art models, which were 3DUV-NetR+ [24] and TransSea [25]. The 3DUV-NetR+ model achieved Dice scores of 91.95% for the WT, 82.80% for the TC, and 81.70% for the ET on the BraTS2020 dataset. Its key innovation lies in combining feature representations from 3DU-Net and V-Net, followed by fusion at each decoder depth, further enhanced with 3D convolution layers and a Transformer block for richer contextual information. The TransSea model attained Dice scores of 92.36% (WT), 86.89% (TC), and 79.71% (ET). This model leverages a hybrid CNN–Transformer network with semantic awareness, incorporating semantic mutual attention (SMA) and multi-scale semantic guidance (SG) in the encoder, along with a semantic integration (SI) module in the decoder to enhance feature representation.
In comparison, MSTransBTS also integrates CNN and Transformer architectures, reinforcing the effectiveness of this hybrid approach in capturing both local and global contextual features in MRI images. While it does not achieve the highest overall Dice scores, it demonstrates notable strengths in specific aspects of tumour segmentation. Specifically, MSTransBTS outperforms 3DUV-NetR+ in TC segmentation by 1.95% and surpasses TransSea in ET segmentation by 0.38%. These results indicate that MSTransBTS is competitive with the latest SOTA models and excels in certain aspects of brain tumour segmentation.
These findings further emphasize the effectiveness and robustness of the proposed model, reaffirming its significance in advancing precision medicine through improved brain tumour segmentation.

5. Conclusions

In conclusion, the proposed MSTransBTS model demonstrates superior performance in BT segmentation, showing better Dice scores and achieving superior results with the implementation of TTA. By incorporating various DL components and strategies, the proposed model is capable of accurately localizing and delineating the ROI. The streamlined BT segmentation process demonstrates a more efficient diagnosis than manual diagnosis, easing the burden of medical experts. Additionally, the model’s capability to colour-coding each ROI enhances the clarity of segmentation results, making it easier to identify the precise location of the BT. Ultimately, automation facilitated by a reliable and advanced model, like the MSTransBTS model, has the potential to revolutionize patient outcomes and clinical decision-making, facilitating advancement in precision medicine.
While the MSTransBTS model has achieved superior segmentation results, there is still room for improvement. Firstly, the effectiveness of the proposed model can be validated with the upcoming BraTS2024 dataset. By training the model with a diverse dataset, the model is able to recognize and extract more detailed features, facilitating the advancement in BT segmentation. This approach is able to provide the opportunity to validate and refine the proposed MSTransBTS model. Due to the disadvantage of the proposed model’s long evaluation time, optimizing the model’s computation efficiency is not an option but a necessity. Therefore, the investigation of parallelizing the CNN encoders alongside the Swin Transformer and Mamba encoders can be carried out to enhance the model’s evaluation speed and scalability. With the intention to enhance the segmentation capability of the proposed model, investigations integrating different sizes of Swin Transformers can be conducted. This is due to Swin Transformers greater in size have the potential to enhance the segmentation capability of the proposed model. Despite the high number parameter count issue, the main objective is to enhance the segmentation capability of the proposed model, as an accurate diagnosis is highly indispensable in the healthcare industry.

Author Contributions

Conceptualization, H.N.; methodology, J.Q.N. and H.N.; software, J.Q.N.; validation, J.Q.N.; formal analysis, J.Q.N.; investigation, J.Q.N.; resources, H.N.; data curation, J.Q.N.; writing—original draft preparation, J.Q.N., H.N. and C.-Y.T.; writing—review and editing, J.Q.N., H.N. and C.-Y.T.; visualization, J.Q.N.; supervision, H.N.; project administration, H.N. All authors have read and agreed to the published version of the manuscript.

Funding

This research received no external funding.

Data Availability Statement

The dataset used in this study is 3D BT segmentation dataset from BraTS2020 and 2023. The BraTS2020 dataset can be obtained from https://www.kaggle.com/datasets/awsaf49/brats20-dataset-training-validation/data (accessed on 20 August 2023), while the BraTS2023 dataset can be obtained from https://www.med.upenn.edu/cbica/brats/ (accessed on 25 April 2024).

Conflicts of Interest

The authors declare no conflicts of interest.

References

  1. Cherguif, H.; Riffi, J.; Mahraz, M.A.; Yahyaouy, A.; Tairi, H.B.T. Segmentation Based on DL. In Proceedings of the 2019 International Conference on Intelligent Systems and Advanced Computing Sciences (ISACS), Taza, Morocco, 26–27 December 2019. [Google Scholar]
  2. Saif, A.; Pallab, K.C. On the Performance of Deep Transfer Learning Networks for BT Detection using MR Images. IEEE Access 2022, 10, 59099–59114. [Google Scholar]
  3. Johnson, K.J.; Schwartzbaum, J.; Kruchko, C.; Scheurer, N.E.; Lau, C.C.; Woehrer, A.; Hainfellner, J.A.; Wiemels, J.B.T. epidemiology in the era of precision medicine: The 2017 BT Epidemiology Consortium meeting report. Clin. Neuropathol. 2017, 36, 255–263. [Google Scholar] [PubMed]
  4. Asma, N.; Tahreem, Y.; Arifah, A.; Tanzeela, S.; Kashif, Z. Computer-Aided BT Diagnosis: Performance Evaluation of Deep Learner CNN Using Augmented Brain MRI. Int. J. Biomed. Imaging 2021, 2021, 1–11. [Google Scholar]
  5. Tan, D.S.; Nisar, H.; Yeap, K.H.; Dakulagi, V.; Amin, M. Lumbar intervertebral disc detection and classification with novel deep learning models. J. King Saud Univ. Comput. Inf. Sci. 2024, 36, 102148. [Google Scholar]
  6. ZainEldin, H.; Gamel, S.A.; El-Kenawy, E.-S.M.; Alharbi, A.H.; Khafaga, D.S.; Ibrahim, A.; Talaat, F.M.B.T. Detection and Classification Using DL and Sine-Cosine Fitness Grey Wolf Optimisation. Bioengineering 2022, 10, 18. [Google Scholar] [CrossRef] [PubMed]
  7. He, Y.; Nath, V.; Yang, D.; Tang, Y.; Myronenko, A.; Xu, D. SwinUNETR-V2: Stronger Swin Transformers with Stagewise Convolutions for 3D Medical Image Segmentation. In Medical Image Computing and Computer Assisted Intervention—MICAI 2023, Proceedings of the 26th International Conference, Vancouver, BC, Canada, 8–12 October 2023; Springer: Berlin/Heidelberg, Germany, 2023; pp. 416–426. [Google Scholar]
  8. Xing, Z.; Ye, T.; Yang, Y.; Liu, G.; Zhu, L. SegMamba: Long-range Sequential Modeling Mamba For 3D Medical Image Segmentation. In Medical Image Computing and Computer Assisted Intervention—MICCAI 2024, Proceedings of the 27th International Conference, Marrakesh, Morocco, 6–10 October 2024; Springer: Berlin/Heidelberg, Germany, 2024. [Google Scholar]
  9. Tabian, I.; Fu, H.; Sharif Khodaei, Z. A convolutional neural network for impact detection and characterization of complex composite structures. Sensors 2019, 19, 4933. [Google Scholar] [CrossRef] [PubMed]
  10. Tan, D.S.; Tam, W.Q.; Nisar, H.; Yeap, K.H. Segmenting Brain Tumor with an Improved U-Net Architecture. In Proceedings of the 2022 IEEE—EMBS Conference on Biomedical Engineering and Sciences (IECBES), Kuala Lumpur, Malaysia, 12–14 December 2022; pp. 72–77. [Google Scholar] [CrossRef]
  11. He, K.; Zhang, X.; Ren, S.; Sun, J. Deep Residual Learning for Image Recognition. arXiv 2015, arXiv:1512.03385. [Google Scholar]
  12. Wang, E.; Chen, C.; Ding, M.; Yu, H.; Zha, S.; Li, J. TransBTS: Multimodal BT Segmentation Using Transformer. In Proceedings of the Medical Image Computing and Computer Assisted Intervention—MICCAI 2021: 24th International Conference, Strasbourg, France, 27 September–1 October 2021. [Google Scholar]
  13. Chen, X.; Li, H.; Li, M.; Pan, J. Learning a sparse transformer network for effective image deraining. In Proceedings of the IEEE/CVF Conference on Computer Vision and Pattern Recognition, Seattle, WA, USA, 13–19 June 2020; pp. 5896–5905. [Google Scholar]
  14. Liu, Z.; Lin, Y.; Cao, Y.; Hu, H.; Wei, Y.; Zhang, Z.; Lin, S.; Guo, B. Swin Transformer: Hierarchical Vision Transformer Using Shifted Windows. In Proceedings of the 2021 IEEE/CVF International Conference on Computer Vision (ICCV), Montreal, QC, Canada, 10–17 October 2021. [Google Scholar]
  15. Gong, L.Y.; Li, X.J.; Chong, P.H.J. Swin-Fake: A Consistency Learning Transformer-Based Deepfake Video Detector. Electronics 2024, 13, 3045. [Google Scholar] [CrossRef]
  16. Hatamizadeh, A.; Nath, V.; Tang, Y.; Yang, D.; Roth, H.R.; Xu, D. Swin UNETR: Swin Transformers for Semantic Segmentation of Brain Tumors in MRI Images. BrainLes 2021, 272–284. [Google Scholar] [CrossRef]
  17. Wang, Z.; Zheng, J.Q.; Zhang, Y.C.; Cui, G.; Li, L. Mamba-UNet: UNet-Like Pure Visual Mamba for Medical Image Segmentation. arXiv 2024, arXiv:2402.05079. [Google Scholar]
  18. BraTS2020 Dataset (Training + Validation). Available online: https://www.kaggle.com/datasets/awsaf49/brats20-dataset-training-validation (accessed on 7 April 2024).
  19. Baid, U.; Ghodasara, S.; Mohan, S.; Bilello, M.; Calabrese, E.; Colak, E.; Farahani, K.; Kalpathy-Cramer, J.; Kitamura, F.C.; Pati, S.; et al. The RSNA-ASNR-MICCAI BraTS 2021 Benchmark on Brain Tumor Segmentation and Radiogenomic Classification. arXiv 2021, arXiv:2107.02314. [Google Scholar]
  20. Menze, B.H.; Jakab, A.; Bauer, S.; Kalpathy-Cramer, J.; Farahani, K.; Kirby, J.; Burren, Y.; Porz, N.; Slotboomy, J.; Wiest, R.; et al. The Multimodal Brain Tumor Image Segmentation Benchmark (BRATS). IEEE Trans. Med. Imaging 2015, 34, 1993–2024. [Google Scholar] [PubMed]
  21. Bakas, S.; Akbari, H.; Sotiras, A.; Bilello, M.; Rozycki, M.; Kirby, J.S.; Freymann, J.B.; Farahani, K.; Davatzikos, C. Advancing The Cancer Genome Atlas glioma MRI collections with expert segmentation labels and radiomic features. Nat. Sci. Data 2017, 4, 170117. [Google Scholar]
  22. Yeung, M.; Sala, E.; Schönlieb, C.B.; Rundo, L. Unified Focal loss: Generalising Dice and cross entropy-based losses to handle class imbalanced medical image segmentation. Comput. Med. Imaging Graph. 2022, 95, 102026. [Google Scholar] [CrossRef] [PubMed]
  23. Wang, G.; Li, W.; Ourselin, S.; Vercauteren, T. Automatic Brain Tumor Segmentation Using Convolutional Neural Networks with Test-Time Augmentation. BrainLes 2018, 11384, 61–72. [Google Scholar]
  24. Abboussaleh, I.; Riffi, J.; Fazazy, K.; Mahraz, A.M.; Tairi, H. 3DUV-NetR+: A 3D hybrid semantic architecture using transformers for brain tumor segmentation with MultiModal MR images. Results Eng. 2024, 21, 101892. [Google Scholar] [CrossRef]
  25. Liu, Y.; Ma, Y.; Zhu, Z.; Cheng, J.; Chen, X. TransSea: Hybrid CNN–Transformer With Semantic Awareness for 3-D Brain Tumor Segmentation. IEEE Trans. Instrum. Meas. 2024, 73, 16–31. [Google Scholar] [CrossRef]
Figure 1. Residual connection in CNN’s encoder.
Mathematics 13 01117 g001
Figure 2. Two successive Swin Transformer blocks. Adapted with permission from [14], Copyright IEEE 2025.
Mathematics 13 01117 g002
Figure 3. GSC mechanism. Adapted with permission from [8], Copyright Springer 2025.
Mathematics 13 01117 g003
Figure 4. ToM mechanism. Adapted with permission from [8], Copyright Springer 2025.
Mathematics 13 01117 g004
Figure 5. Flowchart of the project.
Mathematics 13 01117 g005
Figure 6. Proposed model of MSTransBTS architecture.
Mathematics 13 01117 g006
Figure 7. MambaUnet architecture. Adapted with permission from [7], Copyright Springer 2025.
Mathematics 13 01117 g007
Figure 8. SwinUnet architecture. Adapted with permission from [8], Copyright Springer 2025.
Mathematics 13 01117 g008
Figure 9. TTA mechanism.
Mathematics 13 01117 g009
Figure 10. Overall result of loss, accuracy, IoU, and Dice Score for MSTransBTS.
Mathematics 13 01117 g010
Figure 11. Overall result of loss, accuracy, IoU, and Dice score for model (2), model (3), and model (4).
Mathematics 13 01117 g011aMathematics 13 01117 g011b
Figure 12. Overall result of loss, accuracy, IoU, and Dice score for model [12] (a), model [7] (b), and model [8] (c).
Mathematics 13 01117 g012
Figure 13. Overall result of loss, accuracy, IoU, and Dice score for proposed MSTransBTS on BraTS2023.
Mathematics 13 01117 g013
Figure 14. Overall result of loss, accuracy, IoU, and Dice score for model [7] (a) and model [8] (b) for BraTS2023.
Mathematics 13 01117 g014
Table 1. Dataset splitting for training, validation, and testing set.
DatasetBraTS2020BraTS2023
SetRatioNumber of SamplesRatioNumber of Samples
Training70%25870%876
Validation10%3710%125
Testing20%7420%250
Total100%369100%1251
Table 2. Comparison of original and augmented ground truth masks.
Augmentation MethodOriginal Ground Truth MaskAugmented Ground Truth Mask
(1) Random cropping of the data from 240 × 240 × 155 to 128 × 128 × 128 voxelsMathematics 13 01117 i001Mathematics 13 01117 i002
(2) Random mirroring across the axial, coronal, and sagittal planes with a probability of 0.5Mathematics 13 01117 i003Mathematics 13 01117 i004
(3) Incorporating random intensity shifts in the range of [−0.1, 0.1] and scales between [0.9, 1.1]Mathematics 13 01117 i005Mathematics 13 01117 i006
Table 3. Configurations in model training progress.
ParametersSpecification
Number of Epochs100
Batch Size1
OptimizerAdam
Initial Learning Rate0.002
Learning Rate SchedulerPolynomial
Rate Decay by each iteration (Power)0.9
Table 4. First to eighth augmented and dis-augmented prediction result.
Flipping Direction
UnchangedHeightWidthDepthHeight, WidthHeight, DepthWidth, DepthHeight, Width, Depth
Augmented Prediction
Mathematics 13 01117 i007Mathematics 13 01117 i008Mathematics 13 01117 i009Mathematics 13 01117 i010Mathematics 13 01117 i011Mathematics 13 01117 i012Mathematics 13 01117 i013Mathematics 13 01117 i014
Dis-Augmented Prediction
Mathematics 13 01117 i015Mathematics 13 01117 i016Mathematics 13 01117 i017Mathematics 13 01117 i018Mathematics 13 01117 i019Mathematics 13 01117 i020Mathematics 13 01117 i021Mathematics 13 01117 i022
Table 5. Comparison of merged prediction, original prediction, and ground truth.
Merged PredictionOriginal PredictionGround Truth
Mathematics 13 01117 i023Mathematics 13 01117 i024Mathematics 13 01117 i025
Note: Table 4 and Table 5 share the same labels annotation: (1) whole tumour: yellow; (2) tumour core: blue; (3) enhancing tumour: grey.
Table 6. Result of loss, accuracy, IoU, and Dice score at 100th epoch of proposed method.
LossAccuracyIoUDice Score
Training1.07290.98660.50010.6063
Validation1.14700.98020.53990.6511
Table 7. Average Dice score of WT, ET, and TC of proposed method.
Average Dice Score
Whole Tumour (WT) (%)Enhanced Tumour (ET) (%)Tumour Core (TC) (%)Average (%)
MSTransBTS (w/o TTA)89.2479.8184.1784.40
MSTransBTS (w/ TTA)89.5380.0984.7584.79
Table 8. Computational complexity of proposed method.
MSTransBTS
No of Parameters (M)Training Time (h)Testing Time (min)Inference Time (min)
(w/o TTA)138.6219.641.241.44
(w/ TTA)8.17
Table 9. Visualization result of three different slices for MSTransBTS Model.
Index 162, Slice 59
Whole Tumour (WT)Enhanced Tumour (ET)Tumour Core (TC)Combined Output
Ground TruthMathematics 13 01117 i026Mathematics 13 01117 i027Mathematics 13 01117 i028Mathematics 13 01117 i029
Predicted OutputMathematics 13 01117 i030Mathematics 13 01117 i031Mathematics 13 01117 i032Mathematics 13 01117 i033
Index 189, Slice 100
Ground TruthMathematics 13 01117 i034Mathematics 13 01117 i035Mathematics 13 01117 i036Mathematics 13 01117 i037
Predicted OutputMathematics 13 01117 i038Mathematics 13 01117 i039Mathematics 13 01117 i040Mathematics 13 01117 i041
Index 338, Slice 50
Ground TruthMathematics 13 01117 i042Mathematics 13 01117 i043Mathematics 13 01117 i044Mathematics 13 01117 i045
Predicted OutputMathematics 13 01117 i046Mathematics 13 01117 i047Mathematics 13 01117 i048Mathematics 13 01117 i049
Table 10. Comparison of loss, accuracy, IoU, and Dice score at 100th epoch for the proposed model and models (2), (3), and (4).
(Proposed) MSTransBTS
LossAccuracyIoUDice Score
Training1.07290.98660.50010.6063
Validation1.14700.98020.53990.6511
(2) MSTransBTS*
Training1.10020.98530.47710.5860
Validation1.17600.97500.48840.6044
(3) SwinTransBTS
Training1.08270.98540.49380.5996
Validation1.17200.97630.49600.6119
(4) MambaBTS
Training1.08300.98510.49160.5972
Validation1.14850.97920.53130.6390
Table 11. Comparison of average Dice score of the WT, ET, and TC for the proposed model and models (2), (3), and (4).
(Proposed) MSTransBTS
Whole Tumour (WT) (%)Enhanced Tumour (ET) (%)Tumour Core (TC) (%)Average (%)
(w/o TTA)89.2479.8184.1784.40
(w/ TTA)89.5380.0984.7584.79
(2) MSTransBTS*
(w/o TTA)87.9677.1880.1081.74
(w/ TTA)88.7078.5281.2582.82
(3) SwinTransBTS
(w/o TTA)88.3778.2879.7582.13
(w/ TTA)88.8079.9380.9483.22
(4) MambaBTS
(w/o TTA)88.1177.9581.3882.48
(w/ TTA)88.5479.0582.3083.30
Table 12. Comparison of computational complexity for the proposed model and models (2), (3), and (4).
(Proposed) MSTransBTS
No. of Parameter (M)Training Time (h)Testing Time (min)
(w/o TTA)138.6219.641.24
(w/ TTA)8.17
(2) MSTransBTS*
(w/o TTA)60.1217.081.04
(w/ TTA)2.20
(3) SwinTransBTS
(w/o TTA)73.4118.481.33
(w/ TTA)5.80
(4) MambaBTS
(w/o TTA)65.8417.631.20
(w/ TTA)6.30
Note: V100 GPU is used for training, while T4 GPU is used for testing and inferencing.
Table 13. Comparison of visualization result of index 368 with slice 71 for the proposed model and models (2), (3), and (4).
Whole Tumour (WT)Enhanced Tumour (ET)Tumour Core (TC)Combined Output
Ground TruthMathematics 13 01117 i050Mathematics 13 01117 i051Mathematics 13 01117 i052Mathematics 13 01117 i053
(Proposed)Mathematics 13 01117 i054Mathematics 13 01117 i055Mathematics 13 01117 i056Mathematics 13 01117 i057
(2)Mathematics 13 01117 i058Mathematics 13 01117 i059Mathematics 13 01117 i060Mathematics 13 01117 i061
(3)Mathematics 13 01117 i062Mathematics 13 01117 i063Mathematics 13 01117 i064Mathematics 13 01117 i065
(4)Mathematics 13 01117 i066Mathematics 13 01117 i067Mathematics 13 01117 i068Mathematics 13 01117 i069
Table 14. Comparison of loss, accuracy, IoU, and Dice score at the 100th epoch of the proposed MSTransBTS model and those available in the literature [12], [7], and [8].
(Proposed) MSTransBTS
LossAccuracyIoUDice Score
Training1.07290.98660.50010.6063
Validation1.14700.98020.53990.6511
TransBTS [12]
Training1.13260.98380.45180.5632
Validation1.18950.97680.49230.6143
SwinUNETR [7]
Training1.04410.98510.53090.6334
Validation1.09790.97880.53820.6502
SegMamba [8]
Training1.10330.98620.46780.5728
Validation1.15060.97770.49370.6193
Table 15. Comparison of average Dice score of the WT, ET, and TC of the proposed MSTransBTS model and those available in the literature [12], [7], and [8].
(Proposed) MSTransBTS
Whole Tumour (WT) (%)Enhanced Tumour (ET) (%)Tumour Core (TC) (%)Average (%)
(w/o TTA)89.2479.8184.1784.40
(w/ TTA)89.5380.0984.7584.79
TransBTS [12]
(w/o TTA)87.3874.8777.3479.86
(w/ TTA)87.9476.8178.5081.08
SwinUNETR [7]
(w/o TTA)89.1281.7582.1284.33
(w/ TTA)89.2581.8882.2584.46
SegMamba [8]
(w/o TTA)88.8169.6879.2679.25
(w/ TTA)89.0269.8279.5779.47
Table 16. Comparison of computational complexity of the proposed MSTransBTS model and those available in the literature [12], [7], and [8].
(Proposed) MSTransBTS
No.of Parameter (M)Training Time (h)Testing Time (min)
(w/o TTA)138.6219.641.24
(w/ TTA)8.17
TransBTS [12]
(w/o TTA)32.9914.280.99
(w/ TTA)3.16
SwinUNETR [7]
(w/o TTA)61.9921.341.46
(w/ TTA)10.24
SegMamba [8]
(w/o TTA)64.3017.291.74
(w/ TTA)12.54
Note: V100 GPU is used for training, while T4 GPU is used for testing and inferencing.
Table 17. Comparison of the visualization results of index 337 with slice 77 of the proposed MSTransBTS model and those available in the literature [12], [7], [8].
Whole
Tumour (WT)
Enhanced
Tumour (ET)
Tumour Core (TC)Combined Output
Ground TruthMathematics 13 01117 i070Mathematics 13 01117 i071Mathematics 13 01117 i072Mathematics 13 01117 i073
(Proposed)Mathematics 13 01117 i074Mathematics 13 01117 i075Mathematics 13 01117 i076Mathematics 13 01117 i077
[9]Mathematics 13 01117 i078Mathematics 13 01117 i079Mathematics 13 01117 i080Mathematics 13 01117 i081
[8]Mathematics 13 01117 i082Mathematics 13 01117 i083Mathematics 13 01117 i084Mathematics 13 01117 i085
[10]Mathematics 13 01117 i086Mathematics 13 01117 i087Mathematics 13 01117 i088Mathematics 13 01117 i089
Table 18. Result of loss, accuracy, IoU, and Dice score at the 30th epoch on BraTS2023.
LossAccuracyIoUDice Score
Training0.98010.99390.59930.6893
Validation0.99520.99190.65270.7491
Table 19. Average Dice score of WT, ET, and TC on BraTS2023.
Average Dice Score
Whole Tumour (WT) (%)Enhanced Tumour (ET) (%)Tumour Core (TC) (%)Average (%)
MSTransBTS (w/o TTA)90.3881.5985.7385.90
MSTransBTS (w/ TTA)90.6282.2786.3986.43
Table 20. Visualization result of three different slices in BraTS2023 for the proposed MSTransBTS model.
Index 413, Slice 62
Whole
Tumour (WT)
Enhanced
Tumour (ET)
Tumour Core (TC)Combined Output
Ground TruthMathematics 13 01117 i090Mathematics 13 01117 i091Mathematics 13 01117 i092Mathematics 13 01117 i093
Predicted
Output
Mathematics 13 01117 i094Mathematics 13 01117 i095Mathematics 13 01117 i096Mathematics 13 01117 i097
Index 1393, Slice 103
Ground TruthMathematics 13 01117 i098Mathematics 13 01117 i099Mathematics 13 01117 i100Mathematics 13 01117 i101
Predicted
Output
Mathematics 13 01117 i102Mathematics 13 01117 i103Mathematics 13 01117 i104Mathematics 13 01117 i105
Index 1398, Slice 68
Ground TruthMathematics 13 01117 i106Mathematics 13 01117 i107Mathematics 13 01117 i108Mathematics 13 01117 i109
Predicted
Output
Mathematics 13 01117 i110Mathematics 13 01117 i111Mathematics 13 01117 i112Mathematics 13 01117 i113
Table 21. Comparison of loss, accuracy, IoU, and Dice score at 30th epoch for the proposed MSTransBTS model and those available in the literature ([7] and [8]) on BraTS2023.
(Proposed) MSTransBTS
LossAccuracyIoUDice Score
Training0.98010.99390.59930.6893
Validation0.99520.99190.65270.7491
SwinUNETR [7]
Training0.98810.99380.59020.6796
Validation0.98670.99090.63320.7369
SegMamba [8]
Training1.03030.99280.55040.6462
Validation1.03120.98970.59470.7051
Table 22. Comparison of average Dice score of WT, ET, and TC of proposed MSTransBTS model and those available in the literature ([7] and [8]) on BraTS2023.
(Proposed) MSTransBTS
Whole Tumour (WT) (%)Enhanced Tumour (ET) (%)Tumour Core (TC) (%)Average (%)
(w/o TTA)90.388985.7385.90
(w/ TTA)90.6282.2786.3986.43
[7] SwinUNETR
(w/o TTA)90.0682.0585.2785.79
(w/ TTA)90.2083.0385.9386.39
[8] SegMamba
(w/o TTA)88.2081.5784.7684.84
(w/ TTA)88.4481.9085.2185.18
Table 23. Comparison of visualization result of index 1657 with slice 53 of the proposed MSTransBTS model and those available in the literature ([7] and [8]) on BraTS2023.
Whole
Tumour (WT)
Enhanced
Tumour (ET)
Tumour Core (TC)Combined Output
Ground TruthMathematics 13 01117 i114Mathematics 13 01117 i115Mathematics 13 01117 i116Mathematics 13 01117 i117
(Proposed)Mathematics 13 01117 i118Mathematics 13 01117 i119Mathematics 13 01117 i120Mathematics 13 01117 i121
[6]Mathematics 13 01117 i122Mathematics 13 01117 i123Mathematics 13 01117 i124Mathematics 13 01117 i125
[7]Mathematics 13 01117 i126Mathematics 13 01117 i127Mathematics 13 01117 i128Mathematics 13 01117 i129
Disclaimer/Publisher’s Note: The statements, opinions and data contained in all publications are solely those of the individual author(s) and contributor(s) and not of MDPI and/or the editor(s). MDPI and/or the editor(s) disclaim responsibility for any injury to people or property resulting from any ideas, methods, instructions or products referred to in the content.