Article

A Retail Inventory Model with Promotional Efforts, Preservation Technology Considering Green Technology Investment

1
Department of Mathematics and Statistics, Banasthali Vidyapith, Tonk 304022, India
2
Department of Hospitality and Tourism Management, Sejong University, 209 Neungdong-ro (Gunja-dong), Gwangjin-gu, Seoul 05006, Republic of Korea
3
Small Enterprise Policy Research Center, Small Enterprise and Market Service (SEMAS), Hannuri-daero, Sejong-si 30147, Republic of Korea
4
Division of International Trade, Institute of Digital Economy, Incheon National University, 119 Academy-ro, Yeonsu-gu, Incheon 22012, Republic of Korea
*
Author to whom correspondence should be addressed.
Mathematics 2025, 13(7), 1065; https://doi.org/10.3390/math13071065
Submission received: 9 February 2025 / Revised: 12 March 2025 / Accepted: 19 March 2025 / Published: 25 March 2025
(This article belongs to the Section E5: Financial Mathematics)

Abstract

:
Retailing strategy can be considered as the most critical factor for the success of industries. Managing deteriorating products in retail demands a strategic approach aimed at mitigating losses while maximizing profitability. This entails a proactive stance towards identifying products nearing expiration, becoming obsolete or showing signs of deterioration. Offering discounts or promotions can stimulate consumer interest and clear out inventory. The promotion of products within the context of retail management involves a multifaceted approach aimed at increasing awareness, generating interest, and ultimately driving sales. Sustainability helps retailers to develop social as well as economic consistency. Every country and their respective governments are currently working towards sustainable development. New technologies in this direction have been introduced. The present paper introduces a retailing model considering green technology as it is becoming popular to lower environmental risks. The items considered in this study are perishable in nature. As product prices and the promotion of products highly influence demand, a demand pattern dependent on price and promotion is therefore considered. This paper presents a sustainable retail-based inventory model that considers preservation technology to lower the rate of deterioration and increase product shelf life. As carbon emissions is currently the biggest threat to the environment, enforcing a penalty may lower its emissions. Carbon emissions costs due to storage, transportation, and preservation are considered herein. This model studies the effect of various cost parameters on the model. A numerical analysis is performed to validate the result. The results of this study show that the implementation of preservation technology not only increases cycle time but also significantly reduces total cost, hence increasing profit. Sensitivity analysis is performed to show the behaviors of different cost parameters on total cost and decision variables. Mathematica 11 and Maple 18 software are used for graphical representation.

1. Introduction

Retail management encompasses a multifaceted array of strategies, principles, and practices aimed at effectively running retail businesses. At its core, it involves overseeing all aspects of a retail operation, from inventory management and sales tracking to customer service and employee training. Successful retail management requires a keen understanding of market trends, consumer behavior, and competition dynamics. It involves creating and implementing strategies to attract customers, boost sales, and enhance the overall shopping experience. This often entails the meticulous planning of product displays, pricing strategies [1], promotional activities, and marketing campaigns to maximize profitability and customer satisfaction. Moreover, effective retail management entails fostering a positive work environment, nurturing a motivated and skilled workforce, and ensuring seamless coordination among different departments. This may involve hiring and training staff, setting performance targets, and resolving conflicts to maintain high levels of productivity and morale. In essence, successful retail management requires a holistic approach that integrates diverse functions and disciplines to deliver value to customers, drive sales, and achieve sustainable business growth in an ever-evolving retail landscape. Additionally, retail managers must stay abreast of technological advancements and industry innovations to optimize operations and stay ahead in a constantly evolving marketplace. Overall, successful retail management is a dynamic practice endeavor that requires a combination of strategic vision, operational excellence, and people management skills. One of the primary challenges is inventory management. Unlike non-perishable goods, perishable products have limited shelf lives, which necessitates precise forecasting and monitoring of demand to avoid overstocking or understocking. Overestimating demand can lead to excessive waste as products expire before being sold, while underestimating demand can result in stockouts and lost sales opportunities. Retail managers must implement effective inventory management systems, leveraging data analytics and historical sales data to accurately predict demand and optimize inventory levels. Another significant challenge in retail management of perishable products is maintaining product quality and freshness. Perishable items are susceptible to spoilage, deterioration, and damage during storage, handling, and transportation. Therefore, retailers must establish stringent quality control measures, including proper storage conditions, eco-packaging [2], temperature control, and handling procedures, to preserve the integrity and freshness of perishable goods throughout the supply chain. This often involves investing in specialized equipment, such as refrigeration units and humidity control systems, and training staff on proper handling techniques to minimize product damage and waste. Additionally, perishable products require swift turnover to ensure freshness and minimize waste. This poses a challenge for retailers in terms of sales and promotions planning. While discounts and promotions can help stimulate demand and accelerate inventory turnover [3], they must be carefully timed and executed to avoid overstocking or devaluing the brand. Moreover, retailers must carefully manage product rotation to ensure older inventory is sold before newer stock to prevent spoilage and waste. Furthermore, perishable products are often subject to fluctuations in supply and demand, as they are influenced by factors such as seasonality, weather conditions, and market trends. Retailers must stay agile and adaptable to respond to these dynamic factors, adjusting pricing, promotions [4], and inventory levels accordingly. This requires real-time data analysis, effective communication with suppliers, and flexibility in sourcing and procurement strategies to mitigate risks and capitalize on opportunities. Deterioration refers to the process of becoming worse over time, typically in quality or condition. It can apply to various aspects such as physical objects, structures, health, or even relationships. For instance, a building might deteriorate due to weather or lack of maintenance, or a person’s health might deteriorate due to illness or aging. In general, it implies a decline or a worsening of the original state or quality. Deterioration can stem from various factors depending on what is being affected. Here are a few common reasons across different contexts. Natural processes like weathering, erosion, and oxidation contribute to the degradation of materials over time. Exposure to elements like sunlight, air, water, and temperature changes can lead to physical breakdown or chemical changes in materials. Without proper care or maintenance, things tend to deteriorate faster. Regular maintenance can prevent or slow down the degradation of many objects or systems. Objects or structures used regularly, like roads, vehicles or machinery can deteriorate due to constant wear and tear. The more they are used, the more likely they are to deteriorate. Chemical reactions are also one of the reasons for the deterioration of certain categories of products. Chemical processes, such as rust in metals, decay in organic materials, or reactions between different substances can cause deterioration. Living organisms, such as insects, microorganisms, or plants, can cause deterioration in materials or structures. For example, wood can decay due to fungal growth. Age and time can be treated as one of the cause of deterioration. With time, most things tend to naturally degrade. For instance, as people and animals age, their bodies can deteriorate.
Understanding the reasons behind deterioration is crucial for implementing preventive measures or strategies to slow down the process or mitigate its effects. This paper includes the deterioration of edible items. The deterioration of food can occur due to various factors. Microbial activities such as bacteria, yeast, and mold can thrive on food, causing spoilage. This is accelerated when food is stored improperly, such as in warm temperatures or when exposed to air. Oxidation is also one of the main reasons. Exposure to air can lead to oxidation in food, causing changes in flavor, texture, quality loss of raw materials [5], and nutritional value. This is why some foods, like fruits or oils, turn rancid over time. Enzyme activities also cause deterioration. Enzymes in food can remain active even after the food is harvested. They can cause ripening or degradation, as seen in the browning of cut fruits or vegetables. Moisture loss or gain can be treated as one of the reasons for this. Improper storage conditions can lead to food either losing or gaining moisture, leading to changes in texture and quality. Physical damage also causes the deterioration of food. Bruising or physical damage to food can expedite the deterioration process. For example, a bruised apple will spoil faster than an intact one.
Preventing food deterioration involves proper storage such as refrigeration or freezing [6], packaging, and sometimes the addition of preservatives. Understanding the specific factors that contribute to a particular food’s deterioration helps in preserving its quality and safety for consumption. It is very important to focus on this issue. Deterioration can significantly impact businesses in various ways. Deterioration affects the quality of stored inventory, especially in industries dealing with perishable goods like food, pharmaceuticals, or chemicals. This can lead to financial losses if products become unsellable or need to be discarded. Deterioration of machinery, tools, or infrastructure can result in increased maintenance costs, reduced efficiency, and, in extreme cases, production halts. This impacts operational expenses and productivity. If a business consistently delivers products or services of declining quality due to deterioration, it can harm its reputation and customer trust. This can lead to a loss of customers and decreased revenue. Compliance and Safety Issues are also related to deterioration. Deterioration in certain industries, like construction or manufacturing, can lead to safety hazards or non-compliance with regulations, resulting in legal issues, fines, or accidents. Deterioration also has a financial impact. Addressing or repairing deteriorating assets or products often incurs additional costs. This can strain a company’s financial resources, affecting budgets and, potentially, profitability. Businesses usually mitigate these impacts by implementing preventive maintenance schedules, proper storage, quality control measures, suitable preservation technology, and regular inspections. Early detection and proactive measures help reduce the effects of deterioration on different aspects of a business. Thus, dealing with deteriorating products is a big challenge to concerned traders. Such products have short shelf lives [7], and after spoilage, these products cannot be sold, which in turn affects not only supply chain performance but also profit. Therefore, it is very important for businesses to not be run purely for gaining profit.
Preservation technology helps to compensate loss due to deterioration by lowering the rate of deterioration to some extent. It encompasses a variety of methods aimed at extending shelf life and maintaining the quality of products across different industries. In the realm of cultural heritage and artifact preservation, conservationists employ methods like temperature and humidity control, as well as protective enclosures to shield items from environmental factors. Additionally, chemical treatments may be used to stabilize and protect materials from deterioration over time. In construction and infrastructure, preservation involves the use of protective coatings, sealants, and corrosion inhibitors to shield structures from the effects of weathering, moisture, and other environmental stresses. These measures are crucial for preventing degradation and ensuring the longevity of buildings and infrastructure. In the pharmaceutical industry, preservation methods focus on maintaining the stability and efficacy of medications. Proper storage conditions, such as controlled temperatures and humidity levels, help prevent the degradation of active pharmaceutical ingredients, ensuring that the medications remain safe and effective. Natural resource management employs preservation strategies to sustainably manage ecosystems and biodiversity.
Overall, preservation methods are diverse and tailored to the specific needs of each industry. Whether in the context of food, cultural heritage, construction, pharmaceuticals, or natural resource management, these methods contribute to the sustainability, safety, and longevity of products, structures, and ecosystems. Advances in technology and research continue to expand the range of preservation techniques, addressing contemporary challenges and promoting more sustainable practices across various sectors. In conclusion, managing perishable products in the retail industry presents a complex set of challenges that require proactive planning, effective execution, and continuous adaptation. By implementing robust inventory management systems, ensuring strict quality control measures, optimizing sales and promotions strategies, and staying responsive to market dynamics, retailers can successfully navigate the complexities of perishable product management and drive profitability while maintaining product quality and freshness.
The world is facing serious environmental issues like pollution, global warming, ozone depletion, etc. These are substantial threats not only to mankind but also to all the creatures of this planet. That is why, over last few decades, these issues have drawn the attention of countries and their governments, industrialists, researchers, and common people as well. Consumers are also shifting towards sustainable products. Industries are not only investing in green technologies but are also focusing on producing less waste Using greener resources provides a competitive advantage in the market. Supply chain decisions are governed by many factors such as advertisement, preservation technology, and green technology [8]. Advertisements clearly attract customers. Thus, we can say that advertisement affects the demand of a product. This is why it has become very popular and almost all companies advertise their products. It has become particularly popular after the technology revolution. In the dynamic landscape of retailing, promotion, trade credit, and green technology each play significant roles in shaping the industry’s sustainability, competitiveness, and environmental impact. Promotion strategies encompass a spectrum of activities aimed at increasing product visibility, driving sales, and enhancing brand perception.
Trade credit, another critical aspect, involves the extension of credit terms by suppliers to retailers, facilitating inventory procurement without immediate cash outlay. This arrangement benefits retailers by improving cash flow, enabling them to stock a broader assortment of products and maintain optimal inventory levels [9]. However, effective management of trade credit is essential to mitigate credit risks, maintain supplier relationships, and uphold financial stability. Green technology has emerged as a cornerstone of sustainable retailing, driven by growing consumer demand for eco-friendly products and responsible business practices. Retailers are increasingly adopting green technologies across their operations, from energy-efficient lighting and heating systems to sustainable packaging and waste management practices. Moreover, the integration of green technologies into retail operations aligns with corporate social responsibility objectives, demonstrating a commitment to environmental stewardship and ethical business practices. Retailers that embrace green technology initiatives position themselves as industry leaders, differentiate their brands in a competitive marketplace, and contribute to global sustainability efforts.
In summary, the convergence of promotion, trade credit, and green technology in retailing underscores the industry’s evolution towards greater sustainability, innovation, and responsiveness to consumer preferences. By leveraging effective promotion strategies, managing trade credit judiciously, and embracing green technologies, retailers can enhance profitability, foster customer loyalty, and contribute to a more environmentally sustainable future.

1.1. Research Gaps

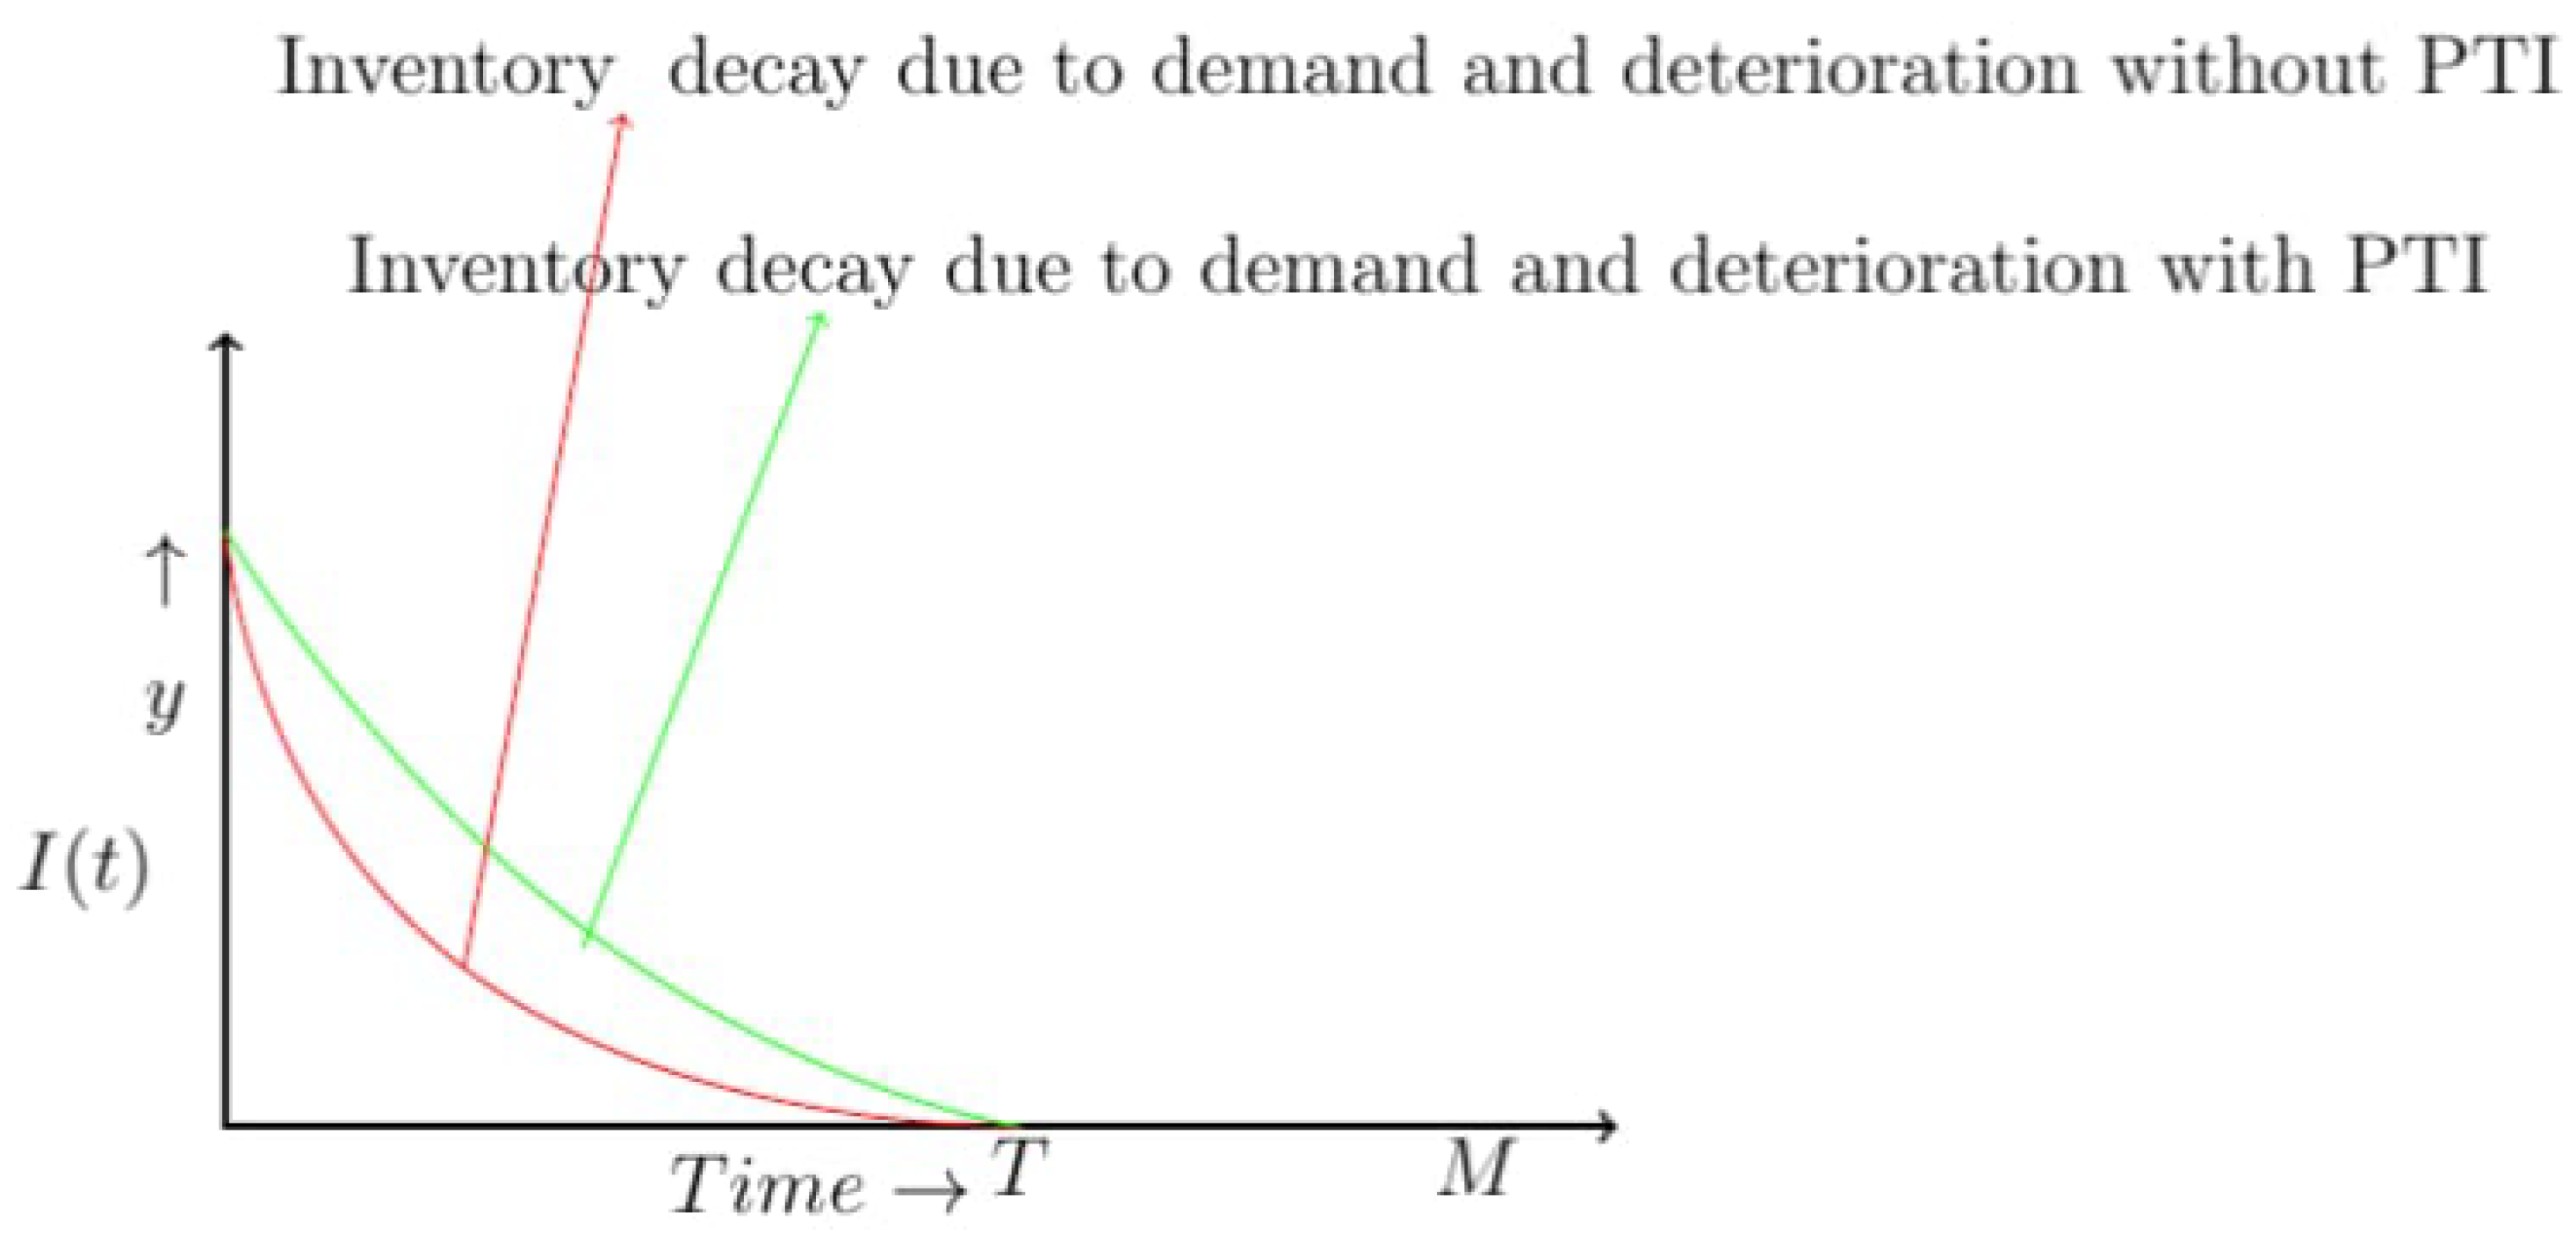
For perishable products, preservation technology plays a very important role. With the use of preservation technology, there is a reduction in deterioration rate. Different types of reduction are used in the literature [10]. This paper considers a deterioration reduction function as a function of the efficiency of production technology used.
So far, there is no study in the literature exploring the knowledge of authors who used variable transportation costs dependent on distance along with fixed transportation costs dependent on time. This study addresses this gap by including both aspects.
Carbon emissions due to supply chain activities like preservation, storage, and transportation are included in this study.

1.2. Contribution to the Field

Preservation technology is the backbone of industries as it deals with deteriorating products. There is a substantial amount of research available in this regard. As preservation technology reduces the rate of deterioration, the previous literature involves different types of reduction functions like function of profit fraction used [10], constant reduction, etc. Reduction in deterioration rate strictly depends on the efficiency of the technology used, i.e., if less-efficient technology is used, the reduction in the rate of deterioration will be low, while if highly efficient technologies are used, then reduction in deterioration will accordingly rise. Hence, one can say that reduction in the rate of deterioration is directly proportional to the efficiency of technology used for this purpose. This study considers a reduction function dependent on the efficiency of preservation technology used. Additionally, this paper considers variable transportation costs dependent on distance and fixed transportation costs dependent on time. Carbon emissions due to various activities like storage of the product, transportation, and preservation technology are also considered.

2. Literature Review

2.1. Retail Inventory Model

Retail management encompasses the intricate processes and strategies involved in overseeing the operations of retail businesses, from planning and procurement to sales and customer service. At its core, effective retail management aims to optimize various aspects of the retail business, including inventory management, merchandising, pricing, marketing, and customer experience, to achieve sustainable growth and profitability. Merchandising, another critical aspect, entails the strategic presentation and arrangement of products within the retail space to enhance visibility, appeal, and sales. This involves decisions on product assortment, placement, pricing, and promotion, often guided by market trends, consumer behavior, and competitive analysis. Pricing strategies in retail management are crucial for balancing profitability with competitiveness and consumer perception. Retailers employ various pricing tactics such as dynamic pricing, discounting, bundling, or psychological pricing to optimize margins and drive sales while remaining responsive to market dynamics and customer preferences. Marketing plays a pivotal role in retail management, encompassing a wide array of activities aimed at promoting products, attracting customers, and building brand loyalty. Effective retail managers prioritize aspects such as store layout, ambiance, staff training, and personalized services to create positive shopping experiences that foster customer loyalty and advocacy.
A lot of research has been carried out considering retail modeling. It has been updated throughout the manuscript. Kar et al. [11] considered a flexible production system with cap and trade regulation. Sarkar et al. [12] showcased that advertisement policy increases profit significantly. Taheri et al. [13] discussed home delivery policy. Both online and offline media were used for the sale of products. Single-setup-multi-delivery (SSMD) policy was used for transportation. Souiden et al. [14] discussed new trends in retailing. Amankou et al. [15] studied a retail model for non-durable products. A consumer service was also incorporated. Demand was considered as price- and quality-dependent. Mridha et al. [16] considered dual-channel advertising. Carbon emission was also included in the model. Using flexible production, both energy consumption and carbon emission were utilized. Guha et al. [17] found that artificial intelligence impacts retailing. Hota et al. [18] used SSMD policy for retailing. It was assumed that the manufacturer delivers a lower amount of products than the ordered quantity. Lead time was considered and two stage inspection was used. Mahapatra et al. [19] studied impact of demand patterns on integrated online–offline in smart supply chain management.

2.2. Marketing with Promotion

Every organization wants maximum profits through its business. Profit is directly linked to sales. The higher the sales, the higher the profit. A lot of strategies have been adopted by industries to increase their sales. Promotion is one of them. Marketing with promotion is a fundamental aspect of a company’s marketing strategy. Promotion is one of the four Ps of marketing (along with product, price, and place). Effective promotion helps create awareness, generate interest, and eventually boosts sales. Here are some key elements of marketing with promotion. Advertisements are used to reach a broad audience and convey key messages about a product or service. Sales promotions are transient marketing strategies intended to stimulate immediate purchases. These may consist of rebates, coupons, promotions, etc. Public relations (PR) or PR efforts involve managing a company’s public image and reputation. Producing insightful and timely materials, such blog articles, ebooks, and videos, is the main goal of content marketing to attract and engage with the target audience. It also involves leveraging social media platforms to encourage products or services, interact with customers, and build brand awareness. Influencer marketing also affects promotion through collaborating with influencers or opinion leaders to promote a product or service to their followers. Email marketing has also recently become popular. It involves sending targeted emails to potential and existing customers to deliver promotions, product updates, and information. Generating media coverage is also a form of promotion and it is performed through press releases, news stories, and interviews to increase brand exposure. Event marketing involves organizing or taking part in events, trade shows, and exhibitions to present goods and engage with possible buyers. Direct marketing is also gaining attention. It involves sending personalized messages or offers directly to potential customers via mail, email, or other channels. Collaborating with affiliates or partners to promote products in exchange for a commission on sales is also a type of promotion. Cause Marketing is also popular, and Word-of-Mouth Marketing is another very effective means of promotion, which is the practice of persuading satisfied clients to share their positive experiences with friends and family both offline and online.
Clear messaging, a strategic approach to reach and influence potential customers through a thorough understanding of the target market, and effective promotion are necessary for effective marketing. It is also crucial to measure and analyze the results of promotional efforts to optimize marketing strategies and ensure a positive return on investments. In the management of industries, it is very difficult to decide how much to invest in promotional policies. To apply a promotion policy, i.e., to promote each product, proper planning is necessary. There are mainly three stages of product life spans for which different promotion tactics are applied. The first stage is the growth stage. In this stage, the main aim is to promote the product’s brand. The second stage is the maturity stage. In this particular stage of product life span, the concerned retailer encourages its target customers to purchase their product over that of their competitive dealers. In this stage, less advertisement is required compared to the first stage. The third stage is the decline stage. In this stage, the retailer wants to generate the maximum possible revenue after maximum sales. In the first stage of the product’s life span, maximum promotion is supposed to be applied, as it is the introduction stage, to create awareness about the product among potential customers. Thus, it can be concluded that meticulous planning is required for the implementation of a promotion policy to achieve maximum profit.
There are numerous research papers published on promotion policy. Tayyab and Sarkar [20] used the promotion of government participation in dyestuff regulation. Dey et al. [21] developed a model considering promotion policies. A model was developed for controllable lead time and variable demand. Production rate was assumed to be flexible. Dey et al. [22] studied the tasks involved in process inventory using error-free inspection. Sarkar et al. [23] introduced collaborative advertising policy. Selling price and advertising cost-dependent demand were considered.

2.3. Preservation Technology

The perishability of products is a big concern in a supply chain. It can be due to natural deterioration or as a result of poor maintenance conditions, bad environmental conditions, or irregular waste management. To reduce deterioration to some extent, investments in preservation technology are used. Preservation technology slows down the deterioration rate and reduces the product loss. Preservation technology is the most important part of an inventory cycle dealing with materials that are perishable in nature. By applying this technology, the quantity and quality of products can be preserved. Thus, it can be concluded that preservation technology is very important to lower deterioration rate and maintain the freshness of food, fruits, vegetable, fish, pickles, etc. Discrete and continuous are two possible ways to apply preservation technology to food. In the discrete type, first, the condition of the product is checked, and then different costs are applied at different intervals of time. However, in the continuous type, a fixed cost is associated throughout the inventory cycle. Some examples of food preservation are salting (to preserve fish, etc.), canning and bottling (to preserve soft drinks, beverages), refrigeration (to preserve products that need low temperature), and oiling (to preserve pickles, etc.). Clearly, preservation technology can reduce the deterioration rate to some extent but cannot omit it completely. In addition, preservation technology contributes to carbon emissions, which is undoubtedly a significant threat to the environment at a global scale.
There is a substantial amount of literature available on preservation technology. Saha et al. [24] studied the effect of investment on the technology of preservation. The authors also added promotion to their model and considered the pattern of demand as promotional, financial, and trapezoidal. The main goal of the model included maximizing the overall profit. Mishra et al. [25] introduced a sustainable model with backorder. The authors considered the emission of carbon in their model, which was developed for perishable items. Over the last decade, researchers have given a lot of attention to preservation technology in supply networks. A model for perishable products was developed by the authors of Das et al. [26]. Deterioration was considered following Weibull distribution. Preservation technology was used in the model and a selling price of a product-dependent demand pattern was taken. Dye [27] discussed a model for perishable products. The effect of preservation technology in the supply chain was studied. Chang et al. [28] introduced an inventory model based on production. The authors used preservation technology shared by manufacturers and retailers. The main goal of their paper was to find the most suitable solution for all inventory decisions like production and delivery. Production was considered as a multistage process. An integrated model was considered in Tayal et al. [29], considering production. Items considered in the model were taken as perishable. Preservation technology was used in the model to decrease the rate of deterioration of the products. The authors used trade credit facility in the model. They developed a cost function for all the players of the supply chain. Like all other inventory models, the aim of the model was to minimize the total cost. Giri et al. [30] developed a two-echelon supply chain inventory model considering deteriorating products. The model was developed for a single vendor and a single buyer. Buyer’s demand was considered as being selling price-dependent. Vendor’s production process was assumed to be not perfectly reliable.

2.4. Carbon Emissions

Global environmental problems are centered on carbon emissions, particularly in the form of carbon dioxide. Excessive atmospheric carbon dioxide release is a major contributor to climate change as well as a host of other environmental, economic, and social problems. This article investigates the origins, effects, and potential remedies for carbon emissions in order to tackle this urgent global issue. The burning of fossil fuels is one of the causes of and is a primary contributor to carbon emissions. When fossil fuels like coal, oil, and natural gas are burned for energy production, transportation, and industrial activities, large volumes of carbon dioxide are released into the atmosphere, aggravating the greenhouse effect. Deforestation is one of the biggest reason for emission of carbon. The removal of forests and trees, particularly in tropical regions, results in increased carbon emissions. Trees absorb and store carbon, and when they are cut down or burned, the carbon is emitted into the atmosphere. Industrial processes are responsible for carbon emissions. Several commercial operations release carbon dioxide as a byproduct. These operations are major contributors to global carbon emissions. Agricultural practices produce carbon footprint. The utilization of chemical fertilizers, land-use changes, and livestock production generate carbon emissions. Additionally, carbon emissions are linked to the energy consumption involved in food production and transportation.
There are huge consequences of carbon emissions; these include biodiversity loss. Changing climate conditions due to carbon emissions threaten ecosystems and species. Many plant and animal species may struggle to adapt or face extinction, negatively impacting their health. Poor air quality resulting from carbon emissions is a major public health concern. Respiratory illnesses and cardiovascular problems are linked to exposure of pollutants like fine particles and ground-level ozone. Moreover, the economic consequences of carbon emissions are substantial, including damage to infrastructure from extreme weather events, agricultural losses, increased healthcare costs, and reduced labor productivity.
Carbon emissions are a complex worldwide issue with wide-ranging effects. A concerted, long-term effort at the individual, governmental, and global levels is needed to address this problem. Mitigating the worst effects of climate change and working towards a more sustainable and resilient future for the planet and its inhabitants can be achieved by reducing carbon emissions through a combination of energy efficiency, reforestation, sustainable agriculture, adoption of renewable energy, and international cooperation.
Numerous researchers have studied supply chain costs associated with carbon emissions. Sarkar et al. [31] studied a model for nullifying waste. Th carbon emission effect was studied on the model. Jauhari et al. [32] introduced a two-echelon closed-loop supply chain inventory model. Carbon emissions due to activities like transportation, storage, and production activities were considered. The study’s findings indicated that system costs can be minimized and emissions can be reduced by by controlling the collection rate and product allocation. Daryanto et al. [33] studied variable transportation costs in a three-level supply chain. Kazemi et al. [34] studied the effect of carbon emission costs in a supply chain having imperfect products. Tiwari et al. [35] investigated a two-echelon inventory model by considering carbon emissions caused by warehousing, transportation of items, and disposal of deteriorating items. Wee and Daryanto [36] created an inventory model that takes carbon emissions into account for products of unsatisfactory quality. The authors included an inspection aspect to the supply chain. The study focused on a supply chain containing a percentage of imperfect-quality items in its delivered lot, and carbon emission costs were considered under a carbon tax policy. A classic economic order quantity (EOQ) model was extended by Salmeh and Jaber [37]. Sana [38] created a three-layered supply chain manufacturing inventory model for products with unsatisfactory quality. The model took into account the effects of business strategy, like the ideal raw material order size. Gautam and Khanna [39] presented a flawed production inventory model for an integrated supply chain that included setup cost savings and carbon emissions. In order to minimize the vendor setup costs for upcoming cycles, the authors took into account a one-time discrete investment. The model aimed to maximize the expenses incurred by both parties. Khan et al. [40] developed a model with power demand. The concept of quantity discount was also included in the model. Carbon credit policy was discussed in Wang et al. [41], Zhang et al. [42]. Carbon emissions in multiple stages was used in Sarkar et al. [43]. The effect of variable emission and transportation was included in Sarkar et al. [44]. A carbon reduction policy was included in the model along with SSMD policy. Sarkar and Sarkar [45] studied waste reduction and energy consumption within a smart production system. Tayyab et al. [46] studied cap and trade policy for textile industries.

2.5. Trade-Credit

Purchasing products or services on an account, and delaying payment with cash, is known as trade-credit. It is essentially a type of credit that a seller extends to a buyer. The seller permits the buyer to order products or services and pay for them later, usually within the prearranged time frame, which may span several days or several months. In business-to-business interactions, this arrangement is typical and frequently used to promote positive connections between suppliers and purchasers. By procuring necessary items or services and paying for them after they have been used or resold, it helps firms manage their cash flow. It is an integral part of many companies’ working capital management strategies. Trade-credit offers several benefits to both the buyer and the seller in commercial transactions.
For buyers:
Cash flow management: Products and services can be purchased by customers without requiring an upfront payment, allowing them to use the purchased items before making payments. This helps in managing short-term cash flow.
Negotiation power: Buyers might use this as an opportunity to bargain with suppliers for better terms, such as extended credit terms or discounts for early payments.
Working capital efficiency: It contributes to better working capital management by allowing businesses to use their cash for other operational needs or investment opportunities.
For sellers:
Competitive edge: Offering trade credit can attract more buyers and improve market competitiveness by providing flexible payment terms.
Customer loyalty: It helps build long-term relationships with buyers, encouraging repeat business due to the convenience of deferred payments.
Increased sales: By allowing buyers to make purchases without immediate cash payments, sellers may see increased sales volumes.
Reduced collection costs: Although it involves a certain degree of risk, it lessens the administrative burden of constantly collecting payments and managing invoices.
However, both parties should carefully manage and monitor trade-credit to minimize risks associated with potential payment delays or defaults. It is essential to establish clear terms and conditions to ensure a smooth and mutually beneficial trade relationship.
Thus, trade-credit can increase sales, because, by allowing buyers to make purchases without immediate cash payments, companies may experience increased sales volumes. Although there is a risk of delayed or defaulted payments, trade-credit can reduce the administrative burden of constant collection efforts and managing invoices. Offering flexible payment terms can give a company a competitive edge in the market, attracting more customers or clients. However, companies need to assess and manage the associated risks of offering or utilizing trade-credit, including the potential for delayed payments or defaults, which can impact cash flow and profitability. Thus, careful credit assessment, setting clear terms and conditions, and proactive credit management are essential for its successful utilization. Trade-credit, while beneficial, presents certain challenges for both the buyer and the seller.
For buyers:
Over-reliance on trade-credit might lead to a situation where the buyer becomes too dependent on suppliers’ credit, affecting their financial flexibility and potentially impacting relationships with suppliers. Heavy reliance on trade-credit could affect the buyer’s creditworthiness, potentially limiting their ability to secure other forms of credit. Relying heavily on trade-credit from specific suppliers might limit a buyer’s ability to access a broader range of suppliers or take advantage of better deals available elsewhere. Delayed payments or strained credit terms could harm the relationship between buyer and seller. Frequent late payments might lead to a loss of trust or strained ties. Some suppliers might add interest or penalties for late payments, increasing the overall cost of products or services.
For sellers:
A seller’s cash flow may be strained if they rely too much on offering trade-credit, which could limit their capacity to make investments in the expansion of their company or to satisfy their own financial obligations. Extending credit increases the risk of non-payment or delayed payments, impacting the seller’s financial stability and potentially leading to losses. Managing trade-credit requires resources and time, increasing administrative costs related to invoicing, monitoring, and collections. The possibility of non-payment exists. Giving credit comes with a risk: late or nonexistent payments could have an impact on the seller’s cash flow and profitability. It increases administrative burden. Managing credit, invoicing, and collections requires resources and time, potentially increasing administrative costs. While offering trade-credit can attract more customers, the opportunity cost of tying up funds in trade credit as opposed to investing elsewhere might affect the seller’s overall profitability.
Balancing these challenges involves careful credit management, clear terms and conditions, effective credit risk assessment, and a robust credit control system to ensure that trade-credit remains a mutually beneficial arrangement for both parties involved. Many researchers have explored trade-credit. chen et al. [47] discussed the impact of trade-credit. The authors used an empirical strategy. Singh and Rana [48] introduced an inventory model for growing items, incorporating shortage into the model. Garai and Sarkar [49] formulated a cost-efficient and customer-centric closed-loop supply chain model that links herbal medicines with biofuel. Stock-level-dependent holding costs were considered. The demand pattern was considered as a function of selling price and stock level. The model considered two cases based on the position of stock level, i.e., when the stock level is positive and when it is negative. The study elaborated the importance of using trade credit. Sarkar and Bhunia [50] considered green investment and a variable demand pattern. A remanufacturing production system was considered. Table 1 lists the contributions of the aforementioned researchers.

3. Notation and Assumption

3.1. Notation

Table 2 presents notation used in this study.

3.2. Assumptions

Based on the following assumptions, the model is developed:
a.
A retail model is considered for products deteriorating in nature. Promotional tactics are used to drive sales.
b.
Demand is taken as D ( λ , p ) = a + b λ + f ( p ) , where f ( p ) is the decreasing function of p and λ is advertisement elasticity.
c.
It is considered that permissible delay period M is greater than cycle time T; therefore, interest is earned. This study have considered that some fraction of this earned interest is invested in green technology.
d.
Shortage is negligible.
e.
Lead time is negligible.

4. Mathematical Model

Figure 1 represents the effect of using preservation technology on an inventory level.
The differential equation representing the level of inventory is given below:
d I ( t ) d t + α ( 1 e β P ) I ( t ) = ( a + b λ + f ( p ) )
with the boundary condition, where I ( t ) = 0 . The solution of the above differential equation is
I ( t ) = a + b λ + f ( p ) α ( 1 e β P ) e α ( 1 e β P ) ( T t ) 1 .
Initial inventory level is given by
y = I ( 0 ) = a + b λ + f ( p ) α ( 1 e β P ) e α ( 1 e β P ) T 1 .
The total cost consists of holding cost, ordering cost, purchasing cost, green technology cost, advertisement cost, transportation cost, carbon emission cost, and preservation cost. These costs are given below.

4.1. Ordering Cost

It describes the costs incurred each time an order is placed for inventory replacement. It includes various costs associated with the procurement process. It may include ordering process cost, communication cost, and documentation cost. Ordering cost is given by
C o T

4.2. Holding Cost

Holding or carrying cost is an essential cost. It stands for the costs related to keeping and storing inventory for a predetermined amount of time. This cost may contain warehousing cost, insurance and security, depreciation and obsolescence, taxes and licences, and handling and labor costs. For the given retailing model, holding cost is given by
C h T 0 T I ( t ) d t = C h ( a + b λ + f ( p ) ) T ( α ( 1 e β P ) ) 2 e α ( 1 e β P ) T T α ( 1 e β P ) 1 .

4.3. Purchasing Cost

Purchasing cost, known as acquisition cost, is a significant component in inventory management. It represents the expenses associated with procuring or buying inventory items for a business. This cost may include many component costs like cost of goods, shipping and freight costs. Optimizing supply chain costs, including purchasing cost, is a critical aspect of cost management for businesses, as it can significantly impact profitability. Strategies to reduce purchasing costs may include bulk purchasing, negotiation with suppliers, optimizing supply chain processes, and implementing cost effective procurement practices. The present model purchasing cost is given by
1 T ( C y ) = C ( a + b λ + f ( p ) ) T ( α ( 1 e β P ) ) e α ( 1 e β P ) T 1 .

4.4. Transportation Cost

Transportation cost is the expenses incurred in moving goods or materials from one location to another. It includes various expenses such as fuel, maintenance, vehicle purchase or rental, labor, and any associated fees or tolls. Transportation costs can significantly impact businesses, individuals, and economics, and they can vary depending on the mode of transport and distance traveled. This cost can be of two types, i.e., fixed or variable costs. Fixed transportation costs are expenses that remain constant regardless of level of transportation activity. These costs do not change with variations in the volume of goods. Variable transportation costs, on the other hand, are the expenses that fluctuate with the level of transportation activity. It can depend on many factors like distance traveled, fuel prices, vehicle efficiency and maintenance, driver wages, tolls and fees, route selection, vehicle type, and vehicle load. This paper includes fixed and variable transportation costs and they are given by
1 T ( T α ω + l y γ ) .

4.5. Carbon Emission Cost

This is known as carbon pricing. It refers to the economic value or cost associated with emitting one ton of carbon dioxide or its equivalent into the atmosphere. It is a monetary value assigned to the environmental impact of releasing greenhouse gases.
This cost is due to carbon emissions from storage, preservation, and transportation activities. It is given by
1 T ( C e S + C e P + C e T ) 0 T I ( t ) d t = 1 T ( C e S + C e P + C e T ) ( a + b λ + f ( p ) ) ( α ( 1 e β P ) ) 2 e α ( 1 e β P ) T T α ( 1 e β P ) 1 .

4.6. Deterioration Cost

Deterioration cost is the amount spent on the degradation or spoilage of a product held in inventory over time. This cost is especially relevant for perishable goods, pharmaceutical, food items, chemicals, or any product with a limited shelf life. It may depend on the nature of the goods, shelf life, and storage conditions. Since reduction in rate of deterioration is taken as α 1 e β P , the deterioration cost is
C d T ( θ α ( 1 e β P ) ) 0 T I ( t ) d t = C d T ( θ α ( 1 e β P ) ) ( a + b λ + f ( p ) ) ( α ( 1 e β P ) ) 2 e α ( 1 e β P ) T T α ( 1 e β P ) 1 .

4.7. Promotion Cost

This is related to marketing and promotion efforts aimed at increasing product visibility, brand awareness, and customer demand. Effective advertising can impact inventory levels indirectly by influencing demand and sales volume. In a broader business context, advertising can increase sales to a great extent if it is performed strategically. It is assumed that some fraction of profit is invested in advertisement, and it is given by
1 T n ( p C ) ( a + b λ + f ( p ) ) α ( 1 e β P ) e α ( 1 e β P ) T 1 .

4.8. Green Technology Cost

This is called clean technology cost or sustainable technology cost. It is the spent associated with the development, implementation, and adoption of technologies that have a minimal adverse effect on the environment. These technologies are designed to reduce resource consumption, lower emissions, and promote sustainable practices. It may include costs of research and development, manufacturing and production, installation and integration, operational and maintenance costs.
As it is assumed that permissible delay period M is greater than cycle time T, some fraction of earned interest is invested in green technology and is given as
d 1 T p I e 0 T I ( t ) d t + p I e ( M T ) 0 T ( a + b λ + f ( p ) ) d t .
Total cost is the sum of all the above costs and is given as
T C = C o T + C h ( a + b λ + f ( p ) ) T ( α ( 1 e β P ) ) 2 e α ( 1 e β P ) T T α ( 1 e β P ) 1 + C ( a + b λ + f ( p ) ) T ( α ( 1 e β P ) )
× e α ( 1 e β P ) T 1 + 1 T ( 1 T ( T α ω + l y γ ) + 1 T ( C e S + C e P + C e T ) [ ( a + b λ + f ( p ) ) ( α ( 1 e β P ) ) 2 [ e α ( 1 e β P ) T
T α ( 1 e β P ) 1 ] ] + C d T ( θ α ( 1 e β P ) [ ( a + b λ + f ( p ) ) ( α ( 1 e β P ) ) 2 [ e α ( 1 e β P ) T
T α ( 1 e β P ) 1 ] ] + 1 T n ( p C ) ( a + b λ + f ( p ) ) α ( 1 e β P ) e α ( 1 e β P ) T 1
+ d 1 T p I e 0 T I ( t ) d t + p I e ( M T ) 0 T ( a + b λ + f ( p ) ) d t .
Using Taylor’s expansion e x = 1 + x + x 2 2 ! + . . . and taking the second-degree term only, one can obtain
T C ( T , P ) = ( C h + C e S + C e P + C e T + p I e d 1 + C d ( θ α ( 1 e β P ) ) ) ( a + b λ + f ( p ) ) T 2 + 1 T ( C o + T α ω ) + ( C + l γ + n ( p C ) ) ( a + b λ + f ( p ) ) 1 + α ( 1 e β P ) T 2 + p I e d 1 ( M T ) ( a + b λ + f ( p ) ) + P .

5. Solution Methodology

Figure 2 outlines the study’s progression.
This study uses classical optimization technique to optimize cost function. The total cost function is differentiable with respect to cycle time T and preservation technology investment P. First-order partial derivatives are represented below, and equating to zero, one can obtain T C T = 0 and T C P = 0 , and their value is given by
T * = 2 ( C o + T α ω ) ( C h + C e S + C e P + C e T + p I e d 1 + C d θ + ( C + l + n ( p C ) C d ) α ( 1 e β P ) 2 p I e d 1
P * = 1 β l o g ( α β [ C d ( C + l γ + n ( p C ) ) ] ( a + b λ + f ( p ) ) T ) 2 .
It is not possible to provide a sufficient condition mathematically; thus, to show the convexity of the total cost function, a graphical method was used. The graph is plotted using maple 18 software. The convexity of the cost function is shown in the figure in next section.

6. Numerical Analysis

Consider a numerical problem with relevant model parameters taken from Gautam et al. [10], given in Table 3. Using these values, one can obtain optimal values as T = 0.0872 years, P = USD 61.15, and T C = USD 50,780.162/cycle.
Figure 3 and Figure 4 show convexity.

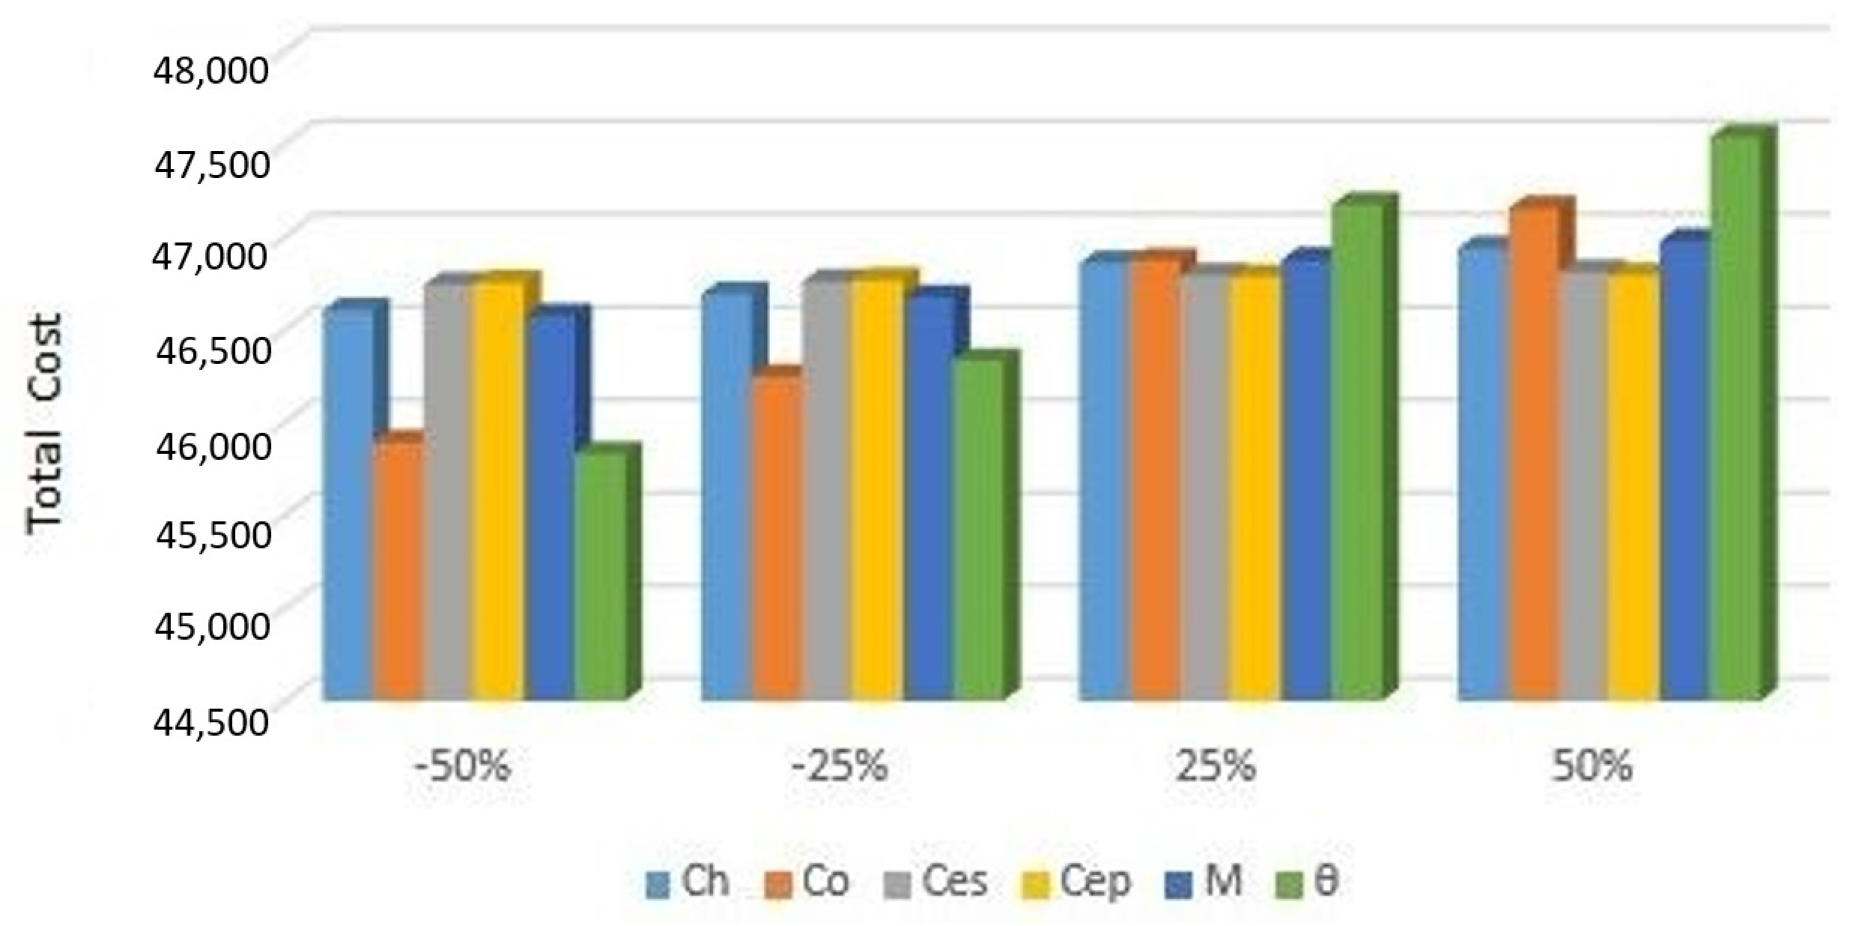
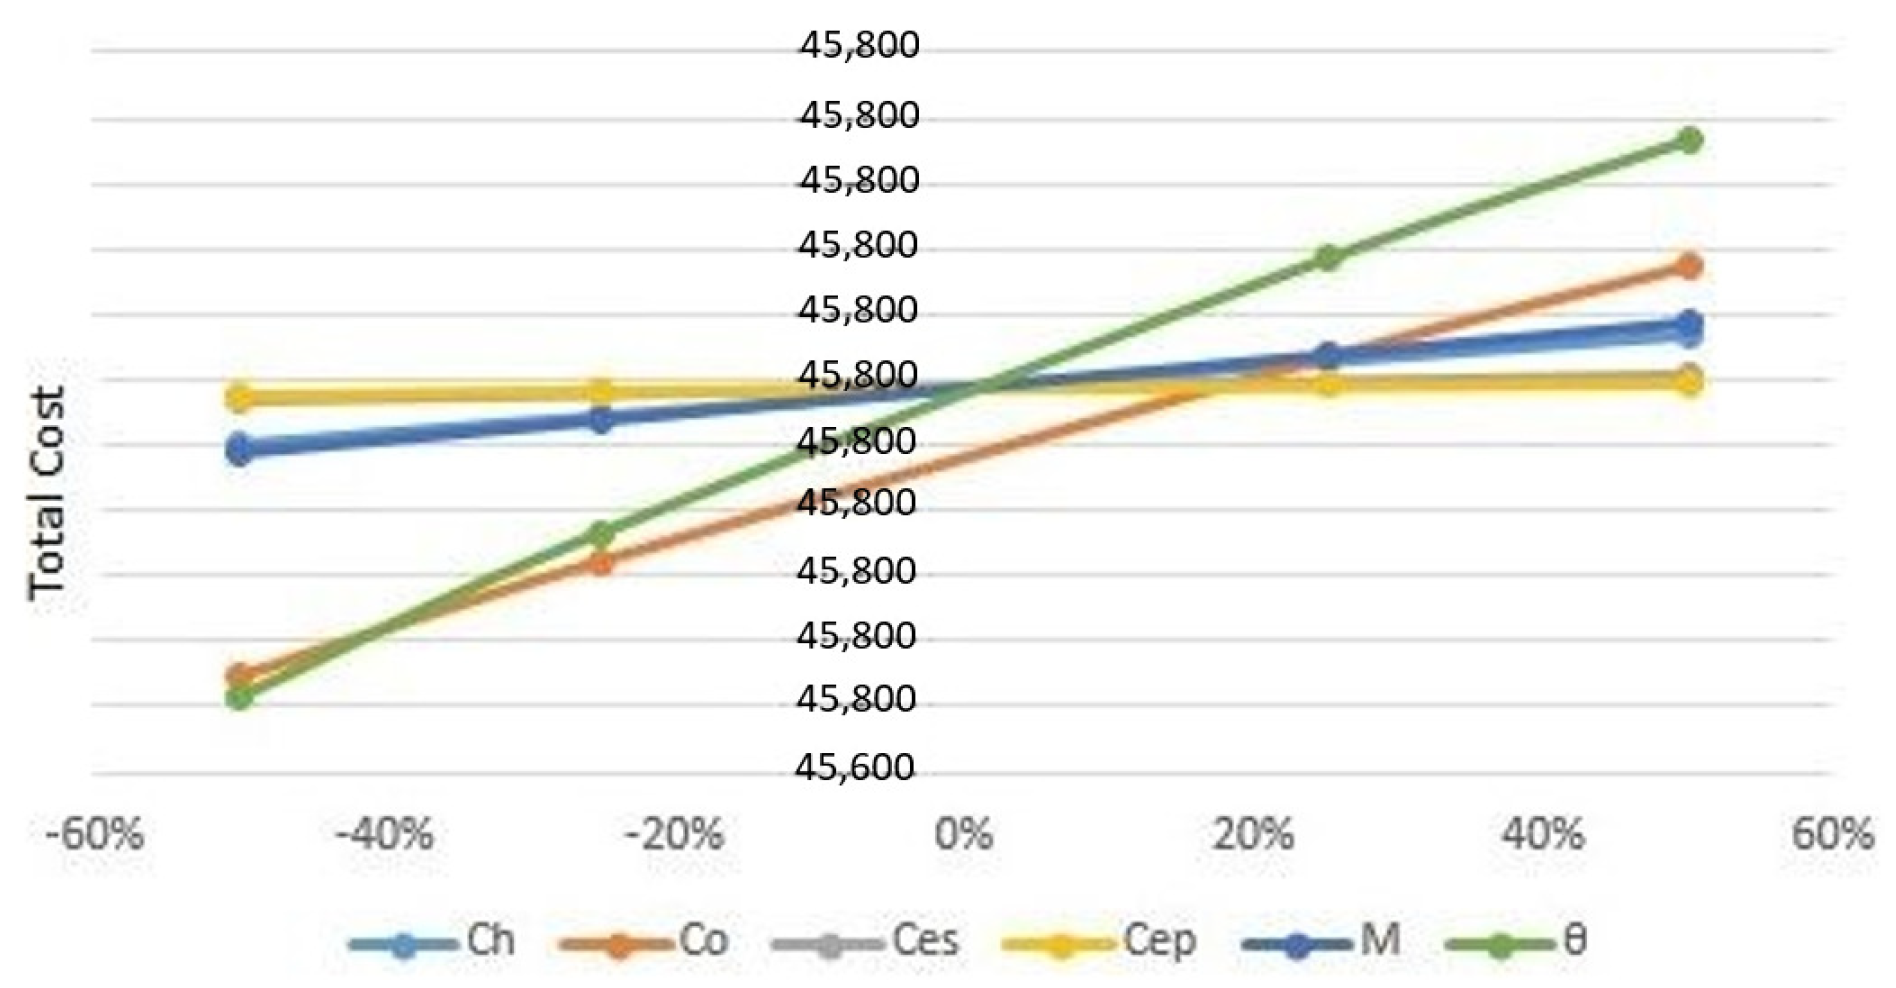
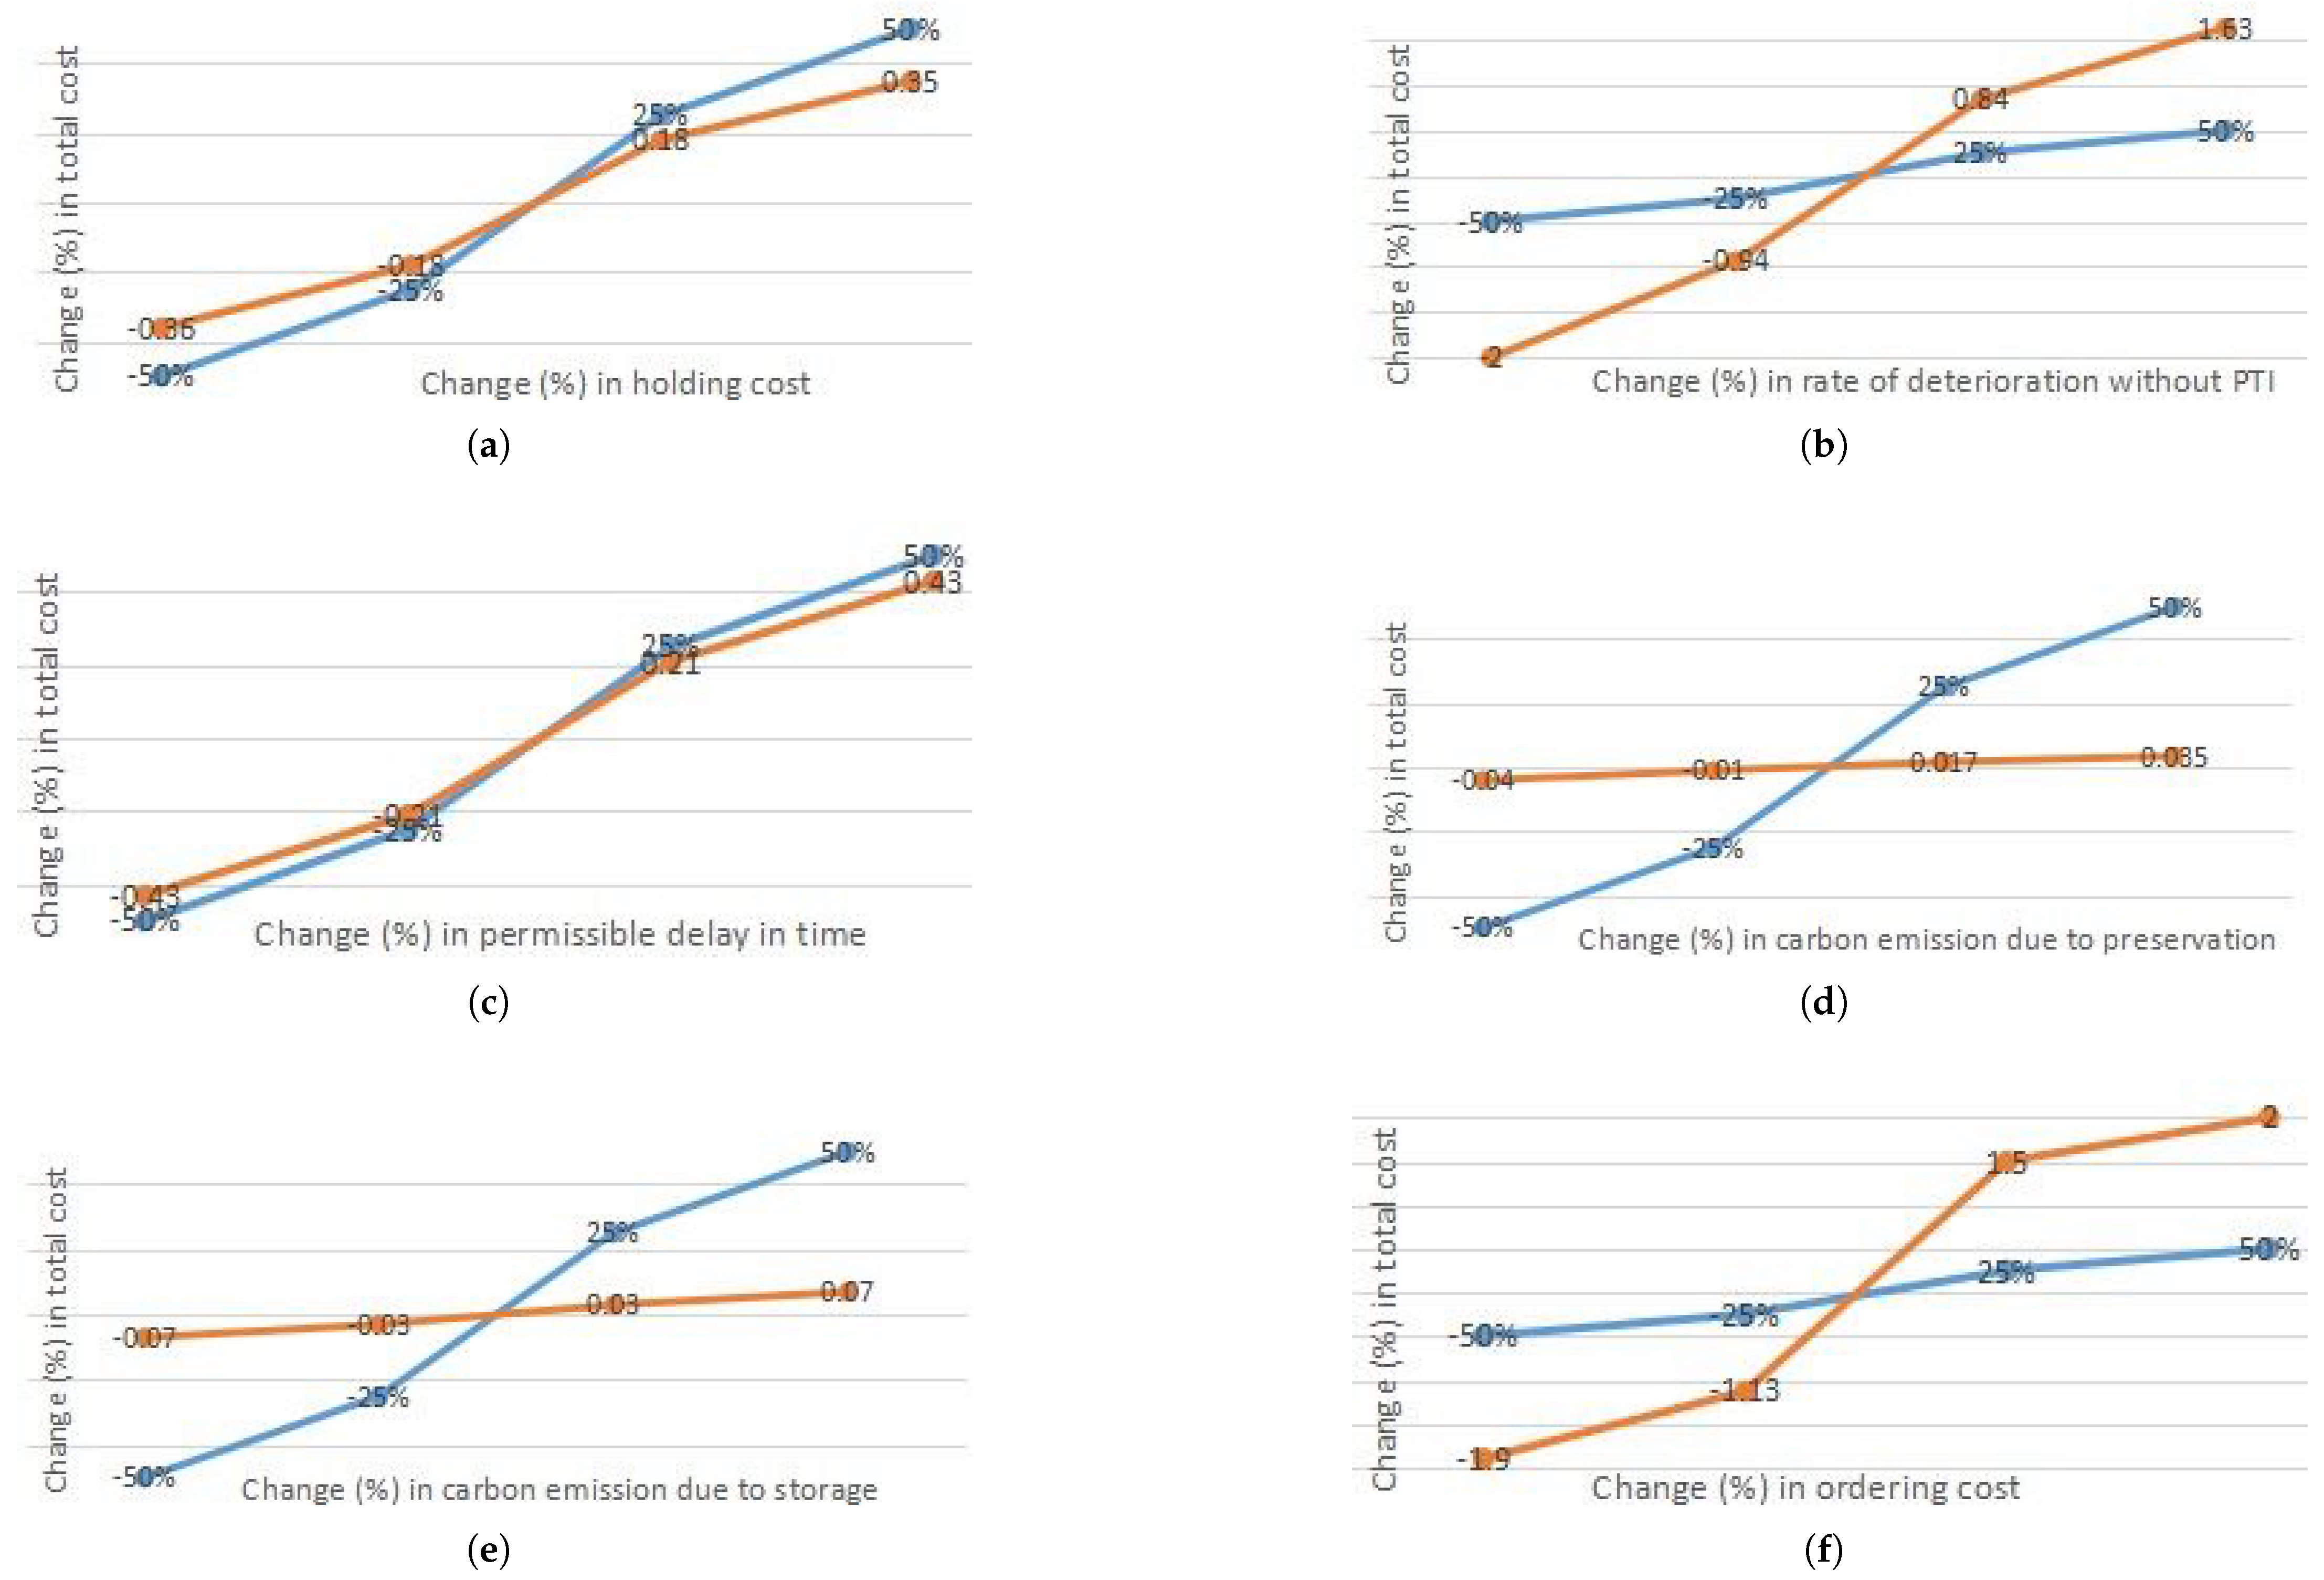
7. Sensitivity Analysis

A sensitivity analysis is performed over total cost and decision variables T and P with the parameters of the model. Sensitivity analysis is shown in the table by changing the parameters such as +50%, +25%, −25%, and −50%. Table 4 depicts the variation in decision variables with cost parameters.
Table 5 shows the effect of λ on total cost.
Figure 5, Figure 6 and Figure 7 show variation in costs with respect to different cost parameters.
Figure 7 show change in total cost with respect to change in different parameters, i.e., holding cost, rate of deterioration without PTI, permissible delay in time, carbon emissions due to preservation, carbon emissions due to storage and ordering cost.

8. Observation

From the above section, the following observations are drawn:
Holding costs can significantly affect businesses, particularly those dealing with inventory or assets that require storage. It is one of the crucial costs because they directly impact a company’s profitability and efficiency. As holding cost increases, cycle time decreases. This can be justified by the fact that as holding cost increases, the concerned firm will intend to keep less inventory, which in turn decreases cycle time.
An increment in carbon emissions cost decreases cycle time. This is due to the fact that inventory stored for a longer time will result in higher carbon emission costs due to storage and preservation; hence, decision-makers will try to clear it as soon as possible, resulting in shorter cycle time.
Preservation technology costs are associated with maintaining the quality and integrity of products over time, especially in industries where the preservation of goods is crucial, such as food, pharmaceutical, and certain manufacturing processes. The costs of preservation technology can increase with an increase in cycle time for several reasons. One of the most important observations is that as cycle time increases, preservation technology cost increases, which may be due to the reason that with an increase in cycle time, products are stored for a longer duration before reaching the end consumer. Preservation technologies, such as refrigeration or controlled environments, may need to be in operation for a more extended period, leading to higher energy costs and maintenance expenses. This can involve additional testing, monitoring, and quality assurance processes, leading to increased labor and equipment costs. The effectiveness of preservation methods may decline over time. For example, the shelf life of perishable goods may be limited even with preservation technologies. If cycle times are extended beyond the effective preservation period, businesses may need to invest in more advanced or costly preservation methods. For these reasons, cycle time increment results increase in preservation cost.
Ordering cost is one of the sensitive costs. An increase in ordering costs raises total costs because it leads to higher expenses associated with the process of placing and receiving orders, including administrative costs, paperwork, and coordination efforts in procurement. An increase in ordering cost increases both cycle time and preservation technology costs. An increase in ordering costs can lead to a longer cycle time because higher costs may prompt businesses to place larger and less-frequent orders. This results in extended intervals between order placements and longer overall cycle times in the procurement and inventory replenishment processes. An increase in ordering costs can impact preservation technology costs because higher ordering costs may lead to larger and less-frequent orders. This could result in the need for enhanced preservation technologies to maintain product quality over extended periods, thereby increasing preservation costs.
Fixed transportation cost is a crucial cost. An increase in fixed transportation costs raises total costs because it represents a higher baseline expense for maintaining transportation infrastructure, vehicles, and logistics regardless of the actual volume of goods transported, impacting overall operational costs. An increase in fixed transportation costs can extend cycle time because businesses, faced with higher fixed costs, may opt for less frequent transportation activities or larger shipment sizes, leading to longer intervals between shipments and delays in the overall cycle. An increase in fixed transportation costs can elevate preservation technology costs because businesses, looking to optimize transportation spending, may extend cycle times and storage durations, requiring more extensive or advanced preservation methods to maintain product quality over longer periods.
Total costs increase with higher carrying cost because carrying cost is related to storing and maintaining inventory, including space for storage, insurance, security, and the opportunity cost of tied-up capital. As holding costs rise, the overall cost of keeping inventory in stock for extended periods increases. As expected, holding cost increment gives rise to total cost.
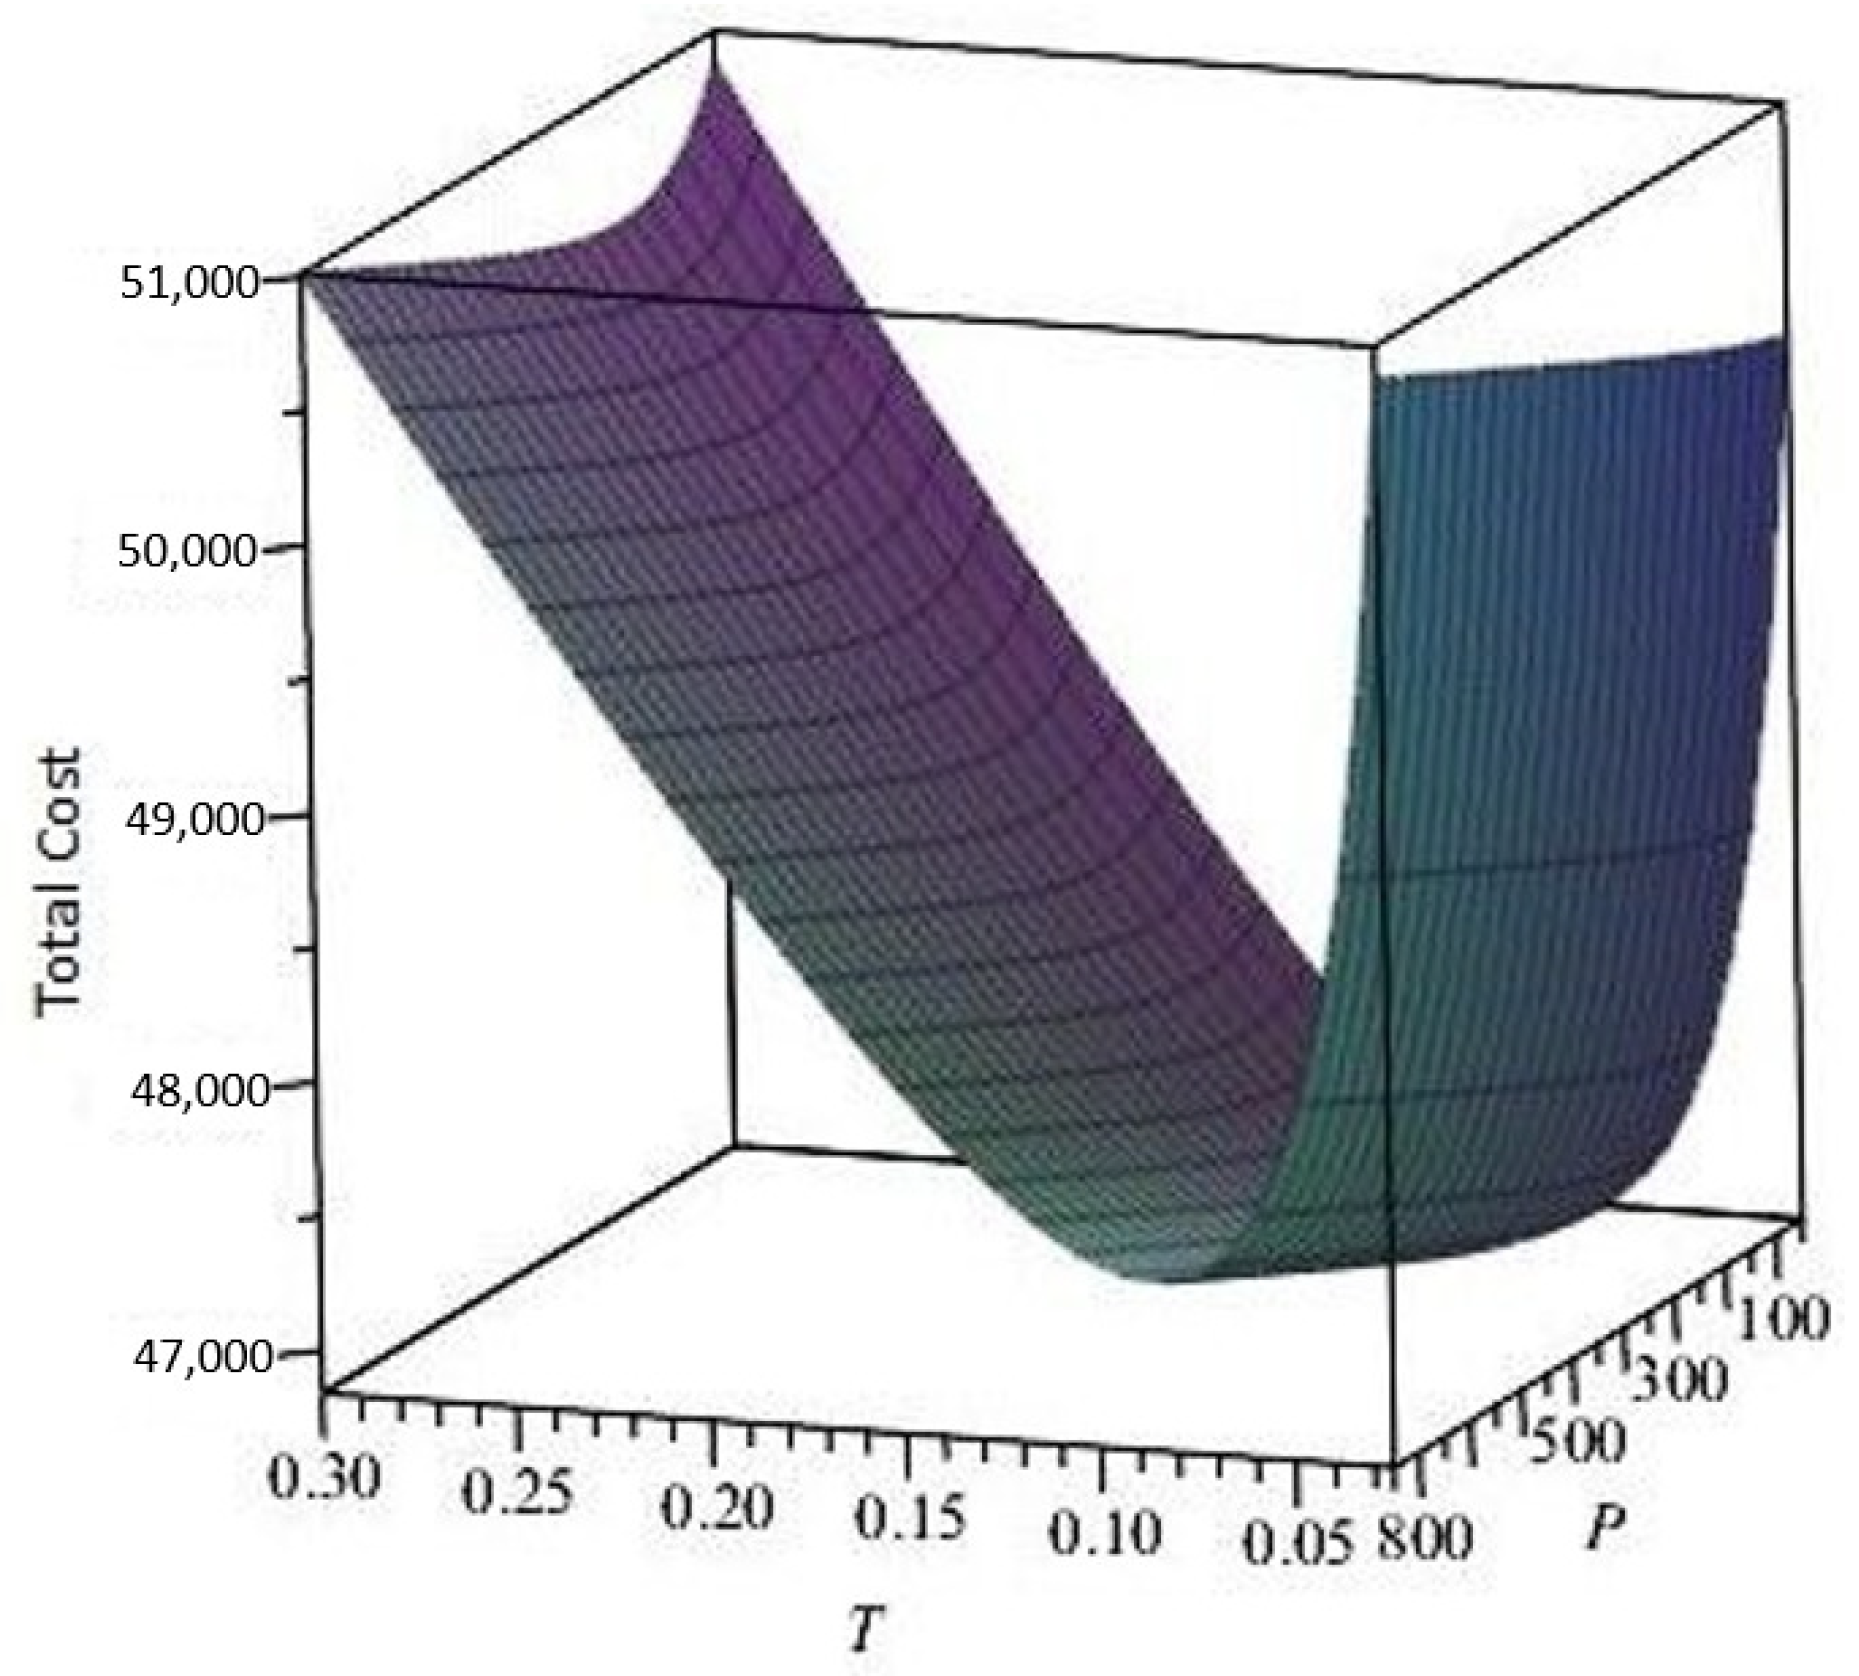
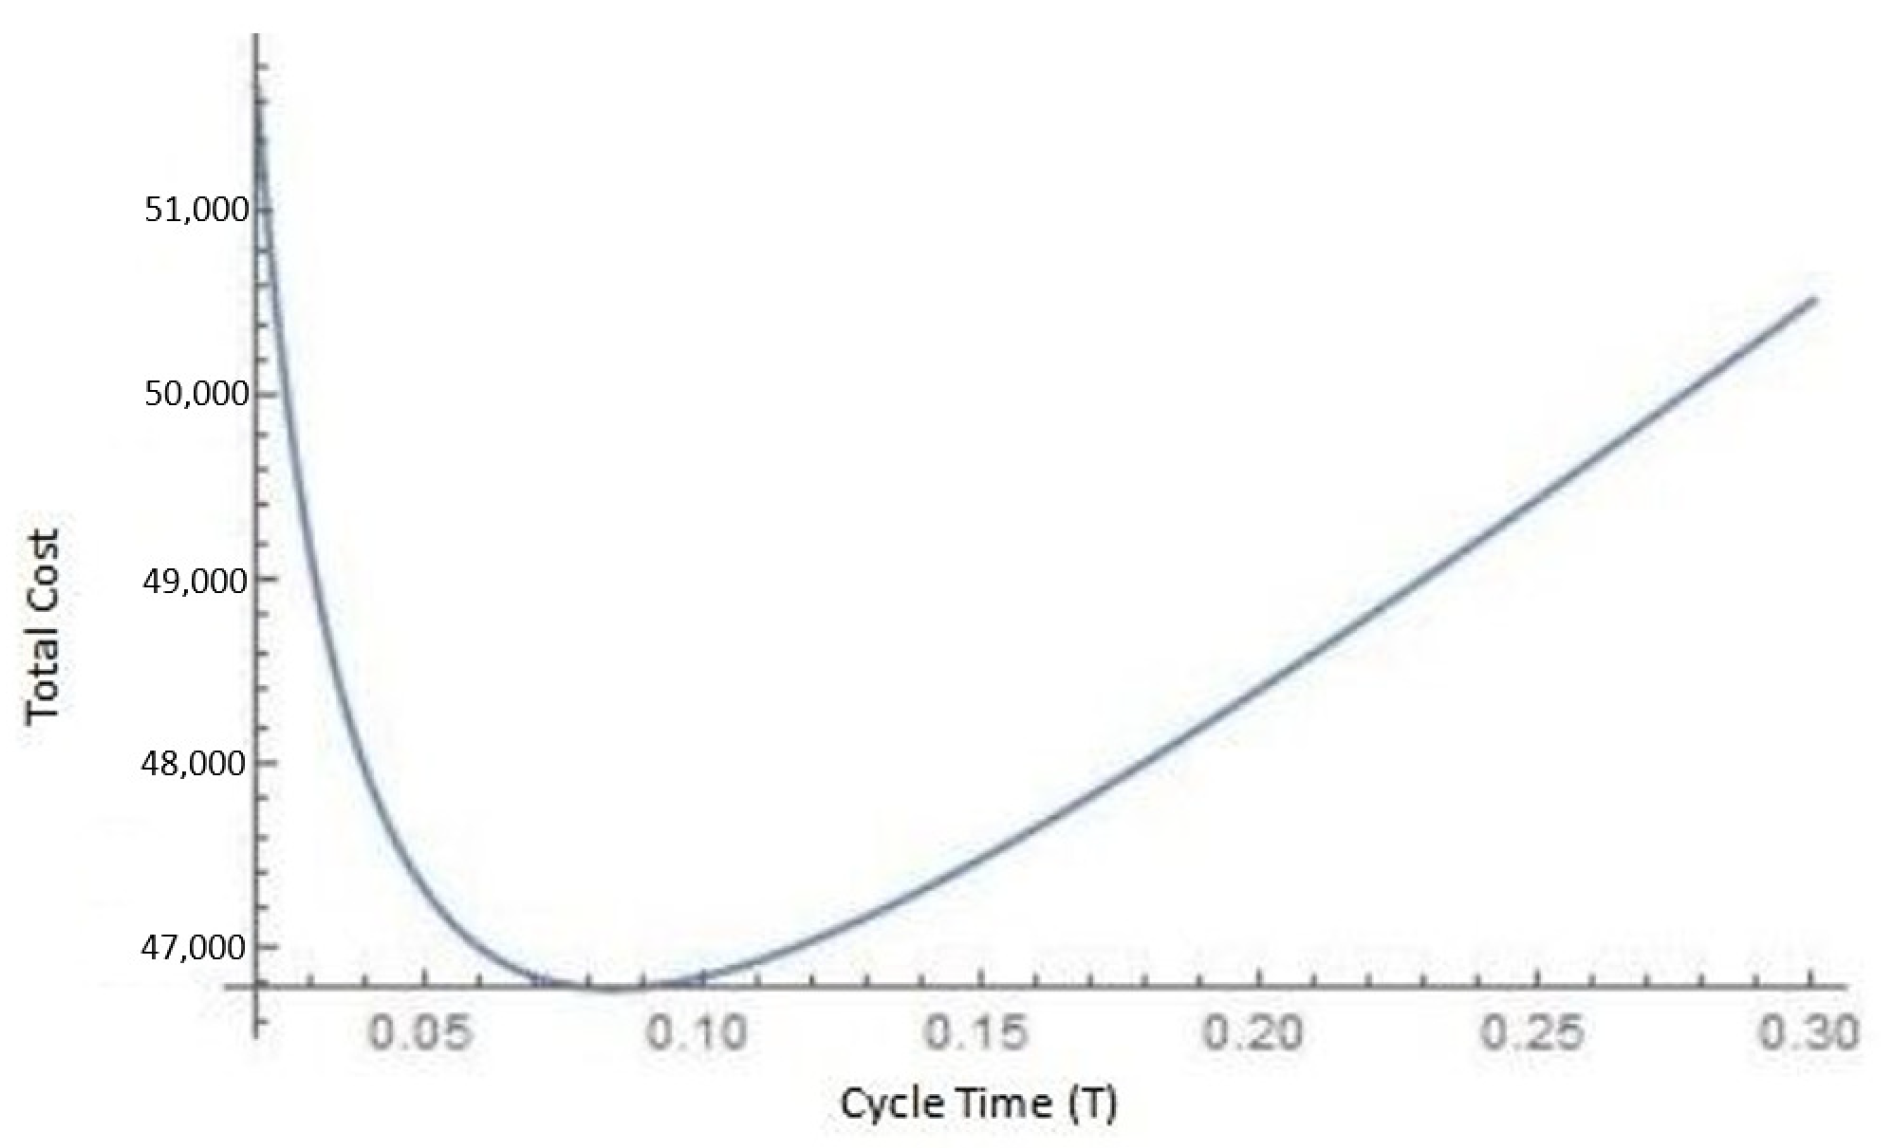
In inventory management, cycle time refers to the total time taken for a product to move through the entire production or order fulfillment process, from the initiation of the production or order to its completion and delivery. The cycle time is a critical factor that influences the overall productivity of the inventory management system. When the cycle time increases, it can lead to an increase in total costs for several reasons, for example, cycle time is directly related to the time a product spends in the inventory. Longer cycle times mean that products are in the inventory for a longer period, leading to higher carrying costs. Longer cycle times increase the risk of product obsolescence. Products that spend more time in inventory may become outdated, leading to potential losses if they need to be sold at a discount or written off entirely. Thus, an increase in cycle time, i.e., T, gives rise to total cost. It is governed by the reason that an increase in T will increase various costs like holding cost and preservation technology cost, which in turn will increase total cost.
Demand plays a crucial role in influencing inventory decisions within a business. Inventory decisions are often driven by the need to balance supply and demand effectively. Businesses aim to maintain optimal inventory levels that match the anticipated demand. If it is to be expected that demand will increase, then inventory levels may need to be adjusted accordingly to prevent stockouts. Conversely, if demand is expected to decrease, excess inventory may need to be reduced to avoid overstock situations. Demand highly affects inventory decisions. With an increase in demand, cycle time decreases, which is obvious with the rise in demand stock clearing in shorter time. Increase in demand increases total cost. This can be due to the fact that with the rise in demand, more inventory will be kept, which in turn will increase numerous costs and, hence, total cost.
An increase in carbon costs raises total costs because it adds expenses related to carbon emissions and environmental impact, including carbon taxes or costs associated with implementing eco-friendly practices, technologies, and compliance measures. Hence, total cost increases with increase in carbon emissions cost. It is advisable that practices should be adopted to reduce the emission. To reduce carbon emissions costs, a business can implement energy-efficient practices, adopt sustainable technologies, optimize transportation, and invest in renewable energy sources. Additionally, engaging in carbon offset programs and obtaining certifications for environmentally friendly practices can contribute to cost reduction.

9. Conclusions

The world is facing serious environmental issues, making sustainability an urgent necessity. It is therefore very important that business activities should be influenced by sustainability, and greener alternatives should also be explored. This study introduced a retail inventory model considering preservation technology. It is considered that advertisement be applied and some fraction of income due to trade-credit be used as green investment. Firms dealing with perishable products can enhance their performance by using preservation technology. Preservation technology applies to diverse areas, including cultural heritage, environmental conservation, food and agriculture, and many other fields. It involves the use of specialized knowledge and innovative methods to protect and maintain the integrity of these valuable assets.
This study presents a retail inventory model that incorporates green technology, trade-credit, promotion-dependent demand, and carbon emissions. This paper uses a different function of reduction in deterioration due to the implementation of preservation technology. This study is performed to observe the effects of various cost parameters on variables used in decision-making. It is found that demand highly affects decision variables. Moreover, permission delay time is a crucial factor as it highly affects total cost. It is advised that decision-makers make their decisions accordingly. Further, the model led to a rise in cycle time. Preservation technology cost depends on parameters α and β and costs like deterioration cost, purchasing cost, selling price, and cycle time. Cycle time depends on ordering cost, carbon emissions cost, holding cost, deterioration cost, demand, fixed transportation cost, and rate of deterioration. The model can be helpful for industries dealing with deteriorating items. Examples demonstrate the efficacy of the model. To show optimality through graphs, Mathematica 11 and Maple 18 software were used.
This model has certain limitations, which can be further explored. A possible direct extension of the model is to extend it to multiple echelons, like two, three, or higher. As backlogging is not considered, backlogging can be incorporated into the model. Quantity discount, waste management, and inflation can be incorporated into the model. The model is expendable by introducing trade credit in an integrated supply chain. It would be interesting to study the model’s behavior by considering multiple items. The concept of green inventory will be an advantageous direction to explore.

Author Contributions

Conceptualization, methodology, S.Y. and M.S.; software, data curation, writing—original draft preparation, writing—review and editing, S.Y.; validation, investigation, resources, S.P. and M.S., formal analysis, M.S., J.-H.M. and Y.-H.A.; visualization, J.-H.M.; supervision, S.P.; project administration, funding acquisition, M.S. and Y.-H.A. All authors have read and agreed to the published version of the manuscript.

Funding

This research work was supported by Incheon National University.

Data Availability Statement

Data is provided in the manuscript.

Conflicts of Interest

The authors declare no conflicts of interest.

References

  1. Barman, A.; Das, R.; De, P.K. An analysis of optimal pricing strategy and inventory scheduling policy for a non-instantaneous deteriorating item in a two-layer supply chain. Appl. Intell. 2022, 52, 4626–4650. [Google Scholar] [CrossRef]
  2. Rani, N.; Maheshwari, S.; Sharma, M.K. A sustainable inventory model: Integrating eco-packaging, advertising, and pricing strategies under carbon tax policies. Int. J. Syst. Assur. Eng. Manag. 2025, 1–18. [Google Scholar] [CrossRef]
  3. Ma, J.; Xie, W. Application and research on the complex dynamics behaviour under price-discount promotion policy in inventory control system. Int. J. Logist. 2016, 19, 520–536. [Google Scholar] [CrossRef]
  4. Hasan, M.R.; Daryanto, Y.; Triki, C.; Elomri, A. An inventory model of e-marketplace with a promotional program. J. Model. Manag. 2024, 19, 787–808. [Google Scholar] [CrossRef]
  5. Fauza, G.; Amer, Y.; Lee, S.H.; Prasetyo, H. An inventory model of production-inventory policy for food products considering quality loss in raw materials. In Proceedings of the 2015 IEEE International Conference on Industrial Engineering and Engineering Management (IEEM), Singapore, 6–9 December 2015. [Google Scholar]
  6. Meneghetti, A.; Monti, L. Greening the food supply chain: An optimisation model for sustainable design of refrigerated automated warehouses. Int. J. Prod. Res. 2015, 53, 6567–6587. [Google Scholar] [CrossRef]
  7. Berbain, S.; Bourbonnais, R.; Vallin, P. Forecasting, production and inventory management of short life-cycle products: A review of the literature and case studies. Supply Chain Forum 2011, 12, 36–48. [Google Scholar] [CrossRef]
  8. Das, P.; Sen, N. A multi-phase sustainable production inventory model for seasonal products with green investment and eco-friendly packaging. Process Int. Opt. Sus. 2025, 1–16. [Google Scholar] [CrossRef]
  9. Praveen, V.P.; Manoharan, M. An EOQ model for deteriorating items under two-level trade credit financing with expiration date. Cent. Euro. J. Oper. Res. 2025, 1–22. [Google Scholar] [CrossRef]
  10. Gautam, P.; Maheshwari, S.; Kausar, A.; Jaggi, C.K. Sustainable retail model with preservation technology investment to moderate deterioration with environmental deliberations. J. Clean. Prod. 2023, 390, 136128. [Google Scholar] [CrossRef]
  11. Kar, S.; Basu, K.; Sarkar, B. Advertisement policy for dual-channel within emissions-controlled flexible production system. J. Retail. Consum. Serv. 2023, 71, 103077. [Google Scholar] [CrossRef]
  12. Sarkar, B.; Kar, S.; Pal, A. Does the bullwhip effect really help a dual-channel retailing with a conditional home delivery policy? J. Retail. Consum. Serv. 2024, 78, 103708. [Google Scholar]
  13. Taheri, S.G.; Navabakhsh, M.; Tohidi, H.; Mohammaditabar, D. A system dynamics model for optimum time, profitability, and customer satisfaction in omni-channel retailing. J. Retail. Consum. Serv. 2024, 78, 103784. [Google Scholar]
  14. Souiden, N.; Ladhari, R.; Chiadmi, N.E. New trends in retailing and services. J. Retail. Consum. Serv. 2019, 50, 286–288. [Google Scholar]
  15. Amankou, K.A.C.; Guchhait, R.; Sarkar, B.; Dem, H. Product-specified dual-channel retail management with significant consumer service. J. Retail. Consum. Serv. 2024, 79, 103788. [Google Scholar]
  16. Mridha, B.; Sarkar, B.; Cárdenas-Barrón, L.E.; Ramana, G.V.; Yang, L. Is the advertisement policy for dual-channel profitable for retailing and consumer service of a retail management system under emissions-controlled flexible production system? J. Retail. Consum. Serv. 2024, 78, 103662. [Google Scholar] [CrossRef]
  17. Guha, A.; Grewal, D.; Kopalle, P.K.; Haenlein, M.; Schneider, M.J.; Jung, H.; Moustafa, R.; Hegde, D.R.; Hawkins, G. How artificial intelligence will affect the future of retailing. J. Retail. Consum. Serv. 2021, 97, 28–41. [Google Scholar]
  18. Hota, S.K.; Sarkar, B.; Ghosh, S.K.; Cheikhrouhou, N.; Treviño-Garza, G. What should be the best retail strategy to deal with an unequal shipment from an unreliable manufacturer? J. Retail. Consum. Serv. 2024, 76, 103576. [Google Scholar]
  19. Mahapatra, A.S.; Sengupta, S.; Dasgupta, A.; Sarkar, B.; Goswami, R.T. What is the impact of demand patterns on integrated online-offline and buy-online-pickup in-store (BOPS) retail in a smart supply chain management? J. Retail. Consum. Serv. 2025, 82, 104093. [Google Scholar]
  20. Tayyab, M.; Sarkar, B. An interactive fuzzy programming approach for a sustainable supplier selection under textile supply chain management. Comput. Ind. Eng. 2021, 155, 107164. [Google Scholar]
  21. Dey, B.K.; Bhuniya, S.; Sarkar, B. Involvement of controllable lead time and variable demand for a smart manufacturing system under a supply chain management. Expert Syst. Appl. 2021, 184, 115464. [Google Scholar]
  22. Dey, B.K.; Pareek, S.; Tayyab, M.; Sarkar, B. Autonomation policy to control work-in-process inventory in a smart production system. Int. J. Prod. Res. 2021, 59, 1258–1280. [Google Scholar]
  23. Sarkar, B.; Omair, M.; Kim, N. A cooperative advertising collaboration policy in supply chain management under uncertain conditions. App. Soft Comput. 2020, 88, 105948. [Google Scholar] [CrossRef]
  24. Saha, S.; Chatterjee, D.; Sarkar, B. The ramification of dynamic investment on the promotion and preservation technology for inventory management through a modified flower pollination algorithm. J. Retail. Consum. Serv. 2021, 58, 102326. [Google Scholar] [CrossRef]
  25. Mishra, U.; Wu, J.Z.; Sarkar, B. Optimum sustainable inventory management with backorder and deterioration under controllable carbon emissions. J. Clean. Prod. 2021, 279, 123699. [Google Scholar] [CrossRef]
  26. Das, S.C.; Zidan, A.M.; Manna, A.K.; Shaikh, A.A.; Bhunia, A.K. An application of preservation technology in inventory control system with price dependent demand and partial backlogging. Alex. Eng. J. 2020, 59, 1359–1369. [Google Scholar]
  27. Dye, C.Y. The effect of preservation technology investment on a non-instantaneous deteriorating inventory model. Omega 2013, 41, 872–880. [Google Scholar]
  28. Chang, C.C.; Lu, C.J.; Yang, C.T. Multistage supply chain production-inventory model with collaborative preservation technology investment. Sci. Iran. 2022, 29, 2099–2114. [Google Scholar] [CrossRef]
  29. Tayal, S.; Singh, S.R.; Sharma, R. An integrated production inventory model for perishable products with trade credit period and investment in preservation technology. Int. J. Math. Oper. Res. 2016, 8, 137–163. [Google Scholar] [CrossRef]
  30. Giri, B.C.; Pal, H.; Maiti, T. A vendor-buyer supply chain model for time-dependent deteriorating item with preservation technology investment. Int. J. Math. Oper. Res. 2017, 10, 431–449. [Google Scholar] [CrossRef]
  31. Sarkar, B.; Debnath, A.; Chiu, A.S.; Ahmed, W. Circular economy-driven two-stage supply chain management for nullifying waste. J. Clean. Prod. 2022, 339, 130513. [Google Scholar] [CrossRef]
  32. Jauhari, W.A.; Pujawan, I.N.; Suef, M. A closed-loop supply chain inventory model with stochastic demand, hybrid production, carbon emissions, and take-back incentives. J. Clean. Prod. 2021, 320, 128835. [Google Scholar] [CrossRef]
  33. Daryanto, Y.; Wee, H.M.; Astanti, R.D. Three-echelon supply chain model considering carbon emission and item deterioration. Transp. Res. Part E Logist. Transp. Rev. 2019, 122, 368–383. [Google Scholar] [CrossRef]
  34. Kazemi, N.; Abdul-Rashid, S.H.; Ghazilla, R.A.R.; Shekarian, E.; Zanoni, S. Economic order quantity models for items with imperfect quality and emission considerations. Int. J. Syst. Sci. Oper. Logist. 2018, 5, 99–115. [Google Scholar] [CrossRef]
  35. Tiwari, S.; Daryanto, Y.; Wee, H.M. Sustainable inventory management with deteriorating and imperfect quality items considering carbon emission. J. Clean. Prod. 2018, 192, 281–292. [Google Scholar] [CrossRef]
  36. Wee, H.M.; Daryanto, Y. Imperfect quality item inventory models considering carbon emissions. Opt. Inventory Manag. 2020, 137–159. [Google Scholar]
  37. Salameh, M.K.; Jaber, M.Y. Economic production quantity model for items with imperfect quality. Int. J. Prod. Econ. 2000, 64, 59–64. [Google Scholar] [CrossRef]
  38. Sana, S.S. A production-inventory model of imperfect quality products in a three-layer supply chain. Decis. Support Syst. 2011, 50, 539–547. [Google Scholar] [CrossRef]
  39. Gautam, P.; Khanna, A. An imperfect production inventory model with setup cost reduction and carbon emission for an integrated supply chain. Uncertain Supply Chain Manag. 2018, 6, 271–286. [Google Scholar] [CrossRef]
  40. Khan, M.A.A.; Cárdenas-Barrón, L.E.; Treviño-Garza, G.; Céspedes-Mota, A.; de Jesús Loera-Hernández, I.; Smith, N.R. Inventory model for livestock farm under quantity discount, power demand, prepayment and carbon rules. J. Clean. Prod. 2024, 441, 140642. [Google Scholar] [CrossRef]
  41. Wang, M.; Ye, B.; Lin, S.; Wang, C.; Zhang, P. Sustainable supply chain planning with the flexible provisions of inter-period emission credits borrowing and banking under a multi-period carbon trading scheme. J. Clean. Prod. 2024, 445, 141406. [Google Scholar] [CrossRef]
  42. Zhang, Y.; Yang, R.; Shi, X.; Zhang, W. Operational strategies in a low-carbon supply chain considering the impact of carbon credit. J. Clean. Prod. 2024, 442, 141080. [Google Scholar] [CrossRef]
  43. Sarkar, B.; Mridha, B.; Pareek, S. A sustainable smart multi-type biofuel manufacturing with the optimum energy utilization under flexible production. J. Clean. Prod. 2022, 332, 129869. [Google Scholar] [CrossRef]
  44. Sarkar, B.; Tayyab, M.; Kim, N.; Habib, M.S. Optimal production delivery policies for supplier and manufacturer in a constrained closed-loop supply chain for returnable transport packaging through metaheuristic approach. Comput. Ind. Eng. 2019, 135, 987–1003. [Google Scholar] [CrossRef]
  45. Sarkar, M.; Sarkar, B. How does an industry reduce waste and consumed energy within a multi-stage smart sustainable biofuel production system? J. Clean. Prod. 2019, 262, 121200. [Google Scholar]
  46. Tayyab, M.; Jemai, J.; Lim, H.; Sarkar, B. A sustainable development framework for a cleaner multi-item multi-stage textile production system with a process improvement initiative. J. Clean. Prod. 2020, 246, 119055. [Google Scholar] [CrossRef]
  47. Chen, C.J.; Jain, N.; Yang, S.A. The impact of trade credit provision on retail inventory: An empirical investigation using synthetic controls. Manag. Sci. 2023, 69, 4591–4608. [Google Scholar]
  48. Singh, S.R.; Rana, K. A sustainable production inventory model for growing items with trade credit policy under partial backlogging. Int. J. Adv. Oper. Manag. 2023, 15, 64–81. [Google Scholar] [CrossRef]
  49. Garai, A.; Sarkar, B. Economically independent reverse logistics of customer-centric closed-loop supply chain for herbal medicines and biofuel. J. Clean. Prod. 2022, 334, 129977. [Google Scholar] [CrossRef]
  50. Sarkar, B.; Bhuniya, S. A sustainable flexible manufacturing–remanufacturing model with improved service and green investment under variable demand. Expert Syst. Appl. 2022, 202, 117154. [Google Scholar]
  51. Xia, L.; Hao, W.; Qin, J.; Ji, F.; Yue, X. Carbon emission reduction and promotion policies considering social preferences and consumers’ low-carbon awareness in the cap-and-trade system. J. Clean. Prod. 2018, 195, 1105–1124. [Google Scholar] [CrossRef]
  52. Yu, C.; Qu, Z.; Archibald, T.W.; Luan, Z. An inventory model of a deteriorating product considering carbon emissions. Comput. Ind. Eng. 2020, 148, 106694. [Google Scholar] [CrossRef]
Figure 1. Inventory representation with and without preservation technology investment.
Mathematics 13 01065 g001
Figure 2. Flow of the study.
Mathematics 13 01065 g002
Figure 3. Graphical optimization for T C versus T versus P.
Mathematics 13 01065 g003
Figure 4. Convexity between total cost and time (T).
Mathematics 13 01065 g004
Figure 5. The effect of various cost parameters on total cost.
Mathematics 13 01065 g005
Figure 6. The effect of various cost parameters on total cost (Figure 2).
Mathematics 13 01065 g006
Figure 7. Percentage change in total cost versus different parameters’ percentage values for Case 1 (af).
Mathematics 13 01065 g007
Table 1. Different author contribution.
AuthorsDemand PatternDeteriorationPreservation TechnologyCarbon EmissionsPromotion
Saha et al. [24]Price-wise, promotional, and trapezoidal typeYesYesNoYes
Xia et al. [51]Function of carbon emissions and promotion levelNoNoYesYes
Gautam and Khanna [39]ConstantNoNoYesNo
Daryanto et al. [33]ConstantYesNoYesNo
Tayal et al. [29]ConstantYesYesNoNo
Chang et al. [28]ConstantYesYesNoNo
Dye [27]ConstantYesYesNoNo
Yu et al. [52]Price- and stock-dependentYesYesYesNo
This paperPrice- and promotion-dependentYesYesYesYes
Table 2. Notation.
Table 2. Notation.
NotationDefinition
pselling price (USD/unit)
C o ordering cost (USD/order)
Cpurchasing cost (USD/unit)
θ rate of deterioration without preservation technology
C h holding cost (USD/unit/unit time)
C e P carbon emissions cost due to preservation (USD/unit)
C e S carbon emissions cost due to storage (USD/unit)
C e T carbon emissions cost due to transportation (USD/unit)
T α fixed transportation cost (USD)
C d deterioration cost (USD/unit)
lvariable transportation cost (USD/unit)
γ distance in kilometers from supplier to retailer
ω duration (in hours) for fixed transportation cost
nfraction of profit used in advertisement cost
λ advertisement elasticity
β efficiency of preservation technology
Mpermissible delay time
I e interest earned
d 1 fraction of interest earned used in green technology investment
T C total cost (USD/cycle)
Decision variables
Tcycle time (time unit)
Ppreservation technology investment (USD)
Table 3. Input values of parameters.
ParametersValuesParametersValues
p14 (USD/unit) C o 100 (USD/unit)
C5 (USD/unit) θ 0.5
C h 1 (USD/unit/year) C e S 0.2 (USD/unit)
C e T 0.2 (USD/unit) C e P 0.1 (USD/unit)
T α 70 (USD/order) C d 10 (USD/unit)
l0.1 (USD/unit)n0.02
ω 1 λ 0.4
a8000 γ 1
b7 f ( p ) a p ( a = 1 )
M0.02 I e 0.03
d 1 0.6M0.1
β 0.01
Table 4. Sensitivity analysis table.
ParameterVariationTC (Change in %)T (Years)P (USD)
C h +50%+0.350.083551.768
+25%+0.180.085358.911
−25%−0.180.0893163.498
−50%−0.360.0915365.961
C o +50%+20.0995274.326
+25%+1.50.0935868.167
−25%−1.130.080453.003
−50%−1.90.072943.289
C e S +50%+0.070.086460.243
+25%+0.030.086860.695
−25%−0.030.087661.612
−50%−0.070.08862.077
C e P +50%+0.0350.086860.695
+25%+0.0170.08760.923
−25%−0.010.087461.381
−50%−0.040.087661.612
M+50%+0.430.087261.15
+25%+0.210.087261.15
−25%−0.210.087261.15
−50%−0.430.087261.15
θ +50%+1.630.072391.96
+25%+0.840.078774.19
−25%−0.940.099350.85
−50%−20.118742.32
γ +50%+2.630.072393.96
+25%+1.840.068776.19
−25%−1.940.089353.85
−50%−2.50.108745
Table 5. Advertisement elasticity effect on total cost.
λ TC (USD)
0.150,767.365
0.250,771.631
0.350,775.896
0.450,780.162
0.550,784.43
0.650,788.694
0.750,792.96
0.850,797.225
0.950,801.491
150,805.76
Disclaimer/Publisher’s Note: The statements, opinions and data contained in all publications are solely those of the individual author(s) and contributor(s) and not of MDPI and/or the editor(s). MDPI and/or the editor(s) disclaim responsibility for any injury to people or property resulting from any ideas, methods, instructions or products referred to in the content.

