A Retail Inventory Model with Promotional Efforts, Preservation Technology Considering Green Technology Investment
Abstract
1. Introduction
1.1. Research Gaps
- •
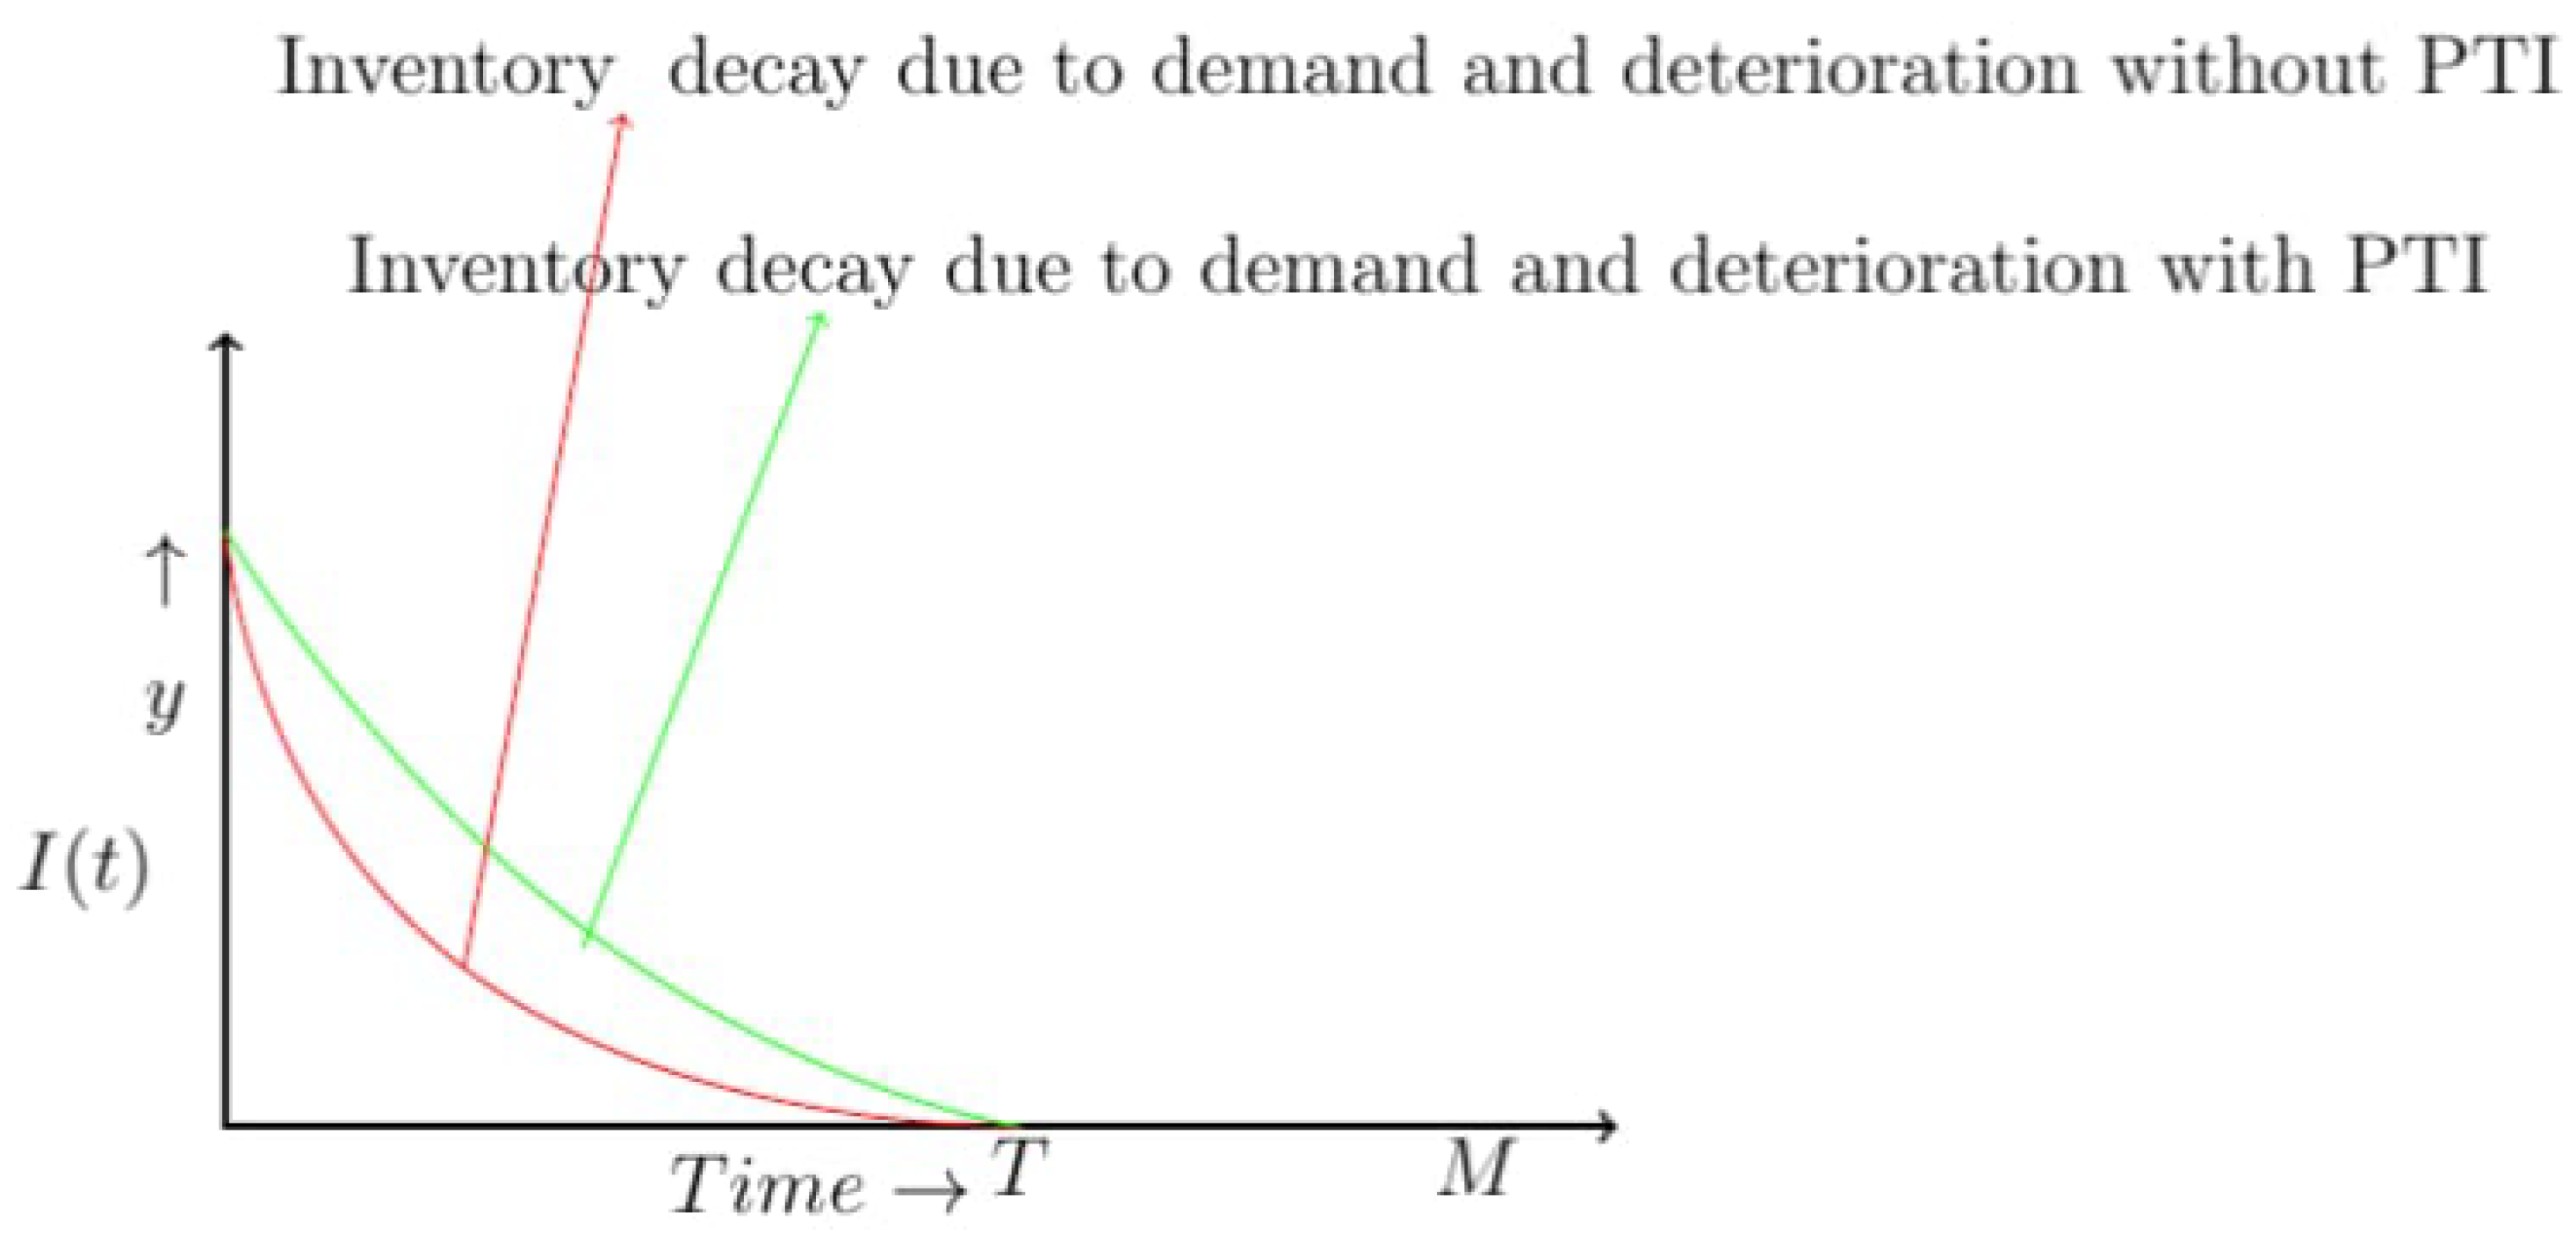
- For perishable products, preservation technology plays a very important role. With the use of preservation technology, there is a reduction in deterioration rate. Different types of reduction are used in the literature [10]. This paper considers a deterioration reduction function as a function of the efficiency of production technology used.
- •
- So far, there is no study in the literature exploring the knowledge of authors who used variable transportation costs dependent on distance along with fixed transportation costs dependent on time. This study addresses this gap by including both aspects.
- •
- Carbon emissions due to supply chain activities like preservation, storage, and transportation are included in this study.
1.2. Contribution to the Field
2. Literature Review
2.1. Retail Inventory Model
2.2. Marketing with Promotion
2.3. Preservation Technology
2.4. Carbon Emissions
2.5. Trade-Credit
- •
- Cash flow management: Products and services can be purchased by customers without requiring an upfront payment, allowing them to use the purchased items before making payments. This helps in managing short-term cash flow.
- •
- Negotiation power: Buyers might use this as an opportunity to bargain with suppliers for better terms, such as extended credit terms or discounts for early payments.
- •
- Working capital efficiency: It contributes to better working capital management by allowing businesses to use their cash for other operational needs or investment opportunities.
- •
- Competitive edge: Offering trade credit can attract more buyers and improve market competitiveness by providing flexible payment terms.
- •
- Customer loyalty: It helps build long-term relationships with buyers, encouraging repeat business due to the convenience of deferred payments.
- •
- Increased sales: By allowing buyers to make purchases without immediate cash payments, sellers may see increased sales volumes.
- •
- Reduced collection costs: Although it involves a certain degree of risk, it lessens the administrative burden of constantly collecting payments and managing invoices.
3. Notation and Assumption
3.1. Notation
3.2. Assumptions
- a.
- A retail model is considered for products deteriorating in nature. Promotional tactics are used to drive sales.
- b.
- Demand is taken as , where is the decreasing function of p and is advertisement elasticity.
- c.
- It is considered that permissible delay period M is greater than cycle time T; therefore, interest is earned. This study have considered that some fraction of this earned interest is invested in green technology.
- d.
- Shortage is negligible.
- e.
- Lead time is negligible.
4. Mathematical Model
4.1. Ordering Cost
4.2. Holding Cost
4.3. Purchasing Cost
4.4. Transportation Cost
4.5. Carbon Emission Cost
4.6. Deterioration Cost
4.7. Promotion Cost
4.8. Green Technology Cost
5. Solution Methodology
6. Numerical Analysis
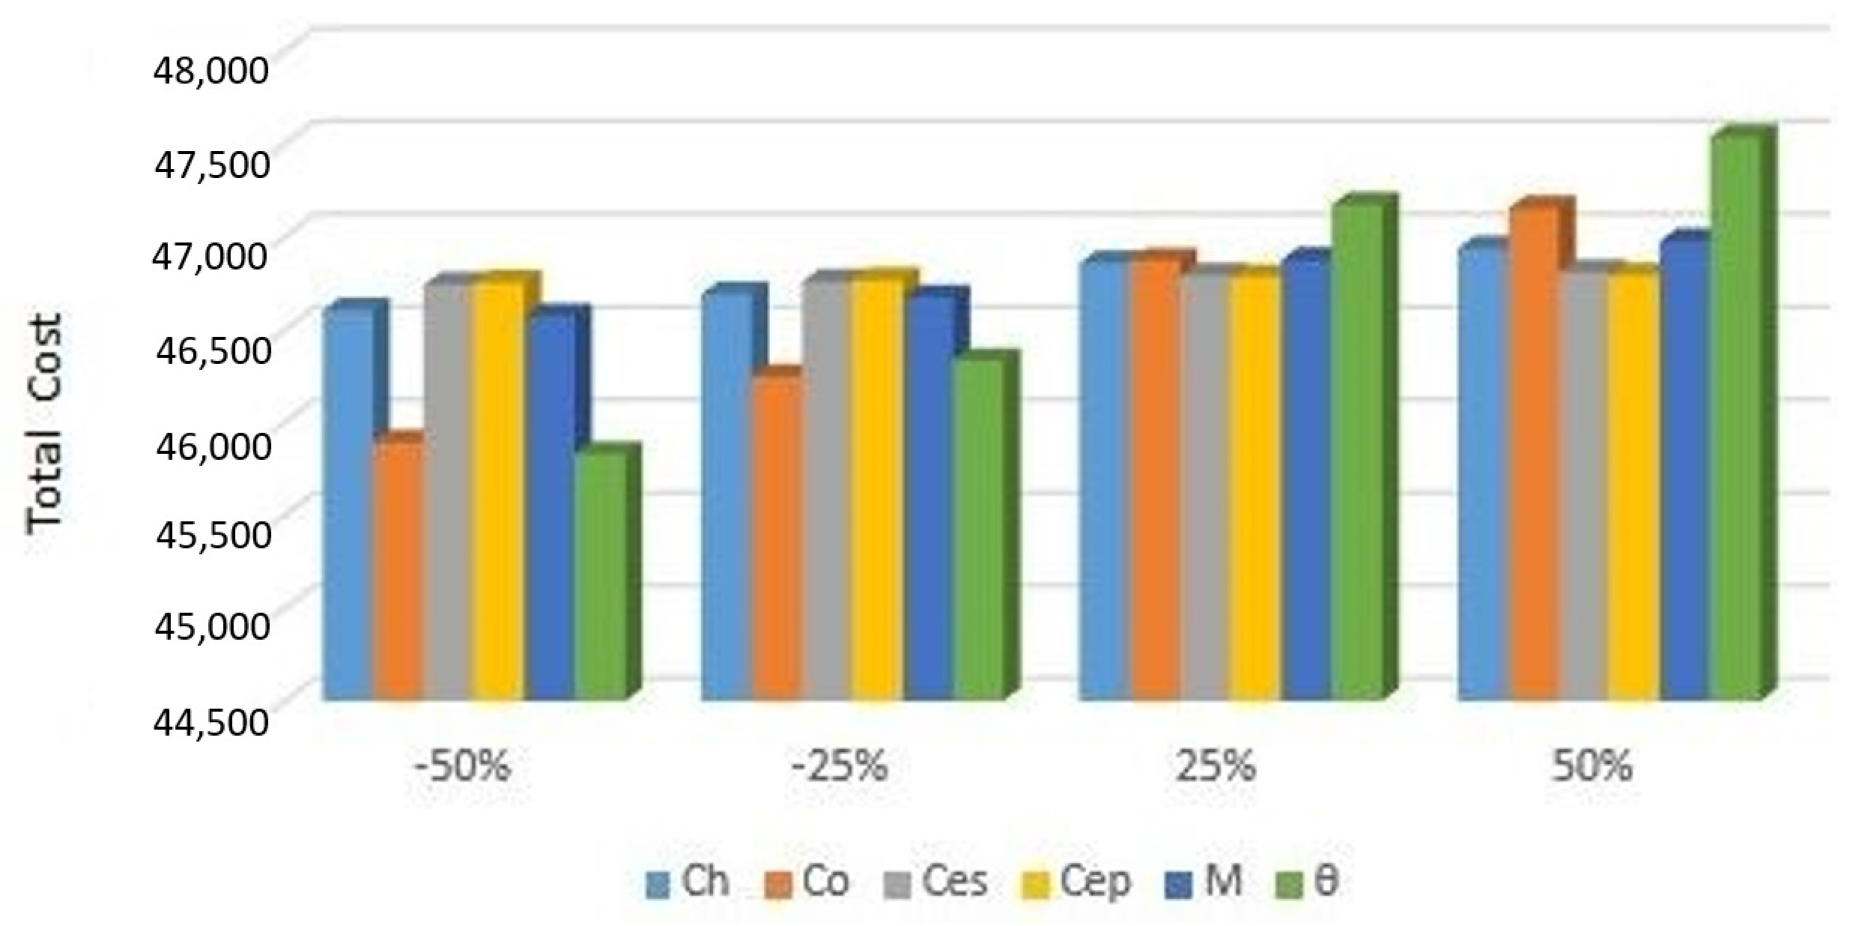
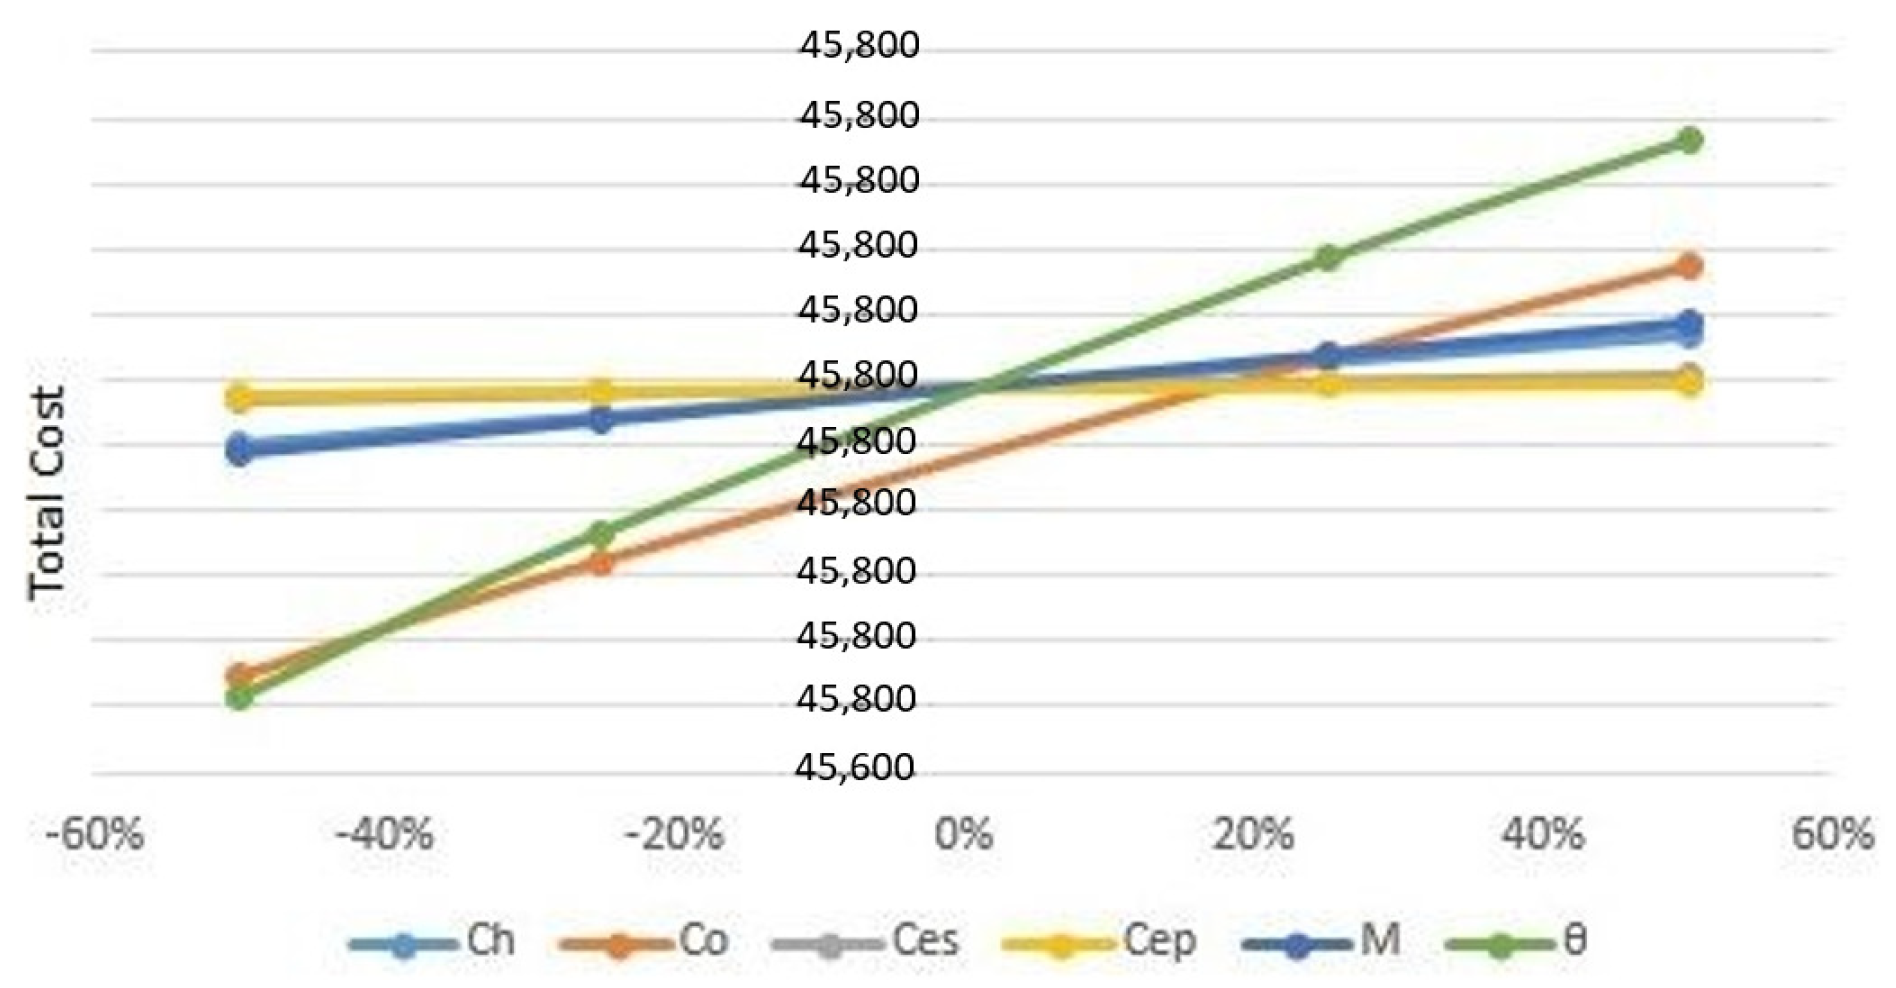
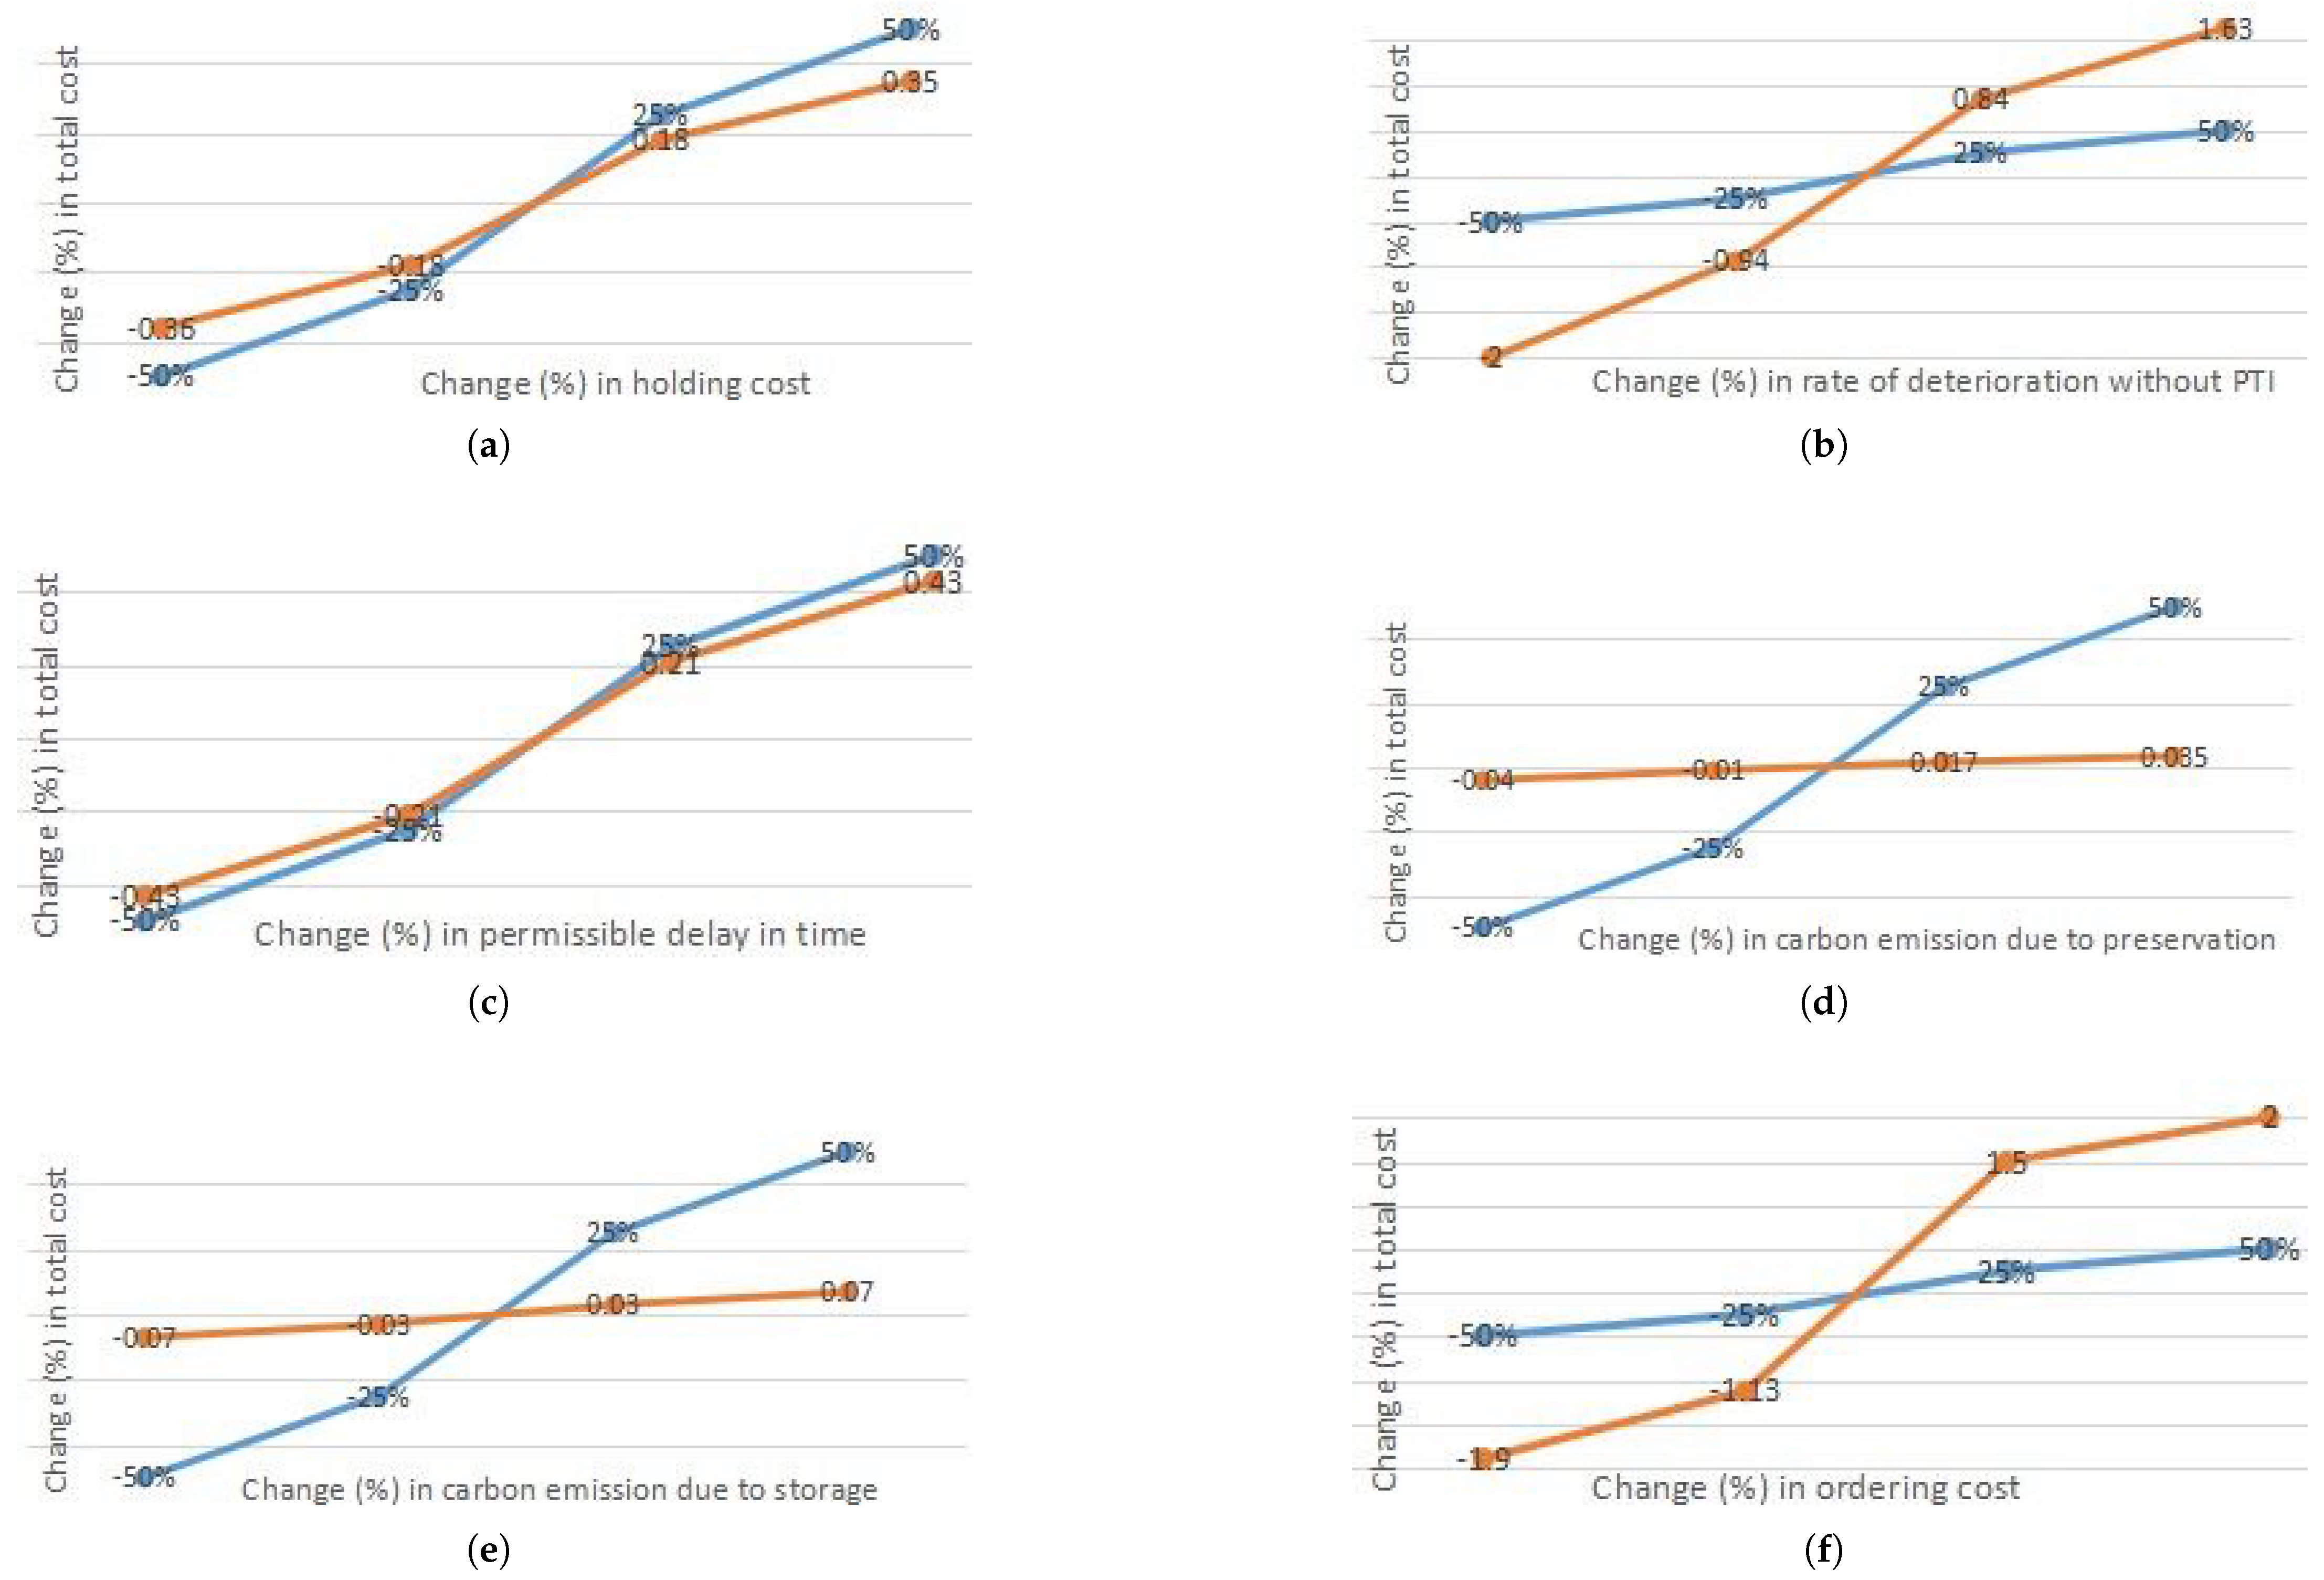
7. Sensitivity Analysis
8. Observation
- •
- Holding costs can significantly affect businesses, particularly those dealing with inventory or assets that require storage. It is one of the crucial costs because they directly impact a company’s profitability and efficiency. As holding cost increases, cycle time decreases. This can be justified by the fact that as holding cost increases, the concerned firm will intend to keep less inventory, which in turn decreases cycle time.
- •
- An increment in carbon emissions cost decreases cycle time. This is due to the fact that inventory stored for a longer time will result in higher carbon emission costs due to storage and preservation; hence, decision-makers will try to clear it as soon as possible, resulting in shorter cycle time.
- •
- Preservation technology costs are associated with maintaining the quality and integrity of products over time, especially in industries where the preservation of goods is crucial, such as food, pharmaceutical, and certain manufacturing processes. The costs of preservation technology can increase with an increase in cycle time for several reasons. One of the most important observations is that as cycle time increases, preservation technology cost increases, which may be due to the reason that with an increase in cycle time, products are stored for a longer duration before reaching the end consumer. Preservation technologies, such as refrigeration or controlled environments, may need to be in operation for a more extended period, leading to higher energy costs and maintenance expenses. This can involve additional testing, monitoring, and quality assurance processes, leading to increased labor and equipment costs. The effectiveness of preservation methods may decline over time. For example, the shelf life of perishable goods may be limited even with preservation technologies. If cycle times are extended beyond the effective preservation period, businesses may need to invest in more advanced or costly preservation methods. For these reasons, cycle time increment results increase in preservation cost.
- •
- Ordering cost is one of the sensitive costs. An increase in ordering costs raises total costs because it leads to higher expenses associated with the process of placing and receiving orders, including administrative costs, paperwork, and coordination efforts in procurement. An increase in ordering cost increases both cycle time and preservation technology costs. An increase in ordering costs can lead to a longer cycle time because higher costs may prompt businesses to place larger and less-frequent orders. This results in extended intervals between order placements and longer overall cycle times in the procurement and inventory replenishment processes. An increase in ordering costs can impact preservation technology costs because higher ordering costs may lead to larger and less-frequent orders. This could result in the need for enhanced preservation technologies to maintain product quality over extended periods, thereby increasing preservation costs.
- •
- Fixed transportation cost is a crucial cost. An increase in fixed transportation costs raises total costs because it represents a higher baseline expense for maintaining transportation infrastructure, vehicles, and logistics regardless of the actual volume of goods transported, impacting overall operational costs. An increase in fixed transportation costs can extend cycle time because businesses, faced with higher fixed costs, may opt for less frequent transportation activities or larger shipment sizes, leading to longer intervals between shipments and delays in the overall cycle. An increase in fixed transportation costs can elevate preservation technology costs because businesses, looking to optimize transportation spending, may extend cycle times and storage durations, requiring more extensive or advanced preservation methods to maintain product quality over longer periods.
- •
- Total costs increase with higher carrying cost because carrying cost is related to storing and maintaining inventory, including space for storage, insurance, security, and the opportunity cost of tied-up capital. As holding costs rise, the overall cost of keeping inventory in stock for extended periods increases. As expected, holding cost increment gives rise to total cost.
- •
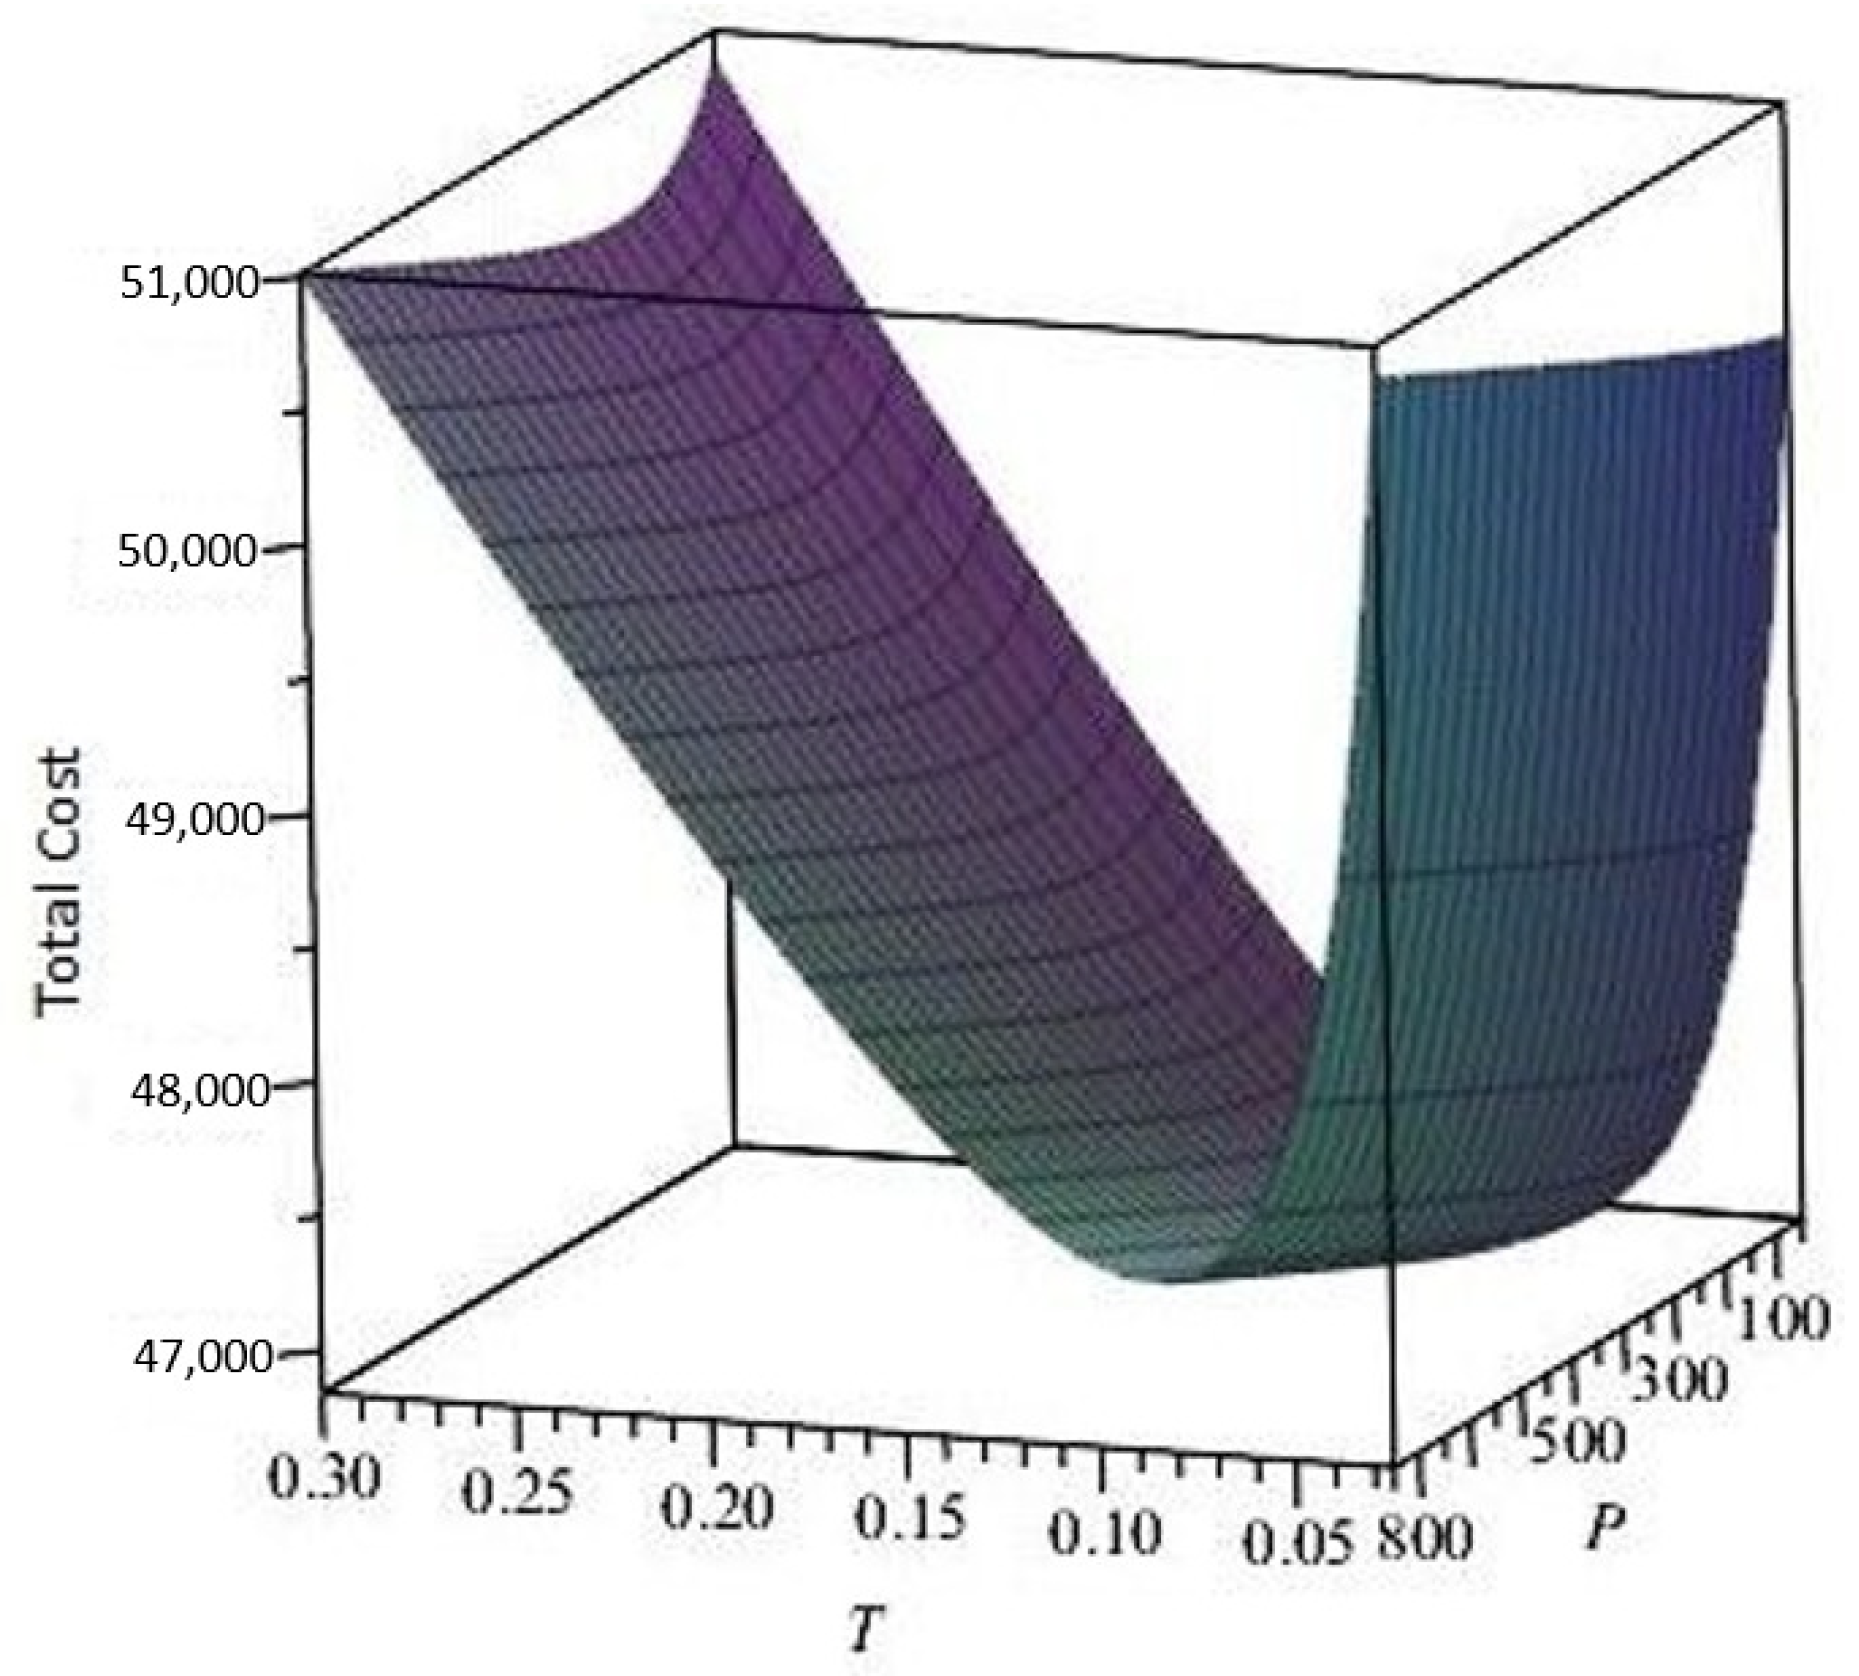
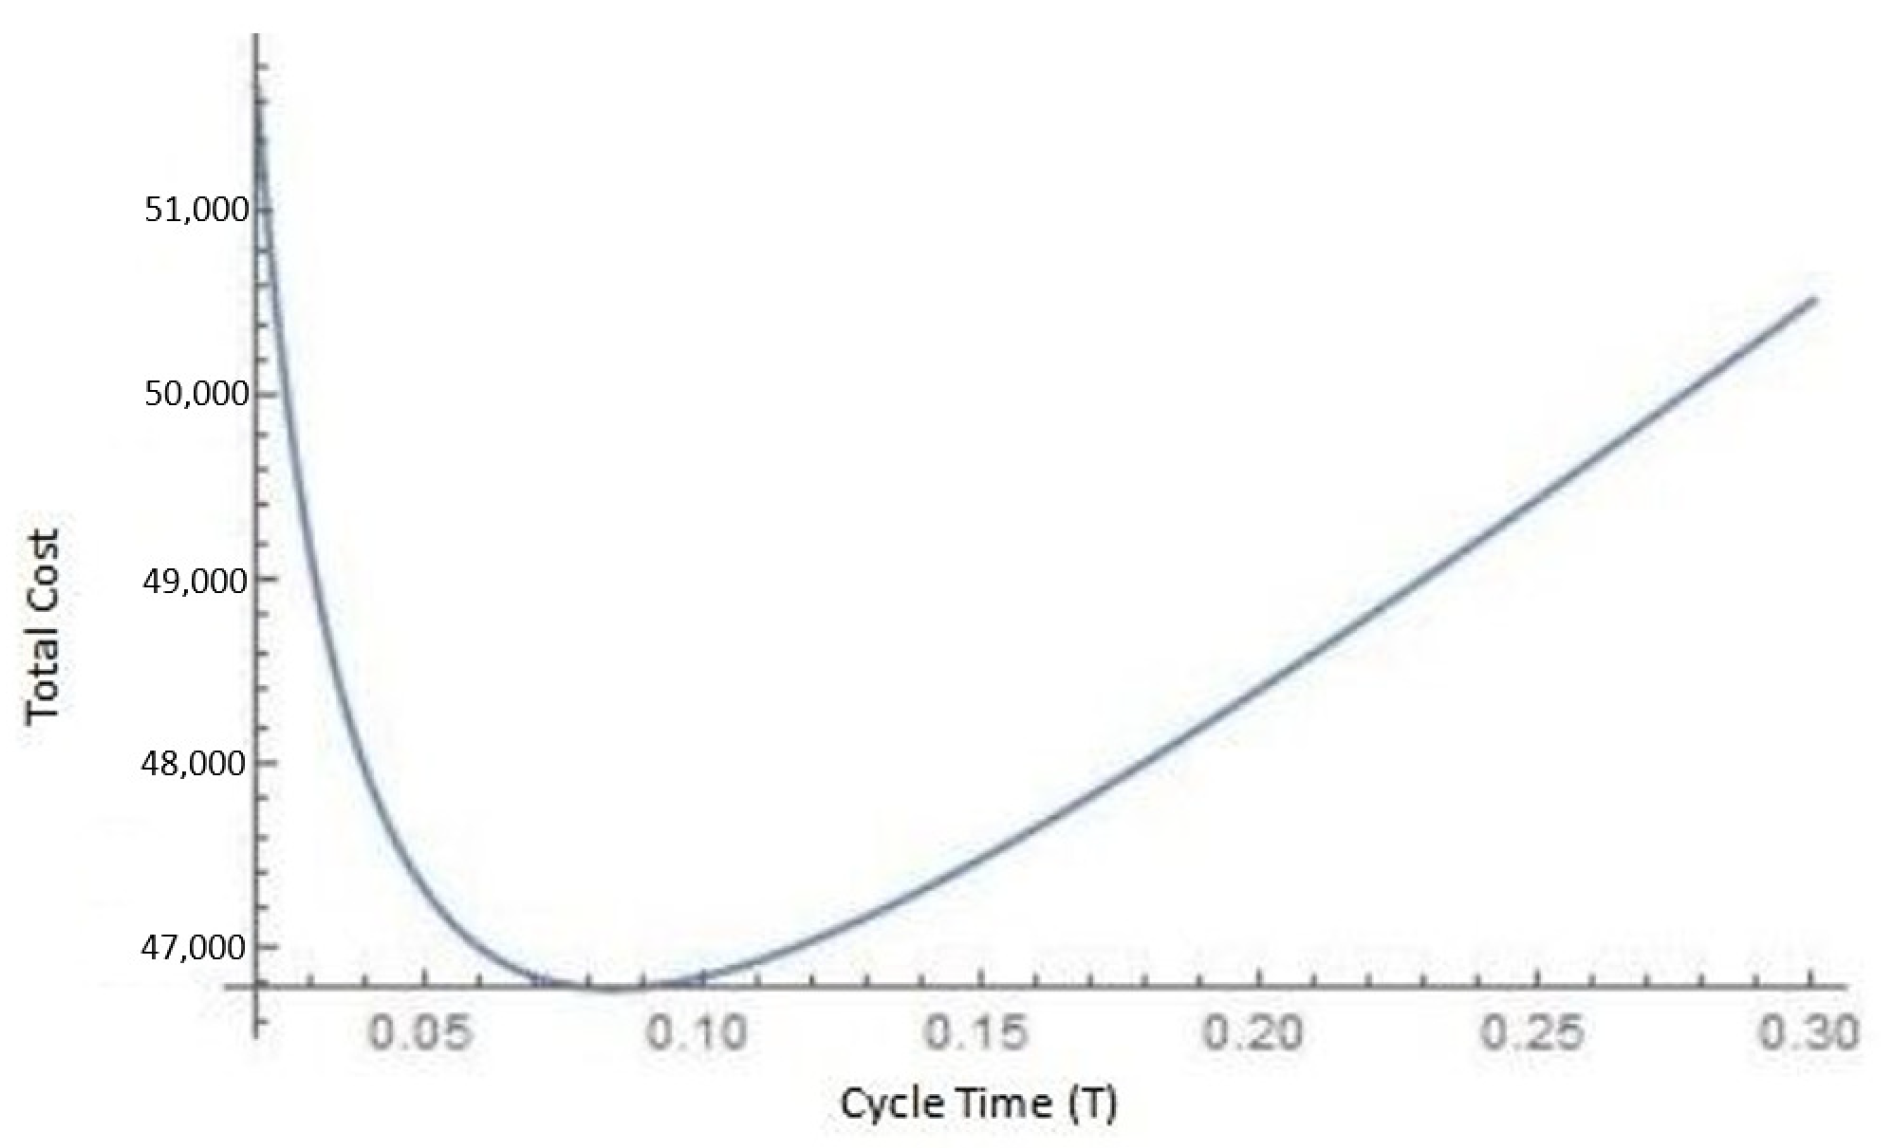
- In inventory management, cycle time refers to the total time taken for a product to move through the entire production or order fulfillment process, from the initiation of the production or order to its completion and delivery. The cycle time is a critical factor that influences the overall productivity of the inventory management system. When the cycle time increases, it can lead to an increase in total costs for several reasons, for example, cycle time is directly related to the time a product spends in the inventory. Longer cycle times mean that products are in the inventory for a longer period, leading to higher carrying costs. Longer cycle times increase the risk of product obsolescence. Products that spend more time in inventory may become outdated, leading to potential losses if they need to be sold at a discount or written off entirely. Thus, an increase in cycle time, i.e., T, gives rise to total cost. It is governed by the reason that an increase in T will increase various costs like holding cost and preservation technology cost, which in turn will increase total cost.
- •
- Demand plays a crucial role in influencing inventory decisions within a business. Inventory decisions are often driven by the need to balance supply and demand effectively. Businesses aim to maintain optimal inventory levels that match the anticipated demand. If it is to be expected that demand will increase, then inventory levels may need to be adjusted accordingly to prevent stockouts. Conversely, if demand is expected to decrease, excess inventory may need to be reduced to avoid overstock situations. Demand highly affects inventory decisions. With an increase in demand, cycle time decreases, which is obvious with the rise in demand stock clearing in shorter time. Increase in demand increases total cost. This can be due to the fact that with the rise in demand, more inventory will be kept, which in turn will increase numerous costs and, hence, total cost.
- •
- An increase in carbon costs raises total costs because it adds expenses related to carbon emissions and environmental impact, including carbon taxes or costs associated with implementing eco-friendly practices, technologies, and compliance measures. Hence, total cost increases with increase in carbon emissions cost. It is advisable that practices should be adopted to reduce the emission. To reduce carbon emissions costs, a business can implement energy-efficient practices, adopt sustainable technologies, optimize transportation, and invest in renewable energy sources. Additionally, engaging in carbon offset programs and obtaining certifications for environmentally friendly practices can contribute to cost reduction.
9. Conclusions
Author Contributions
Funding
Data Availability Statement
Conflicts of Interest
References
- Barman, A.; Das, R.; De, P.K. An analysis of optimal pricing strategy and inventory scheduling policy for a non-instantaneous deteriorating item in a two-layer supply chain. Appl. Intell. 2022, 52, 4626–4650. [Google Scholar] [CrossRef]
- Rani, N.; Maheshwari, S.; Sharma, M.K. A sustainable inventory model: Integrating eco-packaging, advertising, and pricing strategies under carbon tax policies. Int. J. Syst. Assur. Eng. Manag. 2025, 1–18. [Google Scholar] [CrossRef]
- Ma, J.; Xie, W. Application and research on the complex dynamics behaviour under price-discount promotion policy in inventory control system. Int. J. Logist. 2016, 19, 520–536. [Google Scholar] [CrossRef]
- Hasan, M.R.; Daryanto, Y.; Triki, C.; Elomri, A. An inventory model of e-marketplace with a promotional program. J. Model. Manag. 2024, 19, 787–808. [Google Scholar] [CrossRef]
- Fauza, G.; Amer, Y.; Lee, S.H.; Prasetyo, H. An inventory model of production-inventory policy for food products considering quality loss in raw materials. In Proceedings of the 2015 IEEE International Conference on Industrial Engineering and Engineering Management (IEEM), Singapore, 6–9 December 2015. [Google Scholar]
- Meneghetti, A.; Monti, L. Greening the food supply chain: An optimisation model for sustainable design of refrigerated automated warehouses. Int. J. Prod. Res. 2015, 53, 6567–6587. [Google Scholar] [CrossRef]
- Berbain, S.; Bourbonnais, R.; Vallin, P. Forecasting, production and inventory management of short life-cycle products: A review of the literature and case studies. Supply Chain Forum 2011, 12, 36–48. [Google Scholar] [CrossRef]
- Das, P.; Sen, N. A multi-phase sustainable production inventory model for seasonal products with green investment and eco-friendly packaging. Process Int. Opt. Sus. 2025, 1–16. [Google Scholar] [CrossRef]
- Praveen, V.P.; Manoharan, M. An EOQ model for deteriorating items under two-level trade credit financing with expiration date. Cent. Euro. J. Oper. Res. 2025, 1–22. [Google Scholar] [CrossRef]
- Gautam, P.; Maheshwari, S.; Kausar, A.; Jaggi, C.K. Sustainable retail model with preservation technology investment to moderate deterioration with environmental deliberations. J. Clean. Prod. 2023, 390, 136128. [Google Scholar] [CrossRef]
- Kar, S.; Basu, K.; Sarkar, B. Advertisement policy for dual-channel within emissions-controlled flexible production system. J. Retail. Consum. Serv. 2023, 71, 103077. [Google Scholar] [CrossRef]
- Sarkar, B.; Kar, S.; Pal, A. Does the bullwhip effect really help a dual-channel retailing with a conditional home delivery policy? J. Retail. Consum. Serv. 2024, 78, 103708. [Google Scholar]
- Taheri, S.G.; Navabakhsh, M.; Tohidi, H.; Mohammaditabar, D. A system dynamics model for optimum time, profitability, and customer satisfaction in omni-channel retailing. J. Retail. Consum. Serv. 2024, 78, 103784. [Google Scholar]
- Souiden, N.; Ladhari, R.; Chiadmi, N.E. New trends in retailing and services. J. Retail. Consum. Serv. 2019, 50, 286–288. [Google Scholar]
- Amankou, K.A.C.; Guchhait, R.; Sarkar, B.; Dem, H. Product-specified dual-channel retail management with significant consumer service. J. Retail. Consum. Serv. 2024, 79, 103788. [Google Scholar]
- Mridha, B.; Sarkar, B.; Cárdenas-Barrón, L.E.; Ramana, G.V.; Yang, L. Is the advertisement policy for dual-channel profitable for retailing and consumer service of a retail management system under emissions-controlled flexible production system? J. Retail. Consum. Serv. 2024, 78, 103662. [Google Scholar] [CrossRef]
- Guha, A.; Grewal, D.; Kopalle, P.K.; Haenlein, M.; Schneider, M.J.; Jung, H.; Moustafa, R.; Hegde, D.R.; Hawkins, G. How artificial intelligence will affect the future of retailing. J. Retail. Consum. Serv. 2021, 97, 28–41. [Google Scholar]
- Hota, S.K.; Sarkar, B.; Ghosh, S.K.; Cheikhrouhou, N.; Treviño-Garza, G. What should be the best retail strategy to deal with an unequal shipment from an unreliable manufacturer? J. Retail. Consum. Serv. 2024, 76, 103576. [Google Scholar]
- Mahapatra, A.S.; Sengupta, S.; Dasgupta, A.; Sarkar, B.; Goswami, R.T. What is the impact of demand patterns on integrated online-offline and buy-online-pickup in-store (BOPS) retail in a smart supply chain management? J. Retail. Consum. Serv. 2025, 82, 104093. [Google Scholar]
- Tayyab, M.; Sarkar, B. An interactive fuzzy programming approach for a sustainable supplier selection under textile supply chain management. Comput. Ind. Eng. 2021, 155, 107164. [Google Scholar]
- Dey, B.K.; Bhuniya, S.; Sarkar, B. Involvement of controllable lead time and variable demand for a smart manufacturing system under a supply chain management. Expert Syst. Appl. 2021, 184, 115464. [Google Scholar]
- Dey, B.K.; Pareek, S.; Tayyab, M.; Sarkar, B. Autonomation policy to control work-in-process inventory in a smart production system. Int. J. Prod. Res. 2021, 59, 1258–1280. [Google Scholar]
- Sarkar, B.; Omair, M.; Kim, N. A cooperative advertising collaboration policy in supply chain management under uncertain conditions. App. Soft Comput. 2020, 88, 105948. [Google Scholar] [CrossRef]
- Saha, S.; Chatterjee, D.; Sarkar, B. The ramification of dynamic investment on the promotion and preservation technology for inventory management through a modified flower pollination algorithm. J. Retail. Consum. Serv. 2021, 58, 102326. [Google Scholar] [CrossRef]
- Mishra, U.; Wu, J.Z.; Sarkar, B. Optimum sustainable inventory management with backorder and deterioration under controllable carbon emissions. J. Clean. Prod. 2021, 279, 123699. [Google Scholar] [CrossRef]
- Das, S.C.; Zidan, A.M.; Manna, A.K.; Shaikh, A.A.; Bhunia, A.K. An application of preservation technology in inventory control system with price dependent demand and partial backlogging. Alex. Eng. J. 2020, 59, 1359–1369. [Google Scholar]
- Dye, C.Y. The effect of preservation technology investment on a non-instantaneous deteriorating inventory model. Omega 2013, 41, 872–880. [Google Scholar]
- Chang, C.C.; Lu, C.J.; Yang, C.T. Multistage supply chain production-inventory model with collaborative preservation technology investment. Sci. Iran. 2022, 29, 2099–2114. [Google Scholar] [CrossRef]
- Tayal, S.; Singh, S.R.; Sharma, R. An integrated production inventory model for perishable products with trade credit period and investment in preservation technology. Int. J. Math. Oper. Res. 2016, 8, 137–163. [Google Scholar] [CrossRef]
- Giri, B.C.; Pal, H.; Maiti, T. A vendor-buyer supply chain model for time-dependent deteriorating item with preservation technology investment. Int. J. Math. Oper. Res. 2017, 10, 431–449. [Google Scholar] [CrossRef]
- Sarkar, B.; Debnath, A.; Chiu, A.S.; Ahmed, W. Circular economy-driven two-stage supply chain management for nullifying waste. J. Clean. Prod. 2022, 339, 130513. [Google Scholar] [CrossRef]
- Jauhari, W.A.; Pujawan, I.N.; Suef, M. A closed-loop supply chain inventory model with stochastic demand, hybrid production, carbon emissions, and take-back incentives. J. Clean. Prod. 2021, 320, 128835. [Google Scholar] [CrossRef]
- Daryanto, Y.; Wee, H.M.; Astanti, R.D. Three-echelon supply chain model considering carbon emission and item deterioration. Transp. Res. Part E Logist. Transp. Rev. 2019, 122, 368–383. [Google Scholar] [CrossRef]
- Kazemi, N.; Abdul-Rashid, S.H.; Ghazilla, R.A.R.; Shekarian, E.; Zanoni, S. Economic order quantity models for items with imperfect quality and emission considerations. Int. J. Syst. Sci. Oper. Logist. 2018, 5, 99–115. [Google Scholar] [CrossRef]
- Tiwari, S.; Daryanto, Y.; Wee, H.M. Sustainable inventory management with deteriorating and imperfect quality items considering carbon emission. J. Clean. Prod. 2018, 192, 281–292. [Google Scholar] [CrossRef]
- Wee, H.M.; Daryanto, Y. Imperfect quality item inventory models considering carbon emissions. Opt. Inventory Manag. 2020, 137–159. [Google Scholar]
- Salameh, M.K.; Jaber, M.Y. Economic production quantity model for items with imperfect quality. Int. J. Prod. Econ. 2000, 64, 59–64. [Google Scholar] [CrossRef]
- Sana, S.S. A production-inventory model of imperfect quality products in a three-layer supply chain. Decis. Support Syst. 2011, 50, 539–547. [Google Scholar] [CrossRef]
- Gautam, P.; Khanna, A. An imperfect production inventory model with setup cost reduction and carbon emission for an integrated supply chain. Uncertain Supply Chain Manag. 2018, 6, 271–286. [Google Scholar] [CrossRef]
- Khan, M.A.A.; Cárdenas-Barrón, L.E.; Treviño-Garza, G.; Céspedes-Mota, A.; de Jesús Loera-Hernández, I.; Smith, N.R. Inventory model for livestock farm under quantity discount, power demand, prepayment and carbon rules. J. Clean. Prod. 2024, 441, 140642. [Google Scholar] [CrossRef]
- Wang, M.; Ye, B.; Lin, S.; Wang, C.; Zhang, P. Sustainable supply chain planning with the flexible provisions of inter-period emission credits borrowing and banking under a multi-period carbon trading scheme. J. Clean. Prod. 2024, 445, 141406. [Google Scholar] [CrossRef]
- Zhang, Y.; Yang, R.; Shi, X.; Zhang, W. Operational strategies in a low-carbon supply chain considering the impact of carbon credit. J. Clean. Prod. 2024, 442, 141080. [Google Scholar] [CrossRef]
- Sarkar, B.; Mridha, B.; Pareek, S. A sustainable smart multi-type biofuel manufacturing with the optimum energy utilization under flexible production. J. Clean. Prod. 2022, 332, 129869. [Google Scholar] [CrossRef]
- Sarkar, B.; Tayyab, M.; Kim, N.; Habib, M.S. Optimal production delivery policies for supplier and manufacturer in a constrained closed-loop supply chain for returnable transport packaging through metaheuristic approach. Comput. Ind. Eng. 2019, 135, 987–1003. [Google Scholar] [CrossRef]
- Sarkar, M.; Sarkar, B. How does an industry reduce waste and consumed energy within a multi-stage smart sustainable biofuel production system? J. Clean. Prod. 2019, 262, 121200. [Google Scholar]
- Tayyab, M.; Jemai, J.; Lim, H.; Sarkar, B. A sustainable development framework for a cleaner multi-item multi-stage textile production system with a process improvement initiative. J. Clean. Prod. 2020, 246, 119055. [Google Scholar] [CrossRef]
- Chen, C.J.; Jain, N.; Yang, S.A. The impact of trade credit provision on retail inventory: An empirical investigation using synthetic controls. Manag. Sci. 2023, 69, 4591–4608. [Google Scholar]
- Singh, S.R.; Rana, K. A sustainable production inventory model for growing items with trade credit policy under partial backlogging. Int. J. Adv. Oper. Manag. 2023, 15, 64–81. [Google Scholar] [CrossRef]
- Garai, A.; Sarkar, B. Economically independent reverse logistics of customer-centric closed-loop supply chain for herbal medicines and biofuel. J. Clean. Prod. 2022, 334, 129977. [Google Scholar] [CrossRef]
- Sarkar, B.; Bhuniya, S. A sustainable flexible manufacturing–remanufacturing model with improved service and green investment under variable demand. Expert Syst. Appl. 2022, 202, 117154. [Google Scholar]
- Xia, L.; Hao, W.; Qin, J.; Ji, F.; Yue, X. Carbon emission reduction and promotion policies considering social preferences and consumers’ low-carbon awareness in the cap-and-trade system. J. Clean. Prod. 2018, 195, 1105–1124. [Google Scholar] [CrossRef]
- Yu, C.; Qu, Z.; Archibald, T.W.; Luan, Z. An inventory model of a deteriorating product considering carbon emissions. Comput. Ind. Eng. 2020, 148, 106694. [Google Scholar] [CrossRef]
| Authors | Demand Pattern | Deterioration | Preservation Technology | Carbon Emissions | Promotion |
|---|---|---|---|---|---|
| Saha et al. [24] | Price-wise, promotional, and trapezoidal type | Yes | Yes | No | Yes |
| Xia et al. [51] | Function of carbon emissions and promotion level | No | No | Yes | Yes |
| Gautam and Khanna [39] | Constant | No | No | Yes | No |
| Daryanto et al. [33] | Constant | Yes | No | Yes | No |
| Tayal et al. [29] | Constant | Yes | Yes | No | No |
| Chang et al. [28] | Constant | Yes | Yes | No | No |
| Dye [27] | Constant | Yes | Yes | No | No |
| Yu et al. [52] | Price- and stock-dependent | Yes | Yes | Yes | No |
| This paper | Price- and promotion-dependent | Yes | Yes | Yes | Yes |
| Notation | Definition |
| p | selling price (USD/unit) |
| ordering cost (USD/order) | |
| C | purchasing cost (USD/unit) |
| rate of deterioration without preservation technology | |
| holding cost (USD/unit/unit time) | |
| carbon emissions cost due to preservation (USD/unit) | |
| carbon emissions cost due to storage (USD/unit) | |
| carbon emissions cost due to transportation (USD/unit) | |
| fixed transportation cost (USD) | |
| deterioration cost (USD/unit) | |
| l | variable transportation cost (USD/unit) |
| distance in kilometers from supplier to retailer | |
| duration (in hours) for fixed transportation cost | |
| n | fraction of profit used in advertisement cost |
| advertisement elasticity | |
| efficiency of preservation technology | |
| M | permissible delay time |
| interest earned | |
| fraction of interest earned used in green technology investment | |
| total cost (USD/cycle) | |
| Decision variables | |
| T | cycle time (time unit) |
| P | preservation technology investment (USD) |
| Parameters | Values | Parameters | Values |
|---|---|---|---|
| p | 14 (USD/unit) | 100 (USD/unit) | |
| C | 5 (USD/unit) | 0.5 | |
| 1 (USD/unit/year) | 0.2 (USD/unit) | ||
| 0.2 (USD/unit) | 0.1 (USD/unit) | ||
| 70 (USD/order) | 10 (USD/unit) | ||
| l | 0.1 (USD/unit) | n | 0.02 |
| 1 | 0.4 | ||
| a | 8000 | 1 | |
| b | 7 | ||
| M | 0.02 | 0.03 | |
| 0.6 | M | 0.1 | |
| 0.01 |
| Parameter | Variation | TC (Change in %) | T (Years) | P (USD) |
|---|---|---|---|---|
| +50% | +0.35 | 0.0835 | 51.768 | |
| +25% | +0.18 | 0.0853 | 58.911 | |
| −25% | −0.18 | 0.08931 | 63.498 | |
| −50% | −0.36 | 0.09153 | 65.961 | |
| +50% | +2 | 0.09952 | 74.326 | |
| +25% | +1.5 | 0.09358 | 68.167 | |
| −25% | −1.13 | 0.0804 | 53.003 | |
| −50% | −1.9 | 0.0729 | 43.289 | |
| +50% | +0.07 | 0.0864 | 60.243 | |
| +25% | +0.03 | 0.0868 | 60.695 | |
| −25% | −0.03 | 0.0876 | 61.612 | |
| −50% | −0.07 | 0.088 | 62.077 | |
| +50% | +0.035 | 0.0868 | 60.695 | |
| +25% | +0.017 | 0.087 | 60.923 | |
| −25% | −0.01 | 0.0874 | 61.381 | |
| −50% | −0.04 | 0.0876 | 61.612 | |
| M | +50% | +0.43 | 0.0872 | 61.15 |
| +25% | +0.21 | 0.0872 | 61.15 | |
| −25% | −0.21 | 0.0872 | 61.15 | |
| −50% | −0.43 | 0.0872 | 61.15 | |
| +50% | +1.63 | 0.0723 | 91.96 | |
| +25% | +0.84 | 0.0787 | 74.19 | |
| −25% | −0.94 | 0.0993 | 50.85 | |
| −50% | −2 | 0.1187 | 42.32 | |
| +50% | +2.63 | 0.0723 | 93.96 | |
| +25% | +1.84 | 0.0687 | 76.19 | |
| −25% | −1.94 | 0.0893 | 53.85 | |
| −50% | −2.5 | 0.1087 | 45 |
| TC (USD) | |
|---|---|
| 0.1 | 50,767.365 |
| 0.2 | 50,771.631 |
| 0.3 | 50,775.896 |
| 0.4 | 50,780.162 |
| 0.5 | 50,784.43 |
| 0.6 | 50,788.694 |
| 0.7 | 50,792.96 |
| 0.8 | 50,797.225 |
| 0.9 | 50,801.491 |
| 1 | 50,805.76 |
Disclaimer/Publisher’s Note: The statements, opinions and data contained in all publications are solely those of the individual author(s) and contributor(s) and not of MDPI and/or the editor(s). MDPI and/or the editor(s) disclaim responsibility for any injury to people or property resulting from any ideas, methods, instructions or products referred to in the content. |
© 2025 by the authors. Licensee MDPI, Basel, Switzerland. This article is an open access article distributed under the terms and conditions of the Creative Commons Attribution (CC BY) license (https://creativecommons.org/licenses/by/4.0/).
Share and Cite
Yadav, S.; Pareek, S.; Sarkar, M.; Ma, J.-H.; Ahn, Y.-H. A Retail Inventory Model with Promotional Efforts, Preservation Technology Considering Green Technology Investment. Mathematics 2025, 13, 1065. https://doi.org/10.3390/math13071065
Yadav S, Pareek S, Sarkar M, Ma J-H, Ahn Y-H. A Retail Inventory Model with Promotional Efforts, Preservation Technology Considering Green Technology Investment. Mathematics. 2025; 13(7):1065. https://doi.org/10.3390/math13071065
Chicago/Turabian StyleYadav, Sunita, Sarla Pareek, Mitali Sarkar, Jin-Hee Ma, and Young-Hyo Ahn. 2025. "A Retail Inventory Model with Promotional Efforts, Preservation Technology Considering Green Technology Investment" Mathematics 13, no. 7: 1065. https://doi.org/10.3390/math13071065
APA StyleYadav, S., Pareek, S., Sarkar, M., Ma, J.-H., & Ahn, Y.-H. (2025). A Retail Inventory Model with Promotional Efforts, Preservation Technology Considering Green Technology Investment. Mathematics, 13(7), 1065. https://doi.org/10.3390/math13071065


