Abstract
In Industry 4.0, predictive maintenance (PdM) is key to optimising production processes. While its popularity among companies grows, most studies highlight theoretical benefits, with few providing empirical evidence on its economic impact. This study aims to fill this gap by quantifying the economic performance of manufacturing companies in the Visegrad Group countries through PdM algorithms. The purpose of our research is to assess whether these companies generate higher operational profits and lower sales costs. Using descriptive statistics, non-parametric tests, the Hodges–Lehmann median difference estimate, and linear regression, the authors analysed data of 1094 enterprises. Results show that PdM significantly improves economic performance, with variations based on geographic scope. Regression analysis confirmed PdM as an essential predictor of performance, even after considering factors like company size, legal structure, and geographic scope. Enterprises with more effective cost management and lower net sales were more likely to adopt PdM, as revealed by decision tree analysis. Our findings provide empirical evidence of the economic benefits of PdM algorithms and highlight their potential to enhance competitiveness, offering a valuable foundation for business managers to make informed investment decisions and encouraging further research in other industries.
Keywords:
predictive maintenance; internet of robotic things; industry 4.0 manufacturing; artificial intelligence digital twin technologies MSC:
62H10; 62J05
1. Introduction
The concept of Industry 4.0 has significantly transformed the manufacturing sector in recent decades. The complexity of manufacturing equipment has increased due to the increasing number of components, which has also exacerbated the challenges associated with maintenance. In order to mitigate unanticipated failures or downtimes, it is advantageous for organisations to implement continuous monitoring of such intricate systems. The rapid technological advancements brought about by big data-driven Industry 4.0 manufacturing systems have not only introduced new possibilities in maintenance and technical condition prediction but have also provided companies with new ways to monitor the condition and diagnose the health of equipment. PdM is a significant trend that is currently emerging in this context [1]. Traditional maintenance methods, including reactive and preventive maintenance, were employed by companies until recently. Nevertheless, these conventional methods are linked to inefficiencies in the management of production processes. The risks of unexpected downtimes and financial losses are significantly increased by reactive maintenance, which concentrates on repairs only after a failure has occurred. On the other hand, preventive maintenance frequently results in high costs and unnecessary component replacements, despite its ability to prevent breakdowns. In this context, PdM is a solution that integrates predictive capabilities with efficiency [2,3]. The primary advantages of PdM algorithms are the reduction in overall operational costs and the optimisation of equipment utilisation, which results in extended equipment lifespans [4]. PdM, the most sophisticated maintenance approach, is built upon sophisticated machine learning algorithms that serve as the foundation for precise fault diagnostics and predictions [5]. The Internet of Robotic Things (IoRT) is also essential, as it enables the continuous monitoring of manufacturing processes through sensor networks and big data analytics [6]. An active area of research is the quantification of the economic performance of enterprises as a result of PdM algorithms and artificial intelligence digital twin technologies. Research has shown that PdM has a direct impact on business competitiveness by significantly reducing maintenance costs and improving operational efficiency [7,8]. Furthermore, PdM contributes to the reduction in defective products, which in turn results in an increase in customer satisfaction [9,10]. However, PdM implementation poses numerous substantial obstacles, despite its numerous benefits. High costs are the initial significant obstacle. Companies that implement PdM algorithms and artificial intelligence digital twin technologies must incur substantial upfront expenses, as it is imperative to not only acquire PdM solutions but also integrate them with existing systems. This frequently necessitates substantial investments in the development of a comprehensive sensor infrastructure. Additionally, organisations may encounter an absence of expertise among their personnel during the implementation phase. Finally, organisations must resolve concerns regarding predictive models’ dependability [11,12,13]. In this investigation, the economic advantages of PdM algorithms in manufacturing enterprises that operate within the Visegrad Group (V4) countries are examined. Based on 1094 enterprise data, this investigation inspects the influence of PdM on the cost of goods sold and the operating profit. This study employs linear regression, descriptive analysis, non-parametric tests, and the Hodges–Lehmann median difference estimation to quantify this effect. This investigation also inspects the factors that may have influenced companies to implement PdM algorithms and contrasts those that have and those that have not. The results emphasise the significance of PdM in the manufacturing sector, offer managerial assistance in determining its implementation, and establish the foundation for additional academic research. The research gap this study addresses resides in the lack of empirical evidence on the economic benefits of PdM algorithms in manufacturing enterprises within the V4 countries. While PdM is widely acknowledged for its potential to enhance operational efficiency, the existing literature primarily focuses on case studies, theoretical models, or broader industry-level analyses without region-specific insights.
This paper is divided into several sections. The Section 2 summarises the most recent and relevant studies related to the research issue. The Section 3 describes the data acquisition and selection process as well as the description of the methodological steps of the analysis. The outputs of various methods and tests are presented in the Section 4, and the findings are further compared and analysed in the Section 5. A summary of the results and analysis is included in the Section 6, while the last section covers theoretical and practical implications, together with limitations and further directions of research.
2. Literature Review
In today’s dynamic business environment, maintenance has become a widely discussed topic. It is not only addressed by the academic community but also by representatives from a wide range of industrial sectors. In terms of cost-saving potential, maintenance is one of the most critical factors for manufacturing [14]. Nevertheless, the concept of maintenance is delineated in a variety of ways. Maintenance contributes to increased customer satisfaction, enhances performance levels, affects production quality and volume, and helps preserve asset value [15]. This suggests that maintenance is no longer solely concerned with resolving machine malfunctions or failures. Rather, it is perceived as a strategic instrument for the enhancement of efficiency and the optimisation of processes [16]. The emergence of big data-driven Industry 4.0 manufacturing systems and the continuous development of innovative technologies have been the driving forces behind this transformation [17,18].
Enterprises were primarily characterised by reactive maintenance during the initial stages of industrialisation [19]. This method has been found to be inefficient as industrial complexity has increased, because it involves responding to machine issues only after they have occurred [20]. Reactive maintenance is primarily employed by manufacturing companies that are unable to retain a skilled maintenance workforce and lack sufficient staff [21]. Preventive maintenance emerged as a more proactive alternative to the costly and inefficient reactive maintenance approach. Its objective is to conduct routine inspections and servicing of equipment to avert potential failures before they occur [22]. This form of maintenance has been widely implemented by organisations due to its ability to facilitate the early identification and resolution of issues, thereby reducing the likelihood of equipment failures and extending its lifespan [23].
Maintenance has undergone a significant transformation as a result of the development of breakthrough technologies and the introduction of big data-driven Industry 4.0 manufacturing systems. PdM is currently regarded as the most sophisticated form of maintenance, having emerged as a consequence of the adoption of new technologies [19]. Technologies that facilitate PdM include artificial intelligence (AI), the IoRT, big data analytics, and digital twins. PdM is increasingly becoming a critical component of industrial strategies as a result of the utilisation of these intelligent tools [24]. The foundational layer is the IoRT, which is composed of networks of numerous sensors that collect real-time operational data from machines for digital entrepreneurial self-efficacy [25,26]. The data that are collected are subsequently transmitted through communication protocols for further analysis [27].
The massive influx of data from the IoRT is processed by big data analytics, which identifies patterns and anomalies (Figure 1). Potential failures or equipment issues that pose significant risks to businesses can be identified based on these patterns [28]. By employing machine learning algorithms, artificial intelligence significantly improves analytical processes. These algorithms make a substantial contribution to the advancement of predictive models by consistently enhancing their accuracy over time [29].
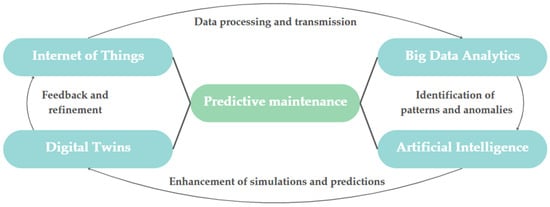
Figure 1.
PdM schema in the context of Industry 4.0. Source: the authors’ compilation.
Cognitive manufacturing systems are significantly influenced by digital twins [30] that facilitate real-time decision-making processes and enable simulations [31]. The integration of digital twins into cyber–physical systems furthers industries to utilise vast amounts of data for resource optimisation and decision-making, thereby enhancing predictive capabilities [32].
Businesses regard the principle of maintenance as an inevitability that must be executed solely when production ceases [33]. In an industrial setting, forced maintenance results in a substantial increase in operational costs, which can account for approximately 15% to 60% of total manufacturing expenses [34]. In this context, Meddaoui et al. [5] emphasise the benefits of PdM associated with reducing downtime and costs based on a case study and enhancements in product quality. Franco and de Figueiredo [35] and Scaife [36] focus on the continuous monitoring of equipment and the analysis of historical data, as these methods allow for the real-time prediction of potential failures prior to their occurrence. The risks associated with unplanned production shutdowns are reduced through the early detection of faults. Furthermore, the reliability of manufacturing equipment is improved by timely servicing [37]. A survey on the adoption of PdM among companies in Slovenia indicates that PdM increases customer satisfaction by extending the lifespan of equipment, reducing maintenance costs, and improving overall manufacturing efficiency. Ultimately, this results in higher-quality products [9]. Companies can reduce total maintenance costs by 5% to 10%, increase equipment uptime by 10% to 20%, and shorten maintenance planning time by 20% to 50% by implementing PdM [38,39]. The significance of PdM algorithms in the pursuit of manufacturing excellence is substantiated by the aforementioned advantages. A wide range of industries, such as aerospace, energy, healthcare, telecommunications, manufacturing, and the automotive sector, are interested in the significant potential of PdM [40,41]. This emphasises the transformative power and complexity of PdM algorithms in contemporary industrial strategies [42,43]. Nevertheless, it is imperative to recognise the obstacles and concerns that are linked to PdM algorithms, artificial intelligence digital twin technologies, and IoRT in big data-driven Industry 4.0 manufacturing systems, as they impede the widespread adoption of cutting-edge tools across various sectors. The processing of vast amounts of sensor-generated data are highly demanding [44]. This is due to the fact that, in many cases, these data contain noise or errors, which significantly affect the accuracy of equipment condition forecasts and negatively impact predictive models. Another obstacle is the phenomenon of “catastrophic forgetting” [45]. The data that represent the current state of equipment are used to train machine learning models that are used for PdM algorithms. Nevertheless, the usage patterns of equipment may evolve as it ages. This can result in inaccurate or misleading predictions [12]. In the final analysis, “catastrophic forgetting” entails that the model forgets the information it acquired from prior data and commences to commit errors [46]. PdM is also linked to economic concerns, in addition to technological obstacles. The high financial costs and organisational barriers that restrict its widespread adoption are underscored [47]. The technological infrastructure, which includes IoRT sensors, cloud systems, and artificial intelligence digital twin technologies, and the necessary capital to invest in PdM algorithms, may be lacking in many companies. Giada and Rossella [48] propose that companies should establish a model for assessing economic return prior to implementation, irrespective of the complexity of determining all costs and benefits, in response to this economic issue. Figure 2 illustrates the inconsistent market development across various regions and presents regional differences in the adoption of PdM algorithms. With a 34.81% market share in 2022, North America was the dominant region in the PdM industry. The widespread implementation of innovative and advanced technologies in North America is the cause of this strong dominance. In contrast, the Asia-Pacific region’s PdM market is anticipated to reach the highest compound annual growth rate (CAGR) by 2030, as a result of the diverse expansion of small and medium-sized industrial sectors [49].

Figure 2.
The inconsistent market development across a variety of regions. Source: the authors’ compilation according to [49].
The authors have also discovered that, despite the substantial interest in PdM, there is a limited number of empirical studies that have been conducted to directly confirm the theoretically described benefits and challenges of PdM algorithms, artificial intelligence digital twin technologies, and IoRT in big data-driven Industry 4.0 manufacturing systems. This is based on the literature review that was conducted. The most significant empirical research conducted, as well as the key findings, are summarised in Table 1.

Table 1.
The most significant empirical research on PdM.
These studies underscore the importance of PdM algorithms in big data-driven Industry 4.0 manufacturing systems, which utilise technologies such as IoRT, big data, and digital twins to facilitate more intelligent manufacturing. Digital twin technology is emphasised as a critical instrument for estimating the remaining useful life (RUL) of machinery, thereby enhancing the accuracy of maintenance. Real-time fault detection is facilitated by multisource heterogeneous data and machine learning, which also optimises energy efficiency and scheduling in production. The research also emphasises a transition to multi-model approaches, which improve the diagnostics and prognostics of intricate industrial systems. In general, PdM algorithms, artificial intelligence digital twin technologies, and thee IoRT in big data-driven Industry 4.0 manufacturing systems are advancing through the implementation of sophisticated data-driven methodologies, which are designed to reduce downtime and enhance manufacturing efficiency.
3. Material and Methods
Data Acquisition: the Orbis Database, which contains comprehensive information on manufacturing companies in numerous countries, was the source of the data used in this study. In total, 5504 large and very large companies from V4 countries were included in the dataset: Slovakia (SK) with 598 companies, Czech Republic (CZ) with 1195 companies, Poland (PL) with 2922 companies, and Hungary (HU) with 789 companies. The size distribution of companies was also assessed prior to data processing in order to ensure the representativeness of the sample and the methodological consistency of the analysis. The companies were categorised based on the criteria of the Orbis database. The proportional representation of these size categories varied across the analysed countries and has been considered in the phase of sample selection.
Selection of Samples: a Python 3.12.7 script was employed to randomly select a sample of 1094 companies for analysis. This script was executed within the Jupyter Notebook 7.2.2 environment. A stratified random sampling method was employed to ensure the representativeness of the sample. The stratification was determined by two primary factors: the distribution of companies by country and by company size within each country. The country-level stratification was applied using the following proportions: 30% of Slovak companies, 20% of Czech companies, 15% of Polish companies, and 30% of Hungarian companies. Simultaneously, the proportional representation of large and very large companies within each country was preserved in accordance with their distribution in the overall population. As the Python script randomly selected company identification numbers for inclusion in the sample, it ensured that both country and size distributions accurately reflected the general structure of the analysed companies. The proportional distribution of companies in the sample was intended to ensure that it remained consistent with the overall distribution of manufacturing companies across the V4 countries. The direct proportional sampling approach would have generated an excessively large dataset, which would have increased the computational complexity and time required for the analysis, as the total number of companies in Poland is substantially greater than that of other V4 countries. In order to guarantee methodological feasibility and maintain the relative representation of corporations across countries, the sample was formed using predetermined proportions that correspond to the general structure of the population. This method was able to maintain the fundamental characteristics of the original distribution while allowing for a manageable dataset.
Utilisation of PdM Identification: a Python script was employed to search the annual reports for the years 2018, 2019, and 2020 in order to ascertain whether a company employed PdM. The search was conducted using keywords such as “Predictive Maintenance” and “PdM.” This analysis does not incorporate annual reports from 2021 and 2022. The primary reason for the exclusion of these reports was to guarantee that the analysis accurately represented the impact of PdM algorithms over a minimum of three years. The results may have been distorted if a company implemented PdM in 2021 or 2022, as its effects may not have been fully observable by 2023. Consequently, the decision was made to concentrate on the 2018–2020 reports in order to guarantee a more comprehensive understanding of the long-term consequences of PdM implementation. The sample contains companies classified by country, company size, and the use of PdM.
Dataset, Variables, and Methods: the variables utilised in the analysis, along with their units of measurement and notation, are summarised in Table 2. The categorical variable Country (X14) takes 4 variations, namely Czech Republic, Hungary, Poland, and Slovakia. There are three variations of the categorical variable Legal form (X15): public limited companies, private limited companies, and partnerships. Company size (X16) is regarded as a binary variable since the dataset contains only large and very large companies. Date of incorporation (X17) is a nominal variable that contains only the year. PdM (X18) specifies whether PdM algorithms have been implemented by the company. This variable is binary in nature, accepting only values of 0 and 1. Companies that have not implemented PdM are represented by a value of 0, while companies that have implemented PdM between 2018 and 2020 are represented by a value of 1. The data were collected from 2018 to 2023, and all analyses are based on this timeframe, with the exception of the decision tree model, which is based on the period from 2018 to 2020. This study implements a variety of statistical methodologies, utilising IBM SPSS 27 and Python 3.12.7 in the Jupyter Notebook 7.2.2 environment. For all statistical tests and regression analyses, the significance level was set at 5%, and all p-values were evaluated against this threshold.
Table 2.
Overview of variables.
Descriptive Analysis: the first step was descriptive analysis, which provided a basic comparison between companies using PdM and those that have not implemented PdM. The authors focused on two key indicators that best reflect company performance:
- Operating profit (reflects the company’s efficiency in managing revenue and costs);
- Cost of goods sold (COGS) (indicator of the efficiency of production and logistics processes).
Each indicator was processed as follows: the average and median values, along with the coefficients of variation, were calculated for each country and for the groups of companies that use PdM and those that do not use PdM. The goal of the descriptive analysis was to provide an initial overview of the potential benefits of PdM algorithms in companies.
Normality test: next, it was necessary to test the statistical significance of these differences, after checking the normality of the data, i.e., whether the values of operating profit and COGS come from a normal distribution. To verify normality, the Kolmogorov–Smirnov test was used, as it is suitable for large datasets. The test confirmed that the data do not follow a normal distribution.
Mann–Whitney test: as the data do not follow a normal distribution, the Mann–Whitney test was used. To test the statistical significance of the differences between companies with PdM and without PdM, the Mann–Whitney test, which is suitable for comparing two independent groups with an unknown data distribution, was applied. This test was used for the following:
- Operating profit, where the results showed significantly higher values for companies with PdM;
- Cost of goods sold, where companies with PdM showed significantly lower values for this indicator.
The goal of this analysis was to statistically confirm whether there are significant differences in the operating profit and COGS between companies that implemented PdM and those that did not.
Kruskal–Wallis test: since the Mann–Whitney test only assessed global, overall differences, for a more detailed comparison between V4 countries, the Kruskal–Wallis test was used. This test allowed us to accomplish the following:
- Identify whether the effects of PdM differ across countries;
- Find out in which countries the differences between companies with PdM and without PdM are statistically significant.
Hodges–Lehmann median difference estimate: to obtain a precise expression of the magnitude of differences between companies with PdM and without PdM, the Hodges–Lehmann median difference estimate was applied. This method was selected for its robustness and suitability for non-normally distributed data, giving it an appropriate alternative to traditional parametric methods. The applied estimate provided the following:
- A quantitative measure of the impact of PdM on operating profit and COGS;
- A more accurate empirical determination of the differences between the countries analysed.
Regression analysis: to identify the factors that most significantly influence the operating profit of companies, the linear regression model was created. The dependent variable in the model was operating profit, and the set of independent variables consisted of six predictors, including an interaction effect between long-term tangible assets and added value. To ensure methodological rigor, a multicollinearity diagnostic check was incorporated. Variance inflation factors were computed to verify that the explanatory variables were not excessively correlated. The regression analysis was designed to assess the extent to which PdM algorithms affect company performance and to determine whether the impact remains substantial even after accounting for other variables.
Decision tree: as the final step, the decision tree method was conducted to analyse the key factors influencing companies’ decisions to implement PdM. This technique is part of supervised machine learning methods that identify patterns in data. The objective of the analysis was to determine which combinations of economic factors were most strongly associated with the implementation of PdM in companies between 2018 and 2020. The target variable was a binary indicator of PdM implementation (0 = not implemented; 1 = implemented). A wide range of economic indicators were included that could influence a company’s decision to implement PdM as explanatory variables. To train the decision tree, the CART (Classification and Regression Trees) algorithm was used, which splits the data based on optimal threshold values of explanatory variables.
The following section introduces step-by-step overview of the analysis to provide a structured and comprehensive explanation of the research process.
- Data acquisition and sample selection—data were extracted from the Orbis database, which covered 5504 large and very large companies from V4 countries. A final dataset of 1094 companies was obtained by employing a stratified random sampling method. The sample was proportionally stratified based on country and company size to maintain representativeness;
- Utilisation of PdM identification—the annual reports were examined using a Python script to identify any mentions of “Predictive Maintenance” or “PdM.” Only annual reports from 2018 to 2020 were included to ensure that at least three years of data were available for assessing the impact of PdM. The classification of companies was determined by their adoption of PdM (0 indicates that it has not been implemented, while 1 indicates that it has been implemented);
- Descriptive and statistical analysis—key performance indicators (operating profit and COGS) were compared between PdM adopters and non-adopters. The Kolmogorov–Smirnov test verified that the data were not normally distributed. The economic performance of PdM and non-PdM companies was analysed through the Mann–Whitney test. The impact of PdM was evaluated across various V4 countries using the Kruskal–Wallis’s test. The impact’s magnitude was quantified using the Hodges–Lehmann median difference estimate;
- Regression analysis—in order to ascertain the primary economic variables that affect operating profit, a linear regression model was implemented. An interaction term between long-term tangible assets and added value was included, in addition to independent variables. To confirm that there was no multicollinearity, the variance inflation factor was checked. In order to determine whether PdM had a significant effect on company performance, the model was evaluated at a 5% significance level;
- Decision tree model for PdM adoption analysis—the CART algorithm was employed to develop a decision tree model. The target variable was the implementation of PdM (0 = no; 1 = yes). The most influential factors for the implementation of PdM were identified by incorporating a set of economic variables (X1–X17). The data were divided by the decision tree according to the most optimal threshold values, which enabled the identification of patterns in the decisions of companies.
4. Results
Table 3 presents a summary of the total number of manufacturing companies (NACE Rev. 2 Section C) in the Orbis database for V4 countries, as well as details regarding the sample of companies that were analysed for this study. The sample is stratified by the countries of operation (Slovakia, Czech Republic, Poland, and Hungary), size (large and very large), and whether PdM is implemented. Of the 1094 companies in the sample, 307 have implemented PdM, which accounts for approximately 28.06%. The proportion of companies that implemented PdM was highest among very large companies in Poland (34.45%), while the lowest proportion was observed among large companies in Hungary (22.67%). Initially, it is possible to discern minor variations in the implementation of PdM among countries and companies of varying sizes. These distinctions serve as the foundation for a more comprehensive examination of the variables that influence the implementation of PdM within organisations.
Table 3.
Distribution of companies by size classification and application of PdM.
The descriptive analysis of two critical factors for companies, operating profit and cost of goods sold, was the primary focus of the initial phase. These factors were selected due to their relevance in evaluating the overall efficiency of operational processes within organisations. The descriptive statistics for the operating profit of companies are summarised in Table 4. It demonstrates that the average operating profits of companies that implement PdM algorithms are higher in all of the countries that have been analysed. In the Czech Republic, PdM has the most substantial impact, resulting in an operating profit increase of EUR 5602.31 thousand for companies that implement it in comparison to those that do not. Additionally, the median values, which provide a robust measure less affected by outliers, reveal a similar trend, highlighting higher operating profits for PdM adopters across all analysed countries. In other countries that were analysed, a comparable trend was observed, albeit with a slightly smaller impact of PdM usage. The utilisation of PdM had the least significant impact in Poland, where companies that employ PdM experience an average increase in operating profit of EUR 3318.96 thousand. This discovery implies that the utilisation of PdM has the capacity to substantially enhance company performance by increasing operating profits.
Table 4.
Descriptive statistics—operating profit.
The cost of goods sold was analysed using the same methodology. Table 5 displays the descriptive statistics that were generated for this factor. The table indicates that the average COGS of companies that employ PdM algorithms is lower in all of the countries that were analysed. The Czech Republic is the location where the most substantial distinction between companies with and without PdM is observed. In this country, the average cost of goods sold is EUR 32,513.93 thousand lower for companies that employ PdM than for those that do not. The second largest decrease in costs is observed in Poland, where companies with PdM report an average COGS of EUR 20,667.87 thousand lower. In Slovakia, the disparity is EUR 16,670.11 thousand. The median values confirm this trend, further demonstrating that companies with PdM consistently achieve lower costs of goods sold across all analysed countries. Nevertheless, Hungary’s performance in international comparisons is the most subpar, as Hungarian companies that implement PdM have an average COGS that is only EUR 5226.98 thousand lower. This is the most minor discrepancy among the countries that were analysed. The variability of COGS is higher among non-PdM companies, as evidenced by the standard deviations.
Table 5.
Descriptive statistics—cost of goods sold.
The descriptive analysis demonstrated that the average operating profit and cost of goods sold of companies with and without PdM were distinct. Consequently, the second phase of the analysis investigated the statistical significance of these company group differences. In order to ascertain the appropriate parametric or non-parametric test, it was imperative to evaluate the normality of the data distribution for both factors prior to conducting the test. The Kolmogorov–Smirnov test evaluated normality in relation to the size of the sample (Table 6). The data are not normally distributed, as the p-value for operating profit and cost of goods sold is less than 0.001 at 5%.
Table 6.
Normality test of selected variables.
The non-parametric Mann–Whitney test was employed to evaluate the significance of the differences between the groups of companies with PdM and those without PdM, as our data do not follow a normal distribution. This test is an exceptional instrument for comparing the medians of two distinct groups. In this instance, the two distinct groups correspond to organisations that implement PdM and those that do not. The Mann–Whitney test is a reliable method for evaluating the differences between these independent groups and is resistant to violations of the normality assumption. Table 7 displays the operating profit test results. Companies that implement PdM (mean rank 632.97) exhibit a higher median operating profit than those that do not (mean rank 514.16). The statistical significance of this difference at the 5% significance level is confirmed by the test statistic Z = −5.588 and a p-value < 0.001. The results corroborate the hypothesis that companies can increase their operating profits by implementing PdM.
Table 7.
Mann–Whitney test—operating profit.
The Mann–Whitney test results for cost of goods sold are summarised in Table 8. It shows that companies that implement PdM achieve lower medians of COGS (mean rank 511.28) than those that do not (mean rank 561.23). In the same vein, the statistical significance of the difference at the 5% significance level is confirmed by the test statistic Z = −2.368 and a p-value of 0.018. The theory that companies can reduce their cost of goods sold by implementing PdM is further supported by the lower mean rank of the group of companies using PdM algorithms.
Table 8.
Mann–Whitney test—cost of goods sold.
The results of the Mann–Whitney test are closely correlated with the results of descriptive statistics, which indicated that the average operating profit and average cost of goods sold were higher for companies that utilised PdM algorithms in all analysed countries. Nevertheless, this test did not ascertain whether the disparities in operating profit and cost of goods sold between companies with and without PdM are statistically significant within individual V4 countries. Consequently, the Kruskal–Wallis’s test was chosen enabling the determination of statistical significance between the analysed V4 countries. Table 9 displays the operating profit results of the Kruskal–Wallis’s test. The p-value was less than the established 5% significance level in three V4 countries: Czechia, Hungary, and Poland, indicating statistically significant differences. In contrast, Slovakia did not exhibit a statistically significant difference between companies that had PdM and those that did not (p-value = 0.282). This implies that there are no substantial distinctions between the various ethnic groups in this nation. The analysis may be somewhat restricted by the lower number of companies in Slovakia that utilise PdM, which may account for this absence. Conversely, it is possible that Slovak companies are not yet fully capitalised on the potential of PdM algorithms, or they may need a longer time frame to demonstrate more substantial economic disparities. The results on a global scale suggested that the relationship between PdM implementation and performance, as measured by operating profit, may be influenced by geographical factors and the local company environment.
Table 9.
Kruskal–Wallis—operating profit.
The Kruskal–Wallis test was also employed to investigate the costs of goods sold in the individual V4 countries between companies that utilised and did not utilise PdM. The statistical significance of the differences in the cost of goods sold in the Czech Republic (p-value = 0.032), Poland (p-value = 0.007), and Slovakia (p-value = 0.003) at the established significance level of 5% was confirmed by the results in Table 10. It is evident that PdM has a substantial effect on the reduction in sales costs in these three V4 countries. The only country in which statistically significant differences (p-value = 0.820) between companies with and without PdM were not confirmed was Hungary. This conclusion can also be drawn from the descriptive analysis, which revealed that Hungarian companies that implemented PdM did not exhibit any substantial disparities in their average sales costs when contrasted with those that did not. In general, the low significance of this economic indicator in the Hungarian business environment suggests that PdM has a weaker impact. The results indicate that the cost of goods sold in specific geographical areas can be significantly and positively impacted by the implementation of PdM from a global perspective. Nevertheless, this effect is also contingent upon the diverse cost structures of companies in various countries and the local conditions.
Table 10.
Kruskal–Wallis—cost of goods sold.
It was possible to determine the statistical significance of the differences in operating profit and cost of goods sold between companies that were using PdM and those that were not in the individual V4 countries using the Kruskal–Wallis’s test. Nevertheless, it did not offer a precise quantitative representation of the distinctions between these two categories of companies. As a result, the Hodges–Lehmann estimate of the median difference was employed. This test is capable of numerical quantification of the effect of PdM implementation on the two selected key economic performance indicators. The Hodges–Lehmann method enables a more precise representation of the discrepancies in the centre of the distribution of both examined indicators between the analysed groups of companies. This method is renowned for its reliable estimates, as it is not affected by outliers or extreme values in the data.
Table 11 presents the separate results of the Hodges–Lehmann median difference estimates for operating profit and cost of goods sold for each analysed country. The Czech Republic recorded the highest median difference (EUR 2198.17 thousand) in the operating profit estimates, underscoring the substantial and advantageous impact of PdM on this metric in that nation. The median difference in Slovakia is the lowest at EUR 403.10thousand, which is at the opposite end of the spectrum. These quantitative findings provide a novel perspective on the impact of PdM usage and substantiate the findings of the Kruskal–Wallis’s test that revealed statistically significant differences in operating profit only in the Czech Republic, Hungary, and Poland, while no significant differences were observed in Slovakia (p-value = 0.282).
Table 11.
Hodges–Lehmann—intervals.
In the same vein, median interval estimates were implemented for the cost of goods sold. It was discovered that Slovakia and Czechia experienced the most significant median cost reductions for companies that implemented PdM (EUR −8355.49 thousand and EUR −7581.25 thousand, respectively). In Hungary, the most minimal and nearly negligible effect was observed, with a median reduction in cost of goods sold of EUR −51.39 thousand for companies that implemented PdM in comparison to those that did not. And again, the Hodges–Lehmann median difference estimates are consistent with the Kruskal–Wallis test results in this instance, as only the Czech Republic, Poland, and Slovakia exhibited statistically significant differences. These discrepancies were classified as statistically insignificant in Hungary (p-value = 0.820).
The Hodges–Lehmann estimates consistently complemented the Kruskal–Wallis’s test results by providing direct quantitative evidence of the economic benefits of PdM algorithms, artificial intelligence digital twin technologies, and the IoRT in big data-driven Industry 4.0 manufacturing systems. The estimates not only illustrate the existence of disparities between countries and groups of companies with and without PdM, but they also supply a reliable representation of the effect of PdM usage on the operating profit and cost of goods sold. The findings of this study are a substantial addition to the current analysis and can also serve as an incentive for additional research on the effects of PdM implementation in organisations.
The quantification of the differences between companies that use and do not use PdM provided valuable insights into the dissimilarities in operating profit and cost of goods sold. Nevertheless, the objective of our analysis was to investigate the influence of individual factors on the performance of the company. Consequently, a linear regression model was developed. It could identify the factors that have the most substantial influence on operating profit as the key performance indicator. This implies that the dependent or target variable in our model was operating profit. Table 12 provides a concise summary of the model’s quality.
Table 12.
Regression—model summary.
The coefficient of determination was relatively high for the model (adjusted R² = 0.872). This suggests that the independent variables account for up to 87.2% of the variability in operating profit among the analysed companies. The statistical significance of the model (p-value = 0.000) at the 5% significance level was confirmed by the ANOVA test, as shown in Table 13. Consequently, the model is suitable for interpretation.
Table 13.
Regression—ANOVA.
Table 14 illustrates the regression model that was generated. One of the six independent variables in the model is an interaction between long-term tangible assets and value added. The model does not exhibit multicollinearity between the independent variables, as the variance inflation factor (VIF) values are all less than 5. Additionally, all independent variables in the model are statistically significant, as they achieve p-values that are below the established 5% significance level. The reference categories for the dummy variables were determined as follows:
- Country—the Czech Republic;
- Company legal structure—public limited companies;
- Company size—very large companies;
- Utilisation of PdM—companies that implemented PdM.
Table 14.
Regression—coefficients.
Table 14.
Regression—coefficients.
| Unstandardised Coefficients | Sig. | Collinearity Statistics | |||
|---|---|---|---|---|---|
| B | Std. Error | Tolerance | VIF | ||
| Constant | 28,138.99 | 2561.00 | <0.001 | ||
| Country = SK | −4806.18 | 2311.35 | 0.038 | 0.866 | 1.155 |
| Country = PL | −5212.78 | 1795.29 | 0.004 | 0.822 | 1.217 |
| Legal form = Private limited companies | −6917.01 | 1911.47 | <0.001 | 0.916 | 1.091 |
| Company size = Large company | −14,206.46 | 1829.42 | <0.001 | 0.961 | 1.041 |
| PdM = No | −5071.42 | 1780.26 | 0.004 | 0.994 | 1.006 |
| Added Value*Tangible Fixed assets | 0.227 | 0.001 | 0.000 | 0.921 | 1.127 |
Source: authors’ compilation.
The structure of the regression equation is as follows:
Each of the coefficients in the regression equation represents the change in the dependent variable, which is operating profit, when the given independent variable changes, assuming that all other variables remain unchanged. The interpretation of the coefficients is as follows. The constant (28,138.99) indicates that if all independent variables take their reference values (i.e., it is a very large company using PdM, located in the Czech Republic with the legal form of a public limited company), the expected operating profit for this company would be EUR 28,138.99 thousand. For companies in Slovakia, the operating profit is, on average, EUR 4806.18 thousand lower compared to companies in the Czech Republic. Similarly, the operating profit of companies in Poland is, on average, EUR 5212.78 thousand, lower compared to companies in the Czech Republic. Companies with the legal form of private limited companies show, on average, EUR 6917.01 thousand lower operating profit compared to public limited companies. Large companies show, on average, EUR 14,206.46 thousand lower operating profit compared to very large companies. Companies that have not implemented and do not use PdM have, on average, EUR 5071.42 thousand lower operating profit compared to companies that have implemented PdM. Finally, an increase in the interaction effect between added value and fixed assets by one unit (EUR thousand) is associated with an increase in operating profit by EUR 0.227 thousand.
The results of the regression model confirmed the huge significance of implementing PdM for companies. Companies that do not use PdM have lower operating profits compared to companies that actively use PdM algorithms. The effect of PdM on the economic performance of companies remained consistent even after considering other factors. The model also revealed differences between the analysed countries and types of companies, reflecting that national and organisational characteristics play a significant role in determining the final impact of PdM on companies’ economic performance.
The current analysis confirmed that PdM algorithms, artificial intelligence digital twin technologies, and the IoRT in big data-driven Industry 4.0 manufacturing systems have a positive effect on the economic performance of companies. However, answering the question of what motivates companies to use PdM algorithms is very challenging. It may be subjective motivation from managers or business owners, it may be a targeted management strategy, or it may simply be the desire to achieve better results than competitors. A questionnaire survey would provide the best answers to this question. It is believed that more can be revealed by data. For this purpose, the decision tree method, which is based on data from the period between 2018 and 2020 (the years in which PdM was implemented by companies), has been applied.
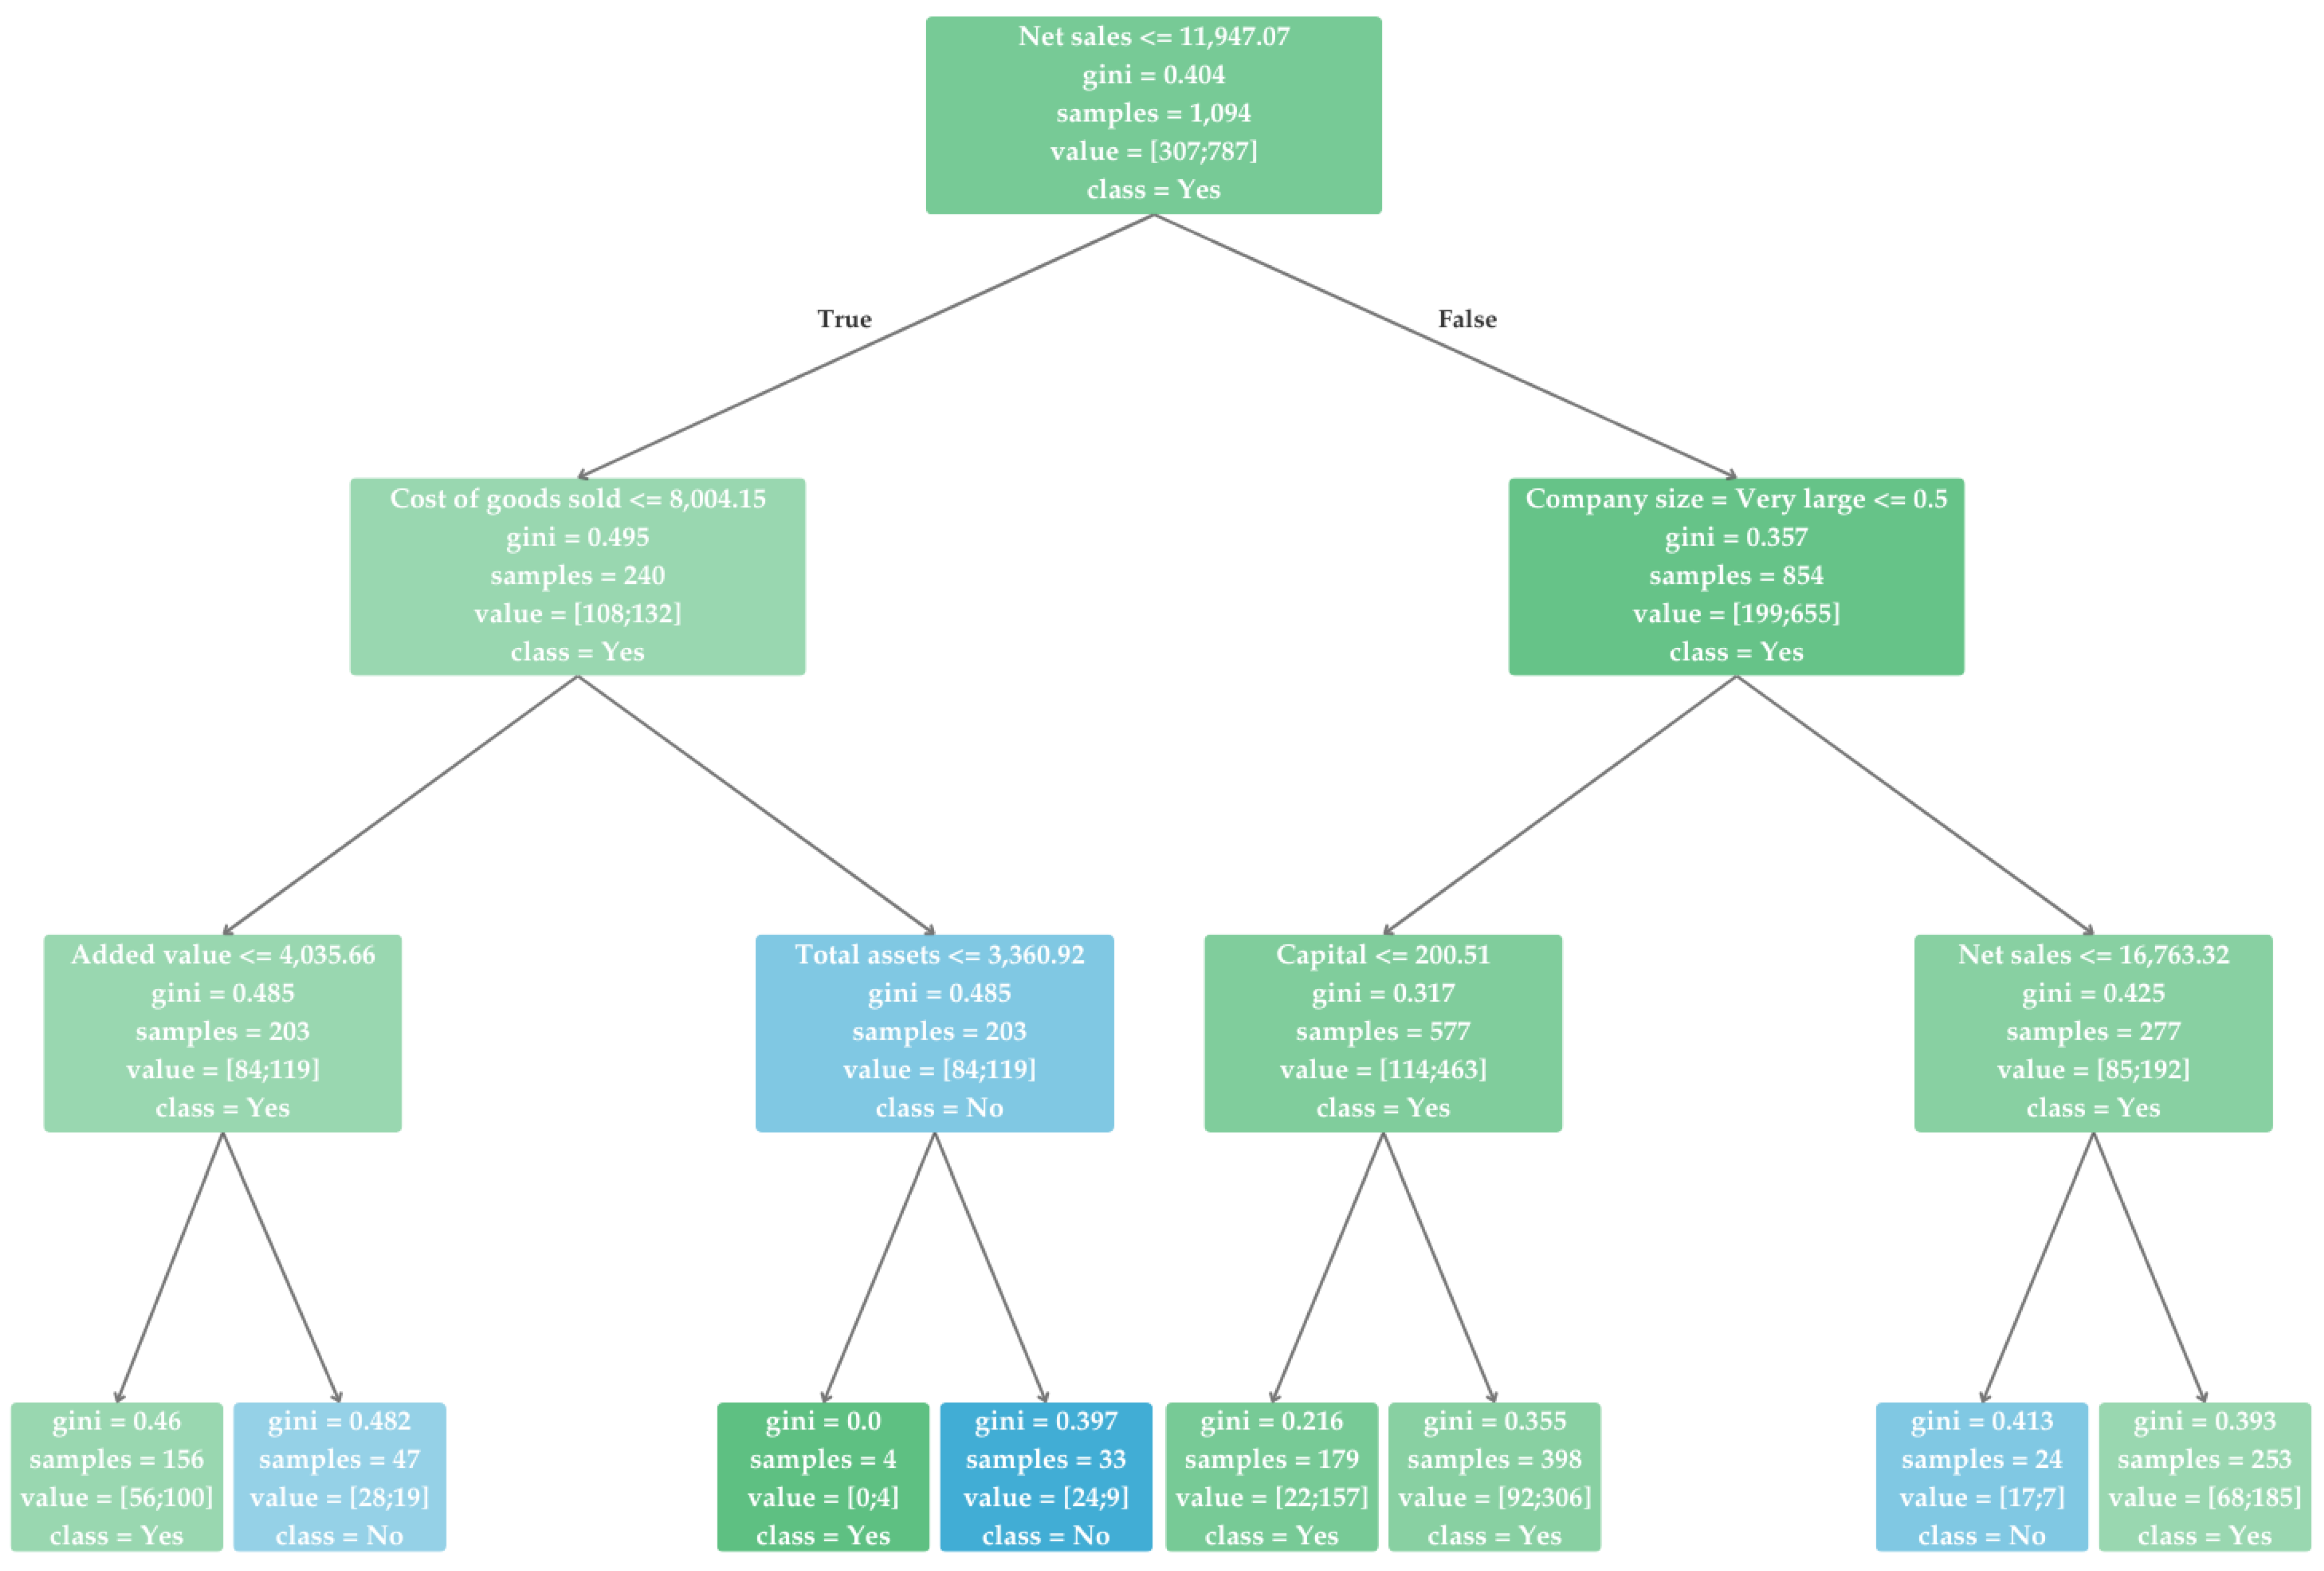
The decision tree shown in Figure A1 (Appendix A) provides a retrospective view of the economic characteristics of companies that implemented PdM in the period from 2018 to 2020. The main goal of this analysis was to identify combinations of factors that were more frequently associated with companies implementing PdM during this period. The root node of the tree identifies that net sales were the most important distinguishing factor between companies. Companies with net sales below EUR 11,947.07 thousand had a higher probability of implementing PdM during this period than companies with higher net sales. This finding may suggest that companies are motivated to use PdM in order to increase their net sales. The layers of the tree also reveal that companies with lower net sales were further characterised by costs of goods sold. Lower costs of goods sold (below EUR 8004.15 thousand) were more frequently observed in companies that implemented PdM. This may indicate that companies were already demonstrating efficient cost management before implementation and viewed PdM algorithms as tools to strengthen this efficiency. Alternatively, it could reflect companies’ efforts to stabilise and maintain their advantageous cost structure amidst growing competition. For companies with higher net sales, factors such as company size or capital played a crucial role. The leaf nodes at the end of the decision tree present the final classifications and summarise the number of companies in each group based on the combination of the analysed factors. The resulting decision tree model provides valuable insight into the decision-making processes that may have led companies to implement PdM.
5. Discussion
The empirical study examining the economic consequences of PdM algorithms in manufacturing enterprises within the V4 countries provides a significant contribution to understanding the financial benefits and challenges of PdM implementation. The findings demonstrate that PdM algorithms, artificial intelligence digital twin technologies, and the IoRT in big data-driven Industry 4.0 manufacturing systems lead to increased operational profits and reduced costs of goods sold, highlighting their role as a strategic investment for companies aiming to enhance productivity and efficiency. However, this study also identifies regional disparities in PdM adoption and effectiveness, which raises important questions about the factors influencing its successful implementation [44]. PdM algorithms have gained widespread recognition for their ability to improve the financial and operational performance of manufacturing enterprises. By leveraging advanced technologies such as artificial intelligence, machine learning, and the IoRT, PdM enables companies to proactively monitor and assess equipment conditions, thereby minimising unplanned downtime and reducing maintenance costs [50]. This study’s findings align with broader industry trends, confirming that companies implementing PdM experience higher operating profits and improved cost efficiency.
One key factor driving these benefits is PdM’s ability to optimise resource allocation. Traditional maintenance approaches, such as reactive and preventive maintenance, often lead to either excessive downtime or unnecessary maintenance expenditures. In contrast, PdM algorithms, artificial intelligence digital twin technologies, and the IoRT in big data-driven Industry 4.0 manufacturing systems allows companies to perform maintenance only when necessary, reducing labour and material costs while extending the lifespan of machinery. The economic impact of these efficiencies is particularly evident in highly automated industries, where downtime can result in substantial financial losses [51]. This study’s results indicate that the Czech Republic exhibited the most significant increase in operating profits among the V4 countries. This suggests that companies in this region have successfully integrated PdM algorithms into their operational strategies, likely benefiting from advanced digital infrastructure and government incentives promoting industrial modernisation [52]. However, the findings also highlight that Slovakia showed statistically insignificant improvements, raising concerns about potential barriers to PdM adoption in this region. The variations in PdM effectiveness across different V4 countries underscore the importance of considering geographical and industry-specific factors when analysing maintenance strategies [53]. Differences in digital maturity, workforce skills, regulatory environments, and economic conditions may all contribute to the disparities observed in this study. Countries with well-developed industrial infrastructure and high levels of digital adoption are more likely to achieve significant financial benefits from PdM [54]. In contrast, regions where businesses face challenges such as limited access to digital technologies, high initial investment costs, and a lack of technical expertise may struggle to realise PdM’s full potential [55]. This study suggests that Hungarian companies, for instance, did not experience statistically significant reductions in COGS, which may indicate obstacles in implementing PdM at scale. Another key aspect influencing PdM’s effectiveness is industry type. Manufacturing sectors that rely heavily on automated production lines, such as the automotive and electronics industries, are more likely to benefit from PdM algorithms, artificial intelligence digital twin technologies, and the IoRT in big data-driven Industry 4.0 manufacturing systems due to their reliance on complex machinery that requires continuous monitoring. Conversely, industries with lower automation levels may find the cost–benefit ratio of PdM less compelling, leading to slower adoption rates [56]. Despite the documented economic benefits, implementing PdM is not without challenges. There are also several barriers that may limit its adoption, including high upfront costs, integration complexities, and the need for skilled personnel to manage and interpret predictive analytics [57]. One major concern is the substantial investment required to deploy PdM solutions. Companies must invest in IoT sensors, data analytics platforms, and cloud computing infrastructure to enable real-time monitoring and predictive modelling. For small and medium-sized enterprises, these costs may be prohibitive, preventing them from fully adopting PdM. Another challenge is data management. PdM relies on vast amounts of sensor-generated data to predict equipment failures accurately [2]. However, collecting, storing, and analysing these data require robust data management systems and skilled personnel who can interpret complex analytical outputs. Companies that lack the necessary expertise may struggle to leverage PdM effectively, limiting its financial impact [58]. Additionally, PdM adoption requires organisational and cultural changes. Traditional maintenance teams accustomed to reactive strategies may resist transitioning to a predictive approach, necessitating training programs and change management initiatives to ensure a smooth integration process. Without adequate support and investment in workforce development, companies may face implementation difficulties [59]. The current study also highlights key factors that influence a company’s likelihood of adopting PdM algorithms, artificial intelligence digital twin technologies, and the IoRT in big data-driven Industry 4.0 manufacturing systems, with net sales and cost structures playing a critical role. Companies with lower net sales and more efficient cost management strategies are more likely to implement PdM, suggesting that enterprises view PdM as a means of enhancing competitiveness and achieving financial stability. Interestingly, this study finds that PdM adoption is more common among smaller enterprises in the sample. This challenges conventional assumptions that larger corporations, with greater financial and technical resources, would be the primary adopters of PdM. One possible explanation is that smaller enterprises, facing higher financial pressures, may prioritise cost-saving initiatives such as PdM to remain competitive [60]. Another important measure influencing the PdM adoption is the company specification as also verified in the current study of V4 enterprises. Company-specific features and financial indicators play a crucial role in the successful implementation of PdM, as they influence a company’s ability to invest in and benefit from advanced maintenance strategies [61]. These factors determine how well a company can integrate PdM algorithms, manage operational risks, and enhance overall efficiency. Company size and scale of operations play a significant role, as larger enterprises typically have more financial resources to invest in PdM technologies such as IoRT sensors, AI-driven analytics, and cloud computing. In contrast, small and medium-sized enterprises may face budget constraints but can still benefit from cost-effective PdM solutions tailored to their needs [62]. Additionally, scale impacts data availability, as larger companies generate vast operational datasets, improving prediction accuracy by production management algorithms. The industry sector and asset intensity also matter, as industries with high capital intensity, such as manufacturing, energy, and transportation, benefit most from PdM and digital twin-based cyber-physical manufacturing systems, given that unplanned downtime leads to significant financial losses. Enterprises operating in less asset-heavy sectors may find PdM less critical but can still use data-driven maintenance strategies to enhance efficiency in extended reality metaverse enterprise-based generative artificial intelligence economics [63]. Technological infrastructure and digital maturity, however, also influence the success of PdM adoption. Companies with strong digital capabilities, including automation, IoRT integration, and AI applications, can implement PdM more effectively, whereas enterprises with outdated systems may require higher initial investments to integrate PdM into existing workflows. Additionally, workforce skills and expertise are crucial, as companies need trained employees who understand data analysis, AI, and machine learning applications to interpret sensor data, optimise machine learning models, and make data-driven decisions [64]. Financial performance metrics directly impact the ability for a corporation to implement and sustain PdM systems. Operating profit is a key indicator, as companies with higher profits have more funds to invest in PdM solutions, which in turn further increases profits by reducing unplanned downtime, optimising asset use, and improving operational efficiency. The cost of goods sold is another critical factor, as enterprises with high COGS may benefit significantly from PdM algorithms, artificial intelligence digital twin technologies, and the IoRT in big data-driven Industry 4.0 manufacturing systems, since reducing machine failures lowers production costs [36], which is in line with the results of this study within the V4 countries. Moreover, other studies confirm that PdM optimises maintenance schedules, leading to lower repair costs and improved machine lifespan [65,66]. Capital expenditures and investment in technology also play a role, as those enterprises with higher expenditures can more easily invest in advanced sensors, cloud computing, and AI-driven PdM solutions, while companies with lower expenditures may opt for a gradual PdM adoption approach to balance cost-effectiveness. Net sales and revenue growth influence PdM adoption, as companies with strong revenue growth can scale PdM adoption across multiple production lines or facilities, while enterprises with declining sales may struggle to justify upfront PdM investments despite the potential for long-term savings [63]. Liquidity and cash flow are also crucial, as enterprises with strong cash flow can finance PdM implementation without disrupting other critical operations. Enterprises with liquidity constraints might need to explore leasing options, partnerships, or phased PdM implementation [47]. Another important factor is return on assets (ROA) and asset utilisation, as PdM directly improves asset utilisation, leading to higher ROA. Companies with capital-intensive assets benefit more from PdM by maximising equipment uptime and ensuring continuous production [67].
Based on the analysis of enterprises within the V4 countries and the results of other relevant studies, it can be concluded that company-specific features and financial indicators are critical in determining the feasibility, adoption, and success of PdM algorithms, artificial intelligence digital twin technologies, and the IoRT in big data-driven Industry 4.0 manufacturing systems. A company’s size, industry type, technological readiness, and workforce skills shape how well PdM can be integrated, while financial performance metrics influence investment decisions and expected benefits. For PdM algorithms to be effective, enterprises should assess both their technical capabilities and financial health to ensure a well-planned, data-driven maintenance strategy that improves efficiency, reduces costs, and enhances long-term competitiveness.
Deep learning-assisted smart process planning configures Internet of Manufacturing Things-based enterprise digital maturity in the service industry by use of geospatial big data management algorithms [68,69,70]. Computer vision algorithms articulate sustainable supply chain practices and online knowledge networks through remote sensing data fusion techniques [71,72,73]. Enterprise generative artificial intelligence technologies and Internet of Things sensing networks can be harnessed in green logistics practices across deep learning-assisted smart process and supply chain management for cyber–physical production systems in the digital twin industrial metaverse [74,75,76]. Geospatial simulation and sensor fusion tools can be deployed for Internet of Robotic Things-based knowledge co-creation by use of big data management algorithms [77,78,79]. The digital twin industrial metaverse develops on deep learning and virtual simulation algorithms, generative artificial intelligence of things and Industry 4.0-based manufacturing systems, multisensory immersive extended reality and autonomous robotic technologies, big data simulation and modelling tools, and cyber–physical production networks [80,81,82]. The sustainable development of artificial intelligence-based Internet of Manufacturing Things systems integrates remote big data management tools, virtual machine and cognitive computing algorithms, and sensing and computing technologies for digital twin simulation modelling-based environment mapping [83,84,85].
6. Conclusions
The incorporation of PdM algorithms, artificial intelligence digital twin technologies, and the IoRT in big data-driven Industry 4.0 manufacturing systems signifies a substantial change in the manner in which manufacturing enterprises approach operational efficiency and maintenance. As traditional reactive and preventive maintenance practices are increasingly determined to be inefficient, PdM has emerged as a more sophisticated solution, utilising advancements in machine learning, the IoRT, and big data analytics. These technologies facilitate continuous monitoring and data-driven insights that anticipate potential failures prior to their occurrence, thereby reducing downtime, improving asset utilisation, and increasing operational profitability. This investigation underscores the substantial economic advantages of PdM algorithms, particularly for enterprises located in V4 countries. The statistical analysis confirms that organisations that implement PdM experience substantial increases in operating profit and decreases in the cost of goods sold.
The results showed that PdM significantly influences operating profit in the Czech Republic, Hungary, and Poland. For Slovakia, these differences were statistically insignificant. Additionally, the results showed that the differences in COGS in the Czech Republic, Poland, and Slovakia were statistically significant, but in Hungary, statistical significance was not confirmed. The highest median difference in operating profit was recorded in the Czech Republic (EUR +2198.17 thousand), while the impact of PdM was smallest in Slovakia. On the other hand, for COGS, the most significant effect of PdM was identified in the Czech Republic, and the smallest effect was found in Hungary. These findings significantly correlate with the previous Kruskal–Wallis test results. The regression model’s findings verified the immense importance of PdM algorithms, artificial intelligence digital twin technologies, and the IoRT in big data-driven Industry 4.0 manufacturing systems for companies. Companies that do not implement PdM generate lower operating profits than those that do. The impact of PdM on economic performance was consistent, even after accounting for other factors. The model also demonstrated that the final impact of PdM on economic performance is significantly influenced by national and organisational characteristics, as evidenced by the differences between the analysed countries and company types. The results of the decision tree reveal that the main predictor of PdM implementation is net sales. Companies with net sales less than EUR 11,947.07 thousand had a higher probability of implementing PdM than companies with higher values. The cost of goods sold was the second most critical factor. Companies with lower COGS (<EUR 8004.15 thousand) had a higher likelihood of implementing PdM. This outcome may indicate that organisations that had already implemented effective cost management strategies prioritised maintenance optimisation as a means of achieving additional cost savings. Conversely, organisations with greater COGS probably refrained from implementing PdM due to other constraints or priorities. The size of the company was the third critical factor. In comparison to large companies, those that were very large demonstrated an increased likelihood of implementing PdM. This discrepancy may be attributable to the increased complexity of production processes and the greater availability of financial resources, which PdM algorithms, artificial intelligence digital twin technologies, and IoRT in big data-driven Industry 4.0 manufacturing systems can effectively optimise. The results of our research are in accordance with the existing literature, which underscores the fact that PdM contributes to cost savings, extended equipment lifespan, and improved product quality, thereby resulting in increased customer satisfaction. Additionally, the regression model emphasises the financial benefits of PdM algorithms by demonstrating that companies that do not implement PdM have lower operating profits than those that do. The adoption of PdM is impeded by substantial challenges, such as the necessity for specialised expertise, the high initial implementation costs, and apprehensions about the reliability of predictive models, despite the apparent advantages. Organisations that are considering the adoption of PdM must exercise caution and implement strategic planning in order to address these obstacles. The decision-making process is further complicated by economic factors, such as the substantial upfront investment necessary for sensor infrastructure and system integration.
The empirical findings of this study make a valuable contribution to the current body of research on PdM algorithms, artificial intelligence digital twin technologies, and the IoRT in big data-driven Industry 4.0 manufacturing systems by providing quantitative evidence of their impact on company performance. Our research also serves as a foundation for future academic investigations, particularly in relation to the factors that influence the adoption of PdM. It is important to note that the analysis indicates that companies with lower net sales were more likely to implement PdM during the examined period, which implies that financial considerations may be a factor in the adoption of PdM.
7. Limitations, Implications, and Further Directions of Research
Nevertheless, this investigation is also a subject to certain limitations. The generalisability of the findings to other regions or industries is restricted by the geographical focus on the V4 countries. The outcomes of PdM adoption may be influenced by the variability in economic conditions, regulatory frameworks, and technological infrastructures. The scope of future research could be broadened to encompass other countries and industries, thereby facilitating a more comprehensive understanding of the applicability of PdM algorithms, artificial intelligence digital twin technologies, and the IoRT in big data-driven Industry 4.0 manufacturing systems. Furthermore, investigating organisational factors, including leadership attitudes, corporate culture, and decision-making processes, could offer a more comprehensive understanding of the internal factors that motivate the adoption of PdM.
This study offers significant insights into the economic advantages of PdM but contains some shortcomings that must be addressed in the future to enhance transparency and trustworthiness. A key concern is the possibility for sample bias, as this research exclusively examines large and very large firms within the Visegrad Group nations. This may not comprehensively reflect the experiences of small and medium-sized enterprises or sectors beyond manufacturing. Despite the stratified sample selection process, inherent biases may persist regarding industry representation, financial health, or technical maturity of the firms.
This research also faces regional and industry-specific constraints. While it offers comparative insights among the V4 countries, it fails to consider regulatory variations, governmental incentives, or changes in digital infrastructure, all of which could substantially influence PdM efficacy. Moreover, the results may not be applicable to sectors with reduced automation, where the implementation of predictive maintenance is less prevalent. Moreover, technological and organisational impediments pose hurdles to the implementation of PdM. This research recognises challenges including elevated initial expenses, complications in data management, and workforce preparedness, although it fails to quantify their precise influence on predictive maintenance adoption rates. Another constraint is the absence of longitudinal analysis. This research study provides an overview of PdM’s economic impact but fails to evaluate long-term financial performance patterns or the possibility of declining returns from PdM over time. Mitigating these constraints in subsequent research would strengthen the findings, boost the validity of conclusions, and yield more useful insights for enterprises contemplating PdM adoption.
Nonetheless, it is evident that PdM provides substantial advantages for manufacturing enterprises in terms of operational efficiency, cost reduction, and economic performance. The long-term benefits of enhanced profitability, reduced downtime, and improved asset reliability are evident, despite the challenges associated with the implementation of PdM, including the necessity for technical expertise, high initial or infrastructure costs, cybersecurity risks, and data quality issues. These challenges can be perceived as points of interests in the future research. Furthermore, a broader industry-wide shift towards data-driven optimised maintenance practices is anticipated as big data-driven Industry 4.0 manufacturing systems continue to advance, resulting in an increasing number of companies across various sectors adopting PdM. The current challenges will likely be addressed by future research and technological advancements, which will facilitate a wider adoption of PdM.
Author Contributions
Conceptualisation, M.N. and G.L.; methodology, M.N., M.F., and K.V.; validation, K.V. and G.L.; formal analysis, M.N.; investigation, M.N. and M.F.; resources, K.V. and G.L.; data curation, G.L. and M.N.; writing—original draft preparation, K.V., G.L., M.N. and M.F.; writing—review and editing, K.V. and G.L.; visualisation, M.N. and M.F.; supervision, G.L. All authors have read and agreed to the published version of the manuscript.
Funding
This research was financially supported by the Slovak Research and Development Agency Grant VEGA 1/0494/24: Metamorphoses and causalities of indebtedness, liquidity and solvency of companies in the context of the global environment and faculty institutional project 4/FPEDAS/2024.
Data Availability Statement
The data presented in this study are available on request from the corresponding author.
Conflicts of Interest
The authors declare no conflicts of interest.
Appendix A

Figure A1.
Decision tree of economic factors influencing companies to implement PdM. Source: authors’ compilation.
Figure A1.
Decision tree of economic factors influencing companies to implement PdM. Source: authors’ compilation.
References
- Sajid, S.; Haleem, A.; Bahl, S.; Javaid, M.; Goyal, T.; Mittal, M. Data Science Applications for Predictive Maintenance and Materials Science in Context to Industry 4.0. Mater. Today Proc. 2021, 45, 4898–4905. [Google Scholar] [CrossRef]
- Çınar, Z.M.; Abdussalam Nuhu, A.; Zeeshan, Q.; Korhan, O.; Asmael, M.; Safaei, B. Machine Learning in Predictive Maintenance towards Sustainable Smart Manufacturing in Industry 4.0. Sustainability 2020, 12, 8211. [Google Scholar] [CrossRef]
- Baur, M.; Albertelli, P.; Monno, M. A Review of Prognostics and Health Management of Machine Tools. Int. J. Adv. Manuf. Technol. 2020, 107, 2843–2863. [Google Scholar] [CrossRef]
- Ruiz-Sarmiento, J.-R.; Monroy, J.; Moreno, F.-A.; Galindo, C.; Bonelo, J.-M.; Gonzalez-Jimenez, J. A Predictive Model for the Maintenance of Industrial Machinery in the Context of Industry 4.0. Eng. Appl. Artif. Intell. 2020, 87, 103289. [Google Scholar] [CrossRef]
- Meddaoui, A.; Hain, M.; Hachmoud, A. The Benefits of Predictive Maintenance in Manufacturing Excellence: A Case Study to Establish Reliable Methods for Predicting Failures. Int. J. Adv. Manuf. Technol. 2023, 128, 3685–3690. [Google Scholar] [CrossRef]
- Carvalho, T.P.; Soares, F.A.A.M.N.; Vita, R.; Francisco, R.d.P.; Basto, J.P.; Alcalá, S.G.S. A Systematic Literature Review of Machine Learning Methods Applied to Predictive Maintenance. Comput. Ind. Eng. 2019, 137, 106024. [Google Scholar] [CrossRef]
- Ayvaz, S.; Alpay, K. Predictive Maintenance System for Production Lines in Manufacturing: A Machine Learning Approach Using IoT Data in Real-Time. Expert Syst. Appl. 2021, 173, 114598. [Google Scholar] [CrossRef]
- Benešová, A.; Hirman, M.; Steiner, F.; Tupa, J. Digital Predictive Maintenance: Case Study. In Proceedings of the 2024 International Conference on Diagnostics in Electrical Engineering (Diagnostika), Pilsen, Czech Republic, 3–5 September 2024; pp. 1–6. [Google Scholar] [CrossRef]
- Maletič, D.; Maletič, M. An Exploration of Organisational Readiness for Industry 4.0: A Predictive Maintenance Perspective. Qual. Innov. Prosper. 2024, 28, 26–46. [Google Scholar] [CrossRef]
- Gu, C.; He, Y.; Han, X.; Chen, Z. Product Quality Oriented Predictive Maintenance Strategy for Manufacturing Systems. In Proceedings of the 2017 Prognostics and System Health Management Conference (PHM-Harbin), Harbin, China, 9–12 July 2017; pp. 1–7. [Google Scholar] [CrossRef]
- Cummins, L.; Sommers, A.; Ramezani, S.B.; Mittal, S.; Jabour, J.; Seale, M.; Rahimi, S. Explainable Predictive Maintenance: A Survey of Current Methods, Challenges and Opportunities. IEEE Access 2024, 12, 57574–57602. [Google Scholar] [CrossRef]
- Dalzochio, J.; Kunst, R.; Pignaton, E.; Binotto, A.; Sanyal, S.; Favilla, J.; Barbosa, J. Machine Learning and Reasoning for Predictive Maintenance in Industry 4.0: Current Status and Challenges. Comput. Ind. 2020, 123, 103298. [Google Scholar] [CrossRef]
- Serradilla, O.; Zugasti, E.; Rodriguez, J.; Zurutuza, U. Deep Learning Models for Predictive Maintenance: A Survey, Comparison, Challenges and Prospects. Appl. Intell. 2022, 52, 10934–10964. [Google Scholar] [CrossRef]
- Passlick, J.; Dreyer, S.; Olivotti, D.; Grützner, L.; Eilers, D.; Breitner, M.H. Predictive Maintenance as an Internet of Things Enabled Business Model: A Taxonomy. Electron. Mark. 2021, 31, 67–87. [Google Scholar] [CrossRef]
- Karki, B.R.; Porras, J. Digitalization for Sustainable Maintenance Services: A Systematic Literature Review. Digit. Bus. 2021, 1, 100011. [Google Scholar] [CrossRef]
- de Jonge, B.; Scarf, P.A. A Review on Maintenance Optimization. Eur. J. Oper. Res. 2020, 285, 805–824. [Google Scholar] [CrossRef]
- Juracka, D.; Nagy, M.; Zvarikova, K.; Popescu, G.H. Eco-Innovation: Analysis of EU Member States Performance in the EU Eco-Innovation Index 2013–2022. Systems 2024, 12, 452. [Google Scholar] [CrossRef]
- Zheng, M.; Li, T.; Ye, J. The Confluence of AI and Big Data Analytics in Industry 4.0: Fostering Sustainable Strategic Development. J. Knowl. Econ. 2024. [Google Scholar] [CrossRef]
- Achouch, M.; Dimitrova, M.; Ziane, K.; Karganroudi, S.S.; Dhouib, R.; Ibrahim, H.; Adda, M. On Predictive Maintenance in Industry 4.0: Overview, Models, and Challenges. Appl. Sci. 2022, 12, 8081. [Google Scholar] [CrossRef]
- Warren, D. Reactive to Proactive Maintenance Journey. SAE Tech. Pap. 2016, 2016-01-0271, 1–10. [Google Scholar] [CrossRef]
- de Faria, H.; Costa, J.G.S.; Olivas, J.L.M. A Review of Monitoring Methods for Predictive Maintenance of Electric Power Transformers Based on Dissolved Gas Analysis. Renew. Sustain. Energy Rev. 2015, 46, 201–209. [Google Scholar] [CrossRef]
- Ulansky, V.; Raza, A. A Historical Survey of Corrective and Preventive Maintenance Models with Imperfect Inspections: Cases of Constant and Non-Constant Probabilities of Decision Making. Aerospace 2024, 11, 92. [Google Scholar] [CrossRef]
- Cheng, J.C.P.; Chen, W.; Chen, K.; Wang, Q. Data-Driven Predictive Maintenance Planning Framework for MEP Components Based on BIM and IoT Using Machine Learning Algorithms. Autom. Constr. 2020, 112, 103087. [Google Scholar] [CrossRef]
- Kliestik, T.; Nica, E.; Durana, P.; Popescu, G.H. Artificial Intelligence-Based Predictive Maintenance, Time-Sensitive Networking, and Big Data-Driven Algorithmic Decision-Making in the Economics of Industrial Internet of Things. Oeconomia Copernic. 2023, 14, 1097–1138. [Google Scholar] [CrossRef]
- Maryska, M.; Doucek, P.; Nedomova, L.; Sladek, P. The Energy Industry in the Czech Republic: On the Way to the Internet of Things. Economies 2018, 6, 36. [Google Scholar] [CrossRef]
- Bui, H.N.; Duong, C.D. ChatGPT adoption in entrepreneurship and digital entrepreneurial intention: A moderated mediation model of technostress and digital entrepreneurial self-efficacy. Equilib. Q. J. Econ. Econ. Policy 2024, 19, 391–428. [Google Scholar] [CrossRef]
- Vlasov, A.I.; Grigoriev, P.V.; Krivoshein, A.I.; Shakhnov, V.A.; Filin, S.S.; Migalin, V.S. Smart Management of Technologies: Predictive Maintenance of Industrial Equipment Using Wireless Sensor Networks. Entrep. Sustain. Issues 2018, 6, 489–502. [Google Scholar] [CrossRef]
- Coandă, P.; Avram, M.; Constantin, V. A state of the art of predictive maintenance techniques. IOP Conf. Ser. Mater. Sci. Eng. 2020, 997, 012039. [Google Scholar] [CrossRef]
- Er-Ratby, M.; Kobi, A.; Sadraoui, Y.; Kadiri, M. The Impact of Predictive Maintenance on the Performance of Industrial Enterprises. SN Comput. Sci. 2025, 6, 73. [Google Scholar] [CrossRef]
- Lazaroiu, G.; Androniceanu, A.; Grecu, I.; Grecu, G.; Neguriță, O. Artificial Intelligence-Based Decision-Making Algorithms, Internet of Things Sensing Networks, and Sustainable Cyber-Physical Management Systems in Big Data-Driven Cognitive Manufacturing. Oeconomia Copernic. 2022, 13, 1047–1080. [Google Scholar] [CrossRef]
- Jiang, Y.; Yin, S.; Li, K.; Luo, H.; Kaynak, O. Industrial Applications of Digital Twins. Phil. Trans. R. Soc. A 2021, 379, 20200360. [Google Scholar] [CrossRef]
- Lazaroiu, G.; Negurita, O.; Grecu, I.; Grecu, G.; Mitran, P. Consumers’ Decision-Making Process on Social Commerce Platforms: Online Trust, Perceived Risk, and Purchase Intentions. Front. Psychol. 2020, 11, 890. [Google Scholar] [CrossRef]
- Cachada, A.; Moreira, P.M.; Romero, L.; Barbosa, J.; Leitno, P.; Gcraldcs, C.A.S.; Deusdado, L.; Costa, J.; Teixeira, C.; Teixeira, J.; et al. Maintenance 4.0: Intelligent and Predictive Maintenance System Architecture. In Proceedings of the 2018 IEEE 23rd International Conference on Emerging Technologies and Factory Automation (ETFA), Turin, Italy, 4–7 September 2018; IEEE: Piscataway, NJ, USA, 2018; pp. 139–146. [Google Scholar] [CrossRef]
- Motaghare, O.; Pillai, A.S.; Ramachandran, K.I. Predictive Maintenance Architecture. In Proceedings of the 2018 IEEE International Conference on Computational Intelligence and Computing Research (ICCIC), Madurai, India, 13–15 December 2018; IEEE: Piscataway, NJ, USA, 2018. [Google Scholar] [CrossRef]
- Franco, I.T.; de Figueiredo, R.M. Predictive Maintenance: An Embedded System Approach. J. Control Autom. Electr. Syst. 2023, 34, 60–72. [Google Scholar] [CrossRef]
- Scaife, A.D. Improve Predictive Maintenance Through the Application of Artificial Intelligence: A Systematic Review. Results Eng. 2024, 21, 101645. [Google Scholar] [CrossRef]
- Ren, Y. Optimizing Predictive Maintenance with Machine Learning for Reliability Improvement. ASME J. Risk Uncertain. Part B 2021, 7, 030801. [Google Scholar] [CrossRef]
- Dabija, D.C.; Bejan, B.M.; Pușcaș, C. A qualitative approach to the sustainable orientation of generation z in retail: The case of Romania. J. Risk Financ. Manag. 2020, 13, 152. [Google Scholar] [CrossRef]
- Deloitte. Predictive Maintenance: Transforming Maintenance Operations with Data and Analytics. Deloitte Insights. Available online: https://www2.deloitte.com/content/dam/Deloitte/us/Documents/process-and-operations/us-predictive-maintenance.pdf (accessed on 2 February 2025).
- Arena, F.; Collotta, M.; Luca, L.; Ruggieri, M.; Termine, F.G. Predictive Maintenance in the Automotive Sector: A Literature Review. Math. Comput. Appl. 2022, 27, 2. [Google Scholar] [CrossRef]
- Chinta, V.S.; Reddi, S.K.; Yarramsetty, N. Optimal Feature Selection on Serial Cascaded Deep Learning for Predictive Maintenance System in Automotive Industry with Fused Optimization Algorithm. Adv. Eng. Inform. 2023, 57, 102105. [Google Scholar] [CrossRef]
- Golightly, D.; Kefalidou, G.; Sharples, S. A Cross-Sector Analysis of Human and Organisational Factors in the Deployment of Data-Driven Predictive Maintenance. Inf. Syst. E-Bus. Manag. 2018, 16, 627–648. [Google Scholar] [CrossRef]
- Zonta, T.; da Costa, C.A.; Righi, R.d.R.; de Lima, M.J.; da Trindade, E.S.; Li, G.P. Predictive Maintenance in the Industry 4.0: A Systematic Literature Review. Comput. Ind. Eng. 2020, 150, 106889. [Google Scholar] [CrossRef]
- Nunes, P.; Santos, J.; Rocha, E. Challenges in Predictive Maintenance—A Review. CIRP J. Manuf. Sci. Technol. 2023, 40, 53–67. [Google Scholar] [CrossRef]
- Hurtado, J.; Salvati, D.; Semola, R.; Bosio, M.; Lomonaco, V. Continual Learning for Predictive Maintenance: Overview and Challenges. Intell. Syst. Appl. 2023, 19, 200251. [Google Scholar] [CrossRef]
- Rüb, M.; Tuchel, P.; Sikora, A.; Mueller-Gritschneder, D. A Continual and Incremental Learning Approach for TinyML On-Device Training Using Dataset Distillation and Model Size Adaption. In Proceedings of the 2024 IEEE 7th International Conference on Industrial Cyber-Physical Systems (ICPS), St. Louis, MO, USA, 12–15 May 2024; pp. 1–8. [Google Scholar] [CrossRef]
- Juracka, D.; Nagy, M.; Valaskova, K.; Nica, E. A Meta-Analysis of Innovation Management in Scientific Research: Unveiling the Frontier. Systems 2024, 12, 130. [Google Scholar] [CrossRef]
- Giada, C.V.; Rossella, P. Barriers to Predictive Maintenance Implementation in the Italian Machinery Industry. IFAC-PapersOnLine 2021, 54, 1266–1271. [Google Scholar] [CrossRef]
- Grand View Research. Predictive Maintenance Market Size, Share & Trends Analysis Report by Component (Software, Services), by Deployment (On-Premises, Cloud), by End-Use (Manufacturing, Automotive), by Region, and Segment Forecasts, 2023–2030. Grand View Research. 2023. Available online: https://www.grandviewresearch.com/industry-analysis/predictive-maintenance-market (accessed on 2 February 2025).
- Elkateb, S.; Metwalli, A.; Shendy, A.; Abu-Elanien, A. Machine learning and IoT—Based predictive maintenance approach for industrial applications. Alex. Eng. J. 2024, 88, 298–308. [Google Scholar] [CrossRef]
- Doran, N.M.; Badareu, G.; Puiu, S. Automation Systems Implications on Economic Performance of Industrial Sectors in Selected European Union Countries. Systems 2025, 13, 26. [Google Scholar] [CrossRef]
- Piotrowska, K.; Wanicki, P. The Czech Republic as a country with the highest development rate in research and development among the v4 countries. Zesz. Nauk. 2023, 9, 125–135. [Google Scholar] [CrossRef]
- Stefanini, R.; Tancredi, G.P.C.; Vignali, G.; Monica, L. Industry 4.0 and intelligent predictive maintenance: A survey about the advantages and constraints in the Italian context. J. Qual. Maint. Eng. 2022, 29, 37–49. [Google Scholar] [CrossRef]
- Skoumpopoulou, D.; Toliyat, S.M.H.; Ojra, A.; Shokri, A.; Hu, S. Challenges of achieving digital transformation in manufacturing firms: The case of predictive maintenance and spare part inventory management. J. Manuf. Technol. Manag. 2025, 36, 159–178. [Google Scholar] [CrossRef]
- Hojnik, B.B.; Huđek, I. Small and Medium-Sized Enterprises in the Digital Age: Understanding Characteristics and Essential Demands. Information 2023, 14, 606. [Google Scholar] [CrossRef]
- Elahu, M.; Afolaranmi, S.O.; Lastra, J.L.M.; Garcia, J.A.P. A comprehensive literature review of the applications of AI techniques through the lifecycle of industrial equipment. Discov. Artif. Intell. 2023, 3, 43. [Google Scholar] [CrossRef]
- Nyoni, R. Harnessing Data Analytics for Predictive Insights: Advancing Decision-Making with Big Data Innovations. Int. J. Res. Publ. Rev. 2025, 6, 2915–2936. [Google Scholar] [CrossRef]
- Wan, Y.; Liu, Y.; Chen, Z.; Chen, C.; Li, X.; Hu, F.; Packianather, M. Making knowledge graphs work for smart manufacturing: Research topics, applications and prospects. J. Manuf. Syst. 2024, 76, 103–132. [Google Scholar] [CrossRef]
- Ledro, C.; Nosella, A.; Pozza, I.D. Integration of AI in CRM: Challenges and guidelines. J. Open Innov. Technol. Mark. Complex. 2023, 9, 100151. [Google Scholar] [CrossRef]
- Florian, E.; Sgarbossa, F.; Zennaro, I. Machine learning-based predictive maintenance: A cost-oriented model for implementation. Int. J. Prod. Econ. 2021, 236, 108114. [Google Scholar] [CrossRef]
- Hoffmann, M.A.; Lasch, R. Unlocking the Potential of Predictive Maintenance for Intelligent Manufacturing: A Case Study On Potentials, Barriers, and Critical Success Factors. Schmalenbach J. Bus. Res. 2025; early access. [Google Scholar] [CrossRef]
- Rahman, S.; Ghosh, T.; Aurna, N.F.; Kaiser, M.S.; Anannya, M.; Hosen, A.S. Machine learning and internet of things in industry 4.0: A review. Meas. Sens. 2023, 28, 100822. [Google Scholar] [CrossRef]
- Lazaroiu, G.; Gedeon, T.; Rogalska, E.; Valaskova, K.; Nagy, M.; Musa, H.; Zvarikova, K.; Poliak, M.; Horak, J.; Crețoiu, R.I.; et al. Digital twin-based cyber-physical manufacturing systems, extended reality metaverse enterprise and production management algorithms, and Internet of Things financial and labor market technologies in generative artificial intelligence economics. Oeconomia Copernic. 2024, 15, 837–870. [Google Scholar] [CrossRef]
- Alahi, M.E.E.; Sukkuea, A.; Tina, F.W.; Nag, A.; Kurdthongmee, W.; Suwannarat, K.; Mukhopadhyay, S.C. Integration of IoT-Enabled Technologies and Artificial Intelligence (AI) for Smart City Scenario: Recent Advancements and Future Trends. Sensors 2023, 23, 5206. [Google Scholar] [CrossRef]
- Faizanbasha, A.; Rizwan, U. Optimizing burn-in and predictive maintenance for enhanced reliability in manufacturing systems: A two-unit series system approach. J. Manuf. Syst. 2025, 78, 244–270. [Google Scholar] [CrossRef]
- Rojek, I.; Jasiulewicz-Kaczmarek, M.; Piechowski, M.; Mikołajewski, D. An Artificial Intelligence Approach for Improving Maintenance to Supervise Machine Failures and Support Their Repair. Appl. Sci. 2023, 13, 4971. [Google Scholar] [CrossRef]
- Lei, X.; Sandborn, P.; Bakhshi, R.; Kashani-our, A.; Goudarzi, N. PHM based predictive maintenance optimization for offshore wind farms. In Proceedings of the 2015 IEEE Conference on Prognostics and Health Management (PHM), Austin, TX, USA, 22–25 June 2015; IEEE Xplore: New York, NY, USA, 2015; pp. 22–25. [Google Scholar] [CrossRef]
- Zvolánková, S.S.; Krajčík, V. Digital maturity of Czech SMEs concerning the demographic characteristics of entrepreneurs and enterprises. Equilib. Q. J. Econ. Econ. Policy 2024, 19, 1363–1404. [Google Scholar] [CrossRef]
- Pelau, C.; Dabija, D.-C.; Ene, I. What makes an AI device human-like? The role of interaction quality, empathy and perceived psychological anthropomorphic characteristics in the acceptance of artificial intelligence in the service industry. Comput. Hum. Behav. 2021, 122, 106855. [Google Scholar] [CrossRef]
- Lăzăroiu, G.; Andronie, M.; Iatagan, M.; Geamănu, M.; Ștefănescu, R.; Dijmărescu, I. Deep Learning-Assisted Smart Process Planning, Robotic Wireless Sensor Networks, and Geospatial Big Data Management Algorithms in the Internet of Manufacturing Things. ISPRS Int. J. Geo-Inf. 2022, 11, 277. [Google Scholar] [CrossRef]
- Gariba, M.I.; Rehman, F.U.; Prokop, V.; Giglio, C. Be digital to be sustainable! The mediating role of sustainable supply chain practices in triggering the effects of digitalisation on Sustainable Development Goals in the European Union. Oeconomia Copernic. 2024, 15, 1383–1425. [Google Scholar] [CrossRef]
- Vătămănescu, E.-M.; Bratianu, C.; Dabija, D.-C.; Popa, S. Capitalizing online knowledge networks: From individual knowledge acquisition towards organizational achievements. J. Knowl. Manag. 2023, 27, 1366–1389. [Google Scholar] [CrossRef]
- Nagy, M.; Lăzăroiu, G. Computer Vision Algorithms, Remote Sensing Data Fusion Techniques, and Mapping and Navigation Tools in the Industry 4.0-Based Slovak Automotive Sector. Mathematics 2022, 10, 3543. [Google Scholar] [CrossRef]
- Chatzoudes, D.; Kadłubek, M.; Maditinos, D. Green logistics practices: The antecedents and effects for supply chain management in the modern era. Equilib. Q. J. Econ. Econ. Policy 2024, 19, 991–1034. [Google Scholar] [CrossRef]
- Kliestik, T.; Dragomir, R.; Băluță, A.V.; Grecu, I.; Durana, P.; Karabolevski, O.L.; Kral, P.; Balica, R.; Suler, P.; Bușu, O.V.; et al. Enterprise generative artificial intelligence technologies, Internet of Things and blockchain-based fintech management, and digital twin industrial metaverse in the cognitive algorithmic economy. Oeconomia Copernic. 2024, 15, 1183–1221. [Google Scholar] [CrossRef]
- Andronie, M.; Lăzăroiu, G.; Iatagan, M.; Uță, C.; Ștefănescu, R.; Cocoșatu, M. Artificial Intelligence-Based Decision-Making Algorithms, Internet of Things Sensing Networks, and Deep Learning-Assisted Smart Process Management in Cyber-Physical Production Systems. Electronics 2021, 10, 2497. [Google Scholar] [CrossRef]
- Lizińska, W.; Sobol, D.; Rūtelionė, A. Internationalisation of science and technology parks and the stage of their life: The Central European perspective. Equilib. Q. J. Econ. Econ. Policy 2024, 19, 549–590. [Google Scholar] [CrossRef]
- Pocol, C.B.; Stanca, L.; Dabija, D.-C.; Pop, I.D.; Mișcoiu, S. Knowledge Co-creation and Sustainable Education in the Labor Market-Driven University–Business Environment. Front. Environ. Sci. 2022, 10, 781075. [Google Scholar] [CrossRef]
- Andronie, M.; Lăzăroiu, G.; Iatagan, M.; Hurloiu, I.; Ștefănescu, R.; Dijmărescu, A.; Dijmărescu, I. Big Data Management Algorithms, Deep Learning-Based Object Detection Technologies, and Geospatial Simulation and Sensor Fusion Tools in the Internet of Robotic Things. ISPRS Int. J. Geo-Inf. 2023, 12, 35. [Google Scholar] [CrossRef]
- Kliestik, T.; Kral, P.; Bugaj, M.; Durana, P. Generative artificial intelligence of things systems, multisensory immersive extended reality technologies, and algorithmic big data simulation and modelling tools in digital twin industrial metaverse. Equilib. Q. J. Econ. Econ. Policy 2024, 19, 429–461. [Google Scholar] [CrossRef]
- Gavkalova, N.; Gładysz, B.; Quadrini, W.; Sassanelli, C.; Asplund, F.; Ramli, M.R.; Detzner, P.; Deville, J.; Dragic, M.; Van Erp, T.; et al. Digital Innovation Hubs and portfolio of their services across European economies. Oeconomia Copernic. 2024, 15, 59–94. [Google Scholar] [CrossRef]
- Nagy, M.; Lăzăroiu, G.; Valaskova, K. Machine Intelligence and Autonomous Robotic Technologies in the Corporate Context of SMEs: Deep Learning and Virtual Simulation Algorithms, Cyber-Physical Production Networks, and Industry 4.0-Based Manufacturing Systems. Appl. Sci. 2023, 13, 1681. [Google Scholar] [CrossRef]
- Andronie, M.; Lăzăroiu, G.; Karabolevski, O.L.; Ștefănescu, R.; Hurloiu, I.; Dijmărescu, A.; Dijmărescu, I. Remote Big Data Management Tools, Sensing and Computing Technologies, and Visual Perception and Environment Mapping Algorithms in the Internet of Robotic Things. Electronics 2023, 12, 22. [Google Scholar] [CrossRef]
- Valaskova, K.; Nagy, M.; Grecu, G. Digital twin simulation modeling, artificial intelligence-based Internet of Manufacturing Things systems, and virtual machine and cognitive computing algorithms in the Industry 4.0-based Slovak labor market. Oeconomia Copernic. 2024, 15, 95–143. [Google Scholar] [CrossRef]
- Dadkhah, M.; Nedungadi, P.; Raman, R.; Dávid, L.D. Emerging and disruptive technologies and the sustainable development goals: A state of art and research agenda. Equilib. Q. J. Econ. Econ. Policy 2024, 19, 13–21. [Google Scholar] [CrossRef]
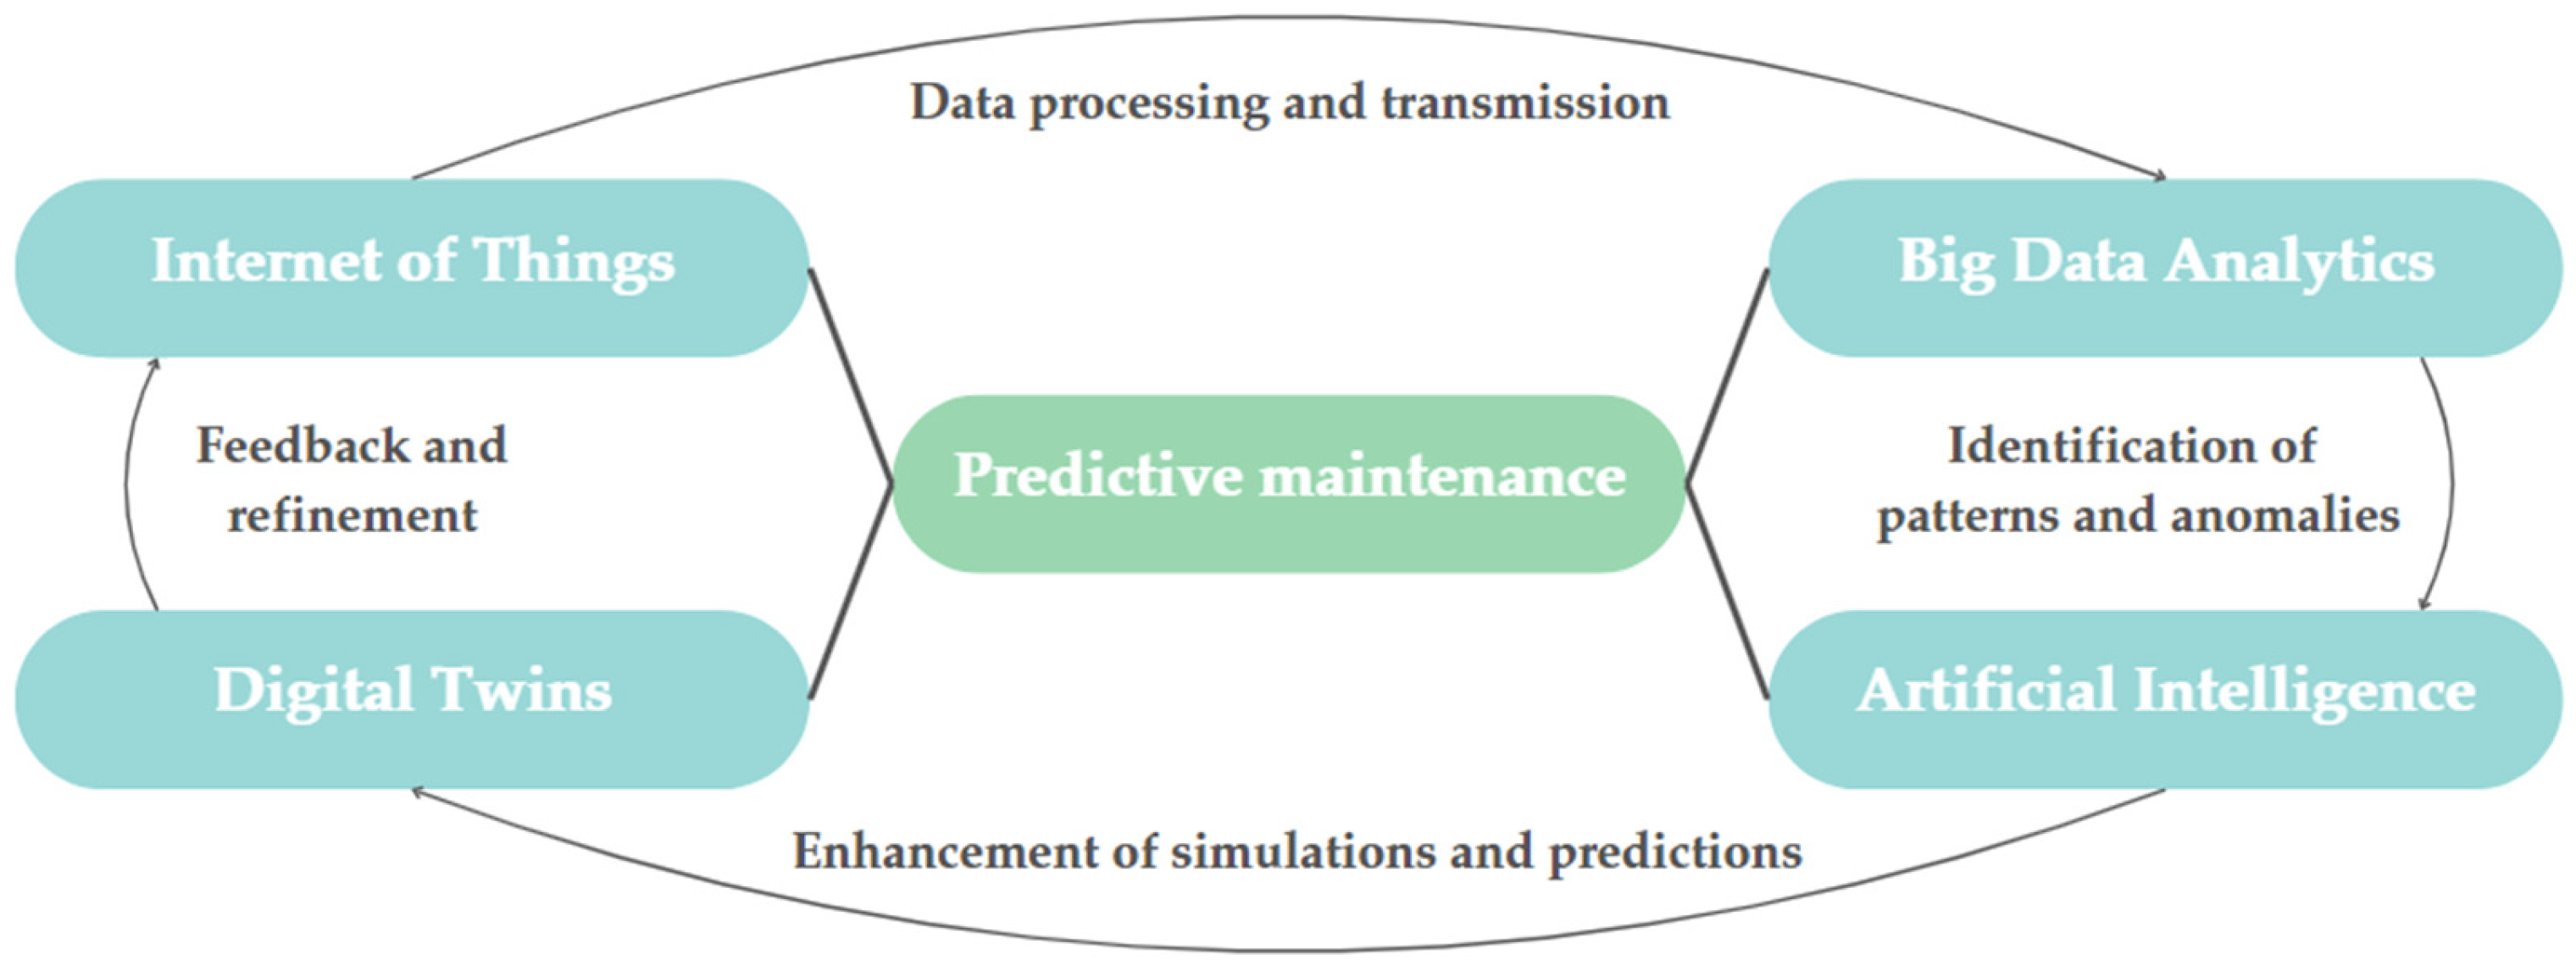
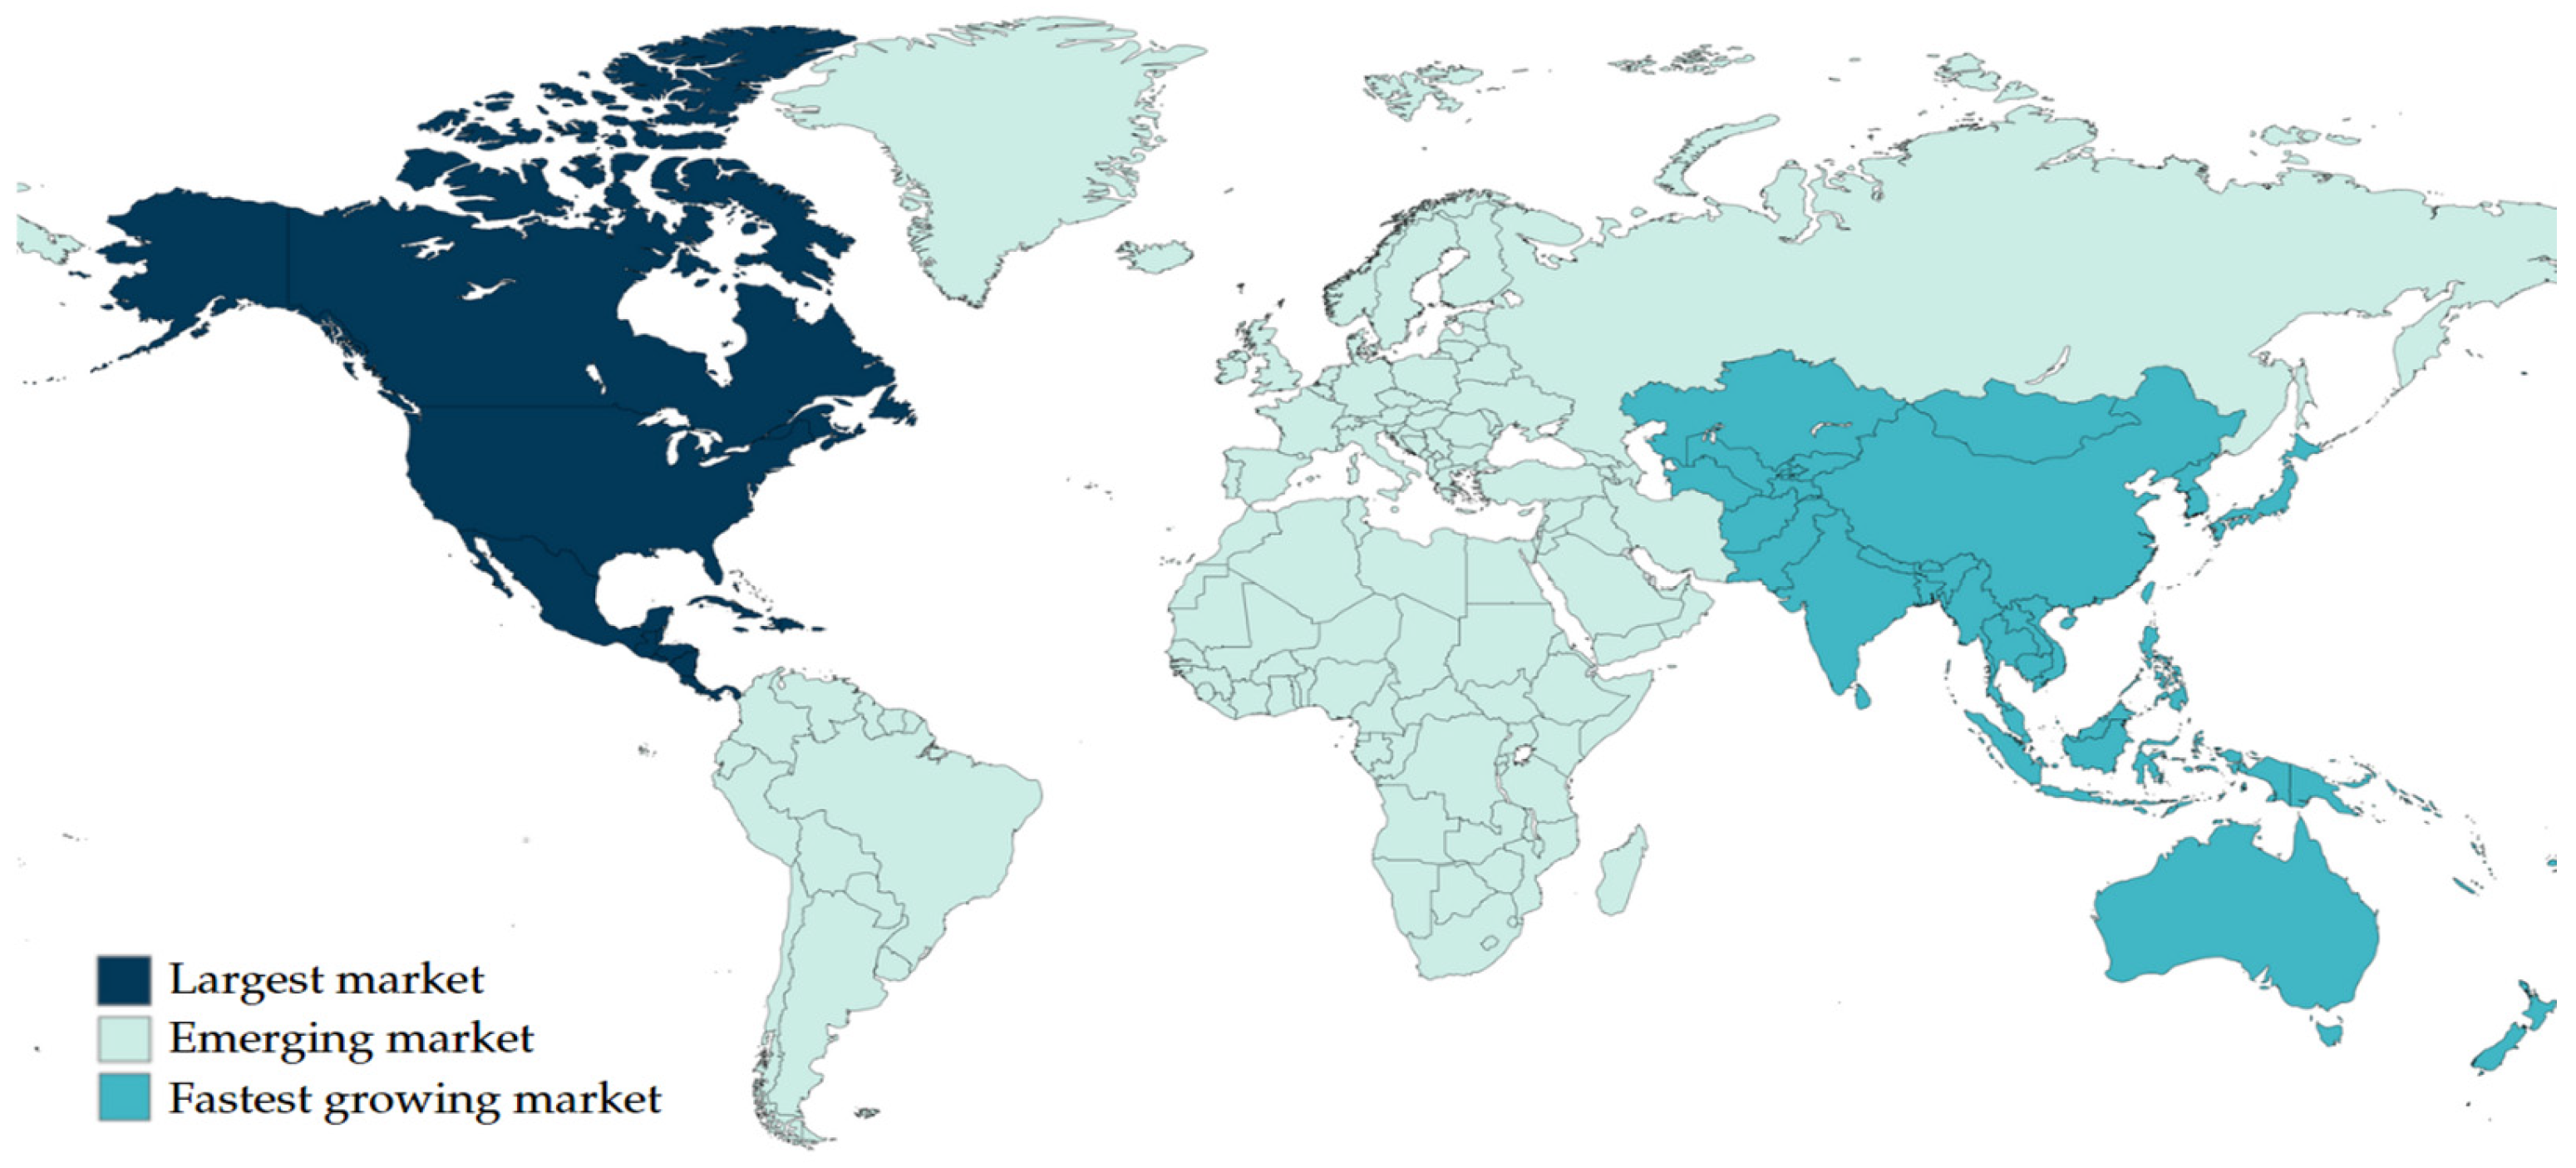
Disclaimer/Publisher’s Note: The statements, opinions and data contained in all publications are solely those of the individual author(s) and contributor(s) and not of MDPI and/or the editor(s). MDPI and/or the editor(s) disclaim responsibility for any injury to people or property resulting from any ideas, methods, instructions or products referred to in the content. |
© 2025 by the authors. Licensee MDPI, Basel, Switzerland. This article is an open access article distributed under the terms and conditions of the Creative Commons Attribution (CC BY) license (https://creativecommons.org/licenses/by/4.0/).