Article

Decoding Colon Cancer Heterogeneity Through Integrated miRNA–Gene Network Analysis

1
School of Mathematical Sciences, Beihang University, Beijing 100191, China
2
LMIB and SKLCCSE, Beihang University, Beijing 100191, China
3
Shen Yuan Honors College, Beihang University, Beijing 100191, China
4
Institute of Artificial Intelligence, Beijing Advanced Innovation Center for Future Blockchain and Privacy Computing, Beihang University, Beijing 100191, China
5
Zhongguancun Laboratory, Beijing 100094, China
*
Authors to whom correspondence should be addressed.
Mathematics 2025, 13(6), 1020; https://doi.org/10.3390/math13061020
Submission received: 20 February 2025 / Revised: 16 March 2025 / Accepted: 18 March 2025 / Published: 20 March 2025
(This article belongs to the Special Issue Network Biology and Machine Learning in Bioinformatics)

Abstract

:
Colon adenocarcinoma (COAD) demonstrates significant clinical heterogeneity across disease stages, gender, and age groups, posing challenges for unified therapeutic strategies. This study establishes a multi-dimensional stratification framework through integrative analysis of miRNA–gene co-expression networks, employing the MRNETB algorithm coupled with Markov flow entropy (MFE) centrality quantification. Analysis of TCGA-COAD cohorts revealed stage-dependent regulatory patterns centered on CDX2-hsa-miR-22-3p-MUC13 interactions, with progressive dysregulation mirroring tumor progression. Gender-specific molecular landscapes have emerged, characterized by predominant SLC26A3 expression in males and GPA33 enrichment in females, suggesting divergent pathogenic mechanisms between genders. Striking age-related disparities were observed, where early-onset cases exhibited molecular signatures distinct from conventional COAD, highlighted by marked XIST expression variations. Drug-target network analysis identified actionable candidates including CEACAM5-directed therapies and differentiation-modulating agents. Our findings underscore the critical need for heterogeneity-aware clinical decision-making, providing a roadmap for stratified intervention paradigms in precision oncology.

1. Introduction

COAD is the third most common malignancy worldwide, with over 1.9 million new cases and 900,000 deaths reported in 2022 [1]. Early-onset CRC, accounting for 9.9–11.6% of cases, has seen a significant increase in incidence and mortality rates over the past decades [2,3]. Despite advancements in multi-omics molecular sub-typing, the current classification systems fail to fully capture the clinical heterogeneity of COAD, such as differences in molecular characteristics across AJCC stages and the impact of gender and age on miRNA expression profiles [4,5,6,7,8,9]. This study aims to address these gaps by integrating molecular network analysis with clinical heterogeneity research to develop new stratified intervention paradigms [10].
The molecular heterogeneity of COAD is driven by complex regulatory networks involving genes, proteins, and non-coding RNAs. Among these, microRNAs (miRNAs) have emerged as critical regulators of gene expression, playing pivotal roles in cancer development and progression. miRNAs are small non-coding RNAs that post-transcriptionally regulate gene expression by binding to target mRNAs, leading to their degradation or translational repression. In COAD, dysregulated miRNAs have been implicated in key oncogenic processes, including cell proliferation, apoptosis, invasion, and metastasis. For instance, miR-21 promotes tumor growth by targeting PTEN [11], while miR-143 and miR-145 suppress tumor progression by inhibiting KRAS [12]. However, the regulatory roles of miRNAs are not isolated; they function within intricate networks of interactions with genes and proteins. Therefore, analyzing miRNA–gene interactions is essential for uncovering the underlying mechanisms of COAD and identifying potential therapeutic targets.
Traditional methods for analyzing miRNA–gene interactions, such as correlation-based approaches (e.g., weighted gene co-expression network analysis, WGCNA) and machine learning algorithms (e.g., random forest), have been widely used to identify key regulatory modules and predict clinical outcomes. While these methods have provided valuable insights, they exhibit limitations in handling high-noise data and capturing complex nonlinear relationships [13,14]. In contrast, information–theoretic approaches, such as mutual information (MI) and Bayesian methods (e.g., Bayesian additive regression trees, BART), offer superior capabilities in managing noisy data and modeling nonlinear interactions. These methods have been successfully applied in cancer research to assess associations between single-cell datasets, enhance prognostic predictions, and dissect the regulatory mechanisms of miRNA–gene networks [15,16]. By leveraging the principles of maximum relevance and minimum redundancy, information–theoretic methods provide a robust framework for constructing accurate and interpretable networks, making them particularly suitable for studying the complex regulatory landscape of COAD.
In this study, we employ an integrative approach to systematically analyze the molecular heterogeneity of COAD by constructing miRNA–gene co-expression networks using the MRNETB algorithm, an information–theoretic method that balances maximum relevance and minimum redundancy. We utilize RNA-seq and miRNA expression data from the TCGA-COAD project, focusing on different clinical stages, genders, and age groups. Markov flow entropy (MFE) is calculated to quantify the importance of nodes within the network, enabling the identification of key regulatory genes and miRNAs. Additionally, protein–protein interaction (PPI) networks and miRNA–target interactions are analyzed to reveal functional connectivity and regulatory mechanisms. Our analysis identifies critical genes (e.g., CDH17, FABP1, CEACAM5) and miRNAs (e.g., hsa-miR-21-5p, hsa-miR-143-3p) with high MFE values, indicating their central roles in COAD progression. Furthermore, we uncover gender- and age-specific molecular signatures, providing insights into the differential regulatory mechanisms in COAD. These findings underscore the importance of integrating molecular network analysis with clinical heterogeneity to develop stratified intervention paradigms, paving the way for precision medicine in COAD treatment.

2. Materials and Methods

In this study, we used RNA-seq data, miRNA data, and methylation data from TCGA-COAD in the Xena database—a colon cancer program within the TCGA program. The detailed distribution of the samples is referenced in Section 2.1. Specific data were constructed for the different clinical subgroups, including different disease stages (Normal and Stage I–Stage IV), gender (male, female), and age (<50, 50–70, 70+), specific miRNA–gene co-expression networks were constructed for each category, and the network was constructed using the information–theoretic method of maximum relevance and minimum redundancy (MRNETB), which is a combination of maximum correlation and minimum redundancy. MRNETB, the specific steps refer to Section 2.2 [17]. Furthermore, the Markov flow entropy (MFE) is calculated separately for each network to measure node importance; the calculation process of MFE and its significance are detailed in Section 2.3. The entire workflow is shown in Figure 1.

2.1. Datasets

In this study, we used gene expression data, miRNA expression data, and gene methylation data from the TCGA-COAD project provided by Xena [18]; the details are shown in Table 1.
Regarding the age distribution of the samples, they are categorized into three groups: There are 55 samples aged under 50 years, 169 samples aged between 50 and 70 years, and 214 samples over 70 years old. In terms of gender, male samples outnumbered female samples by 43. As for the AJCC stage, 8 samples are classified as ’Normal’, 76 samples are in Stage I, 178 samples in Stage II, 129 samples in Stage III, and 65 samples in Stage IV. It should be noted that there is missing information for some sample categories.
To further explore the functional roles of the identified genes and miRNAs, we utilized the STRING database to construct a protein–protein interaction (PPI) network with a confidence score threshold at 0.7. We performed functional enrichment analysis [19], which calculates the strength of enrichment (log10 ratio of observed to expected term occurrences) and the false discovery rate (FDR) to assess the significance of terms associated with proteins in the network, corrected for multiple testing using the Benjamini–Hochberg procedure. Additionally, we used the miRTarBase database to validate experimentally supported miRNA–gene interactions and the DGIdb database to identify potential drug–gene interactions for therapeutic targeting [20].

2.2. Co-Expression Network Construction

The MRNETB algorithm implements a bidirectional feature selection paradigm, integrating backward elimination with sequential replacement (Algorithm 1) to construct robust gene regulatory networks from high-dimensional transcriptomic data. Unlike traditional forward selection strategies, MRNETB employs a backward elimination approach combined with sequential replacement to identify a maximally informative set of predictor variables for each target gene. This strategy reduces the dependency on the initial variable selection, leading to more robust and accurate network inference. MRNETB is particularly advantageous for handling high-dimensional data with limited samples, as it efficiently balances relevance and redundancy among variables without incurring additional computational costs [17].
Suppose we have n samples, each containing the expression values of p genes. The data matrix X is represented as X = ( x i j ) , where i = 1 , , n and j = 1 , , p .
Mutual information measures the correlation between two variables. For genes X i and X j , the mutual information MI ( X i , X j ) is defined as follows:
MI ( X i , X j ) = x i x j p ( x i , x j ) log p ( x i , x j ) p ( x i ) p ( x j ) ,
where p ( x i ) and p ( x j ) are the marginal probability distributions of X i and X j , and p ( x i , x j ) is their joint distribution. In practice, kernel density estimation is often used to estimate these distributions.
For a target gene X j , the predictor set X S j { X X j } is selected based on the trade-off between relevance and redundancy. Relevance is measured by the mutual information I ( X i ; X j ) between a predictor X i and the target X j , while redundancy is the average mutual information among the selected predictors:
Relevance : u = 1 | S j | X k S j I ( X k ; X j ) ,
Redundancy : r = 2 | S j | ( | S j | 1 ) X k , X l S j , k > l I ( X k ; X l ) .
The objective function u r is maximized during backward elimination and sequential replacement to ensure the selected predictors are both relevant to the target and minimally redundant with each other.
The MRNETB algorithm is summarized as follows:
Algorithm 1 MRNETB: network inference using backward elimination and sequential replacement.
  • Require: Gene expression matrix X R n × p (n samples, p genes)
  • Ensure: Regulatory adjacency matrix G { 0 , 1 } p × p
1:
Step1 MI Matrix Construction
2:
       Compute pairwise MI matrix MIM R p × p
3:
Step2 Backward Elimination
4:
for Each target gene X j  do
5:
        Initialize candidate set S j = X { X j }
6:
        Iteratively eliminate redundant genes until convergence
7:
end for
8:
Step3 Sequential Replacement
9:
for Each target gene X j  do
10:
        Optimize predictor set through gene-pair swapping
11:
end for
12:
Step4 Network Generation
13:
        Construct binary adjacency matrix G from final sets

2.3. Markov Flow Entropy

The Markov flow entropy (MFE) for gene i of sample k is defined as follows [21]:
MFE ( i k ) = j = 1 n π i k p i j k log ( π i k p i j k )
where MFE is the Markov flow entropy for gene i in sample k. π i k denotes the normalized expression of gene i, and p i j k represents the normalized weight between the neighboring nodes and gene i to gene j in sample k.
Compared with traditional centrality metrics (e.g., degree centrality, median centrality, and proximity centrality), MFE not only reflects the number of connections of genes but also quantifies the complexity of connection weights and distributions. This gives MFE higher resolution and utility in applications such as functional prediction, network stability analysis, and biomarker discovery. By combining local and global network properties, MFE provides a powerful tool for understanding the complexity and diversity of gene regulatory networks.
When two genes have similar expression levels ( π i k π j k ) but significantly different MFE values, this suggests distinct roles in the network:
  • High MFE gene: This gene likely has a broad and complex regulatory influence, interacting with many other genes in a balanced manner. It may act as a central regulator or hub in the network.
  • Low MFE gene: This gene likely has a narrow and specific regulatory role, interacting with only a few genes. It may function in a specialized pathway or under specific conditions.
The Markov flow entropy (MFE) provides a powerful measure of complexity and functional diversity within a regulatory network. When two genes exhibit similar expression levels but different MFE values, this discrepancy highlights significant differences in their network connectivity, regulatory roles, and biological functions. High MFE genes tend to be multifunctional hubs, while low MFE genes are more specialized. This distinction underscores the importance of integrating both expression data and network topology for a comprehensive understanding of gene regulation.

3. Results

3.1. Identification of Key Genes and miRNAs Across Clinical Stages

We constructed a miRNA–gene co-expression network for COAD using the information–theoretic MRNETB method (see Section 2.2), with edges between miRNAs and genes derived from the miRTarBase database. Based on the clinical AJCC stage information, we divided the samples into Normal, Stage I, Stage II, Stage III, and Stage IV. Drawing on the concept of dynamic network biomarkers, we constructed five networks: Normal, Normal–Stage I, Normal–Stage I–Stage II, Normal–Stage I–Stage II–Stage III, and Normal–Stage I–Stage II–Stage III–Stage IV. For each of these networks, we calculated the MFE values for each gene and miRNA (for details, please refer to Section 2.3). The top 10 genes and miRNA for each of these stages are shown in Table 2 and Table 3, respectively.
We analyzed the top ten genes and miRNAs based on their MFE values across the four clinical stages (Stage I to Stage IV) of COAD. Genes such as CDH17, FABP1, and CEACAM5 consistently ranked high in MFE values across multiple stages. For instance, CDH17 exhibited notable MFE values across the stages, indicating its stable relevance in COAD progression. Similarly, miRNAs like hsa-miR-21-5p and hsa-miR-143-3p were recurrently present in the top ten across all stages, further supporting their critical roles in the pathophysiology of COAD.
In Stage I, CDH17 was implicated in cell adhesion, and FABP1 was associated with fatty acid metabolism, both potentially influencing tumor cell growth and survival. Among the miRNAs, hsa-miR-21-5p was linked to cell proliferation and apoptosis, while hsa-miR-22-3p appeared to regulate the tumor microenvironment, influencing the early stages of cancer development. At Stage II, CEACAM5 and CDX2 played roles in tumor cell invasion and differentiation, respectively. hsa-miR-143-3p was found to inhibit tumor cell proliferation and migration, while hsa-let-7a-5p was involved in cell cycle regulation, suggesting its impact on the transition from early to more invasive stages of COAD.
In Stage III, KRT20 and SLC26A3 were associated with epithelial characteristics and ion transport, respectively, highlighting their involvement in tumor progression. The miRNA hsa-miR-10b-5p was implicated in promoting cell migration and invasion, whereas hsa-miR-99b-5p contributed to regulating cell growth and differentiation, indicating a complex regulatory network during this stage. At the advanced Stage IV, PRAP1 and MEP1A emerged as potential players, involved in protein hydrolysis and tumor progression. Notably, hsa-miR-375-3p was newly identified at this stage and may influence cell proliferation and apoptosis, while hsa-miR-92a-3p was linked to angiogenesis and tumor metastasis, highlighting their significance in advanced COAD.
We performed an intersection analysis of the top 10 genes across several stages. At the gene level, intersection analysis across different stages revealed six common genes present across all stages: CDH17, CDX2, CEACAM5, EPS8L3, KRT20, and MUC13, suggesting that these genes may play critical roles throughout the various stages of COAD (COAD) progression. Differential analysis identified stage-specific genes, such as FABP1, GPA33, and SLC26A3 in Stage I, and CDX1 and VIL1 in Stage II. At the miRNA level, four miRNAs were consistently found across all stages—hsa-miR-143-3p, hsa-miR-192-5p, hsa-miR-21-5p, and hsa-miR-22-3p—indicating their potential as key regulatory factors in the progression of COAD. Additionally, stage-specific miRNAs were observed, including hsa-let-7b-5p, hsa-miR-10a-5p, and hsa-miR-148a-3p in Stage I, and hsa-miR-103a-3p, hsa-miR-92a-3p, and hsa-miR-99b-5p in Stage II. These differential miRNAs may serve as potential biomarkers for distinct stages of COAD.
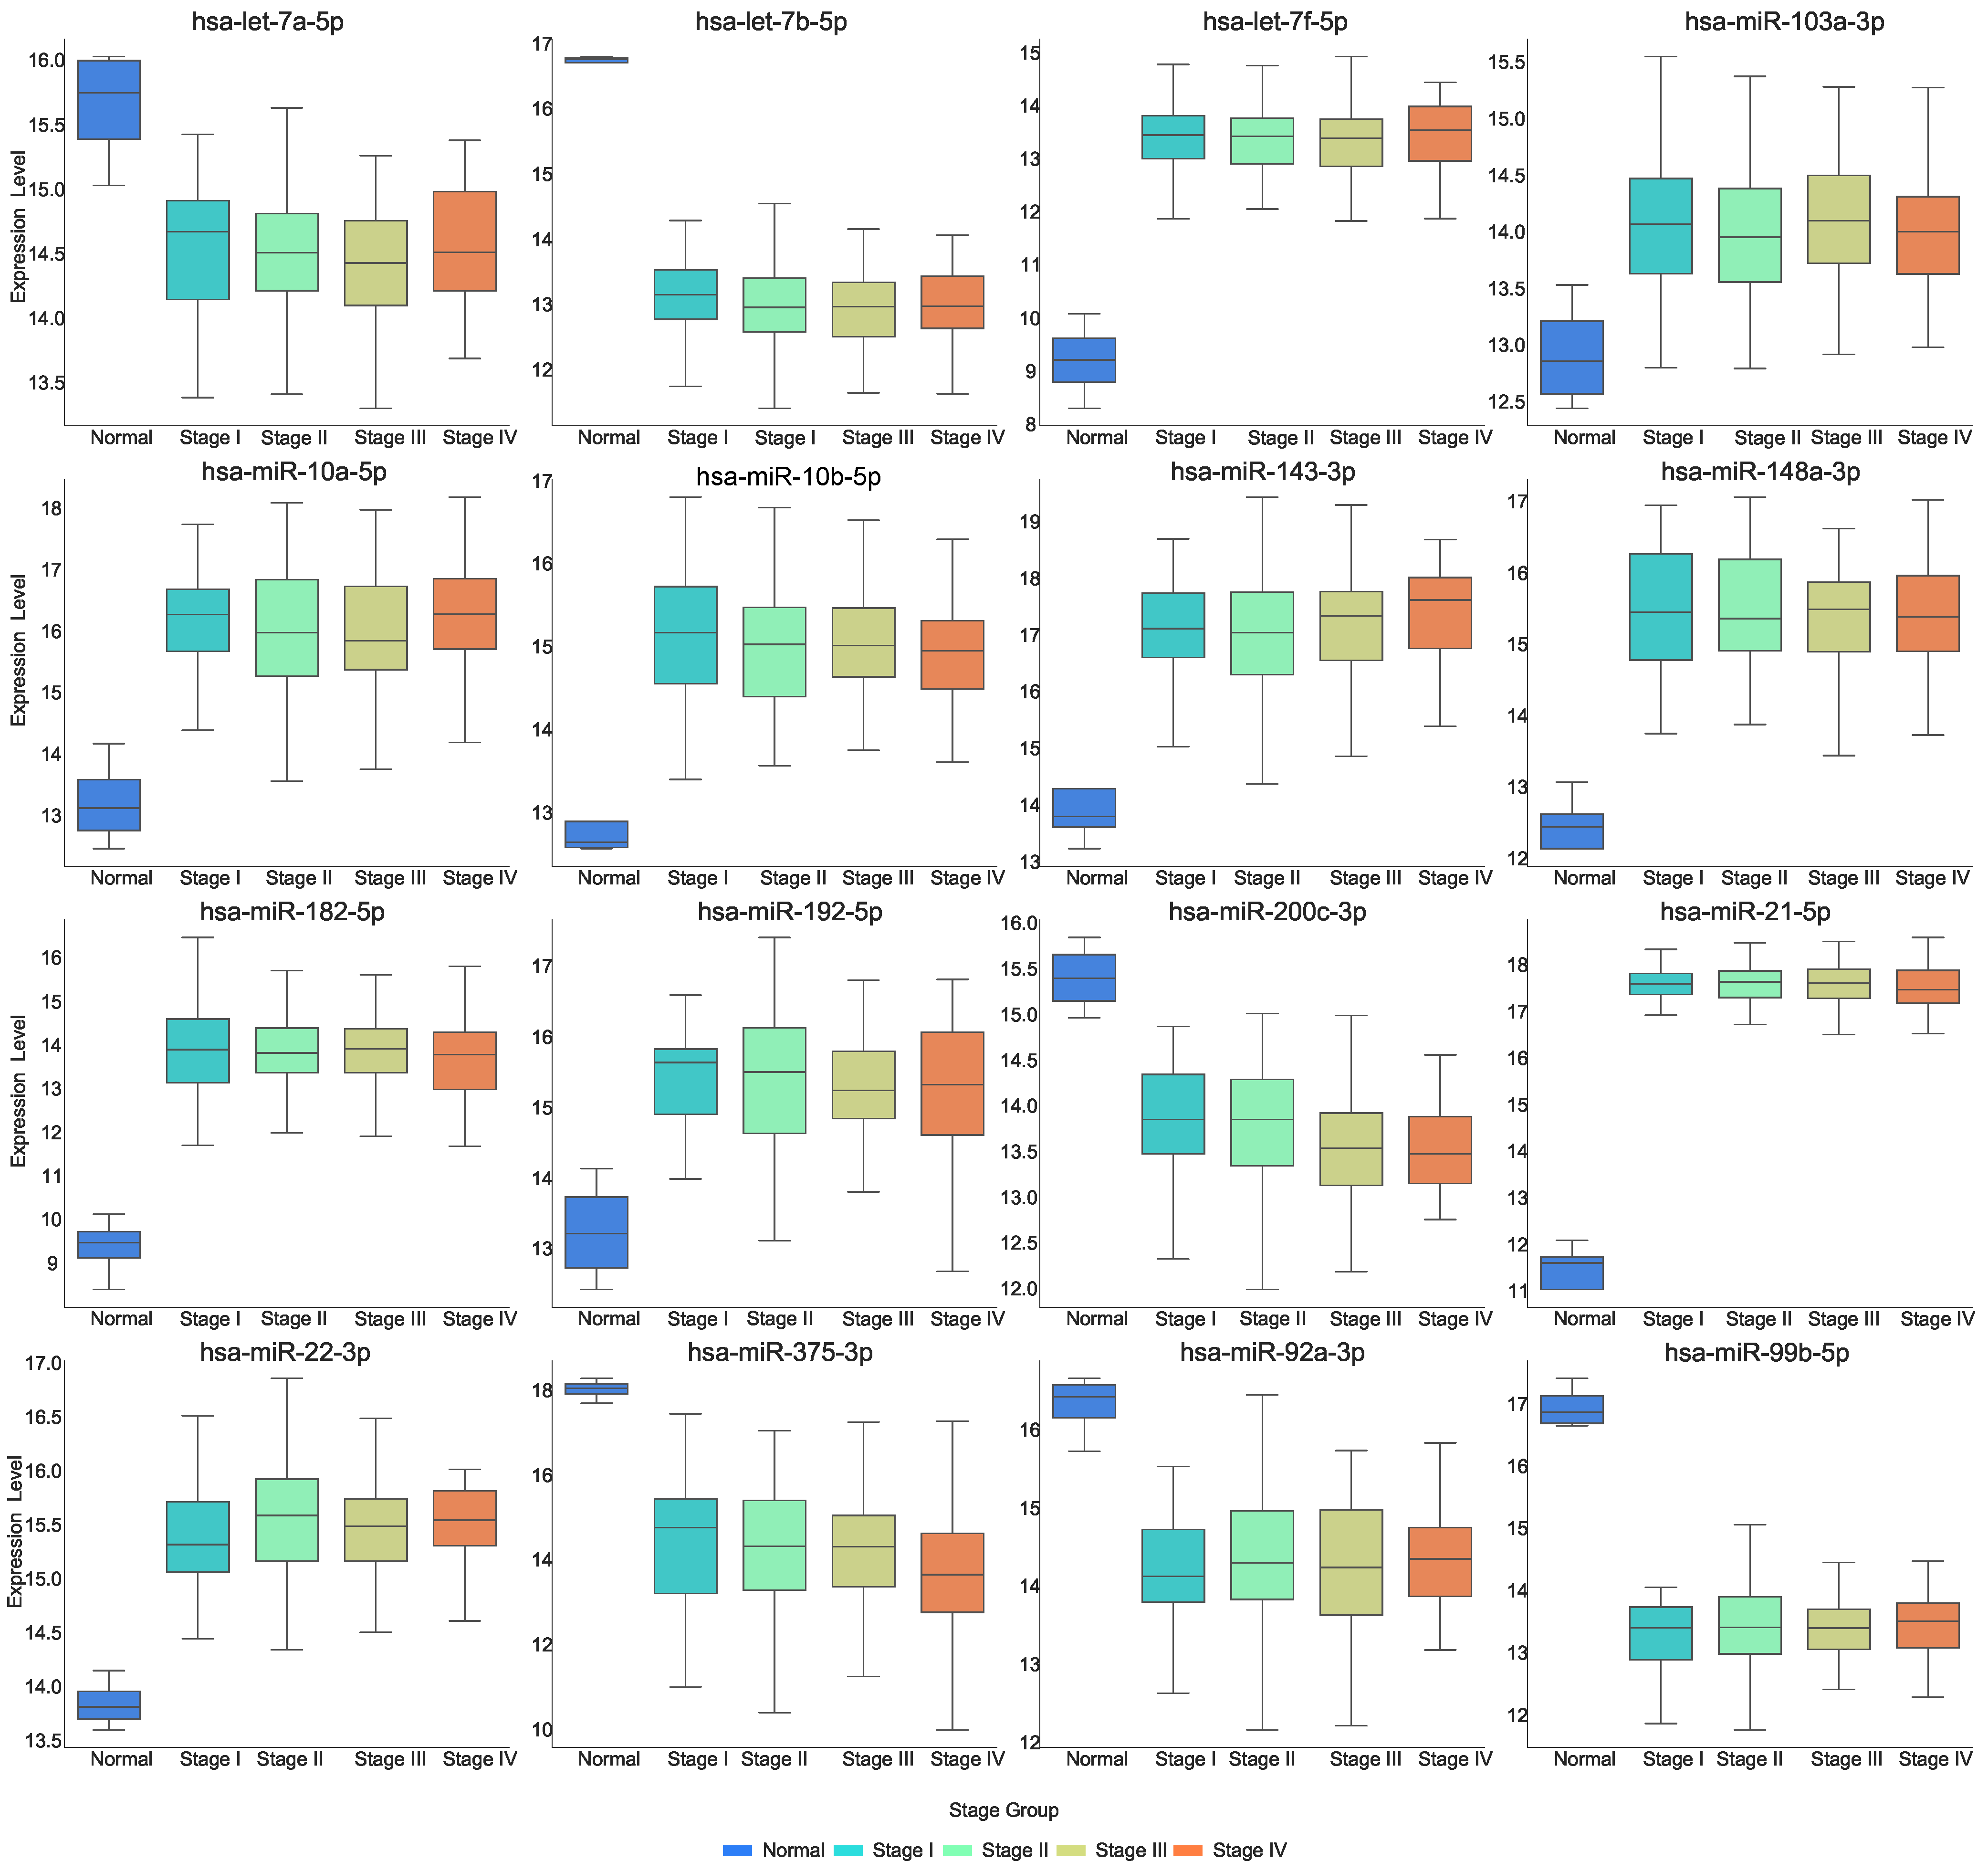
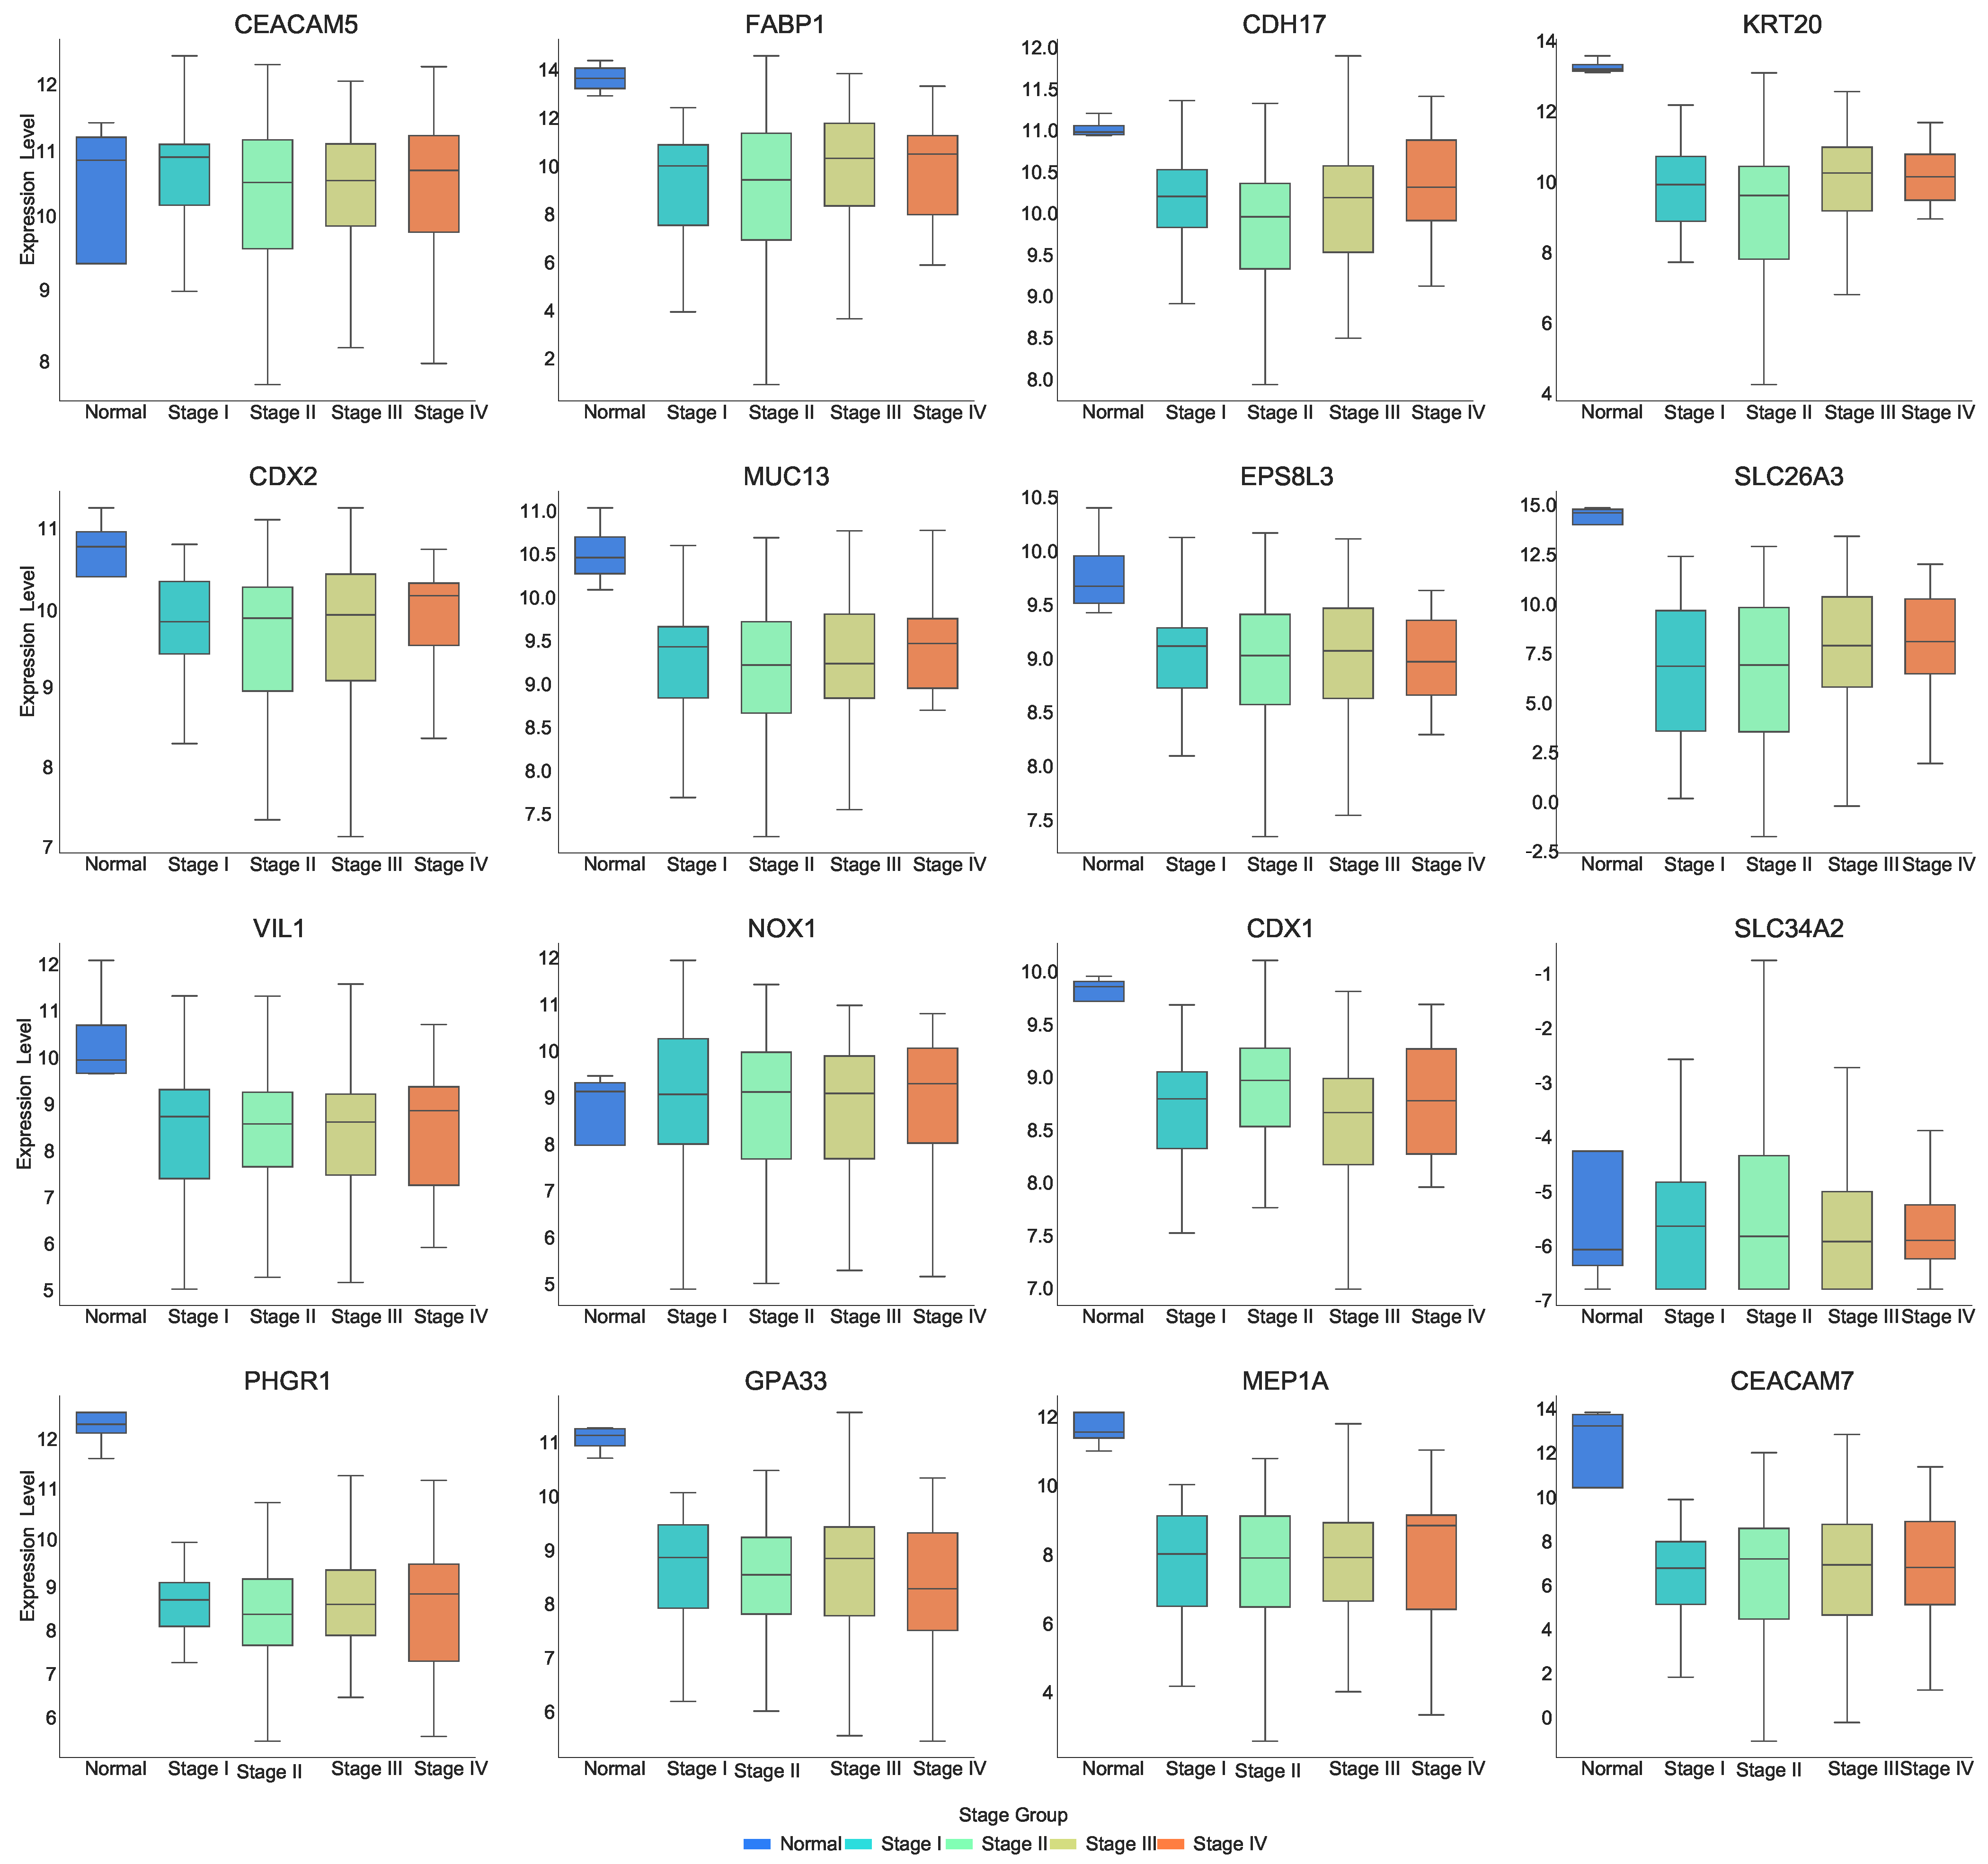
Figure 2 and Figure 3 show the expression distribution of multiple genes ranked high in their MFE values across different clinical stages of COAD. The x-axis represents the clinical stages, including “Normal” and “Stage I–Stage IV”, while the y-axis indicates gene expression levels. The following expression patterns are observed in the figure:
As can be seen in Figure 2, most of the genes are expressed at lower levels in the tumor stage compared to normal tissue. Genes such as CDX2, FABP1, KRT20, CDH17, MUC13, EPS8L3, SLC26A, VIL1, CDX1, PHGR1, GPA33, MEP1A, and CEACAM7 show lower expression in the “Stage I–Stage IV” stages compared to the “Normal” stage. Genes such as CEACAM5, CDH17, KRT20, MUC13, PHGR1, and GPA33 show significant downregulation in Stage II. CDH17 demonstrates a decrease in expression from “Normal” to Stage II, followed by an increase from Stage II to Stage IV, with the lowest expression observed at Stage II. CDX2 shows an increase in expression at Stage IV. SLC26A3 progressively increases its expression level as the disease advances. CDX1 exhibits an “N-shaped” expression pattern from Stage I to Stage IV. SLC34A2 shows an increase in expression from normal tissue to tumor stages. GPA33 shows a decrease in expression from Stage III to Stage IV, while MEP1A shows an increase in expression from Stage III to Stage IV. This suggests that these genes may be closely associated with the onset and progression of COAD, and their expression changes significantly as the disease advances, potentially playing crucial roles in tumor formation and progression.
Figure 3 demonstrates the expression of miRNAs at each stage. The expression of several miRNAs shows significant changes from normal to disease states. Specifically, hsa-let-7a-5p, hsa-let-7b-5p, hsa-miR-200c-3p, hsa-miR-375-3p, hsa-miR-92a-3p, and hsa-miR-99b-5p exhibit a marked decrease in expression as the disease progresses. In contrast, hsa-let-7f-5p, hsa-miR-103a-3p, hsa-miR-10a-5p, hsa-miR-10b-5p, hsa-miR-143-3p, hsa-miR-148a-3p, hsa-miR-182-5p, hsa-miR-192-5p, and hsa-miR-22-3p demonstrate a significant increase in expression from normal to disease states. Additionally, the expression of hsa-miR-143-3p increases as the disease progresses, while the expression level of hsa-miR-200c-3p and hsa-miR-375-3p decrease with disease progression.
Expression pattern analysis of key genes and miRNAs revealed that genes like CDX2, FABP1, and KRT20 exhibited higher expression levels in tumor stages compared to normal tissues, indicating their involvement in tumorigenesis. In contrast, miRNAs such as hsa-let-7a-5p and hsa-miR-375-3p showed decreased expression in tumor stages, reflecting their regulatory roles in maintaining normal cellular function and possibly acting as tumor suppressors. Moreover, these expression patterns underscore the dynamic regulatory landscape of COAD and highlight the potential of these genes and miRNAs as biomarkers for disease progression.
Furthermore, methylation analysis indicated that CDH17 and EPS8L3 were predominantly hypermethylated, with beta values ranging from 0.6 to 0.7, as shown in Figure 4. However, methylation changes were not observed across different stages for other genes, suggesting that their expression anomalies might be regulated through alternative mechanisms, such as miRNA interactions.
Our multi-stage network analysis identified conserved molecular drivers (e.g., CDH17, CEACAM5) and stage-dependent regulators (e.g., FABP1, PRAP1) through MFE quantification. The progressive downregulation of intestinal differentiation markers (e.g., CDX2, MUC13) coupled with miR-22-3p upregulation suggests a miRNA-mediated dedifferentiation mechanism during stage transitions. These dynamic patterns provide a molecular rationale for staging systems and highlight potential therapeutic windows for stage-specific interventions.

3.2. Revealing Potential Gene Pathogenesis via PPI Networks

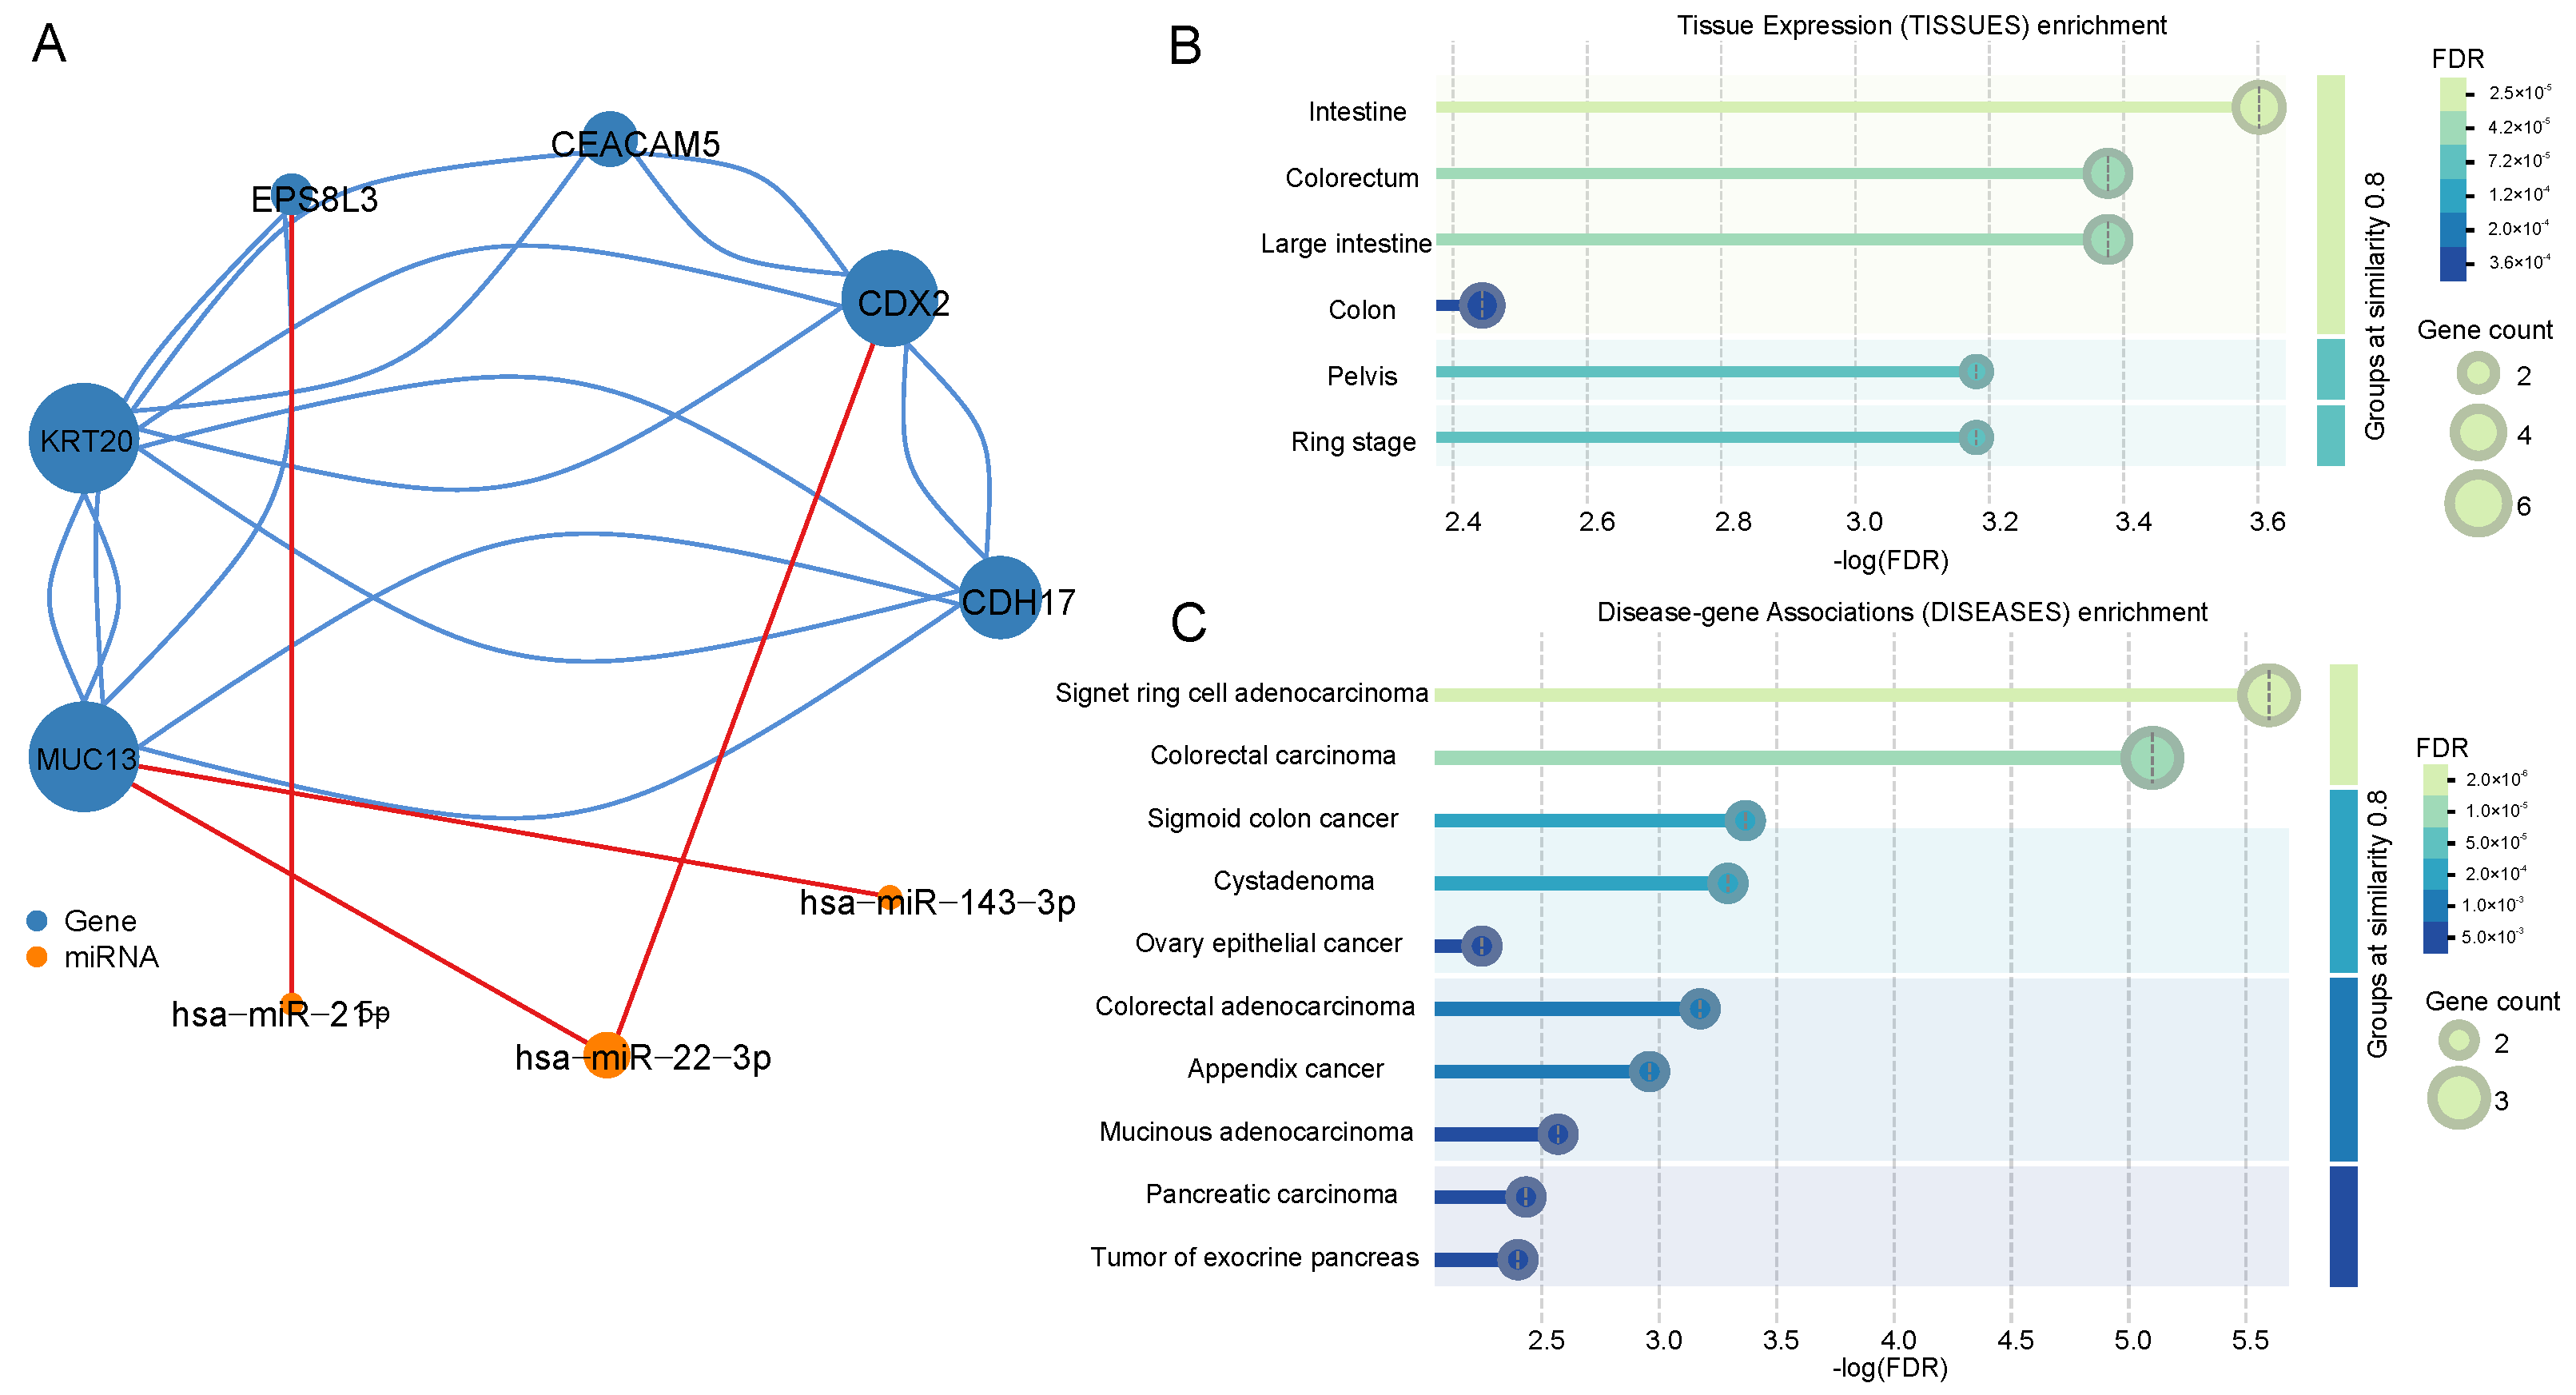
We identified the intersection of the top ten genes and miRNAs ranked by MFE values across different stages, indicating their potential importance at all stages. Since the co-expression network was constructed based on expression data, the actual functional roles of these genes and miRNAs remain unclear. Therefore, we constructed a functional interaction network for the core genes and miRNAs using the STRING database for protein–protein interactions and the miRTarBase database for miRNA–target interactions, as shown in Figure 5A [22,23]. The blue nodes represent genes, and the orange nodes represent miRNAs. We found that these genes form a connected network in their actual regulatory roles, revealing that KRT20 had the highest degree of connectivity, indicating its central role in the gene cluster. Additionally, hsa-miR-22-3p was found to regulate two key genes, CDX2 and MUC13, suggesting its importance in the regulatory network.
Using the STRING database, we performed tissue-specific expression clustering analysis and found that seven out of the top genes were enriched in the intestinal tract, as shown in Figure 5B,C. Specifically, CEACAM5, CDX2, and KRT20 were highly enriched in colorectal tissues, further validating their relevance to COAD. Disease enrichment analysis confirmed the strong association of these genes with COAD, with CEACAM5, CDX2, and KRT20 being significantly linked to colorectal adenocarcinoma. The low-log (FDR) values further supported the reliability of these findings.
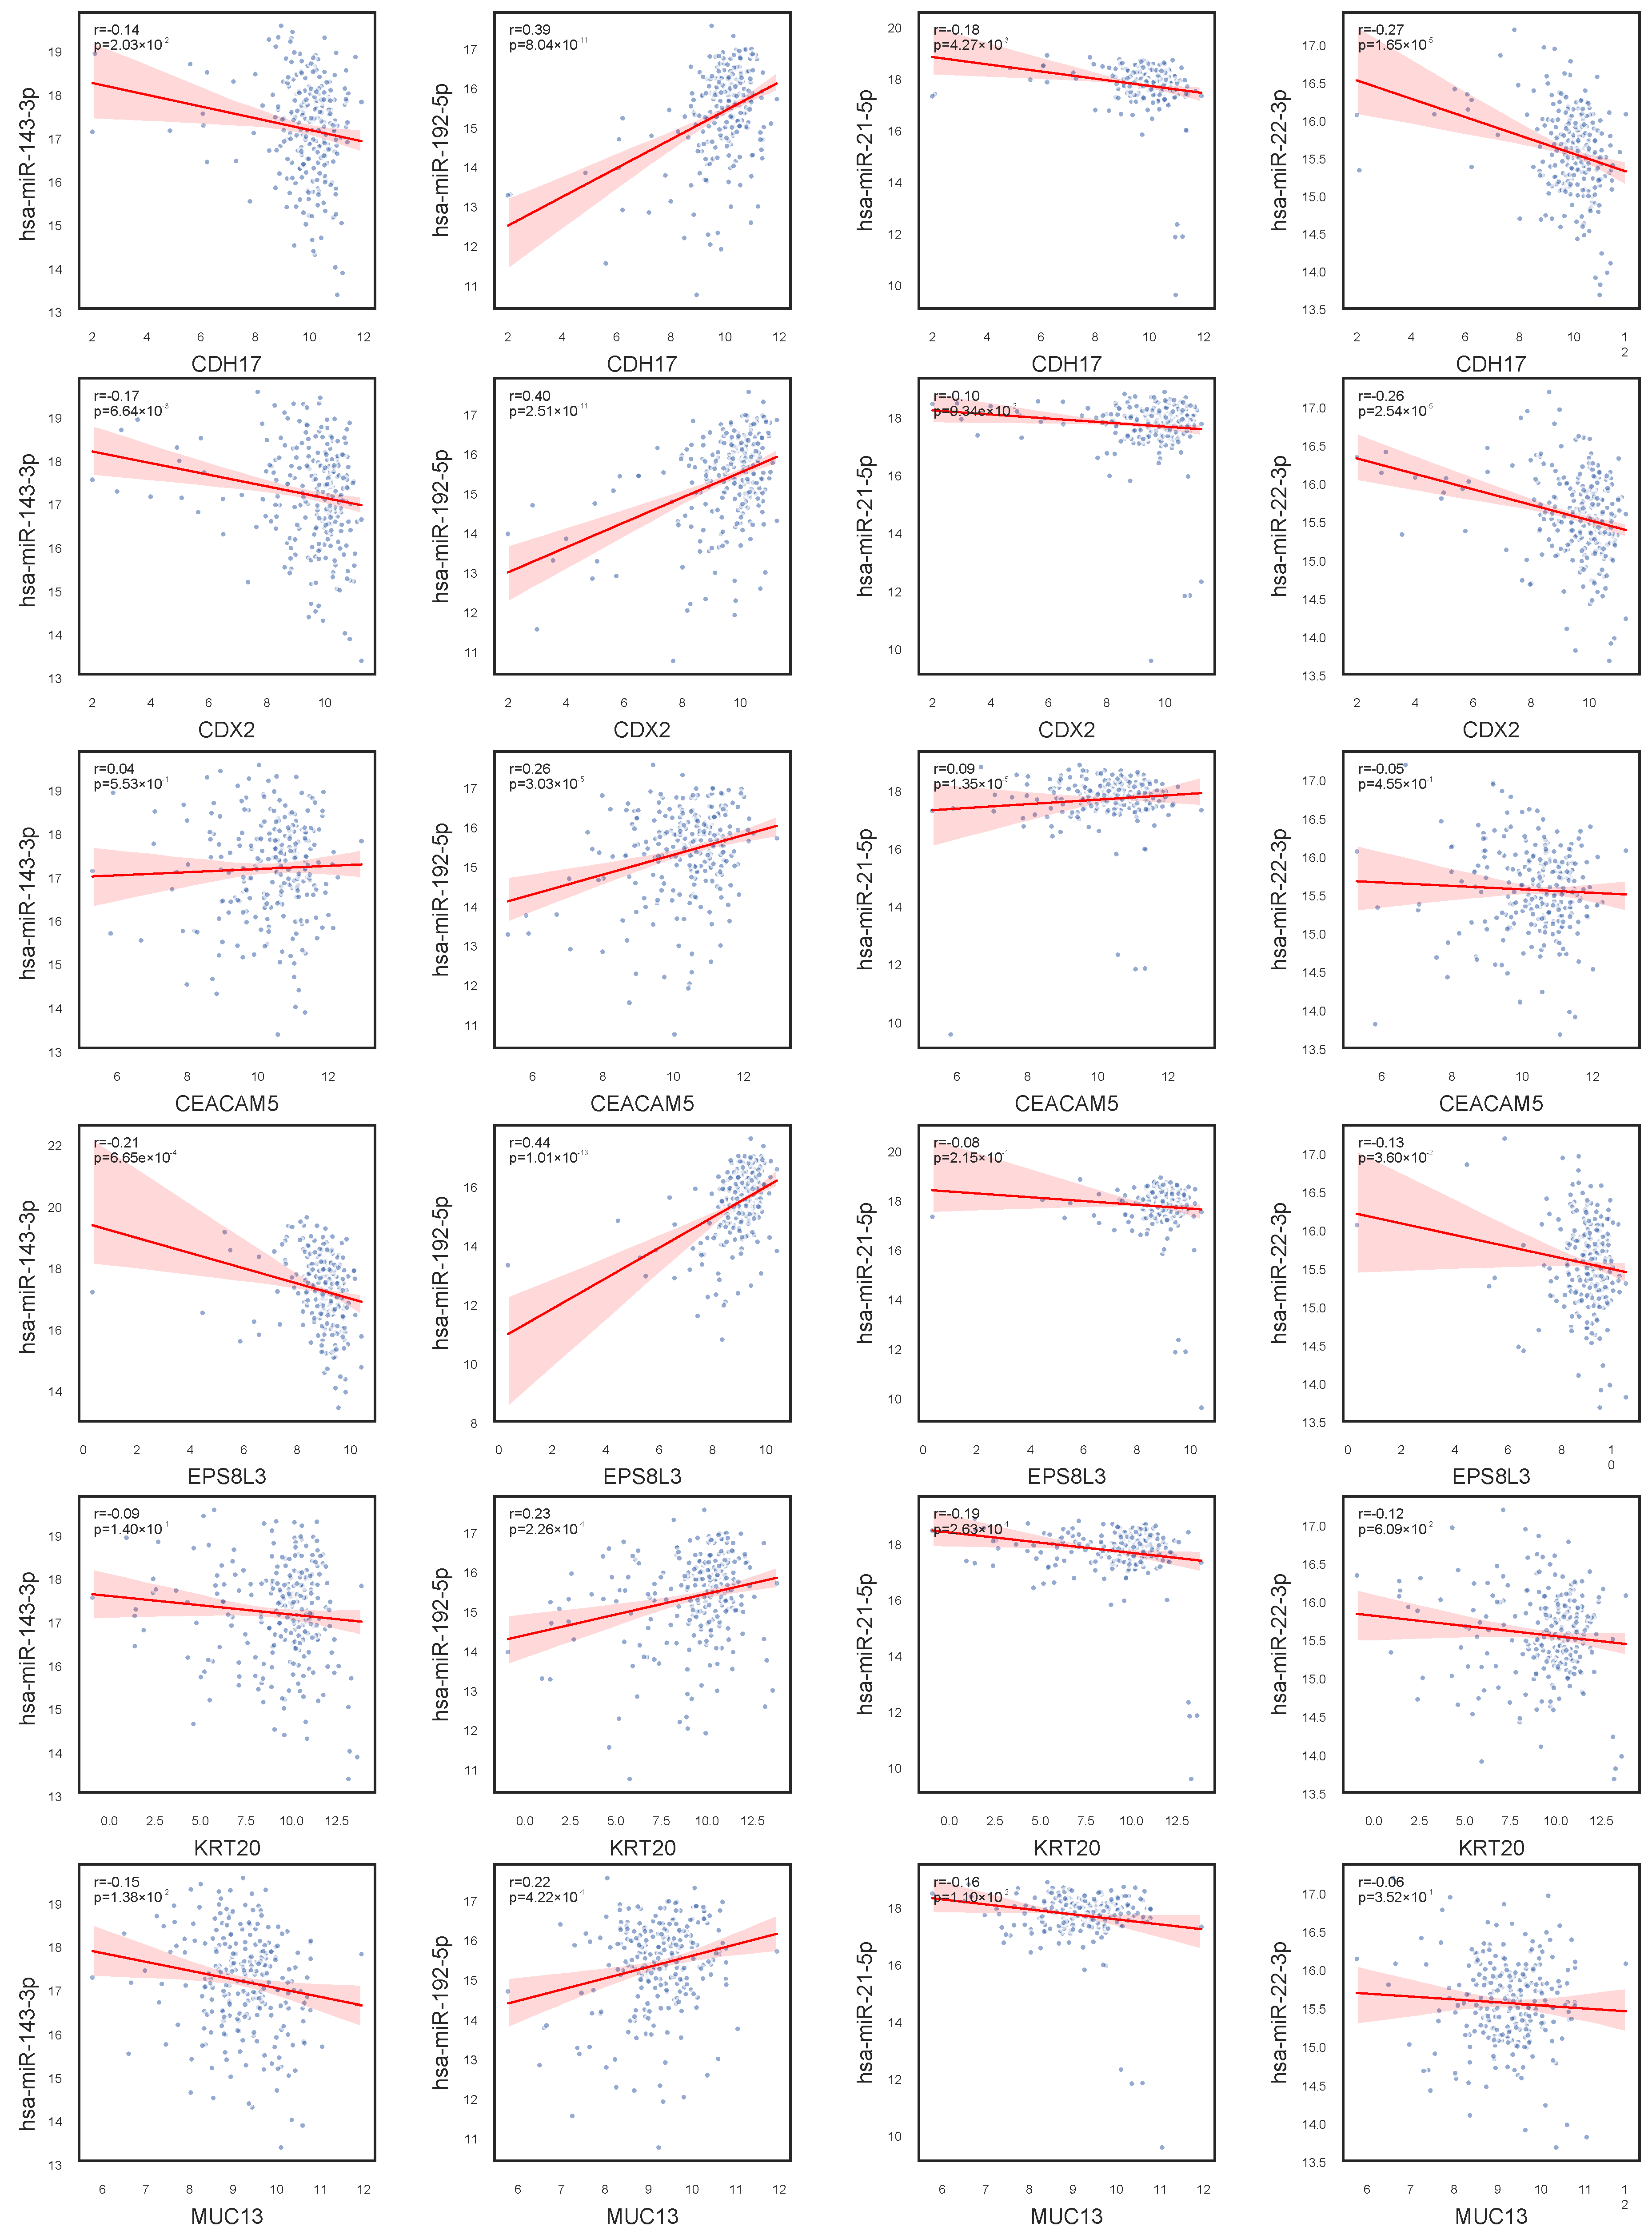
In our investigation of gene–miRNA expression relationships, as shown in Figure 6, we observed that hsa-miR-143-3p exhibits no significant correlation with CEACAM5 and KRT20 expression, but shows a negative correlation with other genes in the network, suggesting a potential inhibitory regulatory mechanism. In contrast, hsa-miR-192-5p demonstrates a positive correlation with the expression of CDH17, CDX2, CEACAM5, EPS8L3, KRT20, and MUC13, indicating a possible role in promoting their expression. Notably, hsa-miR-21-5p displays weak correlations with all studied genes, implying minimal involvement in their regulation under the current conditions. Furthermore, hsa-miR-22-3p exhibits a strong negative correlation with CDH17 and CDX2, and a weaker negative correlation with other genes, highlighting differential regulatory strengths across the network. These findings provide critical insights into gene regulatory networks and their implications in disease mechanisms.
We found interesting phenomena when looking at the relationship among CDX2, hsa-miR-22-3p, and MUC13. As observed in Figure 1, CDX2 and MUC13 exhibit a similar expression pattern: their expression levels decrease from the Normal stage to Stage II, potentially influenced by tumor progression, and then recover in Stages III and IV. Additionally, Figure 2 shows that hsa-miR-22-3p has a very low expression level in normal samples but significantly increases upon disease onset, with a further upward trend across stages. This suggests that hsa-miR-22-3p may regulate the expression of CDX2 and MUC13 in COAD. To validate this hypothesis, we analyzed the correlation between the expression of these genes and the miRNA, as shown in Figure 6. The results indicate a negative correlation between hsa-miR-22-3p and the expression of both CDX2 and MUC13, supporting its potential regulatory role in COAD.
There has been extensive literature demonstrating that the genes CDX2 and MUC13 play important roles in the development of COAD. CDX2 was found to inhibit tumor cell proliferation by regulating the Wnt/ β -catenin signaling pathway. Knockdown of CDX2 promoted tumor growth, while its overexpression suppressed tumor formation. Additionally, CDX2 is a prognostic biomarker in Stage II and Stage III colon cancer [24]. MUC13 was overexpressed in COAD tissues and was associated with increased tumor cell growth, migration, and invasion. It was also found to interact with the JAK2/STAT5 signaling pathway and the oncoprotein YAP1, suggesting its role in tumor metastasis [25]. Hsa-miR-22-3p, although less studied in COAD, is hypothesized to regulate multiple oncogenic processes, including cell proliferation, cycle progression, apoptosis, and migration based on the established regulatory paradigms of miRNAs in colorectal carcinogenesis [26].

3.3. Molecular Signatures of Gender Differences in COAD

We constructed miRNA–gene co-expression networks for males and females and calculated MFE separately using the workflow in the Materials and Methods section. Gender-stratified co-expression network analysis identified conserved and gender-dimorphic regulatory architectures in CRC pathogenesis. As shown in Table 4, the top ten MFE genes in both the male and female networks include CDH17, CDX2, CEACAM5, EPS8L3, FABP1, KRT20, MUC13, NOX1, VIL1, and hsa-let-7a-5p, hsa-miR-10a-5p, hsa-miR-143-3p, hsa-miR-148a-3p, hsa-miR-192-5p, hsa-miR-21-5p, and hsa-miR-22-3p. As observed in Section 3.2, many of these genes and miRNAs overlap with the nodes in the core network, further supporting their relevance within the network context.
CEACAM5 and KRT20 ranked in the top two positions in both male and female patients, consistent with their well-established roles as classical biomarkers for COAD [27]. The high rankings of CDH17 and CDX2 suggest that abnormal intestinal epithelial differentiation is a central event in both sexes. The male-specific SLC26A3, associated with intestinal mucosal pH regulation, may promote carcinogenesis through dysregulated interactions with gut microbiota [28]. In contrast, the female-specific GPA33, a gene related to intestinal epithelial cell surface antigens [29], may play a role in specific phenotypes or immune evasion processes in female COAD. These findings indicate potential differences in immune evasion mechanisms or tumor microenvironments between male and female COADs.
hsa-miR-21-5p and hsa-miR-143-3p occupy central positions in both sexes, aligning with previous studies that demonstrate that miR-21 promotes proliferation via the PTEN/AKT pathway, while miR-143 suppresses metastasis through KRAS inhibition [30,31]. The male-specific hsa-miR-200c-3p may regulate epithelial–mesenchymal transition (EMT) via ZEB1 [32], whereas the female-specific hsa-miR-375-3p has been shown to interact with estrogen receptor signaling [33].
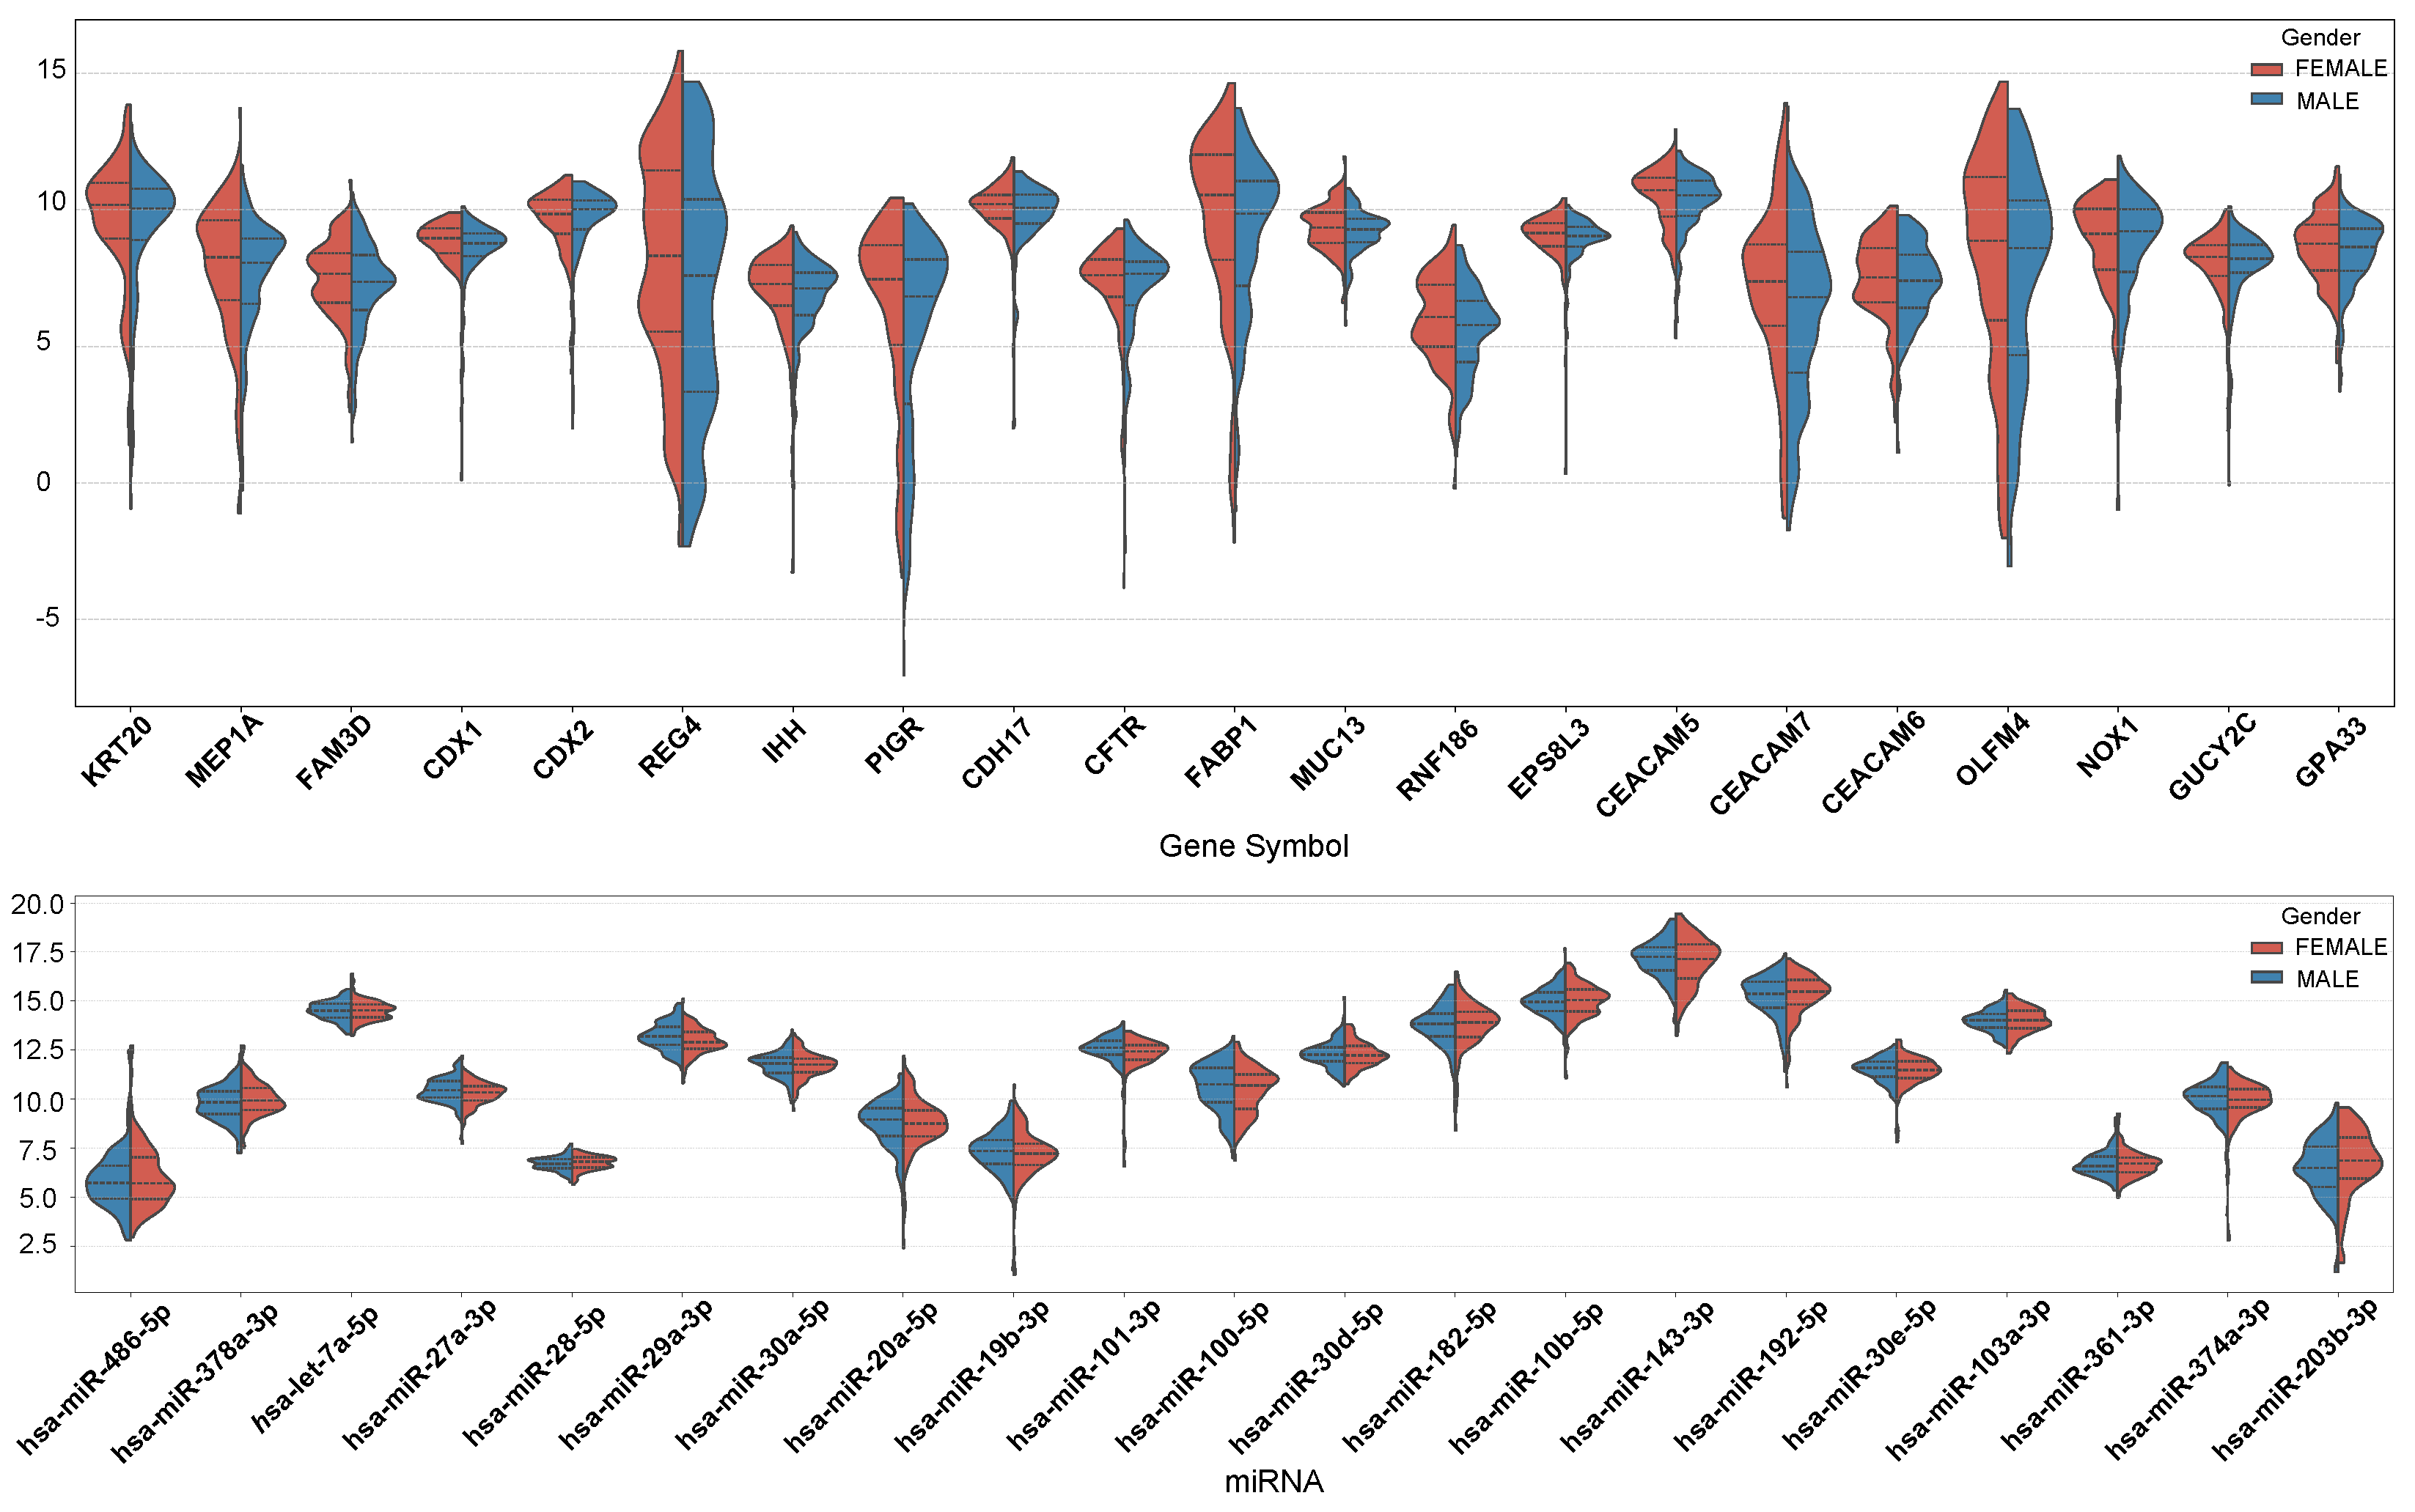
In Figure 7, we present the expression profiles of the top 10 genes with the highest MFE values in both males and females, as well as the top 10 genes with the highest MFE value differences between males and females. The overall expression levels of MEP1A, REG4, IHH, PIGR, FABP1, RNF186, CEACAM7, and OLFM4 were lower in males than in females. On the other hand, the expression levels of hsa-miR-27a-3p, hsa-miR-29a-3p, hsa-miR-101-3p, and hsa-miR-100-5p were slightly higher in males than in females. Conversely, hsa-miR-378a-3p, hsa-miR-192-5p, and hsa-miR-203b-3p exhibited higher expression in females.
MEP1A promotes COAD invasion and metastasis by activating the EGFR-PI3K-Akt pathway and cleaving E-cadherin. REG4 enhances cell proliferation and chemoresistance via EGFR signaling-driven upregulation of anti-apoptotic proteins (Bcl-2/Bcl-xL). IHH may influence tumor progression indirectly by modulating intestinal stem cell dynamics or immune microenvironments. PIGR acts as a tumor suppressor, with low expression linked to poor prognosis, and its upregulation regulates immune responses and fatty acid metabolism. FABP1 likely supports cancer growth through fatty acid metabolic reprogramming. RNF186 suppresses tumorigenesis by inhibiting NF-κB signaling, while its deficiency exacerbates CRC burden. CEACAM7, downregulated in CRC, loses cell adhesion capacity to facilitate cancer spread. OLFM4 is associated with intestinal stem cell properties, affecting tumor initiation and differentiation. There are no relevant studies demonstrating a specific correlation between these genes and sex, but their combined role in proliferation, apoptosis, metabolism, and micro-environmental remodeling determines the degree of malignancy of CRC.
These findings not only provide a molecular basis for explaining gender differences in COAD incidence and treatment responses but also highlight the necessity of gender-stratified strategies in clinical practice.

3.4. Age-Related Molecular Characteristics in COAD

Similarly, we constructed miRNA–gene co-expression networks for patient samples of different age groups (<50, 50–70, 70+) and calculated the MFE values of each gene and miRNA in different networks separately, and the top 10 genes and miRNA in each age group are shown in Table 4. It is very obvious from Table 5 that the top ten genes for under 50 years of age are completely different from the top ten genes for 50–70 and 70+, while nine of the top ten genes for 50–70 and 70+ are the same. This also proves that colon cancer patients younger than 50 years old have a different pathogenesis than patients older than 50 years old. However, at the miRNA level, seven of the top ten miRNA in the three age groups were the same, suggesting that at the miRNA level, the <50 group is similar to the 50–70 and 70+ groups in terms of pathogenic mechanisms.
The middle-aged and old groups exhibit a high degree of overlap in their key gene profiles, which are primarily involved in classic pathways such as cell differentiation (CDX2) [34], adhesive junctions (CDH17) [35], and tumor antigen presentation (CEACAM5) [36]. These pathways align closely with the phenotypic characteristics of adenocarcinoma in colon cancer. Notably, CEACAM5, as a broad-spectrum carcinoembryonic antigen, has shown a positive correlation between its expression level and tumor stage across multiple cohorts, suggesting that it may serve as a significant prognostic indicator in middle-aged and elderly patients. In contrast, the unique gene combinations in the young group are more involved in chromatin remodeling (regulation of the SWI/SNF complex by ZNHIT2) [37] and metabolic transport (SLC family pathways) [38], potentially associated with the more aggressive and poorly differentiated clinical features of colon cancer in younger patients.
Both hsa-miR-21-5p and hsa-miR-143-3p are ranked in the top 10 across all three groups, and their pan-cancer regulatory roles have been widely recognized [30,31]. The sustained high expression of these miRNAs suggests their central role in the development of colon cancer. Notably, hsa-miR-194-5p, specific to the elderly group, has been confirmed to regulate intestinal epithelial differentiation by targeting CDX1. This creates a negative feedback loop with the upregulation of CDX1 in the elderly group, which may reflect a compensatory activation of differentiation regulatory networks within the tumor microenvironment of older individuals [39].
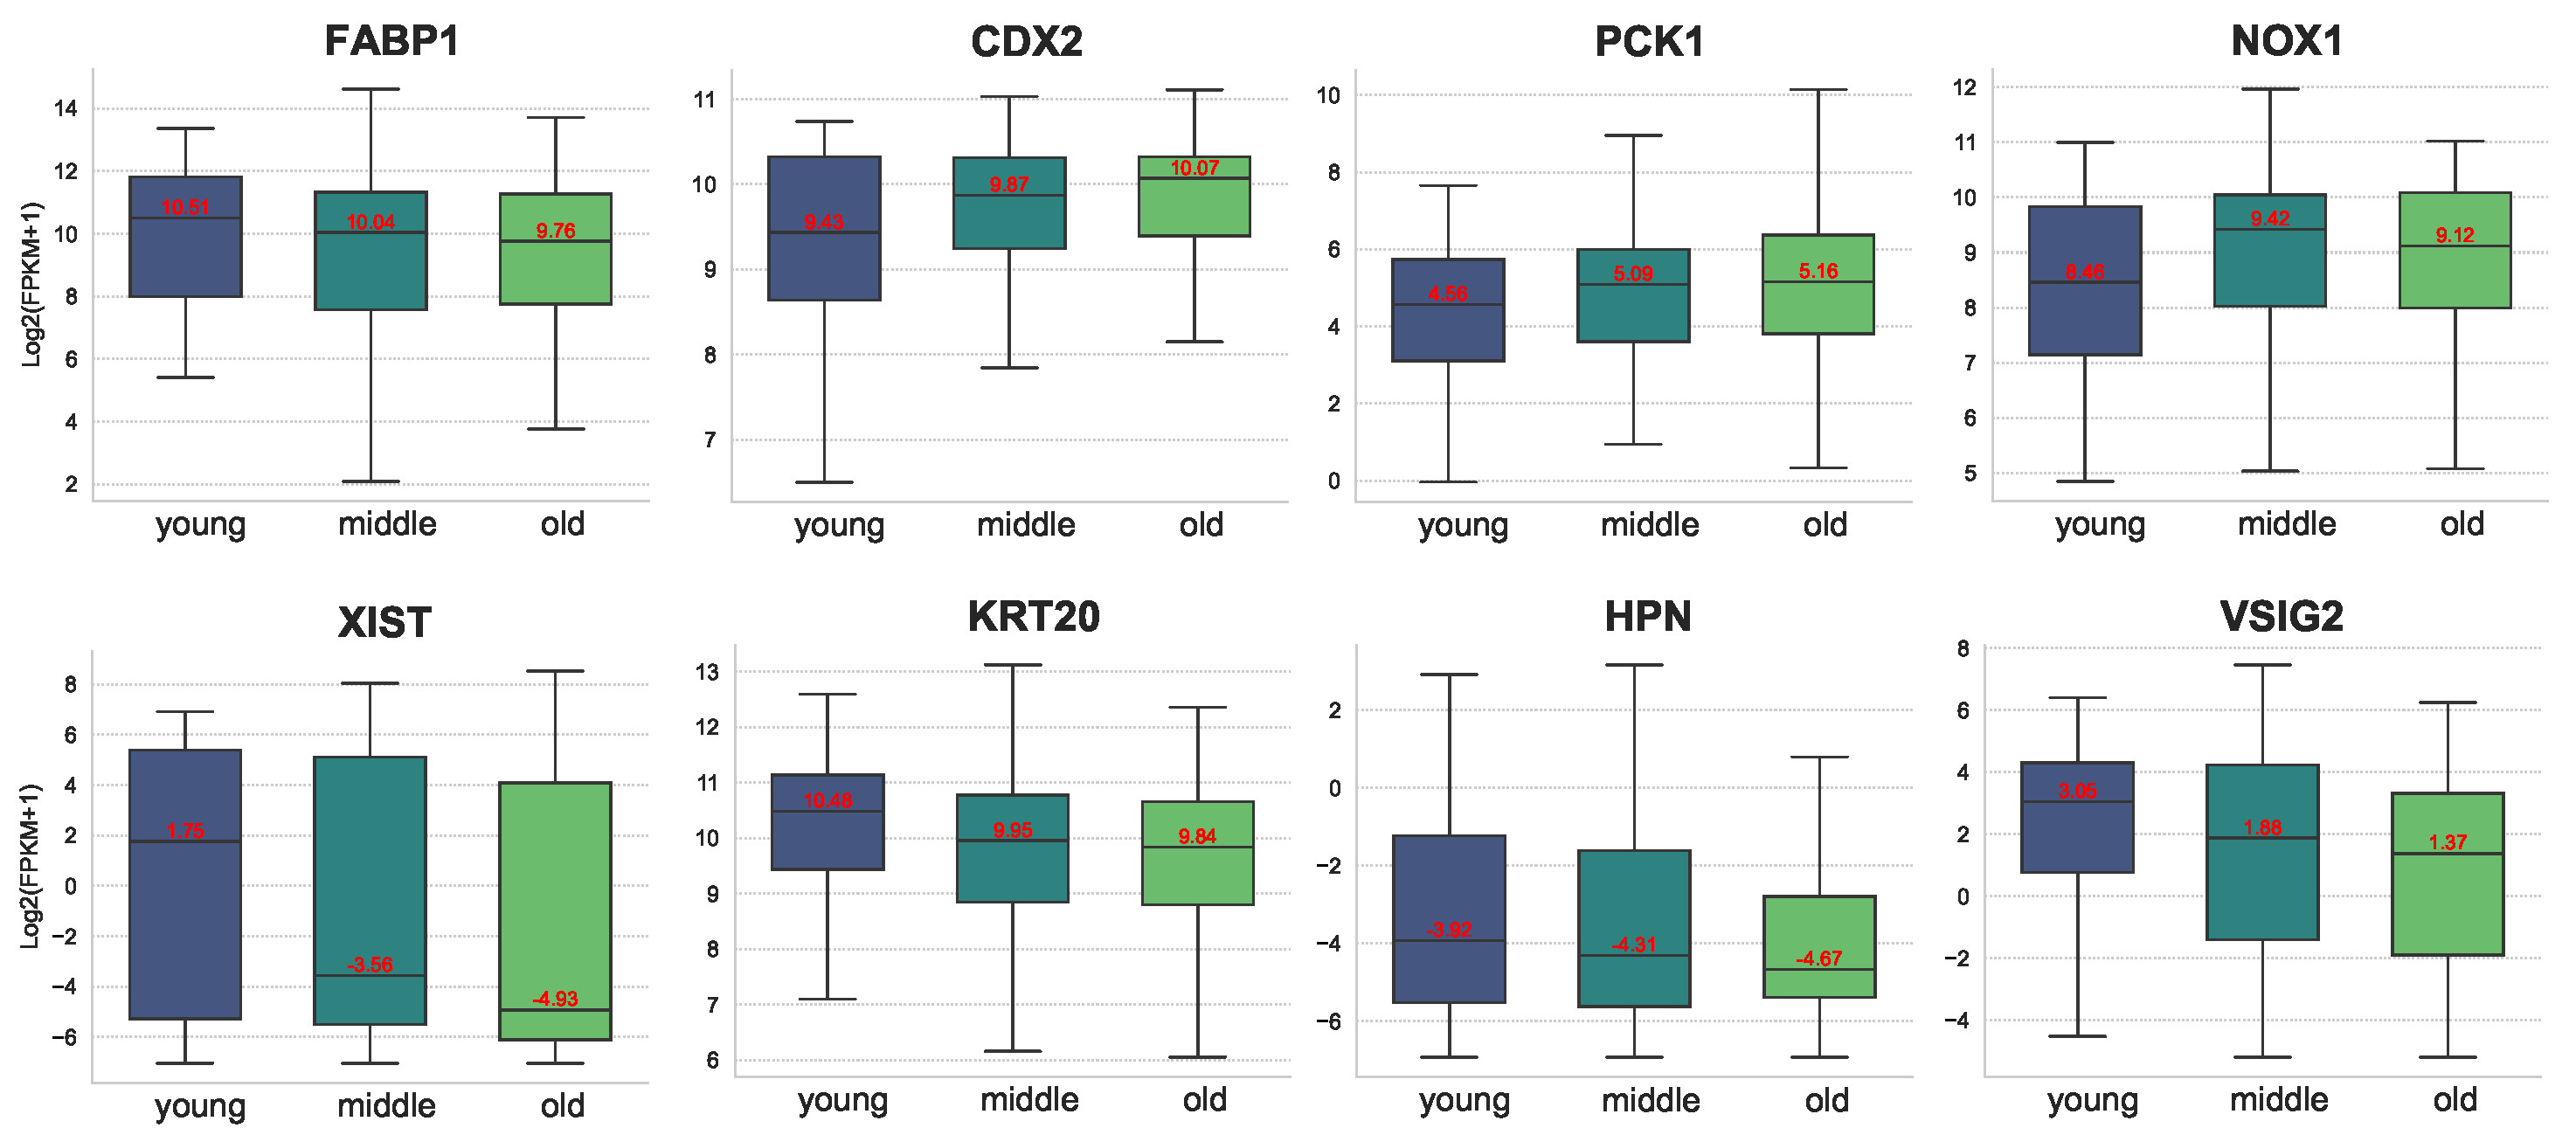
Figure 8 illustrates the expression of some of the differential genes at different ages. As can be seen from the figure, the expression of FABP1, XIST, KRT20, HPN, and VSIG2 gradually decreased with age. In particular, for XIST, the expression difference between the young group and the middle group is huge. In contrast, the expression of CDX2, PCK1, and NOX1 increased with age. In contrast, the expression of CDX2, PCK1, and NOX1 increased with age. Related studies have shown that high expression of XIST is associated with poor overall survival in COAD patients. Knockdown of XIST significantly inhibited COAD cell proliferation, invasion, epithelial–mesenchymal transition (EMT), and COAD stem cell formation in vitro, as well as tumor growth and metastasis in vivo. Thus, gene XIST is likely to be a potential age-related marker for colon cancer.
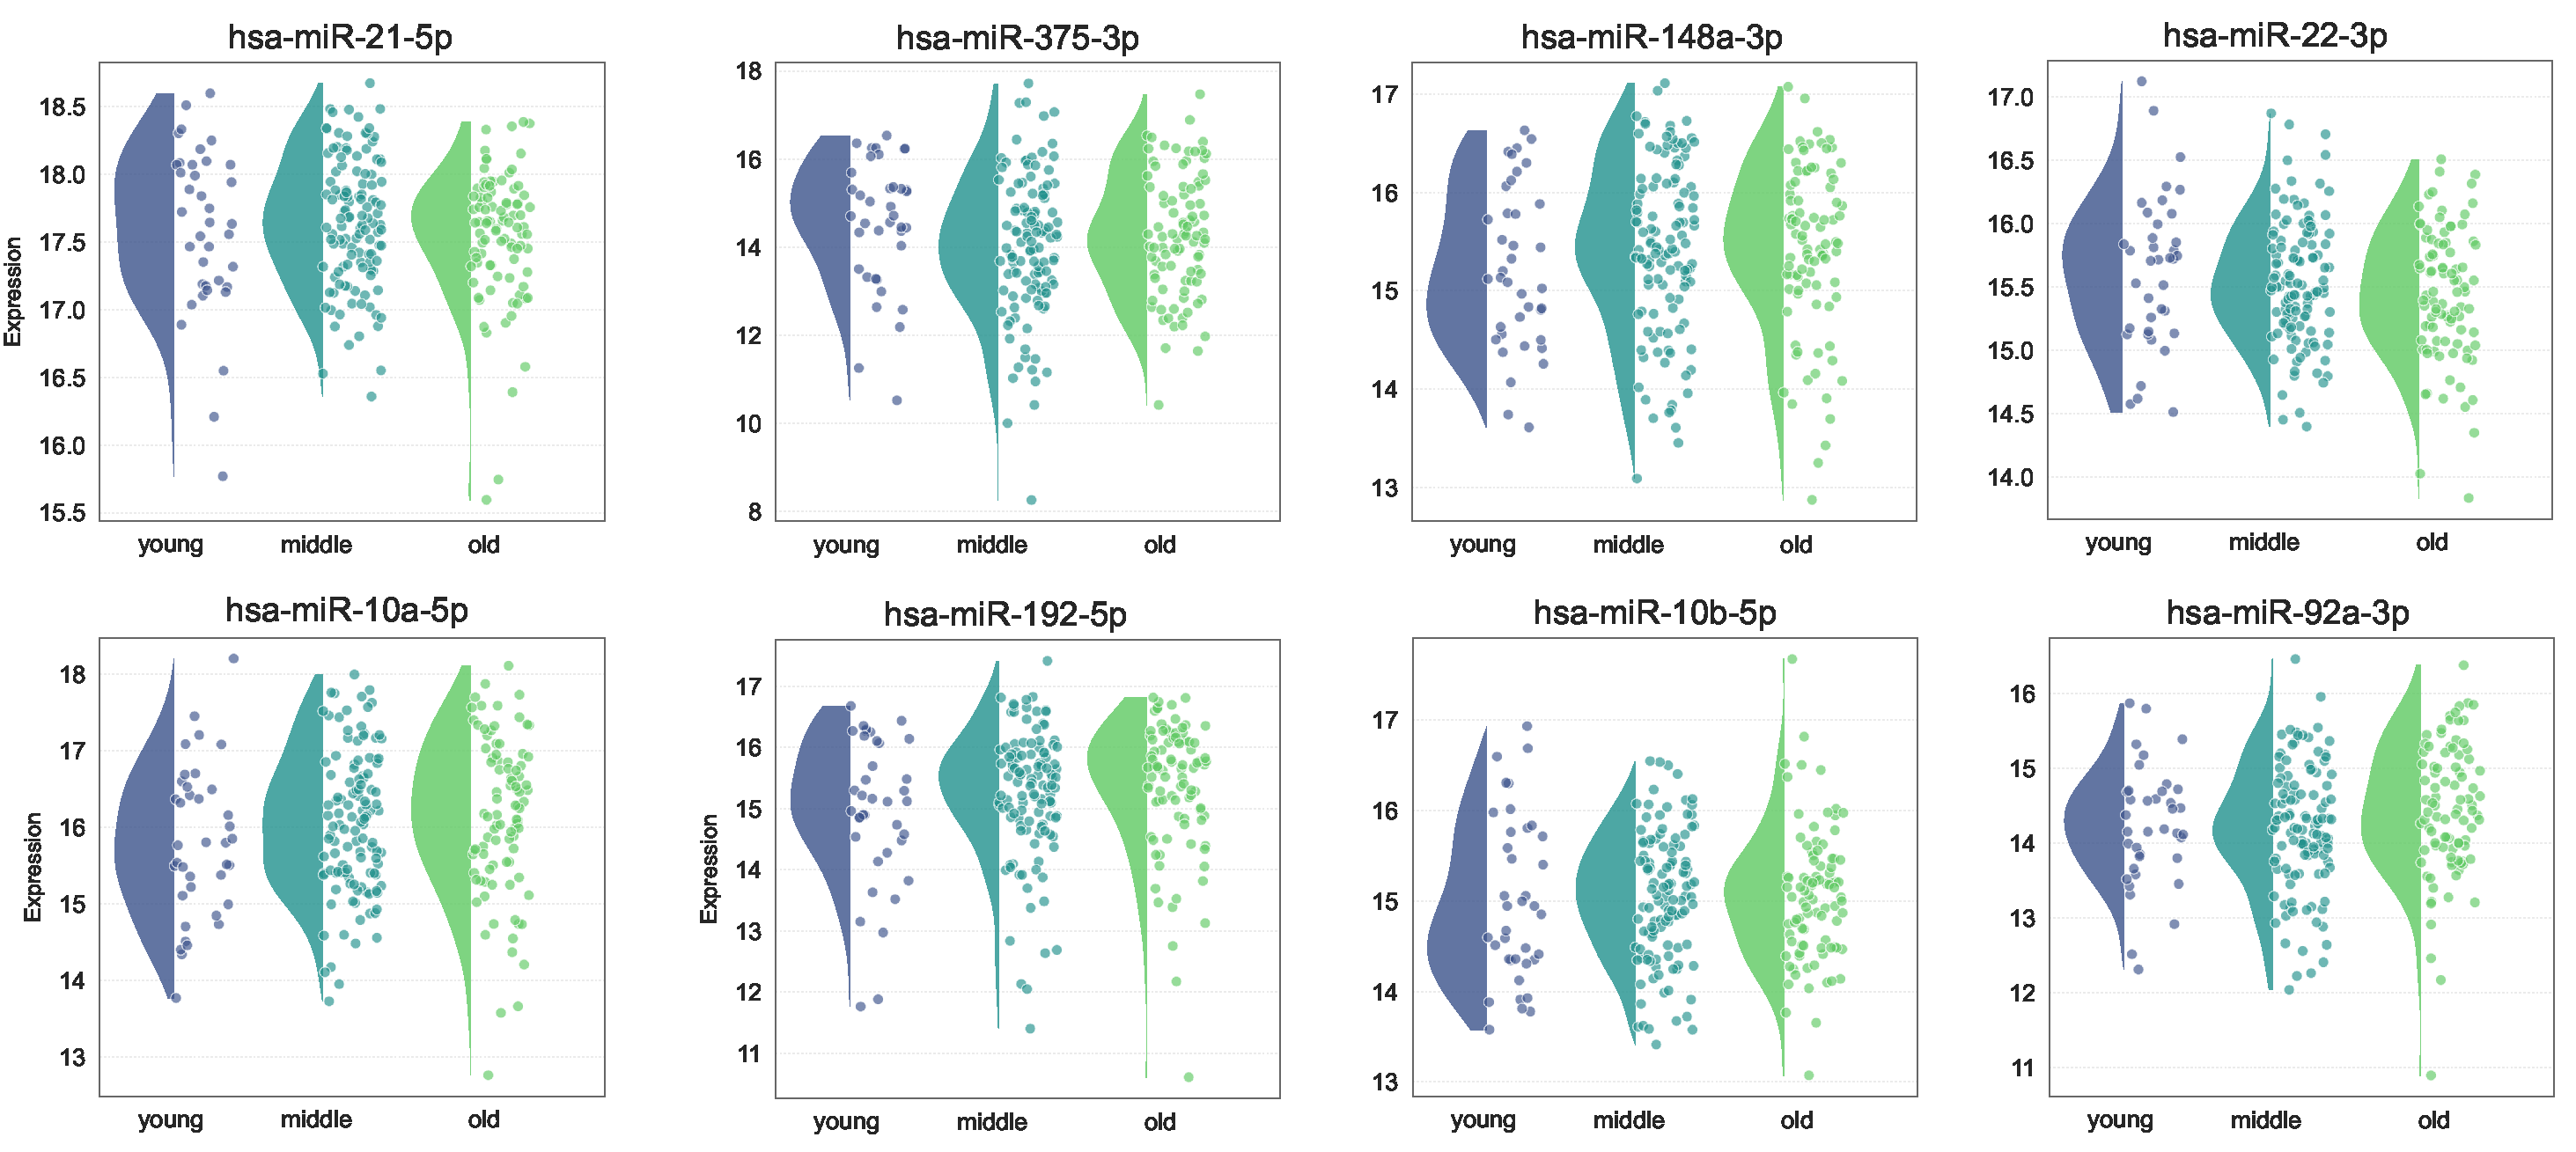
Figure 9 illustrates the expression of some miRNAs with differential expression levels across different age groups. hsa-miR-148a-3p, hsa-miR-192-5p, and hsa-miR-10b-5p were more highly expressed in the middle and old age groups than in the young age group. On the other hand, hsa-miR-375-3p and hsa miR-22-3p exhibited higher expression levels in the younger age group. Among them, hsa-miR-148a-3p, hsa-miR-375-3p, and hsa miR-22-3p have been proven to be biomarkers in CRC.

3.5. Potential Drug Screening Based on Core Network Genes

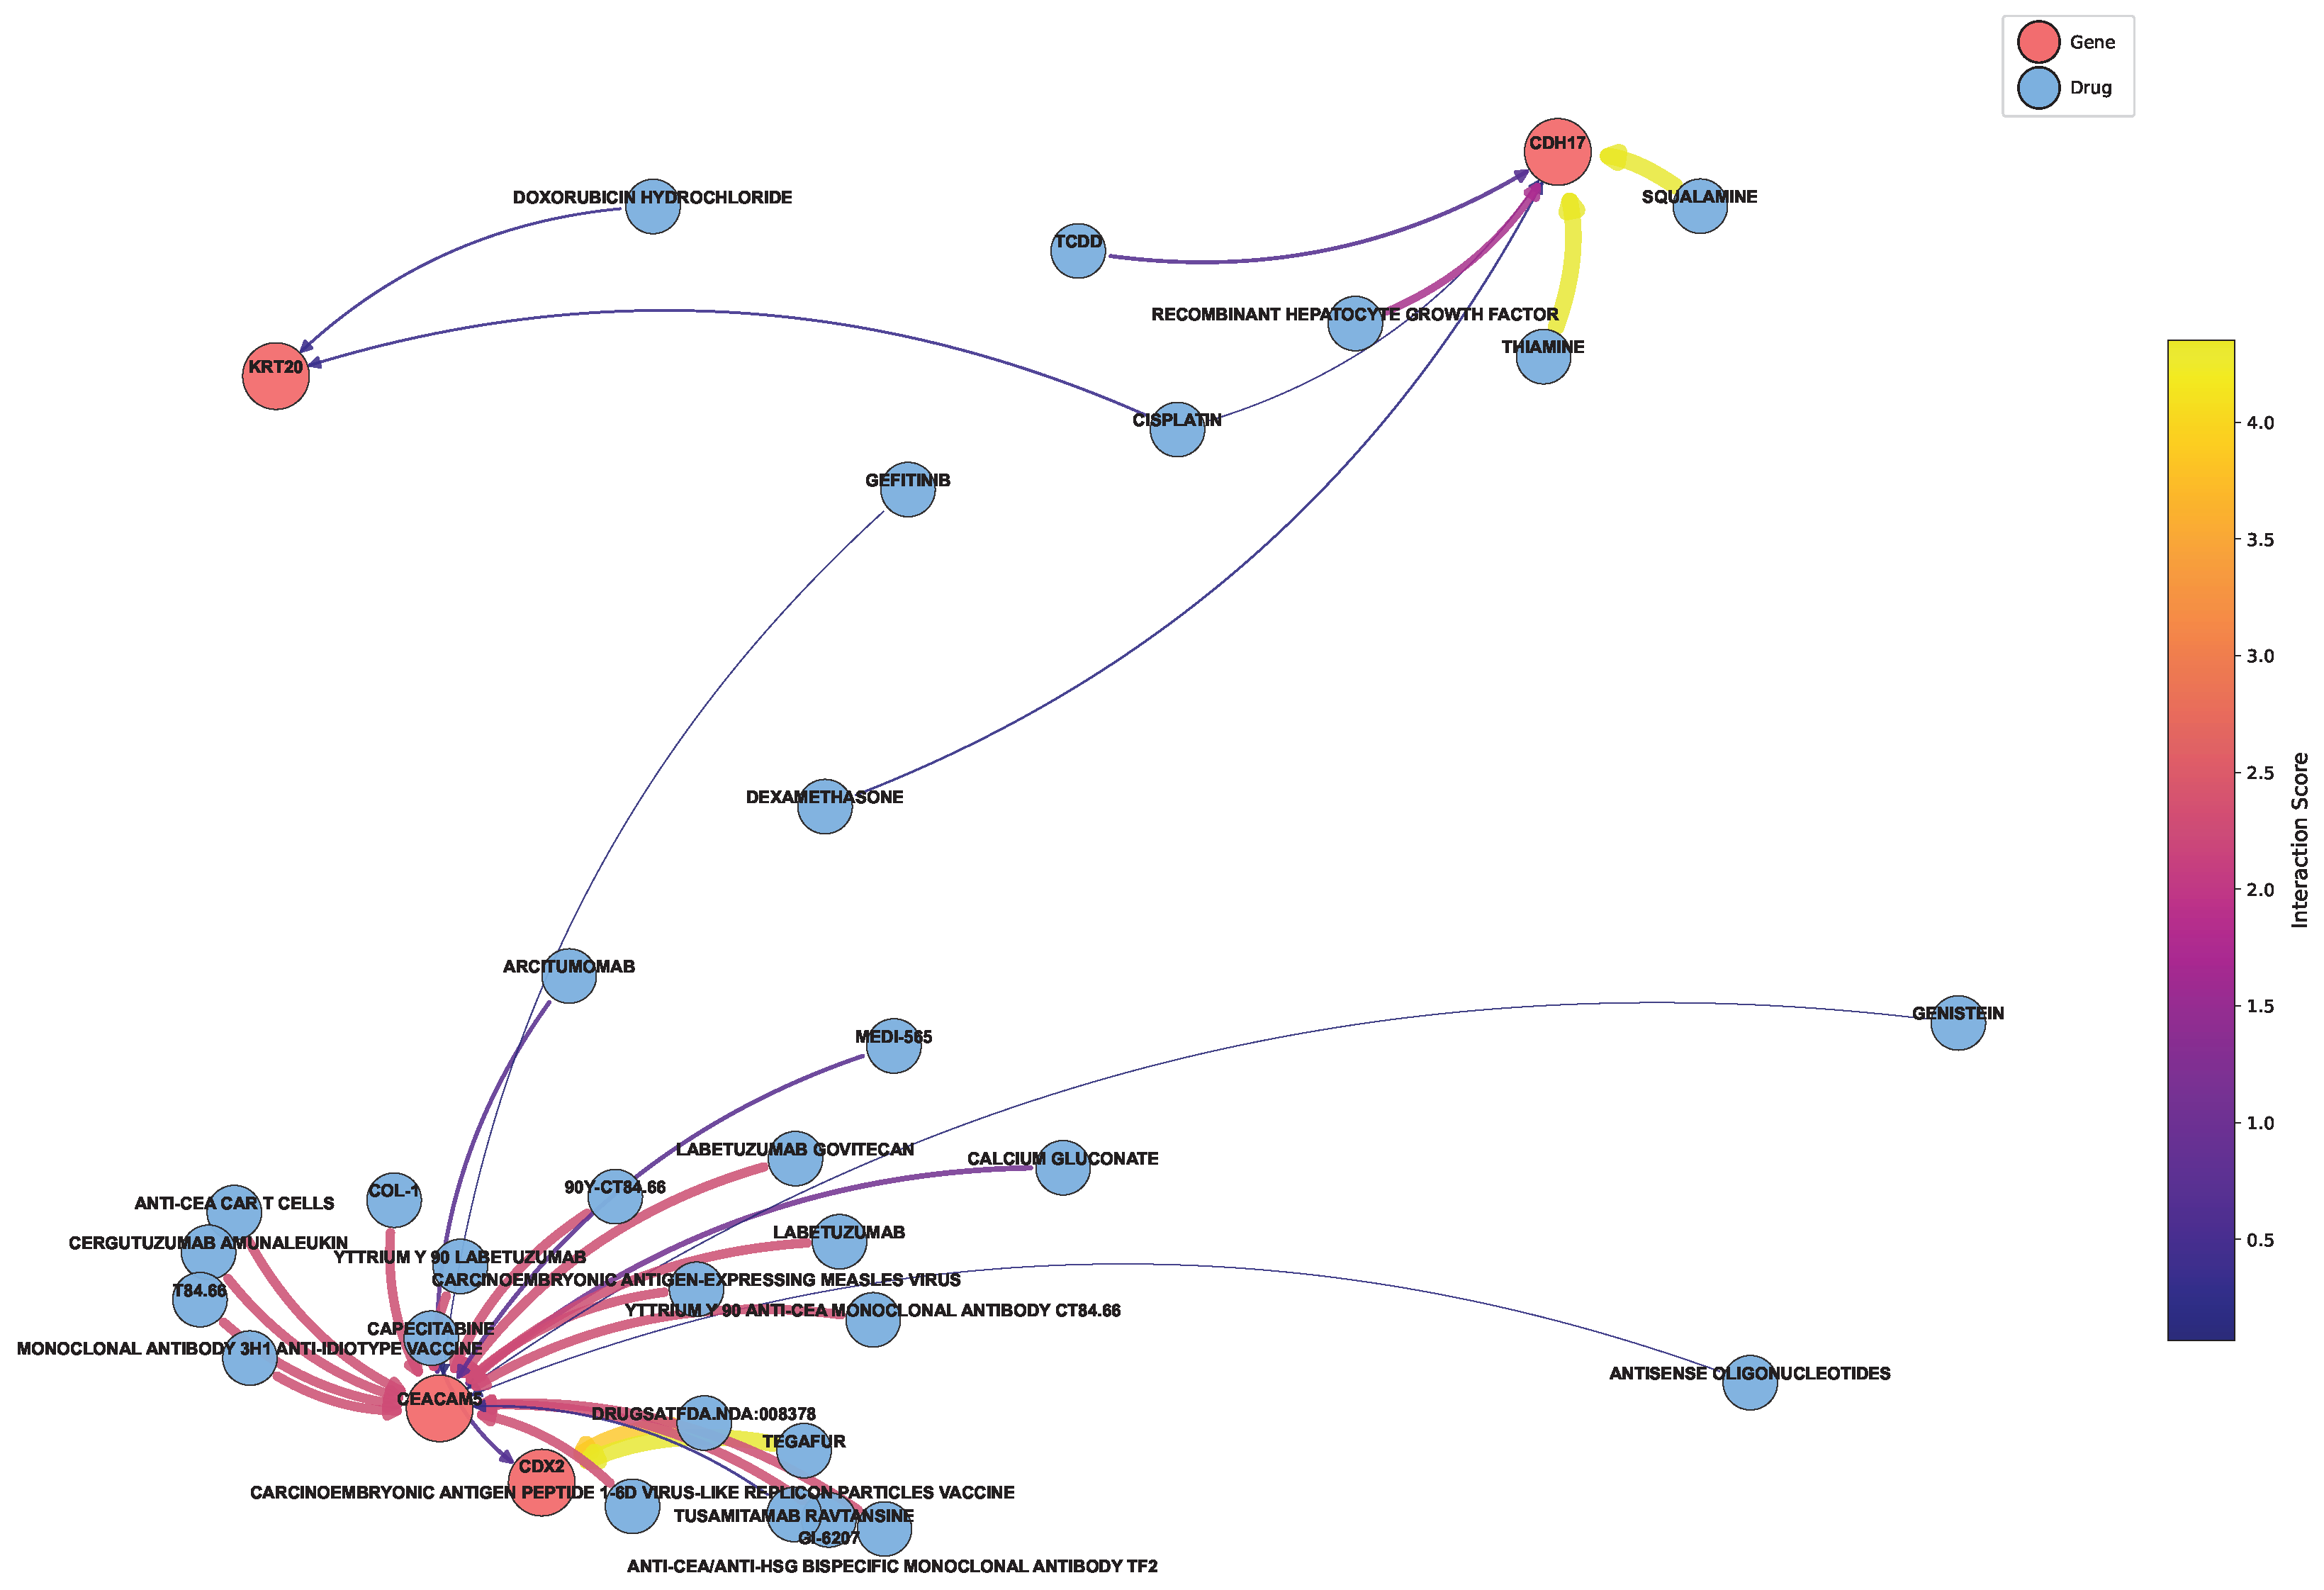
Based on the genes in the core network in Section 3.2, we extracted the drugs associated with these genes from the DGIdb database to map the network, as shown in Figure 10 [40]. It is not difficult to summarize the key targeted drugs, as specifically shown in Table 6. The table presents several potential therapeutic drugs for colon cancer. The potential of these drugs as colon cancer treatments is closely associated with their unique molecular mechanisms.
SQUALAMINE exhibits anti-angiogenic properties by targeting vascular endothelial cells, inhibiting their proliferation and migration, thus limiting the tumor’s blood supply. TEGAFUR, a fluorouracil-based drug, is converted into fluorouracil in the body, where it inhibits thymidylate synthase and interferes with RNA synthesis, suppressing colon cancer cell growth. LABETUZUMAB GOVITECAN, an antibody-drug conjugate, specifically targets colon cancer cell surface antigens, releasing a cytotoxic drug upon endocytosis to induce apoptosis. The ANTI-CEA/ANTI-HSG BISPECIFIC MONOCLONAL ANTIBODY TF2 recruits immune cells to kill colon cancer cells via antibody-dependent cell-mediated cytotoxicity (ADCC) and complement-dependent cytotoxicity (CDC). T84.66, an anti-CEA monoclonal antibody, also targets CEA and employs immune mechanisms to eliminate cancer cells. The CARCINOEMBRYONIC ANTIGEN PEPTIDE 1-6D VIRUS-LIKE REPLICON PARTICLES VACCINE stimulates an immune response against CEA, generating cytotoxic T lymphocytes (CTLs) and antibodies to recognize and destroy colon cancer cells. Finally, YTTRIUM Y 90 ANTI-CEA MONOCLONAL ANTIBODY CT84.66, a radioimmunoconjugate, delivers beta radiation to the tumor, inducing DNA damage and cell death. Together, these therapeutic agents act on key physiological processes in colon cancer cells from various perspectives, showing promise as effective treatments for colon cancer.
In colon cancer treatment, various drugs target distinct mechanisms and regulatory pathways, as outlined in Table 7. Bevacizumab, a monoclonal antibody targeting VEGF, impedes angiogenesis by blocking VEGF, a key factor in blood vessel formation, thereby reducing the tumor’s blood supply and suppressing tumor growth and metastasis. This mechanism involves key genes such as VEGF, VEGFR2 (KDR), PIK3CA, AKT1, and MAPK1. Fruquintinib and regorafenib, multi-kinase inhibitors, block multiple tyrosine kinase receptors like VEGFR, PDGFR, FGFR, RET, and KIT, inhibiting tumor angiogenesis and cell proliferation through pathways like VEGF/VEGFR, PDGF/PDGFR, and FGF/FGFR. Key genes include VEGFR2, PDGFRB, FGFR1, KIT, and RET. Cetuximab and panitumumab, EGFR inhibitors, block EGFR signaling, which in turn activates downstream pathways such as RAS/RAF/MEK/ERK and PI3K/AKT/mTOR, promoting cell proliferation and survival. In colon cancer with wild-type KRAS, inhibiting EGFR can effectively block these oncogenic signals, with key genes including EGFR, KRAS, NRAS, BRAF, PIK3CA, and AKT1. Vemurafenib and trametinib target BRAF and MEK, respectively, and are used for colon cancer with the BRAF V600E mutation. These drugs inhibit the MAPK signaling pathway, blocking the continuous activation of BRAF kinase and MEK, thus preventing cell proliferation and survival. The key genes involved are BRAF (especially the V600E mutant), MEK1/2 (MAP2K1/2), and ERK1/2 (MAPK3/1). Finally, Rhein, a multi-target natural product, induces apoptosis in colon cancer cells by regulating the PI3K-Akt and MAPK pathways. It reduces Bcl-2 expression, upregulates Bax, and inhibits ERK activation. Key genes include PIK3CA, AKT1, MAPK1 (ERK2), BCL2, and BAX. Collectively, these drugs target various critical pathways in colon cancer, providing diverse therapeutic strategies to combat the disease.

4. Discussion

This study employed an integrative approach to dissect the molecular heterogeneity of COAD by constructing miRNA–gene co-expression networks using the MRNETB algorithm, an information–theoretic method that balances maximum relevance and minimum redundancy. We analyzed RNA-seq and miRNA expression data from the TCGA-COAD project, focusing on different clinical stages, genders, and age groups. Markov flow entropy (MFE) was calculated to quantify the importance of nodes within the network, enabling the identification of key regulatory genes and miRNAs. Additionally, protein–protein interaction (PPI) networks and miRNA–target interactions were analyzed to reveal functional connectivity and regulatory mechanisms. This workflow allowed us to systematically explore the molecular landscape of COAD, uncovering critical genes and miRNAs that play pivotal roles in disease progression.
Our multi-dimensional stratification revealed clinically relevant molecular patterns across disease subgroups. In Stage II–III patients, we identified a potential biomarker triad (CDX2-hsa-miR-22-3p-MUC13) showing coordinated expression changes, with CDX2—an established differentiation marker—displaying progressive downregulation concordant with staging criteria [24]. The gender-specific analysis uncovered distinct regulatory landscapes: SLC26A3 emerged as a male-predominant gene (2.1-fold higher expression vs females, FDR < 0.01) [28], while GPA33 showed female-specific overexpression (1.8-fold, p = 0.003), suggesting fundamental mechanistic divergences between sexes [29]. Most strikingly, age stratification revealed nearly disjoint pathogenic mechanisms in early-onset (<50 years) versus conventional COAD, highlighted by dramatic XIST expression disparities. These findings collectively underscore the necessity for heterogeneity-aware therapeutic strategies in COAD management.
Our study has several critical limitations that warrant careful consideration. Methodologically, the computational demands of the MRNETB algorithm and Markov flow entropy (MFE) centrality analysis restricted the integration of multi-omics data (e.g., methylation, proteomics), although cloud-based platforms may mitigate this in future work. Sample size imbalances were particularly evident in early-onset COAD cases (n = 55 vs. 383 in ≥50-year-old groups), potentially reducing statistical power to identify rare variants and limiting subgroup-specific insights. Functional validation is also lacking for key mechanistic findings, such as the CDX2-hsa-miR-22-3p-MUC13 regulatory network, leaving their biological relevance provisional. While our analysis identified colon-specific genes (e.g., CDH17, CEACAM5), their annotation with pan-cancer functional evidence risks obscuring COAD-exclusive pathogenic mechanisms, as highlighted by prior studies on broader CRC cohorts. Population representativeness is further constrained by the TCGA-COAD cohort’s North American-centric composition, raising questions about generalizability to global populations. Lastly, the absence of drug response data precludes assessment of biomarker clinical utility. Future studies should address these gaps through multi-center collaborations that harmonize multi-omics datasets, recruit balanced age-stratified cohorts, and perform experimental validation (e.g., CRISPR screens, RNAi assays) to dissect COAD-specific molecular networks. Validation in ethnically diverse populations and incorporation of therapeutically relevant endpoints will be critical to advancing precision medicine for COAD.

5. Conclusions

This study highlights the importance of integrating molecular network analysis with clinical heterogeneity research to elucidate the complex regulatory mechanisms in COAD. The identification of key genes and miRNAs with high MFE values provides valuable insights into COAD progression and offers potential biomarkers for diagnosis and prognosis. The gender and age-specific molecular signatures underscore the need for personalized treatment strategies in COAD. Future research should focus on validating these findings in larger cohorts and exploring their clinical applications in precision medicine.

Author Contributions

Conceptualization, Q.H., Z.M. and B.G.; data curation, Q.H.; formal analysis, Q.H.; funding acquisition, B.G. and Z.Z.; investigation, Q.H.; methodology, Q.H. and Z.M.; project administration, Z.M. and B.G.; resources, Z.M. and B.G.; software, Q.H.; supervision, B.G. and Z.Z.; validation, Q.H.; visualization, Q.H.; writing—original draft, Q.H., T.L., T.H. and M.L.; writing—review and editing, Q.H. and Z.M. All authors have read and agreed to the published version of the manuscript.

Funding

This work was supported by the National Science and Technology Major Project (grant no. 2022ZD0117802), the Fundamental Research Funds for the Central Universities, and Beijing Advanced Innovation Center for Future Blockchain and Privacy Computing.

Data Availability Statement

TCGA-COAD can be found at UCSC Xena: https://xenabrowser.net (accessed on 29 December 2024). PPI networks used in Section 3.2 are from the STRING database; miRNA and gene relationships are from miRTarBase; gene and drug relationships used in Section 3.5 are from DGIdb.

Acknowledgments

We sincerely thank the TCGA Research Network and its contributing institutions for their valuable data. The authors are grateful to editors and reviewers for their valuable remarks, comments and advice, that help to improve the quality of the manuscript.

Conflicts of Interest

The authors declare no conflicts of interest.

Abbreviations

The following abbreviations are used in this manuscript:
COADcolon adenocarcinoma
MFEMarkov flow entropy
MRNETBMinimum Redundancy NETwork Backward
CRCcolorectal cancer

References

  1. Bray, F.; Laversanne, M.; Sung, H.; Ferlay, J.; Siegel, R.L.; Soerjomataram, I.; Jemal, A. Global cancer statistics 2022: GLOBOCAN estimates of incidence and mortality worldwide for 36 cancers in 185 countries. CA Cancer J. Clin. 2024, 74, 229–263. [Google Scholar] [CrossRef]
  2. Sinicrope, F.A. Increasing incidence of early-onset colorectal cancer. N. Engl. J. Med. 2022, 386, 1547–1558. [Google Scholar]
  3. Willyard, C. The colon cancer conundrum. Nature 2021, 10. [Google Scholar] [CrossRef]
  4. Ten Hoorn, S.; de Back, T.R.; Sommeijer, D.W.; Vermeulen, L. Clinical value of consensus molecular subtypes in colorectal cancer: A systematic review and meta-analysis. JNCI J. Natl. Cancer Inst. 2022, 114, 503–516. [Google Scholar]
  5. Janku, F.; Hanna, G.J.; Carvajal, R.D.; Paik, P.K.; Hernando-Calvo, A.; Gillison, M.L.; Fu, S.; Wheler, J.J.; Bohr, D.; Reiners, R.; et al. First-in-human phase I study of the bifunctional EGFR/TGF β fusion protein BCA101 in patients with EGFR-driven advanced solid cancers. J. Clin. Oncol. 2021, 39, 3074. [Google Scholar]
  6. Zhao, H.; Ming, T.; Tang, S.; Ren, S.; Yang, H.; Liu, M.; Tao, Q.; Xu, H. Wnt signaling in colorectal cancer: Pathogenic role and therapeutic target. Mol. Cancer 2022, 21, 144. [Google Scholar] [CrossRef] [PubMed]
  7. Galindo-Pumari no, C.; Collado, M.; Castillo, M.E.; Barquín, J.; Romio, E.; Larriba, M.J.; de Mier, G.M.; Carrato, A.; de la Pinta, C.; Pena, C. SNAI1-expressing fibroblasts and derived-extracellular matrix as mediators of drug resistance in colorectal cancer patients. Toxicol. Appl. Pharmacol. 2022, 450, 116171. [Google Scholar]
  8. Wu, Z.; Huang, Y.; Zhang, R.; Zheng, C.; You, F.; Wang, M.; Xiao, C.; Li, X. Sex differences in colorectal cancer: With a focus on sex hormone–gut microbiome axis. Cell Commun. Signal. 2024, 22, 167. [Google Scholar]
  9. Dharwadkar, P.; Greenan, G.; Stoffel, E.M.; Burstein, E.; Pirzadeh-Miller, S.; Lahiri, S.; Mauer, C.; Singal, A.G.; Murphy, C.C. Racial and ethnic disparities in germline genetic testing of patients with young-onset colorectal cancer. Clin. Gastroenterol. Hepatol. 2022, 20, 353–361. [Google Scholar] [CrossRef]
  10. Hashimoto, T.; Takayanagi, D.; Yonemaru, J.; Naka, T.; Nagashima, K.; Machida, E.; Kohno, T.; Yatabe, Y.; Kanemitsu, Y.; Hamamoto, R.; et al. A comprehensive appraisal of HER2 heterogeneity in HER2-amplified and HER2-low colorectal cancer. Br. J. Cancer 2023, 129, 1176–1183. [Google Scholar]
  11. Hashemi, M.; Mirdamadi, M.S.A.; Talebi, Y.; Khaniabad, N.; Banaei, G.; Daneii, P.; Gholami, S.; Ghorbani, A.; Tavakolpournegari, A.; Farsani, Z.M.; et al. Pre-clinical and clinical importance of miR-21 in human cancers: Tumorigenesis, therapy response, delivery approaches and targeting agents. Pharmacol. Res. 2023, 187, 106568. [Google Scholar] [CrossRef] [PubMed]
  12. Wei, S.; Hu, W.; Feng, J.; Geng, Y. Promotion or remission: A role of noncoding RNAs in colorectal cancer resistance to anti-EGFR therapy. Cell Commun. Signal. 2022, 20, 150. [Google Scholar] [CrossRef] [PubMed]
  13. Ai, D.; Wang, Y.; Li, X.; Pan, H. Colorectal cancer prediction based on weighted gene co-expression network analysis and variational auto-encoder. Biomolecules 2020, 10, 1207. [Google Scholar] [CrossRef]
  14. Raets, C.; El Aisati, C.; De Ridder, M.; Sermeus, A.; Barbé, K. An Evolutionary Random Forest to measure the Dworak tumor regression grade applied to colorectal cancer. Measurement 2022, 205, 112131. [Google Scholar] [CrossRef]
  15. Jeuken, G.S.; Käll, L. Pathway analysis through mutual information. Bioinformatics 2024, 40, btad776. [Google Scholar] [CrossRef]
  16. Zhao, M.; Lau, M.C.; Haruki, K.; Väyrynen, J.P.; Gurjao, C.; Väyrynen, S.A.; Dias Costa, A.; Borowsky, J.; Fujiyoshi, K.; Arima, K.; et al. Bayesian risk prediction model for colorectal cancer mortality through integration of clinicopathologic and genomic data. NPJ Precis. Oncol. 2023, 7, 57. [Google Scholar] [CrossRef] [PubMed]
  17. Sebastian, S.; Roy, S.; Kalita, J. A generic parallel framework for inferring large-scale gene regulatory networks from expression profiles: Application to Alzheimer’s disease network. Briefings Bioinform. 2023, 24, bbac482. [Google Scholar] [CrossRef]
  18. Goldman, M.J.; Craft, B.; Hastie, M.; Repečka, K.; McDade, F.; Kamath, A.; Banerjee, A.; Luo, Y.; Rogers, D.; Brooks, A.N.; et al. Visualizing and interpreting cancer genomics data via the Xena platform. Nat. Biotechnol. 2020, 38, 675–678. [Google Scholar] [CrossRef]
  19. Szklarczyk, D.; Nastou, K.; Koutrouli, M.; Kirsch, R.; Mehryary, F.; Hachilif, R.; Hu, D.; Peluso, M.E.; Huang, Q.; Fang, T.; et al. The STRING database in 2025: Protein networks with directionality of regulation. Nucleic Acids Res. 2025, 53, D730–D737. [Google Scholar] [CrossRef]
  20. Cui, S.; Yu, S.; Huang, H.Y.; Lin, Y.C.D.; Huang, Y.; Zhang, B.; Xiao, J.; Zuo, H.; Wang, J.; Li, Z.; et al. miRTarBase 2025: Updates to the collection of experimentally validated microRNA–target interactions. Nucleic Acids Res. 2025, 53, D147–D156. [Google Scholar] [CrossRef]
  21. Liu, J.; Tao, Y.; Lan, R.; Zhong, J.; Liu, R.; Chen, P. Identifying the critical state of cancers by single-sample Markov flow entropy. PeerJ 2023, 11, e15695. [Google Scholar]
  22. Szklarczyk, D.; Kirsch, R.; Koutrouli, M.; Nastou, K.; Mehryary, F.; Hachilif, R.; Gable, A.L.; Fang, T.; Doncheva, N.T.; Pyysalo, S.; et al. The STRING database in 2023: Protein–protein association networks and functional enrichment analyses for any sequenced genome of interest. Nucleic Acids Res. 2023, 51, D638–D646. [Google Scholar] [PubMed]
  23. Huang, H.Y.; Lin, Y.C.D.; Li, J.; Huang, K.Y.; Shrestha, S.; Hong, H.C.; Tang, Y.; Chen, Y.G.; Jin, C.N.; Yu, Y.; et al. miRTarBase 2020: Updates to the experimentally validated microRNA–target interaction database. Nucleic Acids Res. 2020, 48, D148–D154. [Google Scholar] [CrossRef] [PubMed]
  24. Dalerba, P.; Sahoo, D.; Paik, S.; Guo, X.; Yothers, G.; Song, N.; Wilcox-Fogel, N.; Forgó, E.; Rajendran, P.S.; Miranda, S.P.; et al. CDX2 as a prognostic biomarker in stage II and stage III colon cancer. N. Engl. J. Med. 2016, 374, 211–222. [Google Scholar] [PubMed]
  25. Gupta, B.K.; Maher, D.M.; Ebeling, M.C.; Stephenson, P.D.; Puumala, S.E.; Koch, M.R.; Aburatani, H.; Jaggi, M.; Chauhan, S.C. Functions and regulation of MUC13 mucin in colon cancer cells. J. Gastroenterol. 2014, 49, 1378–1391. [Google Scholar]
  26. Yadav, P.; Sharma, P.; Chetlangia, N.; Mayalagu, P.; Karunagaran, D. Upregulation of miR-22-3p contributes to plumbagin-mediated inhibition of Wnt signaling in human colorectal cancer cells. Chem.-Biol. Interact. 2022, 368, 110224. [Google Scholar]
  27. Guo, X.; Li, C.; Jia, X.; Qu, Y.; Li, M.; Cao, C.; Qu, Q.; Luo, S.; Tang, J.; Liu, H.; et al. NIR-II fluorescence imaging-guided colorectal cancer surgery targeting CEACAM5 by a nanobody. EBioMedicine 2023, 89, 104476. [Google Scholar] [CrossRef]
  28. Lin, C.; Lin, P.; Lin, H.; Yao, H.; Liu, S.; He, R.; Chen, H.; Teng, Z.; Hoffman, R.M.; Ye, J.; et al. SLC26A3/NHERF2-IκB/NFκB/p65 feedback loop suppresses tumorigenesis and metastasis in colorectal cancer. Oncogenesis 2023, 12, 41. [Google Scholar]
  29. Börding, T.; Janik, T.; Bischoff, P.; Morkel, M.; Sers, C.; Horst, D. GPA33 expression in colorectal cancer can be induced by WNT inhibition and targeted by cellular therapy. Oncogene 2024, 44, 30–41. [Google Scholar]
  30. Chawra, H.S.; Agarwal, M.; Mishra, A.; Chandel, S.S.; Singh, R.P.; Dubey, G.; Kukreti, N.; Singh, M. MicroRNA-21’s role in PTEN suppression and PI3K/AKT activation: Implications for cancer biology. Pathol.-Res. Pract. 2024, 254, 155091. [Google Scholar] [CrossRef]
  31. Hu, Y.; Ou, Y.; Wu, K.; Chen, Y.; Sun, W. miR-143 inhibits the metastasis of pancreatic cancer and an associated signaling pathway. Tumor Biol. 2012, 33, 1863–1870. [Google Scholar] [CrossRef] [PubMed]
  32. Basu, S.; Chaudhary, A.; Chowdhury, P.; Karmakar, D.; Basu, K.; Karmakar, D.; Chatterjee, J.; Sengupta, S. Evaluating the role of hsa-miR-200c in reversing the epithelial to mesenchymal transition in prostate cancer. Gene 2020, 730, 144264. [Google Scholar]
  33. de Souza Rocha Simonini, P.; Breiling, A.; Gupta, N.; Malekpour, M.; Youns, M.; Omranipour, R.; Malekpour, F.; Volinia, S.; Croce, C.M.; Najmabadi, H.; et al. Epigenetically deregulated microRNA-375 is involved in a positive feedback loop with estrogen receptor α in breast cancer cells. Cancer Res. 2010, 70, 9175–9184. [Google Scholar]
  34. Lorentz, O.; Duluc, I.; Arcangelis, A.D.; Simon-Assmann, P.; Kedinger, M.; Freund, J.N. Key role of the Cdx2 homeobox gene in extracellular matrix–mediated intestinal cell differentiation. J. Cell Biol. 1997, 139, 1553–1565. [Google Scholar] [PubMed]
  35. Lee, N.P.; Poon, R.T.; Shek, F.H.; Ng, I.O.; Luk, J.M. Role of cadherin-17 in oncogenesis and potential therapeutic implications in hepatocellular carcinoma. Biochim. Biophys. Acta (BBA)-Rev. Cancer 2010, 1806, 138–145. [Google Scholar]
  36. Blumenthal, R.D.; Leon, E.; Hansen, H.J.; Goldenberg, D.M. Expression patterns of CEACAM5 and CEACAM6 in primary and metastatic cancers. BMC Cancer 2007, 7, 2. [Google Scholar]
  37. Cloutier, P.; Poitras, C.; Durand, M.; Hekmat, O.; Fiola-Masson, É.; Bouchard, A.; Faubert, D.; Chabot, B.; Coulombe, B. R2TP/Prefoldin-like component RUVBL1/RUVBL2 directly interacts with ZNHIT2 to regulate assembly of U5 small nuclear ribonucleoprotein. Nat. Commun. 2017, 8, 15615. [Google Scholar]
  38. Zhang, Y.; Zhang, Y.; Sun, K.; Meng, Z.; Chen, L. The SLC transporter in nutrient and metabolic sensing, regulation, and drug development. J. Mol. Cell Biol. 2019, 11, 1–13. [Google Scholar]
  39. Pidíkova, P.; Reis, R.; Herichova, I. miRNA clusters with down-regulated expression in human colorectal cancer and their regulation. Int. J. Mol. Sci. 2020, 21, 4633. [Google Scholar] [CrossRef]
  40. Cannon, M.; Stevenson, J.; Stahl, K.; Basu, R.; Coffman, A.; Kiwala, S.; McMichael, J.F.; Kuzma, K.; Morrissey, D.; Cotto, K.; et al. DGIdb 5.0: Rebuilding the drug–gene interaction database for precision medicine and drug discovery platforms. Nucleic Acids Res. 2024, 52, D1227–D1235. [Google Scholar] [CrossRef]
  41. Sills, A.K., Jr.; Williams, J.I.; Tyler, B.M.; Epstein, D.S.; Sipos, E.P.; Davis, J.D.; McLane, M.P.; Pitchford, S.; Cheshire, K.; Gannon, F.H.; et al. Squalamine inhibits angiogenesis and solid tumor growth in vivo and perturbs embryonic vasculature. Cancer Res. 1998, 58, 2784–2792. [Google Scholar]
  42. Shirasaka, T.; Shimamato, Y.; Ohshimo, H.; Yamaguchi, M.; Kato, T.; Yonekura, K.; Fukushima, M. Development of a novel form of an oral 5-fluorouracil derivative (S-1) directed to the potentiation of the tumor selective cytotoxicity of 5-fluorouracil by two biochemical modulators. Anti-Cancer Drugs 1996, 7, 548–557. [Google Scholar] [PubMed]
  43. Dotan, E.; Cohen, S.J.; Starodub, A.N.; Lieu, C.H.; Messersmith, W.A.; Guarino, M.J.; Marshall, J.L.; Goldberg, R.M.; Hecht, J.R.; Maliakal, P.; et al. Abstract CT065: Labetuzumab govitecan (IMMU-130), an anti-CEACAM5/SN-38 antibody-drug conjugate, is active in patients (pts) with heavily pretreated metastatic colorectal cancer (mCRC): Phase II results. Cancer Res. 2016, 76, CT065. [Google Scholar] [CrossRef]
  44. Dotan, E.; Cohen, S.J.; Starodub, A.N.; Lieu, C.H.; Messersmith, W.A.; Simpson, P.S.; Guarino, M.J.; Marshall, J.L.; Goldberg, R.M.; Hecht, J.R.; et al. Phase I/II trial of labetuzumab govitecan (anti-CEACAM5/SN-38 antibody-drug conjugate) in patients with refractory or relapsing metastatic colorectal cancer. J. Clin. Oncol. 2017, 35, 3338–3346. [Google Scholar] [CrossRef] [PubMed]
  45. Wang, N.; Patel, H.; Schneider, I.C.; Kai, X.; Varshney, A.K.; Zhou, L. An optimal antitumor response by a novel CEA/CD3 bispecific antibody for colorectal cancers. Antib. Ther. 2021, 4, 90–100. [Google Scholar] [PubMed]
  46. Wong, J.Y.; Shibata, S.; Williams, L.E.; Kwok, C.S.; Liu, A.; Chu, D.Z.; Yamauchi, D.M.; Wilczynski, S.; Ikle, D.N.; Wu, A.M.; et al. A Phase I trial of 90Y-anti-carcinoembryonic antigen chimeric T84. 66 radioimmunotherapy with 5-fluorouracil in patients with metastatic colorectal cancer. Clin. Cancer Res. 2003, 9, 5842–5852. [Google Scholar]
  47. Lynch, K.T.; Squeo, G.C.; Kane, W.J.; Meneveau, M.O.; Petroni, G.; Olson, W.C.; Chianese-Bullock, K.A.; Slingluff Jr, C.L.; Foley, E.F.; Friel, C.M. A pilot trial of vaccination with Carcinoembryonic antigen and Her2/neu peptides in advanced colorectal cancer. Int. J. Cancer 2022, 150, 164–173. [Google Scholar]
  48. Wong, J.Y.; Chu, D.Z.; Williams, L.E.; Liu, A.; Zhan, J.; Yamauchi, D.M.; Wilczynski, S.; Wu, A.M.; Yazaki, P.J.; Shively, J.E.; et al. A phase I trial of 90Y-DOTA-anti-CEA chimeric T84. 66 (cT84. 66) radioimmunotherapy in patients with metastatic CEA-producing malignancies. Cancer Biother. Radiopharm. 2006, 21, 88–100. [Google Scholar]
  49. Ferrara, N. VEGF as a therapeutic target in cancer. Oncology 2005, 69, 11–16. [Google Scholar] [CrossRef]
  50. Chen, D.; Wei, L.; Yu, J.; Zhang, L. Regorafenib inhibits colorectal tumor growth through PUMA-mediated apoptosis. Clin. Cancer Res. 2014, 20, 3472–3484. [Google Scholar]
  51. Cunningham, D.; Humblet, Y.; Siena, S.; Khayat, D.; Bleiberg, H.; Santoro, A.; Bets, D.; Mueser, M.; Harstrick, A.; Verslype, C.; et al. Cetuximab monotherapy and cetuximab plus irinotecan in irinotecan-refractory metastatic colorectal cancer. N. Engl. J. Med. 2004, 351, 337–345. [Google Scholar] [CrossRef] [PubMed]
  52. Zhou, H.; Li, Y.; Wang, Y.; Su, Y.; Yang, Y.; Xu, X.; Duan, X. Preventive and therapeutic effects of common plant drugs on colon cancer and its mechanism. J. Int. Oncol. 2020, 47, 51–55. [Google Scholar]
  53. Kopetz, S.; Grothey, A.; Yaeger, R.; Van Cutsem, E.; Desai, J.; Yoshino, T.; Wasan, H.; Ciardiello, F.; Loupakis, F.; Hong, Y.S.; et al. Encorafenib, binimetinib, and cetuximab in BRAF V600E–mutated colorectal cancer. N. Engl. J. Med. 2019, 381, 1632–1643. [Google Scholar] [CrossRef] [PubMed]
  54. Li, X.; Liu, X.; Yang, F.; Meng, T.; Li, X.; Yan, Y.; Xiao, K. Mechanism of Dahuang Mudan Decotion in the treatment of colorectal cancer based on network pharmacology and experimental validation. Heliyon 2024, 10, e32136. [Google Scholar]
Figure 1. The workflow of this study. The miRNA–gene co-expression networks are constructed based on RNA-seq and miRNA expression data for different clinical classifications (stage, gender, age), respectively, and the MFE value is calculated to obtain important genes and miRNAs.
Mathematics 13 01020 g001
Figure 2. Expression of some genes with high MFE values at different stages. Most of these genes were lowly expressed in the tumor samples, with only CEACAM5 expression showing little change.
Mathematics 13 01020 g002
Figure 3. Expression of some miRNAs with high MFE values at different stages. It is clear that these miRNAs are abnormally expressed in the tumor samples.
Mathematics 13 01020 g003
Figure 4. Distribution of methylation beta values of CDH17, CDX2, CEACAM5, EPS8L3, KRT20, and MUC13 at different clinical stages. It can be seen that these genes are similarly methylated in both normal and tumor samples, with CDH17 and EPS8L3 mainly distributed at 0.6–0.7, which is in a hypermethylated state, and the other genes mainly distributed below 0.6.
Mathematics 13 01020 g004
Figure 5. (A): Common genes and miRNAs form the core COAD network. The blue nodes represent genes and the orange nodes represent miRNA. The size of the node indicates the size of the node degree. (B): Tissue-specific expression enrichment of genes in the core COAD network. (C): Disease enrichment of genes in the core COAD network.
Mathematics 13 01020 g005
Figure 6. Scatterplot and correlation plot of gene and miRNA expression, where the blue scatter is the data distribution and the slope of the red line segment indicates the correlation. From the figure, it can be seen that hsa-miR-143-3p and hsa-miR-22-3p are negatively correlated with most of the genes, on the contrary, hsa-miR-192-5p and all the genes remain positively correlated. hsa-miR-21-5p and most of the genes have very low correlation in terms of expression.
Mathematics 13 01020 g006
Figure 7. Violin plots of expression of selected genes and miRNA in different genders.
Mathematics 13 01020 g007
Figure 8. Boxplots of expression values of different genes in three age groups. FABP1, XIST, KRT20, HPN, and VSIG2 decreased in expression with age, in contrast to CDX2, PCK1, and NOX1, which increased in expression with age.
Mathematics 13 01020 g008
Figure 9. Violin plots of expression values for different miRNAs in three age groups and sample distribution. The expression of hsa-miR-375-3p and hsa-miR-22-3p decreased with age; on the contrary, the expression of hsa-miR-148a-3p, hsa-miR-192-5p, and hsa-miR-10b-5p increased with age.
Mathematics 13 01020 g009
Figure 10. Regulatory relationships in the gene–drug network, where the red nodes are the target genes and the blue nodes are the target drugs.
Mathematics 13 01020 g010
Table 1. Distribution of the TCGA–COAD sample by age at index, gender, and AJCC stage. There is missing information for some categories of samples.
Age at index<50 50–70 70+
No.55 169 214
GenderMale Female
No.243 216
AJCC StageNormalStage IStage IIStage IIIStage IV
No.87617812965
Table 2. Top 10 genes by MFE values across clinical stages.
Stage IStage IIStage IIIStage IV
GeneMFEGeneMFEGeneMFEGeneMFE
CDH170.272CEACAM50.104CEACAM50.078FABP10.121
FABP10.259CDX20.103KRT200.076CEACAM50.120
CEACAM50.251MUC130.103CDX20.075MUC130.115
SLC26A30.247VIL10.093FABP10.074CDH170.112
GPA330.247KRT200.092CDH170.070KRT200.112
KRT200.247NOX10.091MUC130.069CDX20.110
CDX20.247EPS8L30.091SLC26A30.068PRAP10.106
NOX10.246CDH170.090SLC34A20.066SLC26A30.100
MUC130.246CDX10.090PHGR10.066MEP1A0.100
EPS8L30.238EPS8L30.066EPS8L30.066EPS8L30.099
Table 3. Top 10 miRNAs by MFE values across clinical stages.
Stage IStage IIStage IIIStage IV
miRNAMFEmiRNAMFEmiRNAMFEmiRNAMFE
hsa-miR-21-5p0.052hsa-miR-21-5p0.053hsa-miR-143-3p0.055hsa-miR-143-3p0.054
hsa-miR-22-3p0.047hsa-miR-143-3p0.049hsa-miR-21-5p0.051hsa-miR-21-5p0.050
hsa-miR-10a-5p0.047hsa-miR-22-3p0.048hsa-miR-22-3p0.048hsa-miR-22-3p0.045
hsa-miR-143-3p0.045hsa-let-7a-5p0.044hsa-miR-10b-5p0.042hsa-miR-192-5p0.043
hsa-miR-148a-3p0.045hsa-miR-103a-3p0.044hsa-miR-192-5p0.042hsa-miR-10a-5p0.043
hsa-miR-200c-3p0.044hsa-miR-200c-3p0.043hsa-miR-10a-5p0.042hsa-miR-99b-5p0.042
hsa-let-7f-5p0.043hsa-miR-192-5p0.043hsa-miR-99b-5p0.042hsa-miR-148a-3p0.041
hsa-miR-192-5p0.042hsa-miR-92a-3p0.043hsa-miR-103a-3p0.042hsa-miR-92a-3p0.041
hsa-let-7b-5p0.041hsa-miR-99b-5p0.043hsa-let-7a-5p0.041hsa-miR-103a-3p0.041
hsa-let-7a-5p0.041hsa-let-7f-5p0.043hsa-let-7f-5p0.041hsa-miR-375-3p0.040
Table 4. Top 10 genes and miRNA by MFE values in males and females.
MaleFemale
GeneMFEmiRNAMFEGeneMFEmiRNAMFE
CEACAM50.089hsa-miR-21-5p0.053CEACAM50.089hsa-miR-143-3p0.050
KRT200.081hsa-miR-143-3p0.050FABP10.079hsa-miR-21-5p0.053
FABP10.079hsa-miR-192-5p0.049CDH170.079hsa-miR-22-3p0.048
CDH170.079hsa-miR-22-3p0.048CDX20.079hsa-let-7a-5p0.044
CDX20.079hsa-miR-10b-5p0.044MUC130.077hsa-miR-192-5p0.049
MUC130.077hsa-miR-10a-5p0.044KRT200.081hsa-miR-10a-5p0.044
SLC26A30.077hsa-miR-148a-3p0.044EPS8L30.076hsa-miR-103a-3p0.041
EPS8L30.076hsa-let-7a-5p0.044NOX10.073hsa-miR-375-3p0.042
VIL10.075hsa-miR-200c-3p0.044GPA330.070hsa-miR-148a-3p0.044
NOX10.073hsa-miR-101-3p0.043VIL10.075hsa-miR-194-5p0.042
Table 5. Top 10 genes and miRNA by MFE values in different age groups.
YoungMiddleOld
GeneMFEmiRNAMFEGeneMFEmiRNAMFEGeneMFEmiRNAMFE
ZNHIT20.086hsa-miR-21-5p0.056CEACAM50.112hsa-miR-21-5p0.054CEACAM50.153hsa-miR-143-3p0.054
VSIG20.071hsa-miR-143-3p0.050KRT200.107hsa-miR-143-3p0.054CDX20.139hsa-miR-21-5p0.054
XIST0.070hsa-miR-148a-3p0.049CDH170.105hsa-miR-192-5p0.049MUC130.138hsa-miR-22-3p0.049
HPN0.069hsa-miR-22-3p0.049FABP10.101hsa-miR-22-3p0.047CDH170.136hsa-miR-192-5p0.046
RPS280.067hsa-miR-10a-5p0.048CDX20.101hsa-miR-148a-3p0.046KRT200.132hsa-miR-375-3p0.046
SLC16A90.066hsa-let-7a-5p0.047MUC130.096hsa-let-7a-5p0.045FABP10.131hsa-miR-103a-3p0.045
SAMD50.065hsa-miR-375-3p0.047NOX10.093hsa-miR-10a-5p0.045VIL10.131hsa-miR-200c-3p0.045
PCK10.064hsa-miR-103a-3p0.046EPS8L30.092hsa-miR-200c-3p0.044EPS8L30.129hsa-miR-148a-3p0.045
AKR1B100.063hsa-miR-192-5p0.046VIL10.090hsa-miR-92a-3p0.044NOX10.126hsa-miR-10a-5p0.044
SLC26A30.063hsa-miR-10b-5p0.045GPA330.089hsa-miR-375-3p0.042CDX10.125hsa-miR-194-5p0.044
Table 6. Functions of potential colon cancer therapeutic drugs.
Drug NameFunctionReferences
SqualamineAnti-tumor, anti-angio[41]
TegafurAnti-colon cancer drug[42]
Labetuzumab govitecanADC for tumor kill[43,44]
Anti-CEA/Anti-HSG bispecific monoclonal antibody TF2Immune-mediated kill[45]
T84.66Anti-CEA tumor kill[46]
Carcinoembryonic antigen peptide 1-6D Virus-like replicon particle vaccineVacc for CEA immune[47]
Yttrium Y 90 Anti-CEA Monoclonal Antibody CT84.66Radio-Immuno kill[46,48]
Table 7. The drugs currently discovered for the treatment of colon cancer.
Drug NameFunctionReferences
BevacizumabAnti-angiogenic agent[49]
Fruquintinib/regorafenibMulti-kinase inhibitor[50]
Cetuximab/panitumumabEGFR signaling pathway inhibitor[51,52]
Vemurafenib + trametinibBRAF-MEK dual pathway inhibitor[53]
RheinMulti-target natural product[54]
Disclaimer/Publisher’s Note: The statements, opinions and data contained in all publications are solely those of the individual author(s) and contributor(s) and not of MDPI and/or the editor(s). MDPI and/or the editor(s) disclaim responsibility for any injury to people or property resulting from any ideas, methods, instructions or products referred to in the content.