3.1. Identification of Key Genes and miRNAs Across Clinical Stages
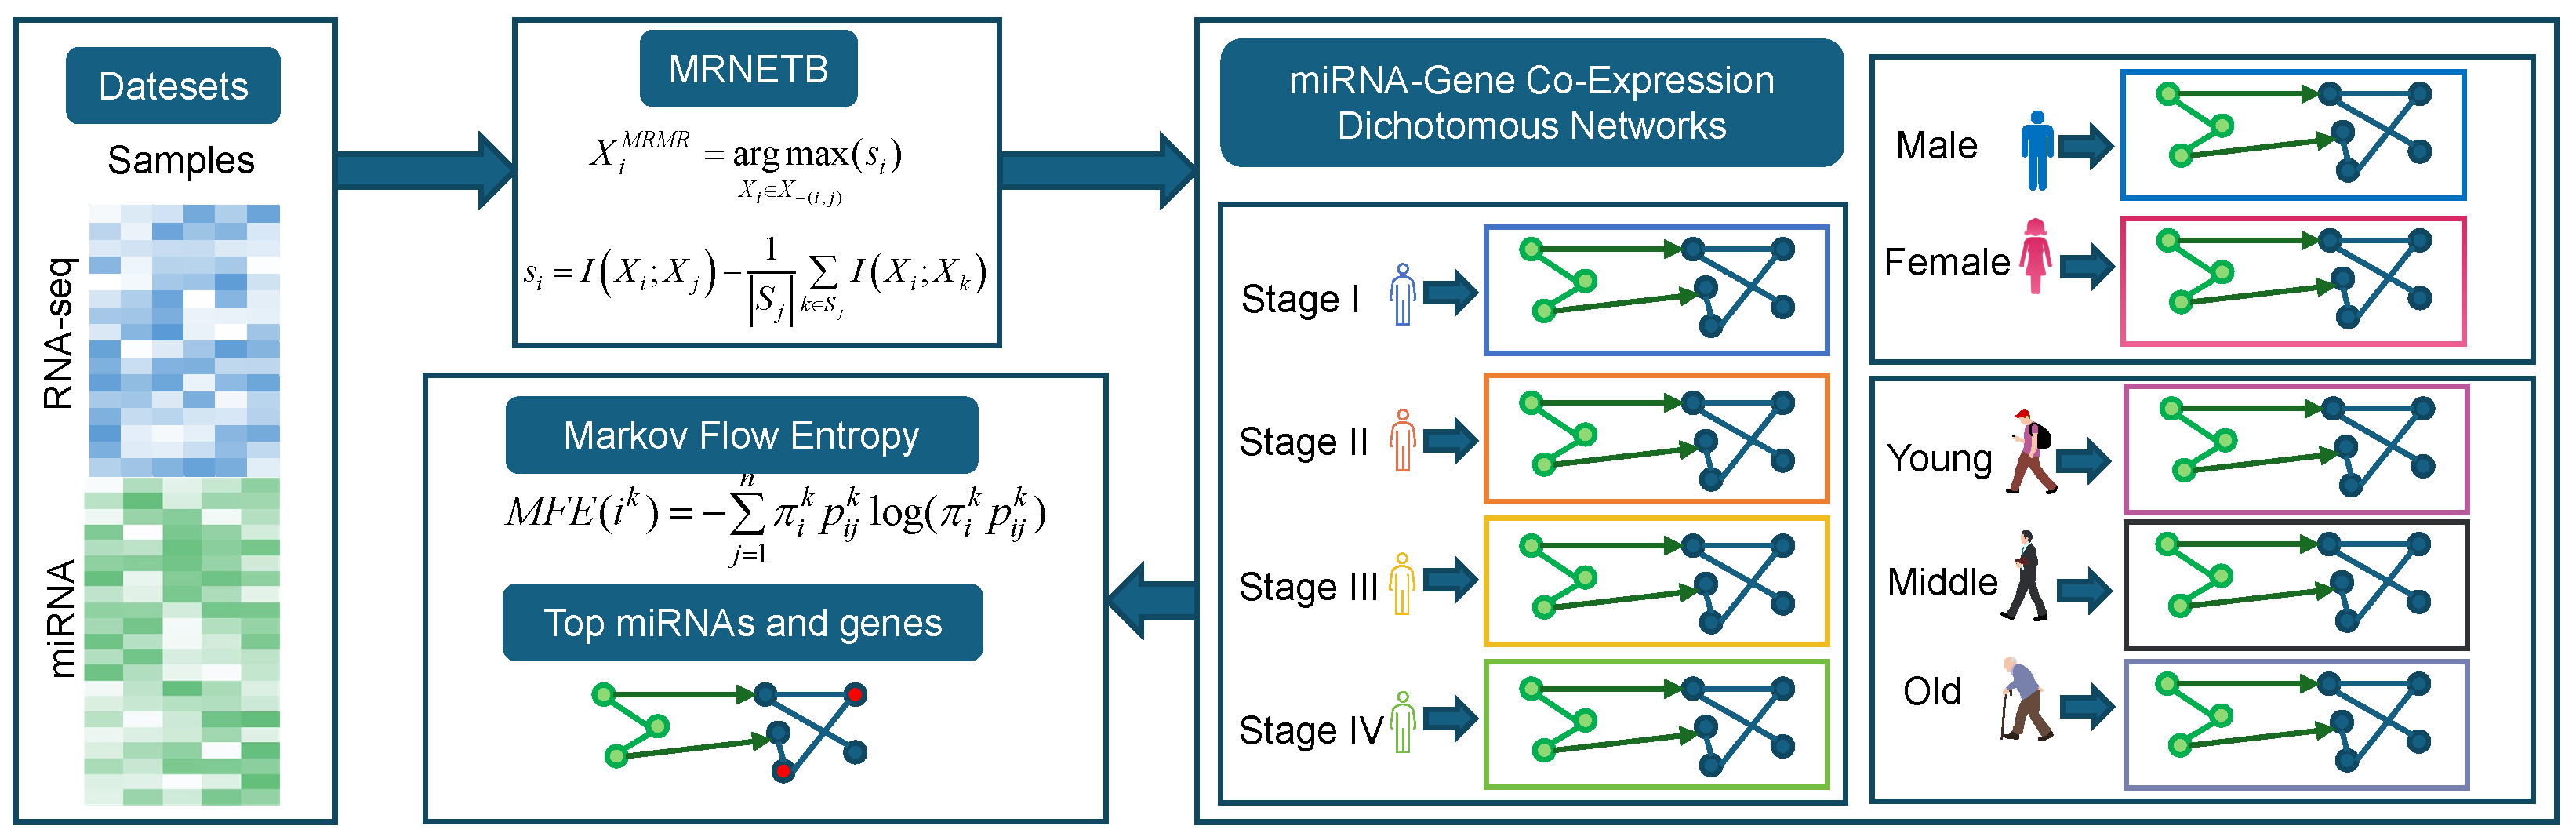
We constructed a miRNA–gene co-expression network for COAD using the information–theoretic MRNETB method (see
Section 2.2), with edges between miRNAs and genes derived from the miRTarBase database. Based on the clinical AJCC stage information, we divided the samples into Normal, Stage I, Stage II, Stage III, and Stage IV. Drawing on the concept of dynamic network biomarkers, we constructed five networks: Normal, Normal–Stage I, Normal–Stage I–Stage II, Normal–Stage I–Stage II–Stage III, and Normal–Stage I–Stage II–Stage III–Stage IV. For each of these networks, we calculated the MFE values for each gene and miRNA (for details, please refer to
Section 2.3). The top 10 genes and miRNA for each of these stages are shown in
Table 2 and
Table 3, respectively.
We analyzed the top ten genes and miRNAs based on their MFE values across the four clinical stages (Stage I to Stage IV) of COAD. Genes such as CDH17, FABP1, and CEACAM5 consistently ranked high in MFE values across multiple stages. For instance, CDH17 exhibited notable MFE values across the stages, indicating its stable relevance in COAD progression. Similarly, miRNAs like hsa-miR-21-5p and hsa-miR-143-3p were recurrently present in the top ten across all stages, further supporting their critical roles in the pathophysiology of COAD.
In Stage I, CDH17 was implicated in cell adhesion, and FABP1 was associated with fatty acid metabolism, both potentially influencing tumor cell growth and survival. Among the miRNAs, hsa-miR-21-5p was linked to cell proliferation and apoptosis, while hsa-miR-22-3p appeared to regulate the tumor microenvironment, influencing the early stages of cancer development. At Stage II, CEACAM5 and CDX2 played roles in tumor cell invasion and differentiation, respectively. hsa-miR-143-3p was found to inhibit tumor cell proliferation and migration, while hsa-let-7a-5p was involved in cell cycle regulation, suggesting its impact on the transition from early to more invasive stages of COAD.
In Stage III, KRT20 and SLC26A3 were associated with epithelial characteristics and ion transport, respectively, highlighting their involvement in tumor progression. The miRNA hsa-miR-10b-5p was implicated in promoting cell migration and invasion, whereas hsa-miR-99b-5p contributed to regulating cell growth and differentiation, indicating a complex regulatory network during this stage. At the advanced Stage IV, PRAP1 and MEP1A emerged as potential players, involved in protein hydrolysis and tumor progression. Notably, hsa-miR-375-3p was newly identified at this stage and may influence cell proliferation and apoptosis, while hsa-miR-92a-3p was linked to angiogenesis and tumor metastasis, highlighting their significance in advanced COAD.
We performed an intersection analysis of the top 10 genes across several stages. At the gene level, intersection analysis across different stages revealed six common genes present across all stages: CDH17, CDX2, CEACAM5, EPS8L3, KRT20, and MUC13, suggesting that these genes may play critical roles throughout the various stages of COAD (COAD) progression. Differential analysis identified stage-specific genes, such as FABP1, GPA33, and SLC26A3 in Stage I, and CDX1 and VIL1 in Stage II. At the miRNA level, four miRNAs were consistently found across all stages—hsa-miR-143-3p, hsa-miR-192-5p, hsa-miR-21-5p, and hsa-miR-22-3p—indicating their potential as key regulatory factors in the progression of COAD. Additionally, stage-specific miRNAs were observed, including hsa-let-7b-5p, hsa-miR-10a-5p, and hsa-miR-148a-3p in Stage I, and hsa-miR-103a-3p, hsa-miR-92a-3p, and hsa-miR-99b-5p in Stage II. These differential miRNAs may serve as potential biomarkers for distinct stages of COAD.
Figure 2 and
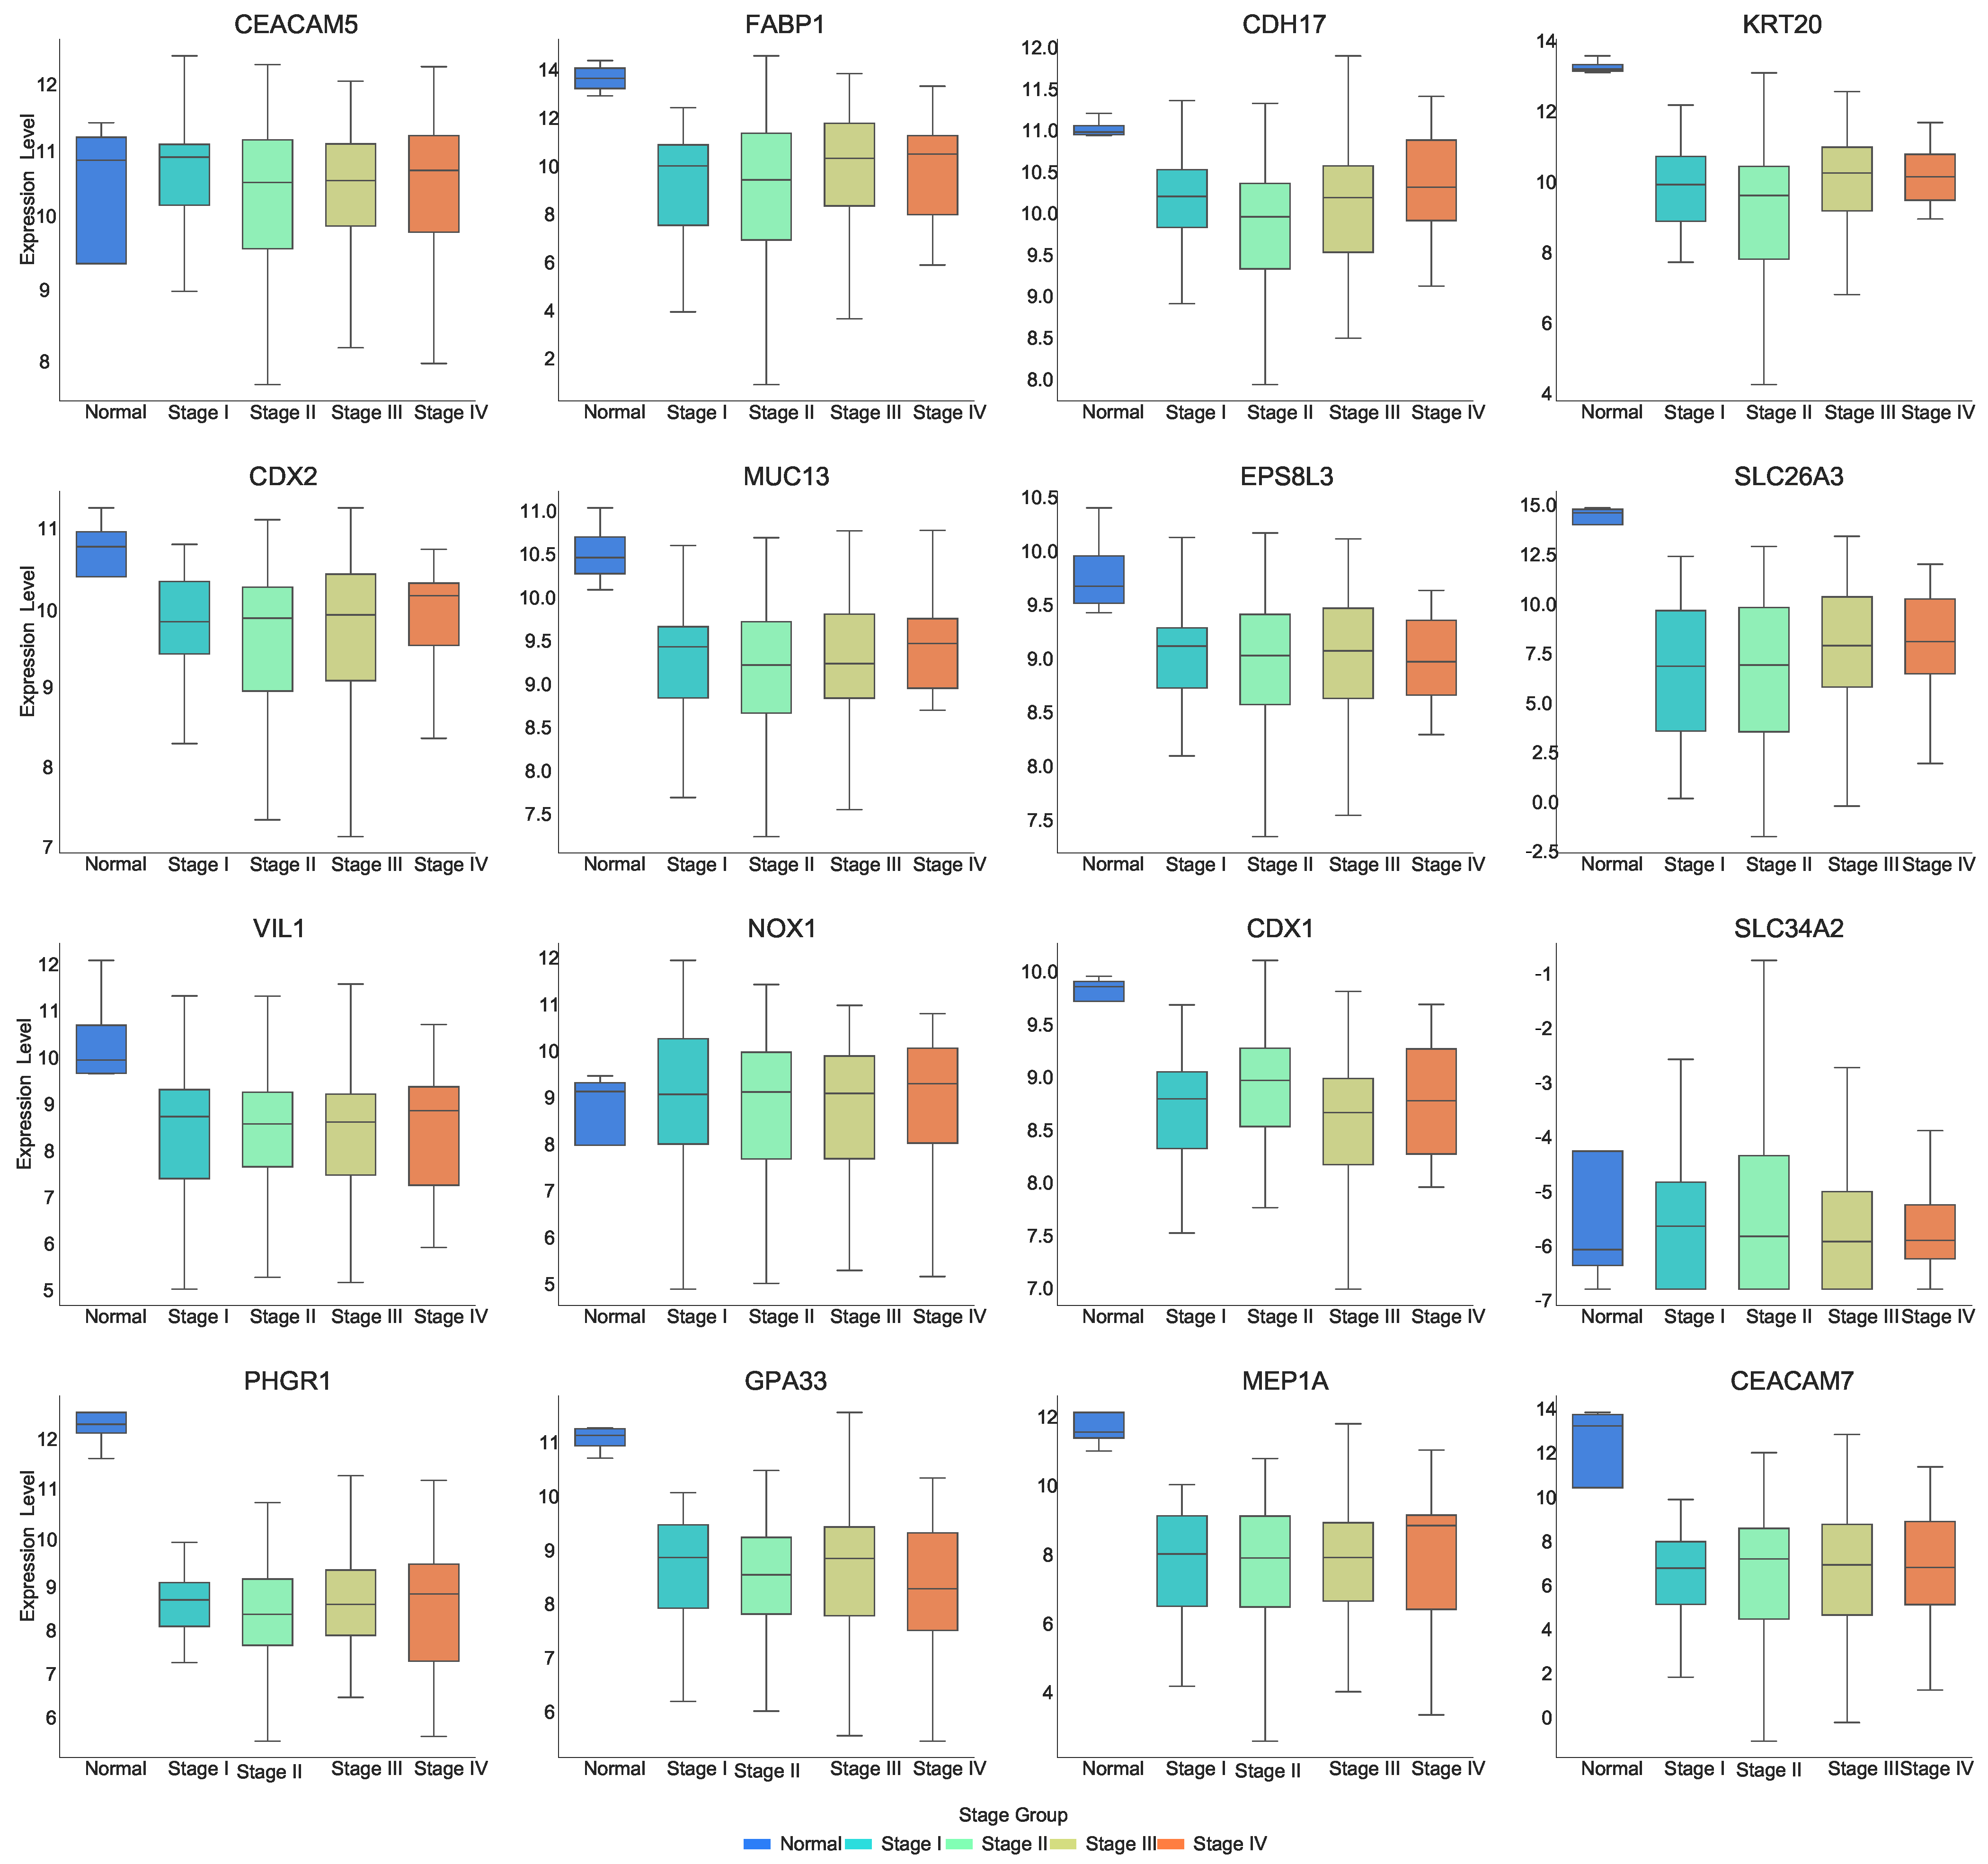
Figure 3 show the expression distribution of multiple genes ranked high in their MFE values across different clinical stages of COAD. The x-axis represents the clinical stages, including “Normal” and “Stage I–Stage IV”, while the y-axis indicates gene expression levels. The following expression patterns are observed in the figure:
As can be seen in
Figure 2, most of the genes are expressed at lower levels in the tumor stage compared to normal tissue. Genes such as CDX2, FABP1, KRT20, CDH17, MUC13, EPS8L3, SLC26A, VIL1, CDX1, PHGR1, GPA33, MEP1A, and CEACAM7 show lower expression in the “Stage I–Stage IV” stages compared to the “Normal” stage. Genes such as CEACAM5, CDH17, KRT20, MUC13, PHGR1, and GPA33 show significant downregulation in Stage II. CDH17 demonstrates a decrease in expression from “Normal” to Stage II, followed by an increase from Stage II to Stage IV, with the lowest expression observed at Stage II. CDX2 shows an increase in expression at Stage IV. SLC26A3 progressively increases its expression level as the disease advances. CDX1 exhibits an “N-shaped” expression pattern from Stage I to Stage IV. SLC34A2 shows an increase in expression from normal tissue to tumor stages. GPA33 shows a decrease in expression from Stage III to Stage IV, while MEP1A shows an increase in expression from Stage III to Stage IV. This suggests that these genes may be closely associated with the onset and progression of COAD, and their expression changes significantly as the disease advances, potentially playing crucial roles in tumor formation and progression.
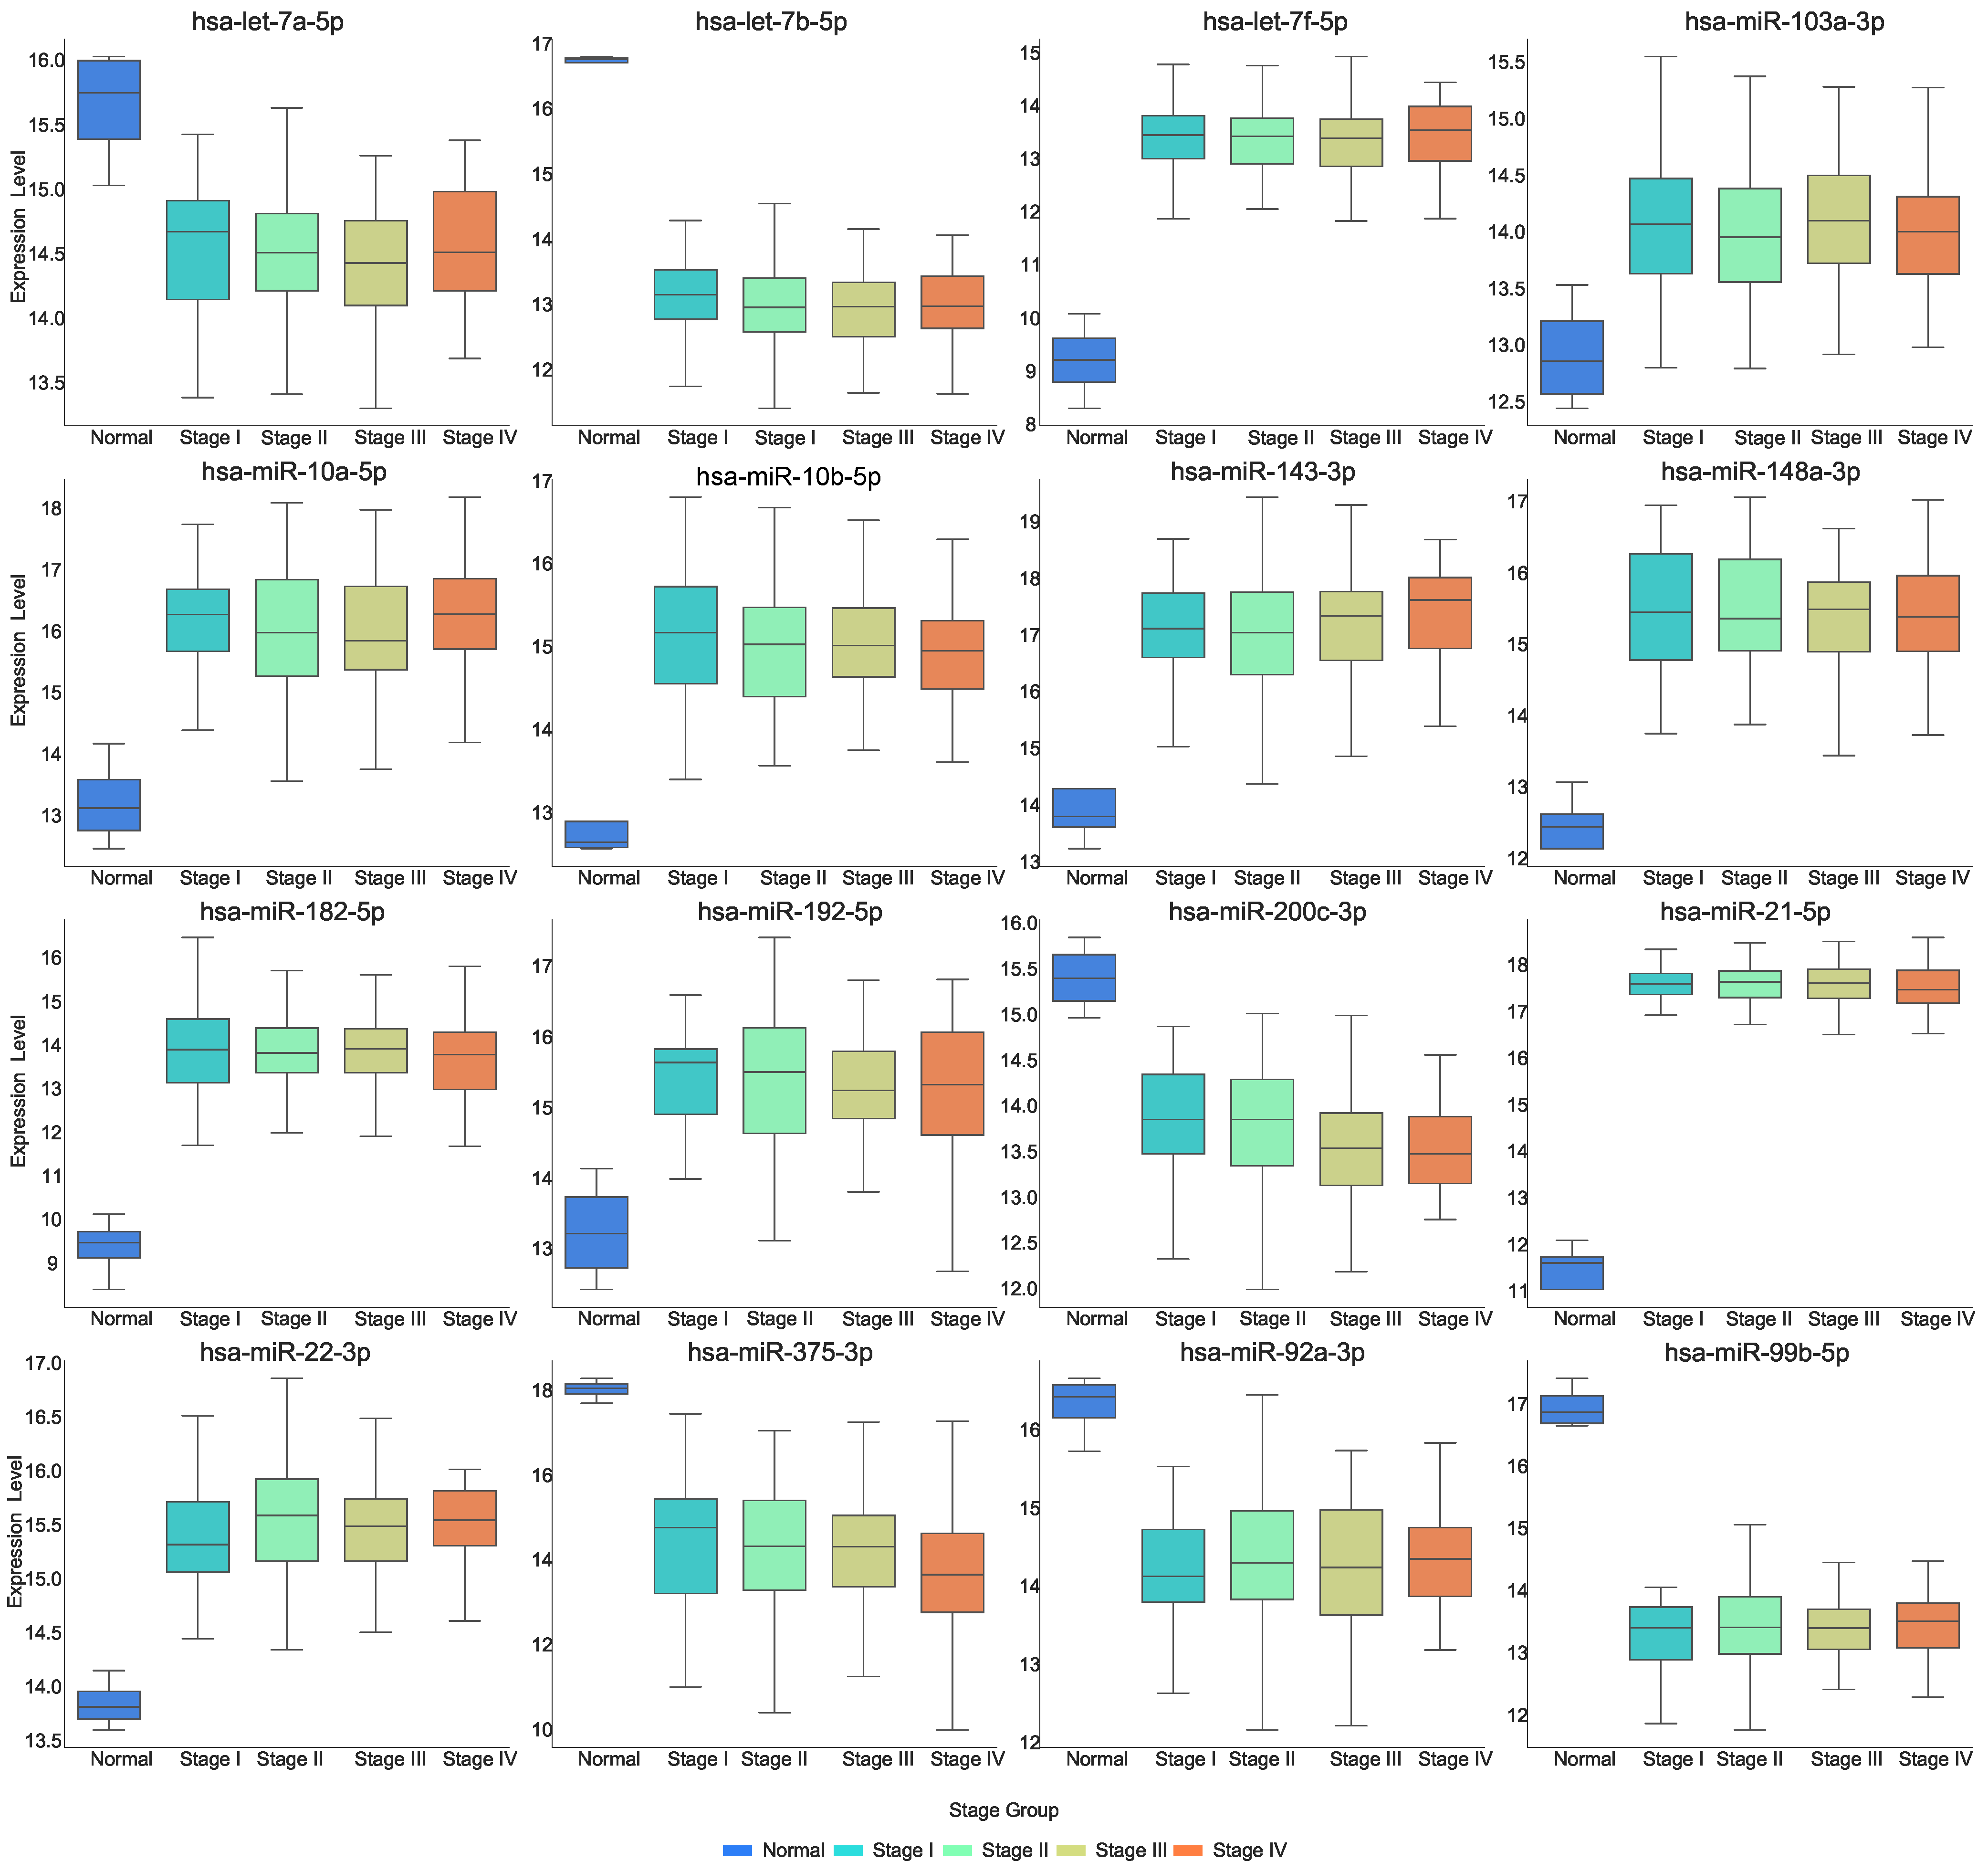
Figure 3 demonstrates the expression of miRNAs at each stage. The expression of several miRNAs shows significant changes from normal to disease states. Specifically, hsa-let-7a-5p, hsa-let-7b-5p, hsa-miR-200c-3p, hsa-miR-375-3p, hsa-miR-92a-3p, and hsa-miR-99b-5p exhibit a marked decrease in expression as the disease progresses. In contrast, hsa-let-7f-5p, hsa-miR-103a-3p, hsa-miR-10a-5p, hsa-miR-10b-5p, hsa-miR-143-3p, hsa-miR-148a-3p, hsa-miR-182-5p, hsa-miR-192-5p, and hsa-miR-22-3p demonstrate a significant increase in expression from normal to disease states. Additionally, the expression of hsa-miR-143-3p increases as the disease progresses, while the expression level of hsa-miR-200c-3p and hsa-miR-375-3p decrease with disease progression.
Expression pattern analysis of key genes and miRNAs revealed that genes like CDX2, FABP1, and KRT20 exhibited higher expression levels in tumor stages compared to normal tissues, indicating their involvement in tumorigenesis. In contrast, miRNAs such as hsa-let-7a-5p and hsa-miR-375-3p showed decreased expression in tumor stages, reflecting their regulatory roles in maintaining normal cellular function and possibly acting as tumor suppressors. Moreover, these expression patterns underscore the dynamic regulatory landscape of COAD and highlight the potential of these genes and miRNAs as biomarkers for disease progression.
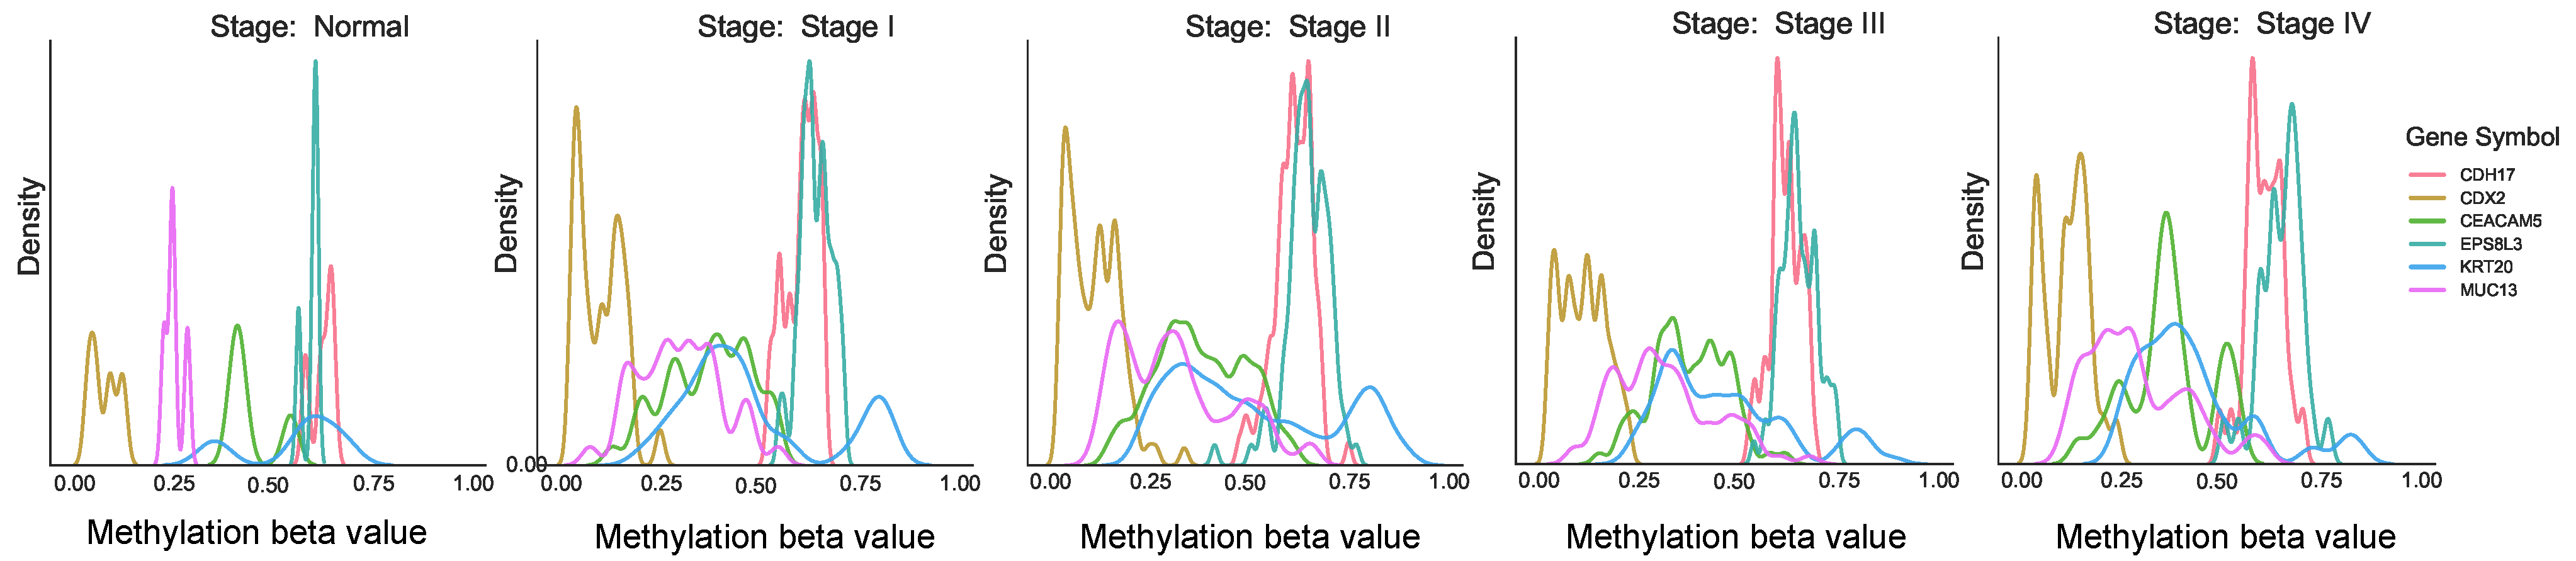
Furthermore, methylation analysis indicated that CDH17 and EPS8L3 were predominantly hypermethylated, with beta values ranging from 0.6 to 0.7, as shown in
Figure 4. However, methylation changes were not observed across different stages for other genes, suggesting that their expression anomalies might be regulated through alternative mechanisms, such as miRNA interactions.
Our multi-stage network analysis identified conserved molecular drivers (e.g., CDH17, CEACAM5) and stage-dependent regulators (e.g., FABP1, PRAP1) through MFE quantification. The progressive downregulation of intestinal differentiation markers (e.g., CDX2, MUC13) coupled with miR-22-3p upregulation suggests a miRNA-mediated dedifferentiation mechanism during stage transitions. These dynamic patterns provide a molecular rationale for staging systems and highlight potential therapeutic windows for stage-specific interventions.
3.2. Revealing Potential Gene Pathogenesis via PPI Networks
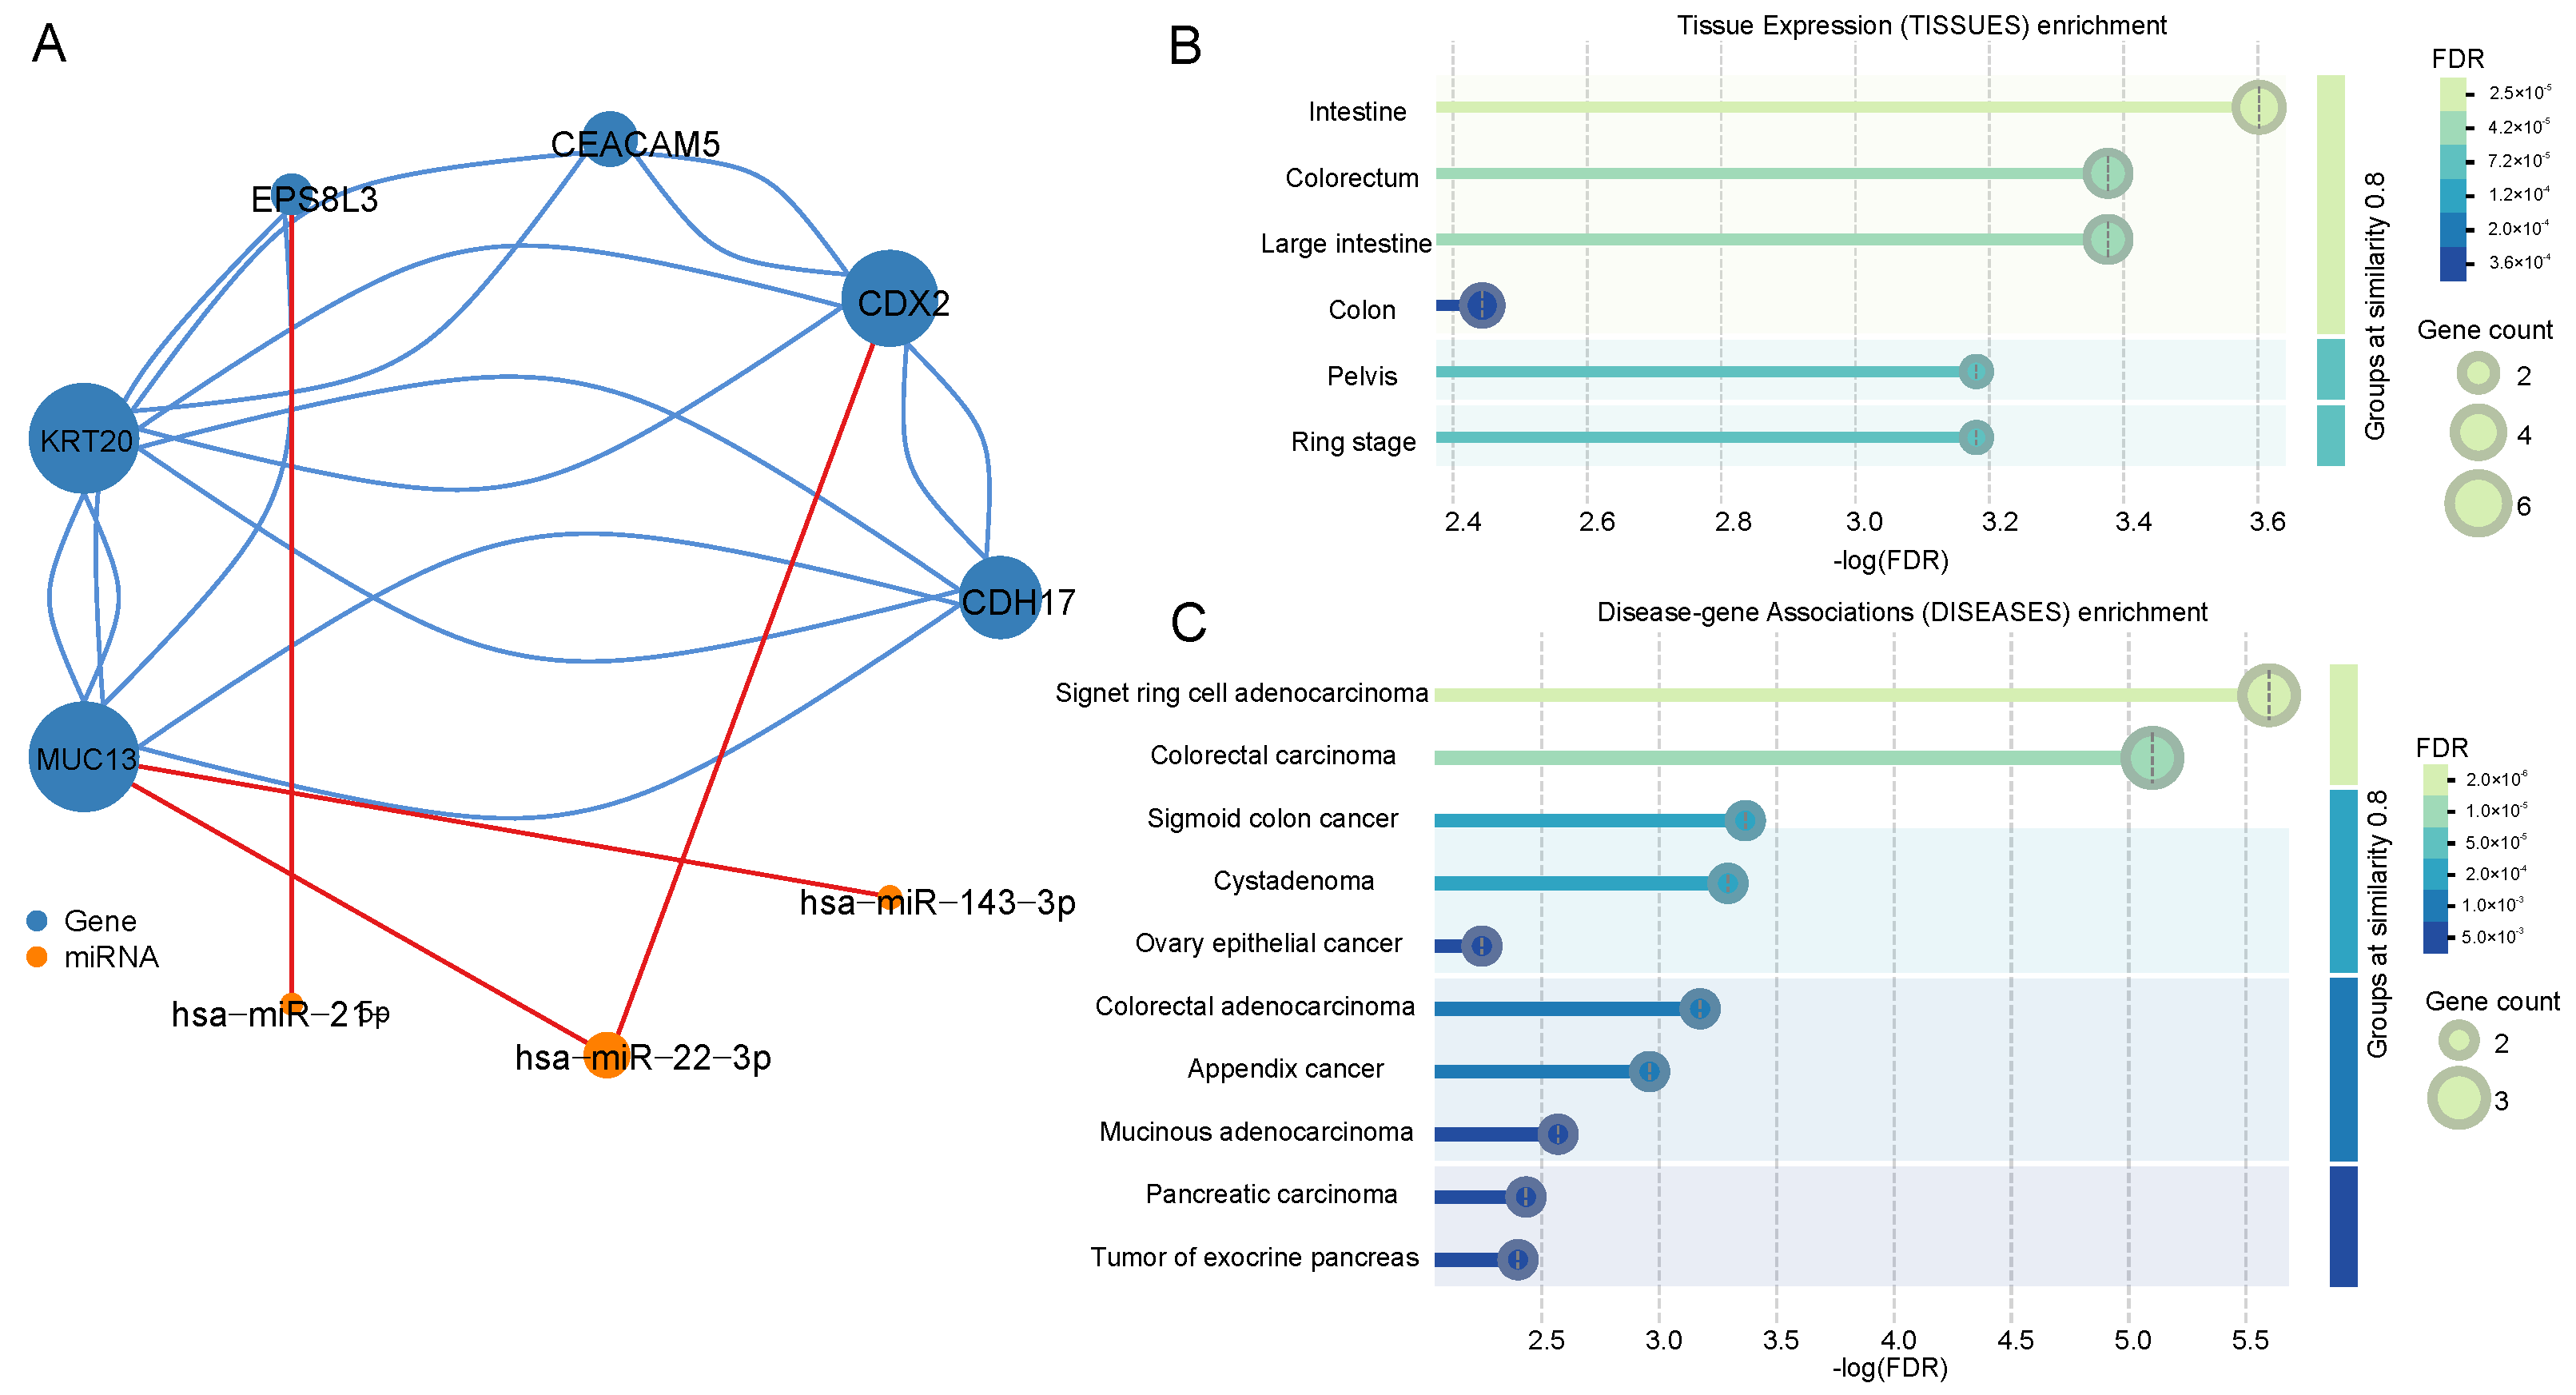
We identified the intersection of the top ten genes and miRNAs ranked by MFE values across different stages, indicating their potential importance at all stages. Since the co-expression network was constructed based on expression data, the actual functional roles of these genes and miRNAs remain unclear. Therefore, we constructed a functional interaction network for the core genes and miRNAs using the STRING database for protein–protein interactions and the miRTarBase database for miRNA–target interactions, as shown in
Figure 5A [
22,
23]. The blue nodes represent genes, and the orange nodes represent miRNAs. We found that these genes form a connected network in their actual regulatory roles, revealing that KRT20 had the highest degree of connectivity, indicating its central role in the gene cluster. Additionally, hsa-miR-22-3p was found to regulate two key genes, CDX2 and MUC13, suggesting its importance in the regulatory network.
Using the STRING database, we performed tissue-specific expression clustering analysis and found that seven out of the top genes were enriched in the intestinal tract, as shown in
Figure 5B,C. Specifically, CEACAM5, CDX2, and KRT20 were highly enriched in colorectal tissues, further validating their relevance to COAD. Disease enrichment analysis confirmed the strong association of these genes with COAD, with CEACAM5, CDX2, and KRT20 being significantly linked to colorectal adenocarcinoma. The low-log (FDR) values further supported the reliability of these findings.
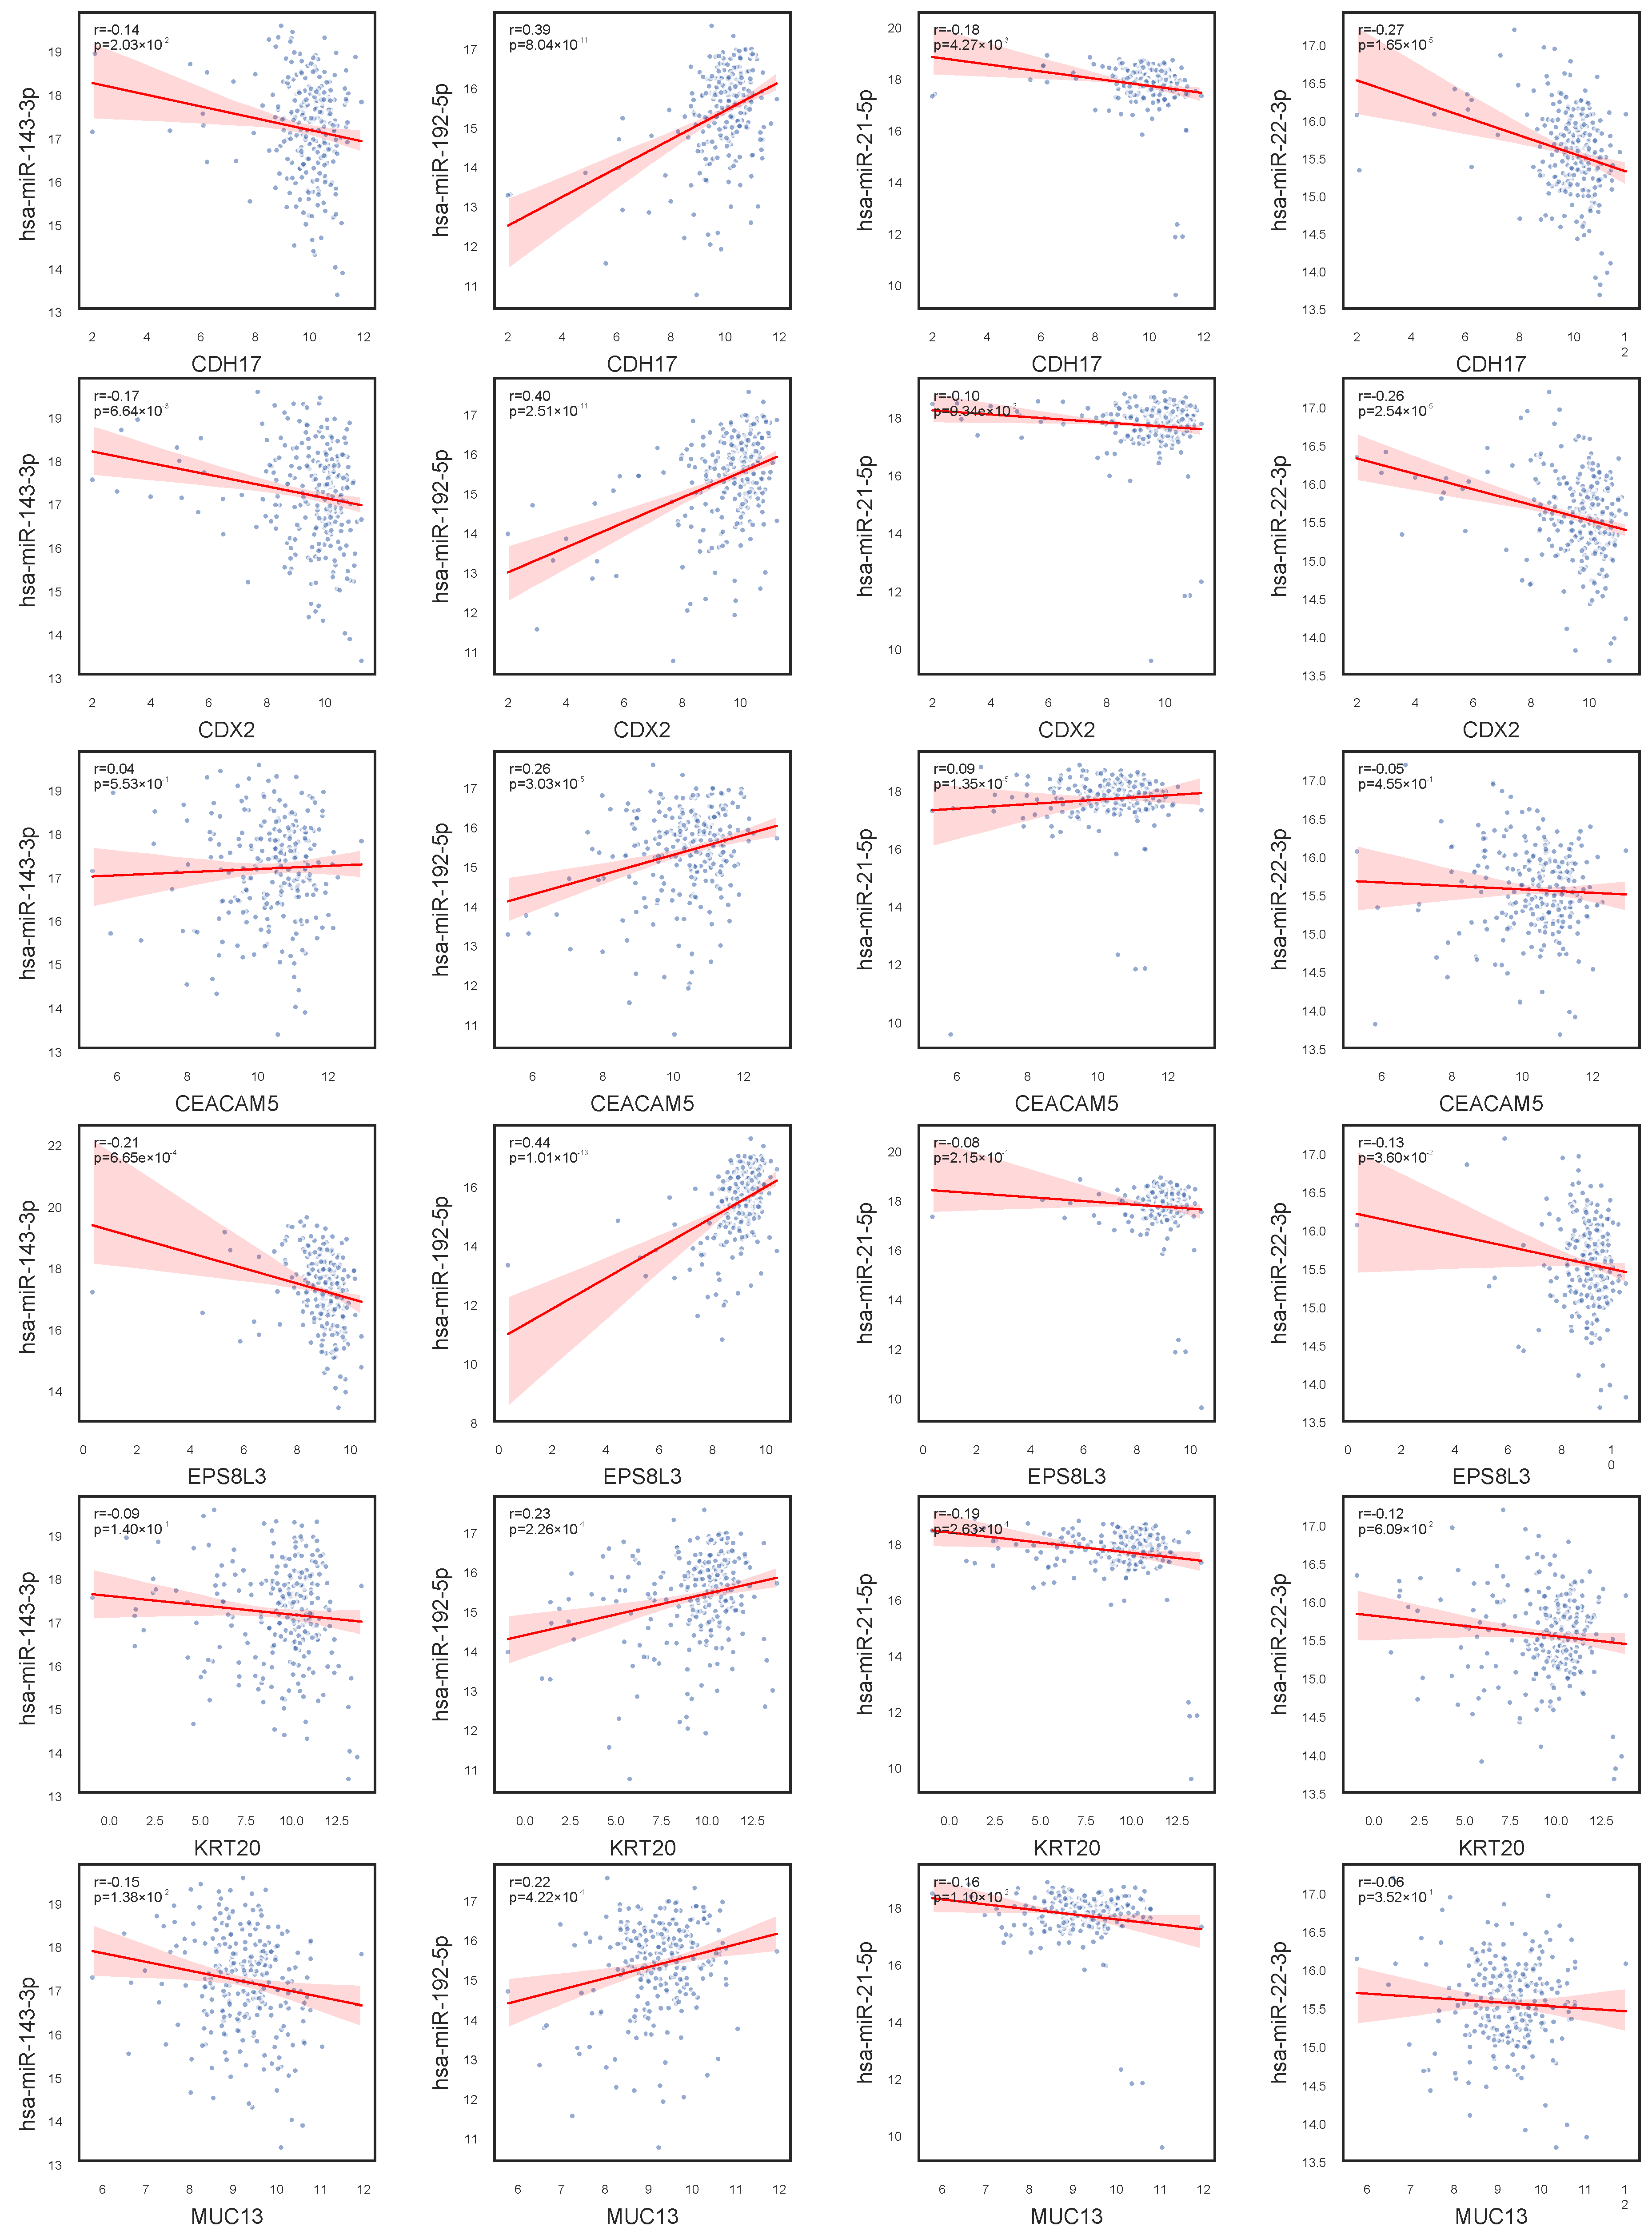
In our investigation of gene–miRNA expression relationships, as shown in
Figure 6, we observed that hsa-miR-143-3p exhibits no significant correlation with CEACAM5 and KRT20 expression, but shows a negative correlation with other genes in the network, suggesting a potential inhibitory regulatory mechanism. In contrast, hsa-miR-192-5p demonstrates a positive correlation with the expression of CDH17, CDX2, CEACAM5, EPS8L3, KRT20, and MUC13, indicating a possible role in promoting their expression. Notably, hsa-miR-21-5p displays weak correlations with all studied genes, implying minimal involvement in their regulation under the current conditions. Furthermore, hsa-miR-22-3p exhibits a strong negative correlation with CDH17 and CDX2, and a weaker negative correlation with other genes, highlighting differential regulatory strengths across the network. These findings provide critical insights into gene regulatory networks and their implications in disease mechanisms.
We found interesting phenomena when looking at the relationship among CDX2, hsa-miR-22-3p, and MUC13. As observed in
Figure 1, CDX2 and MUC13 exhibit a similar expression pattern: their expression levels decrease from the Normal stage to Stage II, potentially influenced by tumor progression, and then recover in Stages III and IV. Additionally,
Figure 2 shows that hsa-miR-22-3p has a very low expression level in normal samples but significantly increases upon disease onset, with a further upward trend across stages. This suggests that hsa-miR-22-3p may regulate the expression of CDX2 and MUC13 in COAD. To validate this hypothesis, we analyzed the correlation between the expression of these genes and the miRNA, as shown in
Figure 6. The results indicate a negative correlation between hsa-miR-22-3p and the expression of both CDX2 and MUC13, supporting its potential regulatory role in COAD.
There has been extensive literature demonstrating that the genes CDX2 and MUC13 play important roles in the development of COAD. CDX2 was found to inhibit tumor cell proliferation by regulating the Wnt/
-catenin signaling pathway. Knockdown of CDX2 promoted tumor growth, while its overexpression suppressed tumor formation. Additionally, CDX2 is a prognostic biomarker in Stage II and Stage III colon cancer [
24]. MUC13 was overexpressed in COAD tissues and was associated with increased tumor cell growth, migration, and invasion. It was also found to interact with the JAK2/STAT5 signaling pathway and the oncoprotein YAP1, suggesting its role in tumor metastasis [
25]. Hsa-miR-22-3p, although less studied in COAD, is hypothesized to regulate multiple oncogenic processes, including cell proliferation, cycle progression, apoptosis, and migration based on the established regulatory paradigms of miRNAs in colorectal carcinogenesis [
26].
3.3. Molecular Signatures of Gender Differences in COAD
We constructed miRNA–gene co-expression networks for males and females and calculated MFE separately using the workflow in the Materials and Methods section. Gender-stratified co-expression network analysis identified conserved and gender-dimorphic regulatory architectures in CRC pathogenesis. As shown in
Table 4, the top ten MFE genes in both the male and female networks include CDH17, CDX2, CEACAM5, EPS8L3, FABP1, KRT20, MUC13, NOX1, VIL1, and hsa-let-7a-5p, hsa-miR-10a-5p, hsa-miR-143-3p, hsa-miR-148a-3p, hsa-miR-192-5p, hsa-miR-21-5p, and hsa-miR-22-3p. As observed in
Section 3.2, many of these genes and miRNAs overlap with the nodes in the core network, further supporting their relevance within the network context.
CEACAM5 and KRT20 ranked in the top two positions in both male and female patients, consistent with their well-established roles as classical biomarkers for COAD [
27]. The high rankings of CDH17 and CDX2 suggest that abnormal intestinal epithelial differentiation is a central event in both sexes. The male-specific SLC26A3, associated with intestinal mucosal pH regulation, may promote carcinogenesis through dysregulated interactions with gut microbiota [
28]. In contrast, the female-specific GPA33, a gene related to intestinal epithelial cell surface antigens [
29], may play a role in specific phenotypes or immune evasion processes in female COAD. These findings indicate potential differences in immune evasion mechanisms or tumor microenvironments between male and female COADs.
hsa-miR-21-5p and hsa-miR-143-3p occupy central positions in both sexes, aligning with previous studies that demonstrate that miR-21 promotes proliferation via the PTEN/AKT pathway, while miR-143 suppresses metastasis through KRAS inhibition [
30,
31]. The male-specific hsa-miR-200c-3p may regulate epithelial–mesenchymal transition (EMT) via ZEB1 [
32], whereas the female-specific hsa-miR-375-3p has been shown to interact with estrogen receptor signaling [
33].
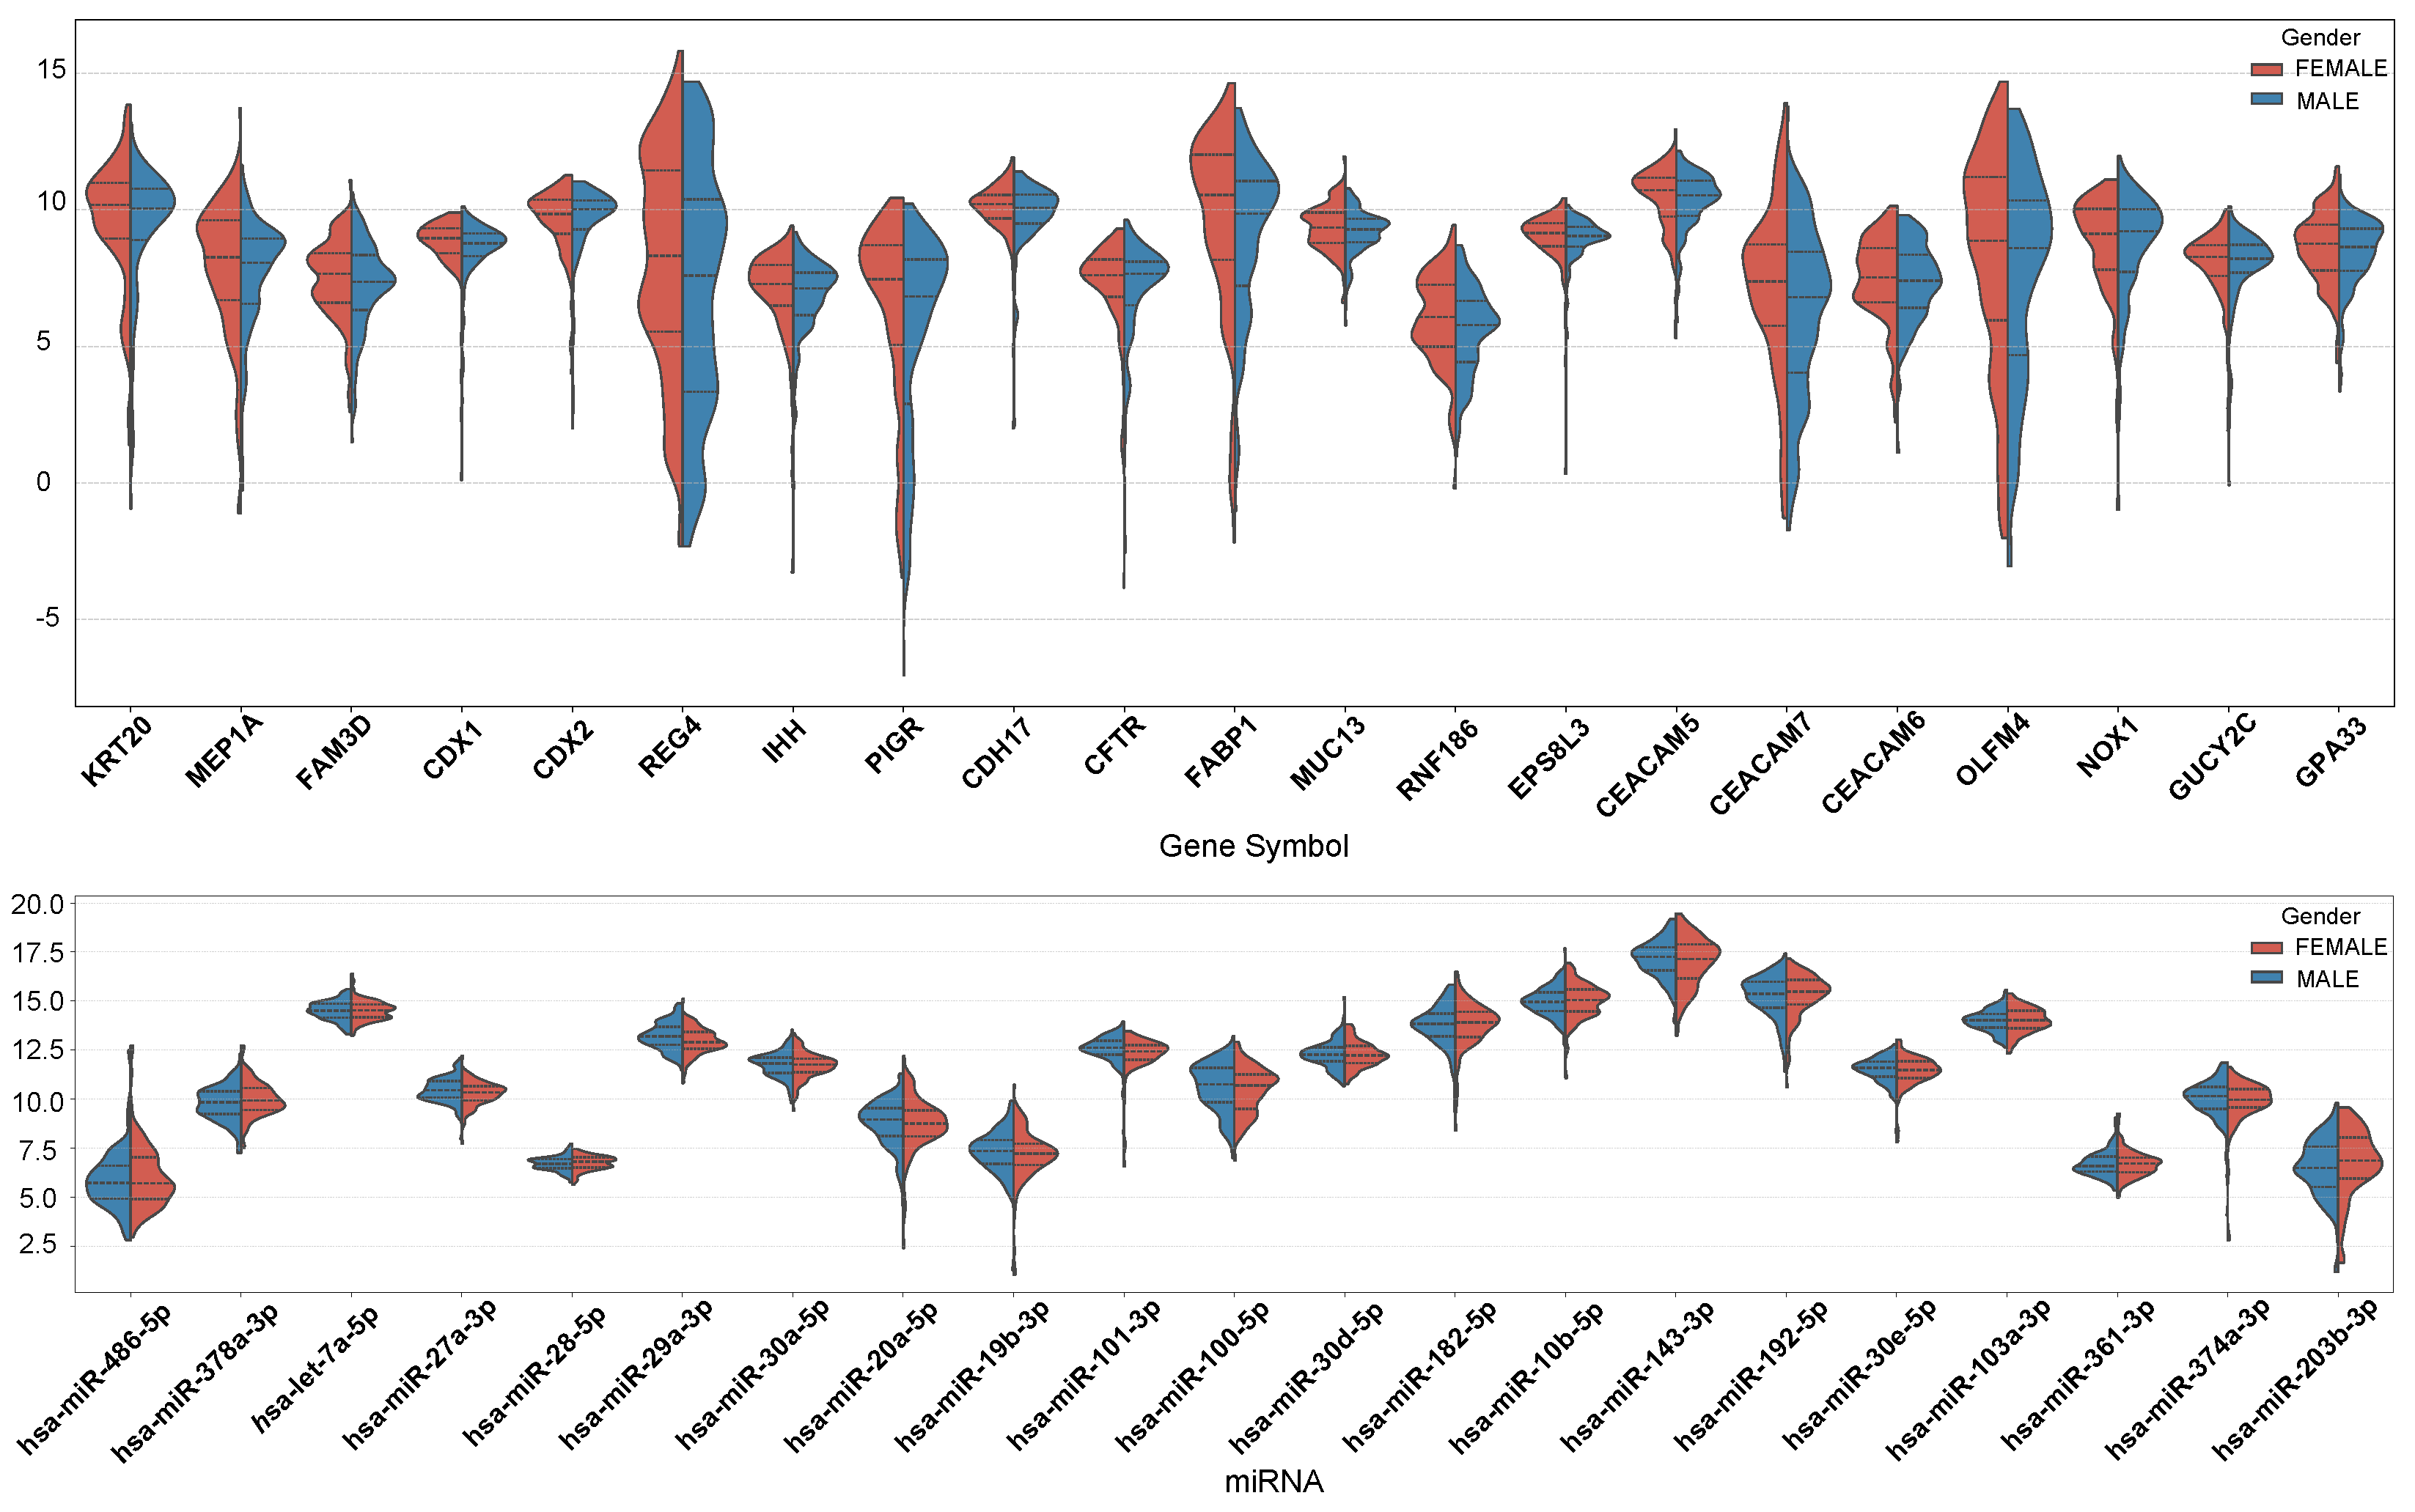
In
Figure 7, we present the expression profiles of the top 10 genes with the highest MFE values in both males and females, as well as the top 10 genes with the highest MFE value differences between males and females. The overall expression levels of MEP1A, REG4, IHH, PIGR, FABP1, RNF186, CEACAM7, and OLFM4 were lower in males than in females. On the other hand, the expression levels of hsa-miR-27a-3p, hsa-miR-29a-3p, hsa-miR-101-3p, and hsa-miR-100-5p were slightly higher in males than in females. Conversely, hsa-miR-378a-3p, hsa-miR-192-5p, and hsa-miR-203b-3p exhibited higher expression in females.
MEP1A promotes COAD invasion and metastasis by activating the EGFR-PI3K-Akt pathway and cleaving E-cadherin. REG4 enhances cell proliferation and chemoresistance via EGFR signaling-driven upregulation of anti-apoptotic proteins (Bcl-2/Bcl-xL). IHH may influence tumor progression indirectly by modulating intestinal stem cell dynamics or immune microenvironments. PIGR acts as a tumor suppressor, with low expression linked to poor prognosis, and its upregulation regulates immune responses and fatty acid metabolism. FABP1 likely supports cancer growth through fatty acid metabolic reprogramming. RNF186 suppresses tumorigenesis by inhibiting NF-κB signaling, while its deficiency exacerbates CRC burden. CEACAM7, downregulated in CRC, loses cell adhesion capacity to facilitate cancer spread. OLFM4 is associated with intestinal stem cell properties, affecting tumor initiation and differentiation. There are no relevant studies demonstrating a specific correlation between these genes and sex, but their combined role in proliferation, apoptosis, metabolism, and micro-environmental remodeling determines the degree of malignancy of CRC.
These findings not only provide a molecular basis for explaining gender differences in COAD incidence and treatment responses but also highlight the necessity of gender-stratified strategies in clinical practice.
3.4. Age-Related Molecular Characteristics in COAD
Similarly, we constructed miRNA–gene co-expression networks for patient samples of different age groups (<50, 50–70, 70+) and calculated the MFE values of each gene and miRNA in different networks separately, and the top 10 genes and miRNA in each age group are shown in
Table 4. It is very obvious from
Table 5 that the top ten genes for under 50 years of age are completely different from the top ten genes for 50–70 and 70+, while nine of the top ten genes for 50–70 and 70+ are the same. This also proves that colon cancer patients younger than 50 years old have a different pathogenesis than patients older than 50 years old. However, at the miRNA level, seven of the top ten miRNA in the three age groups were the same, suggesting that at the miRNA level, the <50 group is similar to the 50–70 and 70+ groups in terms of pathogenic mechanisms.
The middle-aged and old groups exhibit a high degree of overlap in their key gene profiles, which are primarily involved in classic pathways such as cell differentiation (CDX2) [
34], adhesive junctions (CDH17) [
35], and tumor antigen presentation (CEACAM5) [
36]. These pathways align closely with the phenotypic characteristics of adenocarcinoma in colon cancer. Notably, CEACAM5, as a broad-spectrum carcinoembryonic antigen, has shown a positive correlation between its expression level and tumor stage across multiple cohorts, suggesting that it may serve as a significant prognostic indicator in middle-aged and elderly patients. In contrast, the unique gene combinations in the young group are more involved in chromatin remodeling (regulation of the SWI/SNF complex by ZNHIT2) [
37] and metabolic transport (SLC family pathways) [
38], potentially associated with the more aggressive and poorly differentiated clinical features of colon cancer in younger patients.
Both hsa-miR-21-5p and hsa-miR-143-3p are ranked in the top 10 across all three groups, and their pan-cancer regulatory roles have been widely recognized [
30,
31]. The sustained high expression of these miRNAs suggests their central role in the development of colon cancer. Notably, hsa-miR-194-5p, specific to the elderly group, has been confirmed to regulate intestinal epithelial differentiation by targeting CDX1. This creates a negative feedback loop with the upregulation of CDX1 in the elderly group, which may reflect a compensatory activation of differentiation regulatory networks within the tumor microenvironment of older individuals [
39].
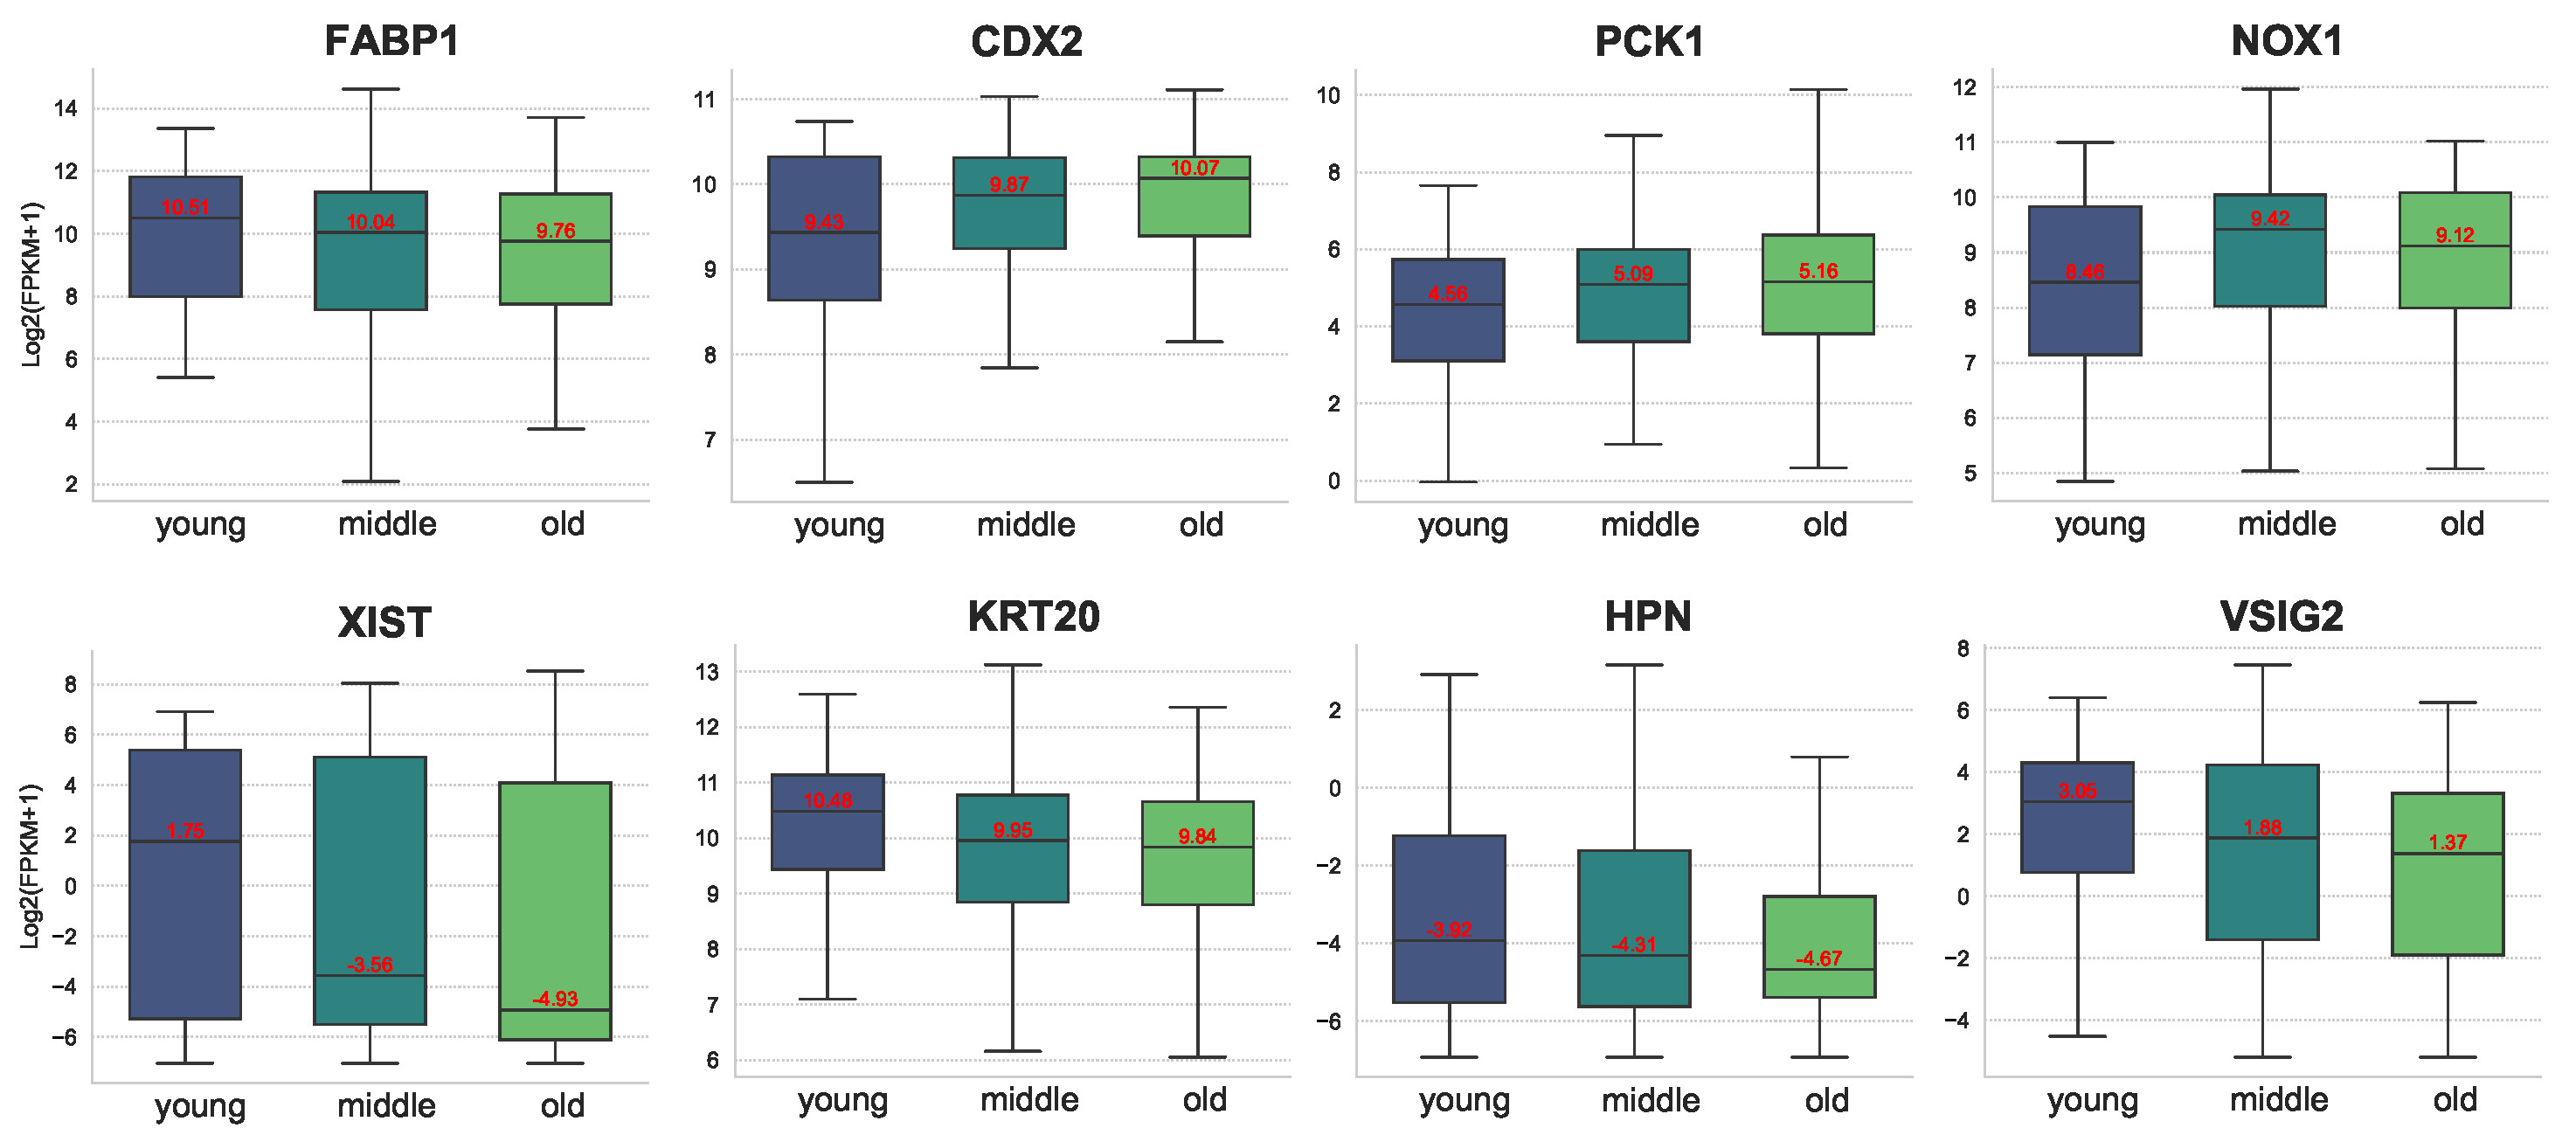
Figure 8 illustrates the expression of some of the differential genes at different ages. As can be seen from the figure, the expression of FABP1, XIST, KRT20, HPN, and VSIG2 gradually decreased with age. In particular, for XIST, the expression difference between the young group and the middle group is huge. In contrast, the expression of CDX2, PCK1, and NOX1 increased with age. In contrast, the expression of CDX2, PCK1, and NOX1 increased with age. Related studies have shown that high expression of XIST is associated with poor overall survival in COAD patients. Knockdown of XIST significantly inhibited COAD cell proliferation, invasion, epithelial–mesenchymal transition (EMT), and COAD stem cell formation in vitro, as well as tumor growth and metastasis in vivo. Thus, gene XIST is likely to be a potential age-related marker for colon cancer.
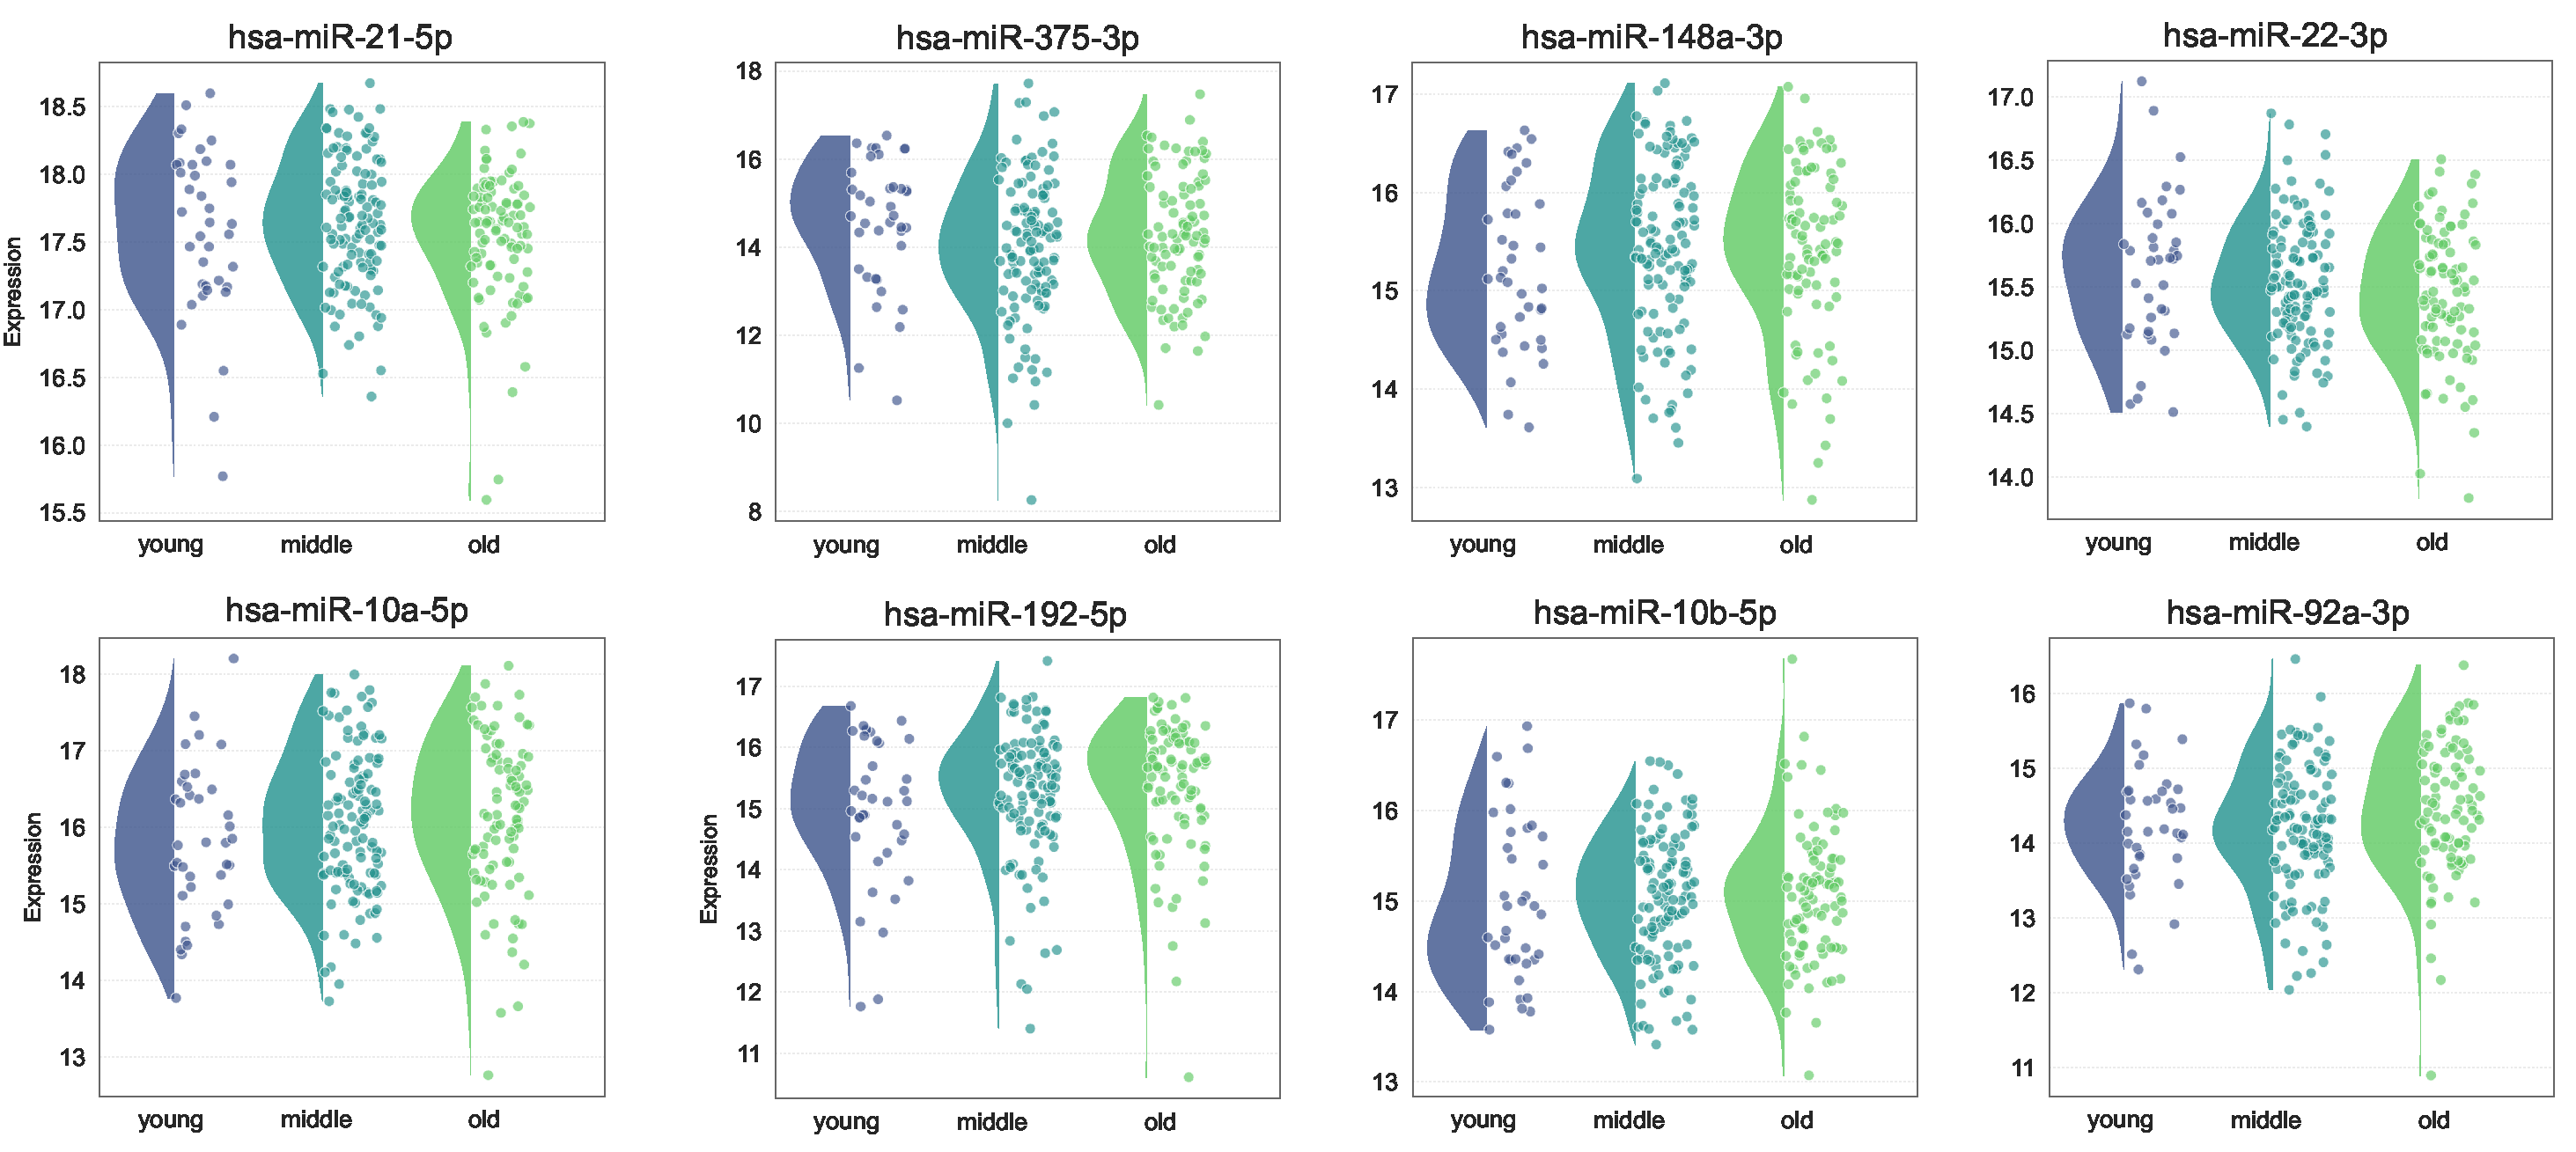
Figure 9 illustrates the expression of some miRNAs with differential expression levels across different age groups. hsa-miR-148a-3p, hsa-miR-192-5p, and hsa-miR-10b-5p were more highly expressed in the middle and old age groups than in the young age group. On the other hand, hsa-miR-375-3p and hsa miR-22-3p exhibited higher expression levels in the younger age group. Among them, hsa-miR-148a-3p, hsa-miR-375-3p, and hsa miR-22-3p have been proven to be biomarkers in CRC.
3.5. Potential Drug Screening Based on Core Network Genes
Based on the genes in the core network in
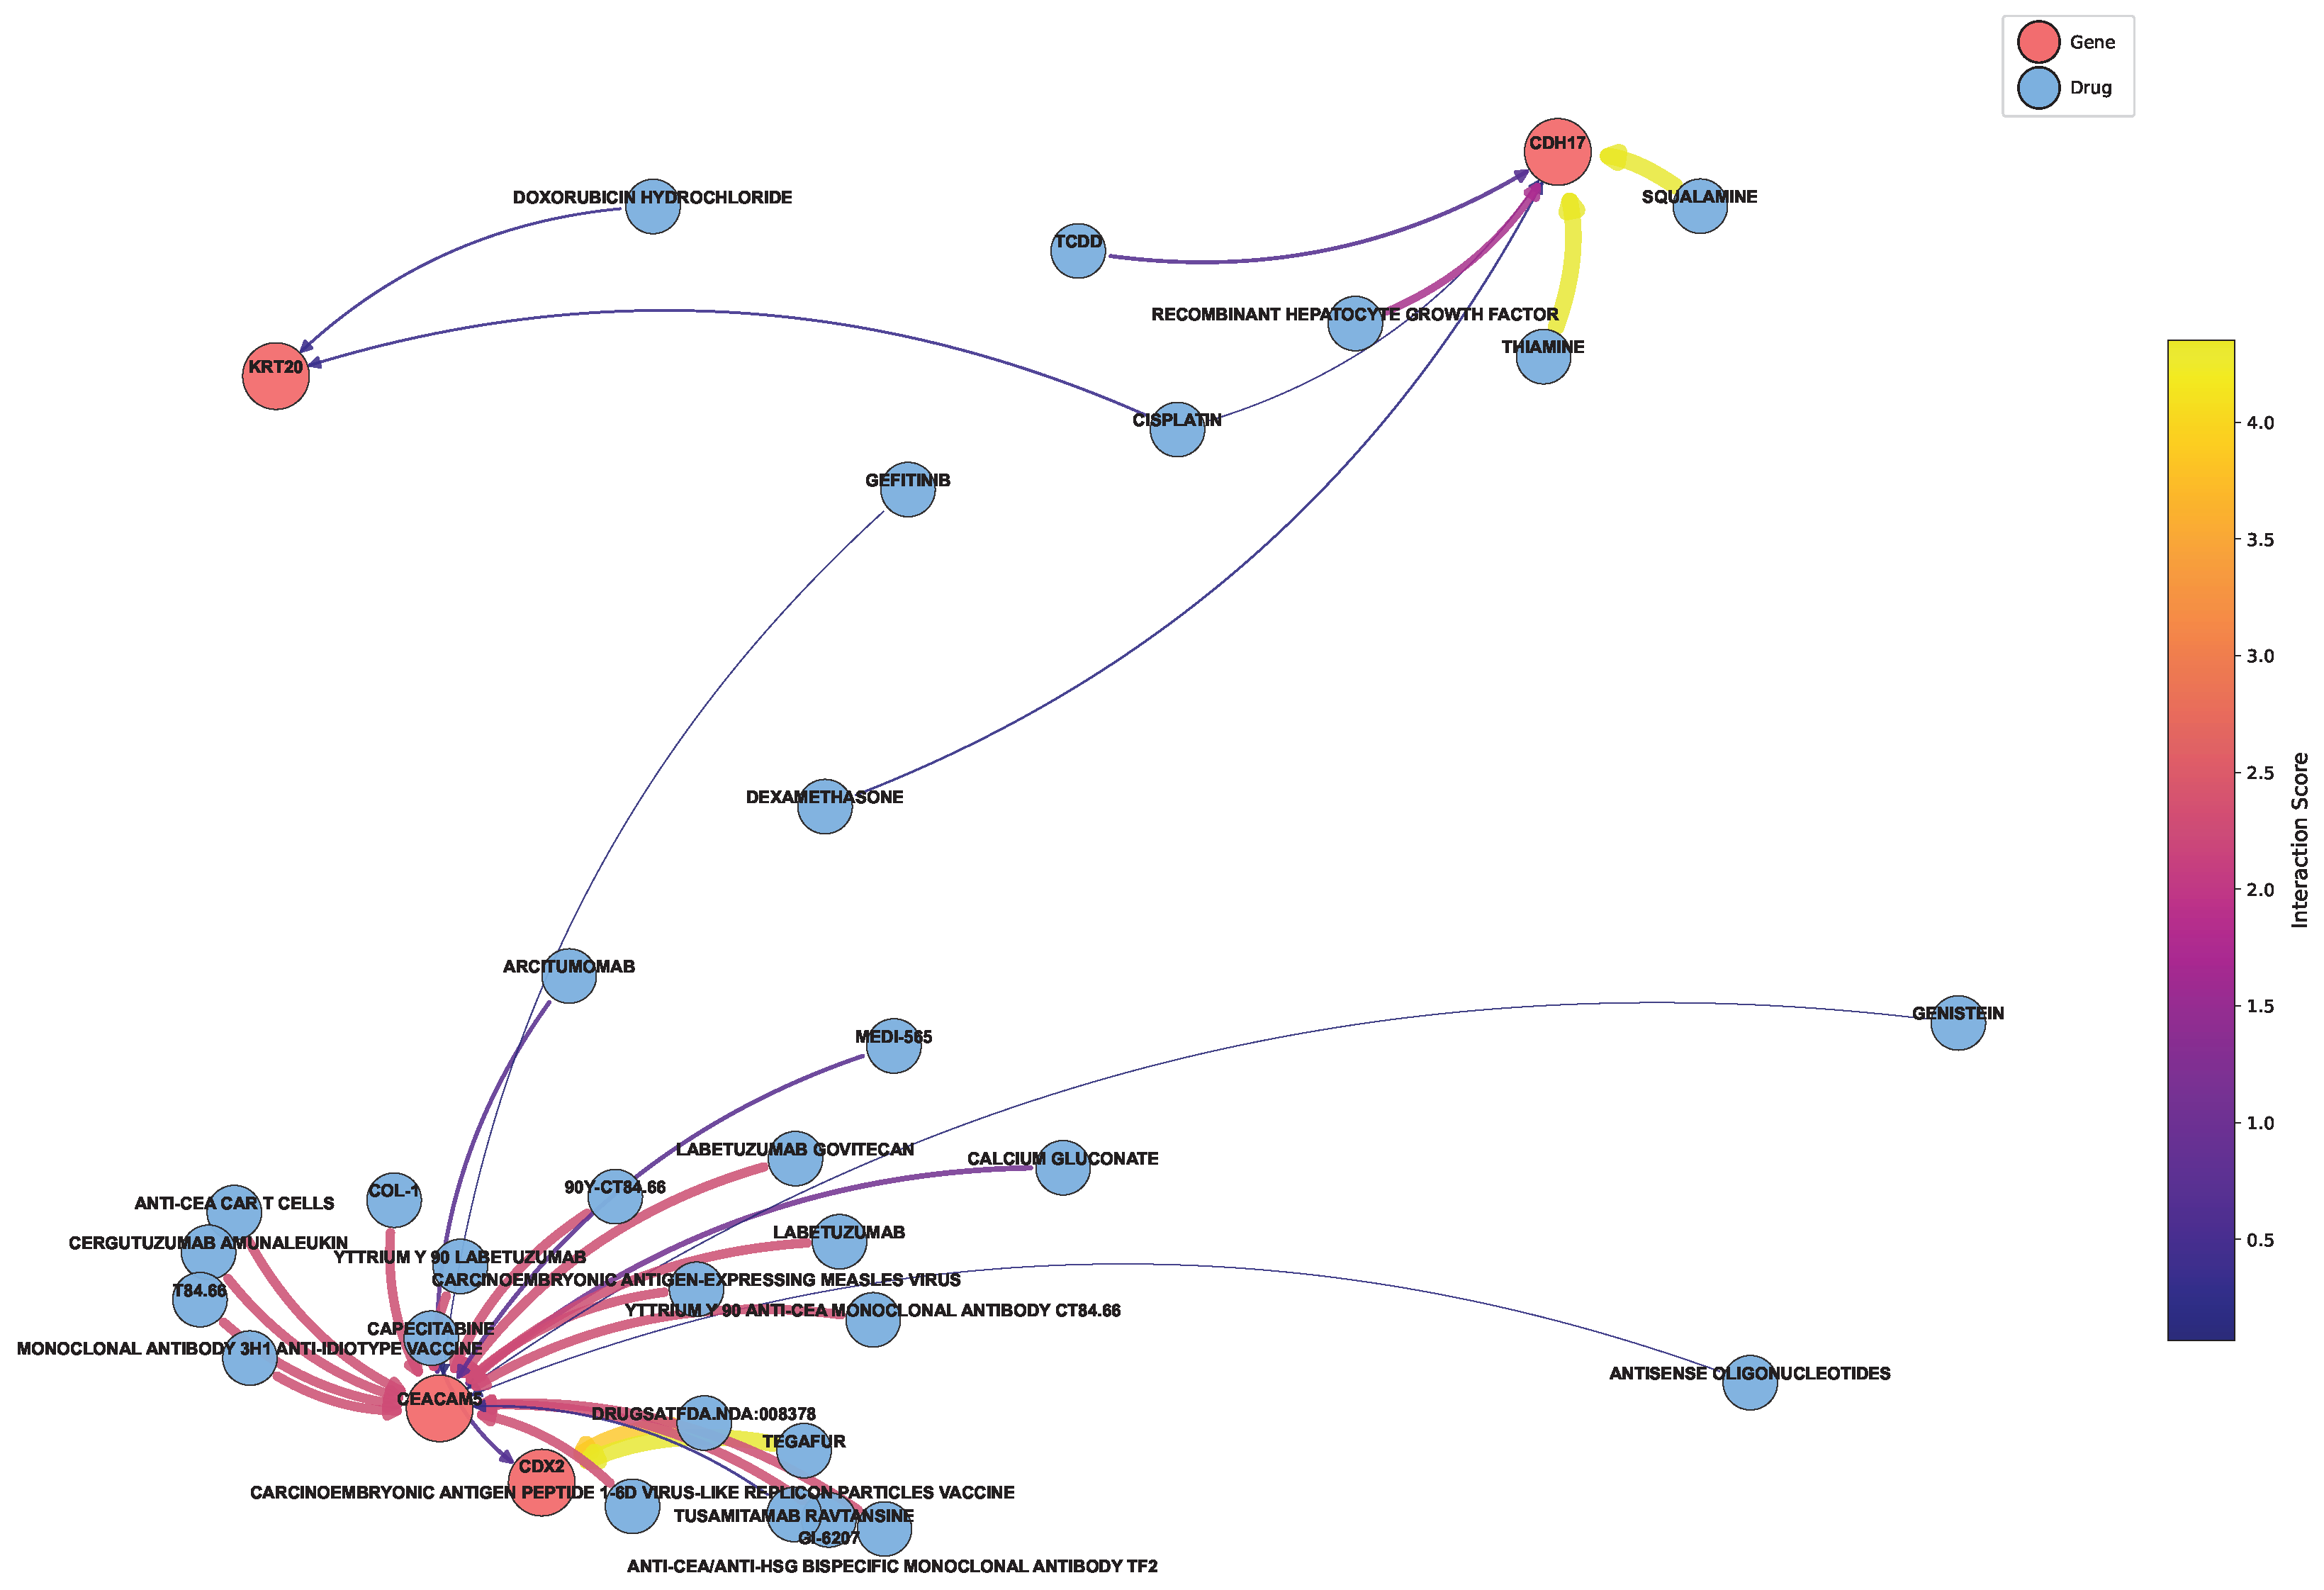
Section 3.2, we extracted the drugs associated with these genes from the DGIdb database to map the network, as shown in
Figure 10 [
40]. It is not difficult to summarize the key targeted drugs, as specifically shown in
Table 6. The table presents several potential therapeutic drugs for colon cancer. The potential of these drugs as colon cancer treatments is closely associated with their unique molecular mechanisms.
SQUALAMINE exhibits anti-angiogenic properties by targeting vascular endothelial cells, inhibiting their proliferation and migration, thus limiting the tumor’s blood supply. TEGAFUR, a fluorouracil-based drug, is converted into fluorouracil in the body, where it inhibits thymidylate synthase and interferes with RNA synthesis, suppressing colon cancer cell growth. LABETUZUMAB GOVITECAN, an antibody-drug conjugate, specifically targets colon cancer cell surface antigens, releasing a cytotoxic drug upon endocytosis to induce apoptosis. The ANTI-CEA/ANTI-HSG BISPECIFIC MONOCLONAL ANTIBODY TF2 recruits immune cells to kill colon cancer cells via antibody-dependent cell-mediated cytotoxicity (ADCC) and complement-dependent cytotoxicity (CDC). T84.66, an anti-CEA monoclonal antibody, also targets CEA and employs immune mechanisms to eliminate cancer cells. The CARCINOEMBRYONIC ANTIGEN PEPTIDE 1-6D VIRUS-LIKE REPLICON PARTICLES VACCINE stimulates an immune response against CEA, generating cytotoxic T lymphocytes (CTLs) and antibodies to recognize and destroy colon cancer cells. Finally, YTTRIUM Y 90 ANTI-CEA MONOCLONAL ANTIBODY CT84.66, a radioimmunoconjugate, delivers beta radiation to the tumor, inducing DNA damage and cell death. Together, these therapeutic agents act on key physiological processes in colon cancer cells from various perspectives, showing promise as effective treatments for colon cancer.
In colon cancer treatment, various drugs target distinct mechanisms and regulatory pathways, as outlined in
Table 7. Bevacizumab, a monoclonal antibody targeting VEGF, impedes angiogenesis by blocking VEGF, a key factor in blood vessel formation, thereby reducing the tumor’s blood supply and suppressing tumor growth and metastasis. This mechanism involves key genes such as VEGF, VEGFR2 (KDR), PIK3CA, AKT1, and MAPK1. Fruquintinib and regorafenib, multi-kinase inhibitors, block multiple tyrosine kinase receptors like VEGFR, PDGFR, FGFR, RET, and KIT, inhibiting tumor angiogenesis and cell proliferation through pathways like VEGF/VEGFR, PDGF/PDGFR, and FGF/FGFR. Key genes include VEGFR2, PDGFRB, FGFR1, KIT, and RET. Cetuximab and panitumumab, EGFR inhibitors, block EGFR signaling, which in turn activates downstream pathways such as RAS/RAF/MEK/ERK and PI3K/AKT/mTOR, promoting cell proliferation and survival. In colon cancer with wild-type KRAS, inhibiting EGFR can effectively block these oncogenic signals, with key genes including EGFR, KRAS, NRAS, BRAF, PIK3CA, and AKT1. Vemurafenib and trametinib target BRAF and MEK, respectively, and are used for colon cancer with the BRAF V600E mutation. These drugs inhibit the MAPK signaling pathway, blocking the continuous activation of BRAF kinase and MEK, thus preventing cell proliferation and survival. The key genes involved are BRAF (especially the V600E mutant), MEK1/2 (MAP2K1/2), and ERK1/2 (MAPK3/1). Finally, Rhein, a multi-target natural product, induces apoptosis in colon cancer cells by regulating the PI3K-Akt and MAPK pathways. It reduces Bcl-2 expression, upregulates Bax, and inhibits ERK activation. Key genes include PIK3CA, AKT1, MAPK1 (ERK2), BCL2, and BAX. Collectively, these drugs target various critical pathways in colon cancer, providing diverse therapeutic strategies to combat the disease.


 ,
, 
