Abstract
Internet of Things (IoT) technology has facilitated the deployment of autonomous sensors in remote and challenging environments, enabling substantial advancements in environmental monitoring and data collection. IoT sensors continuously gather data, transmitting it to a central Base Station (BS) via designated Cluster Heads (CHs). However, data flow encounters frequent congestion at CH nodes, negatively impacting network performance and Quality of Service (QoS). This paper introduces a novel congestion control strategy tailored for Wireless Sensor Networks (WSNs) to balance energy efficiency and data reliability. The proposed approach follows an eight-step process, integrating Generative Adversarial Networks (GANs) for enhanced clustering and Ant Colony Optimization (ACO) for optimal CH selection and routing. GANs simulate realistic node clustering, achieving better load distribution and energy conservation across the network. ACO then selects CHs based on energy levels, distance, and network centrality, using pheromone-based routing to adaptively manage data flows. A congestion factor (CF) threshold is also incorporated to dynamically reroute traffic when congestion risks arise, preserving QoS. Simulation results show that this approach significantly improves QoS metrics, including latency, throughput, and reliability. Comparative evaluations reveal that our method outperforms existing frameworks, such as Fuzzy Structure and Genetic-Fuzzy (FSFG), Deep Reinforcement Learning Cache-Aware Congestion Control (DRL-CaCC), and Adaptive Cuckoo Search Rate Optimization (ACSRO).
Keywords:
wireless sensor networks (WSNs); congestion control; quality of service (QoS); generative adversarial networks (GANs); ant colony optimization (ACO) MSC:
94-04; 68Txx; 93-04
1. Introduction
The Internet of Things (IoT) has improved quickly, leading to smart sensors that work on their own [1]. These sensors can automatically collect and share data and are often spread out in different places to track things like humidity, movement, heat, smoke, or pressure. They can be networked and used in hard-to-reach places to ensure reliable communication [2]. Typically, data collected by these sensors are sent to a Base Station (BS) through a Cluster Head (CH) or other nodes [3]. Connecting such devices to the Internet allows users to analyze the data, offering appealing insights and automation options [4]. IoT connects the physical and digital worlds, making automation possible across various fields [5]. These sensors collect massive amounts of data, help improve insights or organize actions in industries like environmental monitoring, healthcare, and air pollution detection. IoT devices communicate with one another using Internet protocol (IP) [6], the same system that links computers on the Internet [7].
Congestion in data forwarding occurs when too much data tries to pass through a network, overwhelming one or more points along the path [8]. This slows down data transfer and can lead to data loss [9]. Unmanaged data forwarding in an IoT network can lead to congestion, overwhelming the network’s capacity [10,11]. This results in slower performance, delays, and potential data loss. It is helpful to measure congestion under specific conditions. Modern congestion management protocols, tailored to specific application requirements, provide more effective solutions than traditional methods [12]. Effective congestion control adjusts data rates at the source to reduce or avoid congestion. Artificial Intelligence (AI) algorithms play a role by helping sensor nodes share resources fairly, especially when bandwidth is limited [13]. One major benefit of controlling congestion in IoT is improving Quality of Service (QoS), ensuring data can move successfully from start to end [14].
This paper introduces an eight-step approach to improve congestion control in Wireless Sensor Networks (WSNs). The goal is to detect, notify, and manage congestion effectively while keeping energy usage low and data transmission reliable. It starts with setting up the network, where nodes are spread evenly across a defined area, each with a limited amount of initial energy. Direct communication with the BS is optimized by calculating energy based on distance, reducing power usage. Next, cluster generation is conducted using Generative Adversarial Networks (GANs) [15], where clusters are synthesized and validated through a discriminator until the generated and real clusters are indistinguishable, promoting realistic grouping. CHs are selected using Ant Colony Optimization (ACO) [16] based on energy, distance, and centrality within clusters, improving communication efficiency. Pheromone-based routing is then employed to identify optimal paths, with initial pheromone levels encouraging shorter routes and further updates reinforcing reliable paths. Congestion is detected using a congestion factor (CF), calculated as the ratio of data flow to link capacity, triggering alternate routing if thresholds are surpassed. Key contributions of this paper include:
- Congestion Control Framework: A multi-stage approach for detecting, notifying, and mitigating congestion in WSNs, addressing energy and traffic challenges.
- Energy-Efficient Routing: Utilizes GANs for realistic clustering and ACO for efficient CH selection to balance network load.
- Pheromone-Based Routing: Introduces a pheromone system for selecting low-congestion paths, improving data flow and reliability.
- Integrated QoS Metrics: Uses key QoS metrics (latency, throughput, reliability) to evaluate and enhance network performance under congestion.
2. Related Work
In IoT networks, congestion mainly occurs due to two factors: a high rate of packet sending and the rate at which packets are processed. This issue often happens with sensors near the BS because they manage more data traffic. Congestion increases energy use and reduces the QoS for applications. Many congestion control protocols have been developed to manage heavy traffic in IoT, with different methods for detecting, notifying, and preventing congestion studied in detail.
Ridha [17] developed the Event-to-sink Reliable Transport (ESRT) algorithm, which ensures reliable data transfer from the source to the destination while using resources efficiently. ESRT uses local congestion detection, and it centrally manages resources based on essential access needs. In this approach, nodes can access all network resources through broadcasting. Each sensor node monitors its queue size and sends this information to the destination node to report congestion status. The results show that ESRT provides high reliability and availability, though it has limitations in load balancing and energy efficiency.
Aimtongkham, Musikawan [18] propose a novel fuzzy logic system (FLS)-based method to improve path selection in Routing Protocols for Low-Power and Lossy Networks (RPL) within IoT settings. Their approach improves routing efficiency by implementing three FLS-based components: a fuzzy multicriteria mechanism, a fuzzy congestion awareness mechanism, and a fuzzy load balancing mechanism. These components work together to manage traffic dynamically across multiple destination-oriented directed acyclic graphs (DoDAGs), adapting to varying congestion levels. Specifically, the proposed FLS determines path selection by adapting to the congestion levels—whether within a single DoDAG or across DoDAGs, using a multi-DoDAG node for traffic rerouting in extreme congestion. Simulation results suggest that this method effectively mitigates congestion, reduces packet loss, and optimizes energy use, thereby outperforming traditional RPL techniques. However, while the FLS approach is highly adaptive to congestion, it may increase computational demands on resource-constrained IoT devices, potentially impacting overall network lifespan in environments with persistent congestion.
Bhat, Haxhibeqiri [19] proposed a network- and application-aware adaptive congestion control algorithm (NACC) to address the diverse QoS requirements of applications within private professional networks. This algorithm, designed to operate in wireless environments, integrates in-band network telemetry (INT) and application-network (APP-NET) data to adjust congestion control dynamically based on real-time network context and application priorities. The NACC method processes aggregated flow information from intermediate nodes, enabling decentralized, congestion-free service differentiation. The proposed method outperformed the CUBIC algorithm, achieving threefold throughput in single-flow tests and twice the performance in multi-flow scenarios. However, while NACC enhances adaptability and network efficiency, its reliance on continuous telemetry and application integration may introduce overheads, limiting scalability in larger, more complex network architectures.
Andrade-Zambrano, León [20] propose a congestion control algorithm tailored for smart grid networks by combining reinforcement learning (RL) and deep Q-networks (DQN) to manage User Datagram Protocol (UDP) based data transmission. The DQN model autonomously learns and adapts to congestion patterns in real time, eliminating the need for extensive dataset labeling, which is often a drawback in supervised learning. This self-learning mechanism provides flexibility for intricate smart grid scenarios like urban deployments with high node density. The key advantage of Andrade-Zambrano et al.’s method lies in its improved packet delivery ratio (PDR), network throughput, and latency management under various network loads and urban conditions, optimizing smart grid reliability and efficiency. However, this approach may encounter scalability issues as network size increases, which could challenge real-time responsiveness in massive-scale deployments.
Narawade and Kolekar [21] proposed an Adaptive Cuckoo Search Rate Optimization (ACSRO) scheme for congestion control in WSNs. The ACSRO uses an adaptive cuckoo search algorithm to adjust the sending rate of sensor nodes, aiming to keep the packet arrival rate within the service rate of the parent node, thereby minimizing congestion. This method defines optimal rate adjustments based on metrics such as throughput, delay, packet loss, queue size, and congestion levels. The key advantage of ACSRO is its ability to efficiently control congestion by dynamically adjusting rate settings, which optimizes network performance even under high traffic loads. However, a potential downside is the computational complexity associated with adaptive cuckoo search, which may increase energy consumption in resource-limited WSN environments.
Kalaikumar and Baburaj [22] introduced a fuzzy-enabled cross-layer protocol, Fuzzy Cross-Layer Optimization with Oppositional Artificial Bee Colony (FCOABC), to manage congestion in WSNs. The FCOABC protocol integrates Fuzzy Logic (FL) and Oppositional Artificial Bee Colony (OABC) optimization to achieve energy-efficient and reliable routing. It selects CHs by assessing factors such as Link Superiority Pointer (LSP), node density, and residual energy, aiming to address the “hot spots” issue that affects CHs located closer to the Master Station (MS). The clusters are organized in non-uniform sizes, with smaller clusters near the MS to reduce intra-cluster congestion, while larger clusters farther away relay data effectively. This design enhances network longevity and efficiency by using OABC for multi-hop inter-cluster routing, promoting balanced energy consumption and reliable data transmission. An advantage of this approach is its ability to maintain network stability by reducing energy use and congestion at the CH level, significantly extending network lifespan. However, a potential limitation is the protocol’s complexity, which may increase computational overhead, impacting scalability in large or resource-limited networks due to the iterative FL-based CH selection process and inter-cluster routing.
Antoniou, Pitsillides [23] propose a congestion control protocol for WSNs that utilizes bird flocking behavior to manage network congestion. The Flock-based Congestion Control (Flock-CC) protocol treats packets as birds that flock toward the sink node while avoiding congested regions by mimicking repulsion and attraction forces between packets, as well as an artificial magnetic field guiding packets to the sink. This approach, inspired by swarm intelligence, is simple to implement and requires minimal information exchange, leveraging decentralized control with emergent self-organizing properties. Advantages of Flock-CC include effective load balancing, high resilience to node failures, and scalability across various network sizes, outperforming traditional congestion control methods. However, the protocol’s reliance on packet clustering and field-based guidance may introduce delays in high-traffic scenarios and limit its applicability in environments with rapid topology changes.
Alipio and Bures [24] proposed an adaptive cache-aware congestion control mechanism called Deep Reinforcement Learning Cache-Aware Congestion Control (DRL-CaCC), specifically for WSNs using Deep Reinforcement Learning (DRL). Their method combines the Rapid Start algorithm and the DRL algorithm to dynamically adjust the Congestion Window (CWND), aiming to maximize intermediate cache utilization and reduce network congestion. The DRL-CaCC approach achieved improvements between 20–40% in terms of data throughput and reduced packet loss, outperforming baseline protocols such as Real-Time Cache-Aware Congestion Control (RT-CaCC) and other congestion control mechanisms by effectively handling high levels of packet loss and optimizing cache usage dynamically. However, DRL-CaCC’s reliance on DRL models introduces significant computational complexity, which may limit its feasibility for deployment in real time, resource-constrained WSN environments.
Mazloomi, Gholipour [25] proposed a hybrid methodology termed Fuzzy Structure and Genetic-Fuzzy (FSFG), specifically aimed at managing congestion control in WSNs. The FSFG method combines Fuzzy C-Means (FCM) clustering, Support Vector Regression (SVR), Fuzzy Inference Systems (FIS), and Genetic Algorithm (GA) techniques to address congestion. This methodology operates in two phases: Structure Identification, where fuzzy clustering is used to categorize network nodes based on congestion levels, followed by SVR to ensure minimal error in membership functions, and Parameter Identification, which utilizes GA to fine-tune system parameters. Simulation results indicate that the FSFG algorithm surpasses existing congestion control approaches, such as GASVM and CODA, achieving a 32% improvement in packet delivery rate and a 28% reduction in end-to-end delay compared to baseline methods. However, while effective, the FSFG method’s complexity may pose limitations in highly resource-constrained networks, suggesting the need for further optimization for practical applications.
Comparative Outlook
In IoT networks, managing congestion is crucial due to the high packet transmission rates and limited processing capabilities, especially in nodes near the sink that handle substantial upstream traffic. Congestion leads to increased energy consumption and a decline in QoS, affecting application performance and network longevity. Numerous protocols have been developed to address these challenges, each focusing on different aspects of congestion control, such as detection, notification, and mitigation. While these protocols have advanced congestion management in WSNs, limitations remain in balancing energy efficiency, network scalability, and adaptability under varying traffic loads. Table 1 presents the advantages and disadvantages of the other proposed methods.

Table 1.
Outlines the pros and cons of the proposed methods.
Many existing methods demonstrate effective congestion control but often struggle with computational demands or limited scalability in resource-constrained environments. For instance, the ESRT algorithm emphasizes reliable data transfer yet falls short in load balancing, while the FL and RL-based models introduce adaptability but may increase energy use and delay in high-traffic scenarios. Recent developments using swarm intelligence, adaptive rate control, and deep learning have improved packet delivery and load distribution but often encounter challenges in real-time response or scalability in large-scale IoT networks. These gaps indicate a need for a congestion control method that combines efficient resource use, real-time adaptability, and minimal computational overhead.
This paper addresses these limitations by introducing a hybrid congestion control framework that integrates machine learning and optimization strategies for more effective and scalable traffic management in IoT networks. Our approach leverages GAN-based clustering for energy-efficient routing and an ACO-based path selection method that dynamically adapts to congestion levels. This ensures balanced traffic distribution while minimizing energy consumption and maximizing data reliability. Addressing both scalability and resource constraints, our proposed method aims to improve QoS in IoT networks, filling a critical gap in congestion control for real-world, large-scale applications.
3. Problem Statement
A data center is a place where both software and hardware work together to power computers and communication tools [26]. These tools help run various online services and handle massive amounts of data. With the growth of the Internet, the number of data centers has also increased to keep up with the demand for these services. Some of these centers can support bandwidths greater than 4 GB per second, made possible by multiple fiber-optic connections. Network congestion occurs when too much data fills the network queues, causing packet loss [27]. This happens when the rate of data arriving at an output port is faster than it can be transmitted, leading to an overload. In WSN, congestion often happens when there are too much data being sent. If the data matches the network’s capacity, all packets reach their destinations, but when there are too much data, the network cannot keep up, causing some packets to be lost. In cases of severe traffic, network performance drops sharply, and no packets may reach their destinations. Congestion in WSN is also influenced by factors like multiple input lines sending packets to a single output line at the same time, which creates queues [28]. Without enough memory to store these packets, they are discarded. Additionally, slow processing speeds can worsen network congestion. Figure 1 illustrates data transmission in a network under different congestion scenarios. In (a), packets are successfully sent from the sender to the receiver, with solid arrows representing data transmissions and dashed arrows indicating acknowledgments (Ack). In (b), network congestion causes packet loss, marked by the "X" symbol, meaning the receiver did not receive the packet. The solid arrows show successful transmissions, while dashed arrows represent acknowledgments. The label Loss indicates that a packet was dropped due to congestion, likely because the queue was full. This results in retransmissions, increased delays, and reduced network efficiency.
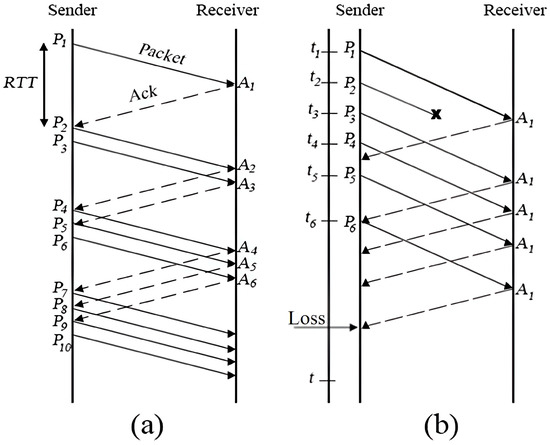
Figure 1.
Congestion control (a) without loss and (b) with loss.
3.1. Strategies for Congestion Control in Wireless Sensor Networks
In WSNs, congestion control is essential to ensure efficient data transmission, preserve energy resources, and maintain QoS standards, including low latency, high throughput, and reliable packet delivery. Congestion in WSNs arises when data transmission demand exceeds the capacity of network nodes or links, leading to delays, packet loss, and increased energy consumption [29]. To address these challenges, congestion control strategies generally encompass three main stages: congestion detection, congestion notification, and congestion mitigation. Each stage has specific metrics and techniques to prevent bottlenecks, optimize network resource utilization, and ensure consistent network performance [30]. The first step, congestion detection, is crucial for identifying where congestion is occurring within the network. In WSNs, congestion can be detected by monitoring real-time metrics such as buffer occupancy, data transmission rate, and link utilization. Buffer occupancy is often used as an indicator, as high buffer levels signal potential congestion due to accumulated packets waiting to be processed or transmitted. Data transmission rate provides insight into traffic intensity; a sustained high transmission rate can signify network congestion [31]. Another valuable metric is the CF, defined as the ratio of data flow to link capacity on each link (i, j) expressed mathematically as:
A CF approaching or exceeding a threshold value signals a high load on the link, prompting the network to initiate congestion control measures [32]. These metrics allow nodes to detect and localize congestion, enabling timely responses before network performance is significantly impacted. Once congestion is detected, the network must communicate this information to surrounding nodes or to the network’s central management system, initiating the second stage: congestion notification. Congestion notification can be implemented through explicit, implicit, or piggybacking techniques. In explicit notification, the congested node sends a control message to neighboring nodes or the BS, directly signaling congestion and prompting rerouting of traffic away from congested areas [33]. Implicit notification, in contrast, relies on indicators such as packet delays or packet loss rates, allowing nodes to infer congestion without additional control packets, which reduces overhead. Piggybacking information embeds congestion data within regular data packets, offering another way to minimize additional control messaging while conveying essential congestion status information [8].
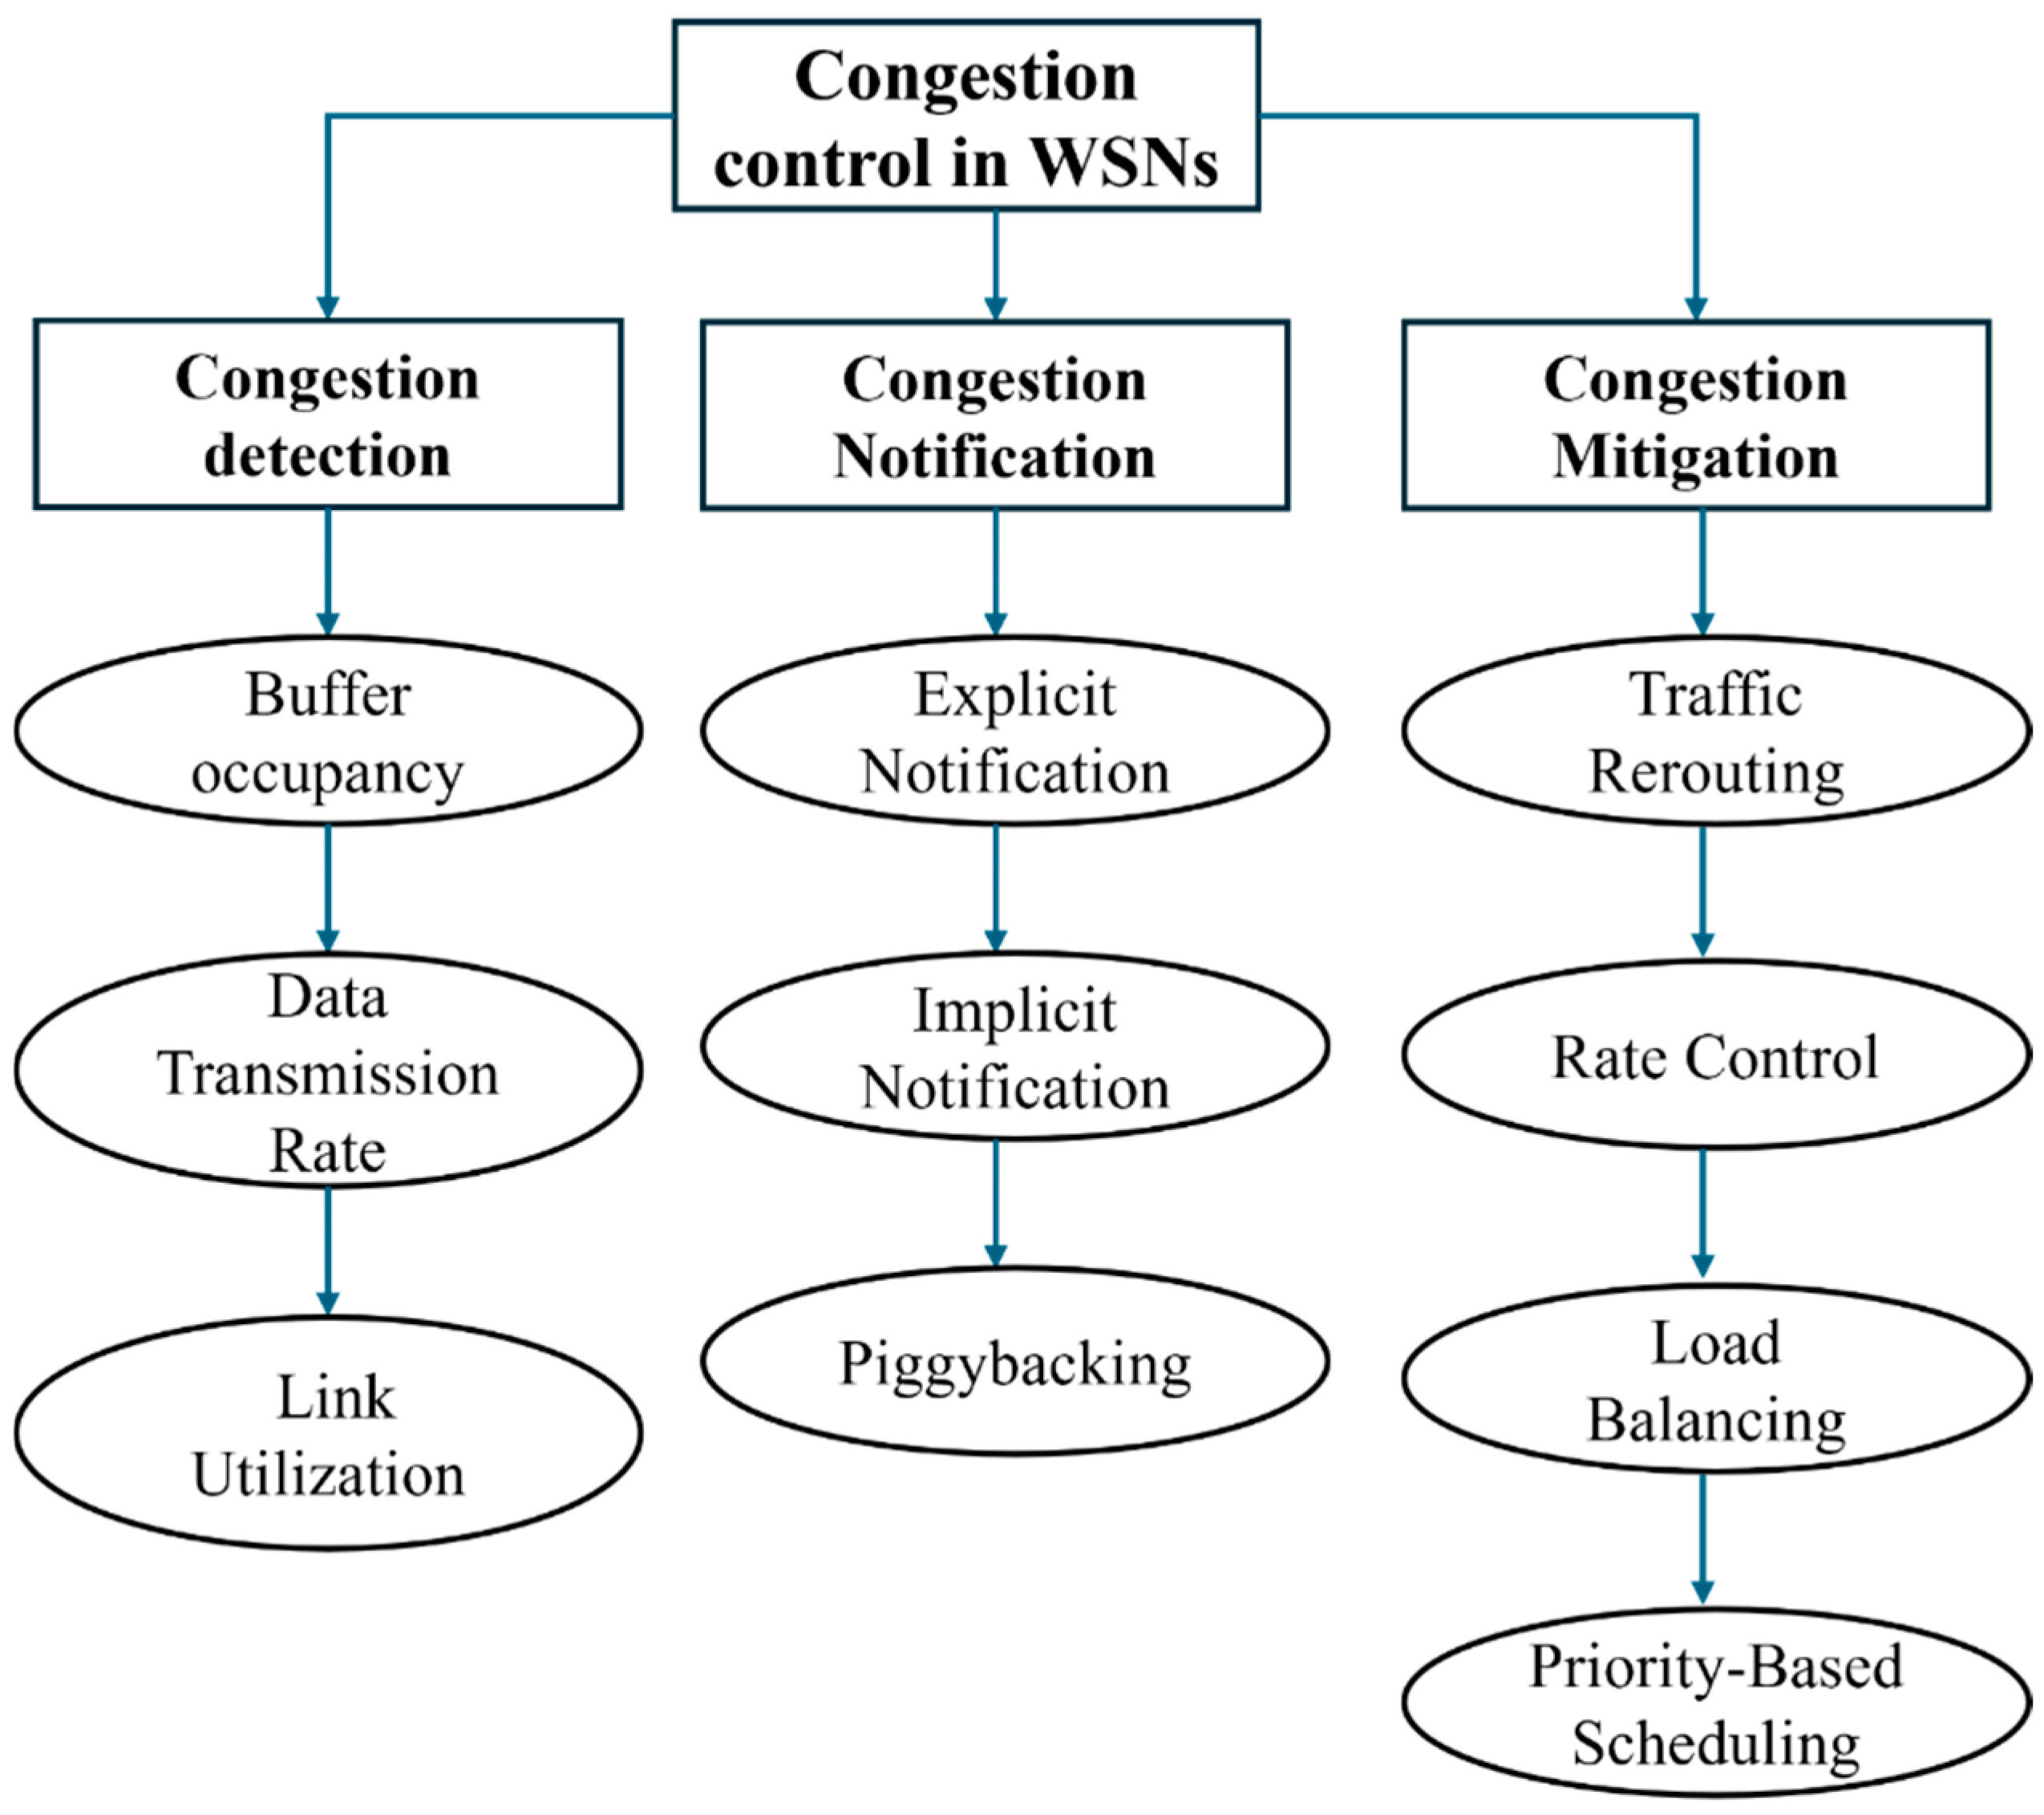
Congestion mitigation is the last step, where the network automatically changes its routes and data-sending methods to reduce congestion [34]. Key mitigation strategies include traffic rerouting, rate control, load balancing, and priority-based packet scheduling. Traffic rerouting involves adaptive path selection, diverting traffic to less congested routes to prevent data buildup. This is often achieved using a probabilistic route selection formula, which incorporates factors such as pheromone levels, link bandwidth, and signal quality to determine optimal paths for data transmission [35]. Rate control algorithms, meanwhile, adjust nodes’ data generation or transmission rates, aligning traffic flow with network capacity. Load balancing further distributes traffic across multiple paths, minimizing the risk of bottlenecks and enhancing the network’s resilience to fluctuating demands [36]. In cases where congestion cannot be avoided, priority-based scheduling ensures that critical data packets are transmitted first, maintaining QoS for essential services. Effective congestion control improves QoS by reducing latency, packet loss, and energy expenditure and extends the network’s operational life. Early detection, efficient notification, and adaptive mitigation work in synergy to sustain network stability and prevent the cascading effects of traffic overload [37]. Congestion control strategies help WSNs run smoothly by managing data flow, choosing the best routes, and focusing on important data. This keeps the network stable, even when traffic changes. These strategies are essential for deploying WSNs in real-world applications where network reliability, scalability, and energy efficiency are paramount, making congestion control a fundamental aspect of modern WSN design and management. Figure 2 shows how congestion control operates as a multi-stage process, with each stage focusing on specific techniques to detect, communicate, and mitigate congestion. This structured approach supports efficient network performance, helping WSNs handle dynamic traffic loads and maintain consistent QoS.
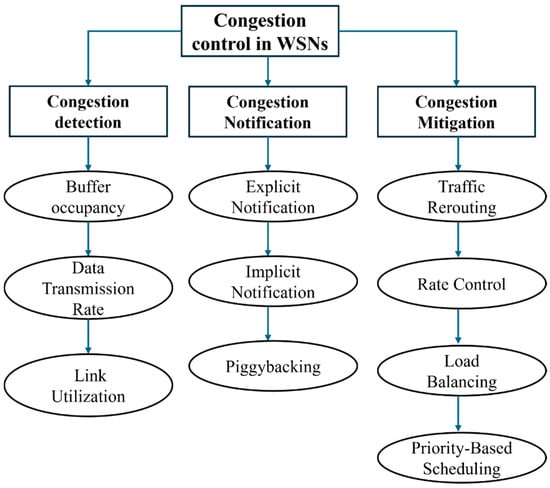
Figure 2.
Hierarchical Structure of Congestion Control Strategies in WSNs.
3.2. Energy Consumption Model
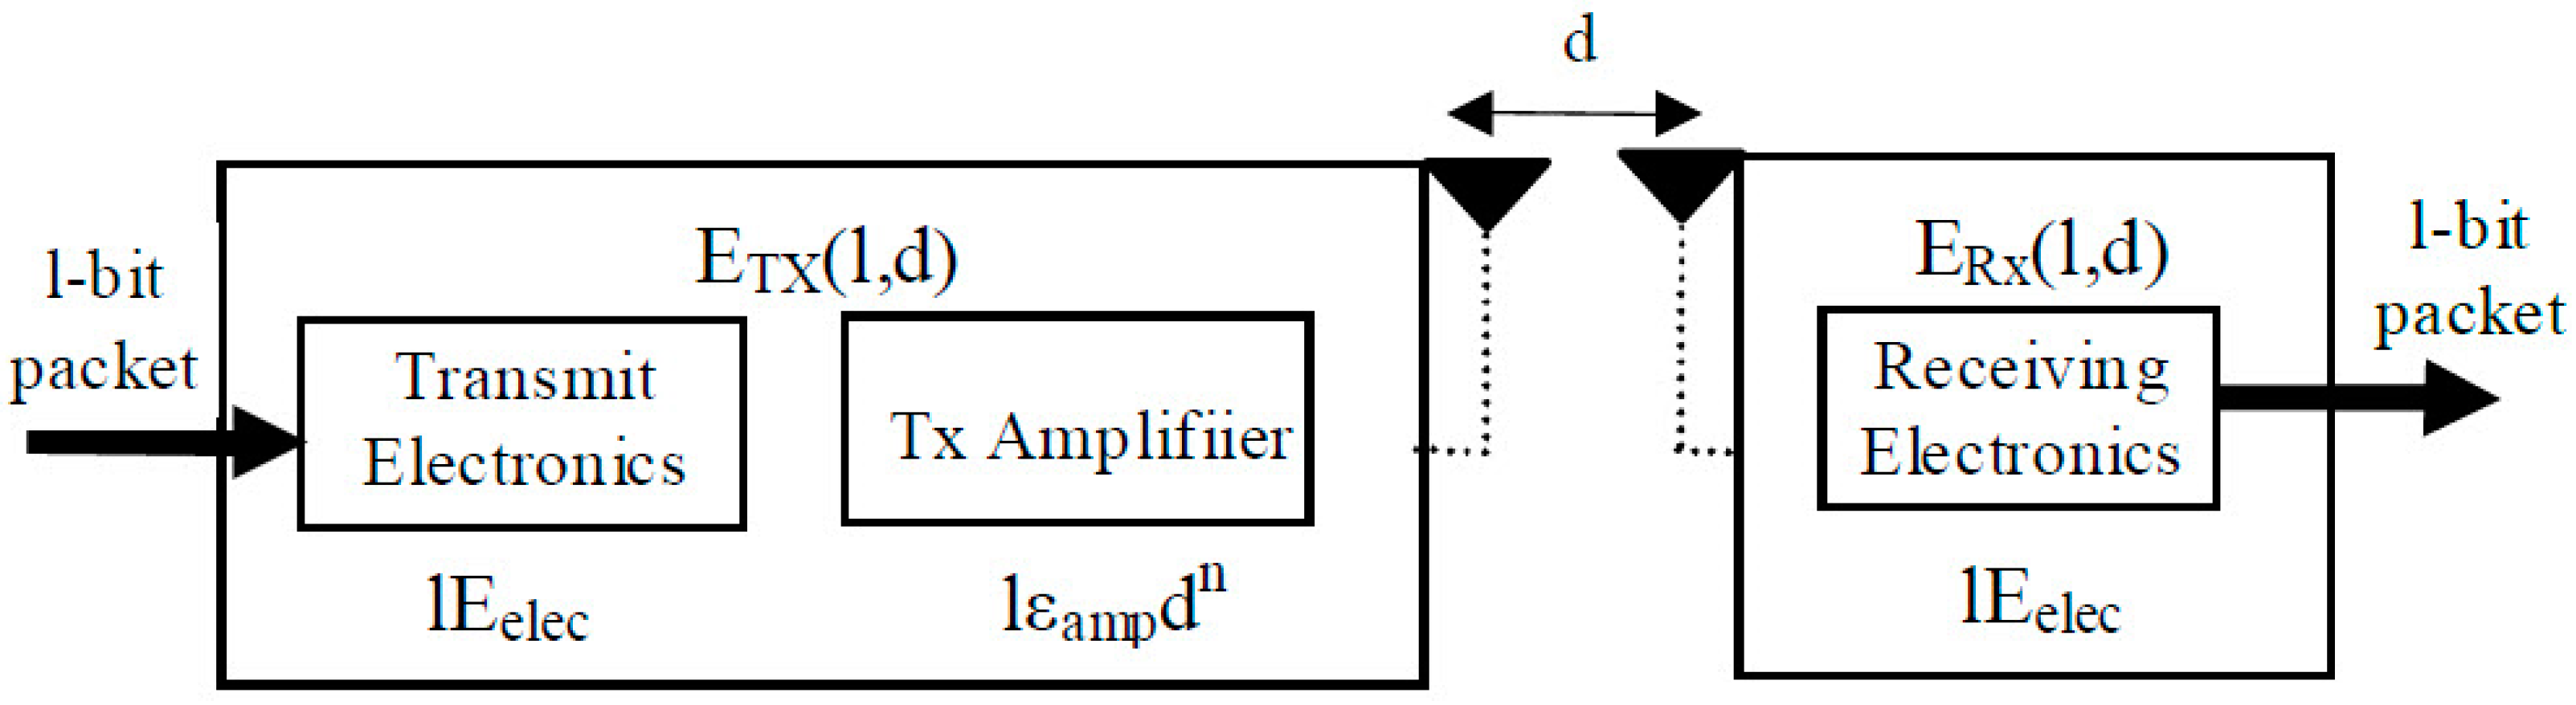
In this study, we use the energy consumption model for network radio parts as outlined in previous work. This model describes how energy is used in the electronic parts of both sending and receiving units. It calculates the energy needed to send or receive a single bit in a data packet, measured in nanojoules per bit [38]. Additionally, it explains the energy used in a WSN for sending one bit from one node to another as , represented in picojoules per bit per meter. Figure 3 visually represents the energy consumption model for wireless communication in a network. The arrows indicate the direction of data flow, showing how a 1-bit packet is transmitted from the sender to the receiver. The triangles represent the antennas used for wireless communication, where the left triangle symbolizes the transmitting antenna, and the right triangle represents the receiving antenna.
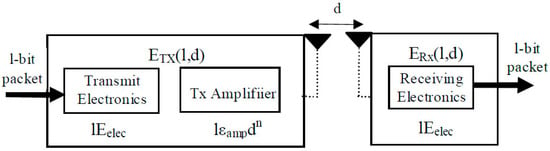
Figure 3.
Model used for energy consumption in radio performance.
The power consumption in our model follows the approach used in the LEACH method. This model estimates the energy used by a transmitting node to send a data packet, considering the packet size ‘k’ bits and the distance ‘d’ between the sender and receiver.
Here, stands for the power used by the electronic circuit, while represents the power needed to amplify signals for sending and receiving a data bit. Additionally, the power used by the receiving node to process a data packet of size ‘k’ bits is calculated using a particular equation.
It is essential to understand that the power used by nodes positioned between the data-sending node and the receiving node equals the total energy needed for both sending and receiving data.
It is important to recognize that the power consumption of any nodes in the network, encompassing both data transmitting and receiving nodes, can be calculated using the formula.
3.3. QoS Factors
Latency: End-to-end latency L for a packet transmitted from a source node S to the BS can be calculated as the sum of transmission delays on each link (i, j) in the path and queuing delays :
where is the time for each transmission, and depends on traffic load and buffer capacity.
Packet Delivery Ratio (PDR): PDR reflects the ratio of successfully received packets at the BS to the total sent packets by the source nodes:
This metric is vital for assessing the reliability of data transmission across the network.
Throughput: Throughput T represents the amount of data successfully delivered to the BS per unit of time, where is the bandwidth capacity of each link (i, j) and is the probability of successful delivery:
Higher throughput indicates an effective and efficient data transmission process.
Link Reliability: Reliability (R) measures the probability of successful packet transmission without loss, where is the probability of packet loss on link (i, j):
This metric captures the robustness of the selected path by considering link quality and overall network reliability.
The CF assesses the load on each link, calculated as the ratio of data flow to link capacity :
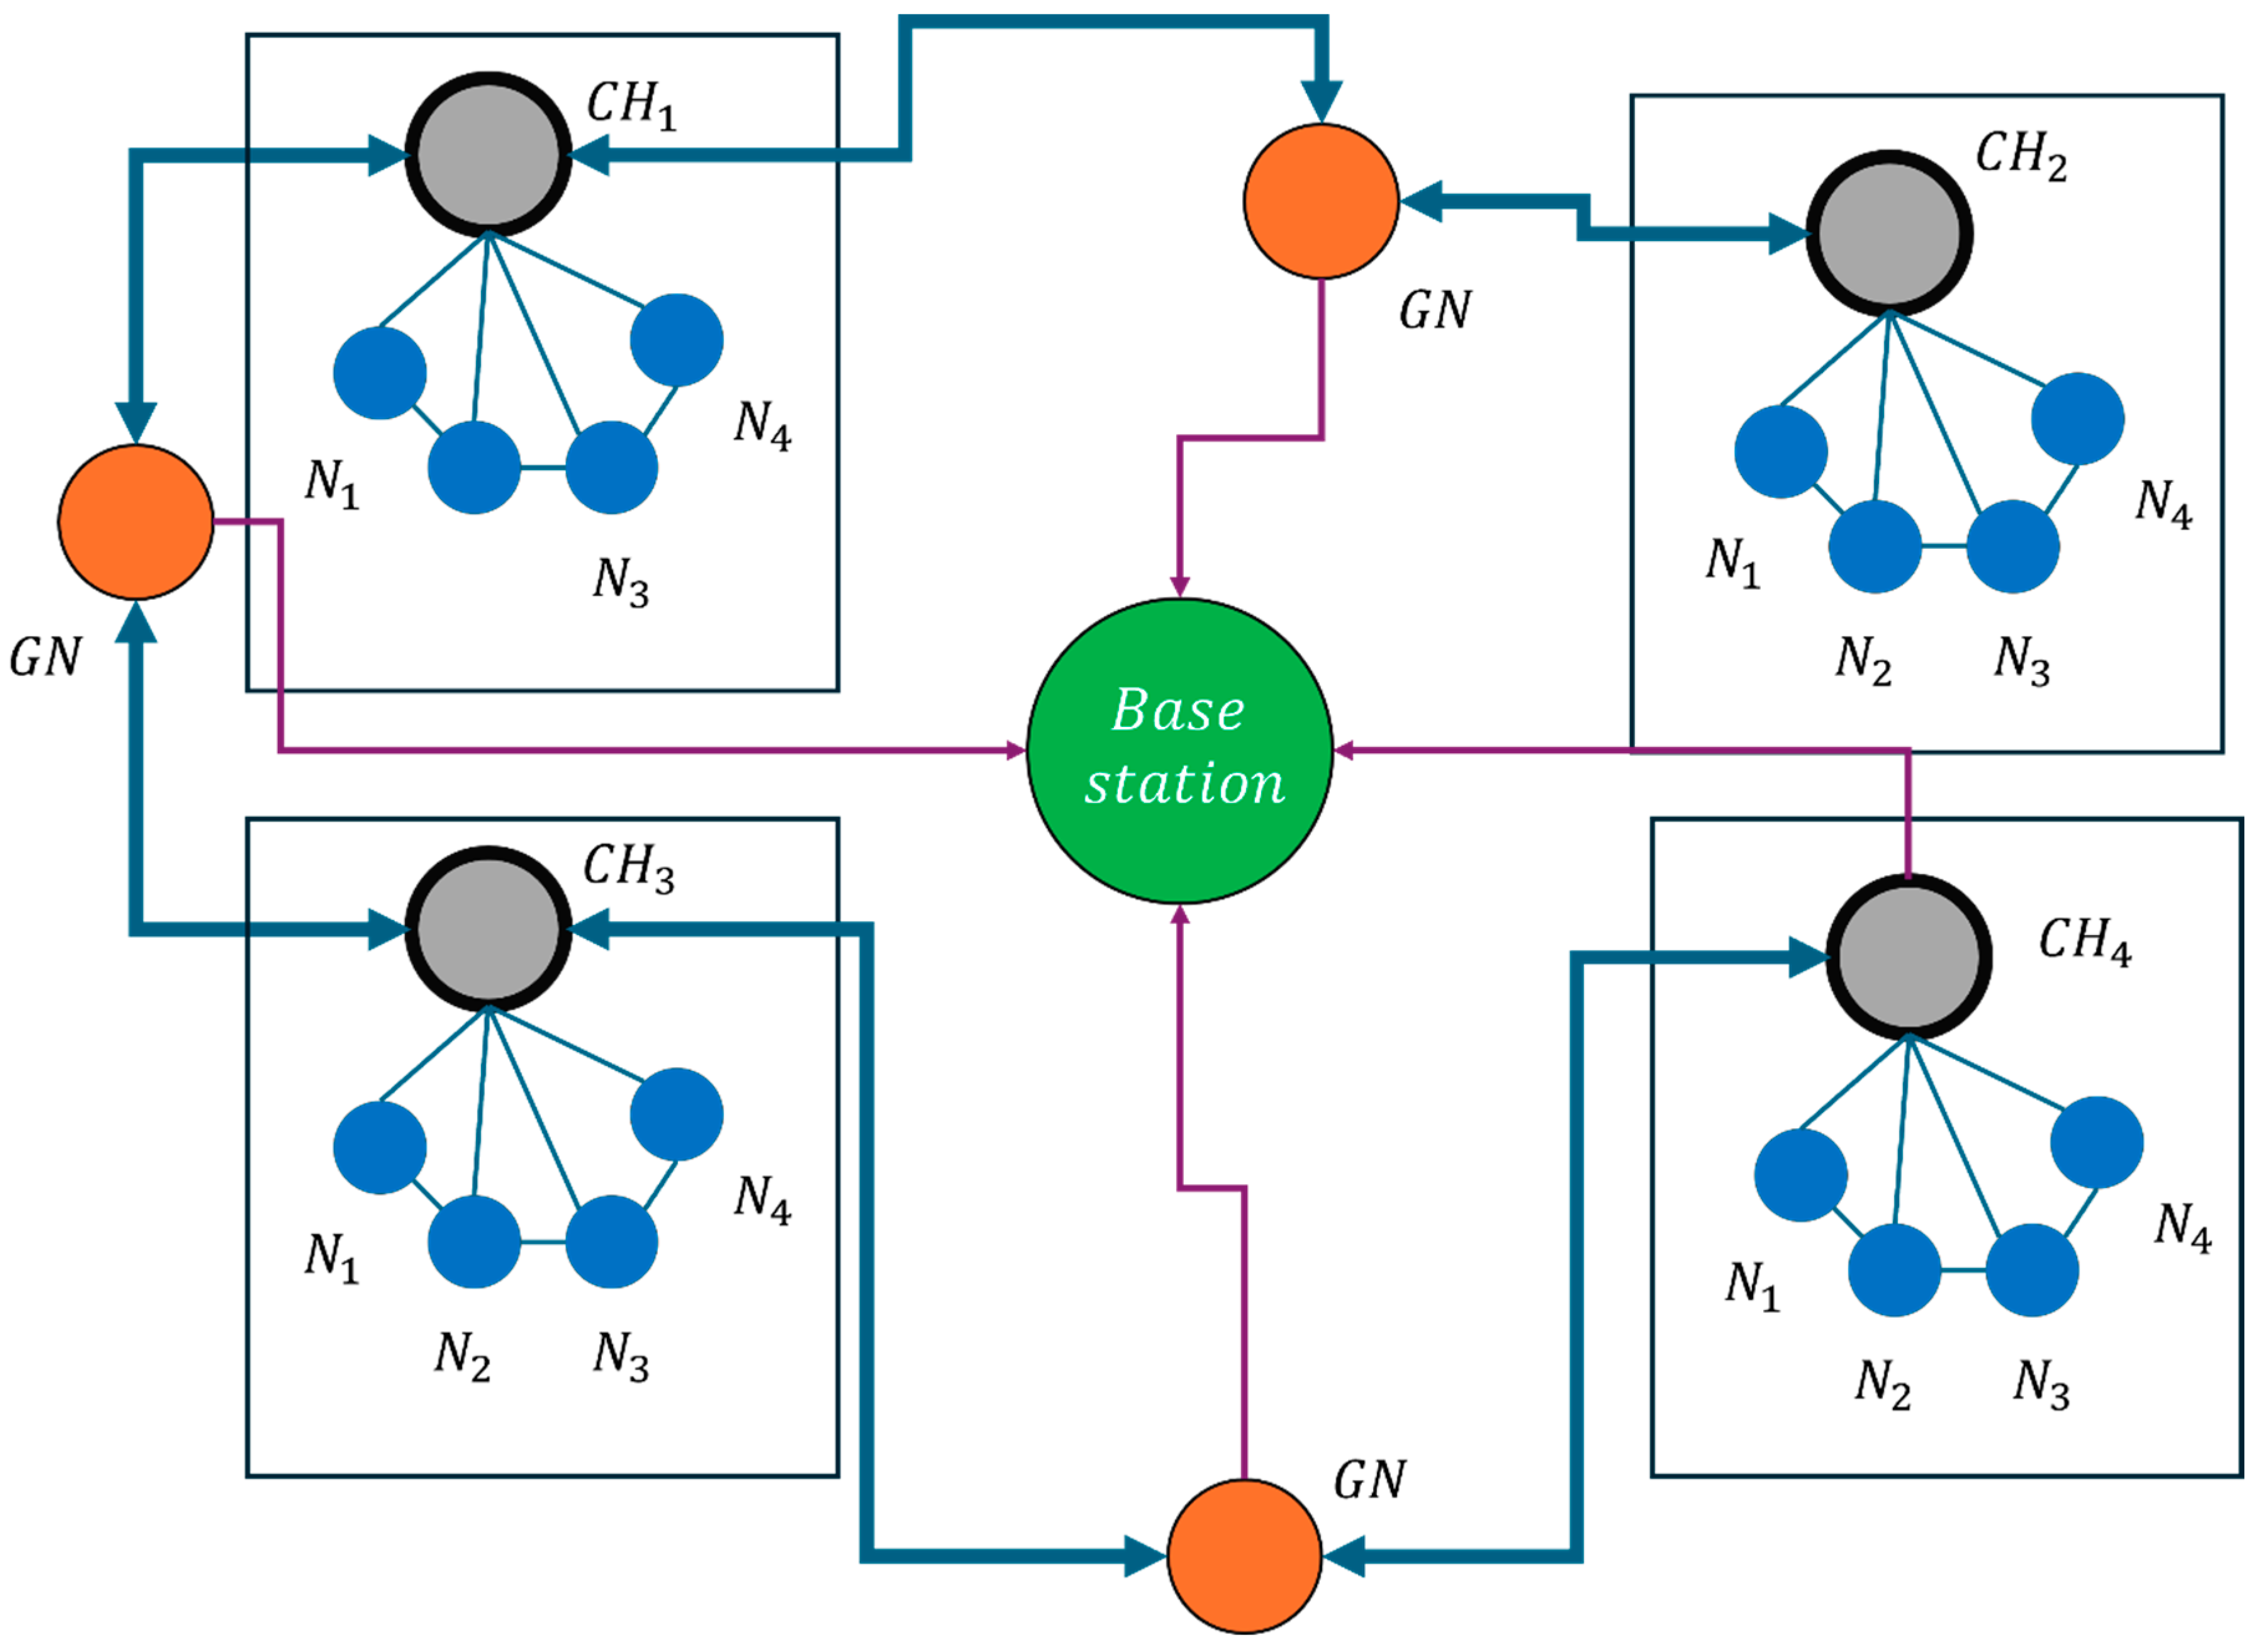
Lower CF implies that traffic is balanced, and congestion is minimized, essential for maintaining smooth data flow across the network. Figure 4 illustrates the application architecture for congestion control in WSNs, emphasizing congestion detection, notification, and management while optimizing energy consumption and ensuring reliable data transmission. The different colored arrows in the figure represent various data flows within the network. The blue arrows indicate the transmission of sensor data from individual sensor nodes to cluster heads, which aggregate and forward the data. The purple arrows represent congestion notifications and control messages sent from cluster heads to the base station, ensuring efficient congestion management.

Figure 4.
Application architecture of proposed method.
3.4. Proposed Method
Step 1: Network Initialization:
Node Deployment: We deploy N nodes uniformly across an M × M area. Each node i is initialized with non-replenishable initial energy , where residual energy at time t is calculated as:
where represents the power consumed in each discrete time interval j up to t. This energy consumption model ensures that node i operates within its energy constraints, making energy optimization crucial for network longevity.
Direct Communication with BS:
The power required by each node i to transmit data to the BS is calculated based on the distance as follows:
where is the reference power at distance , and γ is the path-loss exponent (typically between 2 and 4). Nodes with minimal consume less energy per transmission, enhancing the overall efficiency.
Step 2: GAN-based Cluster formation:
Cluster Generation with GANs: Clusters are generated using a GAN, with the generator.
G (z; producing synthetic cluster centroids from random noise z, and the discriminator D (x; distinguishing real data from generated clusters. The GAN objective function is:
where represents the real data distribution and the noise distribution. Convergence is reached when the discriminator can no longer distinguish real from generated clusters, ensuring realistic clustering of nodes.
CH Selection Using ACO: For each cluster, a CH is selected by evaluating three factors: residual energy , distance to the BS , and central position within the cluster. The selection criterion for each candidate node i is:
where is the maximum energy in the cluster, is the maximum distance to the BS, is the cluster centroid, is the average node distance to the centroid, and α, β, γ are weight factors. The node with the highest is chosen as the CH.
Step 3: Initial Pheromone Setting for Paths:
Neighbor Discovery and Pheromone Initialization: Nodes broadcast “Hello” messages to identify their neighbors and initialize pheromone levels on each link (i, j). The initial pheromone value is set as:
where is the Euclidean distance between nodes i and j, and is a small constant to avoid division by zero. This initialization favors shorter distances, encouraging efficient path selection.
Step 4: Route Selection Probability Calculation:
The probability of choosing a path from node i to j for destination d is:
In this context, the symbols , ß, k, Ŷ, and τ represent weight regulators associated with various network parameters. These regulators are linked to specific aspects of network performance and resource utilization:
is related to energy, indicating its influence or weight in the overall calculation or decision-making process.
represents the bandwidth factor, reflecting its importance or contribution in the network’s functioning.
is associated with latency, demonstrating how latency affects the network’s performance or decisions.
corresponds to the number of steps, which is considered as a heuristic function in the model. This reflects the role of the number of steps taken in the network’s operation or algorithmic process.
denotes the weight given to pheromones, a concept often used in optimization algorithms like ACO algorithm, indicating their significance in the network’s routing or decision-making process.
Dijd indicates the bandwidth, providing a measure or value related to the bandwidth available or used between two points in the network.
EIJD stands for the energy parameter, signifying the energy consumption or requirement for network operations between specific points.
Step 5: Pheromone Updates for Optimal Path Selection:
Pheromone Update Formula:
For efficient routing, pheromone levels are updated:
where ρ is the pheromone evaporation rate and = with Q representing a pheromone reinforcement constant and the path length. This update strengthens the likelihood of choosing reliable paths, balancing the network load.
Step 6: Congestion Detection and Management:
Congestion Detection:
Measure congestion on each link (i, j):
If exceeds a threshold, the link is marked as congested, and alternative routes are considered.
Minimizing Congestion:
An objective function Z minimizes congestion across the network:
= 1 if the link is used, 0 otherwise.
Step 7: Route Performance Evaluation
Traffic Handling Efficiency:
The route’s efficiency in managing data traffic is evaluated using a congestion parameter , as follows:
A route is considered efficient if is within acceptable limits, meaning it can handle the data flow without excessive delays.
Reliability of Data Delivery:
To ensure reliable delivery, we evaluate the probability of successful delivery from a source node S to the CH. This is typically based on factors like residual energy and link quality:
where is the probability of packet loss on link (i, j) along the path. A higher value indicates a more reliable route.
Step 8: Identifying Optimal Path and Traffic Distribution
Objective Function for Minimizing Congestion:
The goal is to identify a route with minimal congestion while distributing traffic across the network. This is achieved by minimizing the congestion-based objective function Z:
represents the CF on link (i, j) and if = 1 the link (i, j) is used in the selected path, and otherwise.
Traffic Selection (TS) Algorithm for Load Balancing:
The TS algorithm identifies the path that minimizes Z and checks each link’s traffic load. If the load on a link exceeds 70% of its capacity, it is marked as congested and added to a congestion list (Algorithm 1).
For each link (i, j), the algorithm evaluates:
| Algorithm 1: WSN Cluster-Based Routing with ACO algorithm |
|
1. for each node i in range (1, N): 2. deploy node i randomly within M×M area 3. set initial energy = 4. for each time t: 5. = - sum([i][j] for j in range (1, t)) 6. calculate distance for node i to BS 7. if < : 8. = * () ^ γ 9. end if 10. end for 11. while GAN has not converged: 12. generate synthetic clusters using G (z, θ_g) 13. classify clusters with D (x, ) to distinguish real from synthetic data 14. adjust G and D using min-max objective until discriminator cannot distinguish real from generated clusters 15. end while 16. for each cluster k: 17. for each node i in cluster k: 18. calculate = α * ()−β * ()−γ * (distance (i, )/) 19. end for 20. choose node with max as CH 21. end for 22. for each node i: 23. broadcast “Hello” message to discover neighbors 24. for each neighbor j of i: 25. = calculate Euclidean distance between node i and node j 26. //Initial pheromone setting 27. end for 28. end for 29. for each node i: 30. for each destination d and neighbor j: 31. calculate = /sum of weights over all neighbors 32. end for 33. end for 34. for each transmission on link (i, j): 35. if transmission is successful: 36. = Q/ 37. else: 38. = 0 39. end if 40. = (1−ρ) * + //Pheromone evaporation and reinforcement 41. end for 42. for each link (i, j): 43. calculate = [i][j]/[i][j] 44. if > : 45. mark link (i, j) as congested 46. consider alternative routes for load balancing 47. end if 48. end for 49. for each path from source node S to CH: 50. calculate = [i][j]/[i][j] 51. if < : 52. mark path as efficient 53. end if 54. = 1 55. for each link (i, j) in path: 56. * = (1− [i][j]) 57. end for 58. end for 59. define Z = sum ( * for each link (i, j)) 60. for each link (i, j): 61. if [i][j]/[i][j] > 0.7: 62. mark link (i, j) as congested 63. add (i, j) to congestion list 64. end if 65. end for 66. return the optimal route minimizing congestion and ensuring reliable data delivery |
4. Simulation and Results
To test the performance of the proposed congestion control strategy in WSNs, a synthetic dataset was created to represent typical WSN communication patterns. The dataset included 10,000 packets generated over a simulation duration of 1000 s, simulating traffic loads that ranged from low to high levels to test adaptability under varying network conditions. Each packet had an average size of 512 bytes. The network was deployed in a 500 m × 500 m area, with N = 100 sensor nodes and 1 BS located centrally within the grid. Each node was initialized with a fixed initial energy of E = 2 Joules to model the limited energy resources characteristic of WSNs. Nodes communicated directly or in multi-hop paths to the BS, with each node’s transmission range set to 100 m. This configuration allowed for both short-range and long-range communication, testing the effectiveness of the congestion control strategy in maintaining energy efficiency and reducing delays. For the ACO algorithm, various parameters were tuned to ensure effective path optimization and congestion management. The pheromone evaporation rate (ρ) was set to 0.1 to prevent excessive pheromone buildup on suboptimal paths. The pheromone deposit factor (Q) was set to 0.5 to enhance the pheromone trail on reliable routes. Weight parameters were defined as α = 1.5, β = 1.2, γ = 0.8, s = 1.0, and k = 1.0 to prioritize energy, bandwidth, latency, and pheromone influence in the route selection process. For GAN, the generator and discriminator each contained two hidden layers with 128 and 64 neurons per layer. The GAN was trained using a learning rate of 0.001 and a batch size of 64, with Gaussian noise as input to the generator. The GAN’s objective was to produce realistic cluster formations, assisting in node clustering and load balancing by distinguishing real clusters from synthetic ones. This configuration ensured efficient clustering to reduce intra-network traffic and minimize congestion. Table 2, Table 3 and Table 4 shows the configuration parameters of simulation in Network Simulator 3 (NS3) [39].
Table 2.
Dataset configuration parameters.
Table 3.
ACO algorithm configuration parameters.
Table 4.
GAN algorithm configuration parameters.
To further assess the impact of the proposed congestion control strategy on network performance, two additional metrics CF Across Different Links (ADL) and Network Lifetime Under Different Load Conditions (NLUDLC) were analyzed and presented in table format. These metrics offer valuable insights into network traffic distribution and energy efficiency, which are critical for ensuring reliable and long-lasting WSNs.
ADL is the load on individual network links, calculated as the ratio of data flow to link capacity. Examining CF values across different links under various traffic loads (low, moderate, and high) reveals which links are most prone to congestion and assesses how well the congestion control strategy distributes network load. High CF values signify links that are close to or exceeding their capacity, indicating potential congestion points that may require rerouting or load balancing. Monitoring CF values across different links is essential for understanding traffic patterns and ensuring that the network can manage peak traffic loads without significant performance degradation. Table 5 provides a detailed overview of CF values for 20 links under different traffic conditions.
Table 5.
CF Across Different Links.
NLUDLC is another critical metric for WSNs, reflecting how long the network can operate before nodes deplete their energy. This metric is particularly important in energy-constrained environments, where extending the network lifetime is a primary goal. Analyzing network lifetime across different traffic loads helps evaluate how well the congestion control strategy conserves energy and extends network operation. A higher network lifetime at elevated traffic loads indicates that the strategy manages energy consumption efficiently, even under heavy demands. Table 6 illustrates network lifetime and the percentage of operational nodes after 1000 s for low, moderate, and high traffic loads, offering a comprehensive view of network sustainability over time.
Table 6.
Network Lifetime Under Different Load Conditions.
In this paper, we combined GANs with an ACO algorithm to develop an advanced congestion control strategy for WSNs. The GAN component is utilized to create realistic clusters by learning the spatial distribution and energy levels of nodes, which helps in forming stable and energy-efficient clusters that reduce overall network traffic. The ACO algorithm is then applied for adaptive routing, where pheromone-based probabilistic selection is used to dynamically adjust paths based on network conditions, such as energy levels, link quality, and CF. To validate our method, we conducted a comparative analysis with three established protocols: FSFG [22], DRL-CaCC [21], and ACSRO [18]. These protocols were chosen for their focus on energy efficiency, congestion management, and longevity in WSNs, respectively.
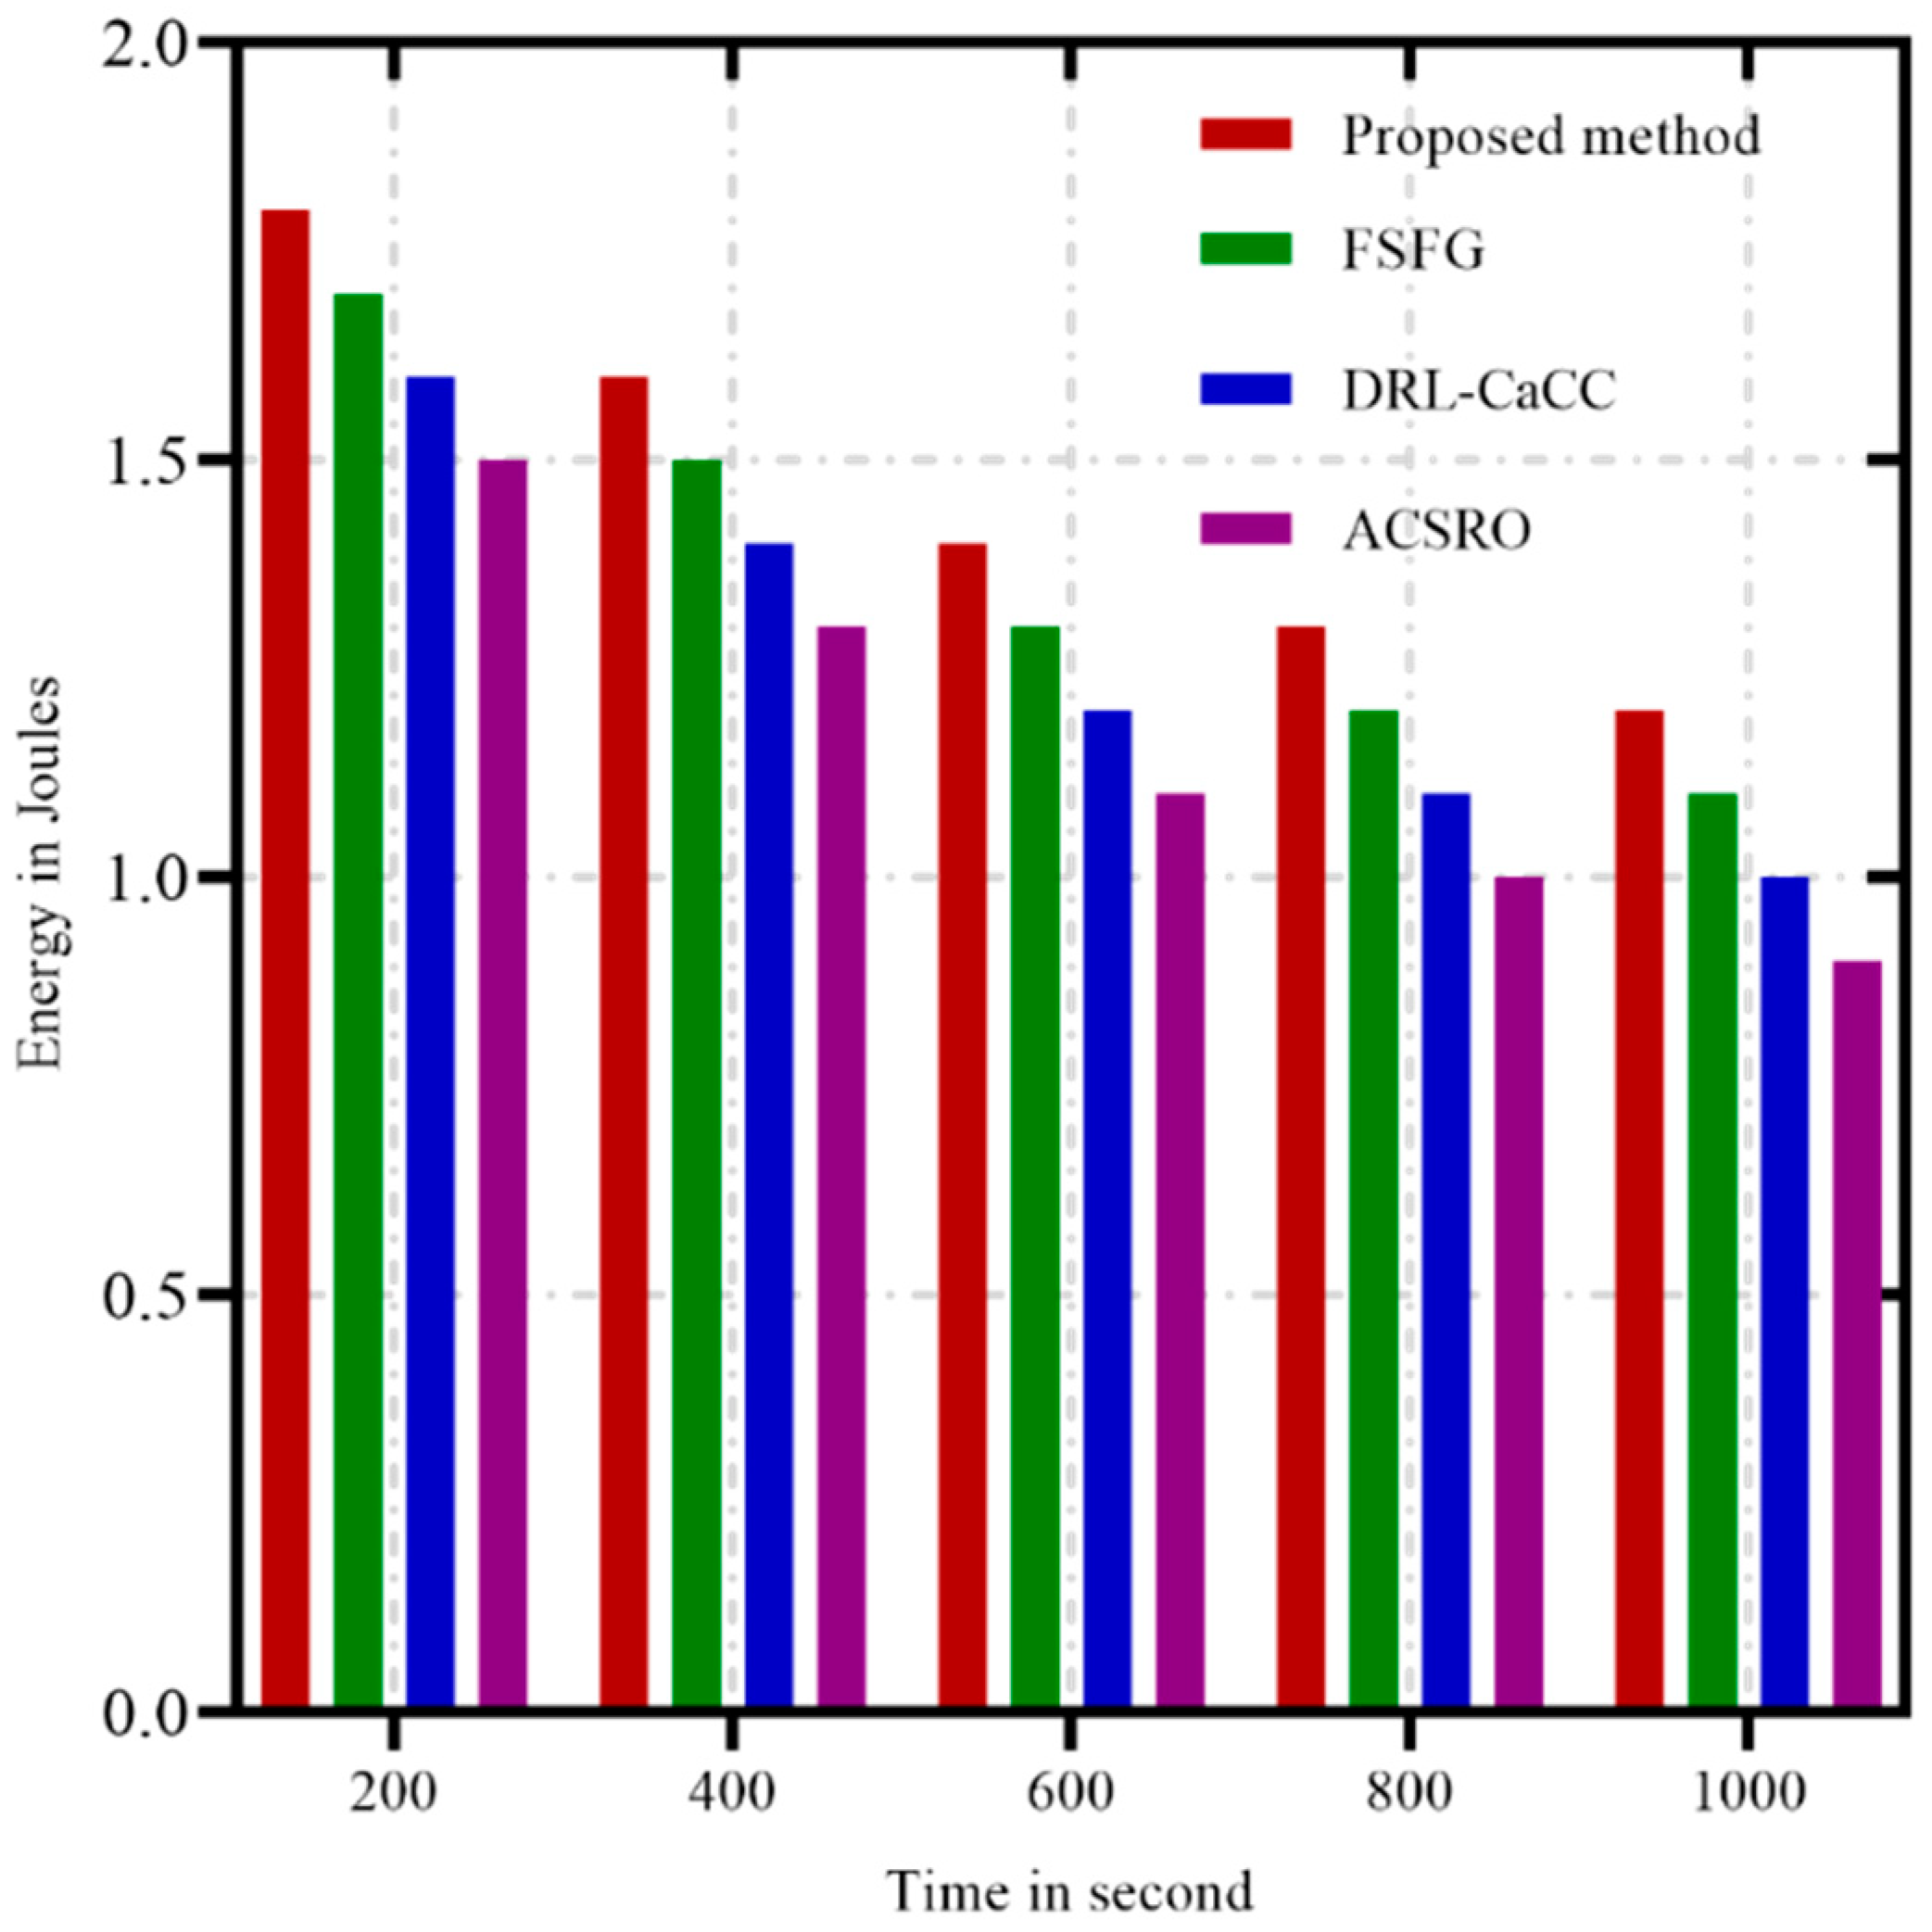
Energy consumption is a pivotal concern in WSNs, as the sensors typically depend on limited power sources, such as batteries, which are difficult to replace or recharge, especially in remote or hazardous environments. Efficient energy management is essential for extending the network’s lifespan, enabling consistent and reliable data collection and transmission over time. In addition, minimizing energy consumption helps maintain stable network performance and reliability, as depleted nodes can lead to data loss, reduced coverage, and compromised communication paths. Figure 5 illustrates a comparative analysis of energy consumption over time for four congestion control algorithms in WSNs: ACSRO (in purple), FSFG (in green), DRL-CaCC (in blue), and the proposed method, GAN-ACO (in red). Here, the y-axis represents the remaining energy (in Joules) of the network nodes, while the x-axis displays time in seconds, covering a range from 200 to 1000 s. This metric provides insights into each algorithm’s effectiveness in preserving energy over extended network operations. The results reveal that the proposed method, GAN-ACO, consistently achieves lower energy consumption than the other algorithms as the simulation progresses. While ACSRO and FSFG maintain higher energy levels in the early stages, they show steeper declines over time, indicating accelerated energy depletion under sustained network conditions. DRL-CaCC demonstrates moderate energy usage, with a steady decline that resembles FSFG but at a slightly faster rate. The proposed method’s superior energy efficiency can be attributed to optimized load distribution and adaptive routing facilitated by the GAN and ACO algorithms, which minimize redundant data transmissions and avoid energy-intensive routing decisions.
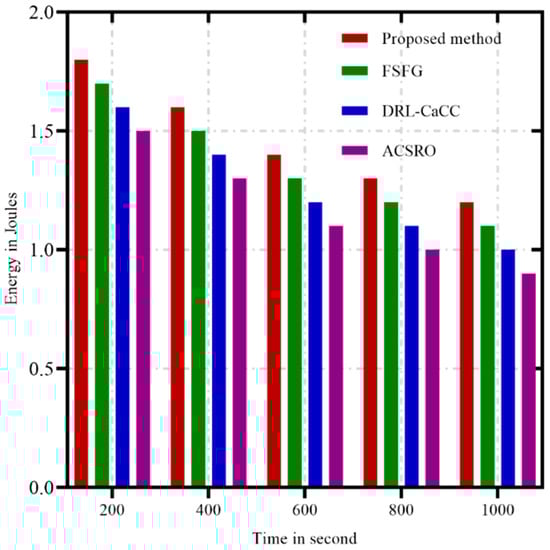
Figure 5.
Energy consumption over time.
Figure 6 demonstrates that the proposed method achieves the lowest latency across a wide range of network loads, maintaining consistently low delay times even as packet load reaches 10,000. This performance can be attributed to the method’s GAN-ACO framework, where the GANs facilitate balanced clustering, while the ACO component ensures adaptive path selection based on real-time pheromone levels. Together, these elements enable dynamic rerouting and efficient load balancing, effectively reducing network congestion and the associated delays. The FSFG algorithm also shows relatively low latency but begins to fall behind the proposed method as network load intensifies, likely due to its limited adaptability under high-traffic conditions. This limitation may stem from a less responsive mechanism for adjusting to real-time network demands compared to the more flexible, adaptive approach provided by GAN-ACO. In contrast, the DRL-CaCC and ACSRO algorithms exhibit higher latency levels, which increase sharply with network load. This pattern suggests that these methods may face challenges in optimizing data flow when traffic is heavy, possibly due to slower congestion response or a lack of robust load distribution techniques needed for low-latency operation.
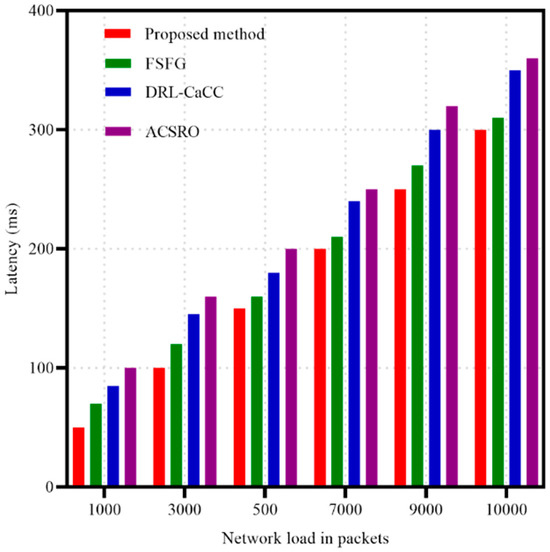
Figure 6.
Latency metrics in different packets.
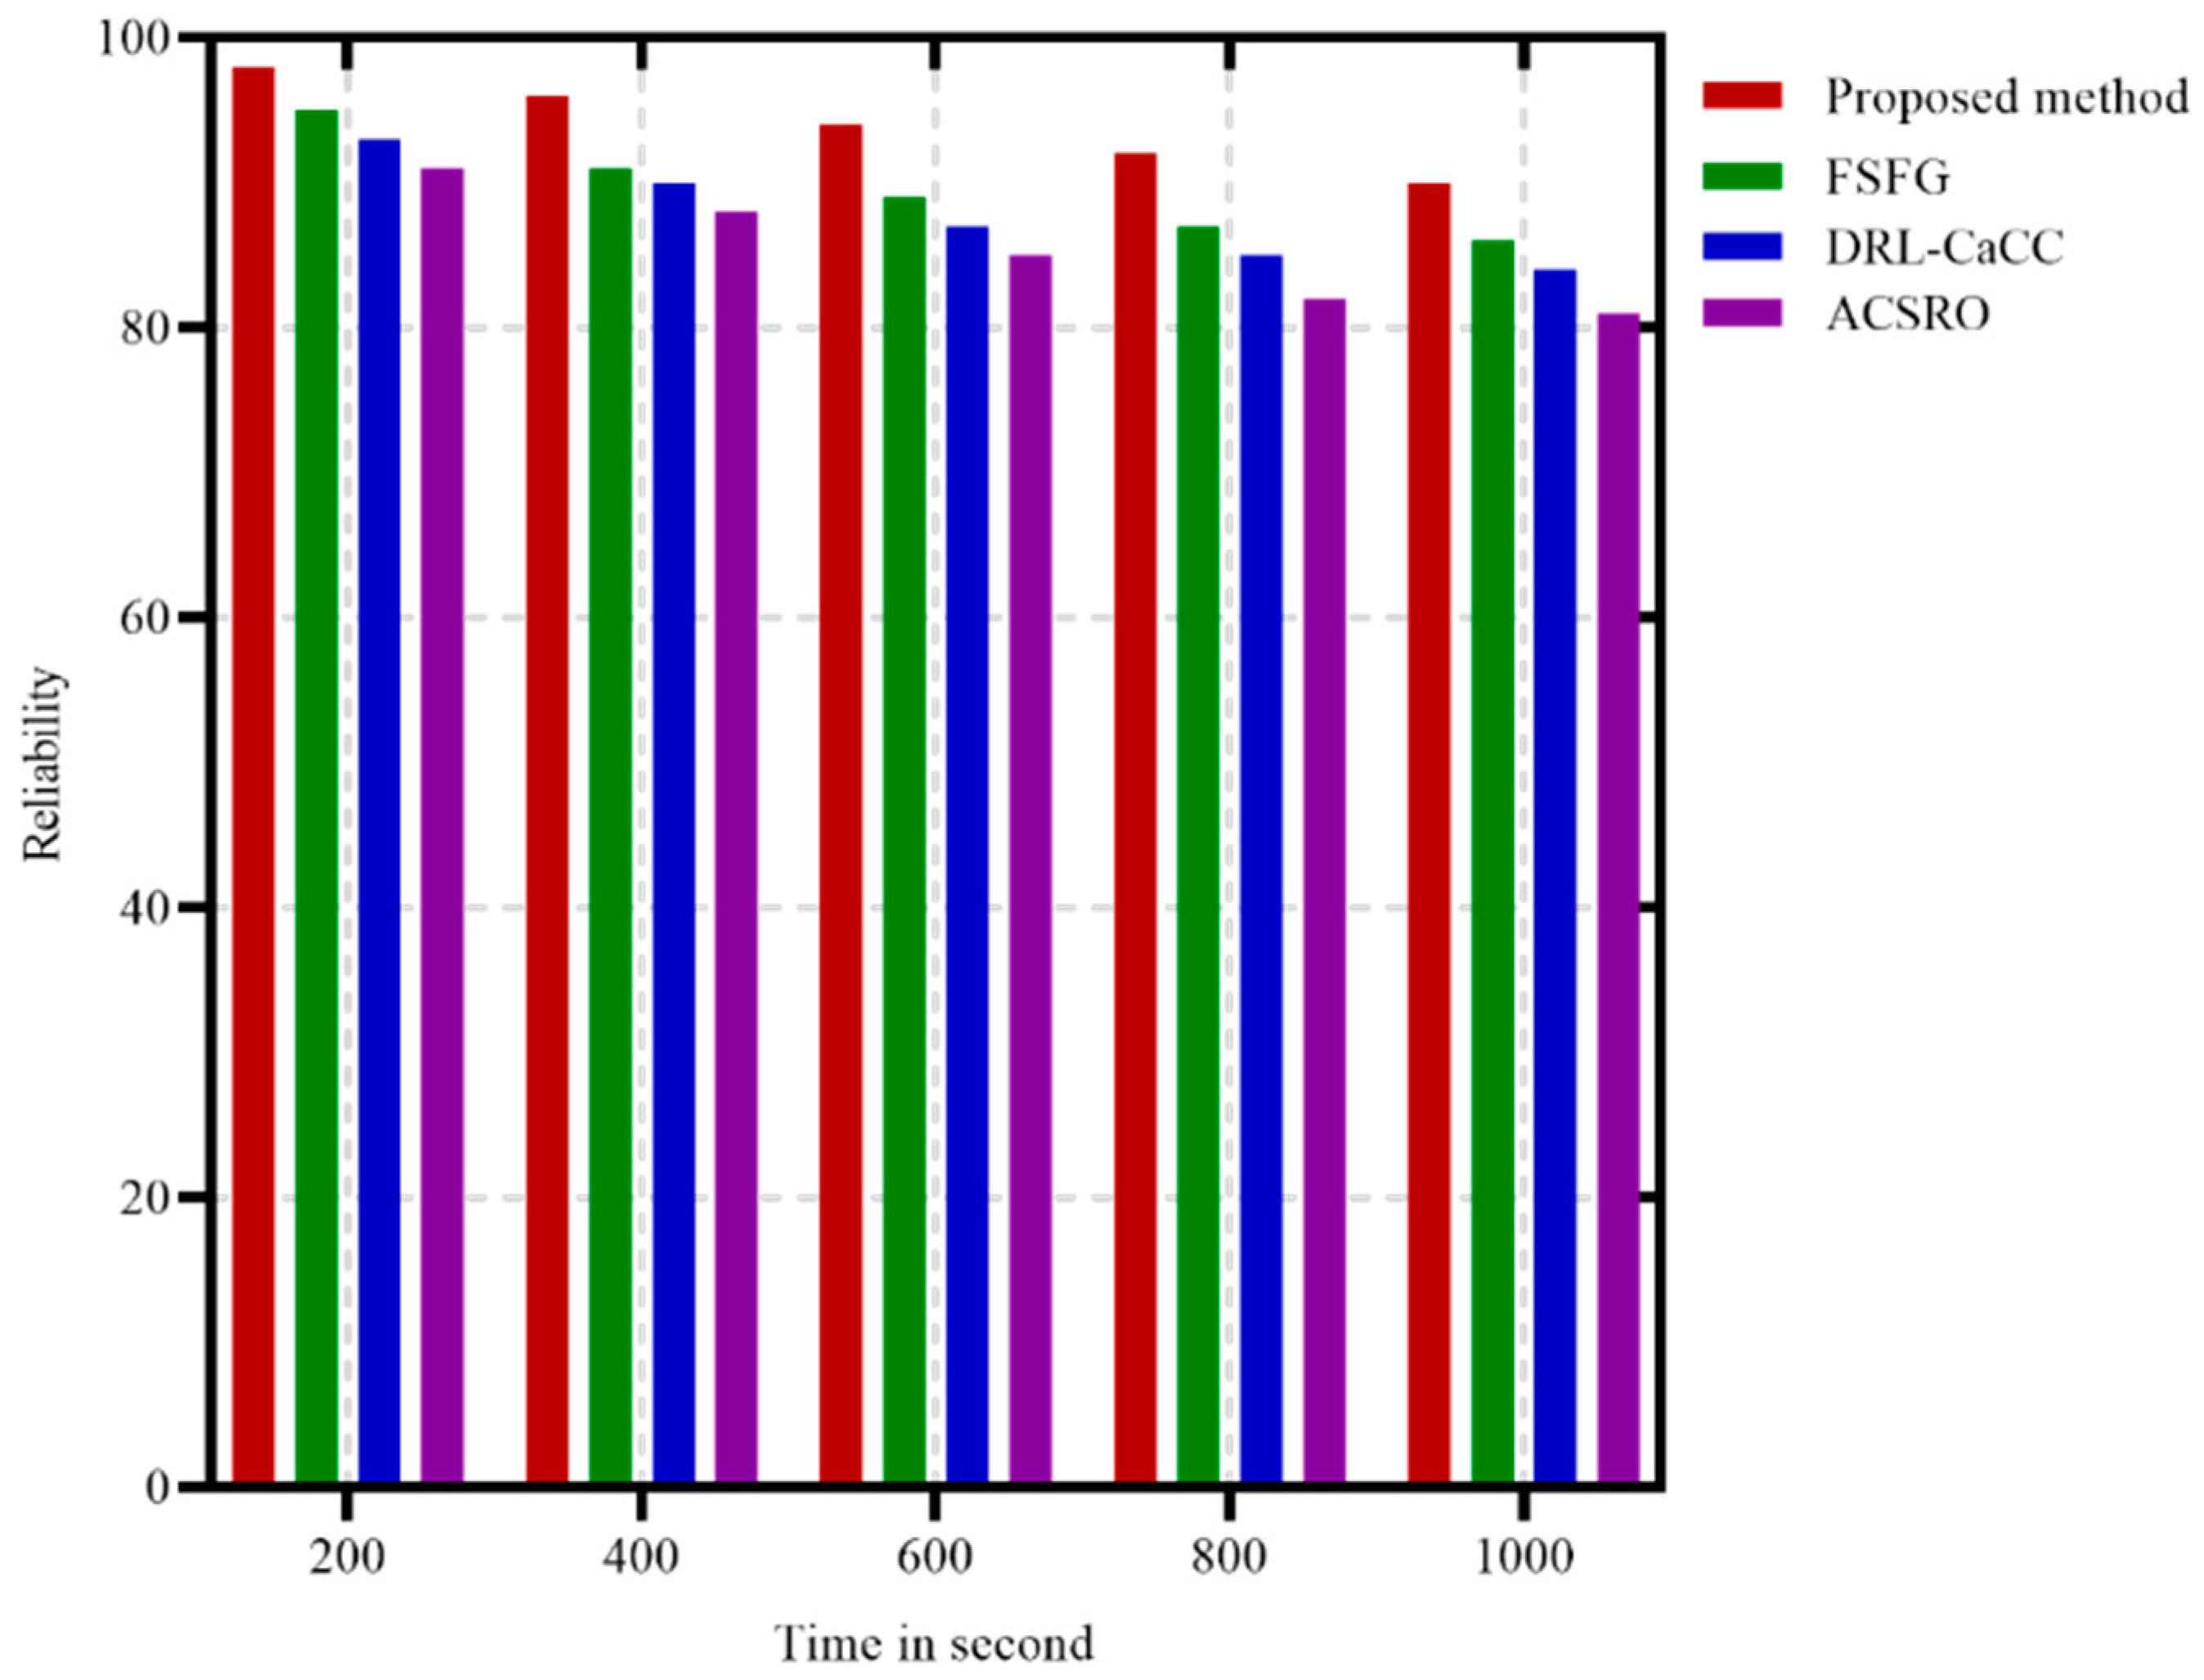
Reliability refers to the capacity of a system or component to perform its required functions consistently over a specified period. It is a key metric in evaluating the robustness and dependability of technology, especially in critical applications where consistent performance is essential for safety and user satisfaction. High reliability ensures that a system maintains its functionality and minimizes the risk of failures, which in turn enhances user confidence, reduces maintenance costs, and extends the lifespan of the system. In Figure 7, it is evident that the proposed method demonstrates superior reliability when compared to FSFG, indicating its greater effectiveness in sustaining performance over time. Reliability here refers to the probability that data packets are successfully delivered without loss, which is essential in applications requiring consistent and accurate data transmission. The proposed method demonstrates the highest reliability throughout the duration, consistently close to 100%. This high reliability can be attributed to its use of GANs for optimized cluster formation and ACO for dynamic path selection. Together, these components enable the method to adapt effectively to network changes, reroute traffic as needed, and prevent packet loss even under varying network conditions. FSFG and ACSRO also exhibit relatively high reliability but fall slightly below the proposed method, indicating that while they are effective in maintaining stable performance, they may not respond adaptively to congestion or changing network loads. DRL-CaCC shows the lowest reliability among the four algorithms, with noticeable declines over time. This trend suggests that DRL-CaCC may struggle with maintaining high packet delivery rates under prolonged operation, potentially due to its reliance on computationally intensive learning processes that may not adjust to real-time changes as efficiently. Overall, the proposed method’s superior reliability across all time intervals highlights its robustness and suitability for critical applications in WSNs where consistent data integrity is essential.

Figure 7.
Reliability metrics in different time.
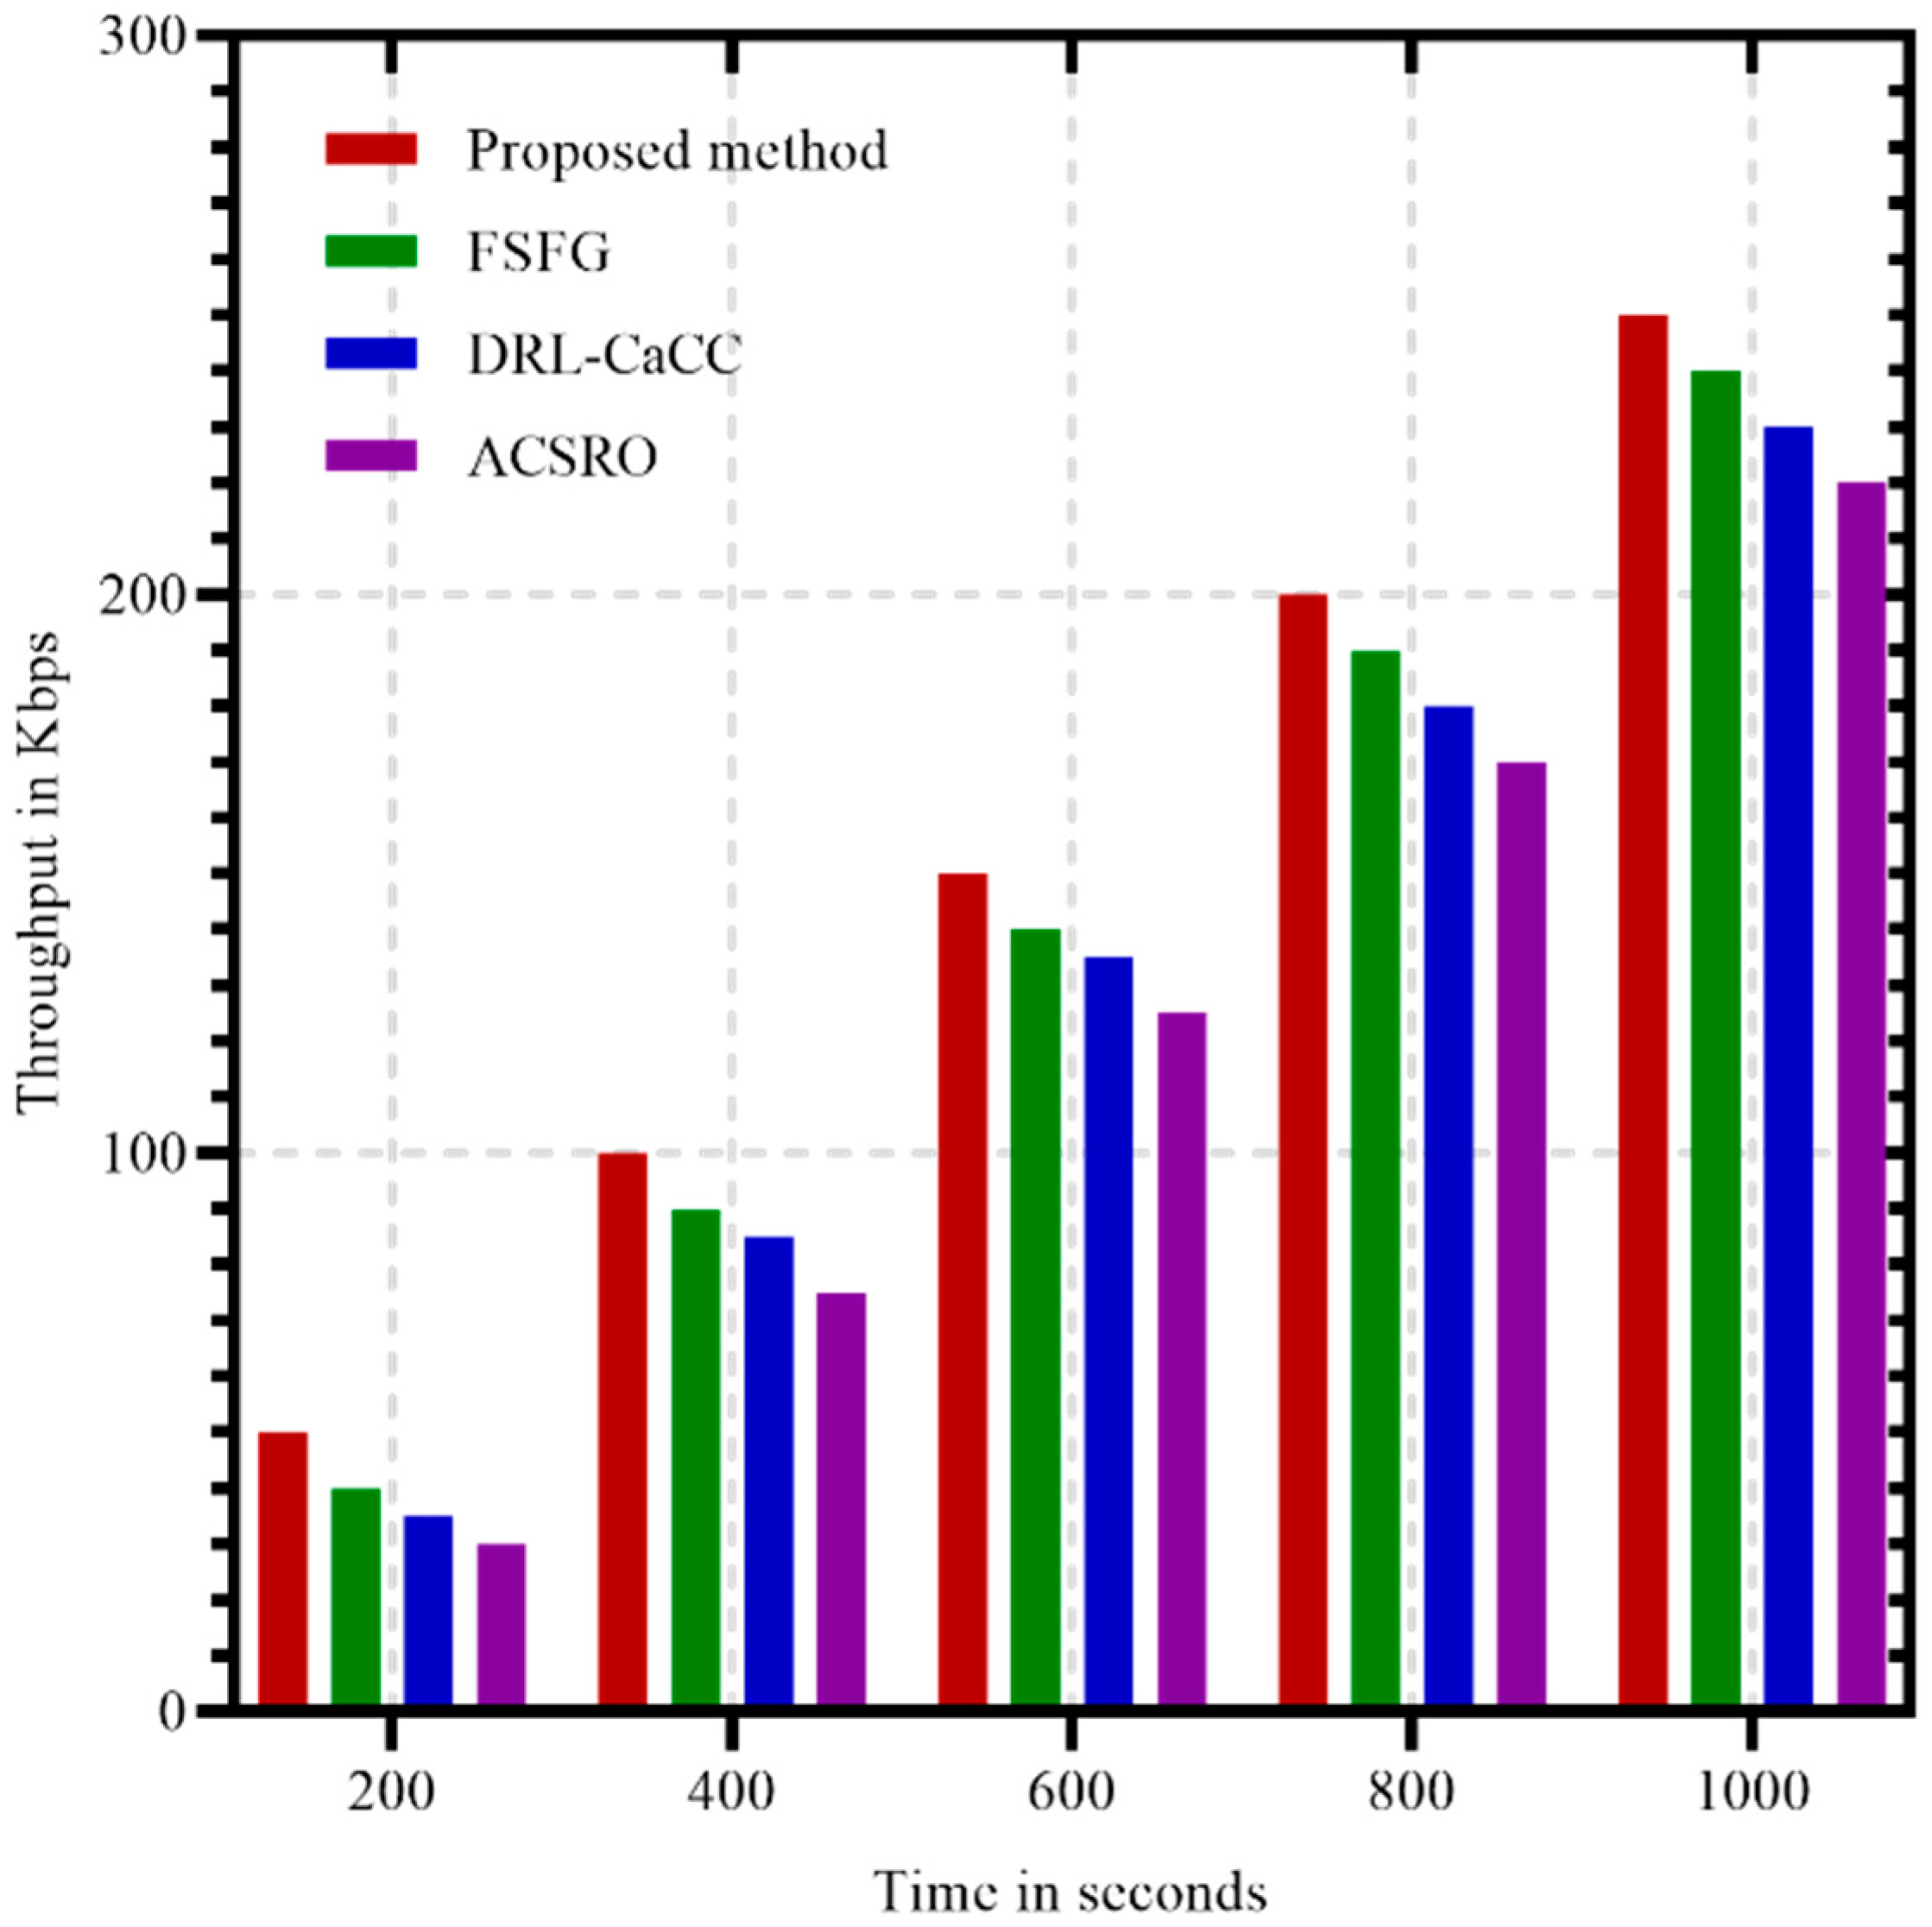
Throughput is a measure of the rate at which a system or network processes data over a given period. It reflects the system’s ability to handle data traffic efficiently, indicating how much information can be successfully transmitted from source to destination without loss or delay. High throughput is essential in applications that require fast data exchange, as it directly impacts performance, user experience, and operational efficiency. The proposed method in Figure 8 consistently achieves the highest throughput across all time intervals, showing a clear advantage over FSFG, DRL-CaCC, and ACSRO. This superior performance can be attributed to the use of GANs and ACO, which enable effective load distribution and adaptive path selection. The GAN-based clustering allows for balanced data handling within each cluster, while ACO optimizes routing to reduce bottlenecks, resulting in efficient data flow and higher throughput. FSFG also performs well but trails slightly behind the proposed method, maintaining relatively stable throughput that increases moderately over time. DRL-CaCC and ACSRO exhibit lower throughput, with more gradual increases, indicating less efficiency in managing data under similar conditions. This difference suggests that DRL-CaCC and ACSRO may face limitations in adapting to real-time congestion or optimizing network paths as dynamically as the proposed method. Overall, the proposed method’s consistent high throughput highlights its suitability for data-intensive WSN applications, where maintaining high data transfer rates is essential for network performance and reliability.
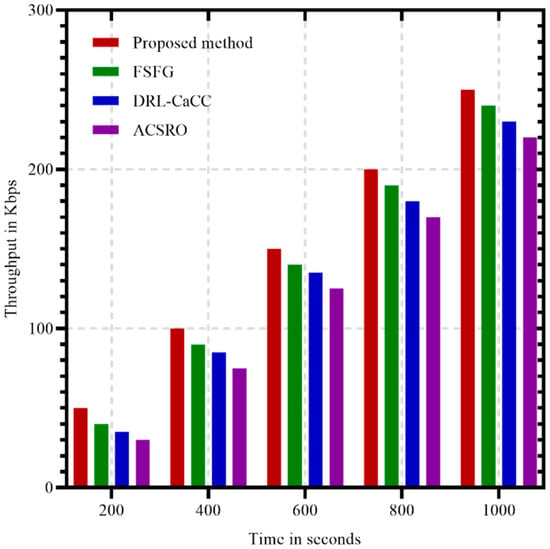
Figure 8.
Throughput metrics in different time.
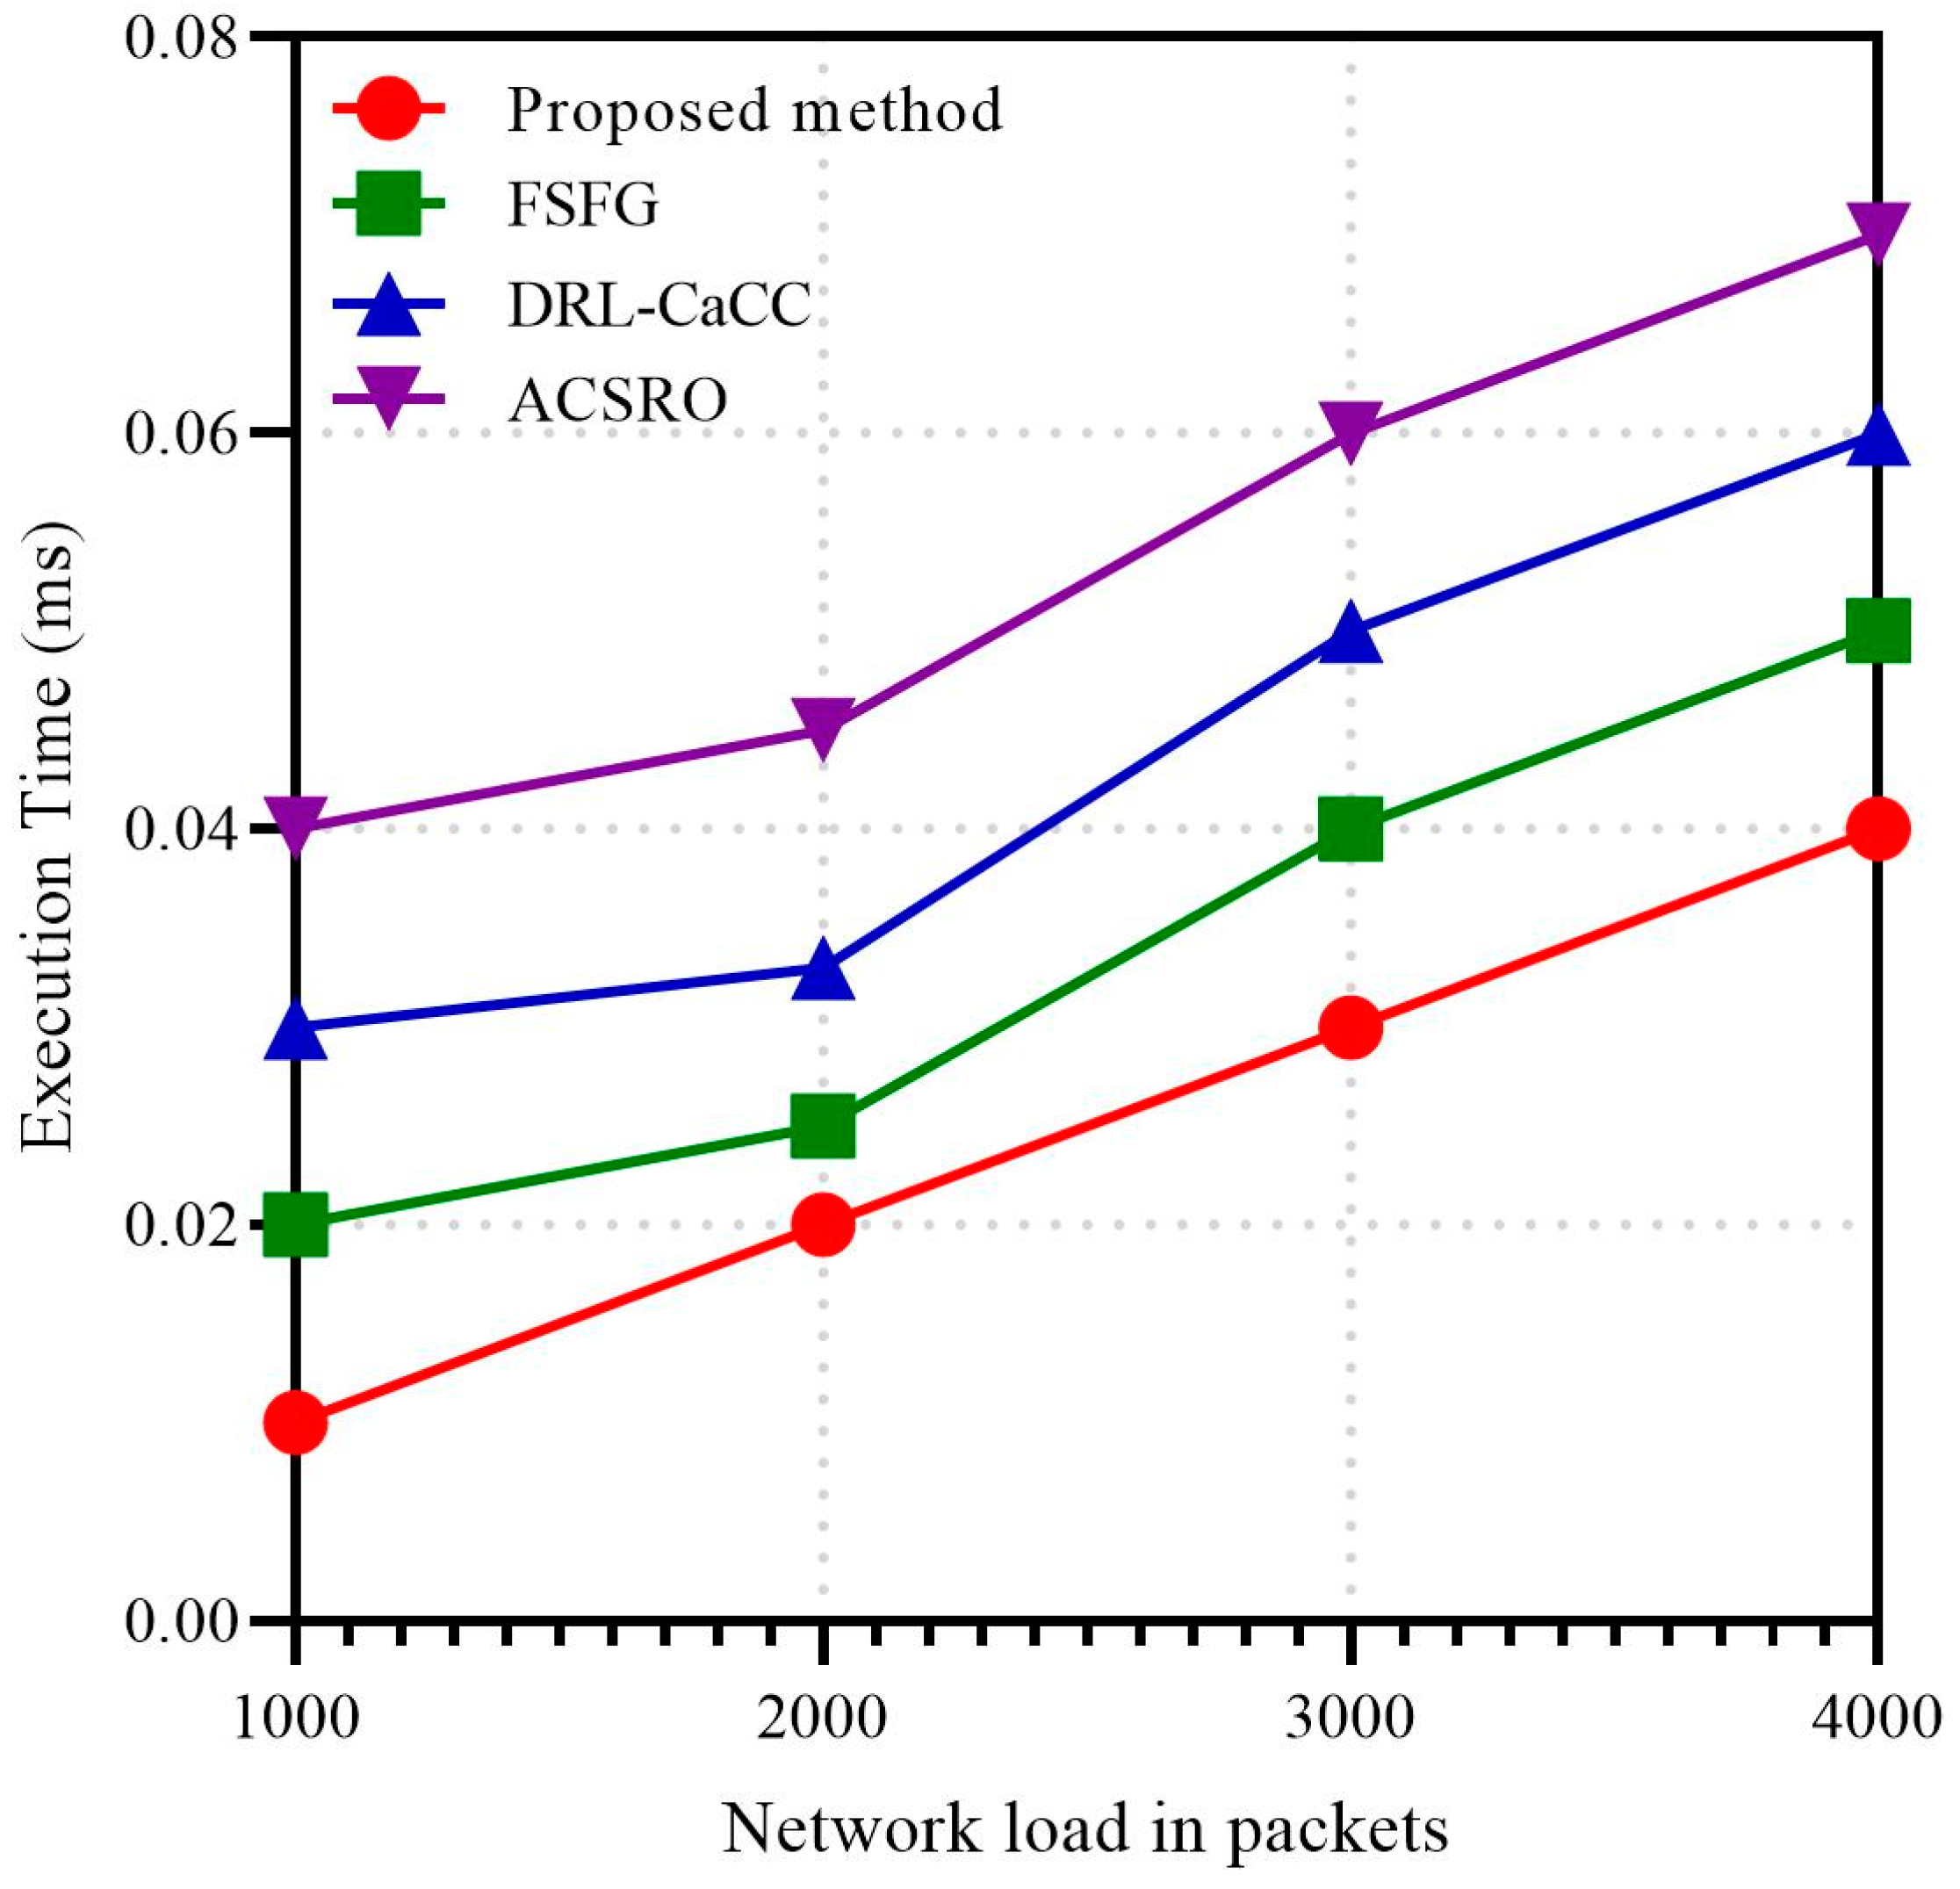
Figure 9 illustrates the execution time of the proposed GAN-ACO congestion control method compared to FSFG, DRL-CaCC, and ACSRO under varying network loads. The X-axis represents the network load in packets, reflecting the input size, while the Y-axis denotes execution time in milliseconds, indicating the computational time. As network load increases from 1000 to 4000 packets, all methods exhibit a rising execution time, but the proposed method consistently demonstrates the lowest execution time, highlighting its computational efficiency. This aligns with the reviewer’s concern regarding run-time complexity, showing that GAN-ACO scales more efficiently than other approaches.
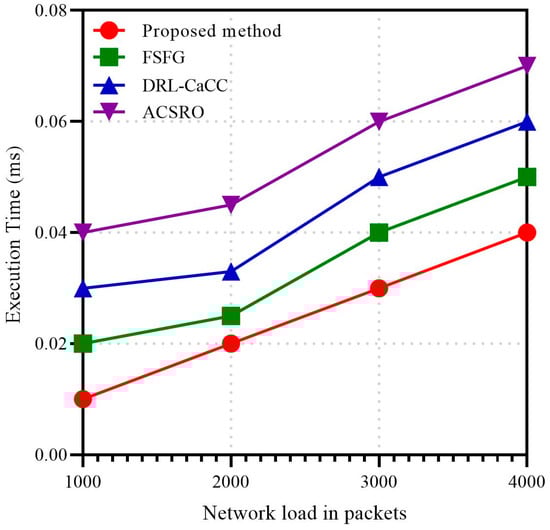
Figure 9.
Execution time metrics in network load packets.
5. Open Issue
The GAN-ACO congestion control strategy offers significant advantages in maintaining energy efficiency, reducing latency, and enhancing network reliability in WSNs. However, several open issues remain, and further investigation is required to fully realize the potential of this method across diverse WSN applications.
Analysis of Results and Observed Patterns
The experimental results show that the proposed GAN-ACO strategy achieves higher energy efficiency and lower latency than traditional algorithms like FSFG, DRL-CaCC, and ACSRO. These improvements stem from GANs’ ability to create balanced clusters that minimize redundant data transmissions and ACO’s adaptive path selection based on real-time pheromone levels. The criteria for selecting this GAN-ACO configuration were largely based on the need to reduce communication overhead and enhance adaptive load balancing. For instance, the use of a lower pheromone evaporation rate (ρ = 0.1) ensures that the pheromone buildup focuses on optimal paths without overcrowding suboptimal routes. This balance prevents excessive retransmissions and rerouting, conserving energy and reducing congestion. Energy efficiency, a critical criterion, is improved as GAN-generated clusters reduce the number of intra-cluster communications by strategically grouping nodes, which minimizes unnecessary transmissions and energy-intensive long-range communication. As shown in Figure 5, GAN-ACO consistently maintains lower energy consumption levels compared to other methods, due to reduced data redundancy and efficient clustering. In high-traffic situations, DRL-CaCC and ACSRO exhibit faster energy depletion, which can be attributed to less optimized routing, especially under high loads, where DRL-CaCC faces computational delays in updating routes, and ACSRO’s predefined routing strategies are less adaptive. Similarly, the lower latency of the GAN-ACO strategy, demonstrated in Figure 6, is a direct result of ACO’s dynamic pheromone-based routing, which enables rapid path selection and adaptation to changes in traffic flow. This criterion is crucial, as WSNs often require minimal delay, especially for real-time monitoring applications. The results indicate that under high traffic, algorithms like DRL-CaCC and ACSRO suffer from increased latency due to their limited rerouting flexibility. The GAN component’s role in load balancing across clusters further reduces latency, as it prevents bottleneck formation by distributing data more evenly across network links. The proposed method, as shown in Figure 7, demonstrates exceptionally high reliability, primarily due to its use of the ACO algorithm. The method draws inspiration from how ants leave pheromone trails to signal the best routes, directing others along the quickest paths. Modeling this behavior, the algorithm efficiently discovers optimal network routes, reducing congestion and delays. This ensures data flows smoothly and reliably, achieving high throughput to the BS, even as network demands vary.
Key Open Issues:
Real-Time Adaptability and Response to Dynamic Network Conditions: Although GAN-ACO dynamically adjusts routes based on pheromone levels, it lacks mechanisms for instantaneous response to sudden environmental changes, such as node failures. Currently, ACO’s pheromone trail system allows for gradual adaptation, which may not be sufficient for critical applications requiring rapid reconfiguration. Future work could incorporate RL techniques to enhance real-time adaptability, allowing the algorithm to adjust routes or cluster formations in real time in response to abrupt changes.
Optimizing for Resource Constraints in Ultra-Low Power WSNs: The current GAN-ACO configuration is optimized for networks with moderate computational resources, which may not be feasible in ultra-low-power sensor networks. The GAN’s clustering mechanism, while effective, is computationally intensive and may drain node energy rapidly. To address this, future research could focus on lightweight clustering alternatives or intermittent GAN training cycles. This approach could balance computational demands and energy preservation, enabling the deployment of GAN-ACO in resource-constrained environments.
Scalability in Large-Scale and Dense Network Deployments: As WSNs expand in size, congestion control strategies must maintain performance and scalability. Current results show that GAN-ACO performs effectively in medium-sized networks; however, in larger deployments, the clustering and pheromone update processes may introduce delays. Implementing a hierarchical clustering framework using GANs, where clusters operate semi-autonomously and aggregate data to a central unit only when necessary, could help in managing high data loads. This hierarchy would reduce the overhead on central nodes and allow for more efficient data processing across large networks.
Security and Robustness Against Adversarial Attacks: WSNs deployed in exposed environments are often susceptible to attacks that compromise data integrity. The GAN-ACO strategy, reliant on clustering and pheromone-based routing, may be vulnerable to attacks such as forged pheromone updates or adversarial clustering. Ensuring robust, secure data paths could be achieved by integrating blockchain for data validation or introducing anomaly detection layers to prevent malicious rerouting or clustering manipulation. A future criterion for this enhancement would be to evaluate robustness by simulating adversarial conditions and measuring performance.
Criteria for Future Directions and Evaluation
Evaluating the future potential of GAN-ACO in WSNs requires a set of well-defined criteria:
Energy Efficiency: Evaluate total network energy consumption under various traffic loads and conditions, with special attention to prolonging network lifetime in low-energy environments.
Latency: Testing latency across dynamic network topologies would provide valuable insights into GAN-ACO’s ability to adapt to increased data flow without introducing delays. Evaluating this technology within 5G and 6G networks could further demonstrate its performance in high-speed, high-capacity environments, showcasing its suitability for modern, demanding network standards.
Scalability: Evaluating the method’s performance in larger WSN deployments with multiple BSs can provide deeper insights into its scalability. Implementing hierarchical clustering across these BSs would help balance the network load, minimizing congestion and enhancing data transmission efficiency as the network grows. This setup allows for more resilient and efficient data handling, particularly in expansive WSN environments.
Security Robustness: Develop metrics to assess resilience against network attacks, including data integrity and reliability under adversarial conditions.
6. Conclusions
In this study, we present a hybrid GAN-ACO congestion control framework for WSNs aimed at enhancing energy efficiency, latency reduction, and reliability. Utilizing GANs for efficient cluster formation and ACO for adaptive routing, this approach balances load distribution while dynamically responding to congestion through pheromone-based path selection. The simulation results demonstrate that GAN-ACO consistently surpasses existing congestion control methods, such as FSFG, DRL-CaCC, and ACSRO, across key QoS metrics—particularly in terms of energy conservation, reduced latency, and higher reliability. This advantage is attributed to GANs’ ability to create well-balanced clusters, minimizing redundant transmissions, while ACO optimally directs traffic to less congested paths, reducing overall delay. Despite these benefits, the computational intensity of GAN-ACO may limit its scalability in ultra-large WSN deployments, especially within resource-constrained settings. Future work could address this by introducing lightweight clustering techniques and integrating hierarchical routing to expand the framework’s applicability across diverse WSN scenarios. Further, employing security enhancements, such as reinforcement learning for real-time adaptability and blockchain for data integrity, could fortify its resilience under high-risk conditions. Overall, GAN-ACO demonstrates robust performance and scalability, suggesting it as a viable solution for real-time, data-heavy applications in fields like environmental monitoring and smart cities, where prolonged network lifespan and QoS maintenance are critical. This framework effectively addresses key WSN congestion challenges, supporting reliable and efficient operation in modern IoT environments.
Author Contributions
Conceptualization, S.S.S. and B.A.; methodology, S.S.S.; software, S.S.S.; validation, S.S.S., B.A. and R.C.; formal analysis, S.S.S.; investigation, S.S.S.; resources, C.-R.C.; data curation, S.S.S.; writing—original draft preparation, S.S.S.; writing—review and editing, B.A., R.C. and C.-R.C.; visualization, S.S.S.; supervision, R.C.; project administration, R.C.; funding acquisition, R.C. and C.-R.C. All authors have read and agreed to the published version of the manuscript.
Funding
This work was partially supported by the TrialsNet project, funded from the European Union’s Horizon-JU-SNS-2022 Research and Innovation Programme under Grant Agreement No. 101095871.
Data Availability Statement
The original contributions presented in the study are included in the article, further inquiries can be directed to the corresponding author.
Conflicts of Interest
The authors declare no conflicts of interest.
References
- Sefati, S.; Navimipour, N.J. A QoS-aware service composition mechanism in the internet of things using a hidden-markov-model-based optimization algorithm. IEEE Internet Things J. 2021, 8, 15620–15627. [Google Scholar] [CrossRef]
- Sefati, S.S.; Craciunescu, R.; Arasteh, B.; Halunga, S.; Fratu, O.; Tal, I. Cybersecurity in a Scalable Smart City Framework Using Blockchain and Federated Learning for Internet of Things (IoT). Smart Cities 2024, 7, 2802–2841. [Google Scholar] [CrossRef]
- AlZyoud, F.; Tarawneh, M.; Almaghthawi, A.; Altalidi, A. A New Approach for Cluster Head Selection in Wireless Sensor Networks. Int. J. Online Biomed. Eng. 2024, 20, 39–50. [Google Scholar] [CrossRef]
- Sefati, S.S.; Halunga, S. Ultra-reliability and low-latency communications on the internet of things based on 5G network: Literature review, classification, and future research view. Trans. Emerg. Telecommun. Technol. 2023, 34, e4770. [Google Scholar] [CrossRef]
- Friess, P. Digitising the Industry-Internet of Things Connecting the Physical, Digital and Virtual Worlds; River Publishers: Nordjylland, Denmark, 2016. [Google Scholar]
- Lv, J.; Kim, B.-G.; Parameshachari, B.; Slowik, A.; Li, K. Large model-driven hyperscale healthcare data fusion analysis in complex multi-sensors. Inf. Fusion 2025, 115, 102780. [Google Scholar] [CrossRef]
- Al-Sarawi, S.; Anbar, M.; Alieyan, K.; Alzubaidi, M. Internet of Things (IoT) communication protocols. In Proceedings of the 2017 8th International Conference on Information Technology (ICIT), Amman, Jordan, 17–18 May 2017; IEEE: Piscataway Township, NJ, USA, 2017. [Google Scholar]
- Dvir, E.; Shifrin, M.; Gurewitz, O. Cooperative Multi-Agent Reinforcement Learning for Data Gathering in Energy-Harvesting Wireless Sensor Networks. Mathematics 2024, 12, 2102. [Google Scholar] [CrossRef]
- Sefati, S.S.; Arasteh, B.; Halunga, S.; Fratu, O.; Bouyer, A. Meet User’s Service Requirements in Smart Cities Using Recurrent Neural Networks and Optimization Algorithm. IEEE Internet Things J. 2023, 10, 22256–22269. [Google Scholar] [CrossRef]
- Al-Ward, H.; Tan, C.K.; Lim, W.H. Caching transient data in Information-Centric Internet-of-Things (IC-IoT) networks: A survey. J. Netw. Comput. Appl. 2022, 206, 103491. [Google Scholar] [CrossRef]
- Radhakrishnan, P.; Sugumar, P.K.; Ponnan, P.; Varadharajan, G.P. Correction to: Certificate-less Aggregate Signature Authentication Scheme (CLASAS) for secure and efficient data transmission in Wireless Sensor Networks (WSNs). Peer Peer Netw. Appl. 2024, 17, 3505. [Google Scholar] [CrossRef]
- Djahel, S.; Doolan, R.; Muntean, G.-M.; Murphy, J. A communications-oriented perspective on traffic management systems for smart cities: Challenges and innovative approaches. IEEE Commun. Surv. Tutor. 2014, 17, 125–151. [Google Scholar] [CrossRef]
- Nayak, D.; Ray, K.; Kar, T.; Mohanty, S.N. Fuzzy Rule Based Adaptive Block Compressive Sensing for WSN Application. Mathematics 2023, 11, 1660. [Google Scholar] [CrossRef]
- Sefati, S.S.; Haq, A.U.; Nidhi, R.; Craciunescu, R.; Halunga, S.; Mihovska, A.; Fratu, O. A Comprehensive Survey on Resource Management in 6G Network Based on Internet of Things. IEEE Access 2024, 12, 113741–113784. [Google Scholar] [CrossRef]
- Pan, Z.; Yu, W.; Yi, X.; Khan, A.; Yuan, F.; Zheng, Y. Recent progress on generative adversarial networks (GANs): A survey. IEEE Access 2019, 7, 36322–36333. [Google Scholar] [CrossRef]
- Blum, C. Ant colony optimization: Introduction and recent trends. Phys. Life Rev. 2005, 2, 353–373. [Google Scholar] [CrossRef]
- Ridha, A. Comparative study of transport protocols in WSN. In Proceedings of the 2014 Information and Communication Technologies Innovation and Application (ICTIA), Sousse, Tunisia, 6–8 March 2014; IEEE: Piscataway Township, NJ, USA, 2014. [Google Scholar]
- Aimtongkham, P.; Musikawan, P.; Kongsorot, Y.; So-In, C. A Novel Congestion Control Scheme Using Fuzzy Logic Systems to Enhance the Path Selection Criteria in Routing Protocols for Low-Power and Lossy Networks on the Internet of Things. SN Comput. Sci. 2024, 5, 610. [Google Scholar] [CrossRef]
- Bhat, R.V.; Haxhibeqiri, J.; Moerman, I.; Hoebeke, J. Network-and application-aware adaptive congestion control algorithm. J. Commun. Netw. 2024, 26, 344–355. [Google Scholar] [CrossRef]
- Andrade-Zambrano, A.R.; León, J.P.A.; Morocho-Cayamcela, M.E.; Cárdenas, L.L.; de la Cruz LLopis, L.J. A Reinforcement Learning Congestion Control Algorithm for Smart Grid Networks. IEEE Access 2024, 12, 75072–75092. [Google Scholar] [CrossRef]
- Narawade, V.; Kolekar, U.D. ACSRO: Adaptive cuckoo search based rate adjustment for optimized congestion avoidance and control in wireless sensor networks. Alex. Eng. J. 2018, 57, 131–145. [Google Scholar] [CrossRef]
- Kalaikumar, K.; Baburaj, E. Fuzzy enabled congestion control by cross layer protocol utilizing OABC in WSN: Combining MAC, routing, non-similar clustering and efficient data delivery. Wirel. Netw. 2020, 26, 1085–1103. [Google Scholar] [CrossRef]
- Antoniou, P.; Pitsillides, A.; Blackwell, T.; Engelbrecht, A.; Michael, L. Congestion control in wireless sensor networks based on bird flocking behavior. Comput. Netw. 2013, 57, 1167–1191. [Google Scholar] [CrossRef]
- Alipio, M.; Bures, M. A cache-aware congestion control mechanism using deep reinforcement learning for wireless sensor networks. Ad Hoc Netw. 2025, 166, 103678. [Google Scholar] [CrossRef]
- Mazloomi, N.; Gholipour, M.; Zaretalab, A. Efficient Fuzzy Methodology for Congestion Control in Wireless Sensor Networks. J. Frankl. Inst. 2024, 361, 107014. [Google Scholar] [CrossRef]
- Buyya, R.; Ilager, S.; Arroba, P. Energy-efficiency and sustainability in new generation cloud computing: A vision and directions for integrated management of data centre resources and workloads. Softw. Pract. Exp. 2024, 54, 24–38. [Google Scholar] [CrossRef]
- Çakmak, M. The Impact of Denial-of-Service Attacks and Queue Management Algorithms on Cellular Networks. J. Intell. Syst. Theory Appl. 2024, 7, 1–13. [Google Scholar] [CrossRef]
- Sunitha, G.; Kumar, S.D.; Kumar, B.V. Energy efficient hierarchical multi-path routing protocol to alleviate congestion in WSN. Int. J. Ad Hoc. Ubiquitous Comput. 2019, 32, 59–73. [Google Scholar] [CrossRef]
- Ghaffari, A. Congestion control mechanisms in wireless sensor networks: A survey. J. Netw. Comput. Appl. 2015, 52, 101–115. [Google Scholar] [CrossRef]
- Qu, L.; Assi, C.; Shaban, K. Delay-aware scheduling and resource optimization with network function virtualization. IEEE Trans. Commun. 2016, 64, 3746–3758. [Google Scholar] [CrossRef]
- Zeng, J.; Xiong, Y.; Liu, F.; Ye, J.; Tang, J. Uncovering the spatiotemporal patterns of traffic congestion from large-scale trajectory data: A complex network approach. Phys. A Stat. Mech. Its Appl. 2022, 604, 127871. [Google Scholar] [CrossRef]
- Wu, N.; Bi, Y.; Michael, N.; Tang, A.; Doyle, J.C.; Matni, N. A control-theoretic approach to in-network congestion management. IEEE/ACM Trans. Netw. 2018, 26, 2443–2456. [Google Scholar] [CrossRef]
- Dutta, A.; Samaniego Campoverde, L.M.; Tropea, M.; De Rango, F. A Comprehensive Review of Recent Developments in VANET for Traffic, Safety & Remote Monitoring Applications. J. Netw. Syst. Manag. 2024, 32, 73. [Google Scholar]
- Ryu, S.; Rump, C.; Qiao, C. Advances in internet congestion control. IEEE Commun. Surv. Tutor. 2003, 5, 28–39. [Google Scholar] [CrossRef]
- Archana, S.; Saravanan, N. Biologically inspired QoS aware routing protocol to optimize lifetime in sensor networks. In Proceedings of the 2014 International Conference on Recent Trends in Information Technology, Chennai, India, 10–12 April 2014; IEEE: Piscataway Township, NJ, USA, 2014; pp. 1–6. [Google Scholar]
- Feng, Y.; Zhang, W.; Feng, Z.; Zhong, X.; Liu, F. An MTD-driven Hybrid Defense Method Against DDoS Based on Markov Game in Multi-controller SDN-enabled IoT Networks. In Proceedings of the 2024 IEEE/ACM 32nd International Symposium on Quality of Service (IWQoS), Guangzhou, China, 19–21 June 2024; IEEE: Piscataway Township, NJ, USA, 2024; pp. 1–6. [Google Scholar]
- Haq, A.U.; Sefati, S.S.; Nawaz, S.J.; Mihovska, A.; Beliatis, M.J. Need of UAVs and Physical Layer Security in Next-Generation Non-Terrestrial Wireless Networks: Potential Challenges and Open Issues. IEEE Open J. Vehicular Technol. 2025. Early Access. [Google Scholar] [CrossRef]
- Ekanayake, V.; Kelly IV, C.; Manohar, R. An ultra low-power processor for sensor networks. In Proceedings of the 11th International Conference on Architectural Support for Programming Languages and Operating Systems, Boston, MA, USA, 7–13 October 2004; pp. 27–36. [Google Scholar]
- Sari, E.K.; Wirara, A.; Harwahyu, R.; Sari, R.F. Lora characteristics analysis for IoT application using NS3 simulator. In Proceedings of the 2019 IEEE R10 Humanitarian Technology Conference (R10-HTC)(47129), Depok, Indonesia, 12–14 November 2019; IEEE: Piscataway Township, NJ, USA, 2019; pp. 205–210. [Google Scholar]


Disclaimer/Publisher’s Note: The statements, opinions and data contained in all publications are solely those of the individual author(s) and contributor(s) and not of MDPI and/or the editor(s). MDPI and/or the editor(s) disclaim responsibility for any injury to people or property resulting from any ideas, methods, instructions or products referred to in the content. |
© 2025 by the authors. Licensee MDPI, Basel, Switzerland. This article is an open access article distributed under the terms and conditions of the Creative Commons Attribution (CC BY) license (https://creativecommons.org/licenses/by/4.0/).