1. Introduction
The utilization of spectroscopic techniques, such as Raman spectroscopy and infrared spectroscopy, has steadily increased in recent years. Raman spectroscopy reveals the molecular fingerprint of a sample and provides quantitative information about its chemical composition [
1]. Spectroscopy also reveals sensitive biochemical alterations in cells and tissues. These properties can be used in disease diagnosis and treatment, and they have applications in a variety of fields, including biology and medicine [
2]. Consequently, significant research efforts have been devoted to advancing spectral signal processing techniques. Among these efforts, one of the most critical and challenging tasks is the fast and precise identification of measured spectra, which requires careful comparison and analysis against well-established and comprehensive spectral databases [
3]. This task is essential not only for improving the efficiency and precision of spectral measurements but also for enabling reliable interpretation and utilization of spectral data in various scientific and industrial applications [
4].
Various spectrum identification methods have been proposed, with deep learning-based approaches receiving considerable attention in recent years [
5,
6]. To effectively leverage these techniques, the availability of a large spectral database is essential [
7]. However, existing spectral libraries typically provide only a single sample for each type of spectrum, which limits the ability to design robust classification models. As a result, search techniques, such as correlation search and Euclidean distance (
) search, are commonly employed. These methods are intuitive, computationally efficient, and compatible with existing spectral libraries [
8].
Fast search techniques are particularly suitable for embedded systems with limited computational resources [
9,
10]. For instance, portable spectrometer systems designed to detect hazardous substances, such as explosives and poisons, at accident sites exemplify the utility of such techniques [
11,
12]. Such applications demand the development of identification methods that are both fast and accurate. To meet this requirement, we focus on fast search methods that utilize similarity evaluation techniques. Unlike deep learning and machine learning approaches, which often incur significant computational overhead during the training process due to the size and complexity of datasets, similarity evaluation methods facilitate efficient searches. By relying on a single representative spectrum for comparison, these methods significantly reduce computational demands while maintaining accuracy [
13].
The
between spectra is a commonly used metric for similarity measurement [
14]. The spectrum most similar to the input spectrum is identified as the corresponding material. A fast
comparison method typically utilizes a clustering structure to optimize the search process. The primary advantage of such a structure lies in its ability to reduce the search space by grouping spectra in the database based on their similarity, thereby minimizing computational effort.
In previous studies, hierarchical clustering was employed to assess the similarity between spectra. This approach grouped closely related spectra into clusters, enabling an initial identification of the input spectrum. Subsequently, a pilot search algorithm was applied within the reduced subset to determine the spectrum most similar to the input, achieving both efficient and accurate identification [
15].
To surpass the performance of existing methods, this study combines
k-
d trees with a fine search process.
k-
d trees are data structures that generalize binary search trees to k dimensions, offering low computational costs. While
k-
d trees are typically used for exact solutions [
16], we adapt them to identify approximate neighbors [
17,
18]. A fine search is then applied as a postprocessing step to ensure that the results are consistent with those obtained through an exhaustive search.
This paper is organized as follows.
Section 2 presents a review of previously developed search methods.
Section 3 introduces the proposed fast algorithm, while
Section 4 compares its simulation results with those of existing techniques. Finally,
Section 5 provides a summary of the experimental results and conclusions.
2. Previous Methods
2.1. Full Search with Partial Distortion Search
The full search method involves identifying the vector that minimizes the squared Euclidean distance between the input vector
and the database vector
, as shown in Equation (
1). Here,
represents the reference spectrum, and
denotes the squared Euclidean distance between the input vector
and the spectrum
, as described in Equation (
2).
The search method using the squared Euclidean distance sequentially searches the entire database to find the reference vector closest to the input vector. This method requires multiplications, additions, and comparisons for a k-dimensional input vector where the number of spectra is N. This method has a limitation in that the computational load increases as the number of spectra N grows. A simple initial solution to this problem is a partial distortion search ().
is an algorithm that terminates early by setting a termination condition during the calculation of
. Assuming that the current minimum distance is
along the minimum search path, the algorithm stops calculating the distance when there exists a value
that satisfies the condition in Equation (
3). This method reduces
multiplications and
additions [
19].
2.2. Fast Search Based on Principal Component Analysis
Assuming that the dimension of the spectrum is 3300, the full search method calculates the Euclidean distance between all data points. Performing these calculations on the entire dataset demands substantial computational resources, rendering it impractical for fast searches. To address this challenge, Principal Component Analysis (
) is frequently employed to reduce computational costs.
is a multivariate analysis technique that reduces data dimensionality while preserving the essential information of the original dataset [
20,
21].
Let the reference spectra
be an
matrix. A correlation matrix
of dimension
is constructed. The matrix
can be decomposed as shown in Equation (
4), where the diagonal eigenvalue matrix
contains the eigenvalues
. The transformed principal components (
) are then computed using Equation (
5).
The degree of compression achieved through
can be quantified as a percentage of the cumulative sum of eigenvalues, as given in Equation (
6).
The cumulative ratio reaches approximately 1 when 250 principal components are used. This indicates that employing 250 PCs provides results nearly identical to those obtained via a full search, significantly reducing computational costs. However, using 250 PCs still involves a considerable amount of computation.
Previous studies have demonstrated that a search method utilizing a smaller number of
can achieve comparable results. The performance of such methods, along with the proposed approach, is discussed in detail in
Section 4.
2.3. Cluster Search with Pilot Search
Cluster search (
) is an algorithm based on hierarchical clustering (
) that utilizes a similarity measure between data clusters. In
, all distances between clusters in a spectral dataset are precomputed [
15]. Assuming that the dataset consists of
M clusters, there are
pairs of distances. The
method calculates the center of each cluster and designates the data point closest to the center as the “center data”. Distances between the center data and all other points within the same cluster are then calculated and stored, with the farthest distance defining the cluster size.
The algorithm begins by computing the distance between the input spectrum and each cluster center, sorting the clusters in ascending order of distance, and identifying the closest cluster. The distance between the input spectrum and the center of the closest cluster is denoted as , which is initialized as the minimum distance .
For a given cluster, if the difference between
and
exceeds the current
, all members of that cluster are excluded from consideration as the closest candidates. Conversely, if the condition in Equation (
7) is not satisfied, the spectra within the cluster are examined sequentially. The search order progresses from the cluster center outward to the farthest member. If a specific member meets the condition, the remaining members of the cluster are excluded from further inspection. This process is repeated across all
M clusters, ultimately identifying the spectrum closest to the input.
Pilot search begins by identifying a relatively close spectrum and then refining the search to locate the closest spectrum from this initial point. Previous studies have demonstrated that pilot search can effectively identify a relatively close spectrum using only a small number of . Once a sufficiently close spectrum is initially identified, the subsequent determination of the closest spectrum can be achieved with substantially reduced computational effort.
3. Proposed - Tree with Fine Search
is commonly employed to reduce the data size required for identifying the initial proximity spectrum. By mitigating noise in the data, the computational cost of determining the initial proximity spectrum is further minimized. Among the various types of noise reduction filters available, this study employs a running average filter to avoid additional computational overhead. Let
represent the input and
M denote the filter order. The running average filter can be expressed as follows:
The multiplications and additions required to compute the average filtering are each , which is significantly less computationally intensive than a typical smoothing filter.
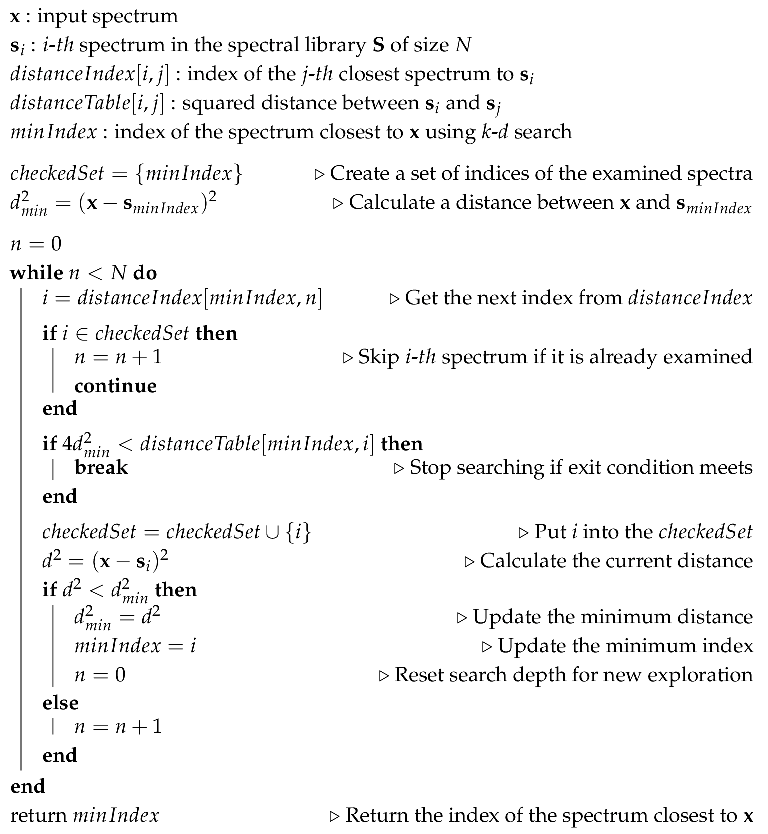
This filter not only reduces the noise present in the data but also significantly decreases the dimensionality of the data. As shown in
Figure 1, the raw data to be identified contain substantial noise, whereas the filtered data exhibit reduced noise, leading to lower data complexity. Consequently, a smaller number of
can be used compared to previous studies. In this study, a running average filter with a length of
M = 11 is employed.
3.1. k-d Tree Search
k-
d tree search is an extension of the binary search algorithm applied to multidimensional data. This search achieves maximum efficiency when the data in each dimension are independent of each other [
22]. Therefore,
is applied to reduce the correlation between each dimension, and then a
k-
d tree is constructed from it in this study.
k-d tree search starts at the root node and computes the distance to the input data in the k-dimensional space, going all the way to the last child node, to identify the closest data point. The algorithm backtracks through the nodes it has traversed, updating the closest distance and checking the opposite branch when necessary to ensure that the closest data are found. This process continues until the root node is reached, at which point the closest data point is determined.
In the proposed method, the k-d tree is constructed using a specified number of rather than all of them. Consequently, k-d tree search identifies a potentially nearest neighbor rather than the exact nearest neighbor. Therefore, a refined search step remains necessary to accurately identify the nearest spectrum.
3.2. Fine Search
Fine search is the process of finding the closest spectrum from the relatively close spectrum obtained through a
k-
d tree search. This process leverages a pre-stored distance table to reduce computational overhead. Let the input spectrum be
, and let the current closest spectrum be
, with
=
. Assume that
represents the spectra sorted by their proximity to
. To determine the closest spectrum, check the following inequality for
, which is the
n-
closest spectrum to
:
If this inequality is not satisfied,
is computed. If the calculated distance is smaller than the current closest distance
, the value of
is updated. Otherwise, the current spectrum
is identified as the closest spectrum based on the following rationale:
When transitioning from the second to the third inequality, the triangle inequality
is applied. The final inequality,
, confirms that further inspection for the closest spectrum is unnecessary.
The existing pilot search algorithm initially identifies a spectrum that is relatively close and subsequently searches for the closest match based on this initial candidate. In contrast, the proposed method improves upon this approach by dynamically updating the candidate spectrum. Specifically, it begins with a relatively close spectrum and iteratively refines the candidate whenever a closer spectrum is identified.
This method requires a table to store spectrum indices in order of proximity to a given spectrum, along with a distance table between the spectra. By continuously updating the closest spectrum when a closer match is found, the proposed approach significantly reduces the search space and improves overall performance.
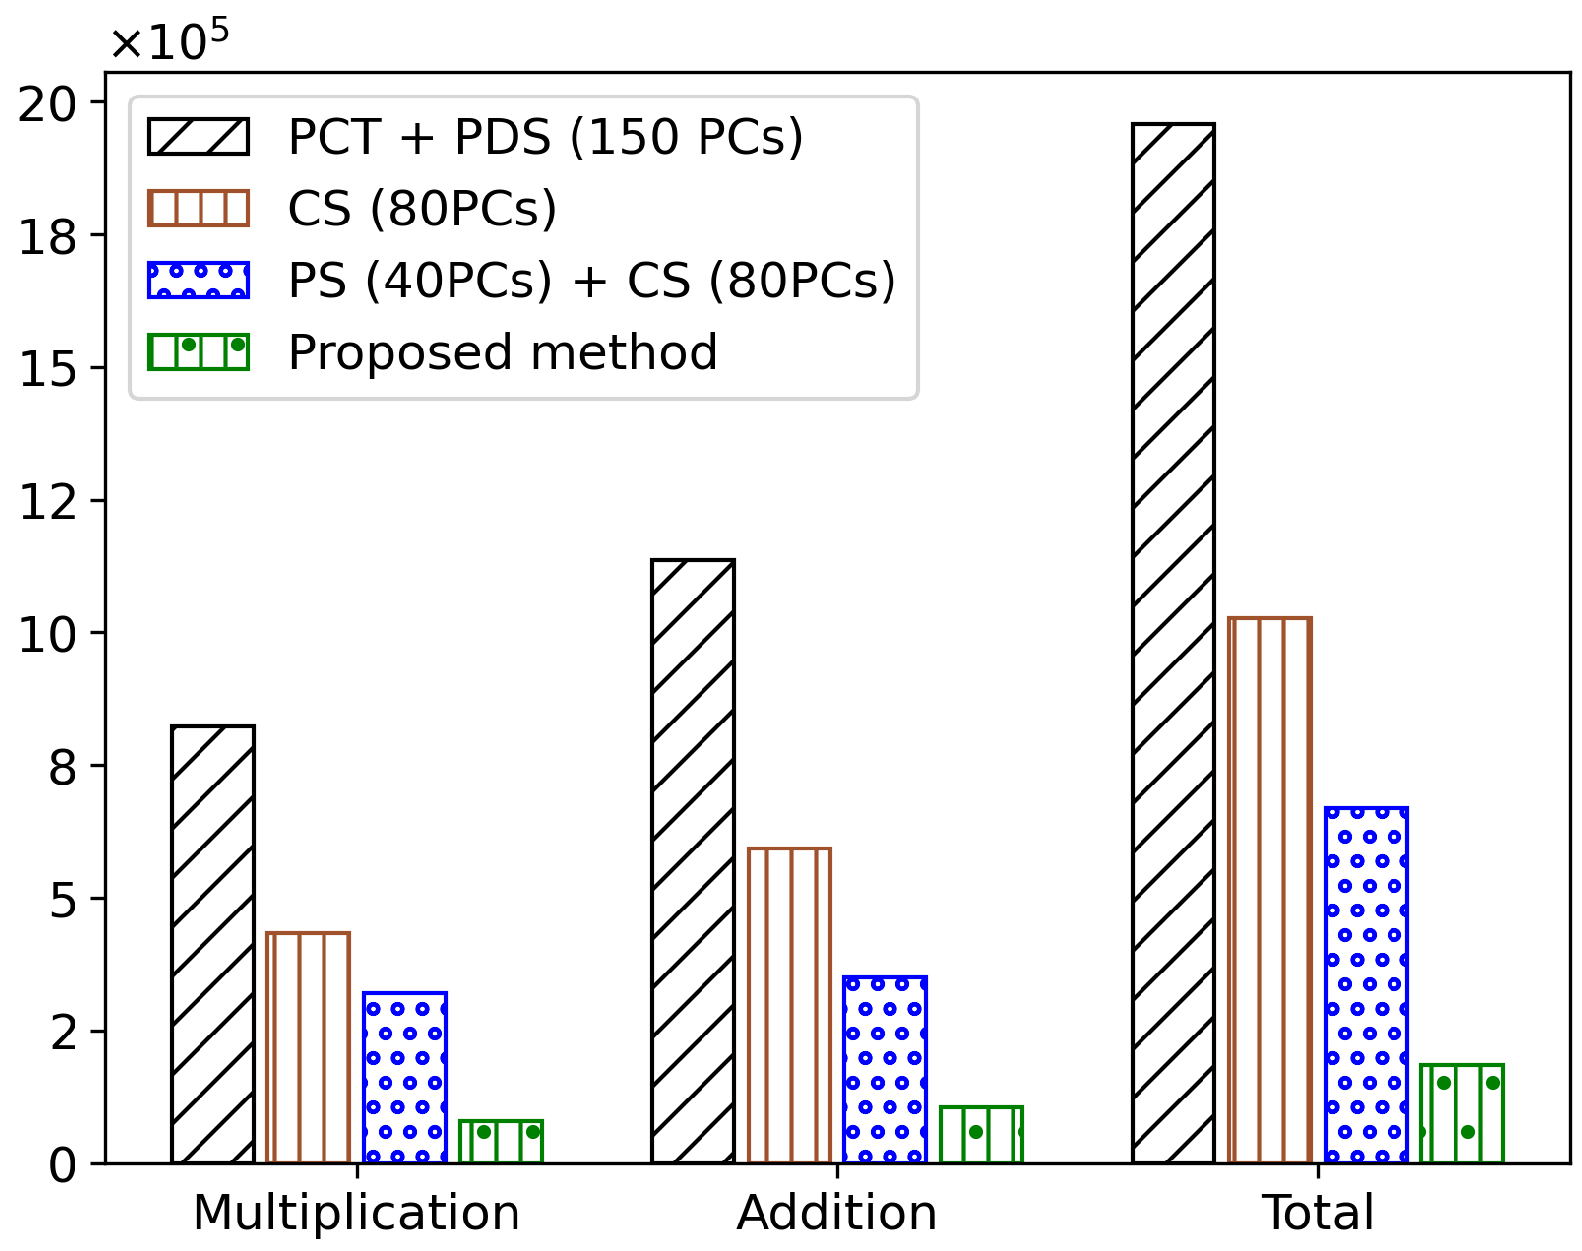
Figure 2 shows a simplified flow diagram of the proposed method, while
Figure 3 provides a detailed flow diagram of the fine search algorithm. The corresponding pseudocode is presented in Algorithm 1.
| Algorithm 1: Fine search algorithm |
![Mathematics 13 00574 i001]() |
4. Experimental Results
The Raman spectrum library used in the experiment comprised 14,085 chemical substances, with each spectrum represented as a one-dimensional vector of size 3300. Background noise and additive noise in the spectrum library were removed using noise removal techniques [
23,
24]. Four Raman spectroscopy systems were used to measure the spectra: the Renishaw 2000, an FT-Raman system, and two inVia instruments.
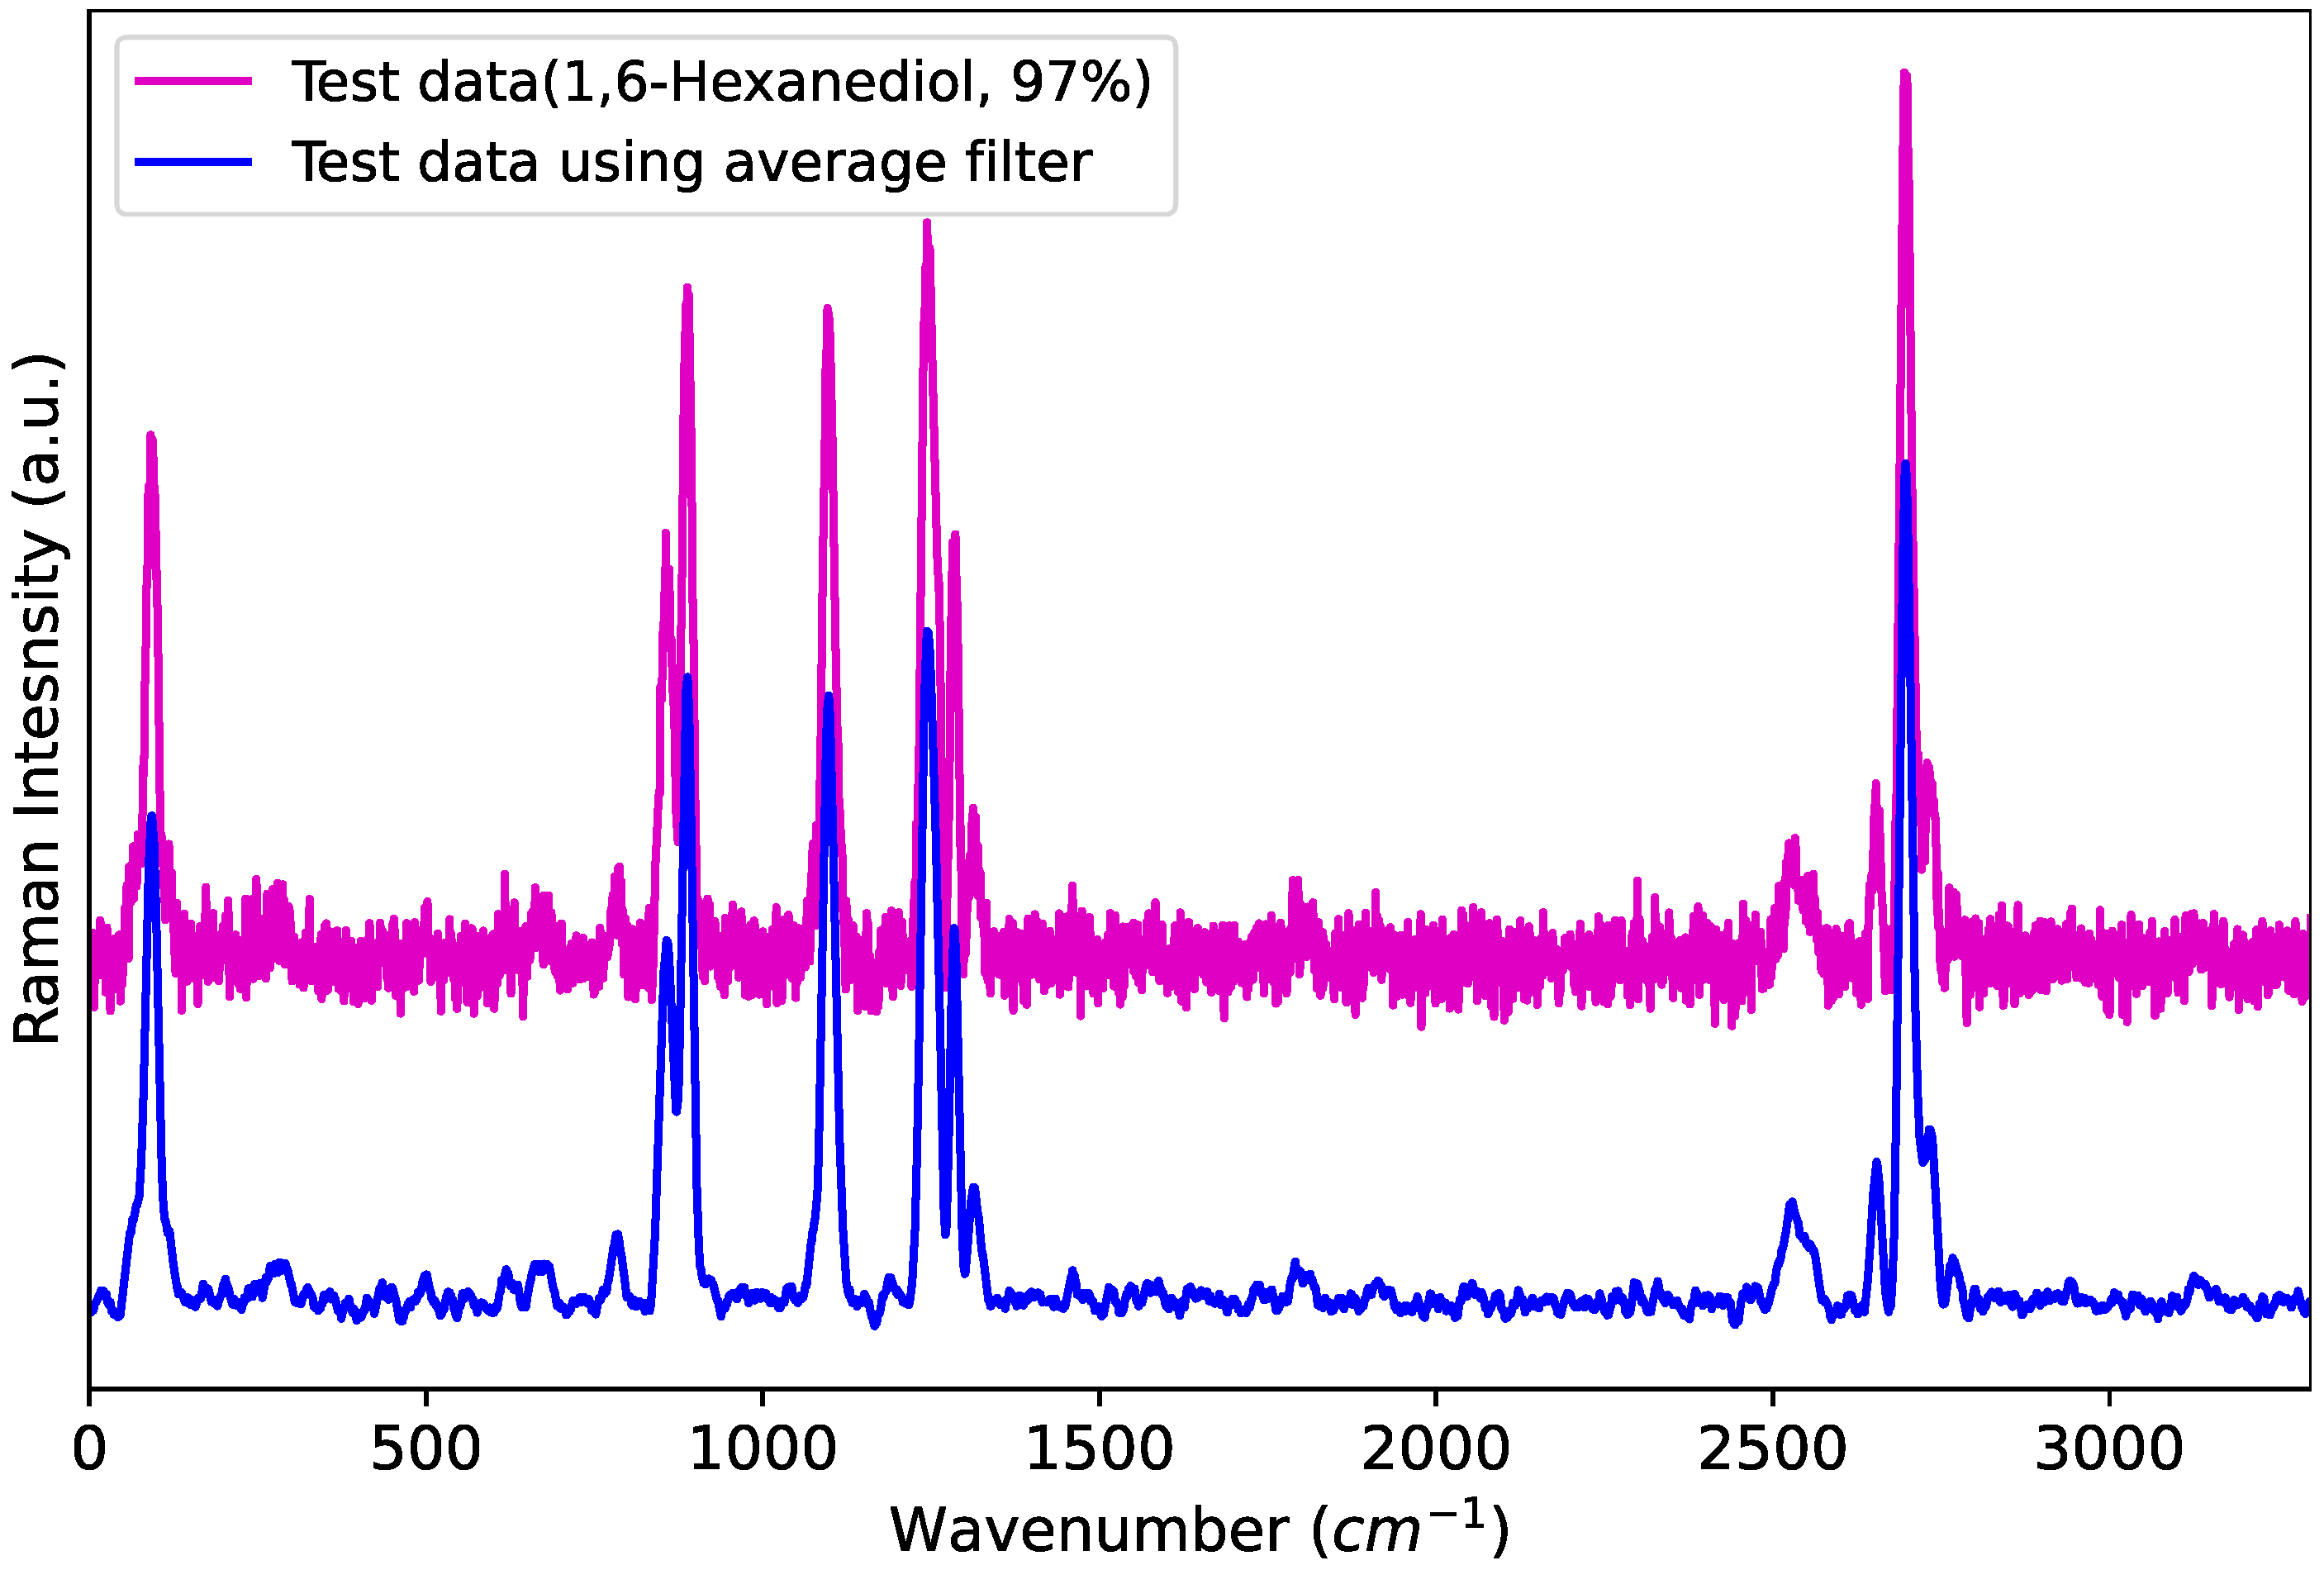
Figure 4 shows examples of preprocessed Raman spectra from the experiments, including 3-aminophenylboronic acid monohydrate, 2-amino-5,6-dimethylbenzimidazole, heneicosane, and triphenylantimony(V) dichloride.
For performance comparison, a total of 2817 types, corresponding to 20% of the entire database, were randomly chosen and had noise levels of 15, 20, and 24 dB added to generate test data. Since actual spectra contain non-linear noise, their presence can negatively impact performance. Therefore, it is crucial to identify the optimal parameters that allow for accurate analysis, even when harsh noise is added to the test data.
The performance of the algorithm was objectively evaluated using two criteria: the number of multiplication operations and the number of addition operations. The computational cost of each operation was calculated as the average number of operations across 2817 test samples.
The performance of the proposed method is significantly influenced by the number of used. Using too few reduces the computational load during the k-d tree search process but increases the burden on the fine search process, potentially resulting in a higher total computational cost. Conversely, using too many minimizes the need for a fine search, as a k-d tree search alone becomes sufficient. Therefore, determining the optimal number of is crucial for balancing efficiency and accuracy.
Table 1 illustrates this trade-off, highlighting the balance between the two processes. Specifically, when more than 40 PCs are used, the fine search step becomes redundant. In our method, 16 PCs were selected as the optimal number, minimizing the total computational cost.
To compare the performance of each algorithm, all test Raman spectra were evaluated, and the results are presented in
Table 2. The number of
used in the algorithm was consistent with the optimal number of
determined in the previous study [
15].
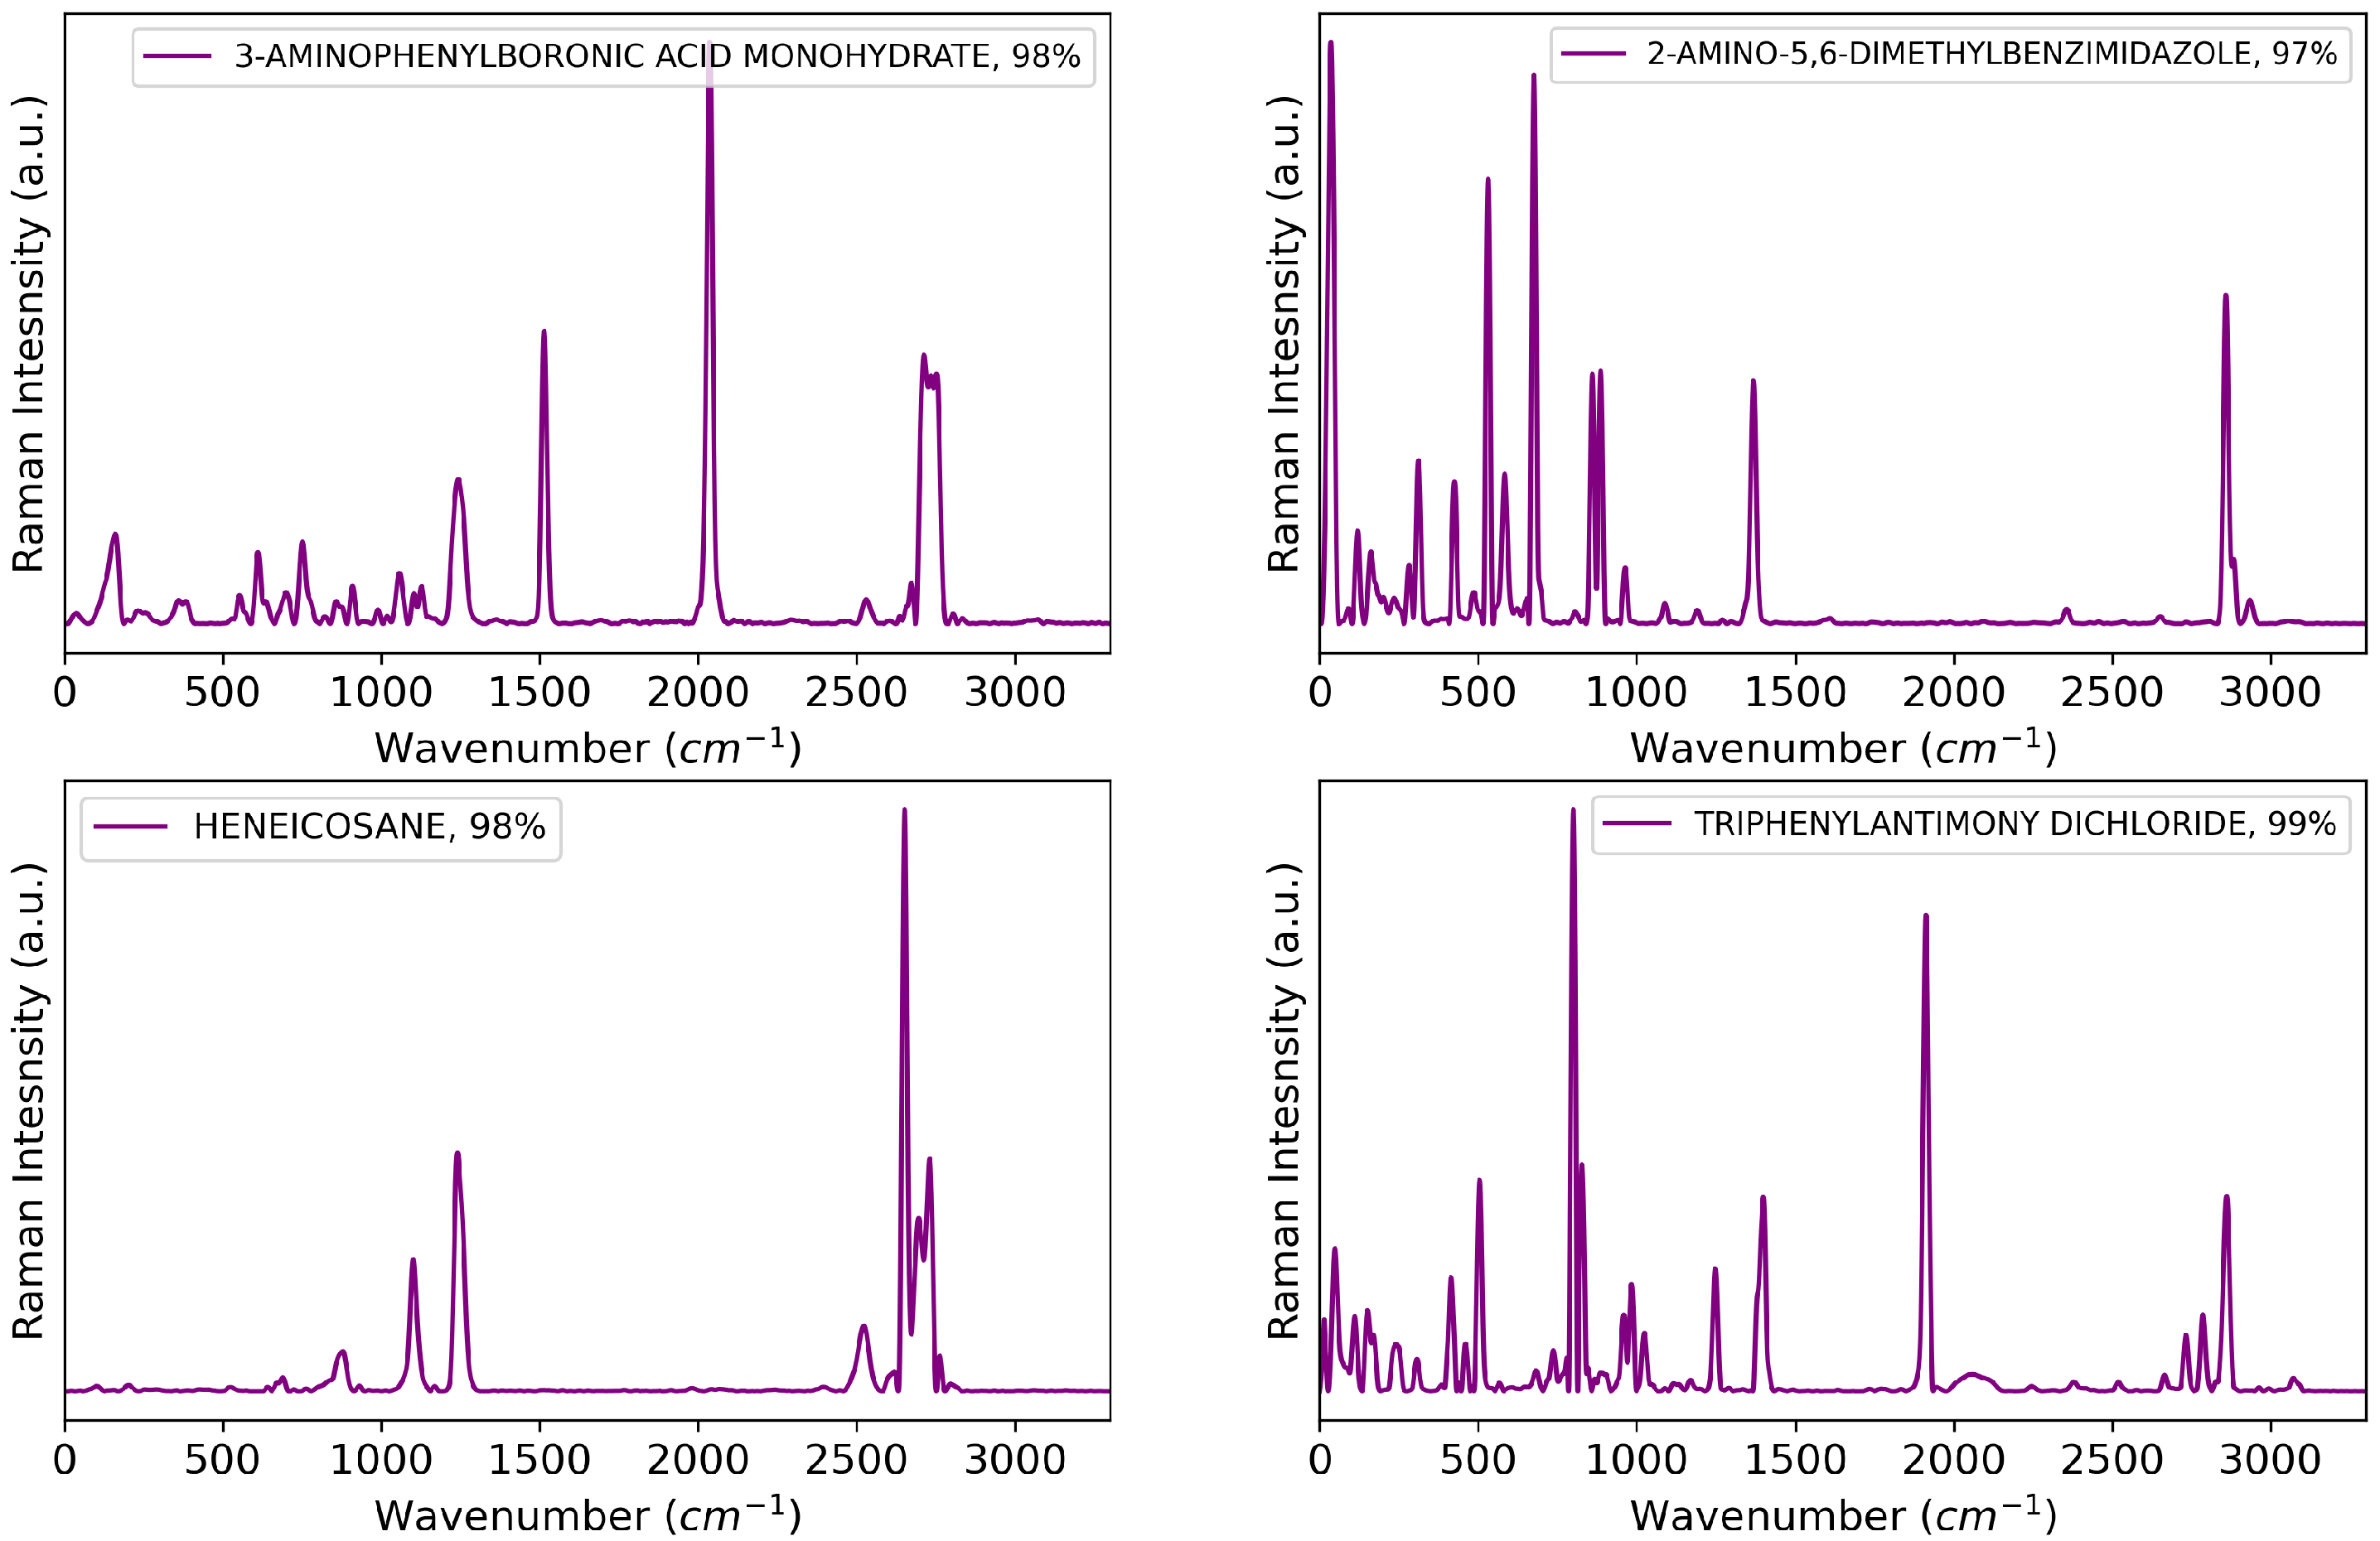
The full search +
method achieved a performance improvement of 80.97% compared to the existing full search method. When
was applied, a performance improvement of 92.62% was observed. Furthermore, the
method, which constructs a cluster tree using 80 PCs, achieved a performance improvement of 47.57%, and the
+
algorithm, which introduces a pilot search to find a better initial spectrum, achieved a performance improvement of 34.78%. The overall average results of the main algorithms are shown in
Figure 5.
5. Conclusions
In this paper, we propose a novel search method to enhance search speed for spectrum identification. A running average filter is applied to suppress noise, improving the efficiency of . By reducing data dimensionality through , the computational complexity of distance calculations is significantly decreased. The k-d tree is constructed using these reduced-dimensional . Since this approach does not inherently guarantee identical results to a full search, a fine search step is incorporated to ensure accuracy equivalent to that of a full search.
The optimal parameters for the proposed method were investigated and experimentally determined. The experimental results demonstrate that the proposed method significantly outperforms existing methods in terms of the number of required additions and multiplications, offering substantial improvements over traditional approaches. However, the fine search stage of the proposed algorithm necessitates additional storage to store the distances between spectra and their corresponding indices.
Consequently, the proposed method is particularly well suited for environments with limited computational power but sufficient memory resources. Deep learning techniques used for spectrum identification typically require extensive datasets, making them challenging to apply to library data containing only a single sample per type. In contrast, the proposed method is expected to be effective for retrieval problems in library datasets with only one spectrum per type.


