
LLM-Augmented Linear Transformer–CNN for Enhanced Stock Price Prediction

 , , , and
Abstract
1. Introduction
- We design and implement a Linear Transformer–CNN model that uses an LLM to enhance the dataset, effectively integrating both market data and images generated from the market data.
- We apply a large language model (LLM) for financial technical analysis, using it to enrich the dataset by generating more refined and accurate technical indicators.
- We evaluate the model on the S&P 500 stock dataset from 2022 to 2023, demonstrating improved accuracy compared to existing models.
2. Related Work
2.1. Traditional Machine Learning Models for Stock Prediction
2.2. Deep Learning Methods for Stock Prediction
2.3. Stock Prediction with Large Language Models (LLMs)
3. Materials and Methods
3.1. Data Preparation
3.2. Data Preprocessing
3.2.1. Standardization and Normalization
3.2.2. Standardization
3.2.3. Normalization
3.2.4. Handling Missing Values
3.2.5. Time-Series Stabilization
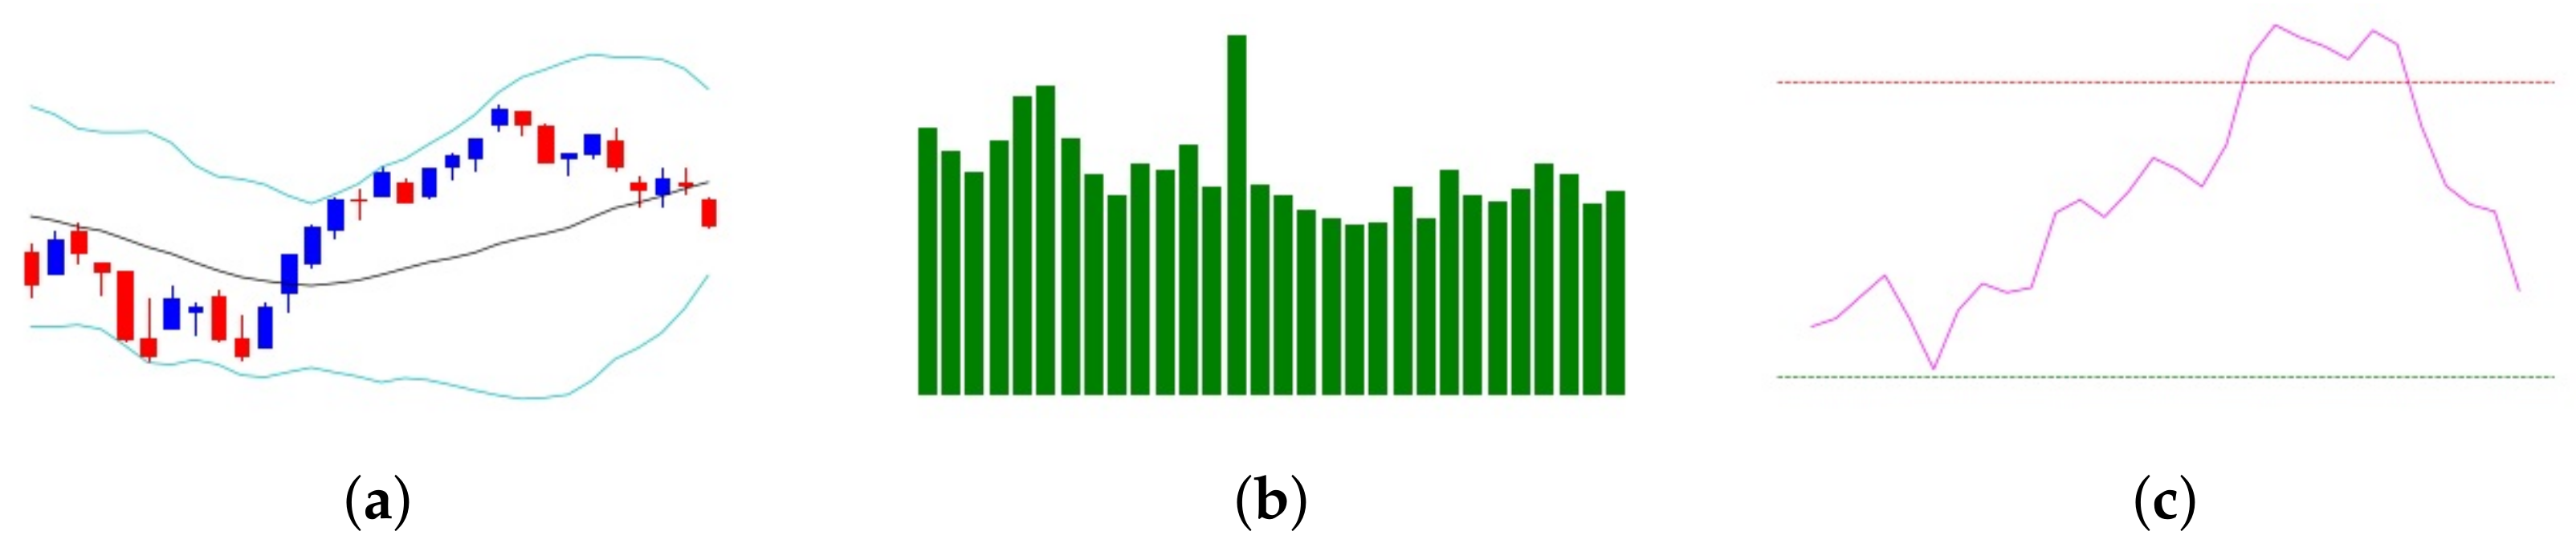
3.3. Stock Image Data Representation
- The SMA smooths out price fluctuations, making long-term trends visually apparent and reducing the impact of short-term noise.
- Bollinger Bands encapsulate price volatility, with the upper and lower bands acting as dynamic support and resistance levels, highlighting potential overbought or oversold conditions.
- The RSI, plotted as a separate oscillator, quantifies momentum shifts and provides a clearer perspective on market extremes.
- Breakouts or reversals often visible at Bollinger Band boundaries, indicating potential price movements.
- Momentum shifts highlighted by RSI crossovers, providing signals for market entry or exit.
- Trend continuity or divergence seen in SMA trajectories, aiding in the confirmation of trend strength or reversals.
3.4. LLM Prompt Engineering
You are a professional financial analyst. Based on the provided dataset containing technical indicators (SMA, EMA, RSI, MACD, Bollinger Bands), analyze each trading day. For each date, output: (1) the date; (2) an analysis of whether the market shows overbought or oversold signals, bullish or bearish momentum, and any notable price volatility based on Bollinger Bands.
- Identification of daily market trends (e.g., bullish or bearish).
- Insights into volatility and momentum based on technical indicators.
- Evaluation of key support and resistance levels for the day.
- Recommendations for potential trading strategies.
- Date: The specific trading day being analyzed.
- Analysis: A textual summary of the market conditions based on technical indicators.
3.5. Vectorization of Textual Insights
- Tokenizing the daily analyses using FinBERT’s tokenizer to ensure compatibility with the model architecture.
- Extracting the CLS token embedding for each report, representing the overall text.
- Aggregating the embeddings into a NumPy array for efficient storage and integration into the predictive pipeline.
3.6. Advantages of LLM and Prompt Engineering
- Consistency: Ensured uniform analytical outputs for all trading days, improving interpretability by aligning generated results with standard financial analysis methodologies.
- Actionable Insights: Generated concise and expert-level textual explanations of market conditions by leveraging structured prompts to analyze technical indicators (e.g., SMA, RSI, Bollinger Bands), aiding in better decision-making.
- Enhanced Dataset Representation: Integrated LLM-generated textual features with numerical and technical indicators, enriching the dataset for predictive analysis by providing multi-dimensional perspectives on market conditions.
- Reduced Noise and Improved Reproducibility: Compared to traditional methods of collecting information from social media, which often involve noisy sentiment variability, LLM-generated analyses were shown to be more consistent and reproducible across repeated runs, ensuring reliable inputs for downstream predictive models. Research has shown that social media platforms often amplify noise due to inconsistent or emotionally driven posts from traders, whose sentiments can fluctuate widely based on market rumors or short-term events [24].
3.7. Enhanced Dataset for Prediction
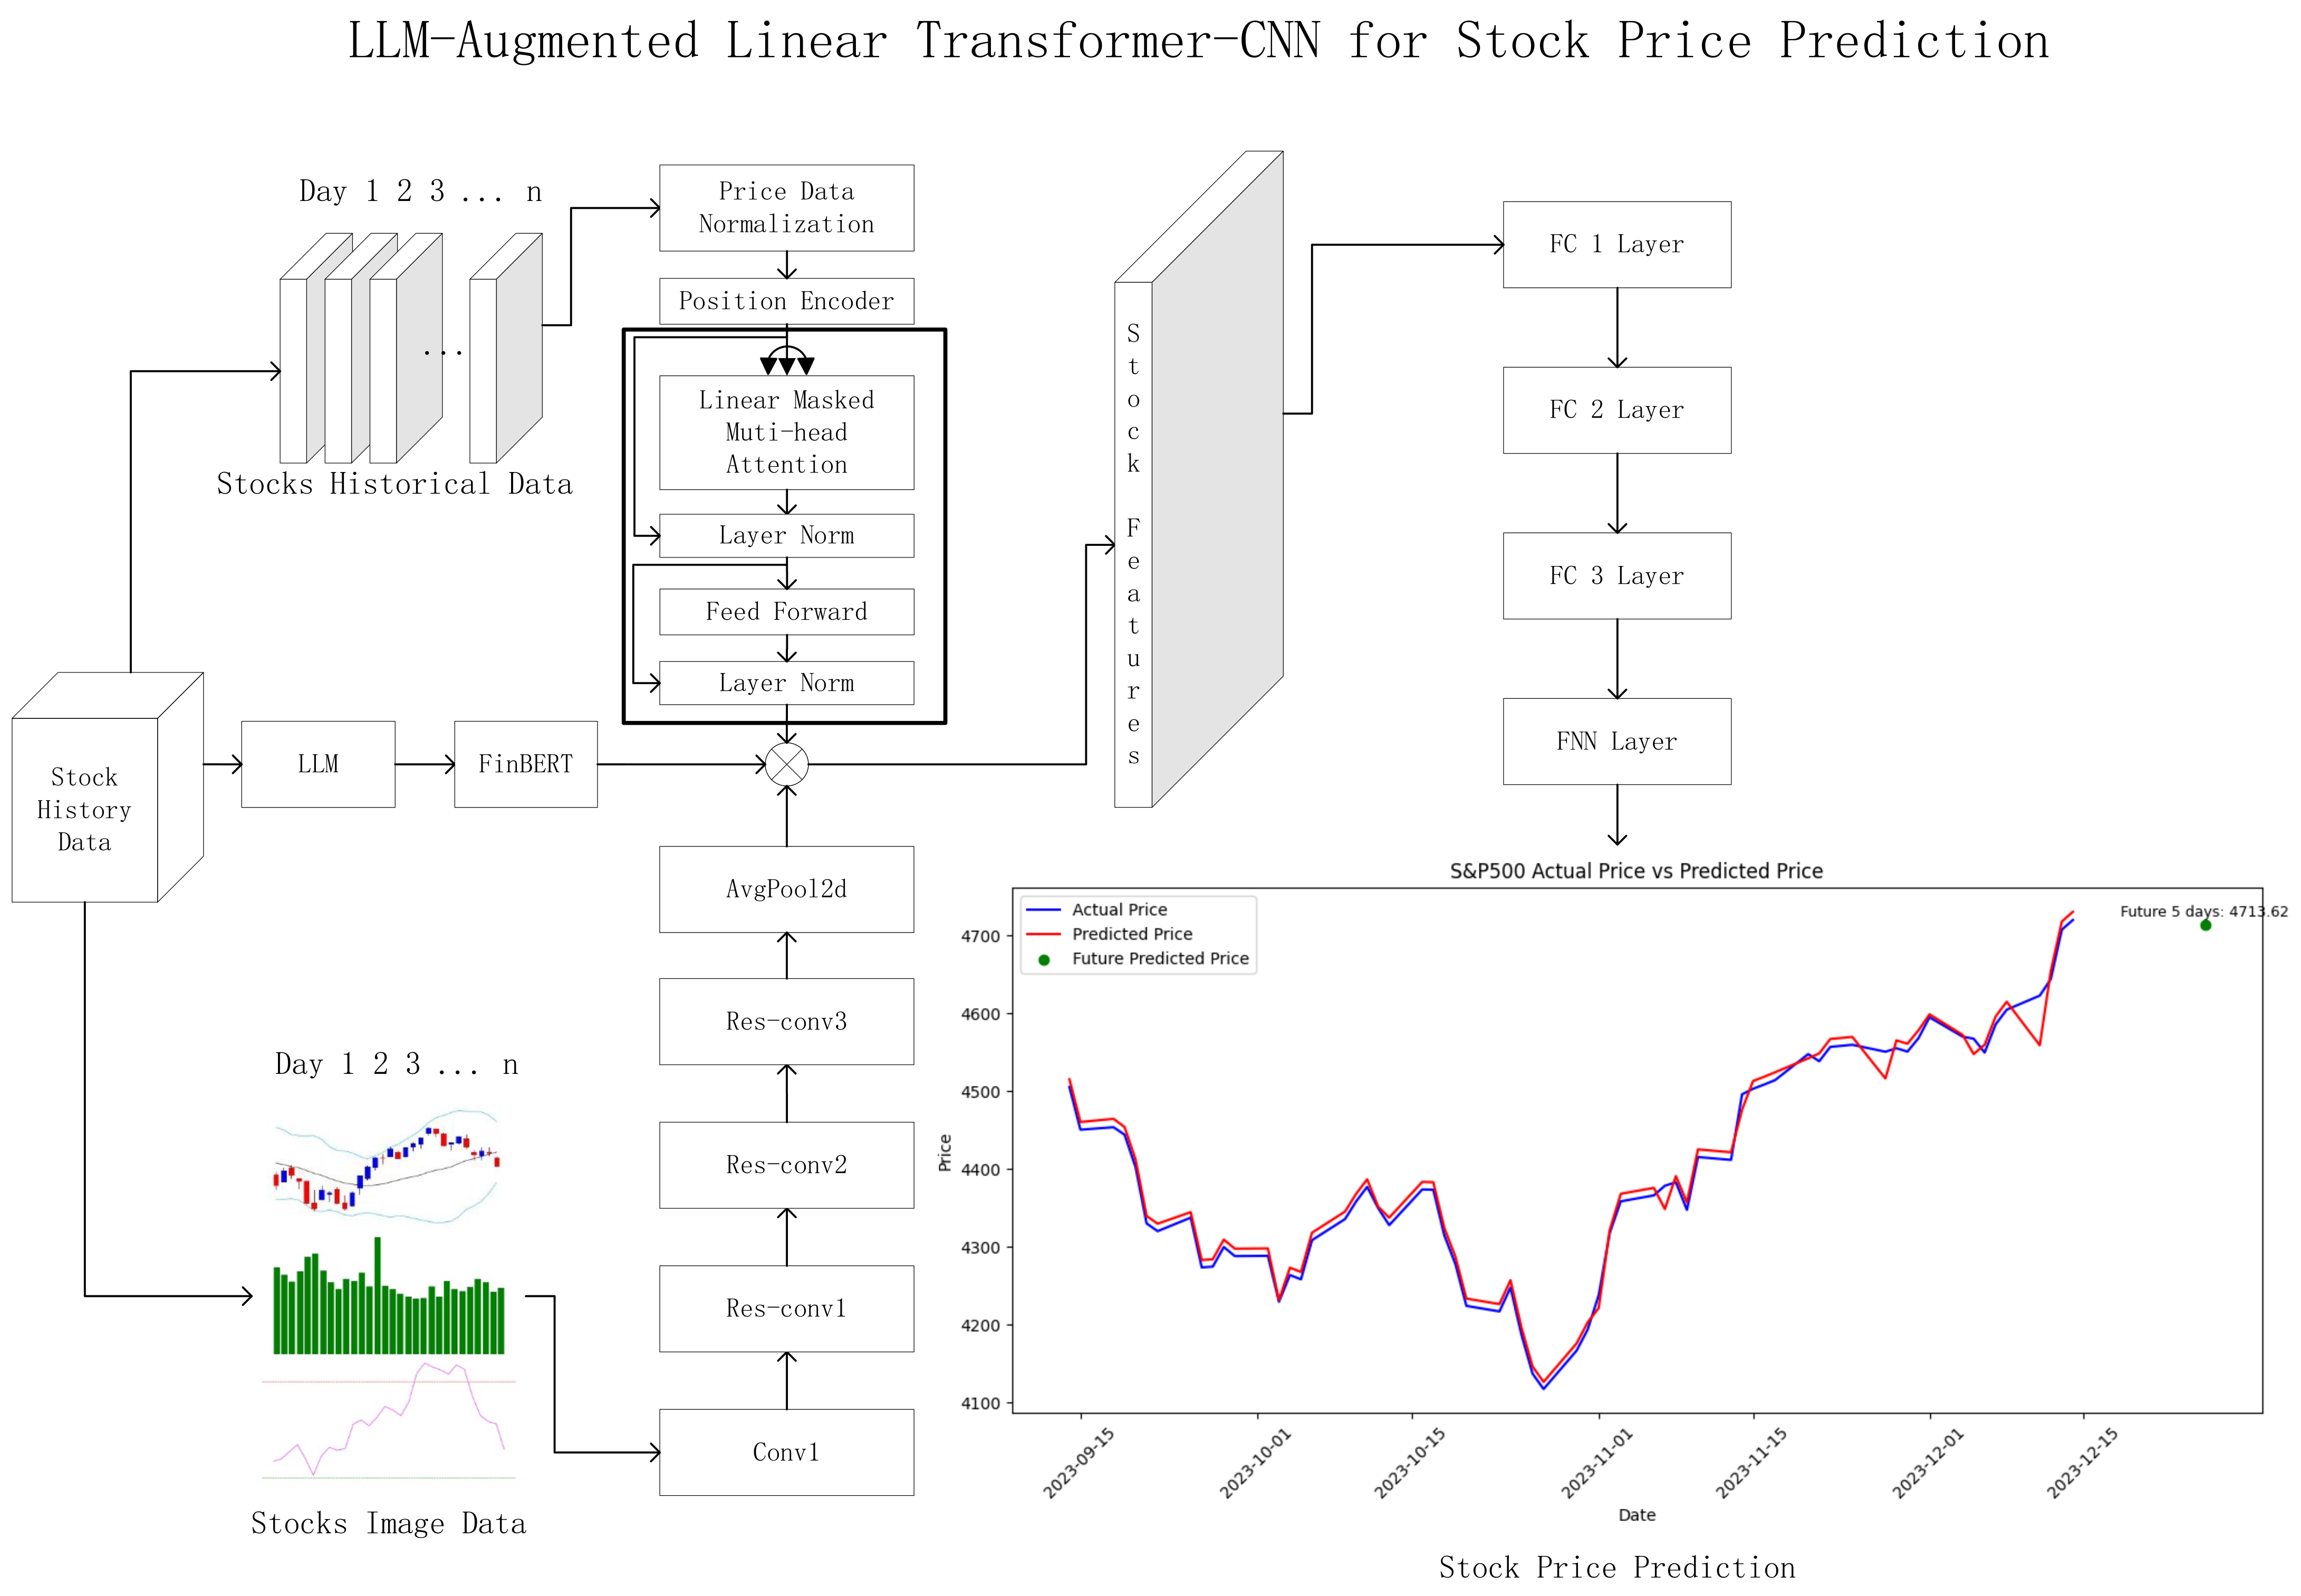
3.8. Stock Prediction Model Framework
- Time-Series Branch: This branch leverages the Linear Transformer model to process historical stock price data. Unlike the standard Transformer, which relies on softmax-based attention, the Linear Transformer approximates the self-attention mechanism using a kernel function to improve computational efficiency while maintaining long-range dependencies in the sequence. Positional encoding is still applied to capture temporal patterns in the stock data.The linearized self-attention mechanism is defined as follows:where Q, K, and V represent the query, key, and value matrices, respectively. is the kernel function that ensures non-negative attention values.The kernel function used in the Linear Transformer is defined as follows:where ϵ is a small constant to avoid division by zero, ensuring stable numerical computations.Multi-head attention is employed to capture relationships across different representations:where each attention head is computed asResidual connections and layer normalization are applied to the output of each layer to avoid gradient issues:After passing through a feed-forward network,The final representation is obtained after applying another layer normalization:
- LLM for Daily Analysis and FinBERT for Embedding: To enhance the quality of the input features, we employ ChatGPT4o as a professional financial analyst to produce daily summaries of the stock market. Each summary provides an in-depth analysis based on technical indicators such as MA, RSI, and BB. The LLM-generated analysis focuses on identifying market trends, potential support and resistance levels, and trading opportunities for each day.The daily textual analysis is then transformed into numerical vectors using FinBERT, a pre-trained transformer model designed for financial analysis. FinBERT processes the LLM-generated text and extracts contextual embeddings using its [CLS] token representation. These embeddings capture nuanced financial insights and are integrated as additional features into the overall prediction framework.The workflow for integrating LLM and FinBERT is as follows:
- –
- ChatGPT4o analyzes the calculated technical indicators from the stock dataset, acting as a professional financial analyst. Based on this analysis, it generates detailed daily textual summaries.
- –
- The generated summary is passed through FinBERT to produce vectorized embeddings, which represent the contextual analysis of the stock market for each day.
- –
- These embeddings are concatenated with the output from the Linear Transformer and SC-CNN branches to create a unified feature representation.
- Image Branch: The SC-CNN (Stock Chart-CNN) branch is responsible for extracting image features from candlestick charts, which include Bollinger Bands and moving averages. This branch is inspired by the work of [23]; it utilizes a modified convolutional neural network (CNN) optimized for stock chart images. Inspired by the ResNet architecture, we employ residual learning and a bottleneck structure to address the challenges of overfitting and the vanishing gradient problem, which are common when deepening networks.The residual learning mechanism uses shortcut connections to bypass certain layers, ensuring smoother gradient flow during backpropagation. This is formalized aswhere is the output of the residual block, is the learned function, and X is the input. By setting the residual to zero initially, optimization becomes easier, allowing the network to learn more efficiently as the depth increases.Furthermore, a bottleneck structure is employed to reduce the time complexity and the number of parameters, while still enhancing the network’s ability to extract features. The bottleneck block consists of three convolutional layers: 1 × 1, 3 × 3, and 1 × 1 filters. This configuration significantly increases the number of feature maps and reduces computational costs.The SC-CNN (Stock Chart-CNN) model uses four convolutional layers, followed by residual blocks (res-conv1, res-conv2, and res-conv3), all optimized for stock chart images. The input stock chart images are resized to 112 × 112 pixels. The architecture includes the following key components:
- –
- Conv1: Initial convolutional layer for basic feature extraction.
- –
- Residual Blocks (res-conv1, res-conv2, res-conv3): These blocks apply the residual learning technique, allowing deeper layers without suffering from degradation or overfitting issues.
- –
- Fully Connected Layers (fc1, fc2, fc3): Following the convolutional layers, fully connected layers perform the final regression or classification tasks, using features extracted by the convolutional and residual blocks.
We modify the original ResNet-50 architecture by adjusting hyperparameters such as the number of convolutional layers and neurons in fully connected layers, and applying a suitable dropout ratio. The resulting SC-CNN is optimized for stock chart data, maintaining adequate depth while avoiding overfitting. The final extracted feature map from the SC-CNN branch is concatenated with the output from the Transformer branch. - Fusion and Prediction:Once the outputs from all three branches—the Linear Transformer branch, the SC-CNN branch, and the FinBERT embedding branch—are obtained, we concatenate their final representations into a unified feature vector. Specifically,
- –
- The final representation from the Linear Transformer branch, which captures temporal patterns from the stock price data and has dimensions .
- –
- The feature vector from the SC-CNN branch, which extracts spatial features from the stock chart images and has dimensions .
- –
- The FinBERT-generated embeddings, which encode contextual and sentiment-based insights from the LLM-generated daily analysis and have dimensions .
The concatenated feature vector, with a total size of , integrates these diverse modalities, creating a comprehensive representation of the stock market data. This unified representation is then passed through a series of fully connected layers for the final prediction. The architecture of the fully connected layers is as follows:- –
- FC1: A dense layer with 500 neurons, followed by a ReLU activation function to model complex interactions between the fused features.
- –
- FC2: A dense layer with 100 neurons and ReLU activation, further refining the feature representation.
- –
- FC3: A dense layer with 25 neurons and ReLU activation, reducing the feature dimension while retaining essential predictive signals.
- –
- Output Layer: A single-neuron output layer for regression, predicting the future stock price.
The number of neurons in each fully connected layer was determined empirically to balance model complexity and computational efficiency. To optimize the model, the Huber Loss function is employed, defined as follows:where represents the actual stock price, is the predicted stock price, and δ is chosen based on cross-validation to balance sensitivity and robustness. The Huber Loss is chosen for its ability to handle financial data anomalies effectively.Dropout layers with a rate of 0.5 are applied after each fully connected layer to prevent overfitting. Early stopping is employed during training, monitoring the validation loss with a patience parameter of 10 epochs. This fusion approach effectively combines temporal, visual, and textual information, enabling the model to capture complex patterns and relationships within the stock market data.
4. Experiments
4.1. Experimental Settings
4.2. Compared Baselines
- LSTM-only: An LSTM model trained solely on stock market data. LSTM models are widely used for time-series prediction due to their ability to capture long-term dependencies in sequential data.
- Transformer-only: A Transformer model trained solely on stock market data. Transformers are known for their strong performance in capturing global dependencies in sequential data through attention mechanisms.
- Linear Transformer: A Linear Transformer model trained on stock market data. Linear Transformers offer a computationally efficient alternative to traditional Transformers by approximating the attention mechanism while maintaining competitive performance.
- LSTM-CNN: A combined LSTM and CNN model that utilizes both image data (e.g., candlestick charts) and stock market data for stock prediction. This hybrid approach leverages the temporal modeling capability of LSTMs and the feature extraction strength of CNNs.
- Transformer–CNN: A combined Transformer and CNN model trained on both image data and stock market data. This model combines the global attention capabilities of Transformers with the spatial feature extraction power of CNNs, making it well suited for multi-modal data analysis.
4.3. Evaluation Metrics
- Root Mean Squared Error (RMSE): RMSE, as the square root of MSE, maintains the same unit as the target variable and is particularly useful for penalizing large deviations.
- Mean Absolute Percentage Error (MAPE): MAPE measures the average absolute percentage difference between predicted () and actual values (), providing an error measure relative to the actual values. It is useful for understanding model accuracy in percentage terms.
- Mean Absolute Error (MAE): MAE computes the average magnitude of errors, treating all deviations equally. It is more robust to outliers than MAPE.
4.4. Overall Performance Comparison
- LSTM and Transformer Models: Both models are trained exclusively on historical time-series data. While the Transformer significantly outperforms the LSTM model (with an RMSE of 25.74 compared to 35.48), both models fail to fully capture spatial and contextual features that could further improve predictive accuracy. The Transformer’s better performance highlights its strength in modeling temporal dependencies in financial data.
- Linear Transformer Model: The Linear Transformer improves upon the standard Transformer with an RMSE of 19.03, MAPE of 0.00357, and MAE of 14.81. This demonstrates the efficiency of linearized self-attention in capturing long-term dependencies in historical stock data, offering a more computationally efficient alternative for time-series modeling.
- LSTM-CNN Model: By combining LSTM and CNN, this model leverages both time-series and spatial data, resulting in better performance compared to standalone LSTM. However, with an RMSE of 53.05 and MAE of 19.94, it is less effective at capturing the interactions between time-series and spatial patterns, highlighting the need for more advanced architectures.
- Transformer–CNN Model: This model integrates a standard Transformer with a CNN, leveraging both historical time-series and spatial data. Although it demonstrates improved performance over the LSTM-CNN model, achieving an RMSE of 30.90 and MAE of 27.49, it still struggles to match the performance of models incorporating more efficient self-attention mechanisms, such as the Linear Transformer.
- Linear Transformer–CNN (Ours): Our proposed Linear Transformer–CNN model achieves the best performance across all metrics, with an RMSE of 13.74, MAPE of 0.00249, and MAE of 11.03. This superior performance highlights the effectiveness of integrating motif-based subgraph structures with Linear Transformer and CNN architectures. The Linear Transformer efficiently captures long-term dependencies in time-series data, while CNN excels at extracting spatial features from stock chart images. This hybrid approach outperforms all baselines, proving its robustness and adaptability for stock price prediction tasks.
5. Discussion
5.1. Strengths of the Proposed Framework
5.2. Limitations and Challenges
- Dependence on High-Quality Input Data: The framework relies heavily on the quality of technical indicators, candlestick chart images, and LLM-generated analyses. Errors or inconsistencies in data preprocessing or prompt design for the LLM may adversely affect the model’s performance.
- Computational Complexity: Although the Linear Transformer reduces the computational burden compared to standard Transformers, the overall framework, including CNNs and LLM-based analysis, remains resource-intensive. Training such a hybrid model requires significant computational resources, which may limit its applicability in real-time scenarios.
- Limited External Factors: The model focuses primarily on historical market data, technical indicators, and LLM-generated interpretations, excluding external factors such as news sentiment, macroeconomic data, and geopolitical events, which can have significant impacts on stock prices.
- Interpretability: While the framework provides accurate predictions, its complexity may hinder interpretability. Understanding how each component contributes to the final prediction requires further exploration, particularly for practical deployment in financial decision-making.
5.3. Future Directions
- Error Analysis in Overpricing and Underpricing Scenarios: Conducting an in-depth error analysis in overpricing and underpricing scenarios could help identify systematic biases in predictions. This would provide valuable insights for developing trading strategies that are tailored to specific market conditions, enhancing the practical utility of the framework.
- Incorporating External Information: Integrating external factors such as news sentiment, macroeconomic indicators, and geopolitical events can further enhance the framework’s predictive capability. For instance, combining structured LLM-generated insights with sentiment analysis from news articles could improve the model’s contextual understanding.
- Explainability: Implementing explainable AI (XAI) techniques to provide insights into the decision-making process of the model can improve trust and adoption in financial applications. For example, techniques such as SHAP (Shapley Additive Explanations) or attention-based visualizations can help analyze the contributions of individual features.
- Lightweight Models: Developing lightweight variants of the proposed framework can reduce computational overhead, enabling real-time predictions and wider applicability in resource-constrained environments.
- Robustness to Noisy Data: Investigating techniques to enhance the framework’s robustness against noisy or incomplete data, such as data augmentation or noise-tolerant algorithms, can improve its performance in real-world scenarios.
6. Conclusions
Author Contributions
Funding
Data Availability Statement
Conflicts of Interest
References
- Li, X.; Xie, Q.; Wang, J.; Ma, X. Multimodal learning for stock prediction based on joint textual and temporal data. IEEE Access 2020, 8, 125389–125401. [Google Scholar]
- Merello, J.; Nieto, J.I.; Corchado, J.M. Ensemble deep learning for financial trend prediction in trading decision support systems. Int. J. Comput. Intell. Syst. 2019, 12, 1257–1268. [Google Scholar]
- Wang, Y.; Zhao, G.; Luo, Y. Hierarchical attention networks for stock prediction with news and tweets. IEEE Access 2021, 9, 42600–42612. [Google Scholar]
- Li, H.; Li, H.; Wei, X.; Zhang, S. Stock market prediction based on stock-specific and market-driven attention networks. In Proceedings of the 34th AAAI Conference on Artificial Intelligence, New York, NY, USA, 7–12 February 2020; Volume 2, pp. 4644–4651. [Google Scholar]
- Feng, F.; He, X.; Tang, J.; Chua, T.-S. Enhancing Stock Movement Prediction with Adversarial Training. In Proceedings of the 27th ACM International Conference on Information and Knowledge Management (CIKM), Torino, Italy, 22–26 October 2018; pp. 1539–1548. [Google Scholar]
- Riva, F.; Tognollo, A.; Gardumi, F.; Colombo, E. Long-term energy planning and demand forecast in remote areas of developing countries: Classification of case studies and insights from a modelling perspective. Energy Strategy Rev. 2018, 20, 71–89. [Google Scholar] [CrossRef]
- Ince, H.; Trafalis, T.B. Short term forecasting with support vector machines and application to stock price prediction. Int. J. Gen. Syst. 2008, 37, 677–687. [Google Scholar] [CrossRef]
- Wang, S.; Li, G.; Bao, Y. A novel improved fuzzy support vector machine based stock price trend forecast model. arXiv 2018, arXiv:1801.00681. [Google Scholar]
- Panwar, B.; Dhuriya, G.; Johri, P.; Yadav, S.S.; Gaur, N. Stock market prediction using linear regression and SVM. In Proceedings of the 2021 International Conference on Advance Computing and Innovative Technologies in Engineering (ICACITE), Greater Noida, India, 4–5 March 2021; pp. 629–631. [Google Scholar]
- Hochreiter, S.; Schmidhuber, J. Long Short-Term Memory. Neural Comput. 1997, 9, 1735–1780. [Google Scholar] [CrossRef] [PubMed]
- Yadav, K.; Yadav, M.; Saini, S. Stock values predictions using deep learning-based hybrid models. Financ. Innov. 2021, 14, 112–124. [Google Scholar] [CrossRef]
- Vaswani, A.; Shazeer, N.; Parmar, N.; Uszkoreit, J.; Jones, L.; Gomez, A.N.; Kaiser, Ł.; Polosukhin, I. Attention is all you need. In Advances in Neural Information Processing Systems; Neural Information Processing Systems Foundation, Inc. (NeurIPS): La Jolla, CA, USA, 2017; pp. 6000–6010. [Google Scholar]
- Bao, W.; Yue, J.; Rao, Y. A deep learning framework for financial time series using stacked autoencoders and long short-term memory. Neurocomputing 2017, 260, 50–60. [Google Scholar] [CrossRef] [PubMed]
- Cheng, J.; Huang, J.; Wu, C. A novel attention-based LSTM model for stock price prediction. IEEE Access 2018, 6, 72832–72840. [Google Scholar]
- Sun, X.; Zhang, Y.; Chen, F. ARIMA-LSTM hybrid model for stock price prediction. J. Comput. Appl. Math. 2018, 348, 341–356. [Google Scholar]
- Liu, J.; Li, Y.; Zhou, H. Corporate knowledge graph embedding and its application in stock price prediction. J. Financ. Eng. 2019, 6, 1–23. [Google Scholar]
- Jiang, W. Applications of deep learning in stock market prediction: Recent progress. J. Financ. Eng. 2021, 5, 133–155. [Google Scholar] [CrossRef]
- Brown, T.; Mann, B.; Ryder, N.; Subbiah, M.; Kaplan, J.D.; Dhariwal, P.; Neelakantan, A.; Shyam, P.; Sastry, G.; Askell, A.; et al. Language models are few-shot learners. In Advances in Neural Information Processing Systems; Neural Information Processing Systems Foundation, Inc. (NeurIPS): La Jolla, CA, USA, 2020; pp. 1877–1901. [Google Scholar]
- Li, Y.; Wang, H.; Chen, D. FinBERT-LSTM: Deep learning-based stock price prediction using news sentiment analysis. arXiv 2022, arXiv:2211.07392. [Google Scholar]
- Zhang, C.; Liu, S.; Jiang, Y. Enhancing few-shot stock trend prediction with large language models. arXiv 2022, arXiv:2407.09003. [Google Scholar]
- Paduri, A.R.; Darapaneni, N.; Sharma, H. Stock price prediction using sentiment analysis and deep learning for Indian markets. arXiv 2022, arXiv:2204.05783. [Google Scholar]
- Zhu, P.; Li, Y.; Song, J. LSR-IGRU: Stock trend prediction based on long short-term relationships and improved GRU. arXiv 2024, arXiv:2409.08282. [Google Scholar]
- Kim, T.; Kim, H.Y. Forecasting stock prices with a feature fusion LSTM-CNN model using different representations of the same data. PLoS ONE 2019, 14, e0212320. [Google Scholar] [CrossRef] [PubMed]
- Bollen, J.; Mao, H.; Zeng, X. Twitter mood predicts the stock market. J. Comput. Sci. 2011, 2, 1–8. [Google Scholar] [CrossRef]

| Method | RMSE | MAPE | MAE |
|---|---|---|---|
| LSTM | 35.48246 | 0.00852 | 35.41428 |
| Transformer | 25.74058 | 0.00473 | 19.67997 |
| Linear Transformer | 19.02579 | 0.00357 | 14.80893 |
| LSTM-CNN | 53.04961 | 0.00484 | 19.93675 |
| Transformer–CNN | 30.90289 | 0.00659 | 27.49392 |
| Linear Transformer–CNN | 13.73599 | 0.00249 | 11.0302 |
| % Improvement over feat. | 61.3% | 70.8% | 68.9% |
Disclaimer/Publisher’s Note: The statements, opinions and data contained in all publications are solely those of the individual author(s) and contributor(s) and not of MDPI and/or the editor(s). MDPI and/or the editor(s) disclaim responsibility for any injury to people or property resulting from any ideas, methods, instructions or products referred to in the content. |
© 2025 by the authors. Licensee MDPI, Basel, Switzerland. This article is an open access article distributed under the terms and conditions of the Creative Commons Attribution (CC BY) license (https://creativecommons.org/licenses/by/4.0/).
Share and Cite
Zhou, L.; Zhang, Y.; Yu, J.; Wang, G.; Liu, Z.; Yongchareon, S.; Wang, N. LLM-Augmented Linear Transformer–CNN for Enhanced Stock Price Prediction. Mathematics 2025, 13, 487. https://doi.org/10.3390/math13030487
Zhou L, Zhang Y, Yu J, Wang G, Liu Z, Yongchareon S, Wang N. LLM-Augmented Linear Transformer–CNN for Enhanced Stock Price Prediction. Mathematics. 2025; 13(3):487. https://doi.org/10.3390/math13030487
Chicago/Turabian StyleZhou, Lei, Yuqi Zhang, Jian Yu, Guiling Wang, Zhizhong Liu, Sira Yongchareon, and Nancy Wang. 2025. "LLM-Augmented Linear Transformer–CNN for Enhanced Stock Price Prediction" Mathematics 13, no. 3: 487. https://doi.org/10.3390/math13030487
APA StyleZhou, L., Zhang, Y., Yu, J., Wang, G., Liu, Z., Yongchareon, S., & Wang, N. (2025). LLM-Augmented Linear Transformer–CNN for Enhanced Stock Price Prediction. Mathematics, 13(3), 487. https://doi.org/10.3390/math13030487