Article

An Optimized Weighted-Voting-Based Ensemble Learning Approach for Fake News Classification

by
Muhammad Shahzaib Toor
1,2,†,
Hooria Shahbaz
1,3,
Muddasar Yasin
4,
Armughan Ali
1,4,*,
Norma Latif Fitriyani
5,†,
Changgyun Kim
6,* and
Muhammad Syafrudin
5,*
1
Applied INTelligence Lab (AINTLab), Seoul 05006, Republic of Korea
2
Information Technology, University of Gujrat, Gujrat 50700, Pakistan
3
Department of Computer Science, HITEC University, Taxila 47080, Pakistan
4
Department of Electrical Engineering, Wah Engineering College, University of Wah, Wah Cantt 47040, Pakistan
5
Department of Artificial Intelligence and Data Science, Sejong University, Seoul 05006, Republic of Korea
6
Department of Artificial Intelligence & Software, Kangwon National University, Samcheok 25913, Republic of Korea
*
Authors to whom correspondence should be addressed.
These authors contributed equally to this work.
Mathematics 2025, 13(3), 449; https://doi.org/10.3390/math13030449
Submission received: 2 January 2025 / Revised: 21 January 2025 / Accepted: 27 January 2025 / Published: 28 January 2025
(This article belongs to the Section D2: Operations Research and Fuzzy Decision Making)

Abstract

:
The emergence of diverse content-sharing platforms and social media has rendered the dissemination of fake news and misinformation increasingly widespread. This misinformation can cause extensive confusion and fear throughout the populace. Confronting this dilemma necessitates an effective and accurate approach to identifying misinformation, an intrinsically intricate process. This research introduces an automated and efficient method for detecting false information. We evaluated the efficacy of various machine learning and deep learning models on two separate fake news datasets of differing sizes via holdout cross-validation. Furthermore, we evaluated the efficacy of three distinct word vectorization methods. Additionally, we employed an enhanced weighted voting ensemble model that enhances fake news detection by integrating logistic regression (LR), support vector machine (SVM), gated recurrent unit (GRU), and long short-term memory (LSTM) networks. This method exhibits enhanced performance relative to previous techniques: 98.76% for the PolitiFact dataset and 97.67% for the BuzzFeed dataset. Furthermore, the model outperforms individual components, resulting in superior accuracy, precision, recall, and F1 scores. The enhancements in performance result from the ensemble method’s capacity to use the advantages of each base model, hence providing robust generalization across datasets. Cross-validation was employed to enhance the model’s trustworthiness, validating its capacity to generalize effectively to novel data.

1. Introduction

Social media has now become an integral part of both business strategies and daily life. More and more people are using these services to receive news and information rather than traditional media [1]. Nowadays, most mainstream events are shared on social media prior to being covered by media outlets such as television or radio. Because information spreads so quickly online, users rarely take the time to verify the accuracy of what they share. It is for this reason that social media often becomes an incubator for misinformation like rumors, hoaxes, or false reports. This spread of inaccurate information can affect people’s perception and reaction to actual news [2,3]. Misinformation flows widely across social networks in numerous channels and platforms. In contrast to centralized information sources seen as potentially leading to media bias, fake news remains a prominent problem that continues to grow [4,5,6].
The rate at which fake news has been spread in the last decade cannot be overlooked, especially the inflamed spread during the 2016 U.S. elections. The development of fake news and fake content has affected various fields in different subjects, not excluding sports, health, and even science [7]. Financial issues are another area that feels the impact, which can be disastrous when unverified information flow circulates the market. It emphasizes that our actions are a reflection of the flow of information that we receive and that flows through our heads about the world. Studies indicate that people have also responded in novel fashions to information that proved to be a scam at a later date [8,9]. A good example is the recent coronavirus pandemic, which has seen fake news broadly circulated about the virus’s source, nature, and behavior [10]. Hence, as this misinformation spread to more people, it deepened public panic. The main problem that persists today is identifying fake news amidst the enormous amount of content available.
Data on the World Wide Web come in different forms, such as documents, videos, and even audio files. The problem of identifying and categorizing text-based online news supplemented with unstructured media elements such as articles, videos, and audio is challenging and sometimes requires a human approach. Computational techniques, particularly NLP, provide the means of identifying contradictions that will allow for the differentiation between fake and genuine articles [1]. Another approach revolves around studying how fake news spreads contrary to real news on the networks [11]. This method asserts that the activity and diffusion of a fake news article on social media contain patterns that can help demarcate it from actual articles. Another approach also works well by analyzing the result of social reactions and text features to determine fake articles.
Current methods of identifying false news have limitations, such as scarce datasets and expensive computational processes. The most straightforward way to detect false news involves using a binary classification model, where a piece of information is determined to be either true or false. However, it cannot handle content that contains some truths and falsehoods. To address this, fake news detection can be transformed into a fine-grained multi-classification problem so that there would be multiple classes within the datasets. There are varying ground truths present in those datasets, which creates trouble while regressing because the direct transformation of ground truths into any number is problematic [12]. So, in that way, this need for creative methods is also growing with the advent of time. The major challenges in existing methodologies include the reliance on binary classification models, which struggle with content that mixes truths and falsehoods, the difficulty in handling scarce and imbalanced datasets, and the need for more advanced models to capture intricate semantic and contextual information. Additionally, many methods fail to effectively deal with the high computational costs of processing large volumes of data.
This paper aims to evaluate different classification methods in identifying fake news: logistic regression (LR) [13], support vector machine (SVM) [14], gated recurrent unit (GRU) [15], and long short-term memory (LSTM) networks [16]. To make the right decision about the input instance, we designed a weight voting model that synthesized the four classifiers, deciding the most appropriate output. The technical contributions of this study are as follows:
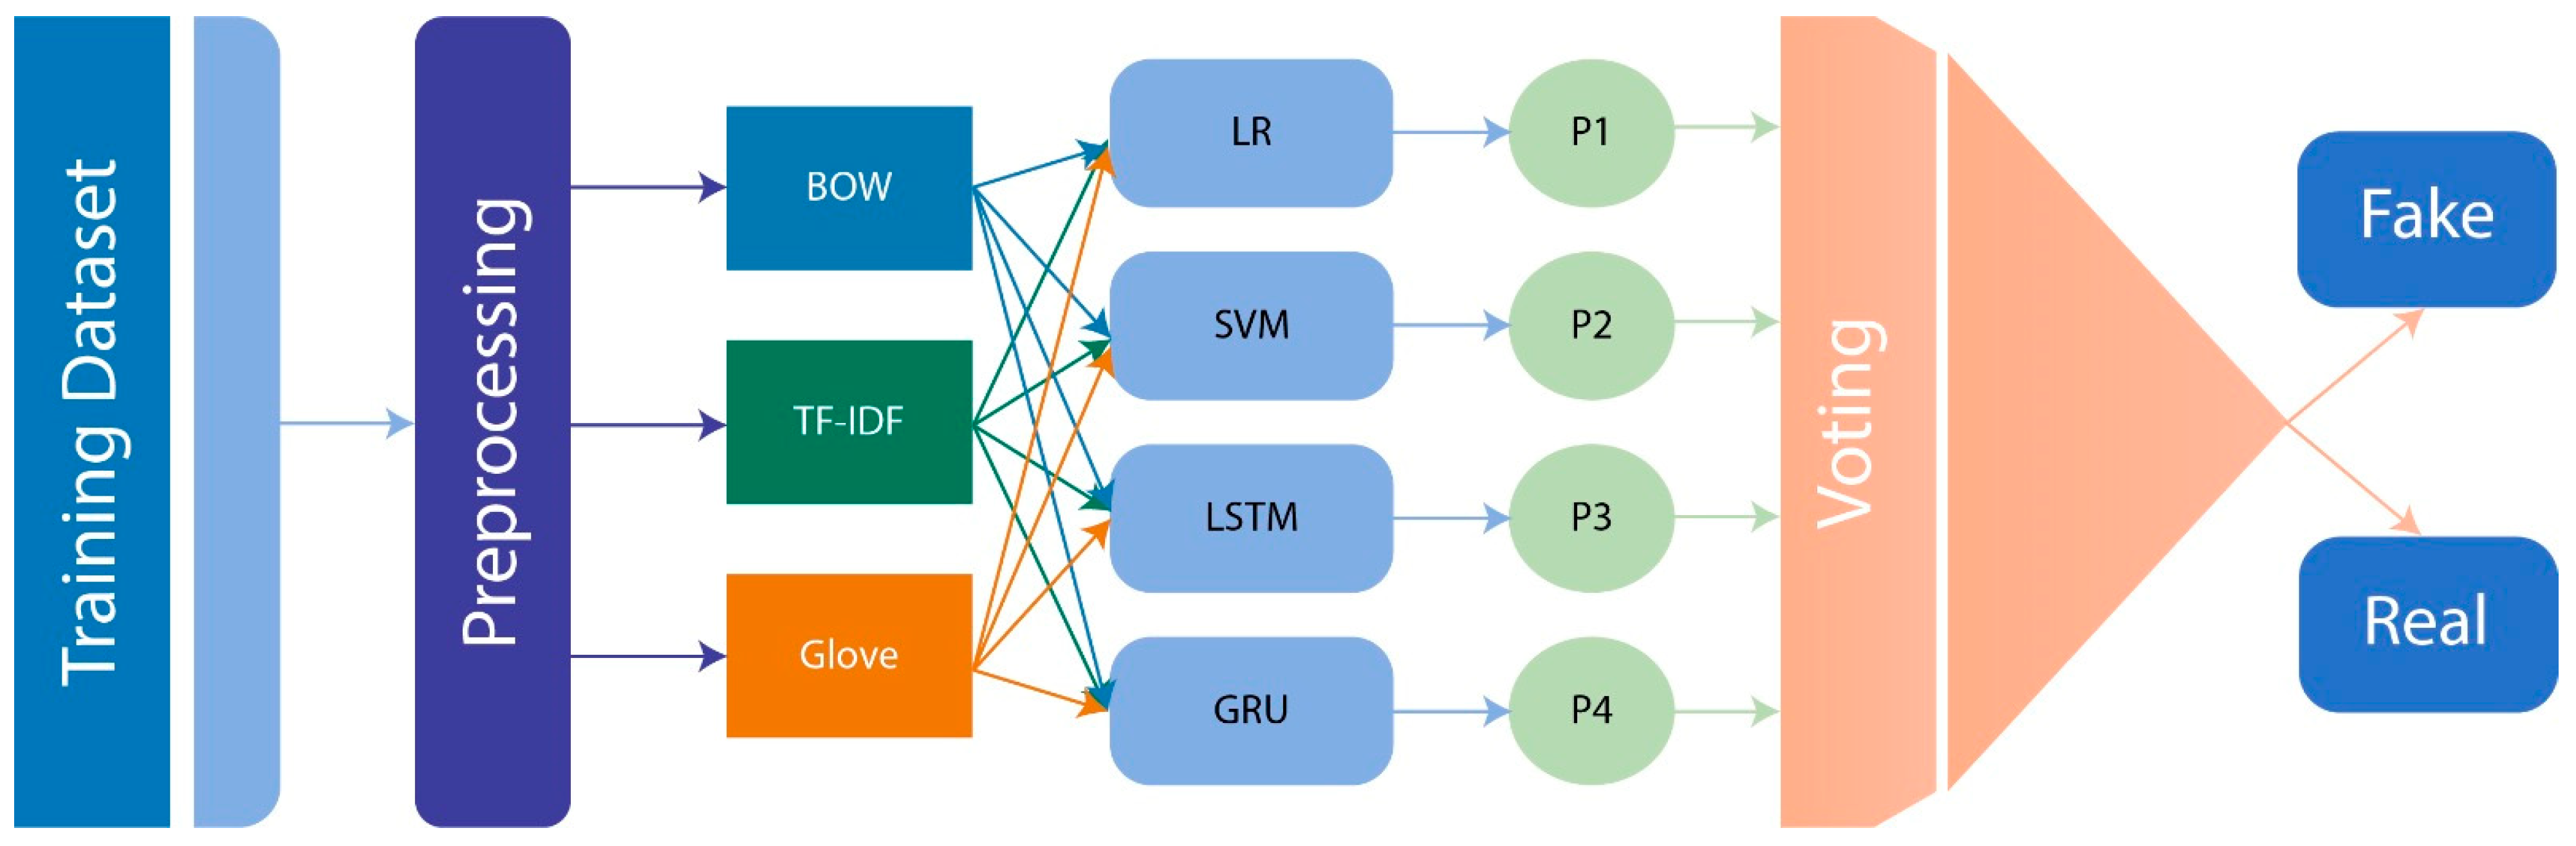
  • Introducing a weighted voting ensemble model combining LR, SVM, GRU, and LSTM for enhanced fake news detection.
  • Comparing text vectorization techniques such as Bag of Words, TF-IDF, and GloVe to identify the most effective representation.
  • Evaluating performance using metrics like accuracy, precision, recall, and F1-score, with hyperparameter tuning through Grid Search, achieving superior results.
For text vectorization, various techniques were compared, including Bag of Words, Term Frequency and Inverse Document Frequency (TF-IDF), and GloVe. Hyperparameter tuning and the choice of a model were made using the methods of Grid Search. Using evaluation indicators like accuracy, recall, F1-score, and precision, we evaluated the model’s performance, comparing it with the results of other methods described in recent studies. This paper overcomes the limitations of current approaches by addressing scarce datasets and computational complexity. Unlike traditional binary classification, our multi-classification approach captures varying ground truths more effectively. The weighted voting ensemble enhances flexibility and accuracy, while Bayesian optimization reduces computational costs and ensures better performance. This study provides a scalable, efficient solution for fake news detection.
The subsequent sections of this work are structured as follows. Section 2 outlines the prevailing research trends in diverse text classification methodologies. Section 3 delineates the suggested methodology based on ensemble learning. Section 4 delineates the experimental findings to illustrate the advantages of our methodology. Section 5 presents the conclusion and outlines further work.

2. Related Work

Numerous studies have predominantly concentrated on identifying and classifying misinformation on social media platforms, including Facebook and Twitter [17,18]. At a conceptual level, fake news is categorized into many categories; this understanding is subsequently utilized to generalize machine learning (ML) models across other domains [19,20,21]. The pros and cons of existing methodologies are summarized in Table 1.
Chi-Square faces problems with imbalanced datasets as it depends upon category distribution for accuracy and reliability [22]. The limitations of classic methods prompted the introduction of new metrics called Var-CV-CHI that base metrics on variance instead of standard deviation. Using datasets like Reuters-21578 and Chinese News Corpus, the method has shown better binary as well as multi-class classifications. Moreover, Osman et al. [23] presented an adapted Iterated Greedy Algorithm specifically for the task of sentiment classification in which effectiveness in relevant tasks is also demonstrated. Their methodology initiates with a minimal-dimensional feature vector and systematically eliminates a predetermined filter-based quantity of features employing the techniques of Information Gain for feature selection and Chi-Square. Multinomial Naive Bayes serves as a foundational categorization between sentiment analyses. Ahmad et al. [24] addressed the feature selection approach, which includes Term Frequency, Bag of Words, and TF-IDF.
Additionally, they covered three feature extraction strategies: Binary Salp Swarm Optimization, Binary Genetic Algorithm, and Binary Particle Swarm Optimization. In employing TF-IDF for feature extraction through Binary Salp Swarm Optimization, the highest level of accuracy observed was 74.5%, utilizing TF-IDF in feature extraction through the Binary Genetic Algorithm paired with K-Nearest Neighbor classification. Likewise, Too et al. [25] formulated an enhanced iteration of the Binary Dragonfly Algorithm, termed the Hyper Learning Binary Dragonfly Algorithm (HLBDA), which integrates both the optimal personal and global solutions to circumvent regional optima. Additionally, in [26], nine feature extraction approaches were used to diminish the spatiality of textual data. Thereafter, the authors calculated probability values for each individual; they analyzed KNN performance in classification, Multinomial Naive Bayes (MNB), and support vector machines (SVMs) on feature sets with sizes ranging from 10 to 500. Their ensemble approach, the “extensive feature selector”, performed better than individual feature selection methods, improving its results.
Noureddine Seddari et al. [5] presented an enhanced feature extraction approach incorporating linguistic and fact-verification features. Even though this model was relatively easy to test in terms of effectiveness relative to existing systems, it overlooked several significant features, possibly limiting its overall utility. Likewise, Eren Sahin et al. [27] suggested a technique for detecting fake news with the combination of LSTM and word embeddings combined with TF-IDF for extracting features from preprocessed data. Though the technique is reasonable and has high accuracy, it is restricted to some specific domains. Hence, the application of the approach is highly restricted. Also, a disentangled-representation-based framework of hierarchical contrastive learning proves its ability to detect fake news even with minimal training samples. However, in this approach, the complexity was found to be too computationally intensive for massive datasets [28]. Y. Zhou et al. [29] proposed a network use of two transformer-based pre-trained models for the token-level feature representation called the Multigrained Multimodal Fusion Network (MMFN). The network successfully resolved ambiguity, but the performance on large datasets was difficult to evaluate.
Zulqarnain and Saqlain [30] gave a detailed account of one of the most popular text classification approaches, providing an overview of current techniques and a valuable comparison of various methods with their results. Hassan et al. [31] carried out a comprehensive comparative analysis of machine learning algorithms for text classification to lay a strong groundwork for analytical research and progress in media analytics. Occhipinti et al. [32] provided a comprehensive overview of 12 machine learning models designed for fake news detection, which may help identify both the strengths and limitations of such models in media verification.
Tong and Koller [33] discussed the application of support vector machine (SVM) active learning for text classification, which is a valuable contribution to the field of active learning. Several other researchers have also proposed innovative approaches for fake news detection. In particular, many researchers in the area of fake news detection have proposed some compelling approaches. Surekha et al. [34] proposed a combination of WoT with Asian social networks in the integration process, aiming to improve feature extraction towards increasing the detection rate for digital misinformation, such as fake news in texts and images. Kurasinski and Mihailescu [35] explained the significance of focusing on explainability in text classification, especially in detecting fake news. Moreover, Bangyal et al. suggested novel deep learning models to track COVID-19-associated propaganda and hoaxes that generally emerge amidst public health outbreaks. Dubey et al. [36] developed an innovative computation technique called Vectorizing Machine Learning Techniques, combining vectorization and machine learning methods that yield a more robust solution.
E. SY et al. [37] previously identified key argument components in text and detected and classified relations between argument units. Traditional ML methods and BERT models addressed data imbalance and robust voting mechanisms to enhance consensus and prediction accuracy. Furthermore, they achieved a Macro-F1 score of 77.08% for unit identification and a Macro-F1 score of 57.90% for detection and classification.
R. Hoque et al. [38] showed that on a dataset with 1076 samples, data were classified from various sources like news articles, Facebook, YouTube, and other social media platforms. Confusion metrics were used for evaluation, and LSTM had the best accuracy at 92.01%.
M. Mhamed et al. [39] applied ML classifiers, RF and SVM, which performed the best among the other classifiers, achieving an accuracy of 82.00%. The DL models, BIGRU, CNN-LSTM, LSTM, and CNN, achieved accuracies of 88.10%, 89.30%, 89.85%, and 90.10%, respectively, in Experiment 2. Additionally, ANPS2 achieved an accuracy of 90.87%, and ANP5 achieved 90.33%. In Experiment 3, RMuBERT outperformed the baselines. Further testing of RMuBERT on various Arabic corpora with different classes, lengths, and sizes, including ArSarcasm (3C), STD (2C), AJGT (2C), and AAQ (2C), revealed accuracies of 77.76%, 91.79%, 94.07%, and 93.48%, respectively.
C.N. Hang et al. [40] introduced TrumorGPT, the novel generative artificial intelligence. Machine learning with natural language differentiates many tumors. TrumorGPT overcomes the “hallucination” issue common in LLMs. The latest knowledge graphs greatly enhance the efficiency of TrumorGPT in delivering accurate and reliable information. By training on a large set of datasets, TrumorGPT has performed well in Automated Fact-Checking.
Vallidevi Krishnamurthy et al. [41] worked on a significant solution to navigate manipulative claims, reducing the cognitive effort to distinguish fact from fabrication, breaking misinformation, and introducing the Yours Truly framework. This framework uses the FactStore database and checks the facts in real-time. Overall, they showed that this model achieved a very good F1 score of 94% with a precision of 75% and recall of 76%.
Table 1. Pros and cons of existing work.
AuthorMethodologyProsCons
Seddari et al. [5]Enhanced feature extraction with linguistic and fact-verification features.Easy to test; relative effectiveness compared to existing systems.Overlooks important features, possibly limiting its overall utility.
Chi-Square [22]Classic method for feature selection based on category distribution.Simple and well-understood technique for classification.Struggles with imbalanced datasets; dependent on category distribution for accuracy and reliability.
Osman et al. [23]Iterated Greedy Algorithm with feature selection via Information Gain and Chi-Square.Effective for sentiment classification, it uses minimal-dimensional feature vectors.Not ideal for larger datasets, and effectiveness may be reduced with more complex datasets.
Ahmad et al. [24]Feature selection using TF, Bag of Words, and TF-IDF with Binary Salp Swarm Optimization.Good accuracy for smaller datasets (74.5%) using TF-IDF and feature extraction.Limited scalability and lower accuracy on complex, large datasets.
Too et al. [25]Hyper Learning Binary Dragonfly Algorithm (HLBDA) for feature selection.Uses personal and global solutions to avoid local optima.Computationally intensive; may require significant resources.
Eren Sahin et al. [27]LSTM with word embeddings and TF-IDF for feature extraction.High accuracy in specific domains.Limited to specific domains; not generalized for other datasets.
Y. Zhou et al. [29]Multigrained Multimodal Fusion Network (MMFN) with transformer-based pre-trained models.Resolves ambiguity well in token-level feature representation.Performance on large datasets is difficult to evaluate and computationally expensive.
Zulqarnain and Saqlain [30]Overview of text classification techniques.Provides a broad comparison of methods.Does not focus on specific deep learning models or solutions for fake news detection.
Hassan et al. [31]Comparative analysis of machine learning algorithms for text classification.Provides a comprehensive comparison of various algorithms.Does not offer specific solutions to the problem of fake news detection but provides a general overview.
Occhipinti et al. [32]Overview of 12 machine learning models for fake news detection.Extensive comparison of different models for fake news detection.Does not focus on the practical application of models to real-world datasets.
Tong and Koller [33]Support vector machine (SVM) active learning for text classification.Valuable contribution to active learning for classification tasks.Active learning may not always be effective, depending on dataset and domain.
Surekha et al. [34]Combination of WoT with Asian social networks for feature extraction.Improves feature extraction and detection rates for digital misinformation.Limited to specific regions and datasets.
Bangyal et al. [35]Novel deep learning models for COVID-19 propaganda detection.Effective for detecting COVID-related misinformation.May not generalize to other topics or domains beyond public health.
Dubey et al. [36]Combination of vectorization and machine learning techniques for fake news detection.More robust solution for fake news detection.May have difficulty handling diverse sources of fake news.
SY et al. [37]Identification of key argument components within text for fake news detection.Robust voting mechanism enhances prediction accuracy.Macro-F1 scores of unit identification (77.08%) and classification (57.90%) suggest limitations.
R. Hoque et al. [38]LSTM on a dataset of various social media and news platforms.High accuracy (92.01%) on a multi-source dataset.May struggle with datasets from domains not included in the training set.
M. Mhamed et al. [39]Machine learning and deep learning models for fake news detection.High accuracy with models like LSTM and RMuBERT (up to 94%).RMuBERT’s performance may drop with datasets that differ from the ones used in testing.
C.N. Hang et al. [40]Introduced TrumorGPT, a generative AI that uses machine learning with natural language to differentiate tumors and overcome hallucination in LLMs.Overcomes hallucination issue; enhances efficiency with knowledge graphs.Limited in scope to tumor differentiation; focus on specific medical applications; may not generalize across other domains.
Vallidevi Krishnamurthy et al. [41]Yours Truly framework with FactStore database for fact-checking.Achieves excellent F1 score (94%) with good precision and recall.Focuses mainly on fact-checking and may not generalize well across various fake news types.

3. Proposed Methodology

This section comprehensively overviews the proposed weighted-voting-based ensemble with ML and DL models. Figure 1 illustrates the proposed model’s structure.

3.1. Preprocessing

All these processes, called vector-based modeling, occur after specific data preprocessing is conducted. This includes stopping the stop words, tokenization, putting all letters into a minor case, and eradicating punctuations on the respective datasets, which will reduce redundancy and minimize datasets.
  • Stop word removal. Stop words are the low-value words of a language that cause noise in text classification features if they appear. Articles, prepositions, conjunctions, and some pronouns commonly add structure or link concepts in sentences. Stop words are “a”, “an”, “the”, “by”, “in”, “on”, “is”, “was”, “that”, “which”, “who”, “what”, and “where”. Preliminary preprocessing attempts are mainly towards eliminating such stop words from the document, making the dataset clear and more efficient by removing irrelevant content. It will reduce extraneous terms, minimize noise in the dataset, and allow the model to focus on more significant and distinctive words for enhanced overall efficiency.
  • Tokenization. Tokenization divides text into smaller meaningful units, like words, symbols, or phrases. That way, further analysis may be performed. It will take a sentence and divide it into its tokens, representing the significant sequence or element of the sentence. The following sentence, “Natural language processing is complex”, tokenizes into the set [Natural, language, processing, is, complex]. Tokenization disaggregates text into smaller, manageable units such as words or phrases, enabling the model to consider each piece as an individual characteristic, hence facilitating detailed analysis.
  • Stemming. Following tokenization, the subsequent step is standardizing tokens. Here, the process is performed by converting words into their root form using stemming. Stemming reduces the number of word forms that data may contain. The process helps reduce unique word forms as related words are reduced to a common base. Examples include words like “Running”, “Run”, “Ran”, and “Runner”, all of which become reduced to “run”. This makes the process easier and faster in terms of classification. A well-known algorithm for this task is the Porter Stemmer, a reliable and effective tool. This technique simplifies words to their base forms, consolidating multiple forms of a single word into one feature to enhance classification efficiency and improve model generalization capability.
  • Punctuation Removal. Removing punctuation is an important preprocessing step in text analysis that involves removing punctuation symbols because they are considered noise. This way, text can be simplified so that only meaningful terms remain, which helps in analysis. For instance, the sentence “Hello, world!” is converted to “Hello world” by removing all punctuation. This step is convenient for tasks like sentiment analysis or text classification, as the punctuation would usually contribute minimally to the intended meaning of the content. This avoids superfluous punctuation marks, allowing for a focus on content and enhancing the identification of significant patterns or relationships within a text.

3.2. Text Vectorization

Before text data can be utilized in modeling, it first needs to be converted to a numerical form. Such a conversion is possible through the use of vectorization. The most common methods in this regard include Bag of Words (BoW), Term Frequency–Inverse Document Frequency (TF-IDF), and Word2Vec, each offering a different means of representing text as numerical vectors for analysis and modeling.

3.2.1. Bag of Words

The Bag-of-Words model depicts text as a fixed-size vector, with entries reflecting the frequencies of specific terms within the text. The complete procedure involves constructing the vocabulary of the entire dataset, with the dimensions of the resultant vector contingent upon the size of this vocabulary. Each term in that vocabulary is associated with a distinct aspect. The text is converted into this vector format by tallying the frequency of each word. For the vocabulary comprising the terms ‘fish’, ‘hamster’, ‘dog’, and ‘cat’, the vector for the sentence “My dog and cat play with the hamster” is [1, 1, 0, 1], indicating the frequency of occurrence of ‘dog’, ‘cat’, ‘fish’, and ‘hamster’, respectively. BoW considers the text as a collection of words, disregarding the positional context of the words. The model can be augmented to incorporate N-grams, wherein sequences of words, such as bigrams like ‘My dog’ or ‘dog and’, are utilized as features in the vector representation. Moreover, methods such as constraining the vocabulary to the most prevalent terms or establishing frequency criteria are employed to reduce the high dimensionality and sparsity of extensive vocabularies in the Bag-of-Words model. The model can be augmented by N-grams, such as bigrams like “dog and”, which leads to heightened dimensionality and computational complexity.

3.2.2. TF-IDF

DL algorithms are mathematically based and, therefore, cannot directly interpret text. So, first, document properties need to be translated into vector representations. Some advanced methods like Doc2Vec and Word2Vec are not focused in certain situations, because they maintain word order, which may not be necessary. Instead, the TF-IDF approach is used more often for transforming features into vectors because of its reliability and effectiveness in news categorization tasks. It uses two main components, Term Frequency (TF) and Inverse Document Frequency (IDF), to measure the importance of terms within a document in relation to a corpus.
The TF-IDF framework comprises two different metrics, Term Frequency (TF) and Inverse Document Frequency (IDF), which are used together to measure the importance of terms in a document relative to a collection of documents. The value of each feature in this framework is calculated using these frequency measures. Term Frequency (TF) calculates the frequency of occurrence of a certain term in a document compared to the total number of words in that document. For instance, if N denotes all words present in the given document and t i denotes the number of times that term occurs in that specific document, then TF is proportioned with respect to term occurrence. Inverse Document Frequency (IDF) measures the rarity of the term by calculating how often that term appears in all documents in the corpus. This measure emphasizes terms that are unique to a few documents while de-emphasizing terms that occur frequently. Significantly, IDF scores are independent of the high frequency of a term in the overall document set; thus, they are more focused on differentiating relevant terms. For further information on the mathematical calculation of these metrics, refer to the respective literature or documentation about TF-IDF methodology.
I D F t ,   D = log D d i t i
In this scenario, d i t i is the number of documents that have the term t i , and D is the total number of documents in the dataset. What is important to note here is that the IDF value increases when the term is concentrated in fewer documents in the dataset, thereby giving importance to its uniqueness in that context. When combined, TF and IDF produce a feature representation that balances term occurrence without biasing towards highly frequent terms. The resulting combined TF-IDF metric is computed by integrating Term Frequency with both the document frequency and the overall dataset frequency. The resulting feature produces an average vector that minimizes the effect of terms with high frequency in individual documents, which, therefore, enables better problem solving compared to the usual methods. Moreover, the word sequence does not have a bearing on the analysis and, therefore, can be used for tasks in which term prominence matters. TF-IDF is beneficial for identifying dominant terms within a document set. It gives its highest scores to those terms that occur frequently but uniquely within a set of documents. Furthermore, it also helps filter out highly frequent and infrequent terms by setting up score thresholds. This versatility enhances its utility in several text analysis applications since it points out meaningful terms and filters out less meaningful ones.
The mathematical representation of the TF-IDF framework is concisely expressed in Equation (2). Here, D represents the entire corpus and x is the particular document being evaluated. The magnitude T x is a measure of the TF-IDF score for the given word T within the document x . In the context of this study, Equation (2) is applied to compute the score for each of the words identified across all documents within the dataset. This ensures a systematic evaluation of term significance based on its relative importance within individual documents and the overall corpus.
T x = g ( T ,   x ) × log Y g ( T ,   Y )
where the function g ( T ,   x ) denotes the frequency of a given word T in a specific document x , while g ( T ,   Y ) refers to the total number of occurrences of T within the entire corpus Y . The vector T x represents the importance of terms in the corpus, which is denoted by Y ( c ) for every subject c such that c C and C is a non-empty collection of topics. This vector-based representation facilitates the analysis of term relevance across documents grouped by different topics.
T F I D F T ,   c = T F T ,   c × I D F T , Y c
This approach distinguishes between terms based on the local frequency within a given document and on global rarity within an entire set. Also, the model assigns weights to terms based on their frequency within a document and their rarity across the entire dataset. This approach highlights terms that are more informative and discriminative for specific documents. Such a dual perspective shows more important terms to convey the core information found in a document while reducing the impact of frequently occurring words that contribute very little to thematic comprehension. This, therefore, makes the TF-IDF technique efficiently transform textual content into structured numerical vectors, optimizing its format for use in machine learning methods such as classification and other message analysis tasks.

3.2.3. GloVe

GloVe, or Global Vectors for Word Representation, is an approach that bridges two methods: direct prediction, as word2vec uses, and count-based methods, like PCA. Unlike word2vec, which relies entirely on the local context of words within a specified window, GloVe integrates global word co-occurrence statistics from the whole corpus to identify relationships between terms. This employs a technique called global matrix factorization, where a matrix captures whether certain words exist within a document, thereby capturing more general relationships in the dataset [42]. This creates dense word embeddings by learning semantic relationships from word co-occurrence statistics in a corpus. Word2Vec is a neural network-based model, commonly known as neural word embeddings, whereas GloVe is implemented as a logarithmic bilinear model. Both models are developed by the same company. The relationships of words are deduced from how often they co-occur within a given corpus using GloVe, making use of the statistical likelihood of their presence. The probabilistic approach may boost performance in solving word analogy problems by pointing out the contextual importance of word pairs and their relationships in the data.
The goal of the GloVe model is to map words to vectors such that the logarithm of the probability of their co-occurrence is proportional to the dot product of their respective word vectors. The mathematical structure helps the GloVe model represent the semantic relationships between words through the statistical likelihood of being in a sentence together. This model can be expressed with an emphasis on the co-occurrence and word embedding philosophy behind the model [42].
Y p T + Y q + c p + c q = log Z p
where Y is the word vector of the target word. On the other hand, c is the word vector for context words. This implies that the words occur in a defined window of a certain size around the target word. There are two scalar biases: one to adjust for the target word p and another for the context word q . The word co-occurrence matrix is denoted as X and will capture how often each of the words appears with each other. The number of times the word i co-occurs with the word k is therefore given by Z p q The context, in this case, consists of the words on either side of the target word i within a window. Each context word will receive a value according to the formula 1/distance, with distance referring to the positioning between the context word and the target word. Then, there is the weighting function of q Z p q These are based on one equation that has been put forth to more accurately describe context compared to others, as summarized in [42].
q Z p q = Z p q z m a x α ; i f   Z p q < z m a x 1 ; o t h e r w i s e
Following this, the model is constructed by combining Equations (4) and (5) into a cost function formula [42]:
k = p , q = 1 M q Z p q Y p T W q + c p + c q = log Z p 2

3.3. Ensemble Classifiers

3.3.1. Logistic Regression

Logistic regression is one of the most commonly used techniques for classification in machine learning, especially for binary classification. In such a case, the target variable y is predicted to be a value between 0 and 1, where y = 1 represents the positive class. To distinguish between these two classes, the h β = β T Z hypothesis is applied with a 0.5 decision threshold. If h β ( z )     0.5 , the model predicts y = 1 , indicating that the news is true. When h β ( z ) < 0.5, the model labels the news as fake and assigns y = 0 .
Therefore, the results that are obtained through the use of logistic regression fall somewhere between 0 and 1. This means that the value of h β ( z ) is between 0 and 1. The sigmoid function, which is utilized in logistic regression, is expressed in the following manner in Equation (7):
h β z = g β T Z
In a similar manner, the cost function for logistic regression is defined in Equation (8) as follows:
J θ = 1 m i = 1 m f h θ x i y i
The model labels news as fake and assigns y = 0 . Key parameters in logistic regression, such as regularization type (L1/L2) and penalty strength (C), are tuned to avoid overfitting and enhance generalization, ensuring the model’s accuracy and efficiency.

3.3.2. Support Vector Machine (SVM)

SVM is considered a highly significant and extensively used model for solving problems of both binary and multi-class classification, as demonstrated in numerous studies [14,43,44,45,46]. SVM is a supervised machine learning classifier that has been extensively applied in academic research to address these issues [43]. In the case of binary classification, SVM creates a decision boundary in the shape of a hyperplane given by the equation w T x + b = 0 . Here, w is the weight vector perpendicular to the hyperplane, x represents the data instances, and b is the bias, which accounts for the required offset from the origin. The main aim of SVM is to find out the optimal values of w and b . When the data are linearly separable, it is possible to calculate the value of w using the Lagrangian function. Support vectors are the data points closest to the hyperplane, lying in the direction of the farthest class. The mathematical expression for w is given in Equation (9).
w = p = 1 M α p Y p Z i
where M is the total support vector count and Y p is the sample z target class label. The bias term b equation is as follows: Y p w T z p + b 1 = 0 . The kernel method is used for non-linear data. The decision function, which includes w and the vector b , is defined in Equation (10).
g z = s g n   p = 1 M α p Y p K Z p , Z + b
Positive semi-definite functions that meet Mercer’s criterion [13] are the only functions that kernel functions are equal to. The mathematical expression for the polynomial kernel is Equation (11):
K Z , Z p = Z T Z p + 1 q
A Gaussian kernel is shown in Equation (12) as
K Z , Z p = exp   γ | Z Z p | 2
This is a robust classifier that separates data using a hyperplane. Key parameters, such as the kernel type (linear, RBF) and the penalty parameter, are tuned to control the trade-off between margin size and classification accuracy. In contrast, the gamma parameter determines the influence of individual data points on the decision boundary.

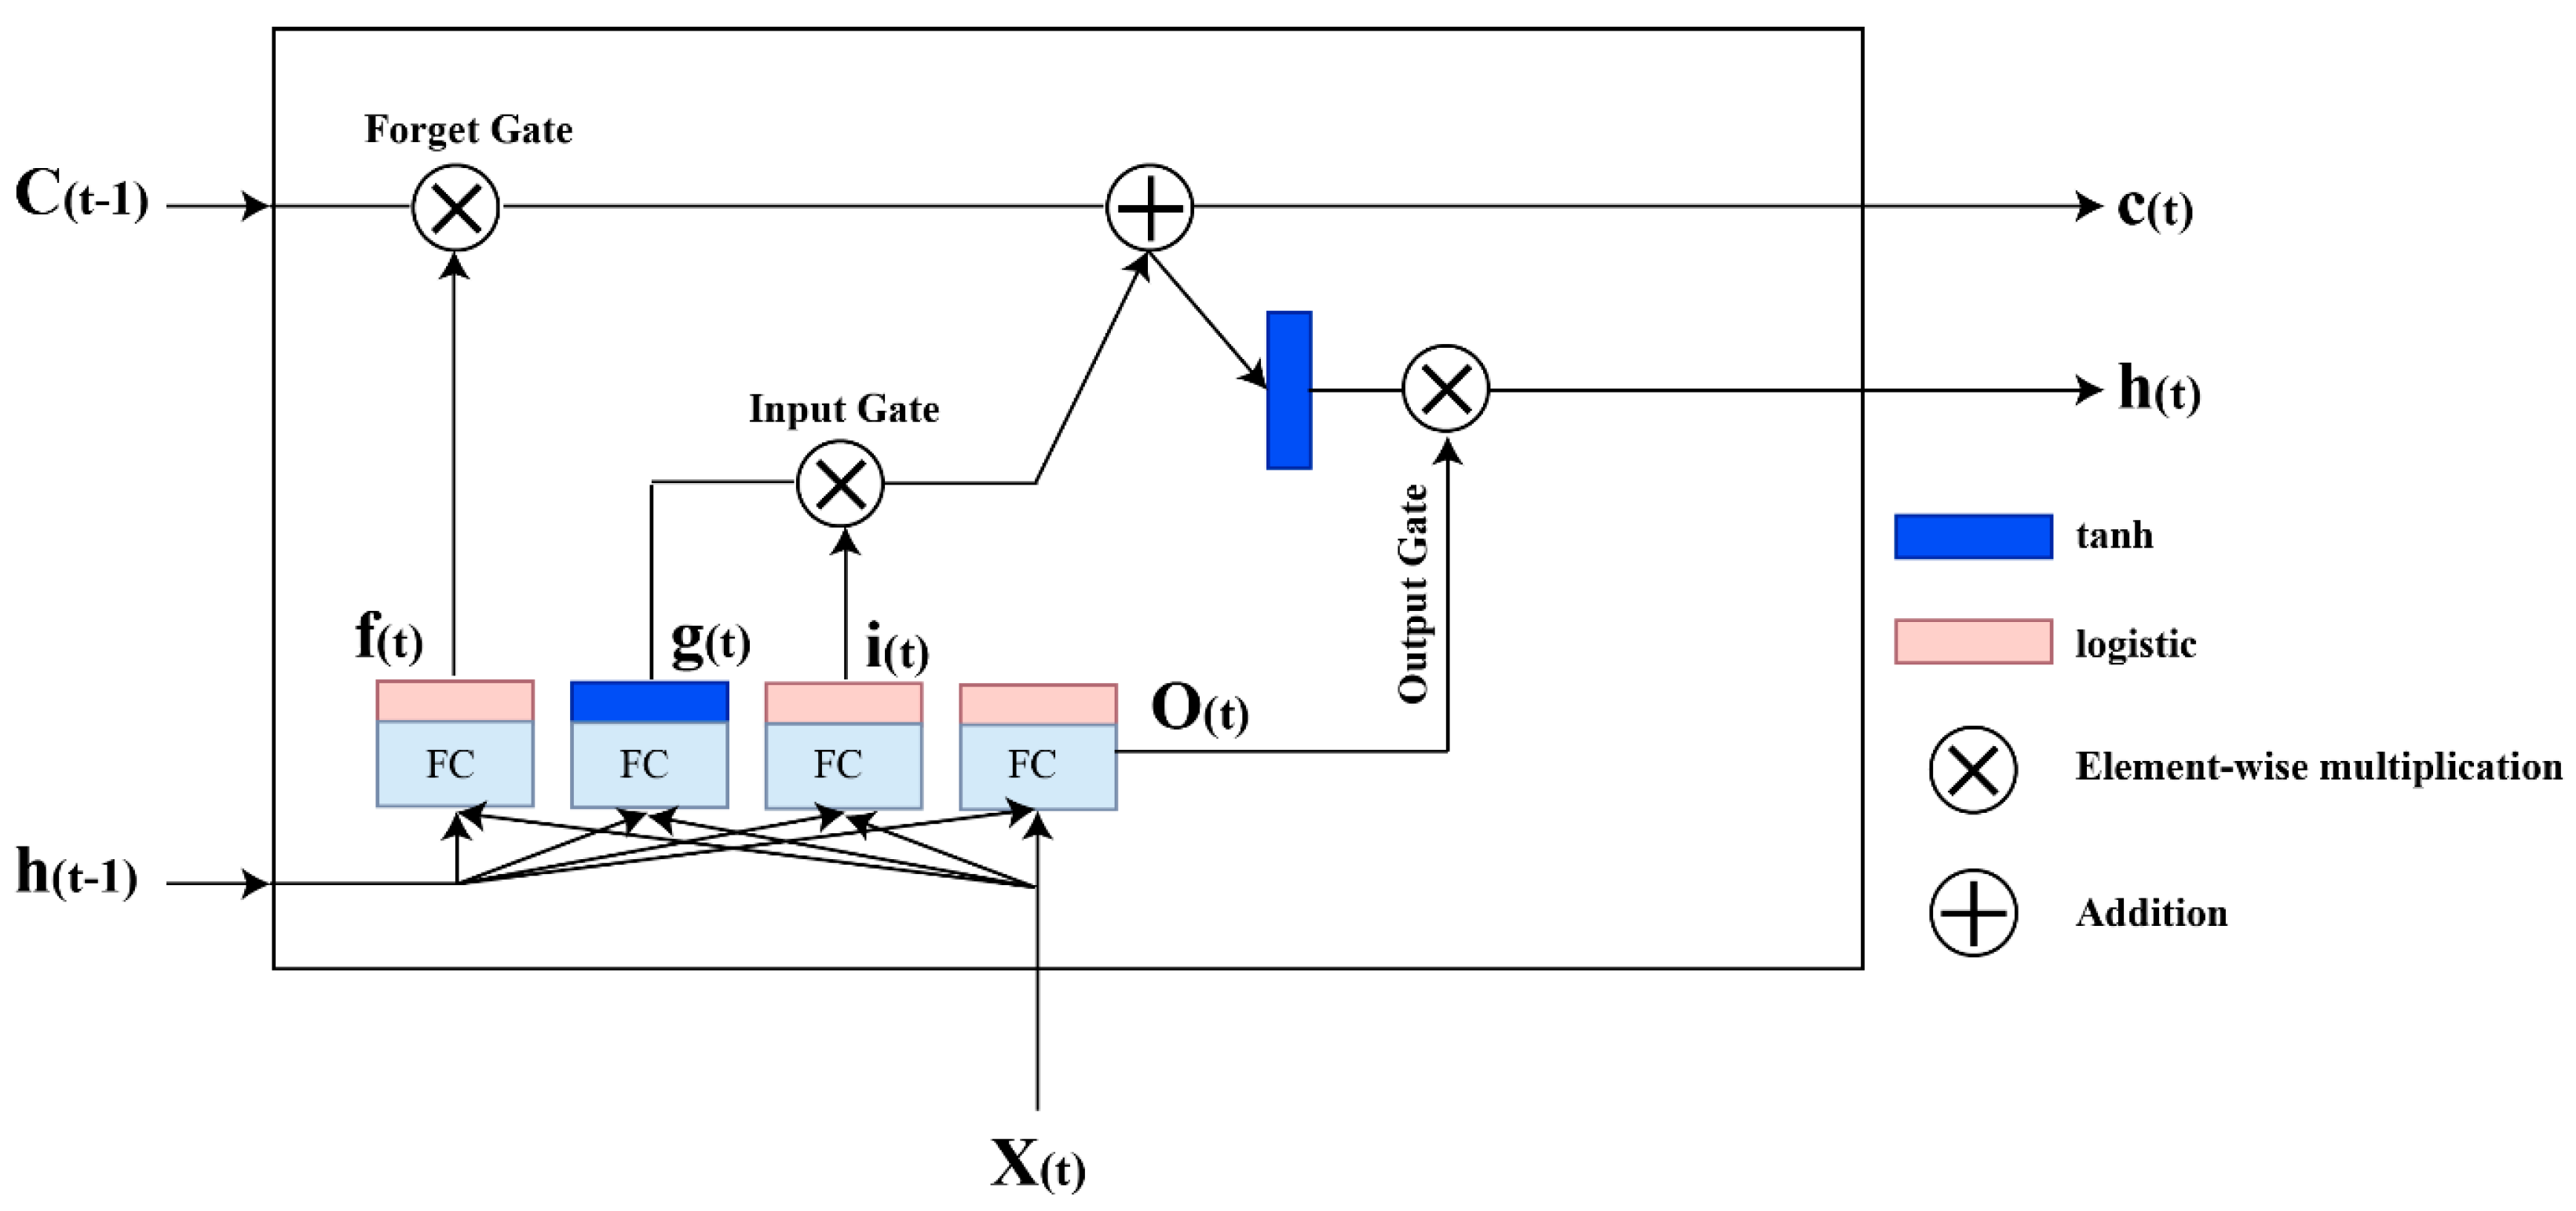
3.3.3. Long Short-Term Memory (LSTM)
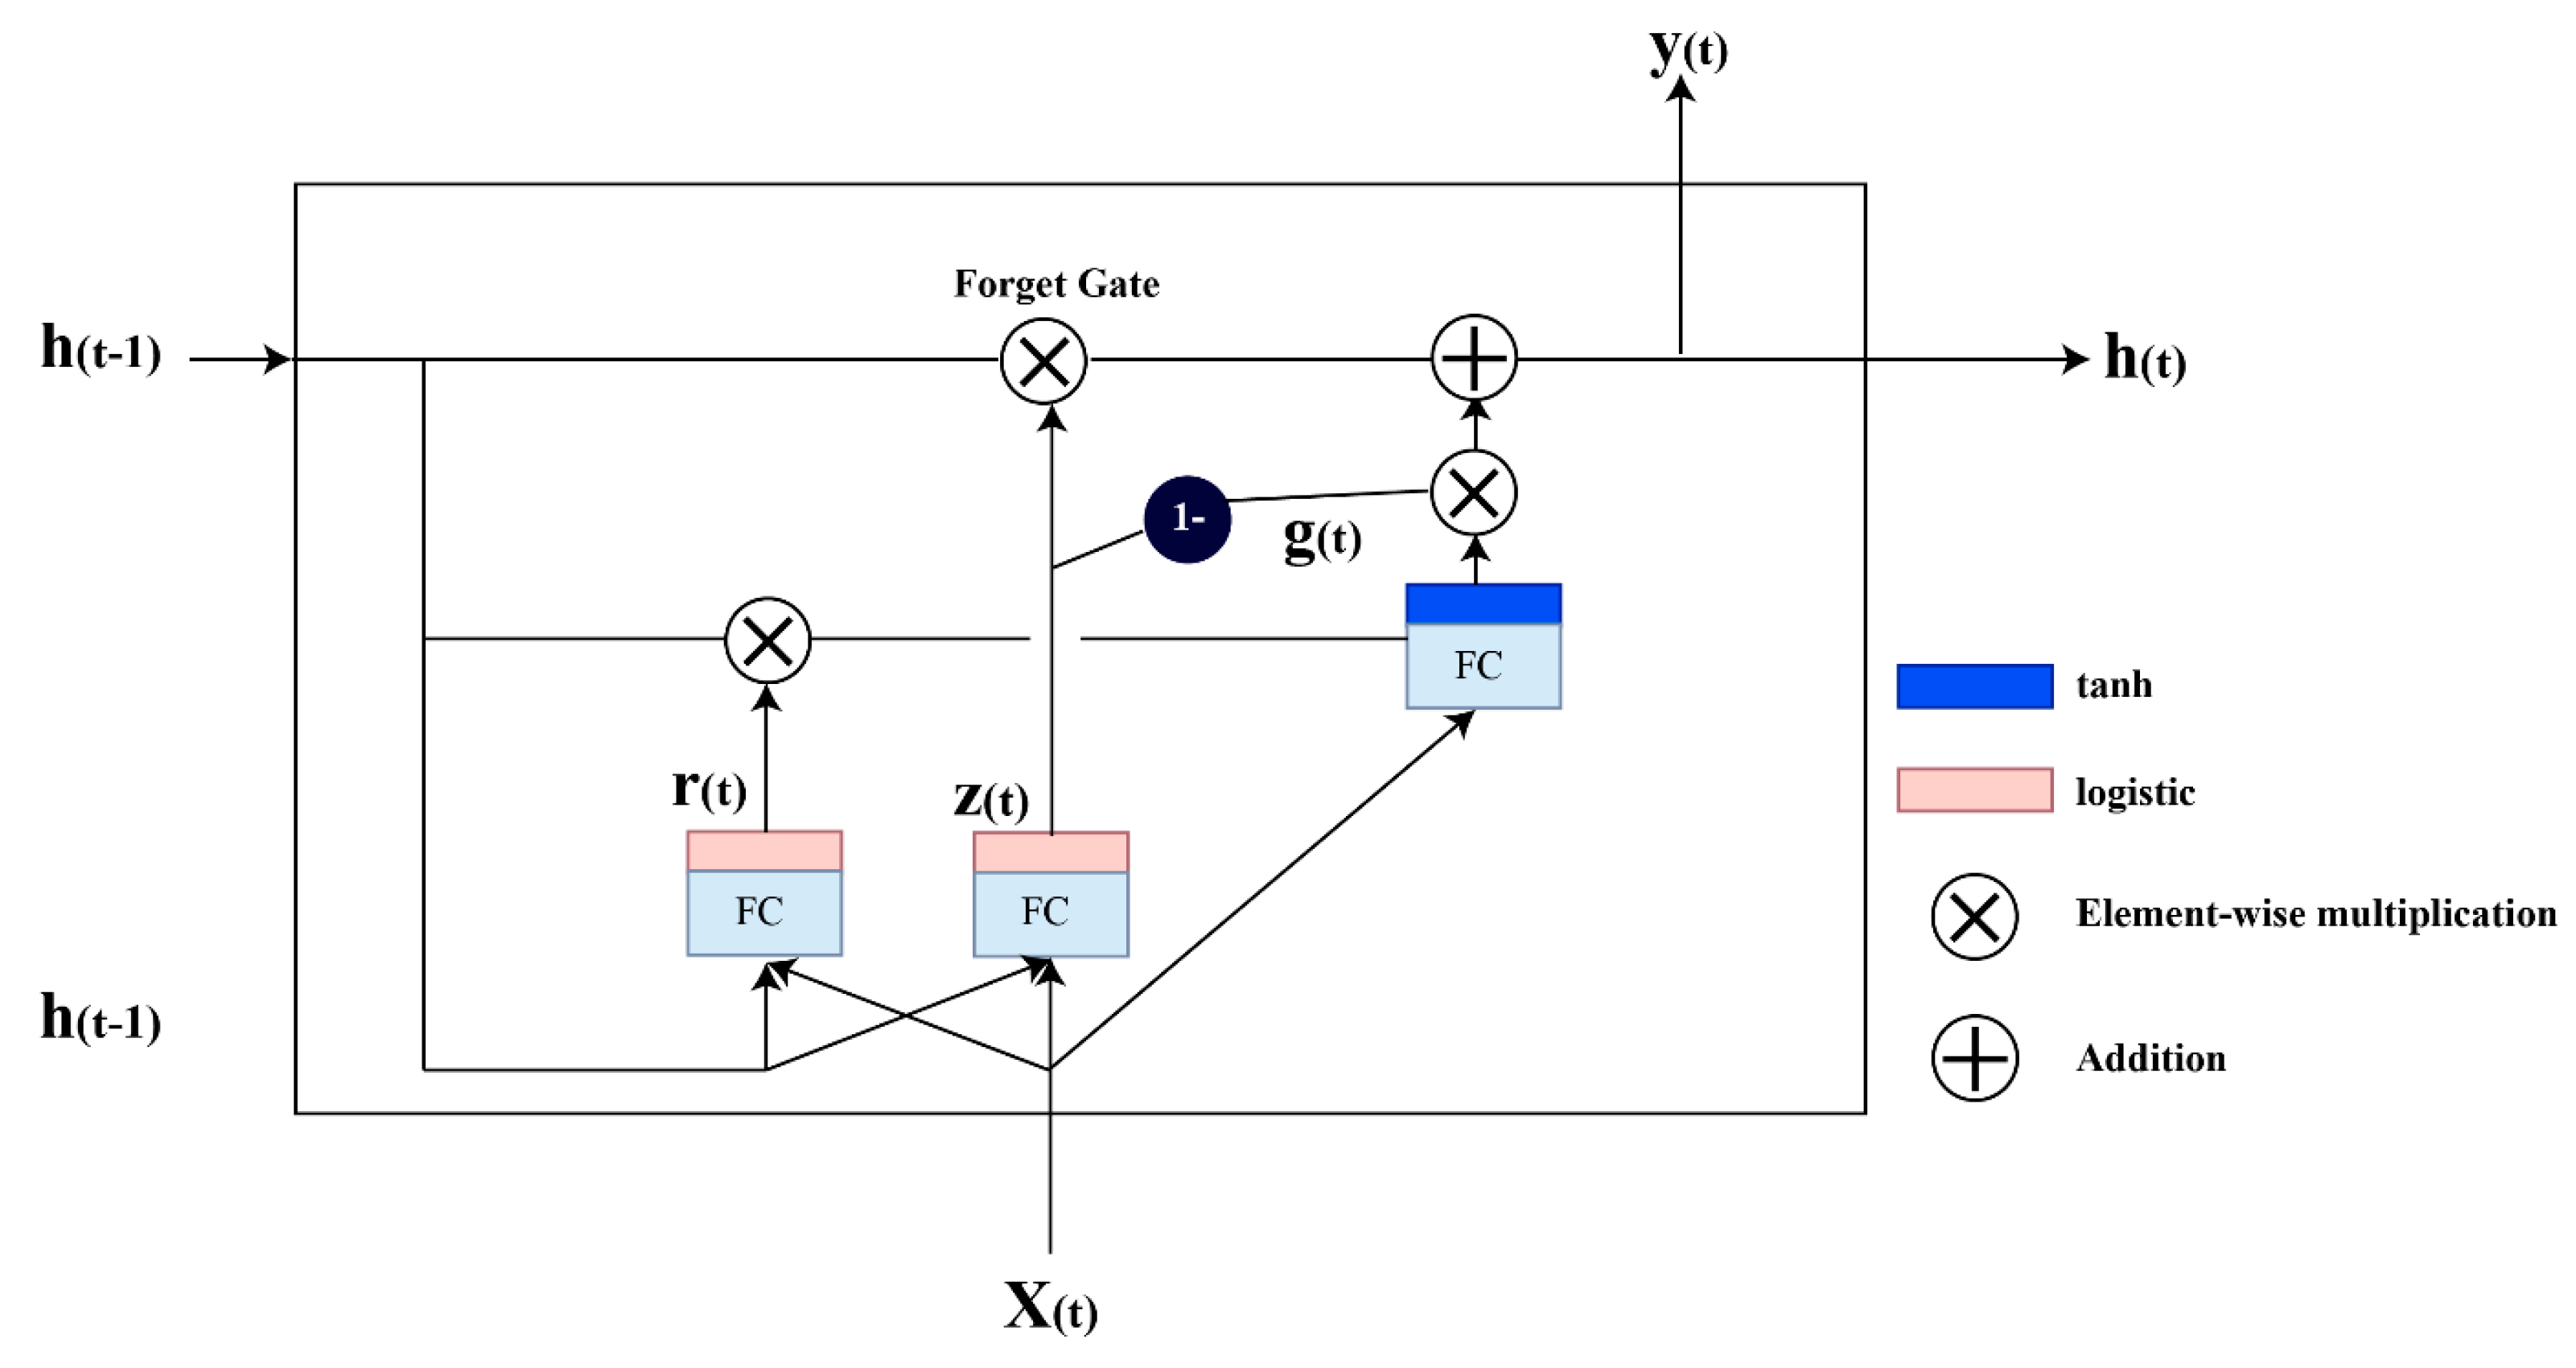
Hochreiter et al. [16] put forward the LSTM algorithm. The LSTM algorithm tries to fix the vanishing gradient problem hindering neural network training if layers become very deep in practice. This places LSTMs among the most widely used recurrent layers for training time series and sequential data. Figure 2 illustrates the cell architecture and the model architecture.
As shown in Figure 2, the long-term state is passed through the forget gate that removes some memories, while the input gate introduces new ones. Hence, c ( t 1 ) is updated to the new long-term state c t by this transformation. The short-term state h t , which represents the cell’s output at time step t , is generated by feeding a copy of c ( t 1 ) into the tanh activation function, multiplying the result by the output gate. Key parameters in LSTM, such as the number of units per layer, dropout rate, optimizer (e.g., Adam), and learning rate, are fine-tuned to capture long-term dependencies in sequential data while preventing overfitting and ensuring optimal performance.
In a typical RNN cell, the output layer is just one layer of neurons, g t However, in an LSTM cell, there are three more layers that control gates. The gates apply a logistic activation function, so their outputs fall in the range of 0 through 1. Using element-wise multiplication, the gates can selectively control activation: an output of zero closes the gate, and an output of one opens it. The forget gate handles information that will be erased, the input gate regulates what information must come in, and finally, the output gate indicates what portion of the state with a long time should actually be read out and sent through in that step. Let x denote the input sequence vector and let W be symbols of weight assigned to all the components. The equations defining mathematical operations within a cell are written as follows:
i t = σ V x i T Z t + V h i T h t 1 + b i
f t = σ V x f T x t + V h f T h t 1 + b f
o t = σ V x o T x t + V h o T h t 1 + b o
g t = tanh V x g T x t + V h g T h t 1 + b g
c t = f t c t 1 + i t g t
y t = h t = o t tanh ( c t )

3.3.4. GRU

The GRU cell [15] can be considered a reduced version of the LSTM cell, but it may be better in some cases than LSTM. As can be seen from our experiments, both GRU and LSTM models are comparable in performance, but the GRU network trains much faster. The GRU contains two gate controllers that create the long-term and short-term states in one single vector, h t Notably, it holds true when z t = 1, where the forget gate is open and the input gate is closed; when z t = 0, the input gate is open and the forget gate is closed. This differs from the LSTM, which features an explicit output gate where the GRU cell just outputs in each step of time. The reset gate, r t , determines what from the previous state is sent through to the primary layer, g t . In GRU, key parameters like the number of units, dropout rate, optimizer, and learning rate are tuned to effectively model sequential dependencies, prevent overfitting, and enhance prediction accuracy. Figure 3 illustrates the architecture of the GRU cell and model, with the computations performed within the GRU cell detailed as follows:
z t = σ V x z T x t + V h z T h t 1 + b z
r t = σ V x r T x t + V h r T h t 1 + b r
g t = tanh V x g T x t + V h g T r t h t 1 + b g
h t = z t h t 1 + 1 z t g t

3.3.5. Voting-Based Ensemble Classifier

As stated above, the four classifiers used to classify the input message could not always provide a stable output. Several aggregation methods of output were considered to improve classifiers’ performance, as seen below. We chose the weighted voting method because the input message can be effectively classified using this method with detailed output. This approach assigns varying weights to each base classifier, with their outputs being influenced by these weights. According to its performance, the most significant influence on the final decision is usually held by the classifier with the highest weight or priority.
To better understand the weighted voting process, assume an input instance x is passed through four classifiers, each defined by a classification function: h 1 ,   h 2 , h 3 , and h 4 . Each of these classifiers is given a weight: V 1 , V 2 , V 2 , and V 4 , respectively. The final output of the ensemble method, H Z , is computed using these weights with the outputs of the individual classifiers.
H Z = c arg max p = 1 4 V p h p q x
The output generated determines the final classification of the input message, assigning it either 0 (real) or 1 (fake). The outputs and weights of the individual base classifiers decide this choice. A significant challenge in using ensembles is selecting weights that yield the best performance for the models. One approach is to compute the weights using the formula W i = a c c u r a c y q q = 1 T a c c u r a c y q , which enables a comparison of each classifier’s accuracy relative to the total accuracy. Techniques such as Grid Search can be used to explore different weight combinations. For our case, Bayesian optimization was used to determine the weights, which is efficient and precise for parameter tuning. Bayesian optimization is a reliable technique for such tasks, as shown in [9], and its effectiveness is verified in [47]. In our model, this optimization problem is formalized as follows:
x * = arg max g Z
This denotes the best weights for the specific models given in classification, which the objective function needs to optimize to the ensemble model. The set of possible weights is called the weight space, denoted as Z . g ( z ) is the model’s performance on a particular set of weights. Accuracy is chosen as the measure of evaluating the goodness of the objective function. Therefore, the optimization process consists of finding the vector z * that maximizes the function g ( z ) , thereby optimizing the best model performance. To adjust the weights in the ensemble model, we first evaluated the performance of each classifier based on its accuracy. The weights were assigned proportionally, with higher-accuracy classifiers receiving greater weights, allowing them to have more influence on the final prediction. Bayesian optimization was then used to refine these weights by exploring different weight combinations to maximize the model’s performance. This iterative process ensured that classifiers with more substantial predictive power were prioritized, while those with lower performance had less impact on the outcome. As a result, the optimized weights improved model accuracy, robustness, and generalization, leading to more precise and reliable predictions. Weighted voting was chosen over majority voting to better capture the strengths of each individual classifier by assigning different levels of influence based on their performance. This method allows the model to make more informed decisions and improve overall accuracy by considering the confidence of each classifier’s prediction.

4. Experimental Results

4.1. Dataset and Experimental Setup

We employed the BuzzFeed dataset [44] for our experiments and evaluations. We manually crawled the web for data and the PolitiFact dataset. These datasets are well-known benchmark sources used for fake news detection tasks. The BuzzFeed dataset consists of news published on the Facebook pages of nine news outlets up until November 2016, during the US election period. It is labeled with 355 fake news articles and 1247 true news articles. Meanwhile, the PolitiFact dataset, which was collected from the FakeNewsNet website, includes articles from the PolitiFact fact-checking website, where professional fact-checkers verified the authenticity of articles. This dataset primarily includes article text and their related social context and dynamic information (such as sharing patterns, comments, etc.). To ensure consistency in preprocessing and maintain the integrity of our data, we followed a rigorous cleaning process to handle any inconsistencies arising from web-crawling. Specifically, articles marked as ‘mixed true and false’ (i.e., content that contained both true and false information) were categorized as fake news. This categorization ensures that articles containing ambiguous or conflicting information are consistently treated. In total, this resulted in 112 fake news articles and 463 real news articles in the PolitiFact dataset. In the experimental setup, the ensemble model employed weighted voting, with each classifier (LR, SVM, GRU, LSTM) assigned specific weights based on its performance. Hyperparameter tuning for each model was conducted using Grid Search to optimize their individual performance before combining them in the ensemble. The learning rate for each model was tuned to ensure efficient convergence, and the number of epochs was chosen to balance training time with model accuracy. We used an i9 14900Hx processor with an RT 4050 GPU for computational resources, providing efficient processing and fast model training.

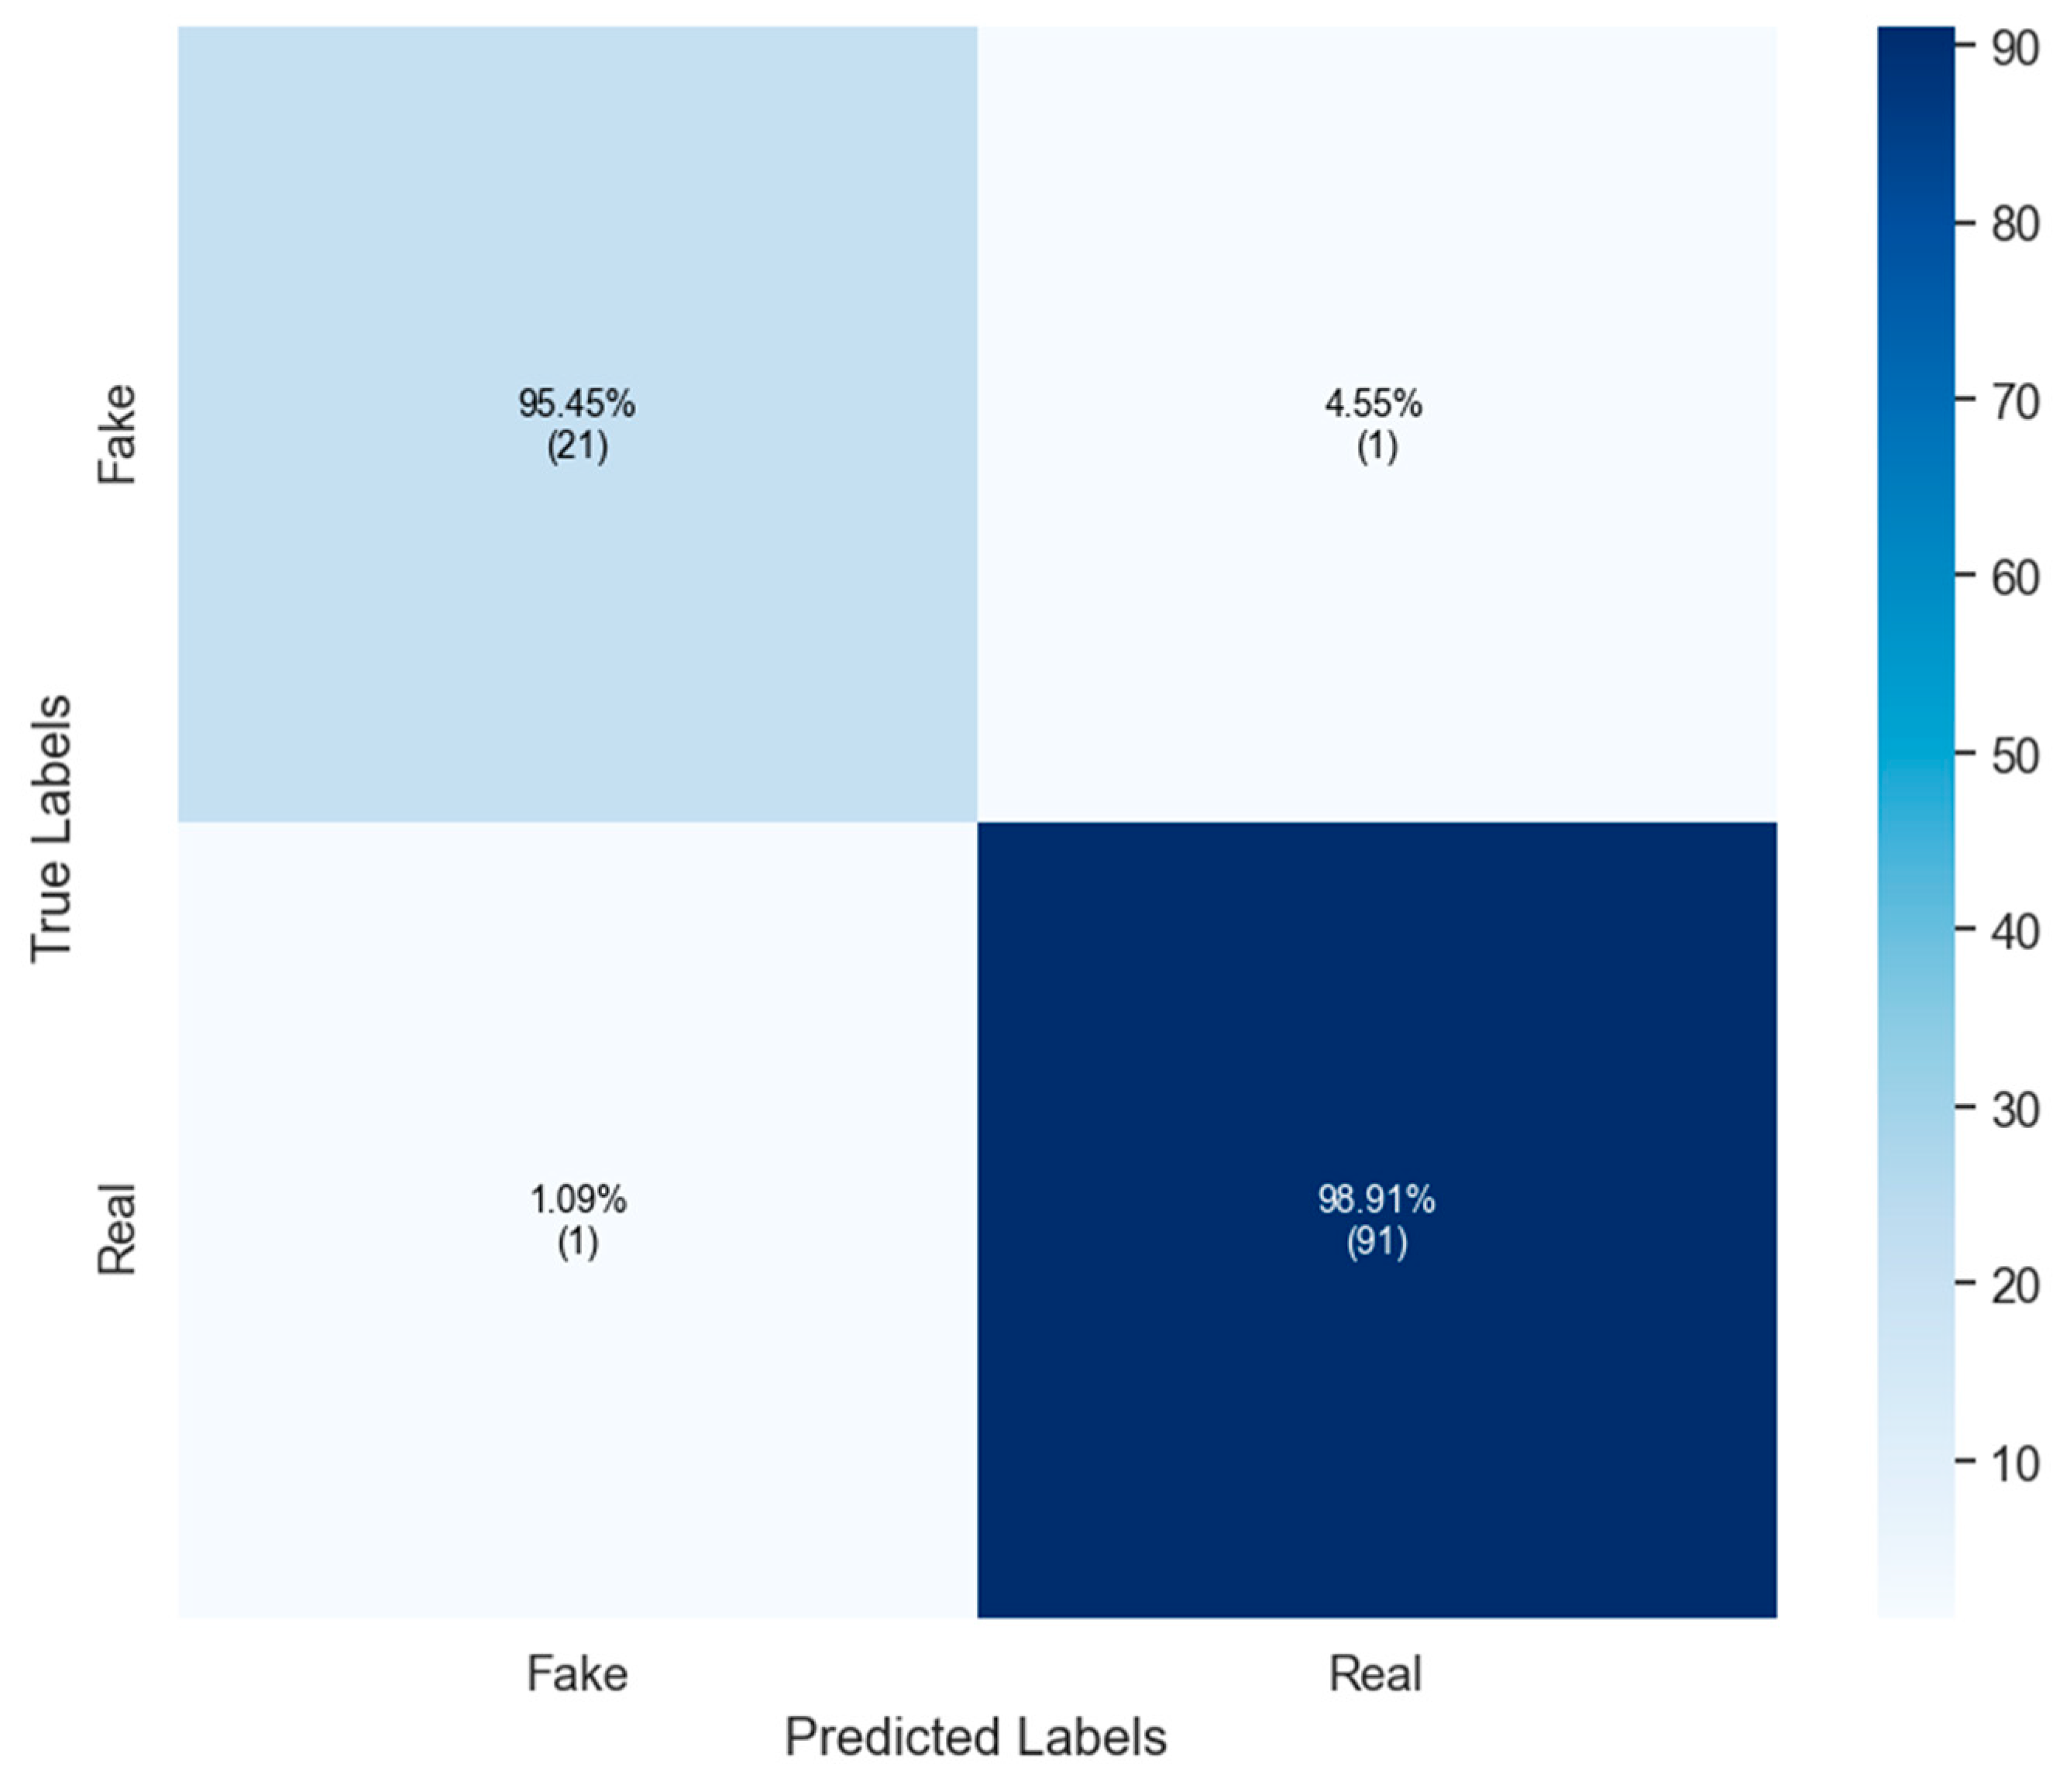
4.2. Results on Politifact Dataset

Table 2 quantitatively compares the proposed models with various models across three text representations: BoW, TF-IDF, and GloVe. The proposed model shows the highest accuracy, precision, and F1 score throughout the representations, with the best being TF-IDF, with a 98.76% accuracy, 98.03% precision, and 97.98% F1-scores. Compared with the baseline models, this measurement shows that SVM performs the best with TF-IDF, with an accuracy of 86.45%, precision of 84.67%, and F1-score of 85.59%. However, it is still much lower in performance than that of the proposed model. Compared to our proposed model, GRU also performs better and achieves 88.39% accuracy with GloVe embeddings. The results show that traditional algorithms like K-Nearest Neighbor (KNN) and random forest (RF) produce relatively low scores across all the measuring parameters, with BoW giving a KNN accuracy as low as 64.58%. Substantial improvement is found when the proposed model is employed and coupled with the TF-IDF representation, which explicitly exhibits superiority over traditional and existing neural network models for this task.
Table 3 compares several ensemble strategies in fake news classification and the performance of every method. All three performance assessment metrics indicate that the proposed weighted voting ensemble method with the TF-IDF text vectorizer outperforms all other techniques, achieving an impressive accuracy of 98.76%, a precision of 98.03%, and an F1-score of 97.98%. This high performance proves that the weighted voting method helps sum up results obtained from one model, which assigns higher power to the stronger classifiers. After that, stacking provides increased performance with an accuracy of 95.40%, precision of 93.78%, and F1-score of 94.59%, thus summarizing the potential of stacking in leveraging the capabilities of different learners. Boosting with an accuracy of 94.34%, a precision of 92.89%, and an F1 score of 93.58% also has reasonably high levels of effectiveness as it optimizes the results by making corrections for mistakes made by the previous versions of boosting. Soft voting comes next with an accuracy of 91.29% and bagging has an accuracy close to 89.46%. The confusion matrix of the proposed model on the PolitiFact dataset is presented in Figure 4.
Table 4 compares various language models employed for fake news classification on the Politifact dataset. RoBERTa leads the group with a commendable accuracy of 93.12%, a precision of 91.76%, and an F1-score of 92.69%, showcasing its strong ability to capture nuanced sentiments in text. Following closely, DistilBERT achieves an accuracy of 91.45%, precision of 90.71%, and F1-score of 90.56%, demonstrating its effectiveness as a lightweight alternative while maintaining robust performance. BERT and AlBERT, however, show comparatively lower results, with accuracies of 86.56% and 84.98%. However, with a weighted-voting-based ensemble learning model, the proposed method performs much better with an accuracy of 98.76%, precision of 98.03%, and F1-score of 97.98%. Incorporating the technique of TF-IDF as a word vectorizer, it is seen that the proposed ensemble model improves its performance accuracy in overcoming the limitations of individual models.

4.3. Results on BuzzFeed Dataset

Table 5 provides a quantitative comparison of several models with three-word vectorization approaches on the BuzzFeed dataset. Among the models, the proposed ensemble learning approach has the highest accuracies of 93.29% for BoW, 97.67% for TF-IDF, and 95.58% for GloVe, with a high precision of 92.57%, 96.98%, and 94.87% and an F1-score of 92.68%, 97.14%, and 94.68%. By comparison, SVM can also receive high evaluation when using TF-IDF; the highest evaluation is 91.85%, while the lowest evaluation of LR is only 78.58% using GloVe. Combined with the high complexity, the LSTM model has a relatively low accuracy of 85.34%. GRU using the GloVe vector has an 87.21% accuracy, which we still consider sufficient for this task.
Table 6 shows the comparison of the different forms of ensemble techniques used in analyzing the BuzzFeed dataset. It is clear that among the assessed approaches, stacking shows relatively high results, an accuracy of 92.78%, precision of 92.14%, and F1-score of 92.03%, which proves that this method allows for enhancing the performance of several selected models. The analysis based on soft voting also shows good performance with an accuracy of 92.45%, precision of 91.86%, and F1-score of 91.98%. These methods yield lower performances; in bagging, the accuracy obtained is 91.54%, while boost obtains an accuracy of 89.67%. On the other hand, the proposed weighted-voting-based ensemble learning outperforms all other methods with an accuracy of 97.67%, precision of 96.98%, and F1 score of 97.14%. This impressive result demonstrates the model’s versatility in generating a reasonable fusion of predictions from other classifiers in the enrolment of fake news within the BuzzFeed set. Figure 5 illustrates the confusion matrix of the proposed model on the BuzzFeed dataset.
Table 7 provides a comparative analysis of the proposed methodology with several language models for the BuzzFeed dataset. From the analyzed models, AlBERT has the best performance with an average accuracy of 94.56% and precision of 93.62% with an F1-score of 93.27%, which confirms good results in detecting fake news. RoBERTa is not far behind with an accuracy of 91.82%, precision of 91.14%, and F1 score of 91.33%, making it more efficient as well. In our case, the two architectures that present lower performance are BERT, with an accuracy of 84.67%, and DistilBERT, with an 82.91% accuracy, confirming their relative weakness for this approach. On the other hand, the proposed weighted-voting-based ensemble learning model performs much better than all of the proposed models, with a better accuracy of 97.67%, precision of 96.98%, and F1-score of 97.14%. This impressive performance further supports the need for a proposed model that carefully brings together predictions from several classifiers to achieve the best detection of fake news on the BuzzFeed dataset.

4.4. Ablation Studies

The proposed model’s performance was assessed using cross-validation approaches, including 5-fold, 10-fold, and 15-fold, using the BuzzFeed and PolitiFact datasets, as shown in Table 8. The BuzzFeed dataset yielded a model accuracy of 97.67% after 5-fold cross-validation, which decreased to 97.45% with 10-fold and 97.32% with 15-fold cross-validation. The steady decrease in accuracy across the folds suggests that while the model generalizes effectively, there is a minor fluctuation corresponding to variations in the training data size for each fold. The model demonstrated superior performance on the PolitiFact dataset, achieving an accuracy of 98.76% at 5-fold cross-validation, which then decreased to 98.34% at 10-fold and 98.12% at 15-fold. The results indicate the model’s consistency and robustness across various validation strategies, demonstrating strong performance on diverse datasets. The subsequent cross-validation outcomes further substantiate the reliability of its performance, which appears promising for fake news detection.

4.5. Comparison with State of the Art

Table 9 compares the proposed model with existing BuzzFeed and PolitiFact corpora methods. Highly notably, the best result of the PolitiFact dataset was 93.91%, which was obtained based on the model in [1]. In comparison, the precision reached 85.19%, with an F1-score of 86.79%. Other methods on PolitiFact, such as the model in [48], obtained an 88.40% accuracy with a precision as high as 87.90% and an F1-score of 92.40% to show a strong capability of detecting fake news. However, several models, including [3,49], were of relatively low performance, with an accuracy of 84.00% and 85.58%, respectively. The model in [50] performed well in the BuzzFeed dataset with an accuracy of 93.41%, precision of 89.90%, and F1-score of 93.68%. However, other models, including [1,51], had constraints, and the models had accuracies of 82.55% and 65.50%, respectively. Overall, the proposed weighted-voting-based ensemble learning approach outperforms all the individual algorithms with better results with both datasets. For the PolitiFact dataset, the proposed model offers an accuracy of 98.76%, a precision of 98.03%, and an F1 score of 97.98%, much higher than those of the other methods. Moreover, the proposed model outperforms existing models on the BuzzFeed dataset, providing an accuracy of 97.67% and a precision of 96.98%. This helps illustrate how the proposed method can perform well in detecting given fake news, thus underscoring the ability to do so better than the traditional methods.

5. Conclusions

This work proposes an ensemble learning method for fake news classification that provides high accuracy and includes relevant features. It employs four ML and DL approaches and vectorizes text using the TF-IDF and ensemble learning approaches. In the first step, we compared the performance of a range of tasks based on ML and DL models and multiple text vectorizers. After that, we used ensemble learning with four classifiers, namely LR, SVM, LSTM, and GRU, to design a strong classifier that could effectively predict fake news while ensuring that few actual fake news were false negatives. To this end, four classification algorithms were integrated, and a weighted voting method was applied to identify the final ensemble model’s output. The performance of the proposed approach was evaluated by experimentation and compared with related work on the Politifact and BuzzFeed datasets, where it obtained accuracies of 98.76% and 96.98%, respectively. Despite this, it may be seen that the presented approach mainly relies on a particular vectorization method like TF-IDF, which may restrict the model’s generality to different forms of data representation. The suggested algorithm, while extremely compelling, may struggle with highly imbalanced datasets or the detection of subtle language variations in fake news. It may also incur much higher computational costs when handling large-scale datasets. It might necessitate the use of efficient hardware or optimization methods. Future endeavors will concentrate on addressing difficulties to improve scalability and robustness. Future research may employ enhanced BERT-based word representations and evaluate the efficacy of transfer learning with pre-trained models to explore more semantic links among words. Multimodal false news detection will provide an additional approach, integrating text, photos, and social context into the model. The authors aim to enhance the model’s generalization capability by applying it to various datasets, ensuring its applicability and performance across other domains.

Author Contributions

Conceptualization, M.S.T., H.S., A.A., M.Y., N.L.F., M.S., and C.K.; methodology, M.S.T., H.S., A.A., N.L.F., M.S., and C.K.; software, M.S.T., H.S., A.A., and N.L.F.; validation, M.Y., A.A., and N.L.F.; formal analysis, M.S.T., H.S., A.A., and N.L.F.; investigation, M.Y., M.S., and C.K.; data curation, M.S.T., H.S., A.A., and N.L.F.; writing—original draft preparation, M.S.T., H.S., A.A., and N.L.F.; visualization, M.S.T., H.S., A.A., and N.L.F.; writing—review and editing, M.Y., M.S., and C.K.; funding acquisition, M.S. and C.K. All authors have read and agreed to the published version of the manuscript.

Funding

This research received no external funding.

Data Availability Statement

The dataset is available at https://doi.org/10.55859/ijiss.1231423 (accessed on 30 September 2024).

Conflicts of Interest

The authors declare no conflicts of interest.

References

  1. Shu, K.; Sliva, A.; Wang, S.; Tang, J.; Liu, H. Fake news detection on social media: A data mining perspective. ACM SIGKDD Explor. Newsl. 2017, 19, 22–36. [Google Scholar] [CrossRef]
  2. Shu, K.; Wang, S.; Liu, H. Understanding user profiles on social media for fake news detection. In Proceedings of the 2018 IEEE Conference on Multimedia Information Processing and Retrieval (MIPR), Miami, FL, USA, 10–12 April 2018. [Google Scholar]
  3. Monti, F.; Frasca, F.; Eynard, D.; Mannion, D.; Bronstein, M.M. Fake news detection on social media using geometric deep learning. arXiv 2019, arXiv:1902.06673. [Google Scholar]
  4. Pulido, C.M.; Ruiz-Eugenio, L.; Redondo-Sama, G.; Villarejo-Carballido, B. A new application of social impact in social media for overcoming fake news in health. Int. J. Environ. Res. Public Health 2020, 17, 2430. [Google Scholar] [CrossRef] [PubMed]
  5. Seddari, N.; Derhab, A.; Belaoued, M.; Halboob, W.; Al-Muhtadi, J.; Bouras, A. A hybrid linguistic and knowledge-based analysis approach for fake news detection on social media. IEEE Access 2022, 10, 62097–62109. [Google Scholar] [CrossRef]
  6. Agarwal, I.Y.; Rana, D.P. An improved fake news detection model by applying a recursive feature elimination approach for credibility assessment and uncertainty. J. Uncertain Syst. 2023, 16, 2242008. [Google Scholar] [CrossRef]
  7. Lazer, D.M.J.; Baum, M.A.; Benkler, Y.; Berinsky, A.J.; Greenhill, K.M.; Menczer, F.; Metzger, M.J.; Nyhan, B.; Pennycook, G.; Rothschild, D.; et al. The science of fake news. Science 2018, 359, 1094–1096. [Google Scholar] [CrossRef]
  8. Higdon, N. The Anatomy of Fake News: A Critical News Literacy Education; University of California Press: Berkeley, CA, USA, 2020. [Google Scholar]
  9. Soll, J. The long and brutal history of fake news. Politico Mag. 2016, 18, 2016. [Google Scholar]
  10. Hua, J.; Shaw, R. Corona virus (COVID-19) “infodemic” and emerging issues through a data lens: The case of China. Int. J. Environ. Res. Public Health 2020, 17, 2309. [Google Scholar] [CrossRef]
  11. Vosoughi, S.; Roy, D.; Aral, S. The spread of true and false news online. Science 2018, 359, 1146–1151. [Google Scholar] [CrossRef]
  12. Manzoor, S.I.; Singla, J. Fake news detection using machine learning approaches: A systematic review. In Proceedings of the 2019 3rd International Conference on Trends in Electronics and Informatics (ICOEI), Tirunelveli, India, 23–25 April 2019. [Google Scholar]
  13. Wu, X.; Kumar, V.; Ross Quinlan, J.; Ghosh, J.; Yang, Q.; Motoda, H.; McLachlan, G.J.; Ng, A.; Liu, B.; Yu, P.S.; et al. Top 10 algorithms in data mining. Knowl. Inf. Syst. 2008, 14, 1–37. [Google Scholar] [CrossRef]
  14. Cristianini, N.; Shawe-Taylor, J. An Introduction to Support Vector Machines and Other Kernel-Based Learning Methods; Cambridge University Press: Cambridge, UK, 2000. [Google Scholar]
  15. Cho, K. Learning phrase representations using RNN encoder-decoder for statistical machine translation. arXiv 2014, arXiv:1406.1078. [Google Scholar]
  16. Hochreiter, S. Long Short-Term Memory; Neural Computation MIT-Press: La Jolla, CA, USA, 1997. [Google Scholar]
  17. Ahmad, I.; Yousaf, M.; Yousaf, S.; Ahmad, M.O. Fake news detection using machine learning ensemble methods. Complexity 2020, 2020, 8885861. [Google Scholar] [CrossRef]
  18. Allcott, H.; Gentzkow, M. Social media and fake news in the 2016 election. J. Econ. Perspect. 2017, 31, 211–236. [Google Scholar] [CrossRef]
  19. Conroy, N.K.; Rubin, V.L.; Chen, Y. Automatic deception detection: Methods for finding fake news. Proc. Assoc. Inf. Sci. Technol. 2015, 52, 1–4. [Google Scholar] [CrossRef]
  20. Rubin, V.L.; Conroy, N.; Chen, Y.; Cornwell, S. Fake news or truth? using satirical cues to detect potentially misleading news. In Proceedings of the Second Workshop on Computational Approaches to Deception Detection, San Diego, CA, USA, 12–17 June 2016. [Google Scholar]
  21. Jwa, H.; Oh, D.; Park, K.; Kang, J.M.; Lim, H. exBAKE: Automatic fake news detection model based on bidirectional encoder representations from transformers (bert). Appl. Sci. 2019, 9, 4062. [Google Scholar] [CrossRef]
  22. Cai, L.-J.; Lv, S.; Shi, K.-B. Application of an improved chi feature selection algorithm. Discret. Dyn. Nat. Soc. 2021, 2021, 9963382. [Google Scholar] [CrossRef]
  23. Gokalp, O.; Tasci, E.; Ugur, A. A novel wrapper feature selection algorithm based on iterated greedy metaheuristic for sentiment classification. Expert Syst. Appl. 2020, 146, 113176. [Google Scholar] [CrossRef]
  24. Al-Ahmad, B.; Al-Zoubi, A.M.; Abu Khurma, R.; Aljarah, I. An evolutionary fake news detection method for COVID-19 pandemic information. Symmetry 2021, 13, 1091. [Google Scholar] [CrossRef]
  25. Too, J.; Mirjalili, S. A hyper learning binary dragonfly algorithm for feature selection: A COVID-19 case study. Knowl.-Based Syst. 2020, 212, 106553. [Google Scholar] [CrossRef]
  26. Parlak, B.; Uysal, A.K. A novel filter feature selection method for text classification: Extensive Feature Selector. J. Inf. Sci. 2021, 49, 59–78. [Google Scholar] [CrossRef]
  27. Sahin, M.E.; Tang, C.; Al-Ramahi, M.A. Fake News detection on social media: A word embedding-based approach. In Proceedings of the 28th annual Americas Conference on Information Systems, Minneapolis, MN, USA, 10–14 August 2022. [Google Scholar]
  28. Wang, H.; Tang, P.; Kong, H.; Jin, Y.; Wu, C.; Zhou, L. DHCF: Dual disentangled-view hierarchical contrastive learning for fake news detection on social media. Inf. Sci. 2023, 645, 119323. [Google Scholar] [CrossRef]
  29. Zhou, Y.; Yang, Y.; Ying, Q.; Qian, Z.; Zhang, X. Multi-modal fake news detection on social media via multi-grained information fusion. In Proceedings of the 2023 ACM International Conference on Multimedia Retrieval, Thessaloniki, Greece, 12–15 June 2023. [Google Scholar]
  30. Zulqarnain, M.; Saqlain, M. Text readability evaluation in higher education using CNNs. J. Ind. Intell. 2023, 1, 184–193. [Google Scholar] [CrossRef]
  31. Hassan, S.U.; Ahamed, J.; Ahmad, K. Analytics of machine learning-based algorithms for text classification. Sustain. Oper. Comput. 2022, 3, 238–248. [Google Scholar] [CrossRef]
  32. Occhipinti, A.; Rogers, L.; Angione, C. A pipeline and comparative study of 12 machine learning models for text classification. Expert Syst. Appl. 2022, 201, 117193. [Google Scholar] [CrossRef]
  33. Baig, M.D.; Akram, W.; Haq, H.B.U.; Rajput, H.Z.; Imran, M. Optimizing misinformation control: A cloud-enhanced machine learning approach. Inf. Dyn. Appl. 2024, 3, 1–11. [Google Scholar] [CrossRef]
  34. Surekha, T.L.; Rao, N.C.S.; Shahnazeer, C.; Yaseen, S.M.; Shukla, S.K.; Bharat, S.; Arumugam, M. Digital misinformation and fake news detection using WoT integration with Asian social networks fusion based feature extraction with text and image classification by machine learning architectures. Theor. Comput. Sci. 2022, 927, 1–14. [Google Scholar] [CrossRef]
  35. Kurasinski, L.; Mihailescu, R.-C. Towards machine learning explainability in text classification for fake news detection. In Proceedings of the 2020 19th IEEE International Conference on Machine Learning and Applications (ICMLA), Virtual Event, 14–17 December 2020. [Google Scholar]
  36. Dubey, Y.; Wankhede, P.; Borkar, A.; Borkar, T.; Palsodkar, P. Framework for fake news classification using vectorization and machine learning. In Combating Fake News with Computational Intelligence Techniques; Springer: Cham, Switzerland, 2022; pp. 327–343. [Google Scholar]
  37. Sy, E.; Peng, T.C.; Lin, H.Y.; Huang, S.H.; Chang, Y.C.; Chung, C.P. Ensemble BERT Techniques for Financial Sentiment Analysis and Argument Understanding with Linguistic Features in Social Media Analytics. J. Inf. Sci. Eng. 2025, 41, 579–599. [Google Scholar]
  38. Hoque, R.; Islam, S.; Sarkar, S.; Habiba, S.U.; Rahman, M.; Palas, R.; Hoque, M. Depressive and Suicidal Text-Based Sentiment Analysis in Bangla Using Deep Learning Models. Bus. IT 2024, XIV, 136–150. [Google Scholar] [CrossRef]
  39. Mhamed, M.; Sutcliffe, R.; Feng, J. Benchmark Arabic news posts and analyzes Arabic sentiment through RMuBERT and SSL with AMCFFL technique. Egypt. Informatics J. 2025, 29, 100601. [Google Scholar] [CrossRef]
  40. Hang, C.N.; Yu, P.-D.; Tan, C.W. TrumorGPT: Query Optimization and Semantic Reasoning over Networks for Automated Fact-Checking. In Proceedings of the 2024 58th Annual Conference on Information Sciences and Systems (CISS), Princeton, NJ, USA, 13–15 March 2024; pp. 1–6. [Google Scholar]
  41. Krishnamurthy, V.; Balaji, V. Yours Truly: A Credibility Framework for Effortless LLM-Powered Fact Checking. IEEE Access 2024, 12, 195152–195173. [Google Scholar] [CrossRef]
  42. Pennington, J.; Socher, R.; Manning, C.D. Glove: Global vectors for word representation. In Proceedings of the 2014 Conference on Empirical Methods in Natural Language Processing (EMNLP), Doha, Qatar, 25–29 October 2014. [Google Scholar]
  43. Chang, C.-C.; Lin, C.-J. LIBSVM: A library for support vector machines. ACM Trans. Intell. Syst. Technol. (TIST) 2011, 2, 1–27. [Google Scholar] [CrossRef]
  44. Santia, G.; Williams, J. Buzzface: A news veracity dataset with facebook user commentary and egos. In Proceedings of the International AAAI Conference on Web and Social Media, Palo Alto, CA, USA, 25–28 June 2018; Volume 12, pp. 531–540. [Google Scholar]
  45. Haq, A.U.; Li, J.; Memon, M.; Khan, J.; Din, S.U.; AHAD, I.; Sun, R.; Lai, Z. Comparative analysis of the classification performance of machine learning classifiers and deep neural network clas-sifier for prediction of Parkinson disease. In Proceedings of the 2018 15th International Computer Conference on Wavelet Active Media Technology and Information Processing (ICCWAMTIP), Chengdu, China, 14–16 December 2018. [Google Scholar]
  46. Brochu, E.; VCora, M.; De Freitas, N. A tutorial on Bayesian optimization of expensive cost functions, with application to active user modeling and hierarchical reinforcement learning. arXiv 2010, arXiv:1012.2599. [Google Scholar]
  47. Ghourabi, A. A security model based on lightgbm and transformer to protect healthcare systems from cyberattacks. IEEE Access 2022, 10, 48890–48903. [Google Scholar] [CrossRef]
  48. Qu, Z.; Meng, Y.; Muhammad, G.; Tiwari, P. QMFND: A quantum multimodal fusion-based fake news detection model for social media. Inf. Fusion 2024, 104, 102172. [Google Scholar] [CrossRef]
  49. Al Obaid, A.; Khotanlou, H.; Mansoorizadeh, M.; Zabihzadeh, D. Multimodal fake-news recognition using ensemble of deep learners. Entropy 2022, 24, 1242. [Google Scholar] [CrossRef]
  50. Güler, G.; Gündüz, S. Deep learning based fake news detection on social media. Int. J. Inf. Secur. Sci. 2023, 12, 1–21. [Google Scholar] [CrossRef]
  51. Ozbay, F.A.; Alatas, B. Fake news detection within online social media using supervised artificial intelligence algorithms. Phys. A Stat. Mech. Its Appl. 2020, 540, 123174. [Google Scholar] [CrossRef]
Figure 1. Architecture of the proposed ensemble model.
Mathematics 13 00449 g001
Figure 2. Overview of LSTM cell architecture.
Mathematics 13 00449 g002
Figure 3. Overview of GRU cell architecture.
Mathematics 13 00449 g003
Figure 4. Confusion matrix of the proposed model on the PolitiFact dataset.
Mathematics 13 00449 g004
Figure 5. Confusion matrix of the proposed model on the BuzzFeed dataset.
Mathematics 13 00449 g005
Table 2. Comparison of proposed models with various models across three text representations on the PolitiFact dataset.
ModelsBoWTF-IDFGloVe
Acc (%)Pre (%)F1 (%)Time (s)Acc (%)Pre (%)F1 (%)Time (s)Acc (%)Pre (%)F1 (%)Time (s)
SVM81.6280.4580.0334786.4584.6785.5938282.3180.4581.22537
LR76.7874.3474.3229478.9377.4378.7642674.6573.1273.90509
LSTM77.4274.2174.6528182.5479.5681.3432876.2375.4375.38522
GRU80.8379.4678.3534780.4579.2279.5733288.3987.5488.65558
KNN64.5860.3960.8228266.6763.4564.2145662.8762.8761.21552
RF67.3464.6763.1829470.4369.3869.1945971.3270.6370.90400
XGBoost72.7570.4670.5226273.9871.6772.3039169.4568.4068.66580
LightGBM71.4768.3868.9732177.4376.4875.4447771.5670.1870.42545
Proposed94.5794.1293.3334798.7698.0397.9833496.6894.7995.67577
Table 3. Comparison of several ensemble strategies using TF-IDF on the PolitiFact dataset.
Ensemble TechniquesAcc (%)Pre (%)F1 (%)
Bagging89.4688.3288.87
Boosting94.3492.8993.58
Soft Voting91.2990.4790.23
Stacking95.4093.7894.59
Weighted Voting98.7698.0397.98
Table 4. Comparison of the proposed model with various language models using TF-IDF on the PolitiFact dataset.
ModelAcc (%)Pre (%)F1 (%)Time (s)
BERT86.5685.6785.22515
DistilBERT91.4590.7190.56472
AlBERT84.9884.0884.65505
RoBERTa93.1291.7692.69530
Proposed98.7698.0397.98334
Table 5. Comparison of the proposed model with various models across three text representations on the BuzzFeed dataset.
ModelsBoWTF-IDFGloVe
Acc (%)Pre (%)F1
(%)
Time
(s)
Acc (%)Pre (%)F1
(%)
Time (s)Acc (%)Pre (%)F1
(%)
Time (s)
SVM82.5481.4681.6034191.8591.2191.4535983.4582.4892.32507
LR75.9575.1375.2429976.9676.4576.1143678.5877.1677.91489
LSTM79.3277.9878.4528082.4181.7882.0431977.3676.3476.14515
GRU84.4583.6483.2134883.2381.9482.6833187.2186.2786.67526
KNN60.1258.8659.6727462.3561.4561.4845162.4560.9861.22551
RF64.0963.1263.5430074.6873.8673.9145666.2365.4765.19392
XGBoost73.6773.0173.1226576.4375.4575.4838861.8161.2561.42570
LightGBM75.4874.3674.1131477.6474.9775.1847063.9463.1163.07540
Proposed93.2992.5792.6834397.6796.9897.1433595.5894.8794.68375
Table 6. Comparison of several ensemble strategies using TF-IDF on BuzzFeed dataset.
Ensemble TechniquesAcc (%)Pre (%)F1 (%)
Bagging91.5490.4790.67
Boosting89.6788.9988.76
Soft Voting92.4591.8691.98
Stacking92.7892.1492.03
Weighted Voting97.6796.9897.14
Table 7. Comparison of the proposed model with various language models using TF-IDF on BuzzFeed dataset.
ModelAcc (%)Pre (%)F1 (%)Time (s)
BERT84.6783.5484.21530
DistilBERT82.9181.6782.18475
AlBERT94.5693.6293.27510
RoBERTa91.8291.1491.33522
Proposed97.6796.9897.14335
Table 8. Model performance on BuzzFeed and PolitiFact datasets with cross-validation.
Dataset5-Fold10-Fold15-Fold
BuzzFeed97.6797.4597.32
PoltiFact98.7698.3498.12
Table 9. Comparison of the proposed model with state-of-the-art models on PolitiFact and BuzzFeed datasets.
ModelDatasetAcc (%)Pre (%)F1 (%)
[48]PolitiFact88.4087.9092.40
[49]PolitiFact 85.5870.5976.19
[50]BuzzFeed65.5065.5066.80
[51]BuzzFeed93.4189.9093.68
ProposedPolitiFact98.7698.0397.98
BuzzFeed97.6796.9897.14
Disclaimer/Publisher’s Note: The statements, opinions and data contained in all publications are solely those of the individual author(s) and contributor(s) and not of MDPI and/or the editor(s). MDPI and/or the editor(s) disclaim responsibility for any injury to people or property resulting from any ideas, methods, instructions or products referred to in the content.

