Article

Bi-Objective Integrated Scheduling of Job Shop Problems and Material Handling Robots with Setup Time

1
Macau Institute of Systems Engineering, Macau University of Science and Technology, Macao 999078, China
2
Zhuhai MUST Science and Technology Research Institute, Macau University of Science and Technology, Zhuhai 519031, China
3
School of Business, Qingdao University, Qingdao 266071, China
*
Authors to whom correspondence should be addressed.
Mathematics 2025, 13(3), 447; https://doi.org/10.3390/math13030447
Submission received: 4 January 2025 / Revised: 21 January 2025 / Accepted: 27 January 2025 / Published: 28 January 2025
(This article belongs to the Section E: Applied Mathematics)

Abstract

:
This work investigates the bi-objective integrated scheduling of job shop problems and material handling robots with setup time. The objective is to minimize the maximum completion time and the mean of earliness and tardiness simultaneously. First, a mathematical model is established to describe the problems. Then, different meta-heuristics and their variants are developed to solve the problems, including genetic algorithms, particle swarm optimization, and artificial bee colonies. To improve the performance of algorithms, seven local search operators are proposed. Moreover, two reinforcement learning algorithms, Q-learning and SARSA, are designed to help the algorithm select appropriate local search operators during iterations, further improving the convergence of algorithms. Finally, based on 82 benchmark cases with different scales, the effectiveness of the suggested algorithms is evaluated by comprehensive numerical experiments. The experimental results and discussions show that the genetic algorithm with SARSA is more competitive than its peers.

1. Introduction

Within production organizations, scheduling plays an extremely important role, especially in the context of manufacturing planning [1]. The efficacy of a manufacturing planning system is determined by the performance of its scheduling approach. Scheduling is categorized based on the job environment, job characteristics, and optimization criteria [2]. The job environment can also be referred to as a machine environment. Scheduling is further divided into single-stage and multi-stage based on machine setup. In single-stage scheduling, there is only one machine and a few tasks, whereas in multi-stage scheduling, there are multiple machines and jobs.
Job Shop Scheduling (JSP) is a critical issue in resource allocation. Resources in this context are referred to as machines, and the basic units of work are called jobs. Each job can consist of several sub-tasks, known as operations, which are interconnected by priority constraints. JSP is a significant class of nondeterministic polynomial-time (NP) problems, similar to the traveling salesman problem [3].
In a static JSP, deterministic jobs are handled by a pre-determined number of machines. The sequence of actions for every individual job is pre-established, and each task must be completed exactly once. It is not possible to perform two tasks simultaneously on the same machine and must wait until the previous operation is completed on that machine. Arranging the operating slots on the device, or computer, is referred to as a schedule. The maximum completion time (makespan) is one of the most common objectives for the JSP.
The bi-objective integrated scheduling of job shop problems and material handling robots (MHR) with setup time, known as BI-JSP-MHR, is a generalization of production scheduling issues. Unlike the classic JSP, which does not consider transportation resources and assumes an unlimited number of MHRs. The BI-JSP-MHR takes into account the practical constraints of workshops. Workshops often have a finite number of MHRs due to the high costs and the limitations of the workshop layout. Setup time is an essential auxiliary factor required for different operations and processes to be carried out on a machine, and it plays a significant role in the overall cycle time of an operation. A shorter setup time can boost productivity by minimizing machine idle time between production runs. Conversely, excessive setup time can significantly slow down the production process, leading to higher costs and longer lead times for customers. Therefore, optimizing the concerned problems with setup time is a key factor in enhancing the efficiency and competitiveness of manufacturing operations. Consequently, research on BI-JSP-MHR aligns more closely with the actual conditions of production, making it highly significant in theoretical studies. BI-JSP-MHR must address two sub-issues: the selection of MHRs and the scheduling of tasks.
Due to the sequential logic constraints between the transport and processing stages, the problem is not easily decoupled. Compared with JSP, BI-JSP-MHR is significantly more challenging, as detailed below:
(1) In addition to the problem of scheduling for processing machines with operational constraints, it is also necessary to address the task assignment for the MHRs.
(2) There is a significant difference between the transport behavior of MHRs and that of machines. These actions are performed alternately, and there may be required waiting periods during execution. This leads to a more complex cascade effect in the calculation of the number of completed jobs.
(3) It is difficult to decouple the interdependence of processing tasks and transport tasks, which implies that a layered or decoupling mechanism might lose its optimal solution.
Clearly, BI-JSP-MHR is a more complex NP-hard problem than JSP. The complexity of BI-JSP-MHR makes it more challenging to study its intrinsic properties and solutions.
The novel contributions this work aims to make include the following:
(1) Establish a double-objective mathematics model for the integration of job shop problems and material processing robots.
(2) Improve different meta-heuristics, including Artificial Bee Colony (ABC), Genetic Algorithm (GA), and Particle Swarm Optimization (PSO), are developed to solve the problems.
(3) Seven local search operators based on problem features are devised for enhancing the quality of algorithms.
(4) Q-learning and SARSA-based local search operators are developed and embedded into meta-heuristics to select high-quality local search strategies.
The designed algorithms enable efficient solving of 82 benchmark instances with different sizes, which provides valuable insights for practical production applications.
The rest of this paper is organized as follows. Section 3 develops a double-objective mathematics model for the integration of the job shop problem and material processing robot. Section 4 presents three meta-heuristics with reinforcement learning-based improved strategies in detail. Section 5 presents experimental results and comparisons. Finally, this study is summarized, and future research directions are suggested in Section 6.

2. Literature Review

2.1. Fundamental Problems

To address the JSP, some classical optimization technologies like [4,5,6,7,8,9] and meta-heuristics are designed, e.g., Ant Colony Optimization (ACO) [10], GA [11], and PSO [12]. These meta-heuristics can get obtain solutions quickly. In addition, several Lourenço researchers built a Local Retrieval process using [12] for the JSP. Wang et al. [13], Pinson [14], and Cheng. [15] introduce several heuristic approaches. Moreover, a combined approach to optimize JSP was designed [16].
The JSP with AGV (JSP-AGV) is the extension of the JSP-MHR. The AGVs are specialized form of automated guidance machines. To minimize the makespan of JSP-AGV, Bilge and Ulusoy [17] establish a non-linear mixed-integer programming model and introduce a solution through the iteration technique. Deroussi et al. [18] put forth a neighborhood system. Erol et al. [19] devise a real-time multi-agent system that employs a negotiation/bidding mechanism among agents to create viable schedules. Kumar et al. [20] utilize two heuristics, one for machine selection and another for vehicle allocation. A mixed Integer Linear Programming (MILP) model and a Tabu Search (TS) algorithm, the innovation of the algorithm is the design of two-dimensional solution coding and a two-neighborhood mechanism [21]. Fontes et al. [22] develop a novel MILP model to address modest-sized instances. Fontes et al. [23] propose an integrated method combining PSO with simulated annealing. Nageswara et al. [24] introduce various initial methods to address the JSP-AGV. Lacomme et al. [25] model the JSP-AGV using a distinct preclusive graph and apply a hybrid evolutionary algorithm. Ham [26] aims to refine the solutions for JSP-AGV. Yao et al. [27] craft an innovative sequential MILP model, demonstrating superior performance compared to other MILP models.
Chen et al. [28] introduce a hybrid PSO approach to address the integration challenge of machines and AGVs. Yao et al. [29] establish a novel mathematical model for the flexible job shop scheduling problem. With limited AGVS. Niu et al. [30] employ a novel multi-task chain scheduling algorithm based on capacity prediction to solve the AGV dispatching problem in an intelligent manufacturing system. Hu et al. [31] employ the “first-in, first-out” heuristic to allocate the optimal AGV for every shipping assignment and then seek out the best local solutions. Yuan et al. [32] and Wen et al. [33] take into account the constraints of machinery, tasks, and AGVs, addressing the adaptable multi-objective job shop scheduling challenge involving AGVs using an enhanced NSGA-II algorithm. Goli et al. [34] explore the role of AGVs in Cellular Manufacturing Systems and develop an imprecise linear–integer programming model to it. The aim of this research is to reduce the production cycle time and the movement within intercellular areas.

2.2. Research Methods

Classic swarm and evolutionary algorithms, such as ABC, GA, and PSO, have been extensively applied to solve variant combination optimization problems. Numerous studies, including those by Liu et al., Huang et al., Fu et al., Qiao, Liu, and Cao, have employed these algorithms [35,36,37,38,39,40,41]. Yu et al. [42] employ GA and ABC to address dynamic surgery scheduling problems with fuzzy processing and setup times. Furthermore, Yu et al. [43] introduce an ABC algorithm based on Deep Q-Network (DQN). For addressing multi-objective heterogeneous USV scheduling problems. Lin et al. [44] use GA and PSO. To solve the urban traffic light scheduling with eight phases. GA, PSO, and Differential Evolution (DE) are proposed to address the multi-objective urban traffic light scheduling problem [45].
Q-learning, a widely utilized method in Reinforcement Learning (RL), has garnered significant attention across several articles [46,47,48]. Ensemble Q-learning has demonstrated the ability to enhance the performance of meta-heuristics. Li et al. [49] develop an ABC algorithm integrated with Q-learning and local search to tackle permutation flow shop scheduling problems. Chen et al. [50] incorporate Q-learning into GA, to realize intelligent parameter adjustment. Shen et al. [51] propose a novel memetic algorithm based on Q-learning for scheduling multi-objective dynamic software projects. Hsieh et al. [52] present an optimal swarm and optimal approach for the scheduling of economic problems. Gao et al. [53] introduce a novel approach that embeds Q-learning into meta-heuristics for the scheduling of unmanned ships.
Despite these investigations, further research is warranted for the problem at hand. As many scholars have noted, BI-JSP-MHR represents an advanced form of the conventional JSP. However, incorporating MHRs into the scenario can significantly alter the scheduling dynamics, and in some instances, the scheduling of MHRs might take precedence.

3. Problem Description

3.1. Problem Description

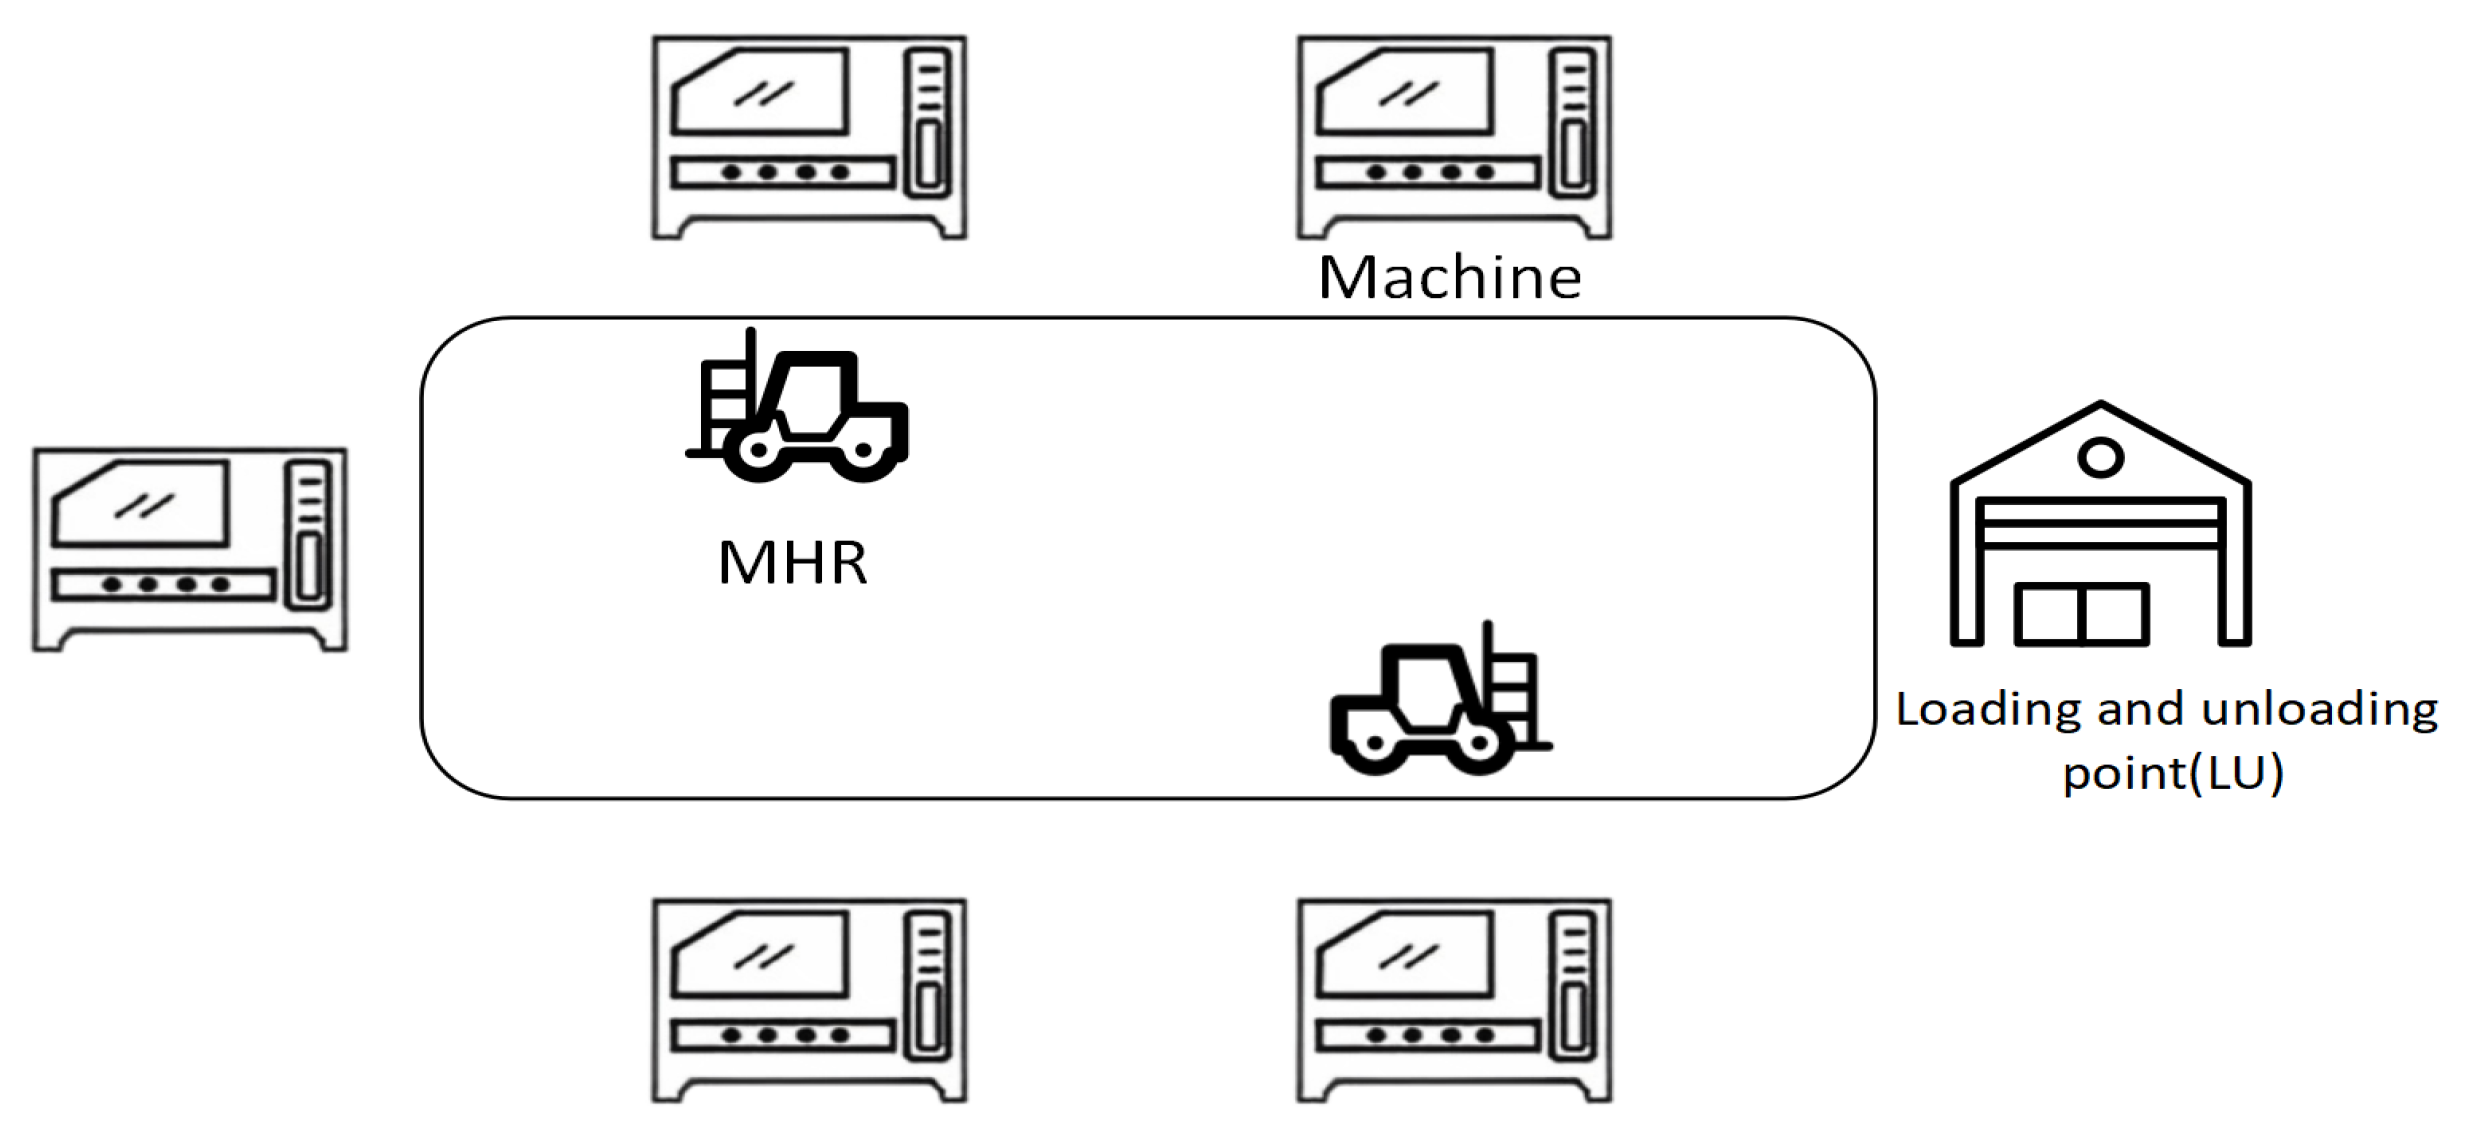
This study establishes a two-objective mathematical model to describe the integration of the job shop problem and the material handling robot with setup time. In the problem, part of the work is processed on certain machines, with each job comprising more than one operation. The MHR is responsible for transporting jobs. The work initiates at the Loading and Unloading (LU) station, which is located at a certain distance from the machinery. The MHR transportation takes time, and the movement of the MHR can be categorized into empty and loaded trips. An empty trip refers to the MHR’s journey from its current position to the designated machine to pick up a job, while a loaded trip is the MHR’s movement from picking up a job to delivering it to the destination machine. Figure 1 illustrates a production scenario with two MHRs and five machines. Our goal is to assign the most suitable processing machine and MHR to each job. Then, determine the order in which operations are performed on both the machines and the MHRs to minimize the objective. Specifically, once the final step in the work process is completed, an MHR is scheduled to deliver the finished product to the warehouse where finished goods are stored. Although transportation time is not included in the processing time of the job, it is crucial to monitor the MHR’s loading and unloading states.
The BI-JSP-MHR meets the following conditions:
(1) At time 0, all machines and MHRs are available.
(2) The time of loading and unloading is included in the transportation time.
(3) Each machine can handle a maximum of one operation.
(4) Each MHR can carry a maximum of one job.
(5) It is not possible to pre-empt an MHR when a transport task has begun.
(6) All MHRs have a fixed velocity, and the transmission time depends only on the location of the job.
(7) Each job can only be handled on one machine and can only be carried by one MHR when it is transferred from one machine to another. Once a job begins, it cannot be stopped until finished.
(8) After completion, work is returned to LU, but time is not taken into account.
(9) Different tasks have different setup times on the same machine.
Figure 2 offers a visual representation of a Gantt chart for BI-JSP-MHR involving two jobs, two machines, and one MHR. Initially, the MHR moves J 2 to M 1 , and then M 1 starts processing O 21 . Following it, the MHR has to travel to the loading/unloading area and transport J 1 to M 2 . At time t, J 2 waits for the MHR transportation from M 2 to M 1 , and then it can start transporting J 2 from M 1 to M 2 . The following steps are executed in a similar way. Finally, the makespan, denoted as C m a x , is defined as the completion time of O 12 .
Setup time primarily refers to the time spent on preparatory activities, such as cleaning the machine and replacing fixtures, molds, and other auxiliary tasks, when the machine is processing the next operation [54]. Setup time can be classified into two types: sequence-independent setup time and sequence-dependent setup time. Sequence-independent setup time suggests that the setup time for a machine depends solely on the current operation and not on the previous operations of the same machine; thus, it can be considered independent and unaffected by other operations. However, typically, the setup time of an operation is related not only to the current operation but also to the previous operation of the machine. That is, the setup time is linked to the processing sequence of the operation. Different processing sequences of operations result in different setup times for the machine. In such cases, constraints on the sequence among operations should be considered when accounting for the number of machine setup times. The timing typically includes the time required to replace fixtures and molds, as well as the time needed for preparatory activities such as loading and unloading the job and starting the machine after the job arrives. Regardless of whether the auxiliary time is before or after the job’s arrival, it is treated as separate setup time. In this study, the setup time due to equipment setup after the job’s arrival during the waiting time is considered, which reduces the impact of waiting times on scheduling and aligns better with actual production conditions. Some example data on time are presented in Table 1.
Setup time is an essential auxiliary time required for different operations and processes to be carried out on a machine, and it plays a significant role in the overall cycle time of an operation. There are typically two approaches to handling setup time in the optimization scheduling problem of a workshop: one is to include it within the processing time; the other is to consider it separately, distinct from the processing time. As research evolves, treating setup time as a separate component is becoming a trend in the study of workshop scheduling problems. In this paper, we explore the impact of setup time on the classical job shop. By considering setup time as a separate component, the optimization of shop floor scheduling becomes more reflective of real-world workshop scenarios, enhancing its practical utility.
As shown in Figure 3, treating the setup time of the machine tools in the production process as part of the processing time effectively extends the production time. The number shown in Figure 3 is example time from Table 1. In this case, the shop scheduling problem only considers the processing time of the operation, which makes the final completion time of the operation closer to the actual production time, but the improvement in optimizing the shop scheduling problem is not particularly significant.
As shown in Figure 4, considering the setup time as a separate part makes it more aligned with real-world conditions of store production, making the optimization of store production scheduling more practically applicable.

3.2. Mathematical Model

The symbols employed in our model are detailed in Table 2.
The mathematical model can be described as follows:
min f ( C m a x , E / T )
C m a x = m a x ( C 1 , C 2 , . . . , C i , . . . , C n )
C i S T O i , o + P t i , o + S E i , o , i
E / T = i = 1 n c i d i n
k v x i , j , k = 1 , i , j , k
S T O i , j S T O i , j + P t i , j + S E i , j D · y i , j , i , j , i , j , i , j , a n d j < j
S T O i , j S T O i , j + P t i , j + S E i , j D · ( 1 y i , j i , j ) , i , j , i , j , a n d j < j
S T O i , j S T L O i , j + T t i , j , i , j
S T L O i , j S T O i , ( j 1 ) + P t i , ( j 1 ) + S E i , ( j 1 ) , i , j a n d j 1
S T L O i , j S T L O i , j + T t i , j + T E P i , j S P i , j D · ( 2 x i , j , k x i , j , k ) D · z i , j , i , j , k , i , j , i , j , a n d j < j
S T L O i , j S T L O i , j + T t i , j + T E P i , j S P i , j D · ( 2 x i , j , k x i , j , k ) D · ( 1 z i , j , i , j , k ) , i , j , i , j , a n d j < j
S T O i , j 0 , i , j
S T L O i , j 0 , i , j
x i , j , k 0 , 1 , i , j , k
y i , j , i , j 0 , 1 , i , j , k
z i , j , i , j , k 0 , 1 , i , j , k
Constraint (1) presents the objective function, which aims to minimize both the makespan and the earliness and tardiness (E/T). Constraints (2) and (3) make sure that the makespan is longer than the finish time of any job. Constraint (4) calculates the ET. Constraint (5) provides for the allocation of traffic among the MHRs and for each transport to be allocated only one MHR. Constraints (6) and (7) indicate that each pair of concurrent operations is assigned a unique priority regardless of their processing time. Constraint (8) guarantees that a processing task must wait until the associated transport task has been finished before it can commence. Constraint (9) implies that the commencement of a transport activity is conditional on the completion of a previous activity, with the exception of the commencement of the work. Constraints (10) and (11) show the sequential relation of any two transports of the same MHR, ensuring that only one transport can be carried out by the MHR. The MHR will have an extra trip if the starting point of the ongoing transfer of the MHR and the last transmission are not the same. Constraints (12) and (13) ensure that the commencement times for both the processing and the loading of an operation are non-zero. Constraints (14), (15), and (16) define the decision variables.

3.3. Multi-Objective Optimization

The criterion of makespan has been extensively studied by researchers in the JSP domain. For manufacturing firms operating under a Just-In-Time (JIT) philosophy, adherence to due dates is paramount. The essence of JIT production lies in minimizing inventory, enhancing responsiveness, cash flow, and customer satisfaction. In the JIT paradigm, delivering early results in excess inventory, while late delivery leads to tardiness. Consequently, this study addresses the reduction of both the makespan in JSP and the average of earliness and tardiness. These objectives are mildly conflicting and have been referenced in existing literature.

4. Proposed Algorithm

4.1. Solution Representation

There are two sub-problems in BI-JSP-MHR, which are job scheduling and MHR scheduling. So, according to the characteristics of the concerned problem, a two-layer representation of the solution is used. The first layer (operation layer) is responsible for the expression of all operations. The second layer (MHR layer) is an indicator of the MHRs carrying the corresponding job. Figure 5 gives an example of an instance of a size 3 job, 3 machines, and 3 MHRs. The comprehensive scheduling scheme in this example can be described as a combination of operations and MHRs ( O i , j , k ) . Every ( O i , j , k ) means V k carries O i , j . Accordingly, the scheduling scheme may be described as follows: ( O 1 , 1 , 1 ) , ( O 2 , 1 , 2 ) , ( O 1 , 2 , 3 ) , ( O 3 , 1 , 1 ) , ( O 2 , 2 , 3 ) , ( O 2 , 3 , 2 ) , ( O 3 , 2 , 1 ) , ( O 1 , 3 , 3 ) , and ( O 3 , 3 , 1 ) .

4.2. Meta-Heuristics

Meta-heuristics have been improved and refined to deal with complex optimization problems. Three classic meta-heuristics are used in this work, including ABC, PSO, and GA. They begin from an initial population, then are updated iteratively using algorithms and specific strategies. The main steps of the three meta-heuristics are as follows:
Step 1. Initialization of population and parameters.
Step 2. Evaluate the original solution.
Step 3. Execute strategies specific to algorithms.
Step 4. Produce new solutions and assess them.
Step 5. If the new solution is superior to the existing one, the population will be updated. Otherwise, keep the old one.
Step 6. If the stopping criterion is satisfied, output results. If not, return to Step 3.

4.2.1. GA

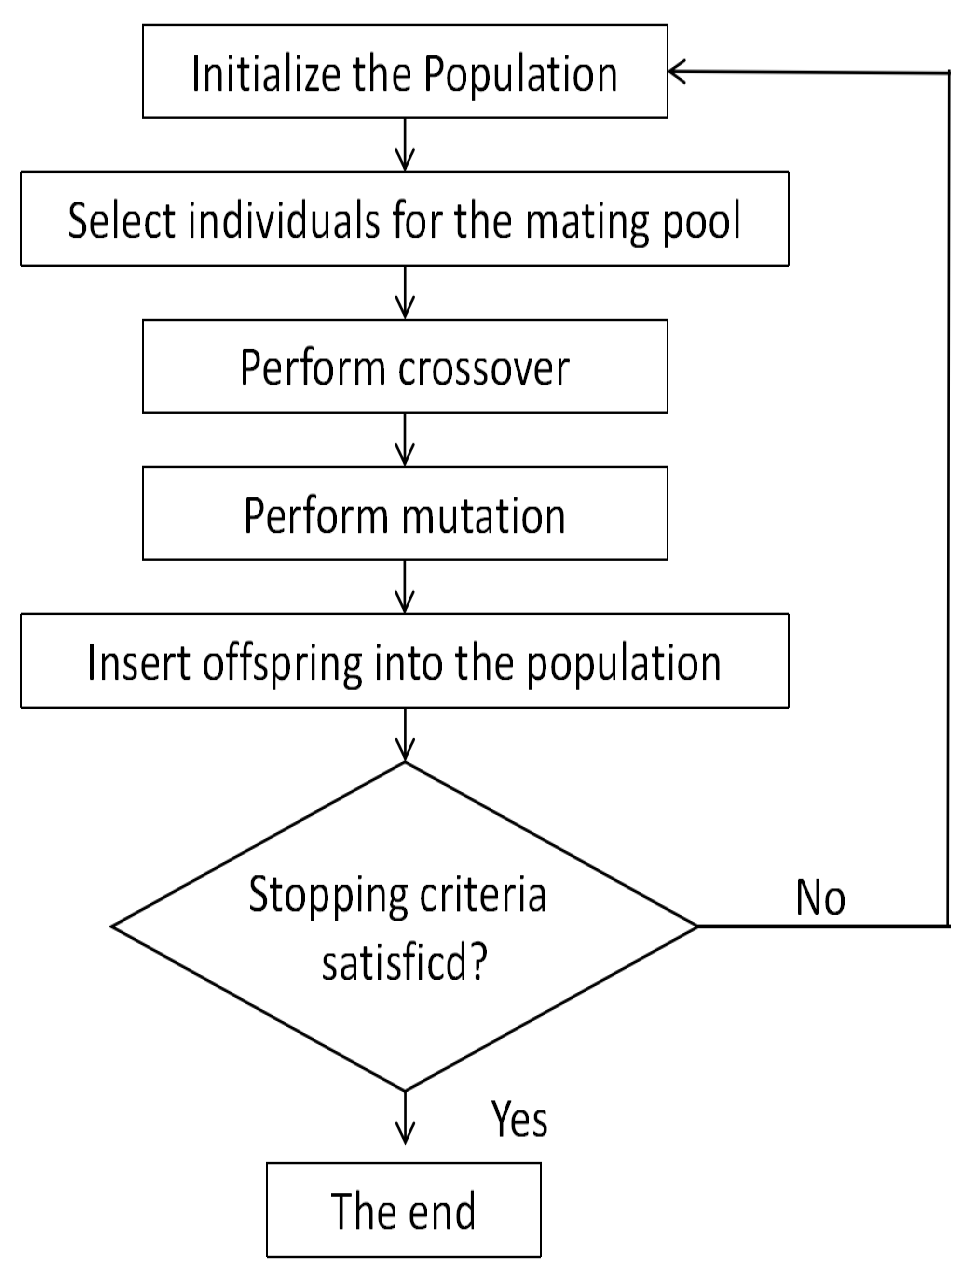
The GA is well suited for addressing production scheduling issues because it operates on a set of potential solutions instead of focusing on a single solution as heuristic searches do. In GA, each chromosome or individual corresponds to a specific sequence of tasks. The algorithm is fundamentally an evolutionary technique that is based on the principle of natural selection, where the fittest survive. The fundamental unit of a GA is the solution encoding, often referred to as a chromosome or an individual, which embodies a potential solution to the problem at hand. Figure 6 depicts the flowchart of the GA process.
(1) Initial solution: The initial solution is obtained randomly as a set of job variations in each machine. The number of operations to perform is equal to the total generations for each chromosome.
(2) Selection: the work is performed using the roulette wheel tournament method.
(3) Crossover: a random procedure is used to cross two points.
(4) Mutation: the exchange mutation is used to avoid the deterioration of the population in its local optimum solution.
(5) Stopping criteria: Generation count is used as a stop condition. In order to solve this problem, we adopt three GA factors, which are population size, crossing probability ( P C ), and mutation probability ( P m ). Figure 6 illustrates the flow pattern of GA factors.

4.2.2. PSO

PSO was developed based on the assumption that birds were social. This paper presents a PSO algorithm that simulates the movement patterns of birds and their information sharing methods to solve an optimization problem. PSO is considered to be one of the most effective algorithms in the real world.
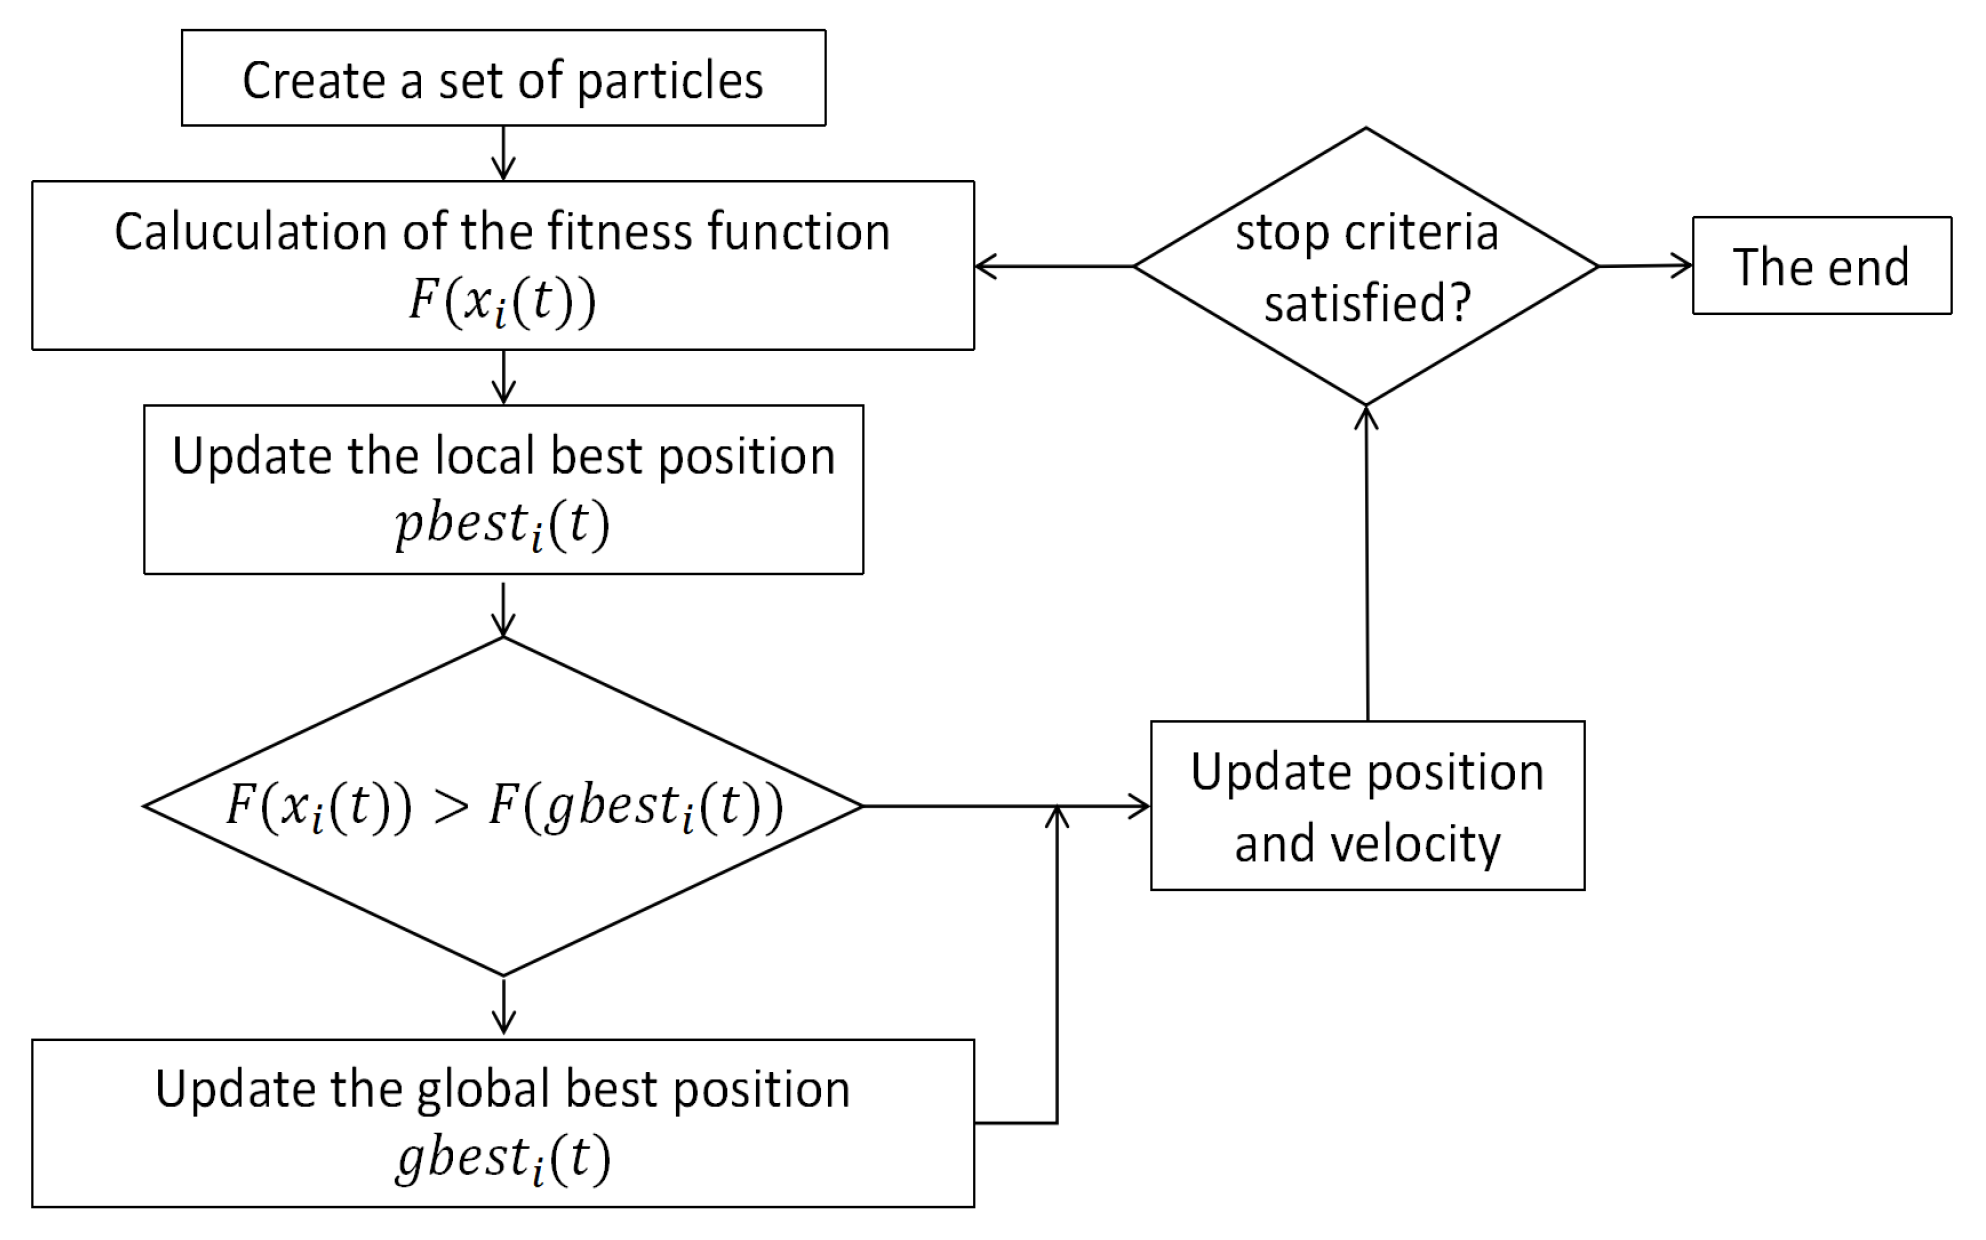
PSO is instrumental in tackling scheduling and routing challenges. The core parameters of PSO include the problem’s dimensionality, the swarm size (number of particles), the inertia weight, the range of iterations, the acceleration constants, and the social cognition factor. Figure 7 shows the operational flow of PSO.

4.2.3. ABC

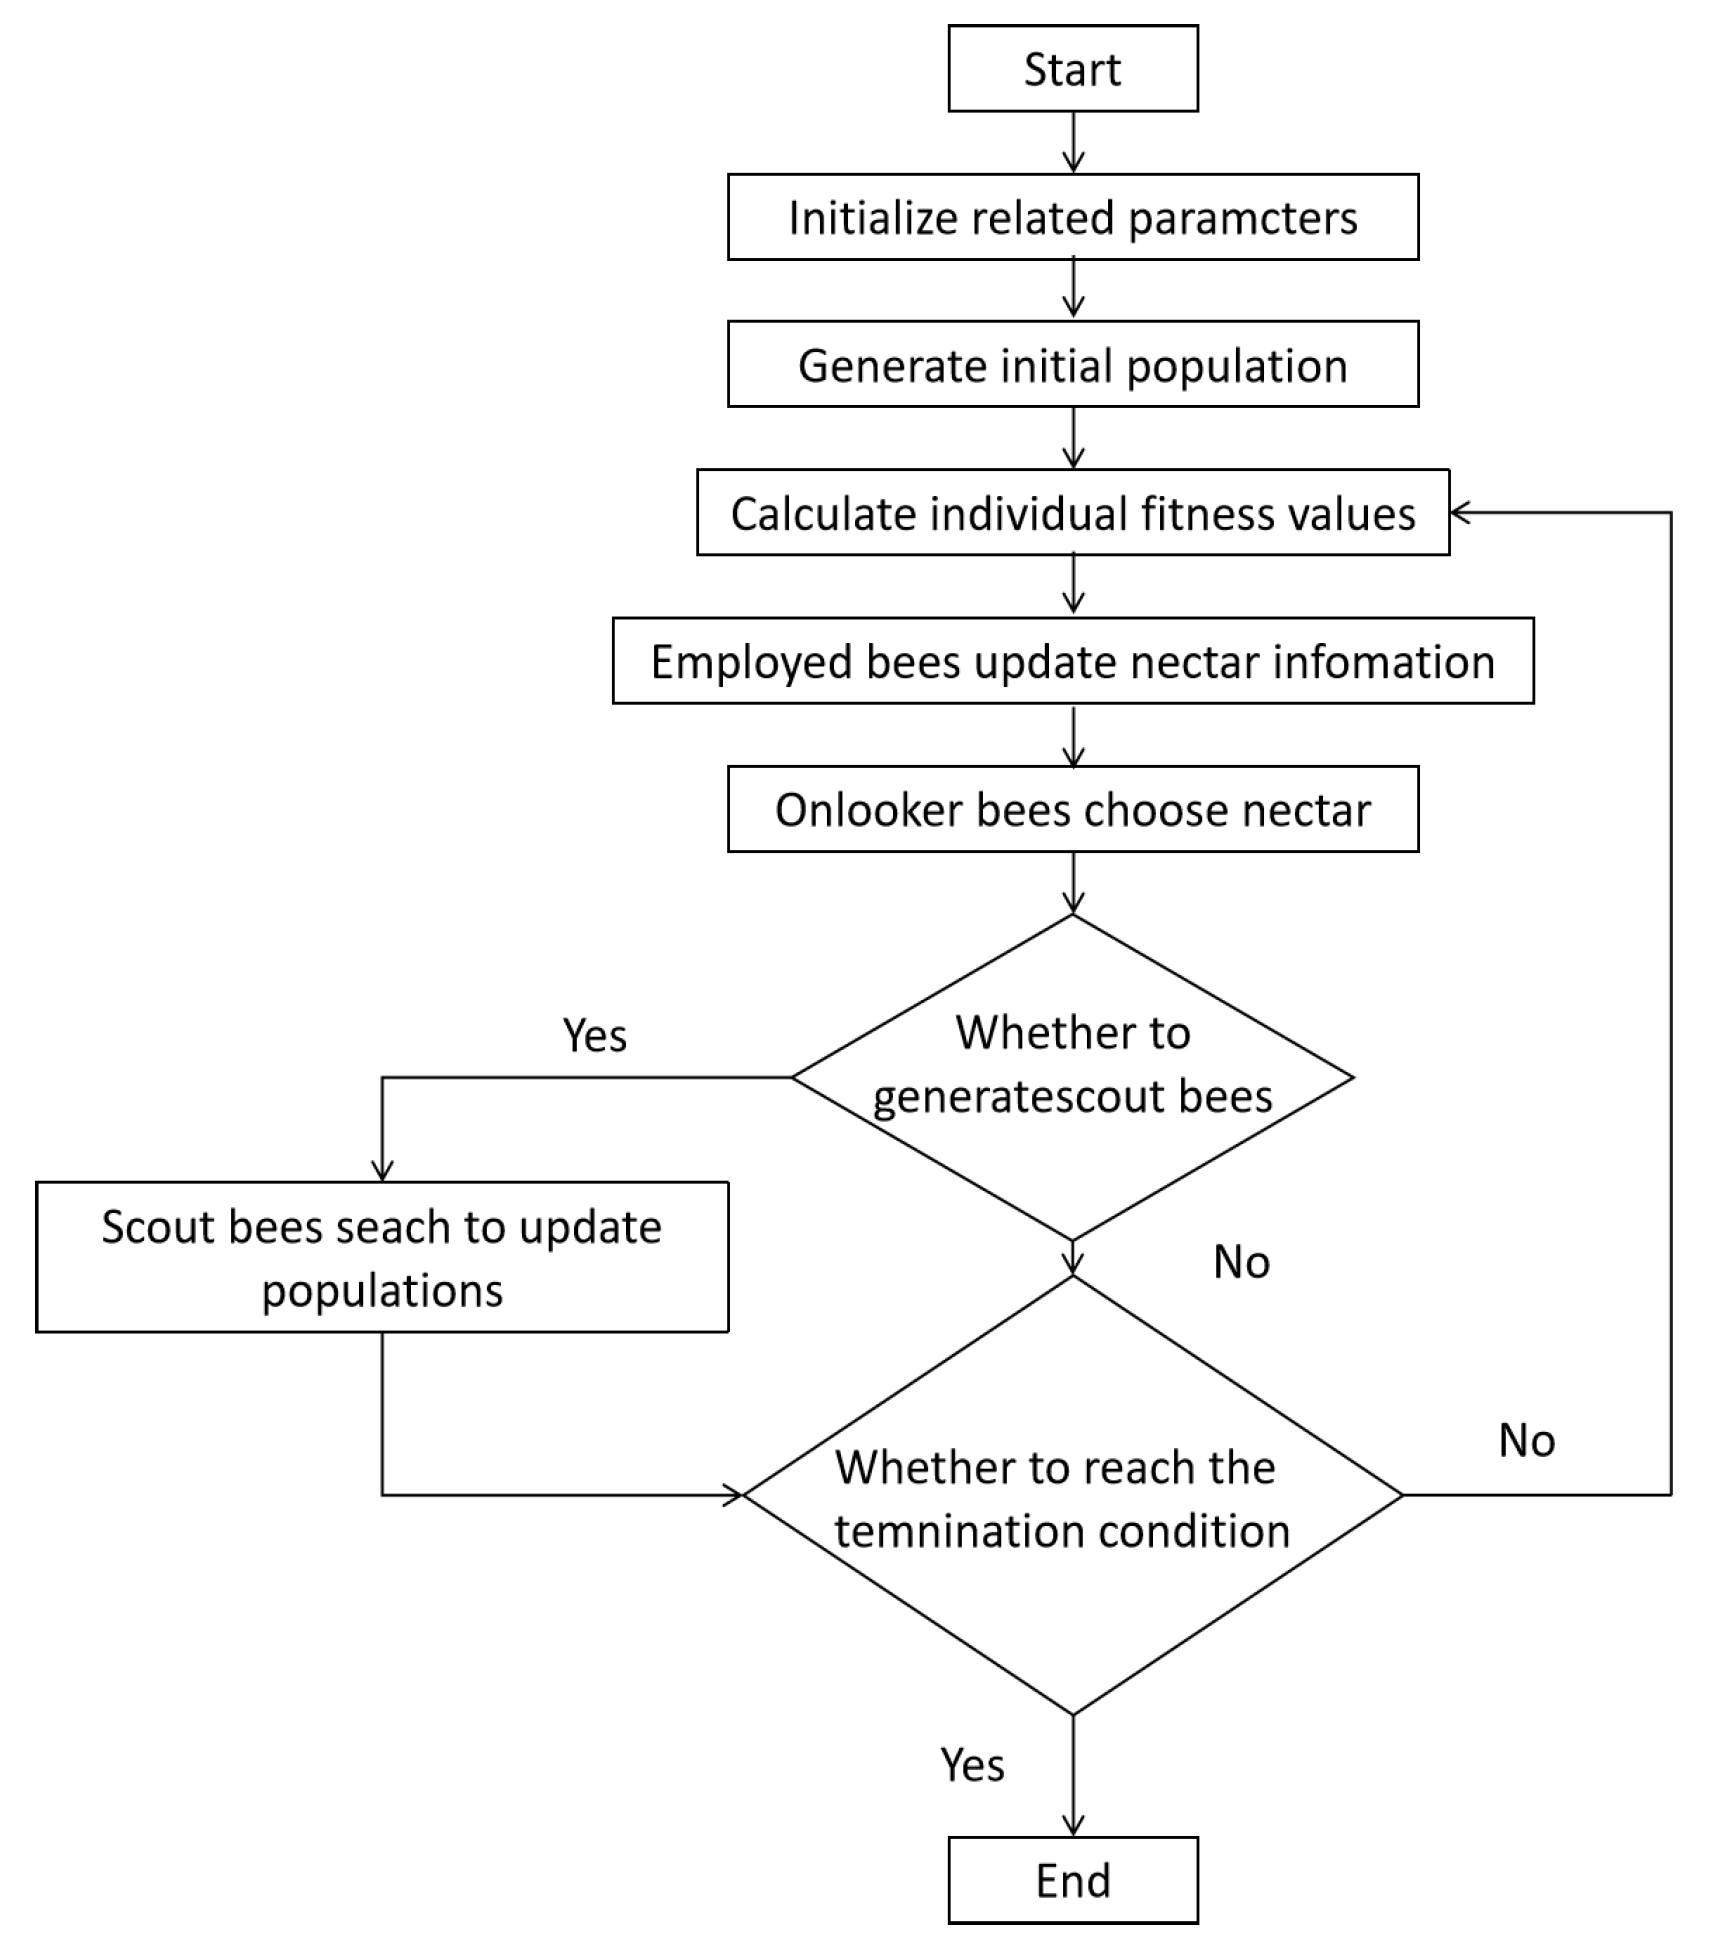
The problem’s solution space is presumed to be D-dimensional. The count of workers and onlookers is SN, equivalent to the number of nectar sources. The standard ABC algorithm addresses the optimization problem within a 2D search space framework. Each nectar source’s location symbolizes a potential solution, with the number of sources aligning with the fitness of the suitable solution. Employed bees are directly linked to nectar sources. To gain insight into the ABC algorithm, a flowchart is provided. The flowchart of the ABC algorithm is depicted in Figure 8.

4.3. Local Search

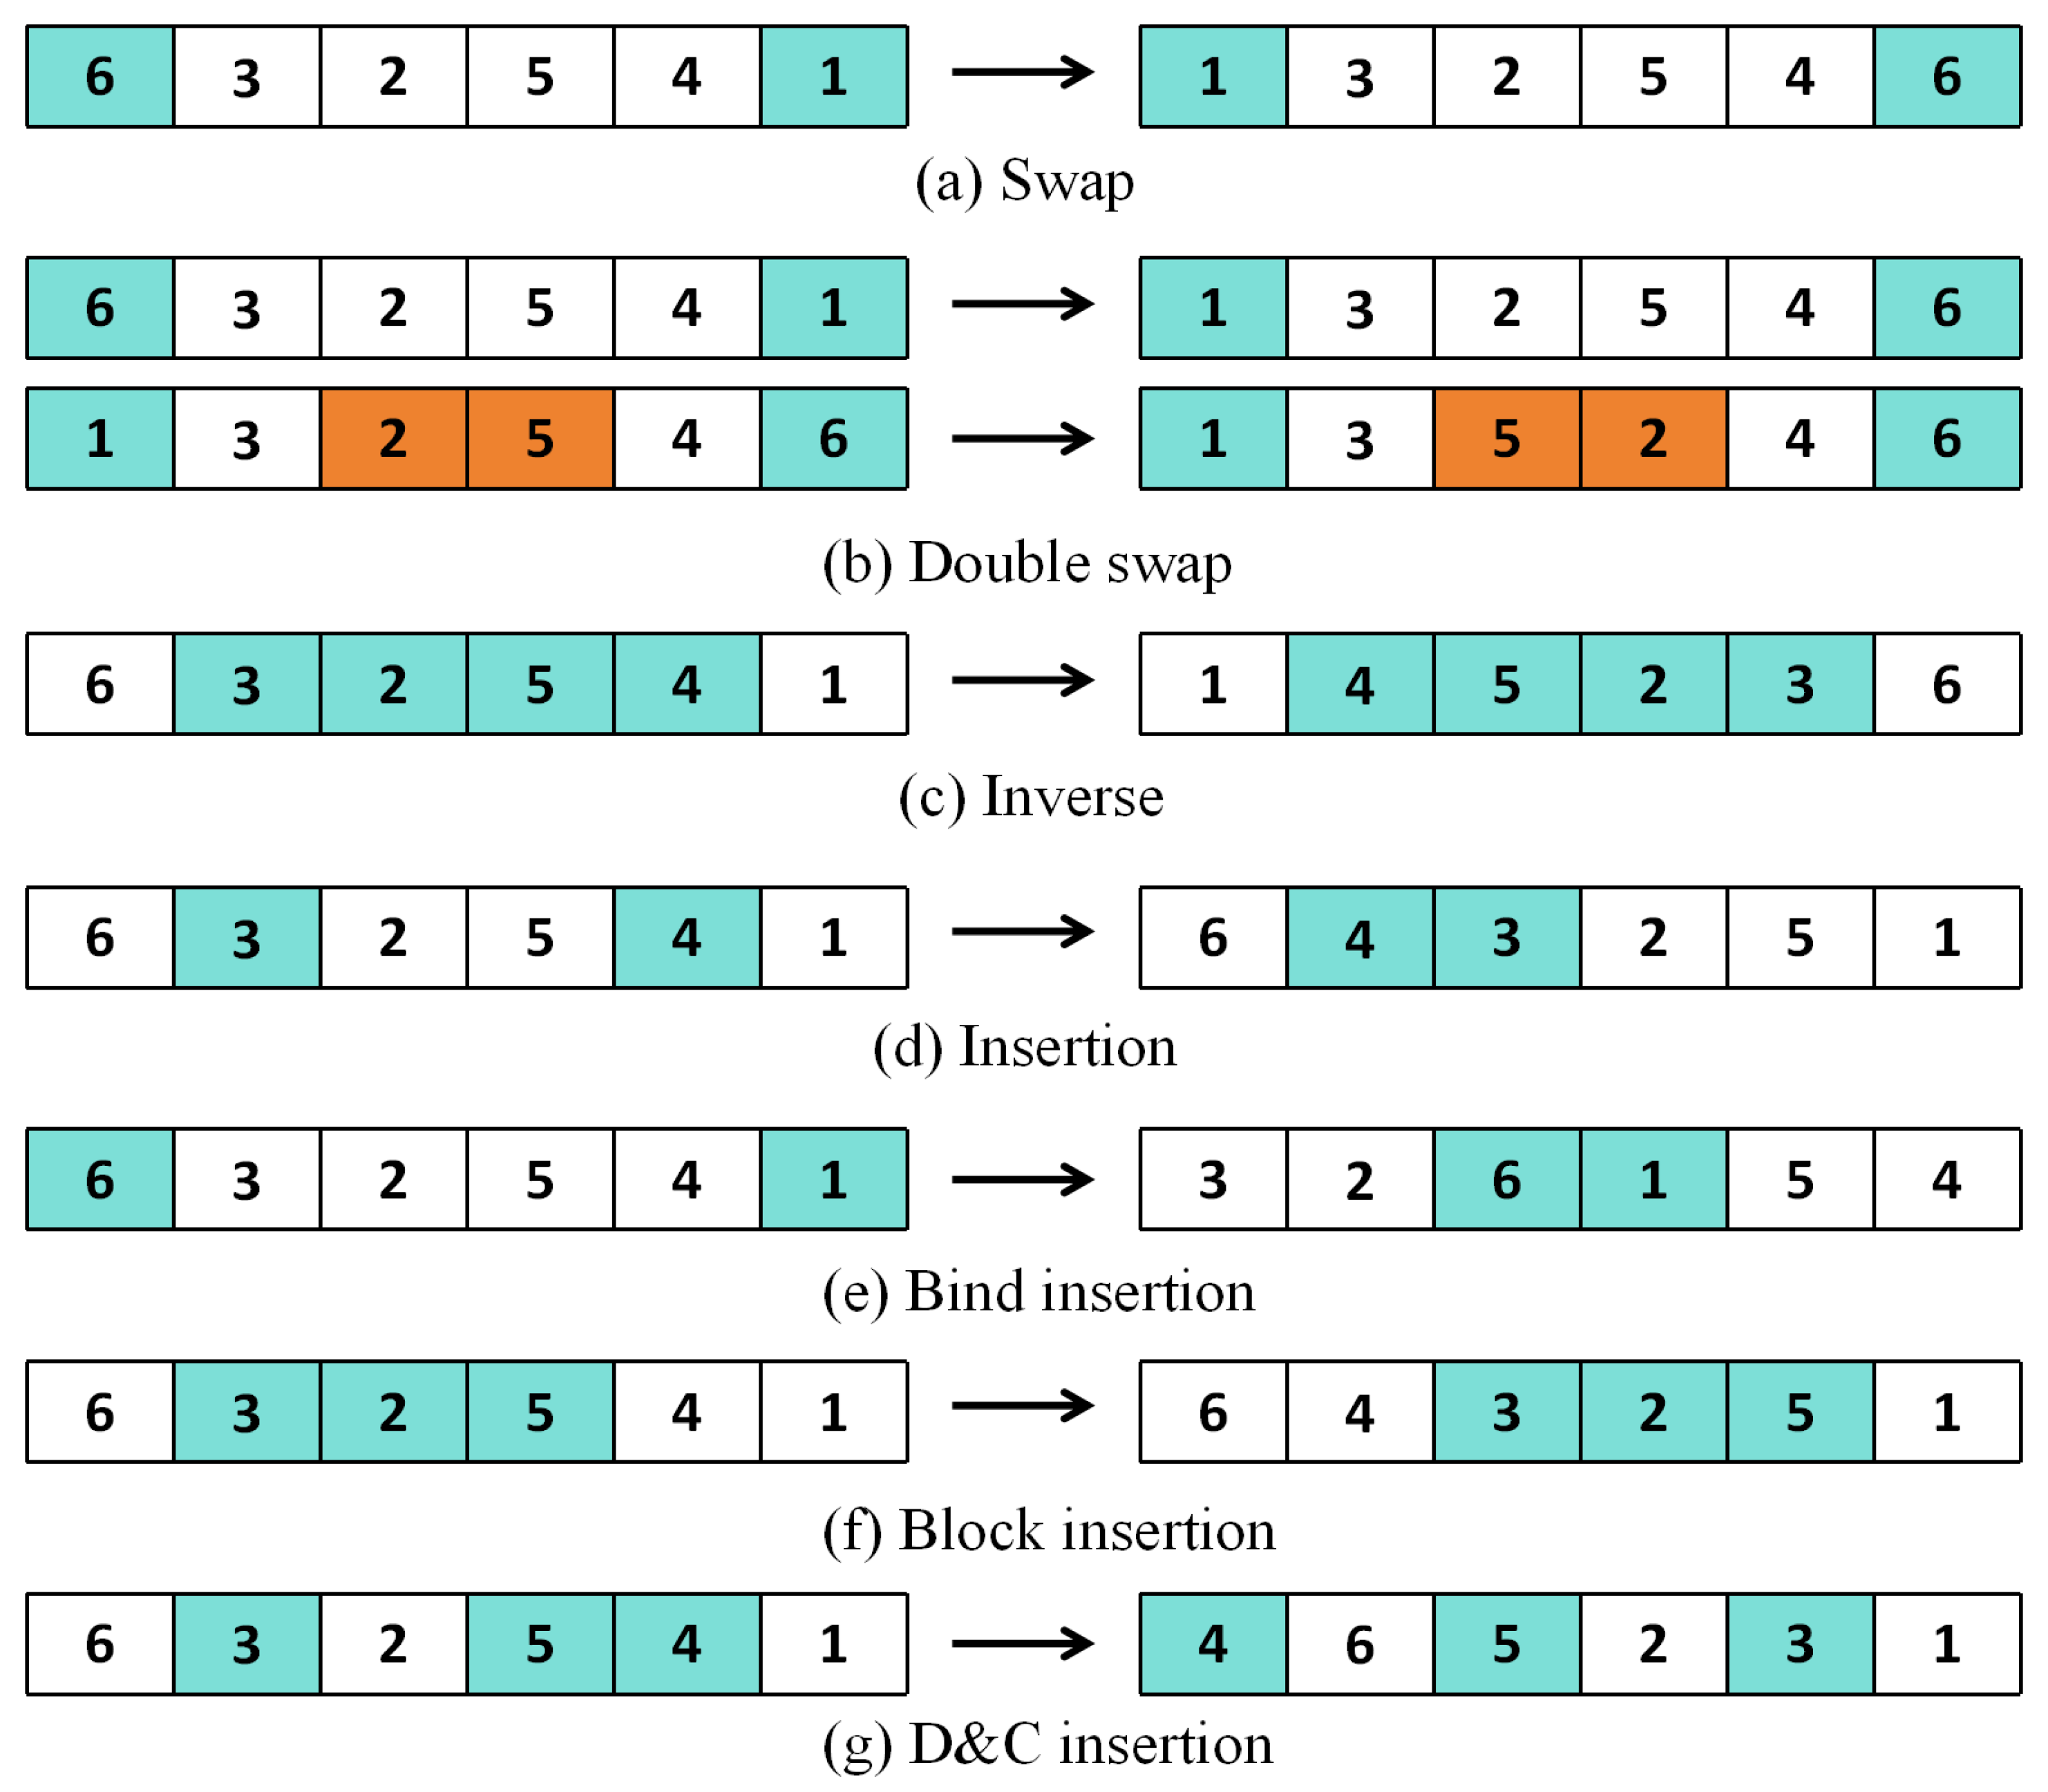
Meta-heuristics are known for their simplicity in implementation and rapid convergence. However, they are prone to falling into local optima during the iterative process. To circumvent settling for a suboptimal solution, this study designs seven local search techniques tailored to the problem’s characteristics. In the BI-JSP-MHR context, we conduct local searches on both the MHR sequences and the job sequence. The details of these seven local search operators are outlined as follows.
(1) Swap: within a solution, two jobs are randomly selected and their positions are interchanged, as shown in Figure 9a.
(2) Double swap: two separate swap operations are performed on a solution, as shown in Figure 9b.
(3) Reverse: two positions are arbitrarily chosen from a solution; reverse all the jobs between the two positions, as depicted in Figure 9c.
(4) Insert: two jobs are randomly chosen, their positional relationship is determined, the second job is inserted into the position of the first, and the subsequent jobs are shifted one position backward, as illustrated in Figure 9d.
(5) Bind insertion: Two jobs are randomly selected and placed in all possible locations while maintaining their order. The process is detailed in Figure 9e.
(6) Block insertion: two different positions within a solution are randomly chosen, treated as a single block, and the block is inserted into all possible locations within the solution, as shown in Figure 9f.
(7) D&C insertion: A set of jobs is randomly extracted from a solution, and these tasks are then randomly inserted back into all potential spots within the solution. Figure 9g shows the arrangement before and after the D&C insertion.

4.4. Reinforcement Learning

Reinforcement Learning (RL) is a type of machine learning framework in which an intelligent agent learns to make decisions by interacting with its environment to achieve specific goals. Through the process, the agent acquires knowledge and improves its performance over time based on feedback received from the environment. The foundation of RL lies in the ongoing exchange between the agent entities and their environment. Within the dynamic environment, the agent adjustment methods, in accordance with their accumulated experiences, have the objective of amplifying the aggregate value of sustained rewards over an extended period.
Using reinforcement learning to guide the local search process, the algorithm can focus on the most promising regions of the search space and select appropriate local structure. It can also learn to use more efficient search strategies, such as parallel exploration of different regions or adaptive adjustment of the search granularity. It can improve the scalability and efficiency of the algorithm, making it more suitable for solving large-scale and complex optimization problems.

4.4.1. Q-Learning

Q-learning is a decision-making method that does not directly train an agent to choose the correct action. Instead, it evaluates the agent’s actions based on responses from the environment. Through continuous interactions with the environment, agents select actions in response to feedback, with the ultimate goal of making the best decisions. The objective of Q-learning is to identify the Q-value for a specific state-action pair and subsequently determine the optimal action based on these values. Q-values are stored in a Q-table, which is initially a single matrix where the rows correspond to the number of states and the columns correspond to the number of possible actions.
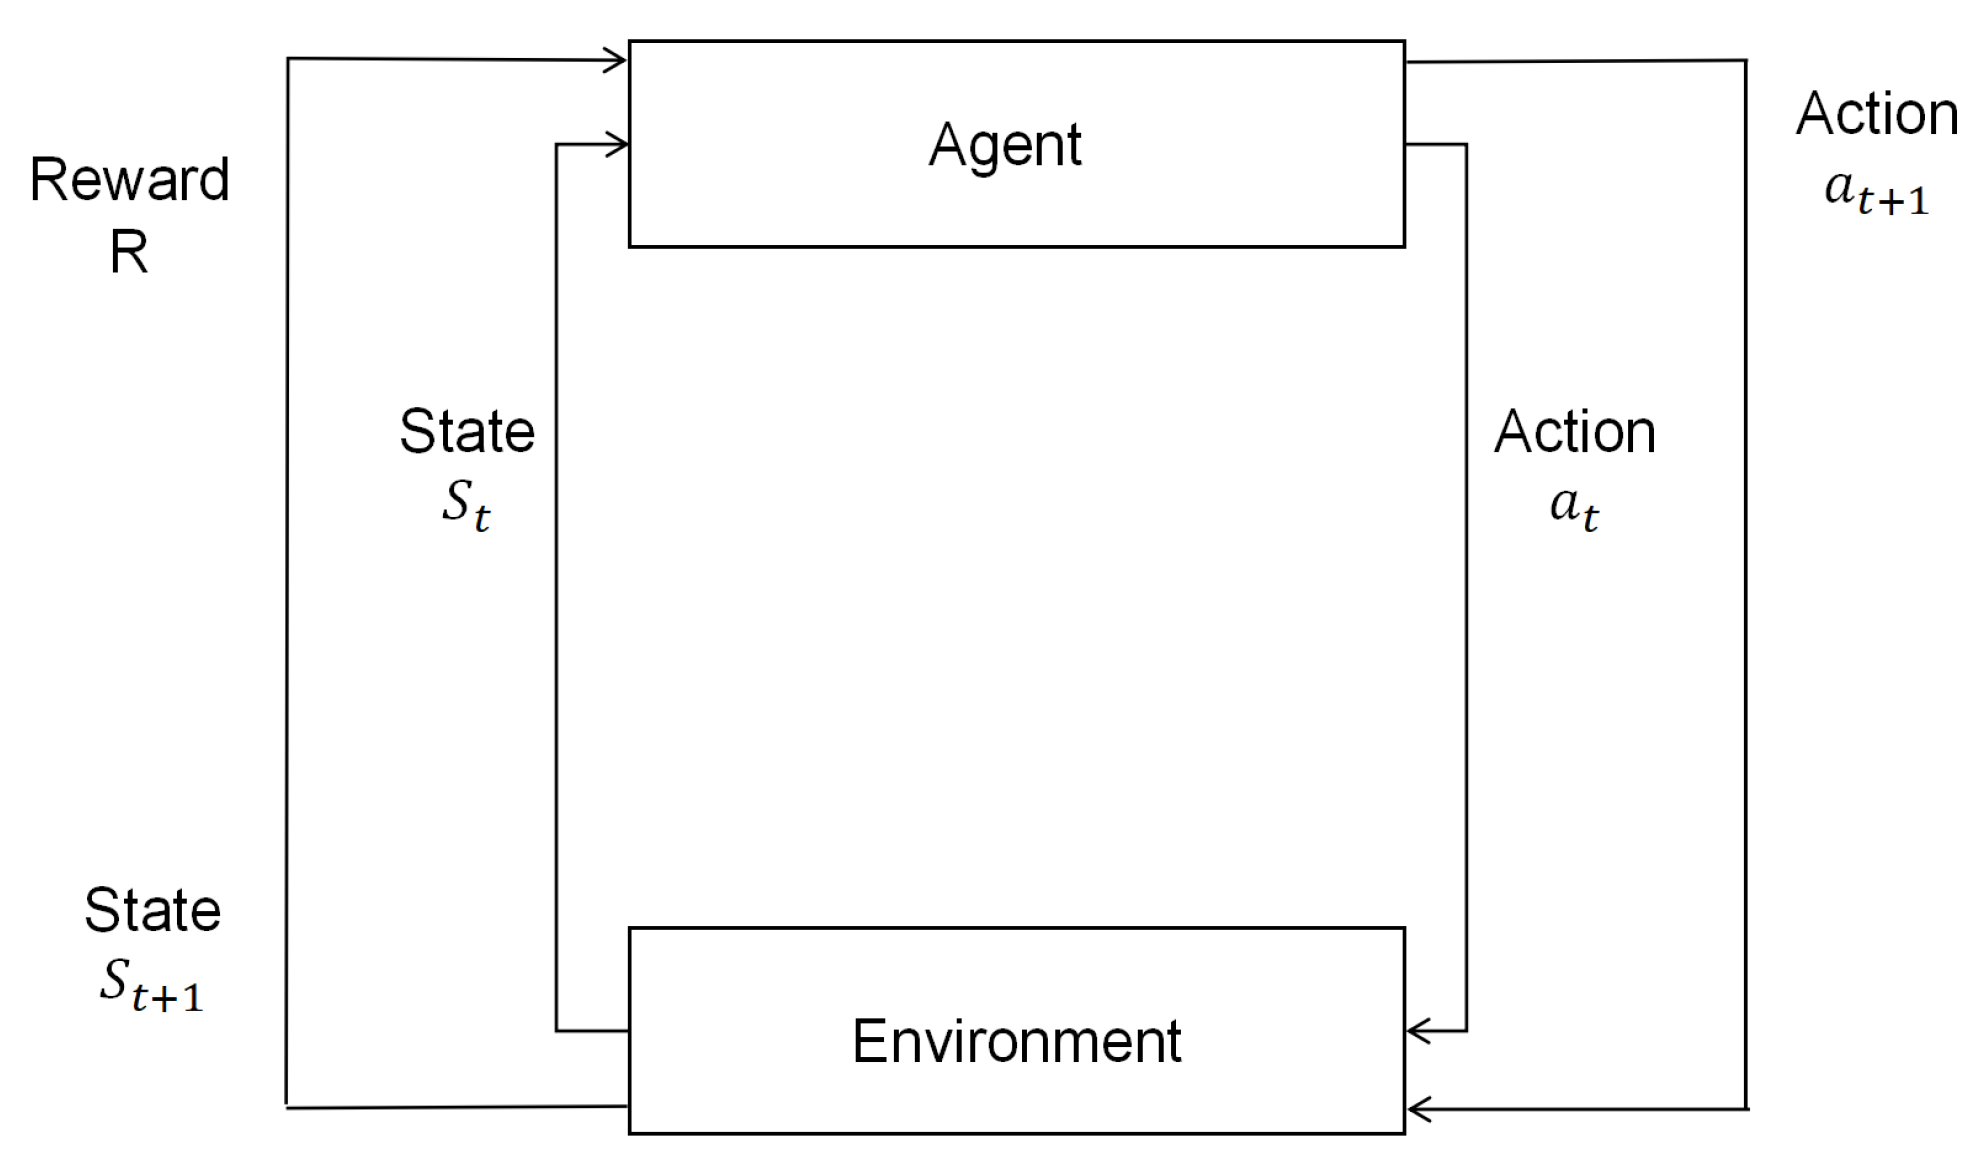
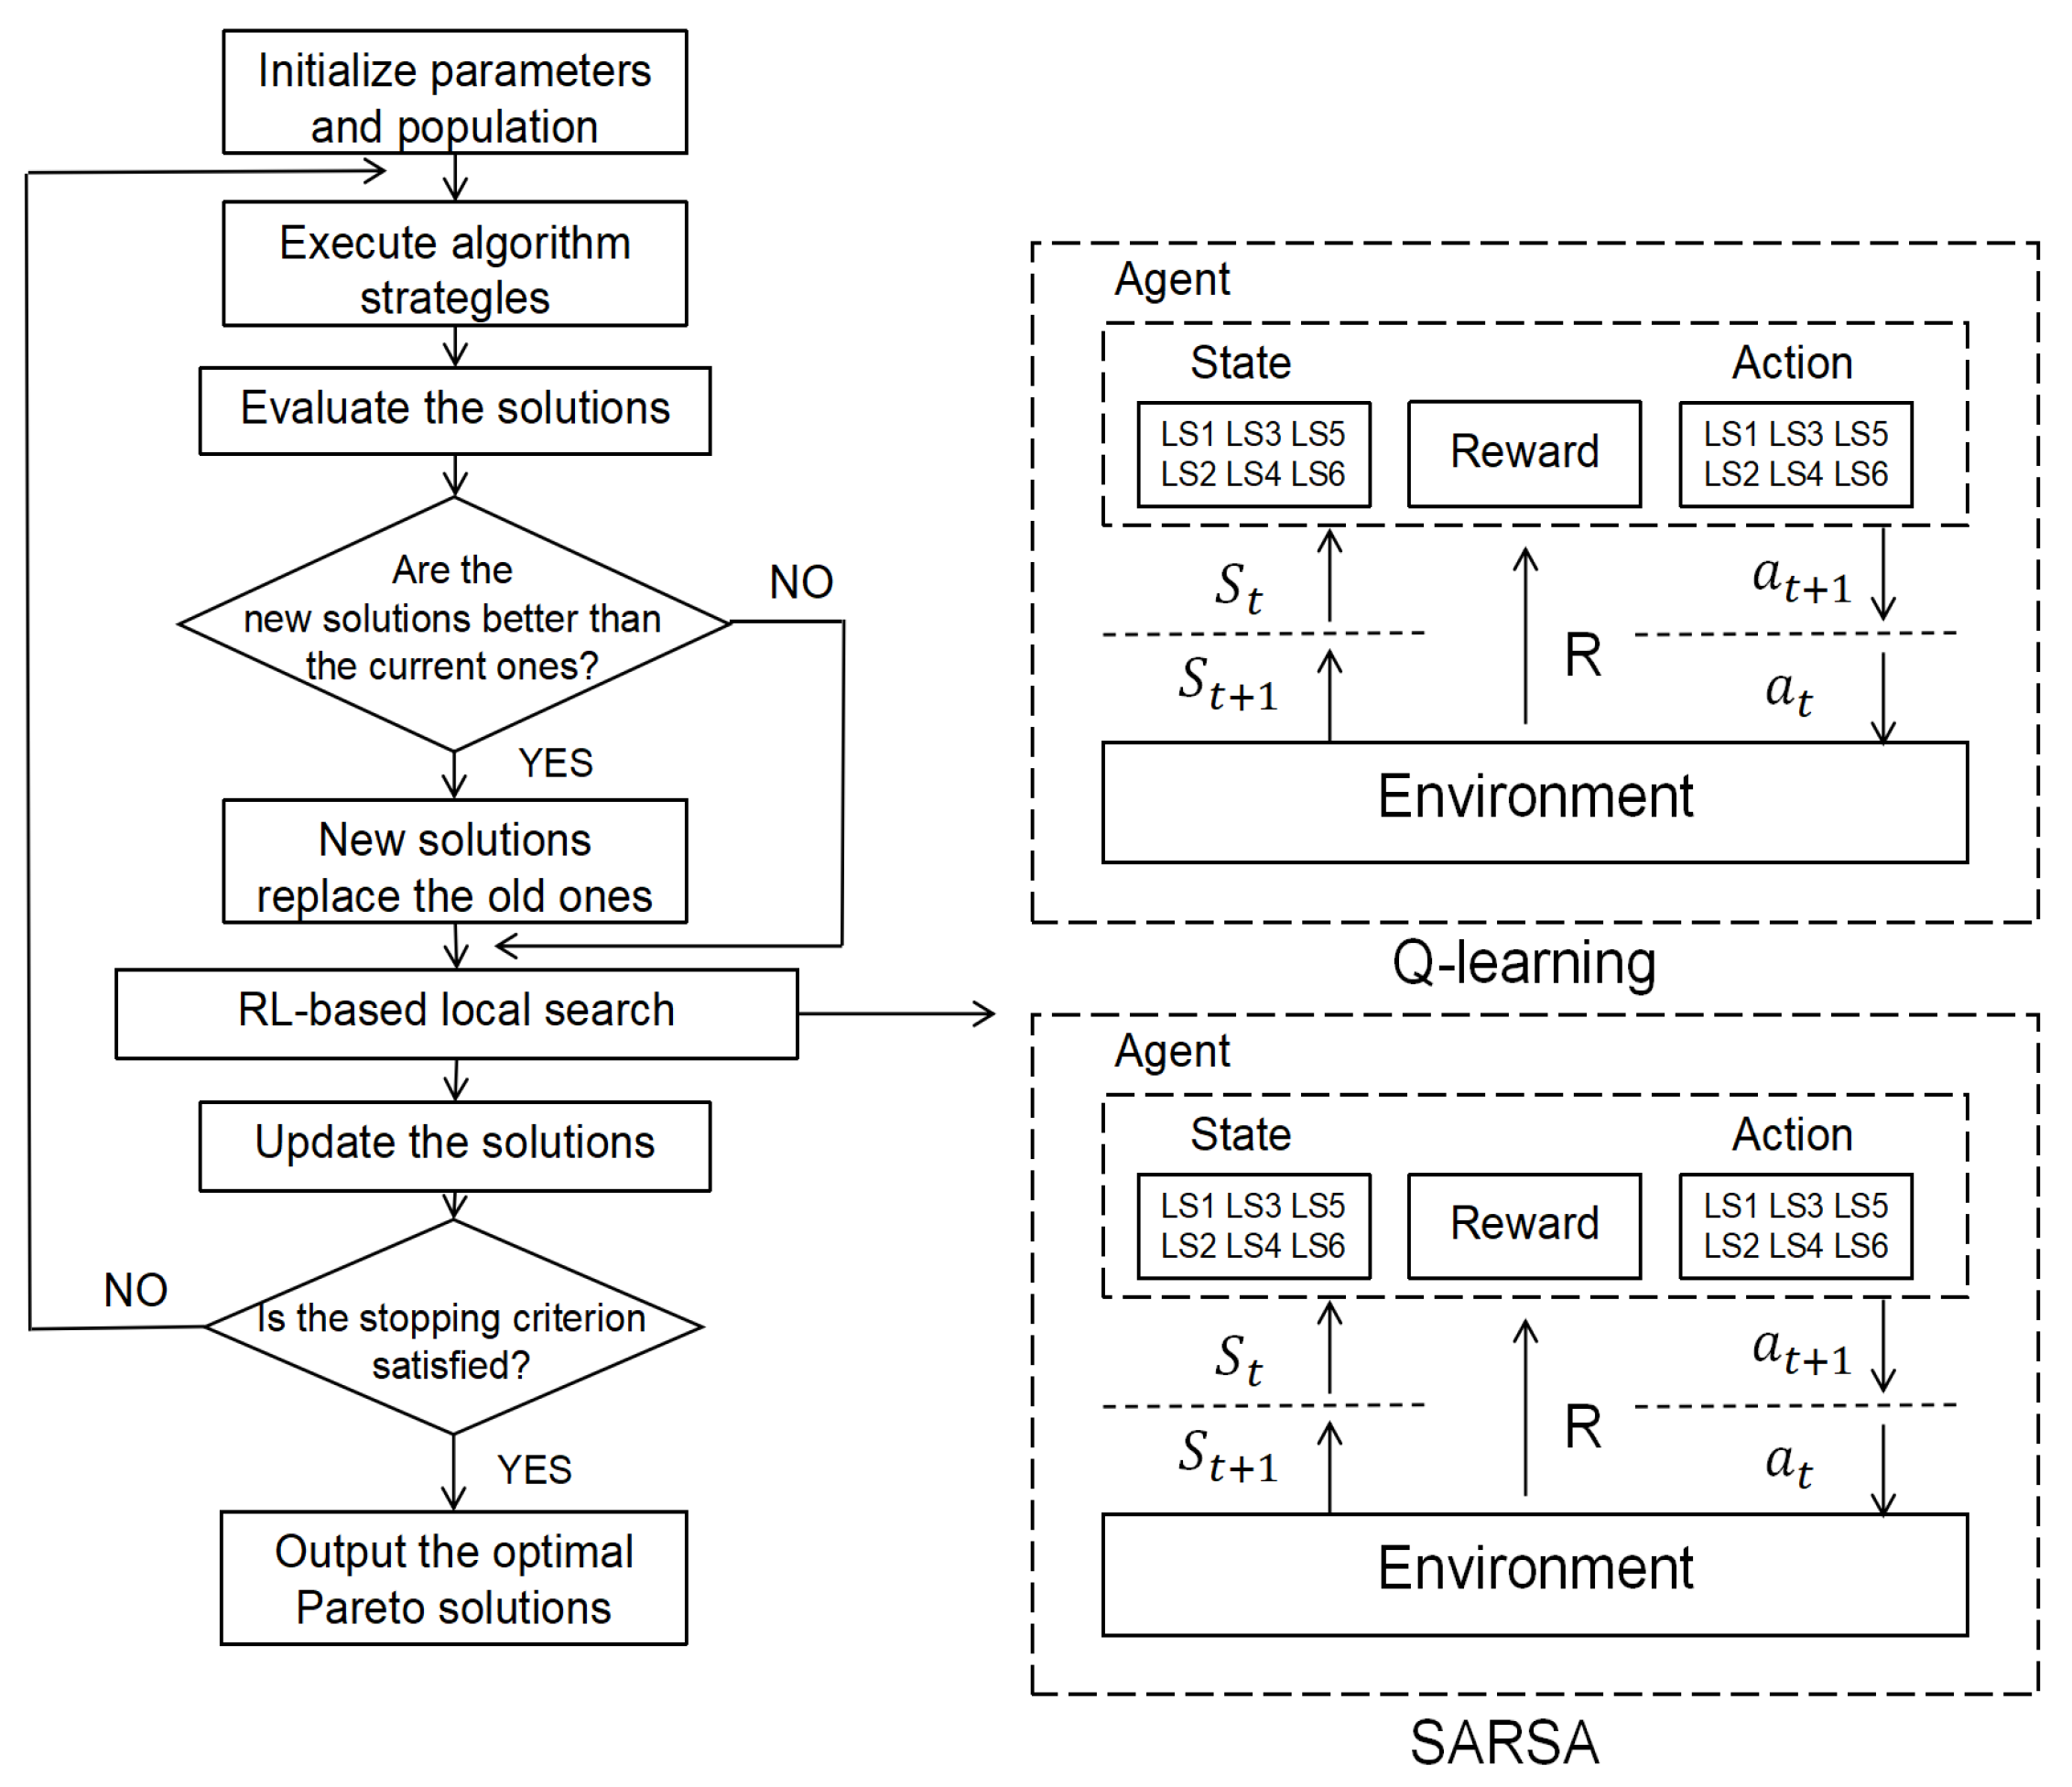
In this study, the concepts of state and action are utilized as components of local search operators within the Q-learning framework. As depicted in Figure 10, the agent selects actions based on the roulette wheel selection approach, which leads to the acquisition of an appropriate reward. Initially, at time t, an agent acquires the current environmental state s t and performs the action a t . Consequently, the environment transitions to the state s t + 1 , and the agent receives the corresponding reward R. Furthermore, the agent refines its strategy for action selection, enabling the selection of an appropriate action a t + 1 in subsequent cycles.
At the beginning, the Q-values in the Q-table are initialized to be identical. With each execution of a local search operator by the algorithm, the Q-values in the Q-table are updated. The Q-table itself is refreshed after every iteration. Under certain conditions, Q-learning, being highly probable, can guide the selection of an appropriate local search operator (action). In other words, if an individual performs L S 1 in state s 1 , it can select any of the seven local search operators in the next state, which is determined on the basis of Q-values in the Q-table. Thus, Q-learning is designed to assist meta-heuristics in the selection of local search operators. The Q-table appears in Table 3.
The Q-value in the Q-table is updated after an operation is performed. The update formula is as follows:
Q s t , a t = Q s t , a t + α R + γ m a x Q s t + 1 , a t + 1 Q s t , a t
In this context, Q ( s t , a t ) represents the Q-value associated with performing an action a t in the present state s t . The parameter α denotes the learning rate, R signifies the reward received, γ is the discount factor, and m a x Q ( s t + 1 , a t + 1 ) refers to the maximum Q-value that can be obtained by selecting an action a t + 1 in the next state s t + 1 using a roulette wheel selection method. The expression for R is given by
R = C m a x C m a x × 2 + E / T E / T × 2 , C m a x > C m a x a n d E / T > E / T 2 , C m a x > C m a x a n d E / T = E / T o r C m a x = C m a x a n d E / T > E / T 1 , C m a x > C m a x a n d E / T < E / T o r C m a x < C m a x a n d E / T > E / T 0 , C m a x < C m a x a n d E / T < E / T o r C m a x < C m a x a n d E / T < E / T
where C m a x , E / T are the makespan and E/T of the new solution while the C m a x and E / T are the old one.

4.4.2. SARSA

Unlike Q-Learning, SARSA is a web-based online learning algorithm. If the Q function is updated, it uses the action value of the following action a that the agent actually receives: Q t ( s , a ) . It means that SARSA takes into account the agent’s existing policy throughout the learning process. Therefore, the policy that SARSA has learned has a close relationship with the practice of the agent in the course of training.
The main difference between Q-learning and SARSA is the update strategy for Q-values. In Q-learning, the expected maximum Q-value obtained by all possible actions in the next state is selected as a factor to update the Q-value under the current state. However, the action with the expected maximum value may not necessarily be executed in the next state. In SARSA, a Q-value obtained by an action in the next state is also used to update the current Q-value, and the action is executed in the next state.
The SARSA algorithm updates the estimation of the value function in every strategy step.The agent operates based on the ε g r e e d y approach. It only needs to know the state of the preceding step ( s t ), the prior action ( a t ), the reward value (R), the present state ( s t ), and the action ( a t ). The formula for updating the action value function is given in the equation below. Q ( s , a ) is used as the Q-value for the states to perform the action a, α is the learning rate, and γ is the discount factor.
Q s t , a t = Q s t , a t + α R + γ Q s t + 1 , a t + 1 Q s t , a t
Despite differences in action selection and Q-value update methodologies, there are similarities between SARSA and Q-learning in various aspects of their learning processes. Both algorithms initialize the Q-table with arbitrary values, typically zeros, and update their Q-value using equivalent reward values. Moreover, the objective of these two algorithms is to learn an optimal strategy that maximizes the cumulative reward.
In summary, SARSA introduces a more exploratory approach to action selection than Q-learning, which uses existing policies to decide what to do in the update. This may result in better environmental research and, in certain cases, quicker convergence towards optimum policies.

4.5. The Framework of Proposed Algorithms

This work designs three enhanced meta-heuristics with Q-learning and SARSA. Figure 11 illustrates the architecture of the Q-learning and SARSA process. Initially, parameters and the population are established. Then, a novel solution is generated through a unique algorithmic approach. After that, the population is adjusted based on the newly generated solution. Next, a local search operator is determined using Q-learning or SARSA. If the Q-learning or SARSA strategy obtains a solution with better performance, it means that the chosen action (e.g., local search operator) is more conducive to maximizing the cumulative reward. Subsequently, the Q-values in the Q-table are updated. The larger the Q-value, the higher the probability that a local search operator will be selected in subsequent iterations. In conclusion, these steps are repeated in a loop until a predefined stopping criterion is met. At that point, the result of the process is reported as the final outcome.

5. Experiments and Discussions

5.1. Experimental Setup

To evaluate the performance of our method, we generate 82 extensive benchmark cases from [55]. These cases encompass combinations of the number of jobs n in { 6 , 10 , 15 , 50 } , the number of machines m in { 5 , 6 , 10 , 15 , 20 } , and Number of MHRs v in { 3 , 4 , 5 , 6 } . The setup time of the cases is generated within the range of 1 to 10 under a normal distribution. We adopt the strategy from Ciholami [56] to incorporate relevant data into our datasets. The deadline is calculated using the following formula:
D i = 1 + T × n m × j = 1 n i P i , j
T is a constant, specifically T = 0.3 [57], n represents the number of jobs, m denotes the number of machines, and P i , j is the mean processing time of all selected machines.
The algorithms under comparison are implemented in Python and executed on a system furnished with a 13th Gen Intel® Core™ i7-13700K CPU(Intel, Santa Clara, CA, USA) @ 3.40GHz and 64.0 GB of RAM, running Microsoft Windows 11 Pro for Workstations. For the fairness of the experiments, all instances are run in the same environment, and each algorithm is run independently 20 times for a case. The time limit for each run is set to t = 0.3 × m × n × v seconds, with a population size set at 5.
To assess the effectiveness of multi-objective optimization algorithms, we employ two metrics: ρ [58] and the Inverse Generational Distance (IGD) [59]. The metric ρ is utilized to evaluate the solution quality, while IGD measures the convergence and diversity of the algorithms. A higher ρ value indicates superior algorithmic performance, and a lower IGD value implies a more competitive algorithm.
The ρ metric is calculated as the proportion of elements in the set x P S | x P F to P F . Here, P S represents the Pareto non-dominated solutions obtained by an algorithm, and P F denotes the approximate Pareto front. It is crucial to understand that the true Pareto front is typically unknown in practical scenarios. For this study, we consider the Pareto non-dominated solutions from all contrasted algorithms that constitute the approximate Pareto front.
The metric IGD can be computed as
I G D P S , P F = 1 P F V P F d ( v , z )
where d ( v , z ) denotes the gap between the solution v and the reference point z. The notation | P F | refers to the count of solution instances that are spread across the Pareto front P F .

5.2. Parameter Setting

The settings of the parameters for an algorithm can significantly influence its effectiveness. The parameters are set based on our previous research and compared algorithms [48]. Taking the case of the instance “20_20”, we assess the advantages and disadvantages of diverse parameter arrangements for all compared algorithms. Each parameter setup is run separately for 20 times, with the IGD metric serving as the outcome measure, which IGD typically gauges the convergence and diversity of the algorithms’ values. A smaller IGD value generally suggests a more formidable algorithm, often reflecting a higher quality collection of solutions.
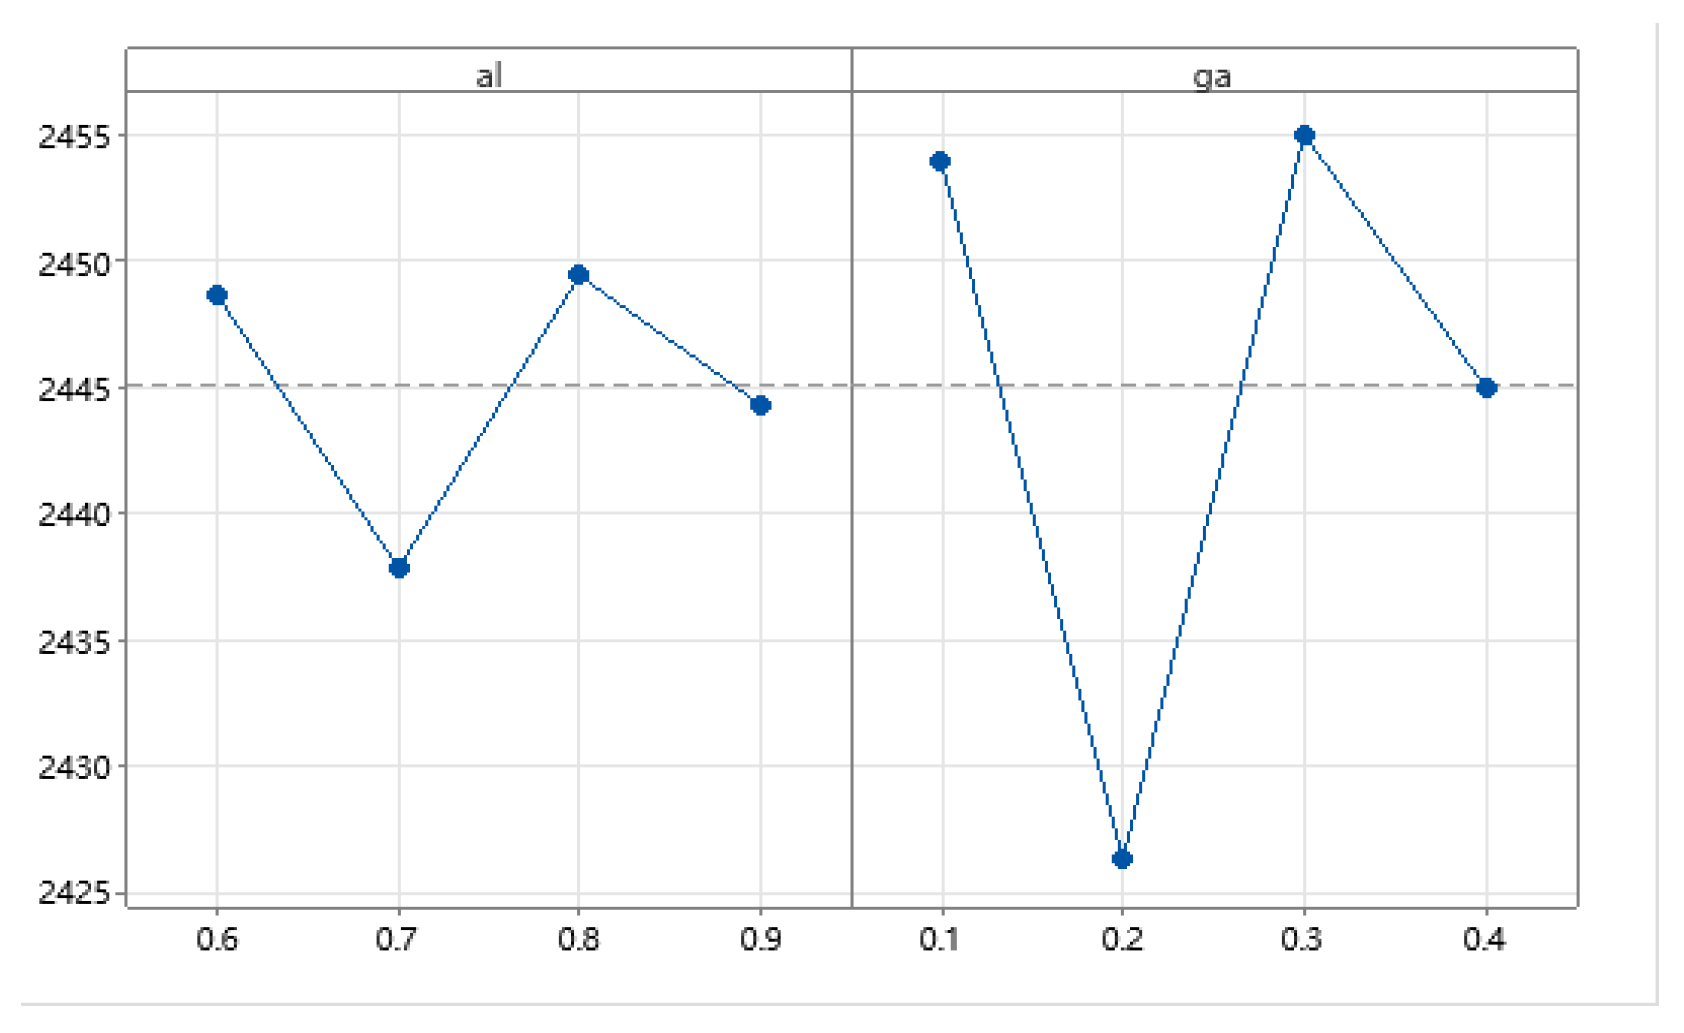
In the ABC. The ABC algorithm involves three key parameters: Employed Bees ( E P ), Onlooker Bees ( O P ), and Scout Bees ( S P ). Drawing on previous studies, we set the ratios of E P and S P : E P in { 0.4 , 0.5 , 0.6 , 0.7 } and S P in { 0.1 , 0.2 , 0.3 } . O P can be calculated as 1 E P S P . Using the trend of parameters depicted in Figure 12, we set the parameters for ABC, where E P = 0.6 , O P = 0.2 , and S P = 0.2 .
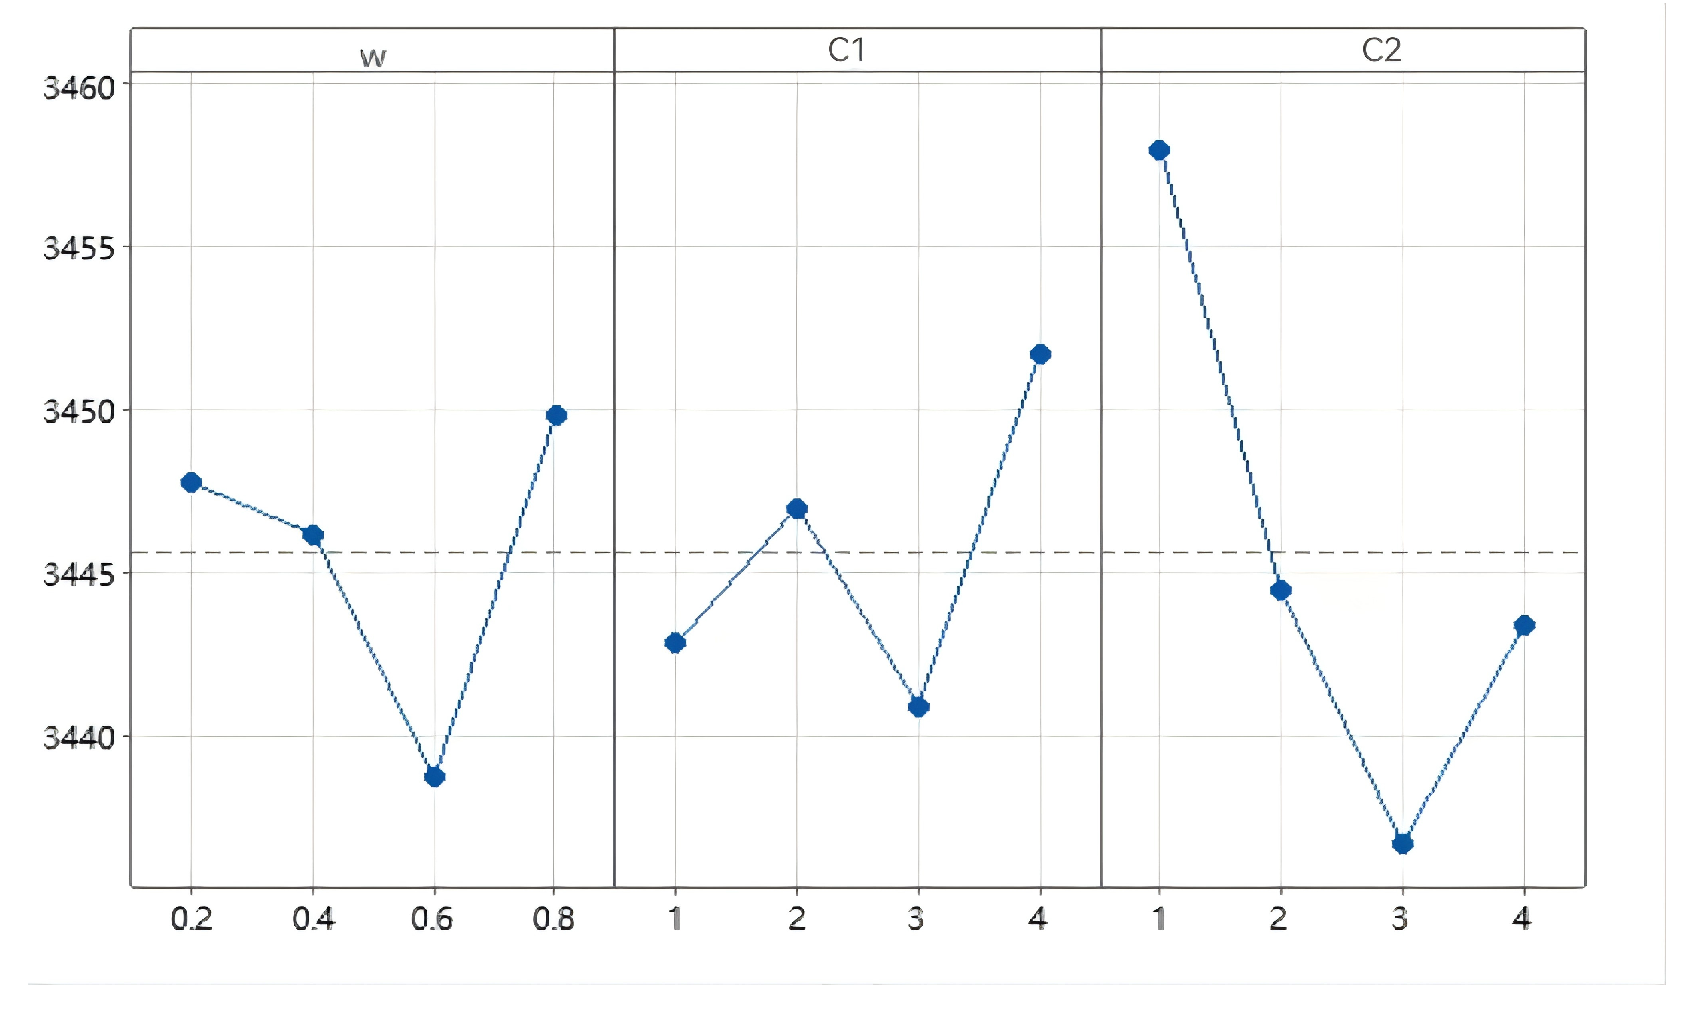
In the PSO, three crucial parameters need consideration: the inertia weight (W), the personal cognition coefficient ( C 1 ), and the social cognition coefficient ( C 2 ). The possible values for these parameters are W in { 0.2 , 0.4 , 0.6 , 0.8 } , C 1 in { 1 , 2 , 3 , 4 } , and C 2 in { 1 , 2 , 3 , 4 } . Analyzing the graph presented in Figure 13, we determine the optimal values for W, C 1 , and C 2 to be 0.6, 3, and 3, respectively.
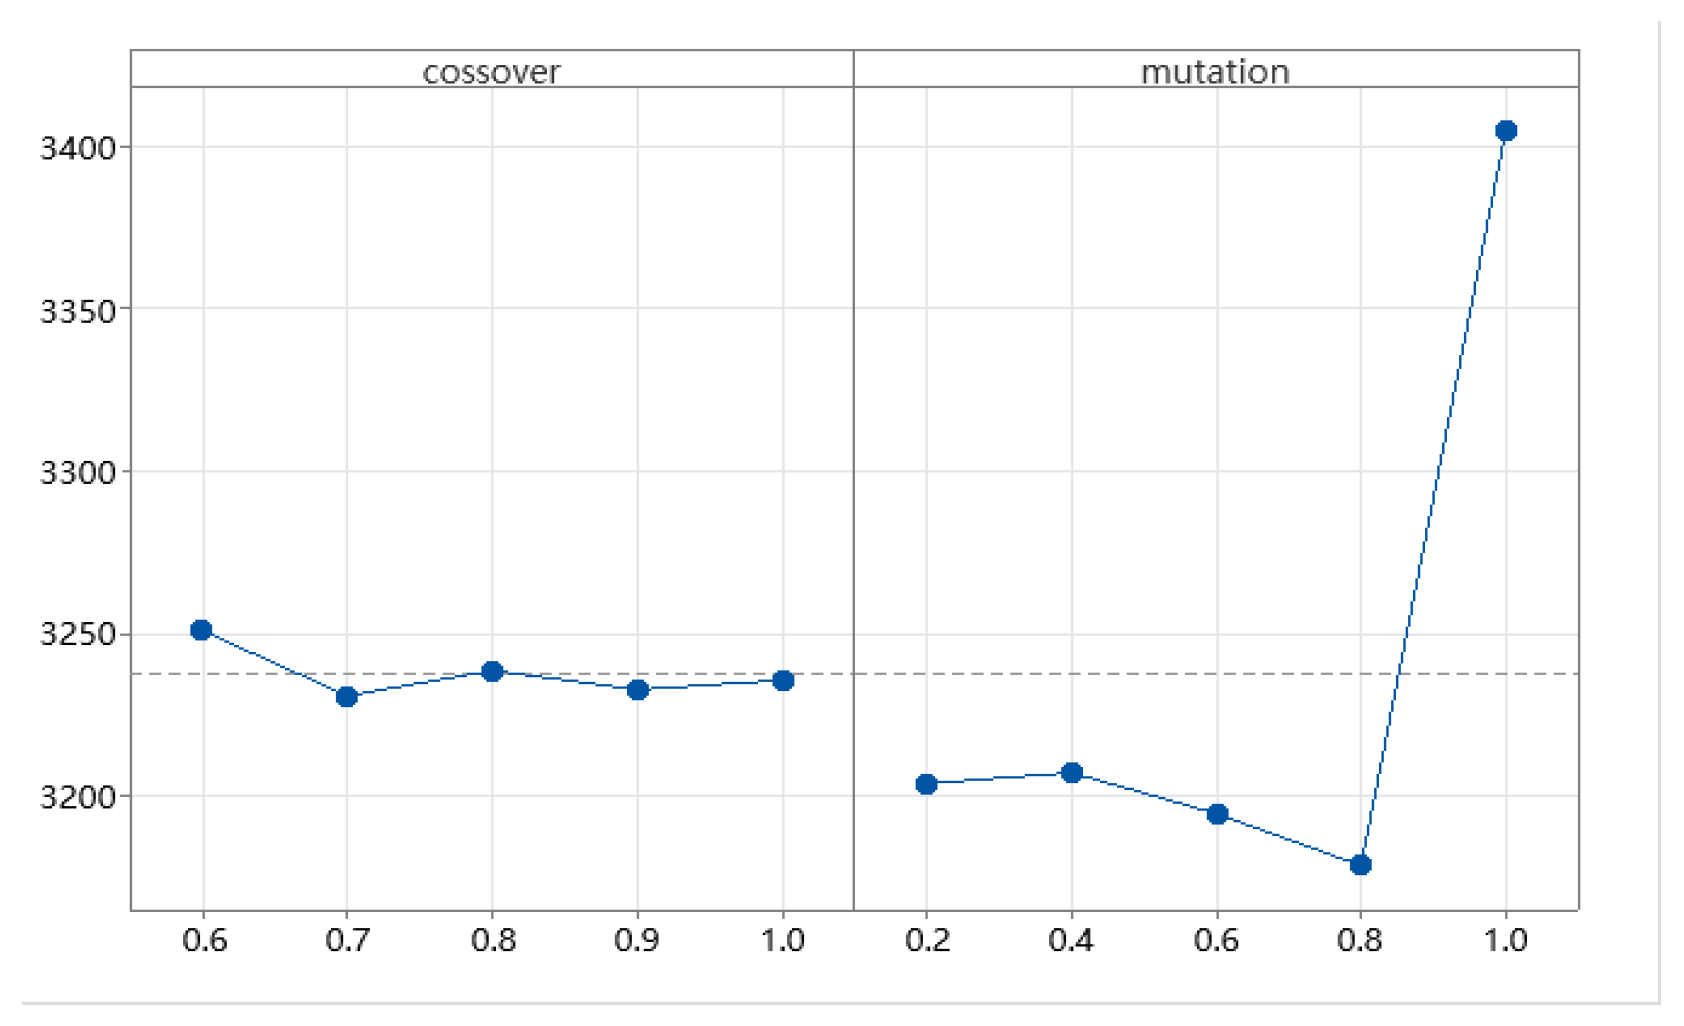
The performance of the GA is largely affected by the crossover probability ( P C ) and mutation probability ( P m ). Consequently, we conduct a parameter tuning experiment for these two parameters, P C ranging in { 0.6 , 0.7 , 0.8 , 0.9 , 1 } and P m ranging in { 0.2 , 0.4 , 0.6 , 0.8 , 1 } . Figure 14 indicates that the algorithm achieves optimal performance when P C is set to 0.7 and P m is set to 0.8.
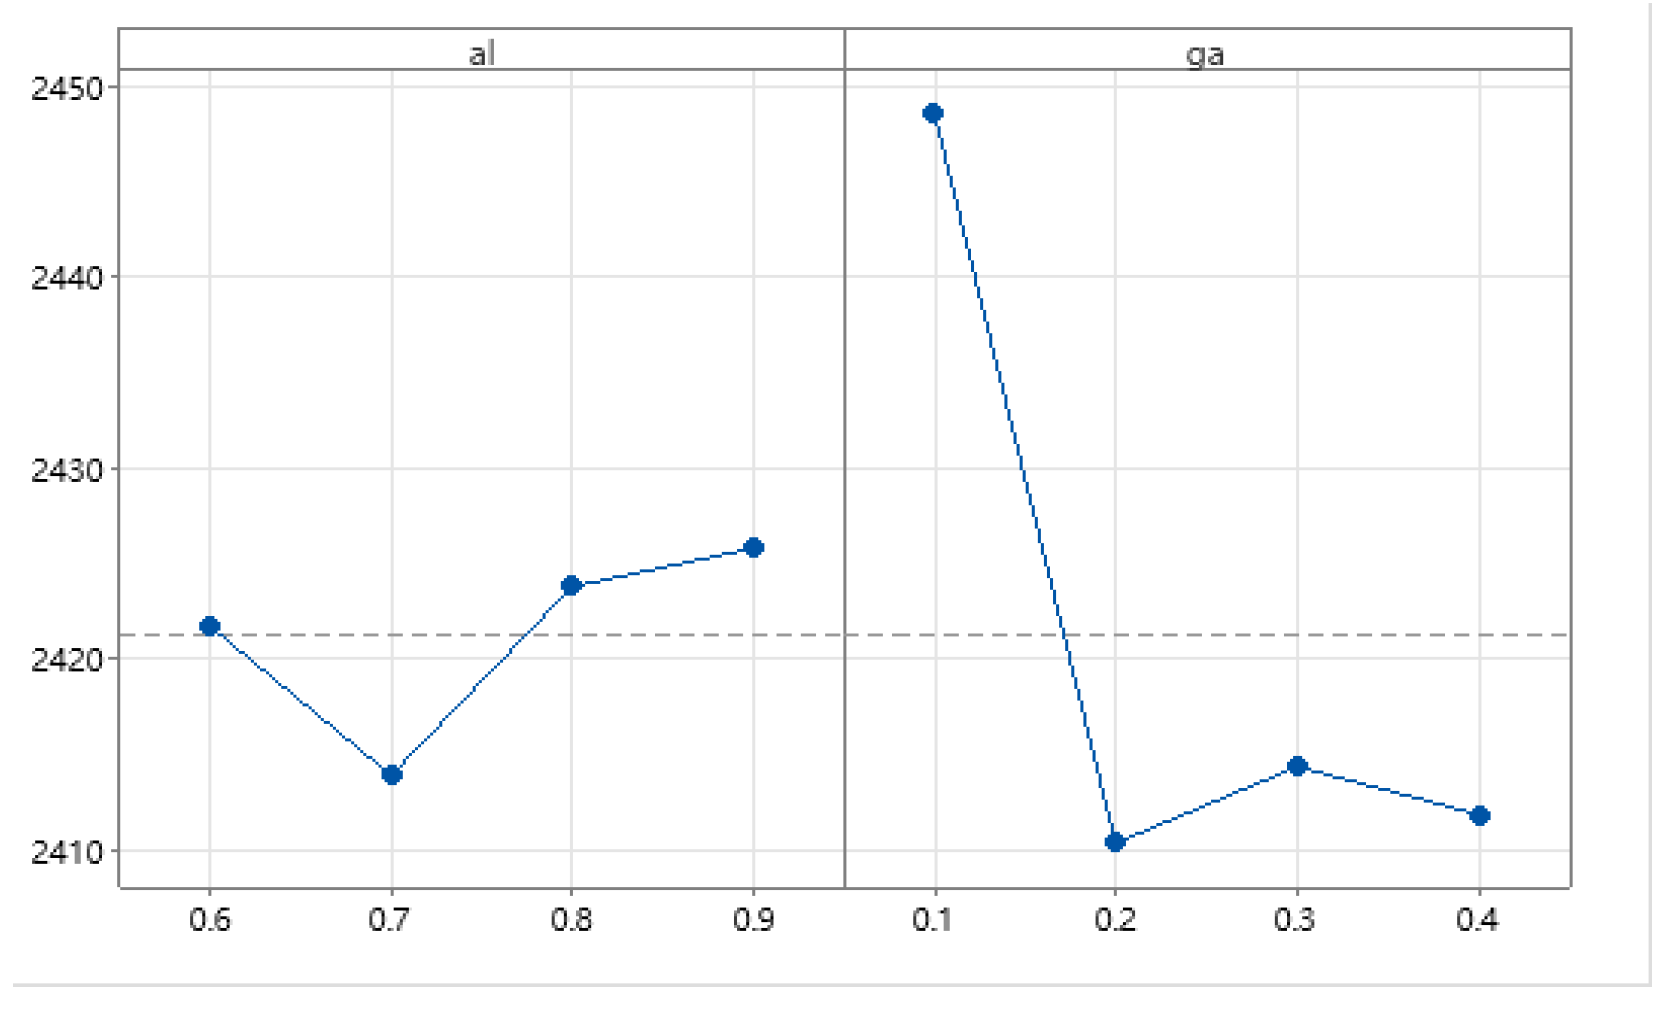
Additionally, for Q-learning and SARSA, we focus on two key parameters: the learning rate α and the discount rate γ . The values for α are considered within { 0.6 , 0.7 , 0.8 , 0.9 } and for γ within { 0.1 , 0.2 , 0.3 , 0.4 } . Given that GA_Q and GA_S have demonstrated superior performance in addressing similar problems, we fine-tune α and γ in Q-learning based on the average performance metrics obtained from GA_Q and GA_S. Analyzing Figure 15 and Figure 16, we determine the optimal settings for α and γ to be 0.7 and 0.2, respectively.

5.3. Results and Comparisons

5.3.1. Within-Group Comparisons of the Developed Methods

The efficacy of the proposed local search operators, Q-learning, and SARSA are confirmed through testing. We compare three meta-heuristic algorithms: GA, PSO, and ABCm with their variants with local search operators (GA_L, PSO_L, ABC_L), variants with Q-learning (GA_Q, PSO_Q, ABC_Q), and variants with SARSA-based local search operators (GA_S, PSO_S, ABC_S). Variants with local search operators refer to algorithms that randomly select local search operators during each iteration.
Table 4, Table 5, Table 6, Table 7, Table 8 and Table 9 present the mean IGD and ρ values across 82 benchmark cases. From Table 4, Table 5 and Table 6, it is evident that the GA_S, PSO_S, and ABC_S algorithms obtained the best IGD values in 68, 55, and 47 out of 82 instances, respectively. It indicates that the meta-heuristics with SARSA-based local search operators outperform others in terms of average IGD, closely followed by those using Q-learning. Specifically, GA_Q, PSO_Q, and ABC_Q achieved the best IGD values in 8, 16, and 20 cases, respectively. From Table 7, Table 8 and Table 9, it can be observed that the meta-heuristics with SARSA-based local search operators produce better average ρ values, and the meta-heuristics with Q-learning rank second. These results suggest that SARSA-based local search operators are particularly effective in enhancing the performance of meta-heuristics, both in terms of convergence and diversity, as measured by IGD and ρ values.
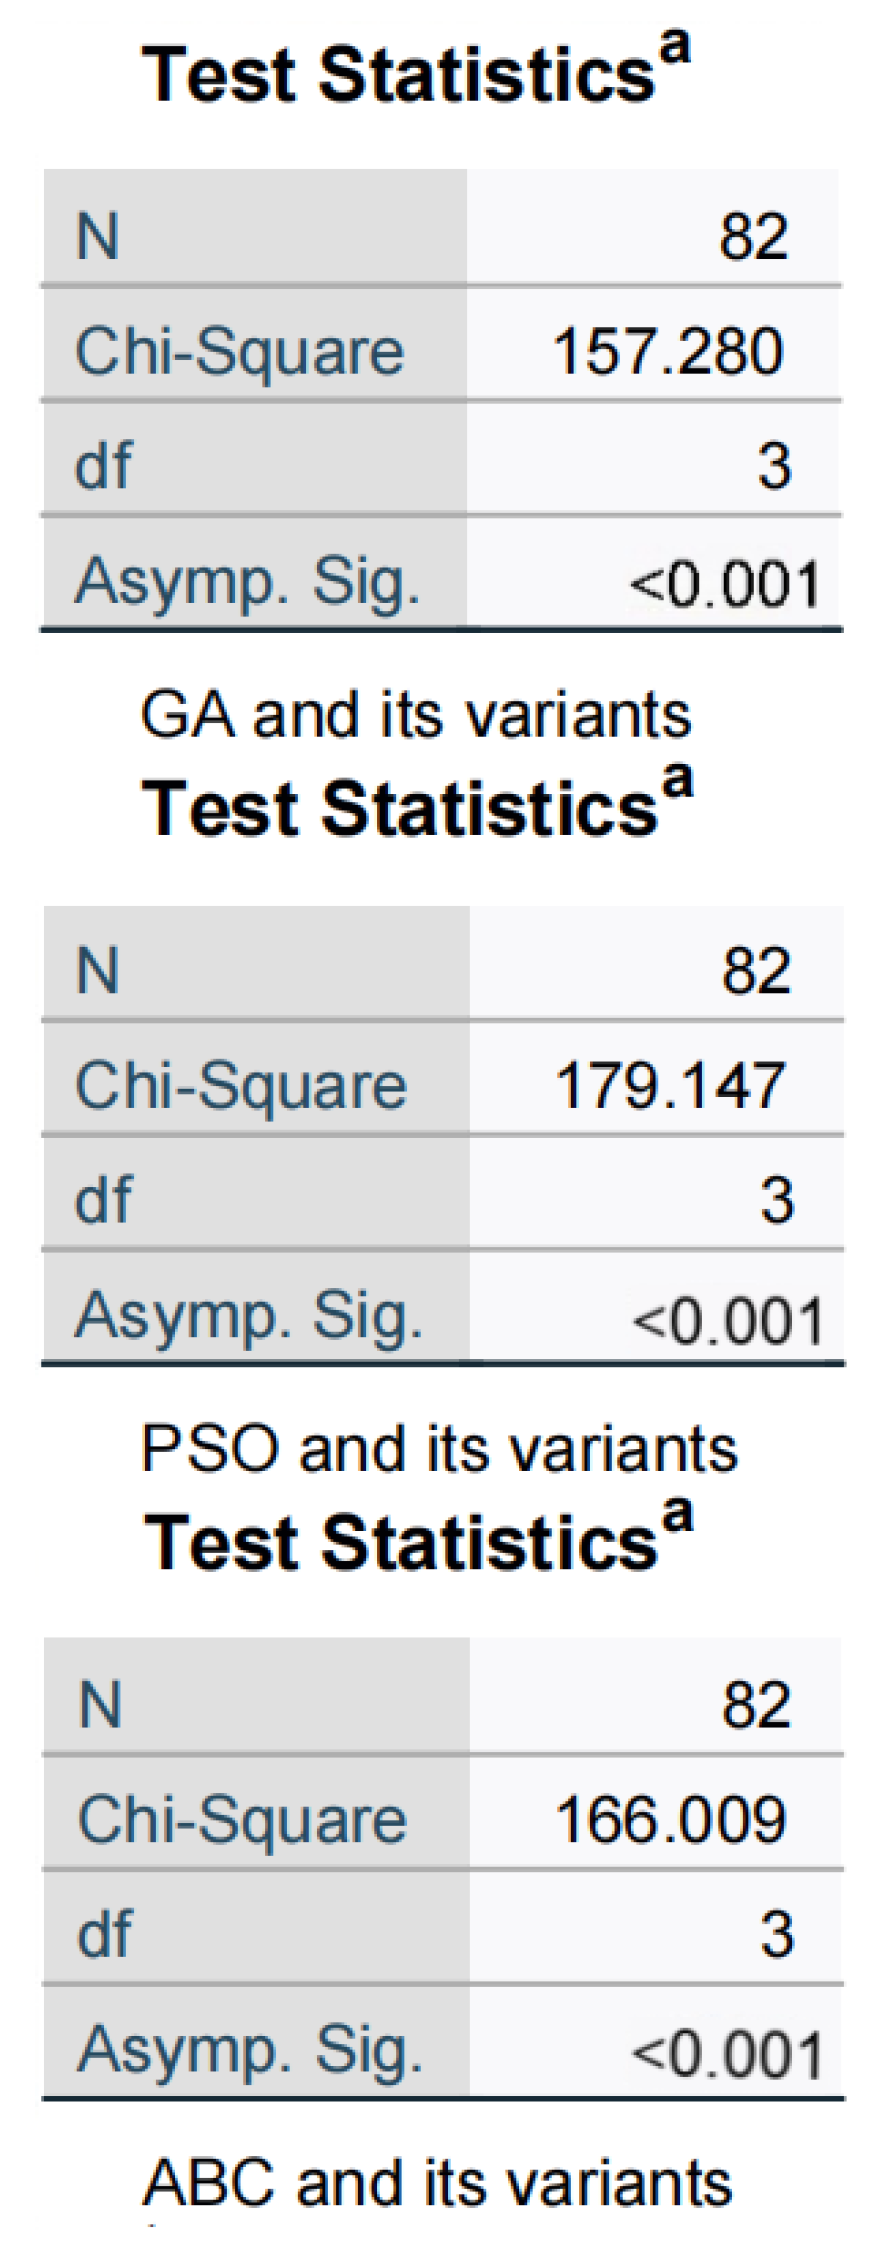
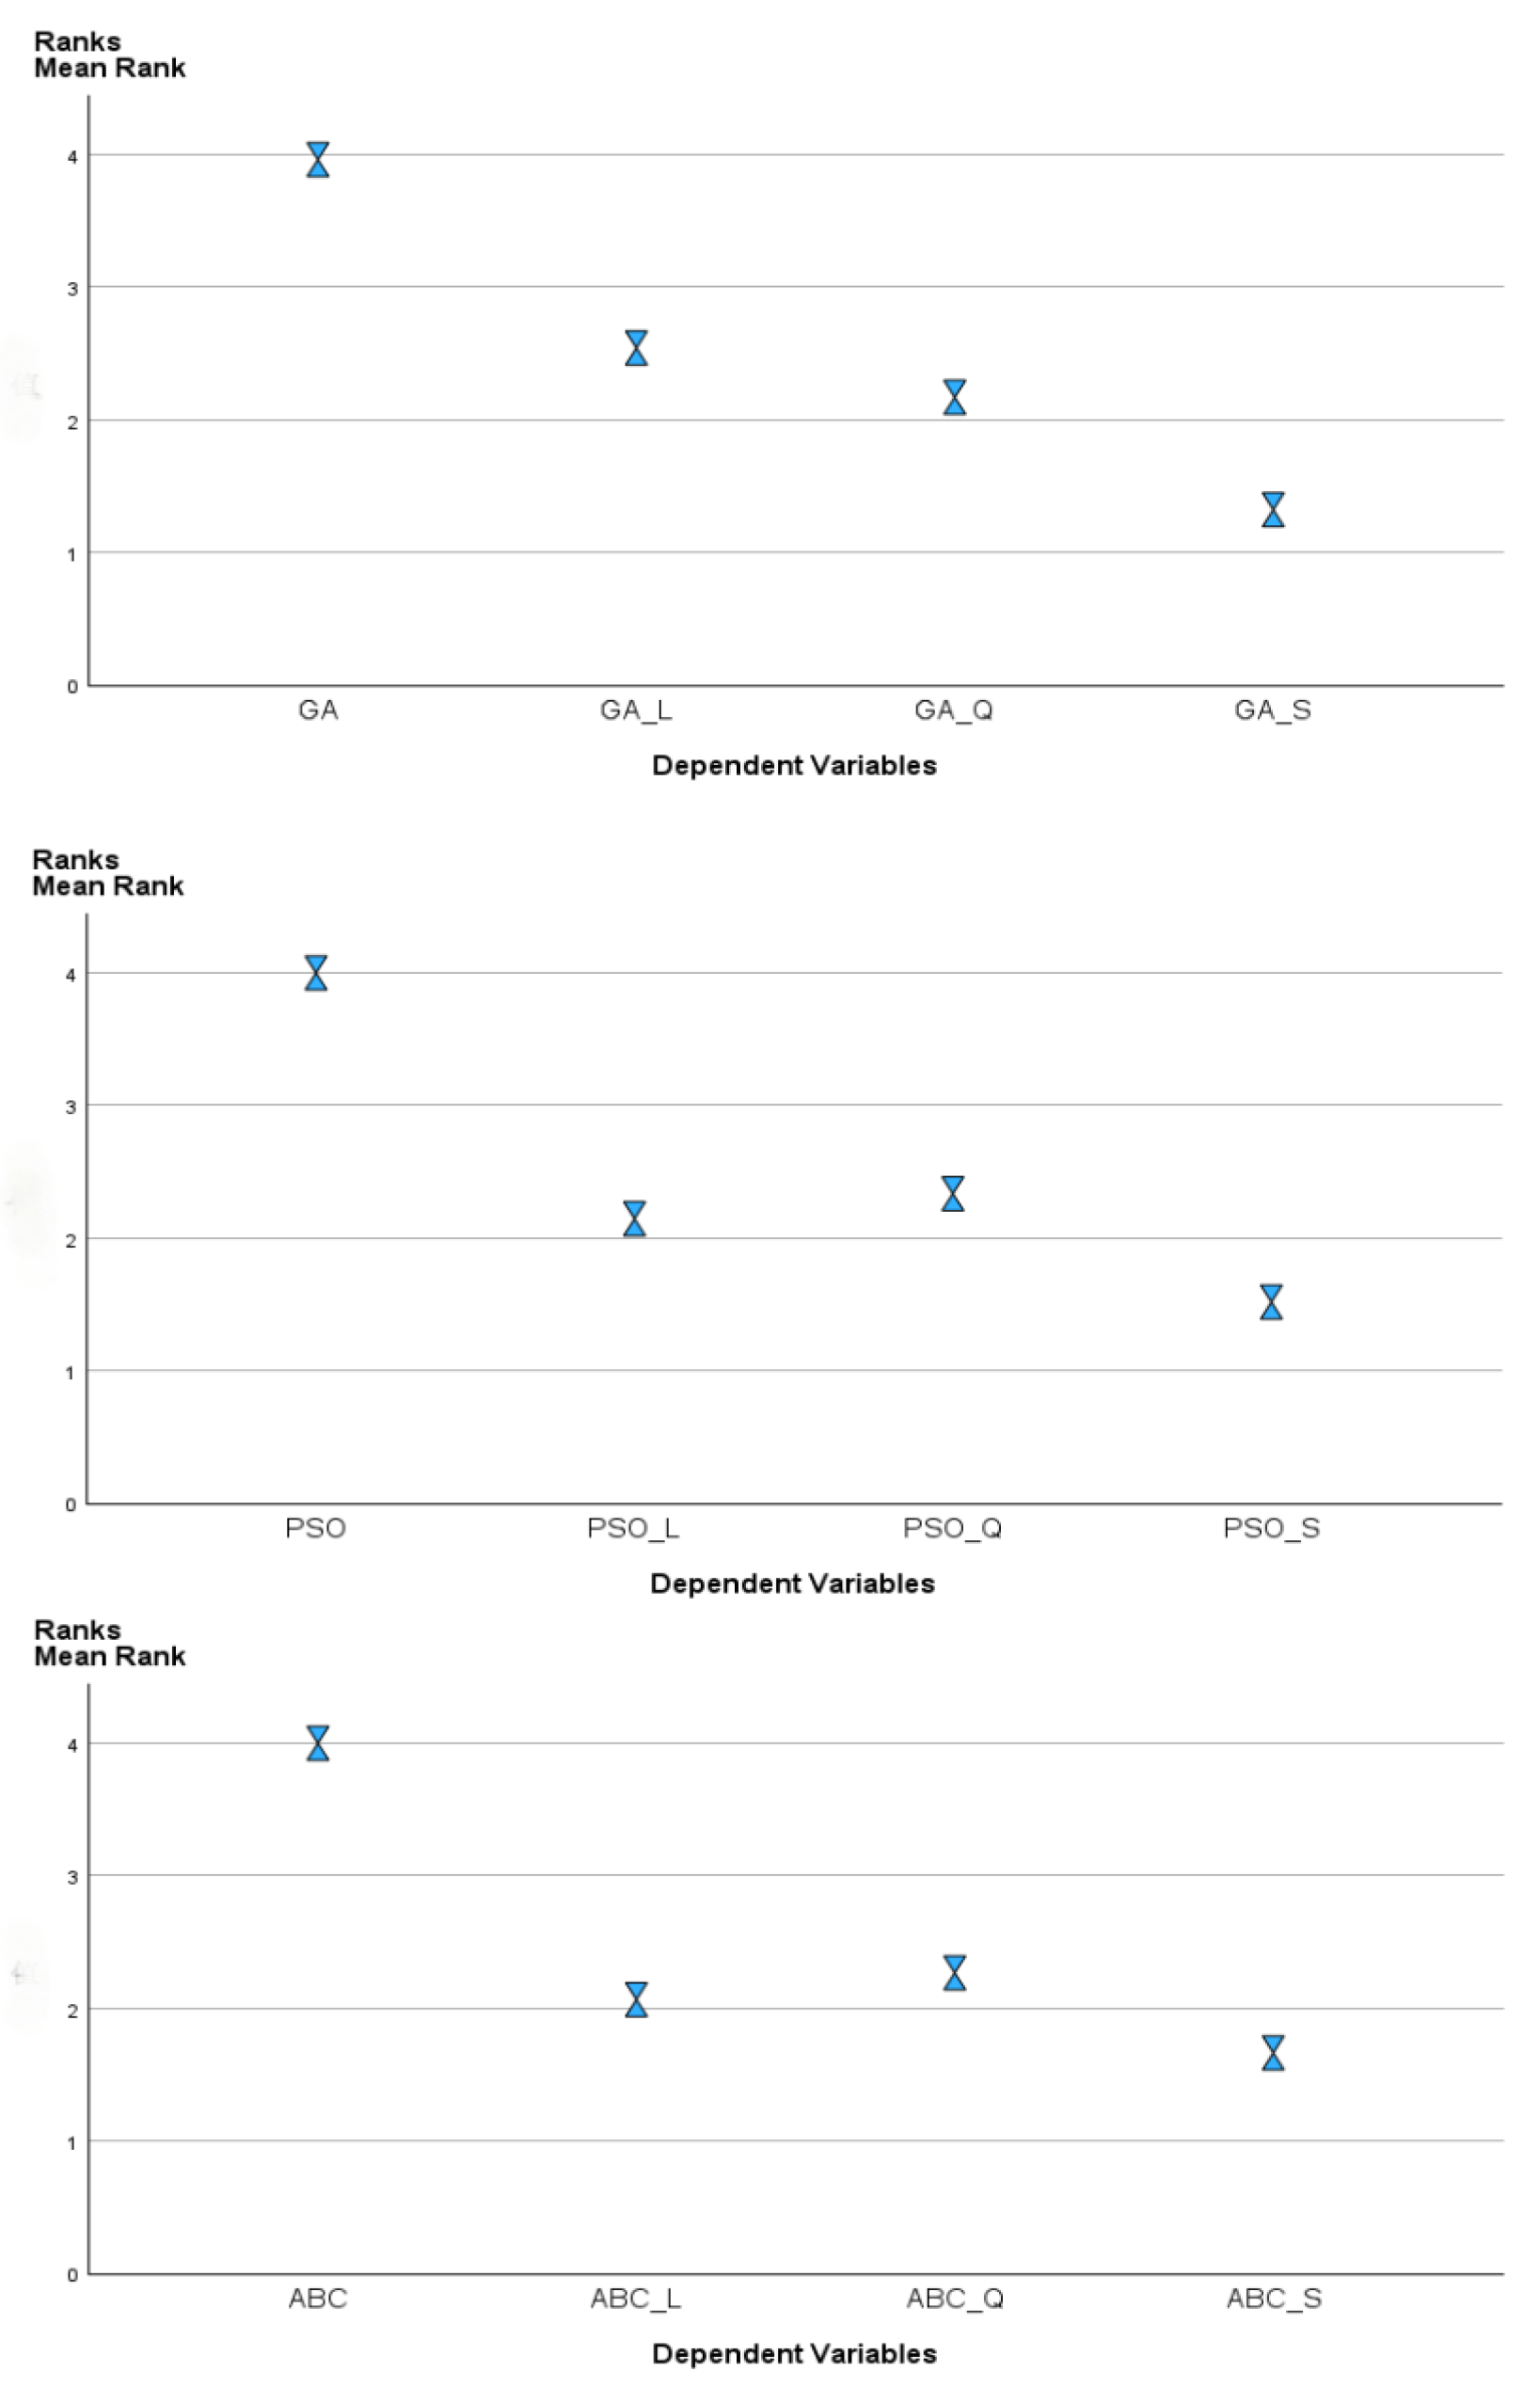
For the metric IGD, the Friedman test is conducted to assess the differences among the compared algorithms. Figure 17 demonstrates significant differences among the base algorithms and their variants, as all asymptotic significance (Asymp. Sig.) values are less than 0.05. Then the Nemenyi post hoc test is used to rank the algorithms, the results depicted in Figure 18. It is evident that the variants with local search operators are superior to the basic ones. Particularly, meta-heuristics with SARSA-based local search operators produce the best performance in each group of algorithm comparisons. GA_S, PSO_S, and ABC_S have average ranks of 1.32, 1.52, and 1.66, respectively. The Friedmann’s Two Analysis of Variance by Rank reflects the rank distribution of compared algorithms. The lower the rank value of IGD, the better the performance of the algorithm. From Figure 19, it can be seen that GA_S, PSO_S, and ABC_S have the largest number of instances at the best rank.
Figure 20, Figure 21 and Figure 22 illustrate the results of the three aforementioned experiments for the ρ values. In the Friedman test, Figure 20 shows that all asymptotic significance (Asymp. Sig.) values are less than 0.05 on metric ρ , further indicating significant performance differences among the algorithms in each group comparison. Figure 21 displays the Nemenyi post hoc test results on metric ρ , where the SARSA-based local search demonstrates the most competitive performance in each group comparison. Moreover, Figure 22 shows that the variants with SARSA-based local search have the highest rank value in each group comparison. The higher the rank value of ρ , the better the performance of one algorithm is.
In conclusion, the local search operator significantly enhances the performance of the basic meta-heuristic algorithm. To some extent, Q-learning improves the performance of local search. SARSA effectively boosts the performance of the meta-heuristics by assisting it in choosing the appropriate local search strategy based on different states.

5.3.2. Comparisons with Other Algorithms

We assess the effectiveness of SARSA-based local search operators by comparing ABC_S, PSO_S, and GA_S with MOEAD [60] and NSGA-II [61]. Under uniform conditions, each algorithm runs 20 times per case, and each execution lasts 0.3 × m × n × v seconds.
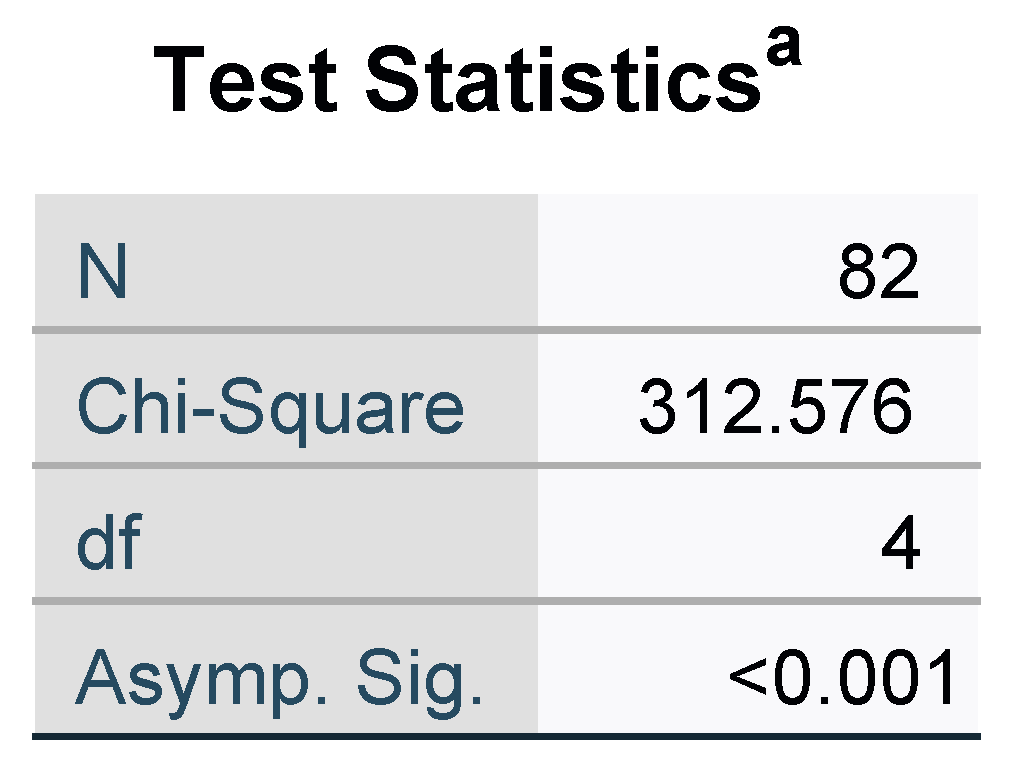
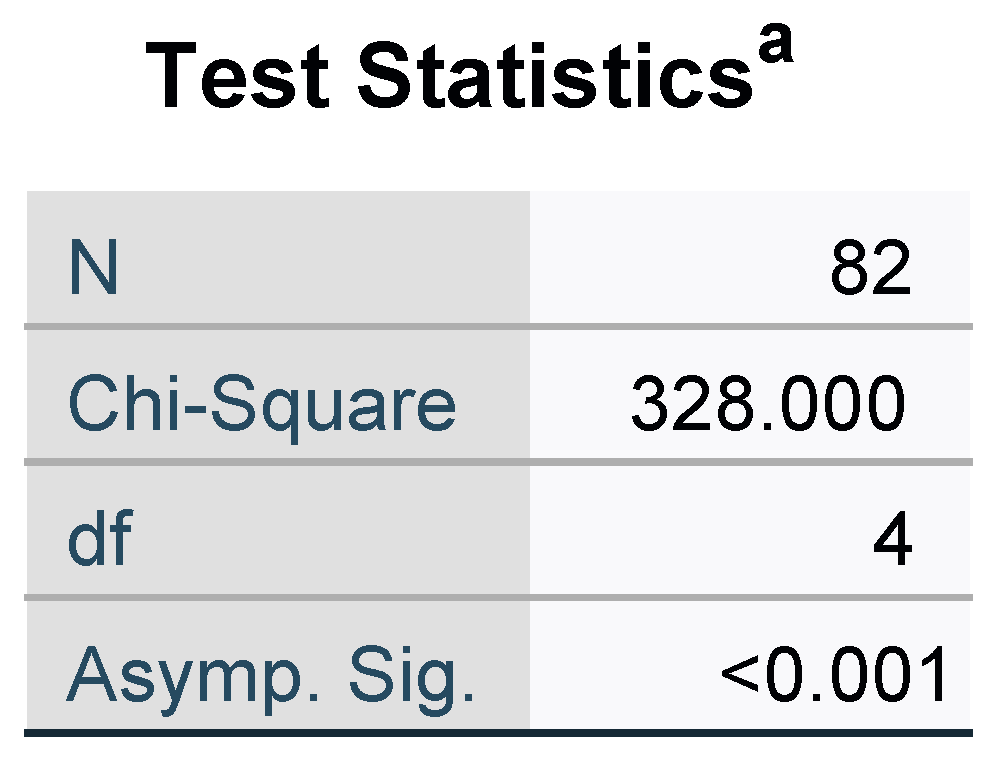
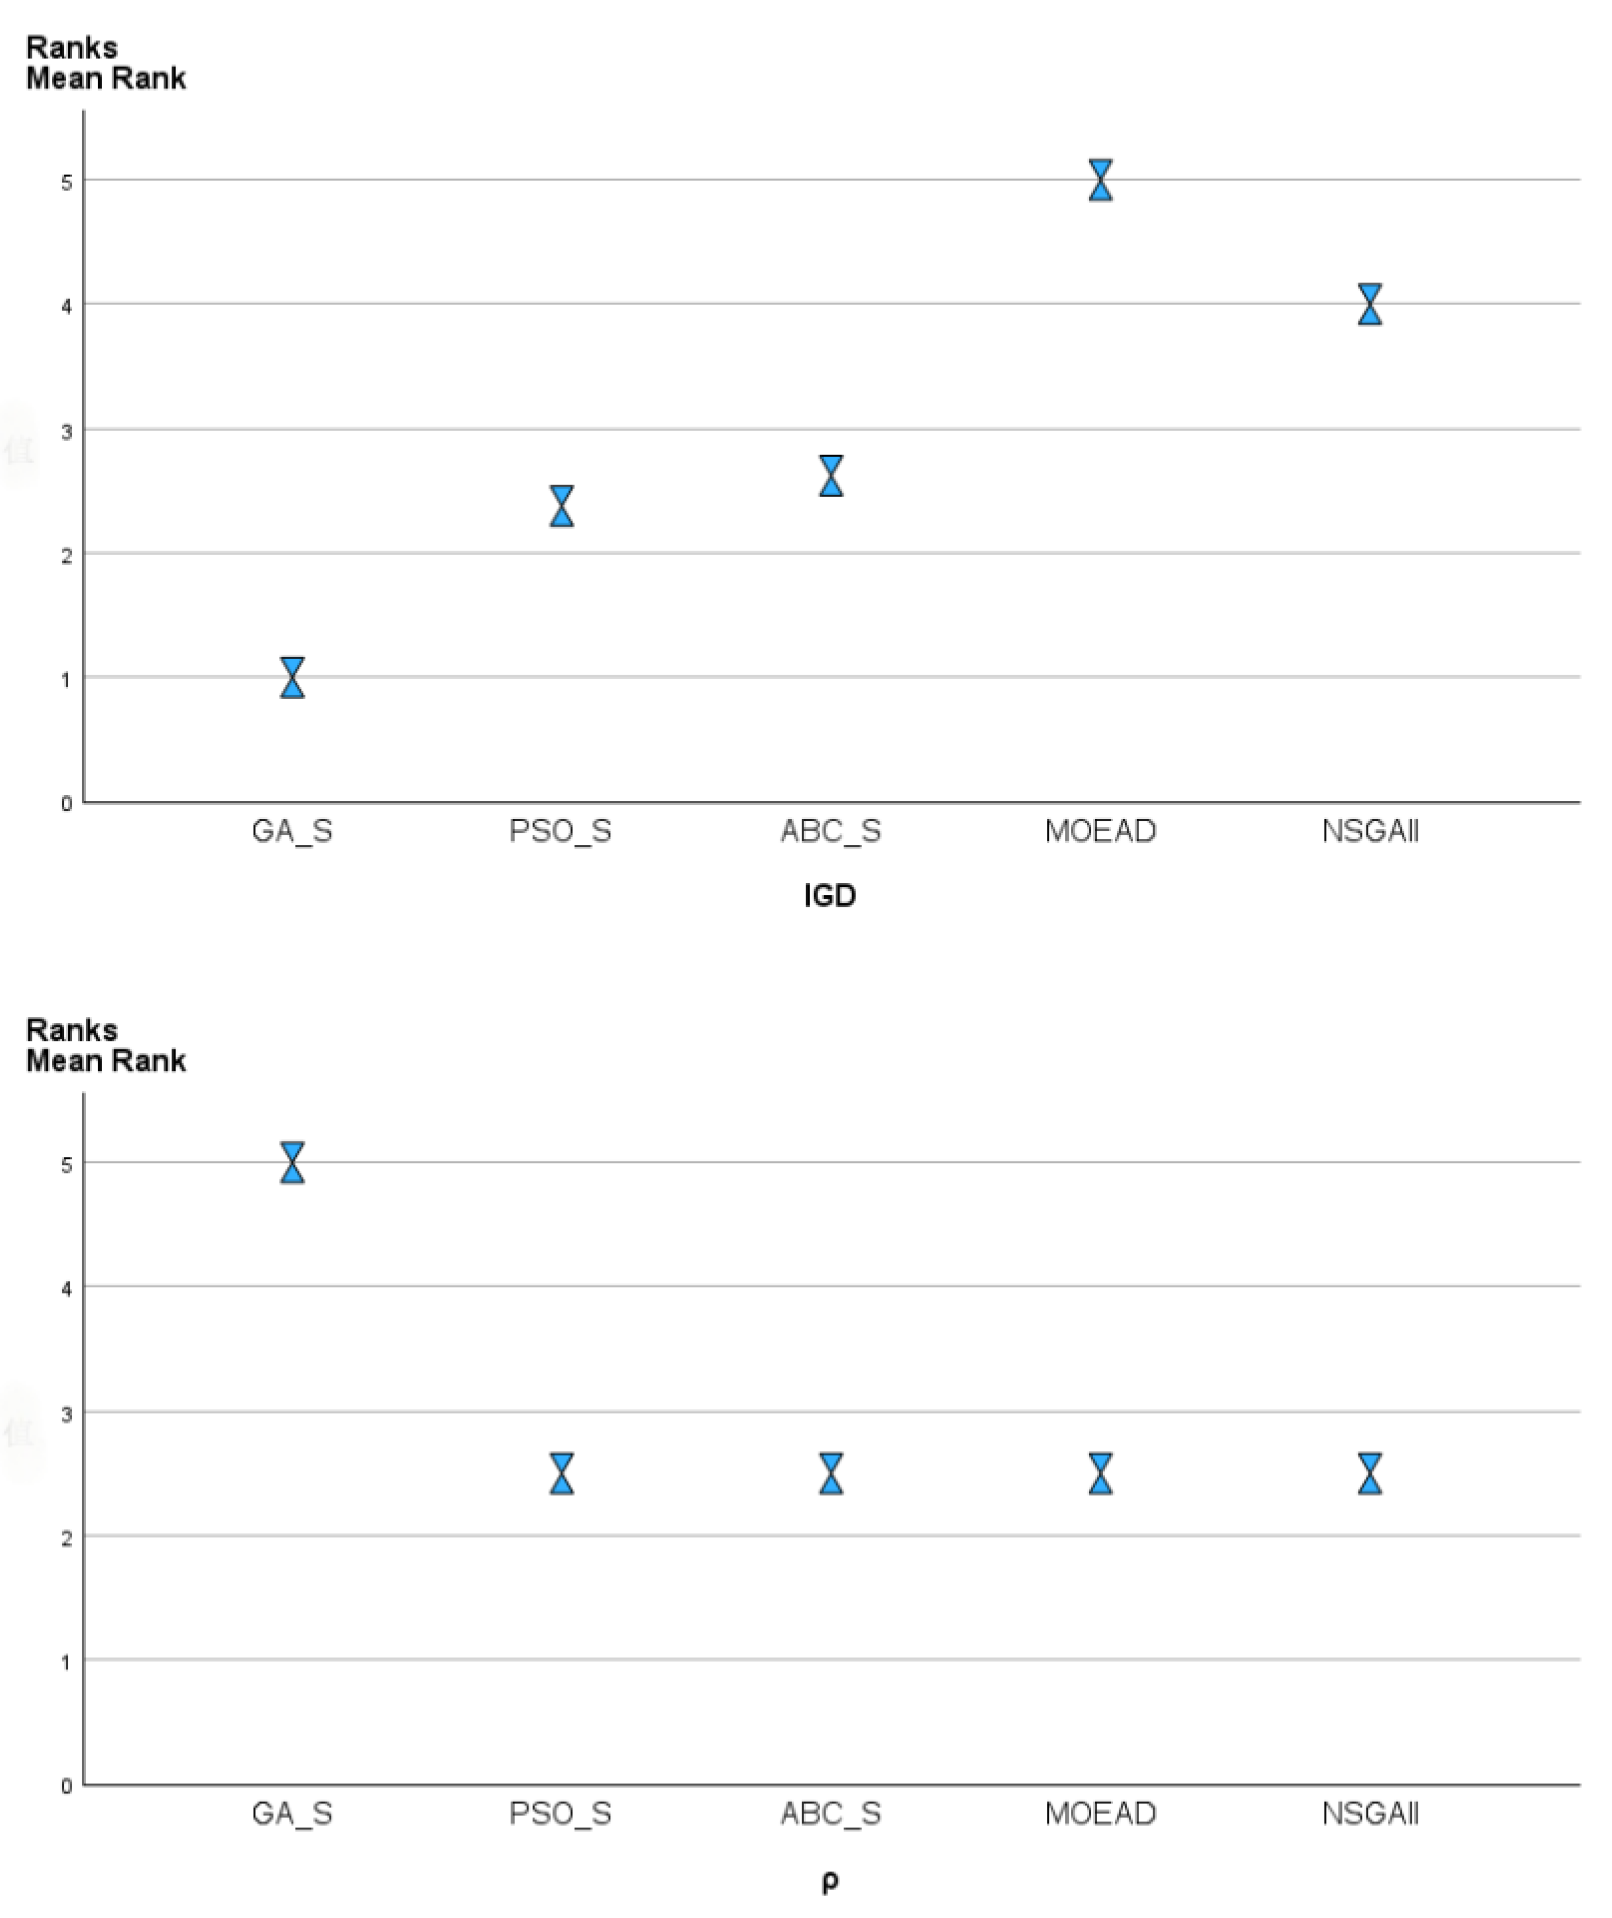
Figure 23 and Figure 24 present the IGD and ρ metric outcomes for a selection of real-case scenarios from the initial dataset. Figure 23’s findings show that the asymptotic significance values for both metrics are considerably below the 0.05 threshold, highlighting significant performance differences among the algorithms. Figure 25 displays the Nemenyi post hoc test results, which rank the performance of the five algorithms. GA_S demonstrates the most competitive performance, with the lowest average rank across all algorithms. This is further validated by GA_S having the highest average rank of 5 in the ρ metric, signifying its dominance.
Furthermore, Figure 26 and Figure 27 graphically represent the ranking distribution of the five algorithms with respect to different metrics. Figure 26 shows the IGD metric rankings, while Figure 27 concentrates on the ρ metric. Figure 26 shows that GA_S has the most number of instances at the first rank on the IGD metric. In contrast, Figure 27 shows that GA_S is mostly ranked fifth and first in the fewest cases for the ρ metric. Figure 28 plots the non-dominated solutions obtained by the five algorithms for two instances. It can be observed from Figure 28 that the non-dominated solutions obtained by GA_S, PSO_S and ABC_S dominate those by MOEAD and NSGA-II. The solutions obtained by GA_S dominate those by PSO_S and ABC_S. These findings further confirm the strong competitiveness of GA_S.

6. Conclusions and Future Work

This work develops a multi-objective mathematical model to solve the integrated scheduling of job shop problems and material handling robots with setup time. Then, we improve three meta-heuristics to address the problems. To enhance the performance of these algorithms, seven local search operators are developed. Finally, 82 benchmark instances with different scales are solved. Experimental results and comparisons show that GA with SARSA-based local search operators is the most competitive among all compared algorithms.
This study optimizes resource allocation and job scheduling through a collaborative mechanism between the MHR and machines, enhancing factory efficiency. It minimizes the maximum completion time and earliness and tardiness, ensuring production continuity and maximizing resource utilization. However, there are still some limitations. In the future, we will focus on the following research directions: (1) consider more objectives, such as machine workload and carbon emission-related ones; (2) add additional constraints, e.g., blocking time; (3) design more local search operators and more reinforcement learning methods to enhance performance, e.g., graph neural networks and deep Q-networks; (4) extend designed algorithms to other production scheduling problems; and (5) collaborate with industry partners to put the suggested models and algorithms to the scope of real-world applications. This study will offer valuable insights into their performance, scalability, and adaptability within actual production settings.
Author Contributions

Conceptualization, R.L., Q.J. and K.G.; Methodology, R.L., Q.J. and K.G.; Software, R.L. and Q.J.; Validation, R.L. and Q.J.; Investigation, R.L. and Q.J.; Resources, K.G.; Data curation, R.L. and Q.J.; Writing—original draft, R.L.; Writing—review & editing, Q.J., H.Y., K.G., Y.F. and L.Y.; Visualization, R.L. and Q.J.; Supervision, K.G., Y.F. and L.Y.; Project administration, K.G., Y.F. and L.Y.; Funding acquisition, K.G., Y.F. and L.Y. All authors have read and agreed to the published version of the manuscript.

Funding

This study is partially supported by the International Science and Technology project of Guangzhou Development District under Grant 2023GH08: Research on Collaborative Technologies of Multimodal, Multi Configuration, and Multi Structural Elements, Guangdong Basic and Applied Basic Research Foundation (2023A1515011531), the Science and Technology Development Fund (FDCT), Macau SAR, under Grant 0019/2021/A, the National Natural Science Foundation of China under Grant 62173356, Zhuhai Industry-University-Research Project with Hongkong and Macao under Grant ZH22017002210014PWC, the Key Technologies for Scheduling and Optimization of Complex Distributed Manufacturing Systems under Grant 22JR10KA007, and the Bureau of Science and Technology of Huzhou Municipality Public Welfare Application Research Project, Industry [Public welfare], 2023GZ24, The second batch of high-level talents special project of Huzhou Vocational and Technical College in 2023, 2023TS08.

Data Availability Statement

The original contributions presented in this study are included in the article. Further inquiries can be directed to the corresponding author.

Conflicts of Interest

The authors declare no conflicts of interest.

References

  1. Pinedo, M. Planning and Scheduling in Manufacturing and Services; Springer: Berlin/Heidelberg, Germany, 2005. [Google Scholar]
  2. Kumar, N.; Mishra, A. Comparative Study of Different Heuristics Algorithms in Solving Classical Job Shop Scheduling Problem. Mater. Today Proc. 2020, 22, 1796–1802. [Google Scholar] [CrossRef]
  3. Simon, F.Y.P. Stochastic Neural Networks for Solving Job-Shop Scheduling I. Problem Representation. In Proceedings of the IEEE 1988 International Conference on Neural Networks, San Diego, CA, USA, 24–27 July 1988; IEEE: Piscataway, NJ, USA, 1988; pp. 275–282. [Google Scholar]
  4. Baker, K.R. Introduction to Sequencing and Scheduling; Jhon Willey and Sons Inc.: New York, NY, USA, 1974. [Google Scholar]
  5. Lageweg, B.J.; Lenstra, J.K.; Rinnooy Kan, A.H.G. Job-Shop Scheduling by Implicit Enumeration. Manag. Sci. 1977, 24, 441–450. [Google Scholar] [CrossRef]
  6. Carlier, J.; Pinson, E. An Algorithm for Solving the Job-Shop Problem. Manag. Sci. 1989, 35, 164–176. [Google Scholar] [CrossRef]
  7. Fisher, H.; Thompson, G. Probabilistic Learning Combination of Local Job-Shop Scheduling Rules. In Industrial Scheduling; Prentice-Hall: Englewood Cliffs, NJ, USA, 1963. [Google Scholar]
  8. Van Laarhoven, P.J.; Aarts, E.H.; Lenstra, J.K. Job Shop Scheduling by Simulated Annealing. Oper. Res. 1992, 40, 113–125. [Google Scholar] [CrossRef]
  9. Gershwin, S.B. Hierarchical Flow Control: A Framework for Scheduling and Planning Discrete Events in Manufacturing Systems. Proc. IEEE 1989, 77, 195–209. [Google Scholar] [CrossRef]
  10. Brucker, P.; Hilbig, T.; Hurink, J. A Branch and Bound Algorithm for a Single-Machine Scheduling Problem with Positive and Negative Time-Lags. Discret. Appl. Math. 1999, 94, 77–99. [Google Scholar] [CrossRef]
  11. Cao, X.Z.; Yang, Z.H. A New Hybrid Optimization Algorithm and Its Application in Job Shop Scheduling. Appl. Mech. Mater. 2011, 55–57, 1789–1793. [Google Scholar] [CrossRef]
  12. Lourenço, H.R. Job-Shop Scheduling: Computational Study of Local Search and Large-Step Optimization Methods. Eur. J. Oper. Res. 1995, 83, 347–364. [Google Scholar] [CrossRef]
  13. Wang, B.; Wang, X.; Lan, F.; Pan, Q. A Hybrid Local-Search Algorithm for Robust Job-Shop Scheduling under Scenarios. Appl. Soft Comput. 2018, 62, 259–271. [Google Scholar] [CrossRef]
  14. Pinson, E. The Job Shop Scheduling Problem: A Concise Survey and Some Recent Developments. In Scheduling Theory and Its Applications; Wiley: New York, NY, USA, 1995; pp. 277–294. [Google Scholar]
  15. Cheng, R.; Gen, M.; Tsujimura, Y. A Tutorial Survey of Job-Shop Scheduling Problems Using Genetic Algorithms, Part II: Hybrid Genetic Search Strategies. Comput. Ind. Eng. 1999, 36, 343–364. [Google Scholar] [CrossRef]
  16. Wang, L.; Zheng, D.Z. An Effective Hybrid Optimization Strategy for Job-Shop Scheduling Problems. Comput. Oper. Res. 2001, 28, 585–596. [Google Scholar] [CrossRef]
  17. Bilge; Ulusoy, G. A Time Window Approach to Simultaneous Scheduling of Machines and Material Handling System in an FMS. Oper. Res. 1995, 43, 1058–1070. [Google Scholar] [CrossRef]
  18. Deroussi, L.; Gourgand, M.; Tchernev, N. A Simple Metaheuristic Approach to the Simultaneous Scheduling of Machines and Automated Guided Vehicles. Int. J. Prod. Res. 2008, 46, 2143–2164. [Google Scholar] [CrossRef]
  19. Erol, R.; Sahin, C.; Baykasoglu, A.; Kaplanoglu, V. A Multi-Agent Based Approach to Dynamic Scheduling of Machines and Automated Guided Vehicles in Manufacturing Systems. Appl. Soft Comput. 2012, 12, 1720–1732. [Google Scholar] [CrossRef]
  20. Kumar, M.V.S.; Janardhana, R.; Rao, C.S.P. Simultaneous Scheduling of Machines and Vehicles in an FMS Environment with Alternative Routing. Int. J. Adv. Manuf. Technol. 2011, 53, 339–351. [Google Scholar] [CrossRef]
  21. Zheng, Y.; Xiao, Y.; Seo, Y. A Tabu Search Algorithm for Simultaneous Machine/AGV Scheduling Problem. Int. J. Prod. Res. 2014, 52, 5748–5763. [Google Scholar] [CrossRef]
  22. Fontes, D.B.M.M.; Homayouni, S.M. Joint Production and Transportation Scheduling in Flexible Manufacturing Systems. J. Glob. Optim. 2019, 74, 879–908. [Google Scholar] [CrossRef]
  23. Fontes, D.B.; Homayouni, S.M.; Gonçalves, J.F. A Hybrid Particle Swarm Optimization and Simulated Annealing Algorithm for the Job Shop Scheduling Problem with Transport Resources. Eur. J. Oper. Res. 2023, 306, 1140–1157. [Google Scholar] [CrossRef]
  24. Nageswara, R.M.; Narayana, R.K.; Ranga, J.G. Integrated Scheduling of Machines and AGVs in FMS by Using Dispatching Rules. J. Prod. Eng. 2017, 20, 75–84. [Google Scholar] [CrossRef]
  25. Lacomme, P.; Larabi, M.; Tchernev, N. Job-Shop Based Framework for Simultaneous Scheduling of Machines and Automated Guided Vehicles. Int. J. Prod. Econ. 2013, 143, 24–34. [Google Scholar] [CrossRef]
  26. Ham, A. Transfer-Robot Task Scheduling in Job Shop. Int. J. Prod. Res. 2021, 59, 813–823. [Google Scholar] [CrossRef]
  27. Yao, Y.J.; Liu, Q.H.; Li, X.Y.; Gao, L. A Novel MILP Model for Job Shop Scheduling Problem with Mobile Robots. Robot. Comput.-Integr. Manuf. 2023, 81, 102506. [Google Scholar] [CrossRef]
  28. Chen, K.; Bi, L.; Wang, W. Research on Integrated Scheduling of AGV and Machine in Flexible Job Shop. J. Syst. Simul. 2022, 34, 461–469. [Google Scholar]
  29. Yao, Y.; Liu, Q.; Fu, L.; Li, X.; Yu, Y.; Gao, L.; Zhou, W. A Novel Mathematical Model for the Flexible Job-Shop Scheduling Problem with Limited Automated Guided Vehicles. IEEE Trans. Autom. Sci. Eng. 2024. [Google Scholar] [CrossRef]
  30. Niu, H.; Wu, W.; Xing, Z.; Wang, X.; Zhang, T. A Novel Multi-Tasks Chain Scheduling Algorithm Based on Capacity Prediction to Solve AGV Dispatching Problem in an Intelligent Manufacturing System. J. Manuf. Syst. 2023, 68, 130–144. [Google Scholar] [CrossRef]
  31. HU, X.; YAO, X.; HUANG, P.; ZENG, Z. Improved Iterative Local Search Algorithm for Solving Multi-AGV Flexible Job Shop Scheduling Problem. Comput. Integr. Manuf. Syst. 2022, 28, 2198. [Google Scholar]
  32. Yuan, M.H.; Li, Y.D.; Pei, F.Q.; Gu, W.B. Dual-Resource Integrated Scheduling Method of AGV and Machine in Intelligent Manufacturing Job Shop. J. Cent. South Univ. 2021, 28, 2423–2435. [Google Scholar] [CrossRef]
  33. Wen, X.; Fu, Y.; Yang, W.; Wang, H.; Zhang, Y.; Sun, C. An Effective Hybrid Algorithm for Joint Scheduling of Machines and AGVs in Flexible Job Shop. Meas. Control 2023, 56, 1582–1598. [Google Scholar] [CrossRef]
  34. Goli, A.; Tirkolaee, E.B.; Aydın, N.S. Fuzzy Integrated Cell Formation and Production Scheduling Considering Automated Guided Vehicles and Human Factors. IEEE Trans. Fuzzy Syst. 2021, 29, 3686–3695. [Google Scholar] [CrossRef]
  35. Liu, Q.; Li, X.; Gao, L.; Wang, G. Mathematical Model and Discrete Artificial Bee Colony Algorithm for Distributed Integrated Process Planning and Scheduling. J. Manuf. Syst. 2021, 61, 300–310. [Google Scholar] [CrossRef]
  36. Huang, J.P.; Pan, Q.K.; Miao, Z.H.; Gao, L. Effective Constructive Heuristics and Discrete Bee Colony Optimization for Distributed Flowshop with Setup Times. Eng. Appl. Artif. Intell. 2021, 97, 104016. [Google Scholar] [CrossRef]
  37. Fu, Y.; Wang, H.; Wang, J.; Pu, X. Multiobjective Modeling and Optimization for Scheduling a Stochastic Hybrid Flow Shop With Maximizing Processing Quality and Minimizing Total Tardiness. IEEE Syst. J. 2021, 15, 4696–4707. [Google Scholar] [CrossRef]
  38. Qiao, Y.; Wu, N.; He, Y.; Li, Z.; Chen, T. Adaptive Genetic Algorithm for Two-Stage Hybrid Flow-Shop Scheduling with Sequence-Independent Setup Time and No-Interruption Requirement. Expert Syst. Appl. 2022, 208, 118068. [Google Scholar] [CrossRef]
  39. Liu, Q.; Li, X.; Gao, L.; Li, Y. A Modified Genetic Algorithm With New Encoding and Decoding Methods for Integrated Process Planning and Scheduling Problem. IEEE Trans. Cybern. 2021, 51, 4429–4438. [Google Scholar] [CrossRef]
  40. Cao, Z.; Lin, C.; Zhou, M.; Zhou, C.; Sedraoui, K. Two-Stage Genetic Algorithm for Scheduling Stochastic Unrelated Parallel Machines in a Just-in-Time Manufacturing Context. IEEE Trans. Autom. Sci. Eng. 2023, 20, 936–949. [Google Scholar] [CrossRef]
  41. Bi, J.; Yuan, H.; Duanmu, S.; Zhou, M.; Abusorrah, A. Energy-Optimized Partial Computation Offloading in Mobile-Edge Computing with Genetic Simulated-Annealing-Based Particle Swarm Optimization. IEEE Internet Things J. 2020, 8, 3774–3785. [Google Scholar] [CrossRef]
  42. Yu, H.; Gao, K.; Wu, N.; Zhou, M.; Suganthan, P.N.; Wang, S. Scheduling Multiobjective Dynamic Surgery Problems via Q-learning-based Meta-Heuristics. IEEE Trans. Syst. Man, Cybern. Syst. 2024, 54, 3321–3333. [Google Scholar] [CrossRef]
  43. Yu, H.; Gao, K.; Ma, Z.; Wang, L. Exact and Deep Q-Network Assisted Swarm Intelligence Methods for Scheduling Multi-Objective Heterogeneous Unmanned Surface Vehicles. IEEE Transactions on Evolutionary Computation 2024. [Google Scholar] [CrossRef]
  44. Lin, Z.; Gao, K.; Wu, N.; Suganthan, P.N. Scheduling Eight-Phase Urban Traffic Light Problems via Ensemble Meta-Heuristics and Q-learning Based Local Search. IEEE Trans. Intell. Transp. Syst. 2023. [Google Scholar] [CrossRef]
  45. Lin, Z.; Gao, K.; Wu, N.; Suganthan, P.N. Problem-Specific Knowledge Based Multi-Objective Meta-Heuristics Combined q-Learning for Scheduling Urban Traffic Lights with Carbon Emissions. IEEE Trans. Intell. Transp. Syst. 2024. [Google Scholar] [CrossRef]
  46. Zhao, F.; Di, S.; Wang, L. A Hyperheuristic with Q-learning for the Multiobjective Energy-Efficient Distributed Blocking Flow Shop Scheduling Problem. IEEE Trans. Cybern. 2022, 53, 3337–3350. [Google Scholar] [CrossRef] [PubMed]
  47. Zhao, F.; Hu, X.; Wang, L.; Xu, T.; Zhu, N.; Jonrinaldi. A Reinforcement Learning-Driven Brain Storm Optimisation Algorithm for Multi-Objective Energy-Efficient Distributed Assembly No-Wait Flow Shop Scheduling Problem. Int. J. Prod. Res. 2023, 61, 2854–2872. [Google Scholar] [CrossRef]
  48. Yu, H.; Gao, K.Z.; Ma, Z.F.; Pan, Y.X. Improved Meta-Heuristics with Q-learning for Solving Distributed Assembly Permutation Flowshop Scheduling Problems. Swarm Evol. Comput. 2023, 80, 101335. [Google Scholar] [CrossRef]
  49. Li, H.; Gao, K.; Duan, P.Y.; Li, J.Q.; Zhang, L. An Improved Artificial Bee Colony Algorithm with Q-learning for Solving Permutation Flow-Shop Scheduling Problems. IEEE Trans. Syst. Man, Cybern. Syst. 2022, 53, 2684–2693. [Google Scholar] [CrossRef]
  50. Chen, R.; Yang, B.; Li, S.; Wang, S. A Self-Learning Genetic Algorithm Based on Reinforcement Learning for Flexible Job-Shop Scheduling Problem. Comput. Ind. Eng. 2020, 149, 106778. [Google Scholar] [CrossRef]
  51. Shen, X.N.; Minku, L.L.; Marturi, N.; Guo, Y.N.; Han, Y. A Q-learning-based Memetic Algorithm for Multi-Objective Dynamic Software Project Scheduling. Inf. Sci. 2018, 428, 1–29. [Google Scholar] [CrossRef]
  52. Hsieh, Y.Z.; Su, M.C. AQ-learning-based Swarm Optimization Algorithm for Economic Dispatch Problem. Neural Comput. Appl. 2016, 27, 2333–2350. [Google Scholar] [CrossRef]
  53. Gao, M.; Gao, K.; Ma, Z.; Tang, W. Ensemble Meta-Heuristics and Q-learning for Solving Unmanned Surface Vessels Scheduling Problems. Swarm Evol. Comput. 2023, 82, 101358. [Google Scholar] [CrossRef]
  54. Allahverdi, A.; Gupta, J.N.; Aldowaisan, T. A Review of Scheduling Research Involving Setup Considerations. Omega 1999, 27, 219–239. [Google Scholar] [CrossRef]
  55. Weller, T.R.; Weller, D.R.; Abreu Rodrigues, L.C.; Volpato, N. A Framework for Tool-Path Airtime Optimization in Material Extrusion Additive Manufacturing. Robot. Comput.-Integr. Manuf. 2021, 67, 101999. [Google Scholar] [CrossRef]
  56. Gholami, M.; Zandieh, M. Integrating Simulation and Genetic Algorithm to Schedule a Dynamic Flexible Job Shop. J. Intell. Manuf. 2009, 20, 481–498. [Google Scholar] [CrossRef]
  57. Gao, K.Z.; Suganthan, P.N.; Pan, Q.K.; Chua, T.J.; Cai, T.X.; Chong, C.S. Pareto-Based Grouping Discrete Harmony Search Algorithm for Multi-Objective Flexible Job Shop Scheduling. Inf. Sci. 2014, 289, 76–90. [Google Scholar] [CrossRef]
  58. He, Z.; Yen, G.G. Visualization and Performance Metric in Many-Objective Optimization. IEEE Trans. Evol. Comput. 2015, 20, 386–402. [Google Scholar] [CrossRef]
  59. Zhang, J.; Cao, J.; Zhao, F.; Chen, Z. An Angle-Based Many-Objective Evolutionary Algorithm with Shift-Based Density Estimation and Sum of Objectives. Expert Syst. Appl. 2022, 209, 118333. [Google Scholar] [CrossRef]
  60. Zhang, Q.; Li, H. MOEA/D: A Multiobjective Evolutionary Algorithm Based on Decomposition. IEEE Trans. Evol. Comput. 2007, 11, 712–731. [Google Scholar] [CrossRef]
  61. Deb, K.; Pratap, A.; Agarwal, S.; Meyarivan, T.A.M.T. A Fast and Elitist Multiobjective Genetic Algorithm: NSGA-II. IEEE Trans. Evol. Comput. 2002, 6, 182–197. [Google Scholar] [CrossRef]
Figure 1. Schematic representation of a manufacturing setup with two MHRs and five machines.
Mathematics 13 00447 g001
Figure 2. An example Gantt chart for BI-JSP-MHR.
Mathematics 13 00447 g002
Figure 3. A production process model with setup time equal to processing time.
Mathematics 13 00447 g003
Figure 4. A production process model that considers the setup time separately.
Mathematics 13 00447 g004
Figure 5. A solution of BI-JSP-MHR.
Mathematics 13 00447 g005
Figure 6. The flowchart of GA.
Mathematics 13 00447 g006
Figure 7. The flowchart of PSO.
Mathematics 13 00447 g007
Figure 8. The flowchart of ABC.
Mathematics 13 00447 g008
Figure 9. Local search operators.
Mathematics 13 00447 g009
Figure 10. Framework of Q-learning.
Mathematics 13 00447 g010
Figure 11. Algorithm framework of Q-learning-based meta-heuristics.
Mathematics 13 00447 g011
Figure 12. Parameter level trend of ABC.
Mathematics 13 00447 g012
Figure 13. Parameter level trend of PSO.
Mathematics 13 00447 g013
Figure 14. Parameter level trend of GA.
Mathematics 13 00447 g014
Figure 15. Parameter level trend of Q-learning.
Mathematics 13 00447 g015
Figure 16. Parameter level trend of SARSA.
Mathematics 13 00447 g016
Figure 17. The IGD Friedman test for meta-heuristics and its variants.
Mathematics 13 00447 g017
Figure 18. The IGD Nemenyi post-hoc test of meta-heuristics and their variants.
Mathematics 13 00447 g018
Figure 19. The IGD rank distribution of meta-heuristics and their variants.
Mathematics 13 00447 g019
Figure 20. The ρ Friedman test of meta-heuristics and its variants.
Mathematics 13 00447 g020
Figure 21. The ρ Nemenyi post-hoc test of meta-heuristics and their variants.
Mathematics 13 00447 g021
Figure 22. The ρ rank distribution of meta-heuristics and its variants.
Mathematics 13 00447 g022
Figure 23. Friedman test on IGD for random instances.
Mathematics 13 00447 g023
Figure 24. Friedman test on ρ for random instances.
Mathematics 13 00447 g024
Figure 25. The Nemenyi post-hoc test of meta-heuristics and their variants.
Mathematics 13 00447 g025
Figure 26. The IGD rank distribution of five algorithms.
Mathematics 13 00447 g026
Figure 27. The ρ rank distribution of five algorithms.
Mathematics 13 00447 g027
Figure 28. Non-dominated solutions of five algorithms.
Mathematics 13 00447 g028
Table 1. Some example data about time.
Processing Time
Jobs Operations Machines
M 1 M 2
Job 1 O1,1 6
O 1 , 2 7
Transportation Time
Jobs Operations MHR
L/U- M 1 M 1 - M 2
Job 1 O 1 , 1 3
O 1 , 2 2
Setup Time
Jobs Operations Machines
M 1 M 2
Job 1 O 1 , 1 5
O 1 , 2 4
Table 2. The notations used in the model.
NotationDescription
nNumber of jobs
mNumber of machines
o i Number of operations of each job
vNumber of MHRs
iIndex of jobs
jIndex of operations
cIndex of machines
kIndex of MHRs
JSet of n jobs, { J 1 , J 2 , , J n }
MSet of m machines, { M 1 , M 2 , , M n }
OSet of operations of job J i = { O i , 1 , O i , 2 , , O i , n }
VSet of v MHRs, { V 1 , V 2 , , V n }
DA large positive number
P t i , j The processing time of operation O i , j
T t i , j The travel time of transportation for operation O i , j
S P i , j The start place of transportation for operation O i , j
E P i , j The end place of transportation for operation O i , j
T c , c The travel time from machine c to machine c
C i The completion time of job J i
C m a x makespan
S T O i , j The start time of processing for operation O i , j
S T L O i , j The start time of loaded transportation for operation O i , j
x i , j , k Binary variable that takes value 1 if MHR k is selected to perform the transportation for operation O i , j , otherwise 0
y i , j , i , j Binary variable that takes value 1 if operation O i , j is processed precedes operation O i , j on the same machine, otherwise 0
z i , j , i , j , k Binary variable that takes value 1 if the transportation of operation O i , j is performed precedes operation O i , j on MHR k, otherwise 0
d i The due date of J i
E / T Earliness and Tardiness
S E i , j The setup time operation O i , j
Table 3. Q-table.
Table 3. Q-table.
LSa1a2a3a4a5a6a7
s1Q(s1,a1)Q(s1,a2)Q(s1,a3)Q(s1,a4)Q(s1,a5)Q(s1,a6)Q(s1,a7)
s2Q(s2,a1)Q(s2,a2)Q(s2,a3)Q(s2,a4)Q(s2,a5)Q(s2,a6)Q(s2,a7)
s3Q(s3,a1)Q(s3,a2)Q(s3,a3)Q(s3,a4)Q(s3,a5)Q(s3,a6)Q(s3,a7)
s4Q(s4,a1)Q(s4,a2)Q(s4,a3)Q(s4,a4)Q(s4,a5)Q(s4,a6)Q(s4,a7)
s5Q(s5,a1)Q(s5,a2)Q(s5,a3)Q(s5,a4)Q(s5,a5)Q(s5,a6)Q(s5,a7)
s6Q(s6,a1)Q(s6,a2)Q(s6,a3)Q(s6,a4)Q(s6,a5)Q(s6,a6)Q(s6,a7)
s7Q(s7,a1)Q(s7,a2)Q(s7,a3)Q(s7,a4)Q(s7,a5)Q(s7,a6)Q(s7,a7)
Table 4. IGD statistics results for GA and its variants.
GAGA_LGA_QGA_S GAGA_LGA_QGA_S
abz5147.7223.7570.01150.03la34755.15213.75175.710
abz6178.958.37071.82la35725.96152.43155.590
abz7538.15323.68260.390la36525.89143.76151.320
abz8516.83202.76131.040la37657.12392.05271.540
abz9486.16241.44157.190la38514.69200.86149.680
ft0637.773.9243.3855.25la39546.54214.8206.180
ft10355.54121.33129.160la40673.66306.23274.150
ft20284.4231.7569.7931.75orb01316.3198.6566.270
la018119.1618.1412.83orb02333.08186.63127.170
la0293.1227.673.826.94orb03276.5725.5940.1227.84
la03113.0620.1622.156.34orb04138.368.3614.1445.68
la0445.52017.1526.78orb05336.48171.5690.010
la0561.8210.621.6223.88orb06172.4234.7633.6210.32
la0682.9948.4419.676.43orb07300.08113.47145.770
la07124.823.4318.9319.15orb08247.5632.6398.982.3
la08130.9472.7258.70orb09132.3237.7734.1633.05
la09186.0570.5253.960orb10278.71130.8149.070
la10141.6865.319.480swv01659.8185.13236.780
la11244.1372.1672.210swv02638.47195.77181.620
la12215.2859.6745.440swv03623.9514.9822.0631.54
la13183.1958.0955.220swv04727.54191.17164.390
la14153.5650.146.710swv05639.67142.1593.380
la15143.5928.3829.620swv061104.3473.09350.890
la16328.18131.29107.690swv071050.05338.08278.380
la17297.4165.1264.350swv081109.45367.4195.160
la18444.15183.51238.030swv09817.02209.32154.380
la19243.8616.9711.578.75swv101030.09382.43336.760
la20311.9272.9382.530swv111494.1151.6681.6282.02
la21393.95121.2680.470swv121490.96325.78308.270
la22414.887.2123.681.25swv131948.77446.83370.110
la23300.6570.66082.33swv141505.27381.14277.250
la24328.6237.560113.35swv151847.38645.67453.50
la25381.66149.85103.870swv161384.62428.09383.540
la26389.6353.0785.530swv171295.19438.06255.520
la27624.76188.6369.370swv181116.51506.38471.550
la28526.4209.7151.670swv191139.02439.61348.070
la29627.13225.71283.070swv201157.33323.84372.970
la30585.38160.88204.630yn1710.56348.32315.430
la31767.54208.56178.580yn2666.05344.7200.820
la32814.13307.07151.980yn3605.92316.39282.710
la33769.84128.5238.4919.31yn4868.03454.21346.740
Table 5. IGD statistics results for PSO and its variants.
PSOPSO_LPSO_QPSO_S PSOPSO_LPSO_QPSO_S
abz5735.2876.4921.9312.48la341088.3159.7114.230.72
abz6680.59142.9239.220la351027.1768.7642.145.22
abz7989.29191.87227.970la361002.3742.330148.83
abz8769.3257.5751.9425.2la371331.35303.87252.260
abz9909110.980115.48la381202.26195.27225.370
ft0662.93019.1151.34la39982.2535.86106.80
ft10699.2196.0173.8322.55la401276.15237.3268.540
ft20455.1261.9554.630orb01704.8478.79156.430
la011862.9328.9315.99orb02653.98166.7165.90
la02170.1512.5112.9210.3orb03603.1726.4822.3255.32
la03183.665.2610.5314.33orb04615.3352.84142.950
la04255.3086.1584.42orb05544.89094.8557.77
la05133.484.8514.588.29orb06685.41230.46237.520
la06259.9767.06390orb07632.79126.28143.470
la07356.0561.1176.260orb08681.69284.13237.430
la08266.97029.7542.41orb09538.8167.781182.54
la09314.65061.4818.57orb10634.68109.92091.29
la10273.4264.6442.5612.71swv01745.2910.4632.9443.39
la11344.01055.9141.02swv02983.67218.76236.640
la12347.1938.2950.820.18swv03918.25211.75255.860
la13441.0221.5759.938.43swv041079.5674.52197.710
la14417.2429.8241.8629.82swv051060.32321.76256.180
la15400.9524.9264.1425.19swv061439.56276.08196.390
la16607.37127.4517.080swv071302.06118.08142.020
la17600.97117.27106.680swv081107.39033.13467
la18585.48110.6476.030swv091571.65300.39368.260
la19453.7820.8629.8842.68swv101279.730241.3273.15
la20693.76165.52151.850swv111501.170145.64351.78
la21546.6523.9476.940swv121924.92261.65207.740
la22673.060172.4570.8swv131940.120320.61116.86
la23663.78114.15104.180swv141766.540231277.37
la24728.82215.68171.150swv151745.340176.54329.04
la25666.12146.0469.9322.74swv161805.81451.2398.640
la26842.9569.2492.010swv171543.0933.6370.323.21
la271006.22251.72202.560swv181391.114.9714.97111.67
la28983.64173.28244.540swv191927.8612.32536.940
la29941.88143.52107.650swv201864.4449.45421.70
la30916.5248.41155.210yn11448.8798.32203.410
la311052.9372.8659.6112.5yn21389.71315.23273.070
la321217.13204.39215.070yn31300.8628.18090.17
la331139.4998.12077.23yn41301.7973.37116.650
Table 6. IGD statistics results for ABC and its variants.
ABCABC_LABC_QABC_S ABCABC_LABC_QABC_S
abz5824.25069.17164.27la341065.360118.72251.4
abz6767.185.05158.520la351381.84265.74266.850
abz7908.43236.69152.010la361294.68179.81186.380
abz8949.570106.53190.63la371244.4356.75114.110
abz9898.9267.5966.8431.03la381183.1675.8448.9717.81
ft06125.6437.6438.730la391191.4298.63087.28
ft10570.4943.2785.450la401361.61213.34232.780
ft20341.7954.9232.5734.3orb01624.1527.4847.18130.34
la01223.669.314.0626.91orb02533.5314.1765.7897.83
la0214143.3513.4434.06orb03557.1662.249.232.34
la03235.6719.0827.020orb04608.833.2885.5116.88
la04249.1523.238.2320.89orb05717.1155.2366.59132.19
la05264.1961.4125.620orb06717.86097.3190.09
la06248.9420.3874.4672.86orb07636.675.7168.270
la07310.9769.9585.380orb08727.4442.01143.750
la08300.3246.4510.4820.94orb09671.3774.060183.67
la09307.788.1218.7932.09orb10861.03151.132470
la10377.4937.2640.157.91swv01853.2274.76117.148.19
la11409.970.9226.033.44swv02819.3927.67106.8883.99
la12414.1448.9671.20swv03914.84141.5187.5120.04
la13301.725.2719.2738.4swv041002.65135.93283.650
la14383.1538.572.1332.37swv05935.1919.4875.3670.76
la15390.3713.9626.8413swv061339.24230.65160.460
la16444.4328.970.93114swv071356.78155.9237.960
la17619.4962.2370.730swv081363.4341.8799.830
la18605.23123.69206.150swv09990.698.5777.13159.79
la19657.7723.7610.3339.48swv101356.43171.02170.970
la20497.116.798.9644.51swv111773.39135.59406.4748.37
la21692.6610.3338.2627.55swv121583.1932.1658.15193.12
la22867.36104.7181.460swv131828.81239.52323.520
la23870.19167.54237.330swv141744.14129.18138.670
la24965.26251.08218.880swv151882.24330.48431.010
la25681.6332.8820.26.96swv161621.610141.96314.24
la26906.9836.17154.8517.67swv172146.63503.39447.730
la27892.8157.7699.490swv181875.72101.28263.060
la28941.5710.5510.5548.67swv191540.95165.6425.63187.65
la29870.665.8122.1122.11swv201718.8418.1280.3456.32
la30978.5129.9515.7321.51yn11169.4060.7293.64
la311026.357.5427.230.9yn21320.2587.01147.330
la321416.65233.77198.290yn31313.44140.8138.3935.01
la331126.2668.276.112.02yn41474.65193.64193.890
Table 7. ρ statistics results for GA and its variants.
GAGA_LGA_QGA_S GAGA_LGA_QGA_S
abz500.50.50la340001
abz60010la350001
abz70001la360001
abz80001la370001
abz90001la380001
ft0600.800.2la390001
ft100001la400001
ft2000.500.5orb010001
la0100.40.20.4orb020001
la02000.670.33orb0300.50.250.25
la0300.2500.75orb0400.50.50
la040100orb050001
la0500.50.250.25orb06000.330.67
la06000.40.6orb070001
la0700.750.250orb0800.1400.86
la080001orb0900.40.20.4
la090001orb100001
la100001swv010001
la110001swv020001
la120001swv0300.40.20.4
la130001swv040001
la140001swv050001
la150001swv060001
la160001swv070001
la170001swv080001
la180001swv090001
la19000.50.5swv100001
la200001swv1100.330.330.33
la210001swv120001
la22000.250.75swv130001
la230010swv140001
la240010swv150001
la250001swv160001
la260001swv170001
la270001swv180001
la280001swv190001
la290001swv200001
la300001yn10001
la310001yn20001
la320001yn30001
la33000.330.67yn40001
Table 8. ρ statistics results for PSO and its variants.
PSOPSO_LPSO_QPSO_S PSOPSO_LPSO_QPSO_S
abz5000.3330.167la34000.6670.333
abz60000.444la35000.250.75
abz70000.667la36000.50
abz8000.3330.667la370000.75
abz90010la380001
ft0600.36400la390000.333
ft10000.250.5la400000.667
ft200000.6orb010000.333
la0100.14300.143orb020000.667
la0200.10.10.3orb0300.50.50
la0300.3330.3330orb040001
la040100orb050100
la0500.3750.1250.25orb060001
la060000.5orb070000.833
la070001orb080001
la0800.83300orb0900.04800.143
la090100orb10000.50
la10000.250.5swv0100.6670.3330
la1100.7500swv020000.667
la1200.04300.304swv030001
la1300.200.4swv040001
la1400.500.5swv050001
la1500.33300.667swv060000.667
la160000.167swv070001
la170000.375swv0800.800
la180000.5swv090000.556
la1900.3330.3330.167swv100100
la200001swv1100.500
la210000.667swv120000.25
la220100swv130100
la230000.6swv140100
la240001swv150100
la25000.250.5swv160001
la260001swv1700.33300.333
la270001swv1800.50.50
la280001swv190001
la290001swv200000.5
la300000.6yn10000.571
la31000.20.6yn20001
la320000.8yn30010
la330010yn40000.6
Table 9. ρ statistics results for ABC and its variants.
ABCABC_LABC_QABC_S ABCABC_LABC_QABC_S
abz50100la3400.500
abz60001la350001
abz70001la360000.67
abz800.500la370001
abz900.170.170.17la38000.330.33
ft060000.17la390010
ft100000.67la400000.5
ft20000.50.5orb0100.440.110.33
la0100.670.170.17orb0200.670.330
la0200.330.110orb0300.130.380.13
la030001orb0400.200.2
la04000.750.25orb0500.50.50
la050001orb0600.2900
la0600.330.330.33orb070001
la070000.83orb080001
la0800.140.430.29orb09000.50
la0900.60.20orb100001
la1000.130.130.38swv0100.1700.83
la11000.250.25swv0200.50.250.25
la120000.5swv03000.140.43
la1300.330.330.33swv040000.67
la1400.090.450.09swv0500.6700.17
la1500.2100.21swv060000.67
la1600.090.270swv070001
la170001swv080000.5
la180000.6swv0900.670.170
la1900.330.670swv100001
la2000.330.220swv1100.3300.67
la2100.330.330.17swv1200.430.290
la220001swv130001
la230000.67swv140001
la240000.23swv150001
la25000.330.67swv160100
la2600.3300.67swv170001
la270001swv180001
la2800.50.50swv1900.290.430.14
la29000.50.5swv2000.6700.33
la30000.670.33yn100.7500
la3100.20.20.6yn20001
la320001yn3000.250.5
la3300.2500.75yn40001
Disclaimer/Publisher’s Note: The statements, opinions and data contained in all publications are solely those of the individual author(s) and contributor(s) and not of MDPI and/or the editor(s). MDPI and/or the editor(s) disclaim responsibility for any injury to people or property resulting from any ideas, methods, instructions or products referred to in the content.