Article

Accelerating Consensus Reaching Through Top Persuaders: A Social Persuasion Model in Social Network Group Decision Making

1
School of Information Management and Engineering, Shanghai University of Finance and Economics, Shanghai 200433, China
2
Shanghai Engineering Research Center of Finance Intelligence, Shanghai University of Finance and Economics, Shanghai 200433, China
3
MoE Key Laboratory of Interdisciplinary Research of Computation and Economics, Shanghai University of Finance and Economics, Shanghai 200433, China
4
Glorious Sun School of Business and Management, Donghua University, Shanghai 200051, China
5
School of Law, Shanghai University of Finance and Economics, Shanghai 200433, China
*
Author to whom correspondence should be addressed.
Mathematics 2025, 13(3), 385; https://doi.org/10.3390/math13030385
Submission received: 23 December 2024 / Revised: 21 January 2025 / Accepted: 23 January 2025 / Published: 24 January 2025

Abstract

:
In traditional group decision-making models, it is commonly assumed that all decision makers exert equal influence on one another. However, in real-world social networks, such as Twitter and Facebook, certain individuals—known as top persuaders—hold a disproportionately large influence over others. This study formulates the consensus-reaching problem in social network group decision making by introducing a novel framework for predicting top persuaders. Building on social network theories, we develop a social persuasion model that integrates social influence and social status to quantify individuals’ persuasive power more comprehensively. Subsequently, we propose a new CRP that leverages the influence of top persuaders. Our simulations and comparative analyses demonstrate that: (1) increasing the number of top persuaders substantially reduces the iterations required to achieve consensus; (2) establishing trust relationships between top persuaders and other individuals accelerates the consensus process; and (3) top persuaders retain a high and stable level of influence throughout the entire CRP rounds. Our research provides practical insights into identifying and strategically guiding top persuaders to enhance the efficiency in consensus reaching and reduce social management costs within social networked environments.

1. Introduction

In recent years, advancements in communication technology and the proliferation of social media platforms have made information sharing and opinion expression more accessible [1]. These technological developments have increased social interactions among individuals and significantly impacted social network group decision making (SNGDM). SNGDM refers to a decision-making scenario in which individuals within a social network express their opinions on various alternatives to reach a collective decision [2,3,4,5,6]. Generally, conflicts often arise among individuals, and the consensus reaching process (CRP) is necessary to resolve differences and achieve a unified solution (e.g., [7,8,9,10]). Unlike traditional group decision making (GDM), which encourages individuals to modify their preferences to align with group suggestion, the CRP in SNGDM primarily relies on preference adjustment through trust relationships [11,12,13].
Trust relationships play a crucial role in SNGDM, as individuals are more inclined to agree with those they trust [14,15,16,17]. The existing literature on SNGDM has demonstrated that trust relationships can influence decision making through mechanisms such as preference estimation, weight allocation, and trust evolution [18,19]. For example, Dong et al. [2] emphasize the role of leaders and improvements in trust relationships in achieving consensus. Zhang et al. [20] propose a trust evolution model that incorporates trust degrees and opinion similarities, introducing a trust evolution-based exogenous feedback mechanism. Additionally, You et al. [18] develop a reputation-based trust model to establish trust relationships among individuals through direct interactions and word-of-mouth recommendations.
To date, research on trust relationships in SNGDM usually encounters the following issues:
(1) In traditional CRPs of SNGDM, decision makers tend to accept advice from individuals they trust. Based on this idea, several feedback mechanisms have been designed based on trust relationships that make the adjusting opinions more persuasive [2,21,22]. For example, Li et al. [23] proposed a feedback mechanism considering trust relationships and bounded confidence for consensus reaching in SNGDM. However, existing SNGDM research often neglects the critical role of limited attention theory, which suggests that individuals have finite cognitive resources and cannot process all available information uniformly [24]. In complex decision environments, decision makers naturally prioritize opinions they perceive as most relevant or urgent, concentrating their attention on a small subset of their most trusted individuals. This selective attention phenomenon highlights the pivotal role of limited attention in shaping CRPs, especially when combined with trust relationships. Despite its importance, limited attention has rarely been systematically integrated with trust-based feedback mechanisms in SNGDM.
(2) In most studies of SNGDM, trust degrees among individuals are mainly determined by their trust relationships within the social network, such as network centrality metrics [3,12]. In general, individuals with high centrality scores are assumed to gain greater trust from others [25,26,27]. While centrality-based approaches effectively capture structural influence within social networks [28], they often overlook the role of individual preferences in shaping trust degrees. Recent research indicates that individuals whose opinions align more closely with the group opinion tend to achieve higher social status and earn others’ trust more easily [29]. For example, an individual with relatively low centrality but high preference alignment may still exert significant influence in the decision-making process. Therefore, it is crucial to jointly consider both network centrality and individual preference alignment to provide a more accurate and comprehensive representation of trust degrees in SNGDM.
To address these challenges, this study focuses on the phenomenon of social persuasion in social networks. Social persuasion refers to the principles and processes through which an individual’s attitudes, beliefs, or behaviors are influenced by other individuals within a social network [30]. According to social network theories, social persuasion arises from various forces, including social influence and social status [31,32]. Notably, social persuasion provides the basis for identifying top persuaders, who exert disproportionately large influence over other individuals [33]. For instance, on platforms such as Facebook and Twitter, a small number of key opinion leaders (KOLs) dominate discussions and capture the attention of vast audiences on the platform.
In this study, we formulate the consensus-reaching problem with top persuaders and address the following questions: (1) How to predict the top K persuaders? (2) How do these top persuaders affect group consensus? To solve these questions, we first develop a novel trust degree estimation method to quantify individuals’ ability to persuade others. Top persuaders are identified based on the estimated trust degrees. Then, we propose a new feedback mechanism based on top persuaders and investigate how they affect consensus reaching and final group consensus by simulations and comparative analyses. The main contributions and highlights of this study are summarized as follows:
(1) A novel method for determining trust degrees among individuals in SNGDM is proposed. The proposed social persuasion model integrates both social influence and social status, where social influence is evaluated using centrality metrics and social status is measured by the consensus degrees of individuals. Compared with existing methods that primarily focus on centrality metrics, our approach provides a more comprehensive framework to capture the critical factors influencing trust degrees. Experimental results demonstrate that the social persuasion model outperforms those considering only social influence or trust relationships in achieving group consensus.
(2) A novel CRP with top persuaders is proposed, which includes two key components: (1) Applying opinion dynamics for individuals based on the social persuasion model; (2) establishing trust relationships between top persuaders and other individuals to help the latter better adjust their preferences and achieve consensus. Our results show that top persuaders maintain their influence throughout the entire CRP rounds.
(3) Our study has practical implications for both business and society. By effectively predicting top persuaders, our method offers substantial value for various applications centered around social networks. For instance, a firm can use our method to identify top persuaders among potential customers, encourage them to adopt a product or service, and leverage their influence to drive wider adoption among other customers.
We organize the remainder of the paper as follows. Section 2 reviews the foundational concepts necessary for our proposal. Section 3 introduces the consensus-reaching problem with social persuasion and outlines our resolution framework. Section 4 details several simulation experiments and comparative analyses. Finally, the main contributions and future studies are drawn in Section 5.

2. Preliminaries

This section briefly introduces preliminaries concerning the traditional GDM problem, social network analysis, and opinion dynamics in a social network, which provide basic knowledge to develop and understand our proposal.

2.1. Traditional GDM Problem

In this article, the GDM problem is defined as a scenario where a group of decision makers V = v 1 , v 2 , , v m ( m 2 ) express their preferences regarding a set of alternatives X = x 1 , x 2 , , x n ( n 2 ) to reach a collective decision. Each decision maker v k V provides their preferences over the set of alternatives X . For simplicity, this study assumes that each v k expresses their preferences using an additive preference relation for pairwise comparisons of alternatives x i ,   x j .
Definition 1.
Let  P k = ( p i j k ) n × n  be an additive preference relation, where   p i j k [ 0 , 1 ]  denotes the preference degree of alternative   x i  over alternative   x j  provided by decision maker   v k , which has the additive reciprocity property   p i j k + p j i k = 1  and   p i i k = 0.5  for   i , j { 1 , , n } . Specifically,   p i j k > 0.5  means alternative   x i  is preferred to alternative   x j , and   p i j k = 0.5  means there is no difference between alternative   x i  and   x j .
Traditionally, GDM problems are divided into two main processes [34,35]: the CRP and the selection process. Furthermore, the CRP comprises two procedures: consensus measure and feedback adjustment. The general framework of GDM is illustrated in Figure 1.
(1) Consensus measure
The consensus measure is used to assess the consensus degree among decision makers in the group, which is usually calculated by measuring the distances between individual preferences and the collective preference [36,37]. In this study, we employ the weighted average (WA) operator to derive the collective preference P c = p i j c n × n , defined as:
p i j c = k = 1 m   π k p i j k ,   for   i , j = 1 , , n
Let π 1 , π 2 , , π m be the weights of a set of individuals, where π k 0 denotes the weight of individual v k in the aggregated collective preference and k = 1 m   π k = 1 . Next, we measure consensus degree of each individual v k and calculate the overall consensus degree C D [ 0 , 1 ] , which are described as follows:
C D v k = 1 i = 1 n 1   j = i + 1 n   p i j k p i j c n ( n 1 ) / 2
C D = k = 1 m   π k C D v k
Here, a larger C D value indicates a higher consensus degree. Achieving complete consensus ( C D = 1 ) in real-world GDM problems is both challenging and often unnecessary [38,39,40]. This study employs a soft consensus approach, where a predefined consensus threshold μ 0 , 1 is established to determine an acceptable level of consensus, and a maximum consensus time T is set to avoid the failure of the consensus process. Once the overall consensus degree reaches the threshold or the consensus time reaches the maximum round, the current collective preference is considered as the final group solution.
(2) Feedback adjustment
When the group does not reach the consensus threshold μ , individuals will be advised to adjust their preferences to improve the group consensus degree. The implementation of preference adjustment in CRPs consists of two classical rules [41,42]: identification rule (IR) and direction rule (DR). The IR helps to identify individuals who significantly deviate from the collective preference, specifically those who do not reach an acceptable consensus C D v k < μ . The DR, on the other hand, provides the necessary guidance on how individuals identified based on the IR should adjust their preferences. It ensures that individual preferences move closer to the collective preference and then increases the group consensus degree C D .
(3) Selection process
When achieving an acceptable consensus, the selection process will be utilized to derive the final collective preference P c = p i j c n × n and rank the alternatives X = x 1 , x 2 , , x n . The ranking of alternative x i can be generated based on the dominance degree Q i over other alternatives, where higher values indicate higher rankings [2,43]. The dominance degree Q i of alternative x i is calculated as follows:
Q i = j = 1 n   p i j c n

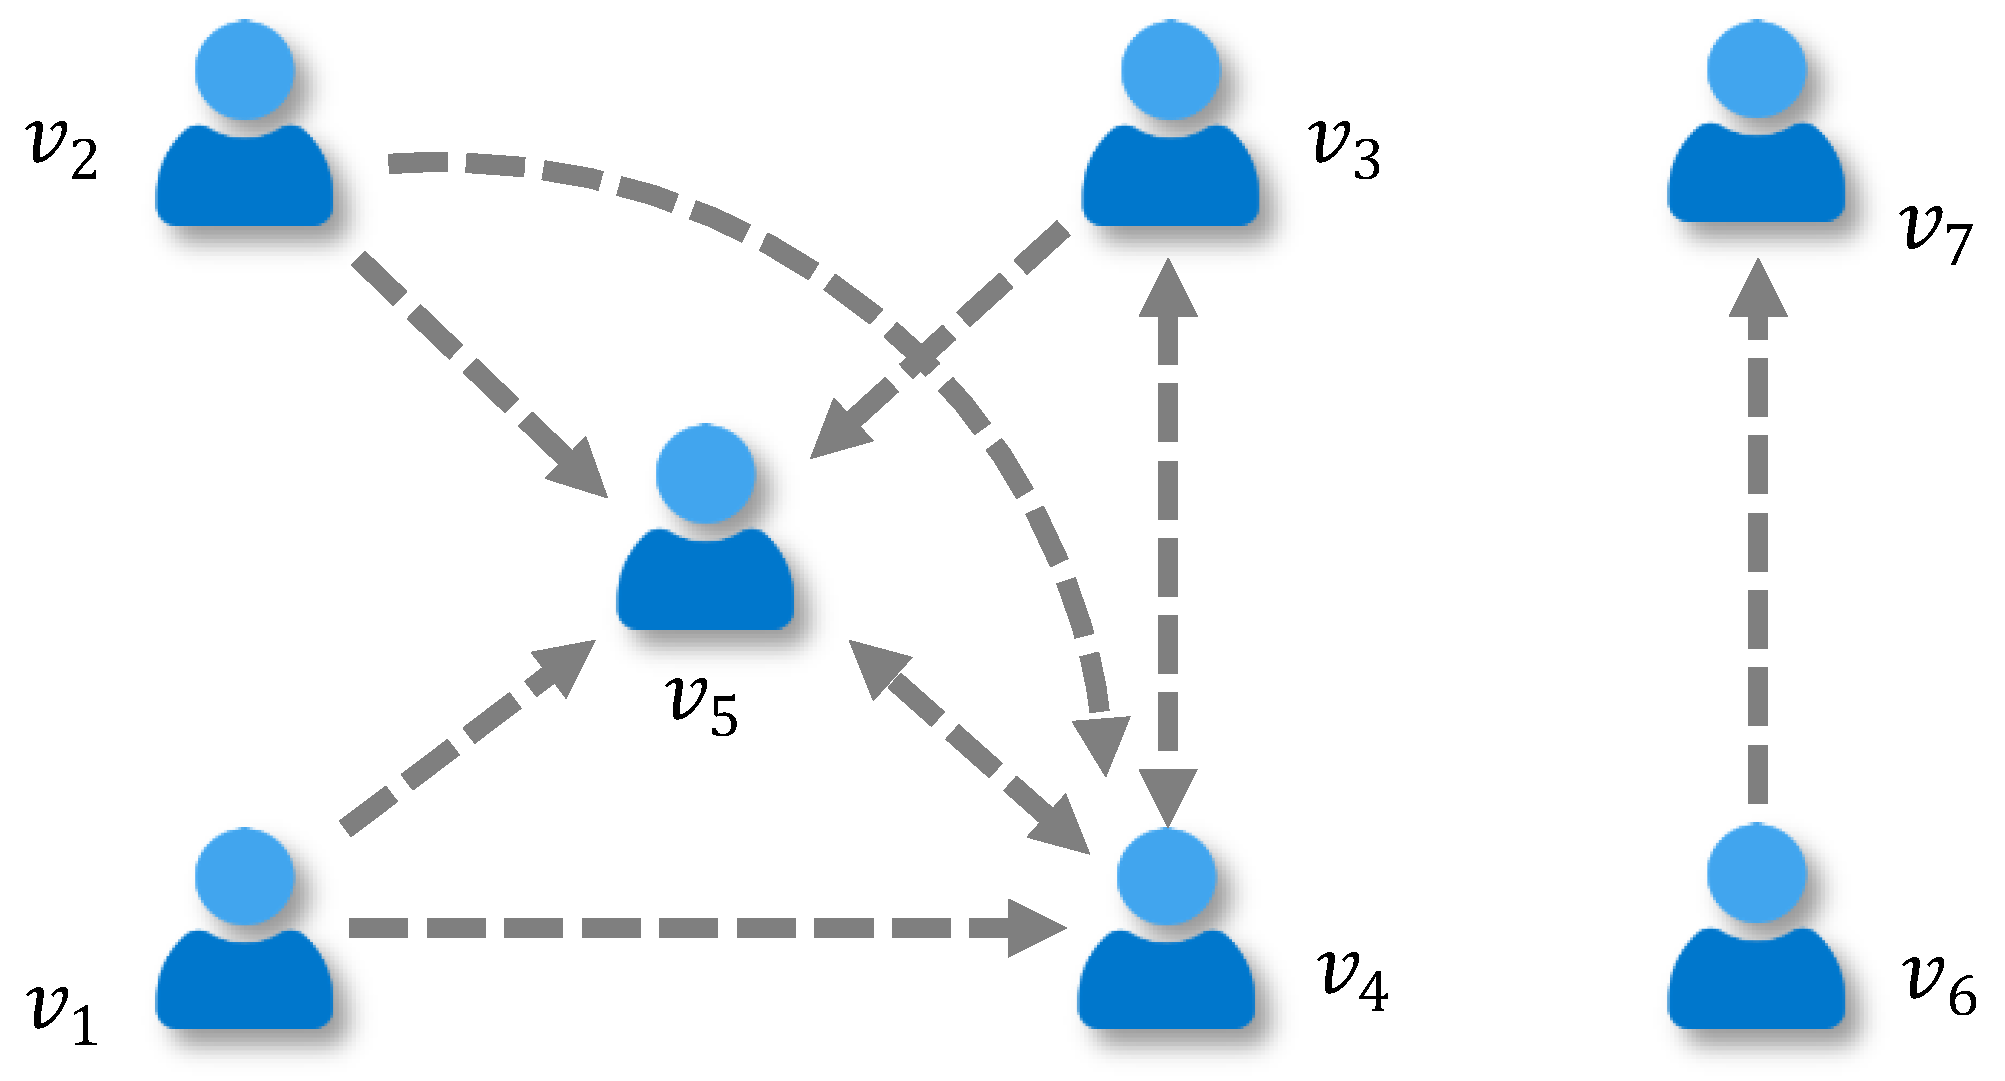
2.2. Social Network Analysis

A social network consists of a set of social entities and the relationships among them [44]. Generally, the social network can be depicted by a graph G ( V , E ) , where V = v 1 , v 2 , , v m ( m 2 ) denotes a set of social entities and E = v k , v l v k , v l V ; k l is a set of edges. The directed graph is used in this study, where an edge ( v k , v l ) E indicates that individual v k directly trusts v l . In our study, the basic definitions and notations regarding social networks are based on the works of Wasserman and Faust [44], Barabási and Márton [45], and Newman [46].
Definition 2.
Let   A = a k l m × m  be the adjacency matrix of graph   G ( V , E ) . If there is an edge from individual   v k  to   v l , a k l  is 1; otherwise, it is 0, i.e.,
a i j = 1 , v k , v l E 0 , v k , v l E .
For example, trust relationships among seven social entities are showed in Figure 2, and its adjacent matrix is
A = 1 0 0 0 0 0 0 1 0 1 0 0 0 0 1 0 0 0 0 1 0 0 0 0 0 0 0 0 0 0 0 0 0 0 0 1 0 0 0 0 0 0 .
Definition 3.
In graph  G ( D , E )  , a directed path from individual   v k  to   v l  is represented by a sequence of edges   v k , v σ ( 1 ) , v σ ( 1 ) , v σ ( 2 ) , , v σ ( q ) , v l , and is denoted as   v k v l .
Definition 4.
The shortest path from individual   v k  to   v l  is the sequence with the fewest number of edges. The distance from   v k  to   v l , denoted by   d k l , is the number of edges traversed along the shortest path.
As illustrated by Figure 2, there are two directed paths from v 1 to v 5 : v 1 v 2 v 3 v 4 v 2 v 5 and v 1 v 2 v 5 . The latter is used as the shortest path and the distance d 15 = 2 . It is possible for there to be no shortest path between two individuals, such as v 1 and v 7 , who are not connected together by any path through the network. In this case, the distance d 17 is infinite. In practice, the breadth first search (BFS) is used to calculate the shortest distance between every pair of individuals [47].
Trust relationships play a pivotal role in shaping interactions among individuals and revealing their social influence [44]. In this paper, the edge v k , v l E represents not only the trust relationship from individual v k to v l but also the social influence from v l to v k . In social network analysis (SNA), centrality-based methods are employed to calculate social influence, considering those individuals with high centrality scores as influential ones [25,26,27]. For instance, in-degree centrality simply measures the number of incoming edges an entity receives [48]. Closeness centrality of a social entity is calculated as the inverse of the sum of its distances to all other entities in a social network [48], which indicates how close an entity is to all other entities in the network. The closer an entity is, the faster it can potentially spread information. Betweenness centrality of a social entity represents its frequency of falling on the shortest paths that link pairs of other entities in a social network [48,49]. Entities with high betweenness centrality act as bridges and control information flow across the network. Eigenvector centrality measures an entity’s influence not just based on the number of connections but also on their centrality scores [50,51,52]. This means that if an entity is connected to other highly central entities, its own influence is correspondingly enhanced.
In this section, we introduce in-degree centrality, which is one of the simplest and most common centrality measures. The other centrality measures will be used in Section 4.2 for comparison analysis.
Definition 5.
The in-degree centrality   C i n ( v l )  measures the number of directed links pointing to   v l , i.e.,
C i n v l = k = 1 , k l m a k l / ( m 1 )
Example 1.
Consider the seven individuals   V = { v 1 , v 2 , v 3 , v 4 , v 5 , v 6 , v 7 }  in Figure 2, the in-degree centrality   C i n v k  of each individual   v k  is
C i n = [ 0 , 1 3 , 1 6 , 1 6 , 1 6 , 0 , 1 6 ]

2.3. Opinion Dynamics in a Social Network

Opinion dynamics, also called opinion evolution, describes how individuals’ opinions evolve and update through interactions. This process can be formulated as a discrete-time dynamical process, where consensus, polarization, or fragmentation can occur in the final state.
The DeGroot model is one of the classical models in opinion dynamics [53]. Dong et al. [2,3,54] propose a variant of the DeGroot model called the social network DeGroot model (SNDG). In practical social network scenarios, each decision maker may consider others’ opinions to a certain extent and modifies their own opinions accordingly. Let o k t R denote the opinion of individual v k at time t . The SNDG model assigns each individual v k a self-confidence degree β k ( 0 , 1 ) for their own opinion and distributes ( 1 β k ) across other individuals. Then, the evolved opinion o k t + 1 can be described as
o k t + 1 = β k o k t + l = 1 , l k m ω k l o l t
where l = 1 , l k m   ω k l = 1 β k , and ω k l 0 , 1 β k denotes the trust weight individual v k assigns to v l . Equation (8) can be equivalently presented as follows:
O t + 1 = W O t , t = 0 , 1 , 2 ,
where O t = o 1 t , o 2 t , , o m t and W = β 1 ω 12 ω 1 m ω 21 β 2 ω 2 m ω m 1 ω m 2 β m .

2.4. Theoretical Background

Existing SNGDM research extensively draws upon several foundational theories and models. Social network analysis (SNA) provides indispensable tools for evaluating individuals’ social influence within a network. Foundational concepts, such as centrality measures, enable researchers to quantify the structural importance of individuals and their capacity to influence others [27,44,48].
Another critical pillar of SNGDM research is opinion dynamics modeling, which captures how individuals’ opinions evolve through iterative interactions with others. Classical models, such as the DeGroot model, have been extended in recent works by Dong et al. [3] and Wu et al. [12] to reflect the complexities of opinion evolution in social networks. These advancements provide insights into how opinions converge, polarize, or fragment under varying network conditions.
By integrating these theoretical frameworks, prior studies have established a robust foundation for analyzing CRPs in SNGDM. Building on this groundwork, our study addresses several existing gaps by introducing a unified social persuasion model that combines social influence and social status to account for trust degrees within networks [30]. Additionally, we extend the application of centrality metrics and opinion dynamics by incorporating the role of top persuaders. These contributions advance the theoretical and practical understanding of SNGDM and provide new perspectives on improving decision efficiency in social networks.

3. The Proposed Framework Based on Social Persuasion

3.1. Problem Description and the Proposed Framework

In traditional GDM, a group of individuals V = v 1 , v 2 , , v m ( m 2 ) express preferences on a set of alternatives X = x 1 , x 2 , , x n ( n 2 ) to reach a collective solution. For each decision maker v k V , P k , t = ( p i j k , t ) n × n denotes their preference degree of alternative x i over alternative x j and C D t v k denotes their consensus degree at time t . Conflicts among individuals always exist in GDM, making consensus difficult to achieve. To mitigate these conflicts, the CRP is often employed. In traditional CRPs, individuals are encouraged to adjust their preferences to align more closely with the collective preference, aiming to improve the group consensus degree. However, in real decision-making scenarios, individuals who are in significant conflict are often difficult to coordinate and may be reluctant to make concessions.
Trust relationships play a crucial role in the decision-making process when individuals are required to adjust preferences. Individuals are more inclined to accept the suggestions of individuals they trust. Following this assumption, some CRPs guided by trust relationships have been justified well in the social network group decision making (SNGDM) [2,20,21]. In SNGDM, trust relationships can be depicted by edges in the network E = v k , v l v k , v l V ; k l , and the strength of trust from v k to v l can be depicted by s k l (i.e., the degree of influence v l has on v k ). Traditional SNGDM models primarily focus on direct interactions among individuals and assume that an individual’s social influence is limited to their first-order neighbors [2,20,28]. Specifically, s k l is 0 if there is no trust relationship from v k to v l . However, real social networks are far more complex than these models suggest. Social influence exists not only between directly connected individuals but can also spread through indirect social ties. For example, if v k trusts v m and v m trusts v l , then v k may be indirectly influenced by v l even if there is no direct trust relationship between them. This transitivity indicates that social influence can propagate through chains of trust relationships and extend to more distant individuals in the network.
Another important phenomenon of social networks in the context of decision making is social persuasion, which refers to the mechanisms through which an individual’s opinions, preferences, or behaviors are influenced by others within the network [30]. Social persuasion effectively illustrates how individuals can influence each other’s decision-making process through both direct and indirect social interactions. Moreover, social persuasion allows organizations to identify key social entities, known as top persuaders, whose influence on other entities in the network can significantly facilitate decision making processes and enhance group consensus.
In this study, we formulate the consensus-reaching problem with top persuaders as follows: In a social network, we observe at the current time a set of decision makers who have provided their preferences over a set of alternatives. The objective is to predict the top K persuaders (i.e., K individuals who will lead to the greatest degree of preference adjustment among other decision makers in the network in a future period) and to investigate how top persuaders assist other individuals in SNGDM to reach consensus.
To solve these problems, we need to address two key challenges. First, for each ordered pair of individuals ( v k , v l ) , we need to estimate the probability that v l can persuade v k to adjust their preferences (i.e., persuasion probability). Then, top persuaders are identified based on the estimated persuasion probabilities. Second, we need to propose a new feedback mechanism based on top persuaders to facilitate consensus reaching. As shown in Figure 3, a resolution framework is proposed to address each of these challenges. In the framework, there are two critical steps:
(1) Establishing the social persuasion model.
According to social network theories, we first construct a model to quantify social persuasion, which can arise from multiple distinct forces including social influence and social status [31,32]. Social influence can be evaluated using centrality metrics (e.g., in-degree centrality) and the influence propagation through trust relationships. Social status, on the other hand, can be measured by the degree of alignment between an individual’s preference and the collective preference of the group. Once the social persuasion model is established, the next step is to identify the top persuaders in the social network—those individuals with the strongest social persuasive power.
(2) Implementing the consensus-reaching process with top persuaders.
If the predefined consensus is not achieved, feedback adjustments with top persuaders are adopted to enhance the consensus degree, which includes two key components: (1) Providing suggestions for top persuaders to modify their preferences and applying opinion dynamics for other individuals based on the social persuasion model. (2) Improving trust relationships between top persuaders and other individuals to help the latter better adjust their preferences and achieve consensus.
To further illustrate the resolution framework, Section 3.2 will discuss how to establish the social persuasion model, and Section 3.3 will show details of the CRP with top persuaders. To improve readability, the main symbols used in this study are listed in Table 1.

3.2. Social Persuasion Model

This section introduces the generation of the social persuasion model and the identification of top persuaders, as depicted in Figure 3.
Step 1: Quantifying social influence using centrality measures
Network centrality measures are essential tools for quantifying social influence, as entities with higher centrality scores generally interact with a greater number of entities and exert more substantial influence within the network. Besides in-degree centrality C i n v k defined in Definition 5, there are several other centrality measures that capture the multi-dimensional nature of social influence from different perspectives. Lü et al. [27] compare well-known centrality measures and show that the impact of these measures can differ significantly depending on the network type and research objectives. In this study, we conduct a systematic analysis of the effectiveness of various centrality measures, which is detailed in the comparative analysis presented in Section 4.2. To ensure consistency and comparability across different centrality measures, we normalize each centrality score C v k by dividing it by the sum of all centrality scores in the network, as shown in Equation (10). This normalization ensures that the total centrality score across all nodes equals 1, allowing for a comprehensive and unbiased comparison of their influence on the identification of top persuaders and the consensus-reaching process.
C n o r m   v k = C v k / l = 1 m C v l
Step 2: Modeling social influence propagation
Prior studies of SNGDM typically focus on the immediate social influence that individuals have on their first-order neighbors. However, in real-world scenarios, social influence extends beyond direct connections and propagates through a chain of trust relationships. For example, as shown in Figure 2, while there is no direct trust relationship between v 1 and v 5 , the influence between them (denoted as s 15 ) can be mediated through v 3 . This indirect influence cannot be captured by first-order effects alone. Inspired by Fang et al. [33], we introduce an attenuation factor θ [ 0 , 1 ] to model this phenomenon. The factor θ d k l 1 reflects how the influence s k l attenuates as the path distance d k l from v k to v l increases. This approach provides a more accurate representation of how social influence propagates through a chain of trust relationships.
Definition 6.
Let   S I = s k l m × m  be the social influence matrix of   G ( V , E ) , where   s k l [ 0 , 1 ]  measures the strength of social influence that   v l  assigns to   v k , which is defined as
s k l = C v l × θ d k l 1
Example 2.
In Figure 2, there are two paths from   v 1  to   v 5  and both can propagate social influence from   v 5  to   v 1 . According to Definition 4, the shortest path is chosen because it propagates social influence more efficiently. Thus, if   θ = 0.8  and in-degree centrality is chosen, the value of social influence from   v 5  to   v 1  is calculated as   s 15 = C i n v 5 × θ d 15 1 = 0.133 .
Step 3: Quantifying social status
While existing methods focus on social influence, social status also plays a crucial role in social persuasion [31,32]. In reality, an individual’s social status affects their ability to shape others’ attitudes and behaviors. Higher social status usually reflects greater authority within the social network, enabling these individuals to more easily persuade others to adopt their opinions and decisions. In the SNGDM problem, the social status of individual v k , denoted as r k , can be measured by how closely their preferences P k align with the collective preference P c . Individuals whose preferences closely match the collective preference P c typically have a greater influence on the decision-making process because they are assigned more weight. Conversely, individuals who deviate significantly from the collective preference P c are assigned smaller weights and have a smaller contribution to the consensus.
Definition 7.
Let   S T = r 1 , r 2 , , r m  be the social status of all individuals, where   r k [ 0 , 1 ]  measures the similarity between individual preferences   P k  and the collective preference   P c , i.e., the consensus degree   C D v k  of individual   v k . The normalized social status   r k  is calculated as follows,
r k = C D v k / l = 1 m C D v l
Step 4: Combining social influence and social status.
Definition 8.
A mapping   U : 0 , 1 × 0 , 1 [ 0 , 1 ]  satisfying monotonicity, associativity, and commutativity is called the Uninorm operator. There is a neutral element   g [ 0 , 1 ]  that makes   U x , g = x  for   x 0 , 1 . For   x , y [ 0 , 1 ] ,   U  is defined as follows:
U ( x , y ) = x y / g   if   0 x , y g ( x + y x y g ) / ( 1 g )   if   g x , y 1 ( x + y ) / 2   else  
In this study, we propose that social persuasion is determined by two main components: social influence and social status, which can be combined mathematically using the Uninorm operator [55]. The strength of social persuasion that v l assigns to v k , denoted as s p k l , is calculated as
s p k l = U ( s k l , r l )
Depending on the values of s k l and r l , the Uninorm operator can exhibit three behaviors: reinforcement, weakening, and averaging. As illustrated in Figure 4, if a decision maker has both high social influence and social status, i.e., s k l , r l [ g , 1 ] , the Uninorm operator will reinforce their social persuasion. Conversely, if a decision maker lacks both social influence and social status, i.e., s k l , r l [ 0 , g ] , their social persuasion will be weakened. In other cases, the social persuasion will be an average of their social influence and social status.
Example 3.
Seven individuals   V = { v 1 , v 2 , v 3 , v 4 , v 5 , v 6 , v 7 }  in Figure 5 are supposed to evaluate three alternatives  X = { x 1 ,   x 2 ,   x 3 } , which are given as follows,
P 1 = 0.5 0.3 0.9 0.7 0.5 0.4 0.1 0.6 0.5   P 2 = 0.5 0.6 0.9 0.4 0.5 0.8 0.1 0.2 0.5   P 3 = 0.5 0.5 0.4 0.5 0.5 0.7 0.6 0.3 0.5   P 4 = 0.5 0.9 0.5 0.1 0.5 0.6 0.5 0.4 0.5 P 5 = 0.5 0.7 0.5 0.3 0.5 0.7 0.5 0.3 0.5   P 6 = 0.5 0.3 0.6 0.7 0.5 0.4 0.4 0.6 0.5   P 7 = 0.5 0.2 0.2 0.8 0.5 0.8 0.8 0.2 0.5 .
According to Equations (6), (10), and (11), the social influence matrix S I = s k l m × m can be obtained. Specifically, based on Equations (6) and (10), the normalized in-degree centrality score of v 5 is C i n v 5 = 0.3 . Then, we set θ   = 0.8, and the social influence propagation from v 5 to v 1 is computed as s 15 = C i n v 5 × θ d 15 1 = 0.3 × 0.8 2 1 = 0.24 .
According to Equations (1), (2), and (12), the social status of all individuals S T = r 1 , r 2 , , r m can be obtained. Specifically, based on Equation (1), we assume all individuals have the same weight π k = 1 / m , and the collective preference is obtained as
P c = 0.5 0.5 0.571 0.5 0.5 0.629 0.429 0.371 0.5 .
Then, based on Equations (2) and (12), the social status scores of all individuals are
R = [ 0.13 , 0.139 , 0.16 , 0.145 , 0.154 , 0.147 , 0.125 ]
Step 5: Identifying top persuaders
Each individual’s social persuasion is obtained using the Uninorm operator based on social influence and social status. We set g = 1 / m = 0.143 . According to Equations (13) and (14), we combine social influence s 15 = 0.24 and social status r 5 = 0.154 to obtain the social persuasion from v 5 to v 1 , which is calculated as follows,
s p 15 = U ( 0.24 , 0.154 ) = 0.25
Similarly, the total social persuasion matrix is obtained as follows,
S P = 0.097 0.12 0.302 0.25 0.074 0 0.058 0.13 0.242 0.309 0.074 0 0.073 0.062 0.302 0.309 0.074 0 0.091 0.078 0.112 0.309 0.074 0 0.073 0.062 0.105 0.302 0.074 0 0 0 0.08 0.072 0.077 0.088 0 0 0.08 0.072 0.077 0.074
Once the social persuasion matrix is obtained, we can further quantify the overall persuasion scores for each individual. In the social persuasion matrix, each element s p k l represents the persuasive power of individual v l over v k . To calculate the total persuasive power of v l , we sum s p k l over all other individuals, i.e.,
S P l = k = 1 , k l m   s p k l
Clearly, a higher S P l indicates a stronger persuasive power. By ranking these scores, we can identify individuals with the highest persuasive power among decision makers, known as the top persuaders. For example, if we set K = 2 , then individual v 4 ( S P 4 = 1.292 ) and v 5 ( S P 5 = 1.331 ) will be selected as the top persuaders in the social network.
S P 1 = 0.295 , S P 2 = 0.3 , S P 3 = 0.627 , S P 4 = 1.292 , S P 5 = 1.331 , S P 6 = 0.442 , S P 7 = 0.088

3.3. Consensus-Reaching Process with Top Persuaders

In this subsection, we present a novel CRP utilizing top persuaders (TPs) in SNGDM, which involves three main phases: consensus measure, TP-based preference adjustment, and TP-based trust relationships improvement. Among these phases, the consensus measure follows the same approach in traditional GDM, as defined by Equations (1)–(3). The TP-based preference adjustment focuses on guiding TPs to modify their preferences to increase consensus. Additionally, non-TP individuals are encouraged to adjust their preferences based on the opinion dynamics model. In the TP-based trust relationships improvement, we identify resistant persuadees—those unwilling to change their preferences—and aim to manage their trust relationships with TPs to facilitate consensus.

3.3.1. TP-Based Preference Adjustment

If the consensus degree does not meet the predefined threshold, preference adjustment is implemented to help individuals achieve consensus. According to Equation (19), individuals are ranked by their persuasive scores and let T P be the set of top K persuaders in the social network. These top persuaders are then divided into two sets: T P A , those with acceptable consensus degrees, and T P U , those with unacceptable consensus degrees, as defined by the following:
T P A = v k v k T P   and   CD v k μ }
T P U = v k v k T P   and   CD v k < μ }
Compared with the traditional CRP, this study emphasizes adjusting the preferences of TPs, particularly those in T P U , to enhance consensus. For v k T P U , it is suggested to guide their preferences p i j k ¯ to align more closely with the collective preference p i j c , i.e.,
p i j k _ _ _ _ m i n p i j k , p i j c , m a x p i j k , p i j c
On the other hand, a large number of non-TP individuals play a crucial role in enhancing the overall consensus. Inspired by the opinion dynamics model discussed in Section 2.3, we introduce a new social network DeGroot model with top persuaders (i.e., TP-based SNDG) as a feedback mechanism to help non-TP individuals achieve consensus. Specifically, we propose that individuals are more likely to adjust their preferences based on those with higher social persuasion rather than just those they directly trust. For example, in Figure 5, individual v 1 directly trusts v 2 and v 4 . However, according to the social persuasion matrix in Equation (18), v 5 has higher persuasive power than v 2 . Thus, when adjusting preferences, v 1 will be more inclined to follow preferences of v 4 and v 5 rather than v 2 and v 4 . In the TP-based SNDG, individuals will adjust their preferences based on social persuasion, as shown in Figure 6, rather than on direct trust relationships as in Figure 5. For individual v k , the number of perceived social persuasion adjustments equals their trust relationships (i.e., the out-degree of v k ). Consequently, the restricted social persuasion weights are updated as follows,
S P = 0.302 0.25 0.242 0.309 0.302 0.309 0.112 0.309 0.302 0.088
In the TP-based SNDG, we assume each individual v k assigns a self-confidence degree β k [ 0 ,   1 ] to their own preference and distributes the remaining weight ( 1 β k ) across other individuals. Let ω k l   ( k ,   l = 1 ,   ,   m ; k l ) be the weight individual v l assigns to v k in opinion dynamics, which is calculated as
ω k l = 1 β k s p k l q = 1 , q k m   s p k q
The preference adjustment of individual v k based on TP-based SNDG is obtained as
p i j k _ _ _ _ = β k p i j k + l = 1 , l k m   ω k l p i j l
For Example 3, let the self-confidence degrees β k = 0.65 ( k = 1,2 , 3,4 , 5 ) . Based on Equations (24) and (25), W can be written as
W = 0.65 0.191 0.159 0.65 0.154 0.196 0.65 0.173 0.177 0.093 0.65 0.257 0.35 0.65 0.65 0.35 1
During the preference adjustment, individual v 1 will keep his/her own preference and be influenced by v 4 and v 5 , which can be calculated as
p 12 1 _ _ _ _ = β 1 p 12 1 + ω 14 p 12 4 + ω 15 p 12 5 = 0.65 × 0.3 + 0.191 × 0.9 + 0.159 × 0.7 = 0.478

3.3.2. TP-Based Trust Relationships Improvement

In this study, resistant persuadees (RPs) are individuals who stick to their initial preferences and resist to adjustments suggested by top persuaders (TPs). The existence of RPs hinders achieving a higher consensus level, as they are unwilling to align their preferences with the collective decision. Trust relationships play a crucial role in SNGDM, influencing individuals’ willingness to accept others’ preferences. To address this, the TP-based trust relationship improvement method is proposed to establish new trust relationships from RPs to TPs.
In the social persuasion matrix such as Equation (18), each element s p i j represents the persuasive strength individual v k receives from v l . If individual v k shows low acceptance of v l ’s persuasion, it suggests that v k is more resistant to being persuaded by v l , resulting in a smaller s p w l value. The resistance degree of individual v k , denoted as R P k , is defined as
R P k = 1 / l = 1 , l k m   s p k l
According to Equation (29), individuals can be ranked based on their resistance scores, and let R P be the K resistant persuadees with the highest scores in the social network. For example, as shown in Equation (30), if we set K = 2 , individual v 6 ( R P 6 = 3.157 ) and v 7 ( R P 7 = 3.301 ) will be identified to be RPs.
R P 1 = 1.19 , R P 2 = 1.23 , R P 3 = 1.22 , R P 4 = 1.51 , R P 5 = 1.62 , R P 6 = 3.16 , R P 7 = 3.3 .
Let R P U be the set of RPs with unacceptable consensus degrees, i.e.,
R P U = v k v k R P   and   CD v k < μ }
Next, TP-based trust relationships improvement is used to identify potential trust relationships between RPs and TPs that can promote the group to reach a consensus. Specifically, the RPs in R P U are encouraged to trust TPs in T P A . These potential trust relationships can be defined as follows,
H = v k , v l v k R P U , v l T P A , v k , v l E
Moreover, social persuasion s p k l is used to recommend the new edges that are easier to establish. Generally, individuals are more likely to accept TPs with higher social persuasive power. For each v k R P U , the TP with highest social persuasion s p k l will be recommended, which can be described as
v k , v l v k R P U , v l v z | s p k z = m a x y   s p k y v k , v y H

4. Simulation and Comparison Analysis

This section explores the role of top persuaders in facilitating consensus reaching in SNGDM through simulation experiments and comparative analysis. We abbreviate our proposed CRP with top persuaders as TPC, the CRP with social information as SIC, and the CRP with trust relationships as TRC [2]. Following the social persuasion model, TP-based preference adjustment, and TP-based trust relationships improvement in Section 3, the TPC model is formally presented in Algorithm 1. The simulation experiments I–IV are developed based on Algorithm 1.
Algorithm 1 General description of TPC model.
Input:The individual preferences { P 1 , P 2 , . . . , P m } , the graph of trust relationships G ( V , E ) , the weights of individuals { π 1 , π 2 , . . . , π m } , the established maximum round T , and the consensus threshold μ .
Output:The ranking of alternatives X = x 1 , x 2 , , x n .
Step 1:Let t = 0 , P k , t = ( p i j k , t ) n × n , and G t V , E t = G ( V , E ) .
Step 2:Aggregate the preferences { P 1 , t , P 2 , t , . . . , P m , t } to obtain P c , t = p i j c , t n × n in round t based on Equation (1), i.e., p i j c , t = k = 1 m   π k p i j k , t .
Step 3:Based on Equations (2) and (3), we compute the individual consensus degrees C D t v k = 1 i = 1 n 1   j = i + 1 n   p i j k , t p i j c , t n ( n 1 ) / 2 and group consensus degree C D t = k = 1 m   π k C D t v k . If C D t μ or t T , go to Step 7; otherwise go to the next step.
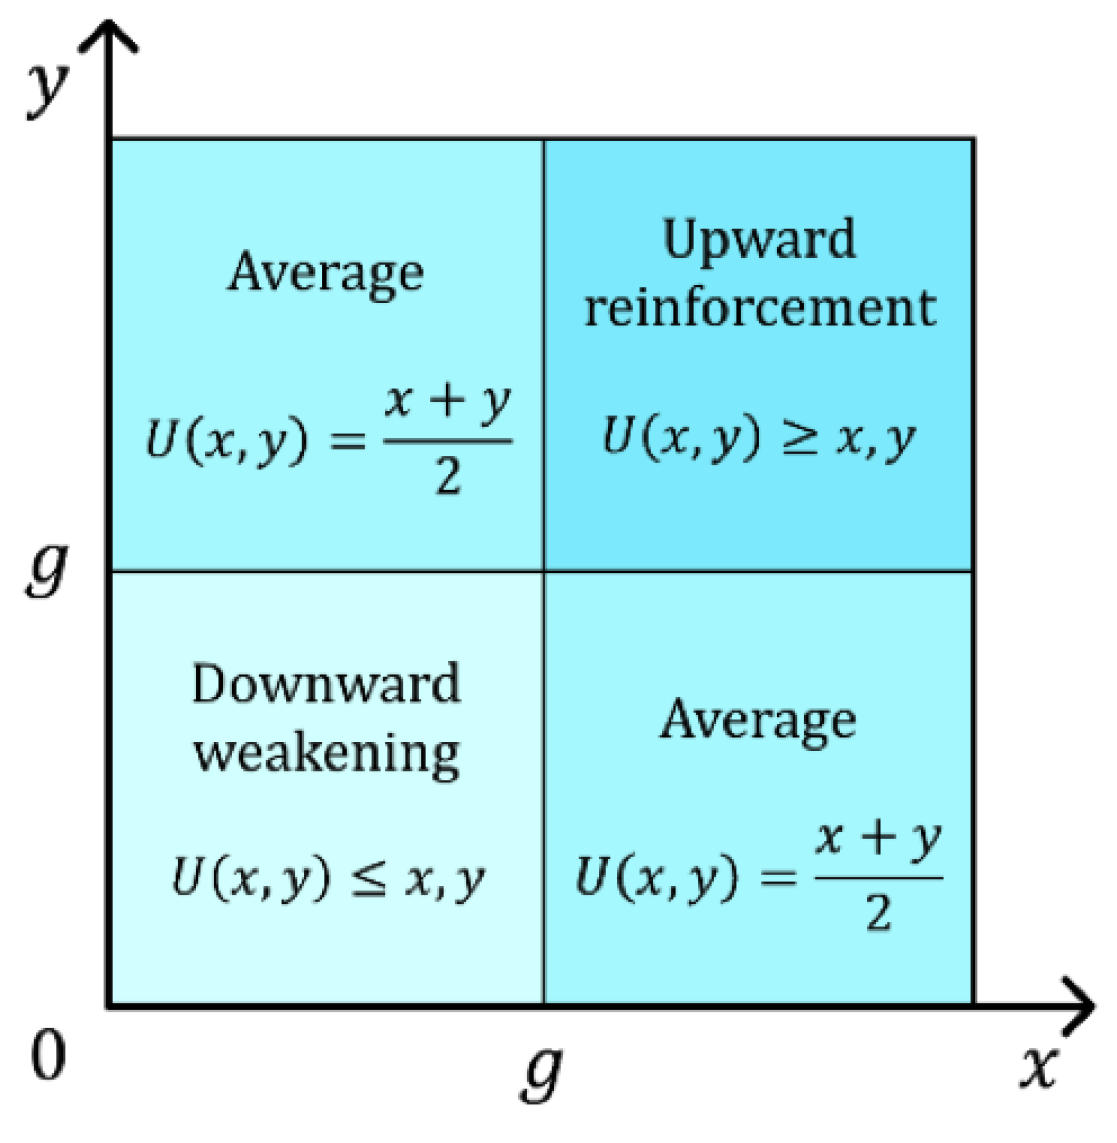
Step 4:(a) Obtain the social influence matrix S I t = s k l t m × m in round t based on Equation (11), i.e., s k l t = C t v l × γ d k l t 1 , where C t v l represents network centrality and d k l t represents the distance between v k and v l .
(b) Obtain the social status S T t = r 1 t , r 2 t , , r m t in round t based on Equation (12), i.e., r k t = C D t v k / l = 1 m C D t v l .
(c) Obtain the social persuasion matrix S P t = s p k l t m × m in round t based on Equation (14), i.e., s p k l t = U ( s k l t , r l t ) , where U ( x , y ) represents a Uninorm operator such as Equation (13).
Step 5:(a) Identify the top persuaders T P t and resistant persuadees R P t in round t based on Equations (19) and (29), i.e., S P l t = k = 1 , k l m   s p k l t and R P k t = 1 / l = 1 , l k m   s p k l t . Further, we classify T P t and R P t into different groups:
T P A , t = v k v k T P t   and   C D t d k μ }
T P U , t = v k v k T P t   and   C D t d k < μ }
R P U , t = v k v k R P t   and   C D t d k < μ }
(b) TP-based preference adjustment. For v k T P U , t , it is suggested to adjust their preferences as p i j k , t + 1 m i n p i j k , t , p i j c , t , m a x p i j k , t , p i j c , t , i j and p i j k , t + 1 = 1 p j i k , t + 1 , j > i . For non-TP individuals, TP-based SNDG is proposed to adjust their preferences based on Equation (26).
(c) TP-based trust relationships improvement. Identify the potential trust relationships H t = v k , v l v k R P U , t , v l T P A , t , v k , v l E t and recommend each v k R P U , t to trust v l T P A , t from v k , v l v k R P U , t , v l v z | s p k z t = m a x y   s p k y t v k , v y H t .
Step 6:Update trust relationships G t + 1 V , E t + 1 and let t = t + 1 , then go to Step 2.
Step 7:Let Q i = j = 1 n   p i j c , t / n . Then, rank alternatives X = x 1 , x 2 , , x n based on dominance degree Q i .

4.1. The Design of Simulation Experiments

In simulation experiment I (the TPC model), we randomly generate individual preferences, self-confidence degrees, and trust relationships among them. TP-based preference adjustment and TP-based trust relationships improvement are employed to help the group reach a consensus. Supplementary details for simulation experiment I are as follows.
(1) Generation of trust relationships.
Trust relationships are generated using Erdos–Rényi (ER) random graphs [56], where parameter b represents the probability of an edge generating between two individuals in the graph. This approach ensures a random distribution of trust relationships among individuals, reflecting a variety of potential real-world social network structures.
(2) TP-based preference adjustment.
For v k T P A , t , no preference adjustment is necessary. For v k T P U , t , they accept the group suggestion with probability ρ in each round. If v k accepts the group suggestion, their preferences will be influenced both by the group suggestion and by the social persuasion form others. Let ω ¯ k l ( k , l = 1 , 2 , , m ; k l ) be the weight v k assigns to v l based on Equation (25), and let ω ¯ k ( m + 1 ) be the weight v k assigns to the group suggestion P c , t , ensuring that ω ¯ k ( m + 1 ) + l = 1 , l k m   ω ¯ k l = 1 β k . Thus, the preference adjustment for v k is defined as follows,
p i j k , t + 1 = β k p i j k , t + l = 1 , l k m ω ¯ k l p i j l , t + ω ¯ k ( m + 1 ) p i j c , t , i j p i j k , t + 1 = 1 p j i k , t + 1 , i < j .
For other individuals ( v k T P U , t who do not accept the group suggestion and non-TP individuals), their preferences will be influenced only by the social persuasion from others. Let ω k l be the weight v k assigns to v l based on Equation (25), such that l = 1 , l k m   ω k l = 1 β k   ( k , l = 1 ,   2 ,   ,   m ) . The preference adjustment for these individuals is defined as follows,
p i j k , t + 1 = β k p i j k , t + l = 1 , l k m   ω k l p i j l , t , i j p i j k , t + 1 = 1 p j i k , t + 1 , i < j .
(3) TP-based trust relationships improvement.
For v k R P U , t , they accept trust relationship recommendations with probability η in each round. If v k agrees to trust v l T P A , t , we set a k l = 1 .

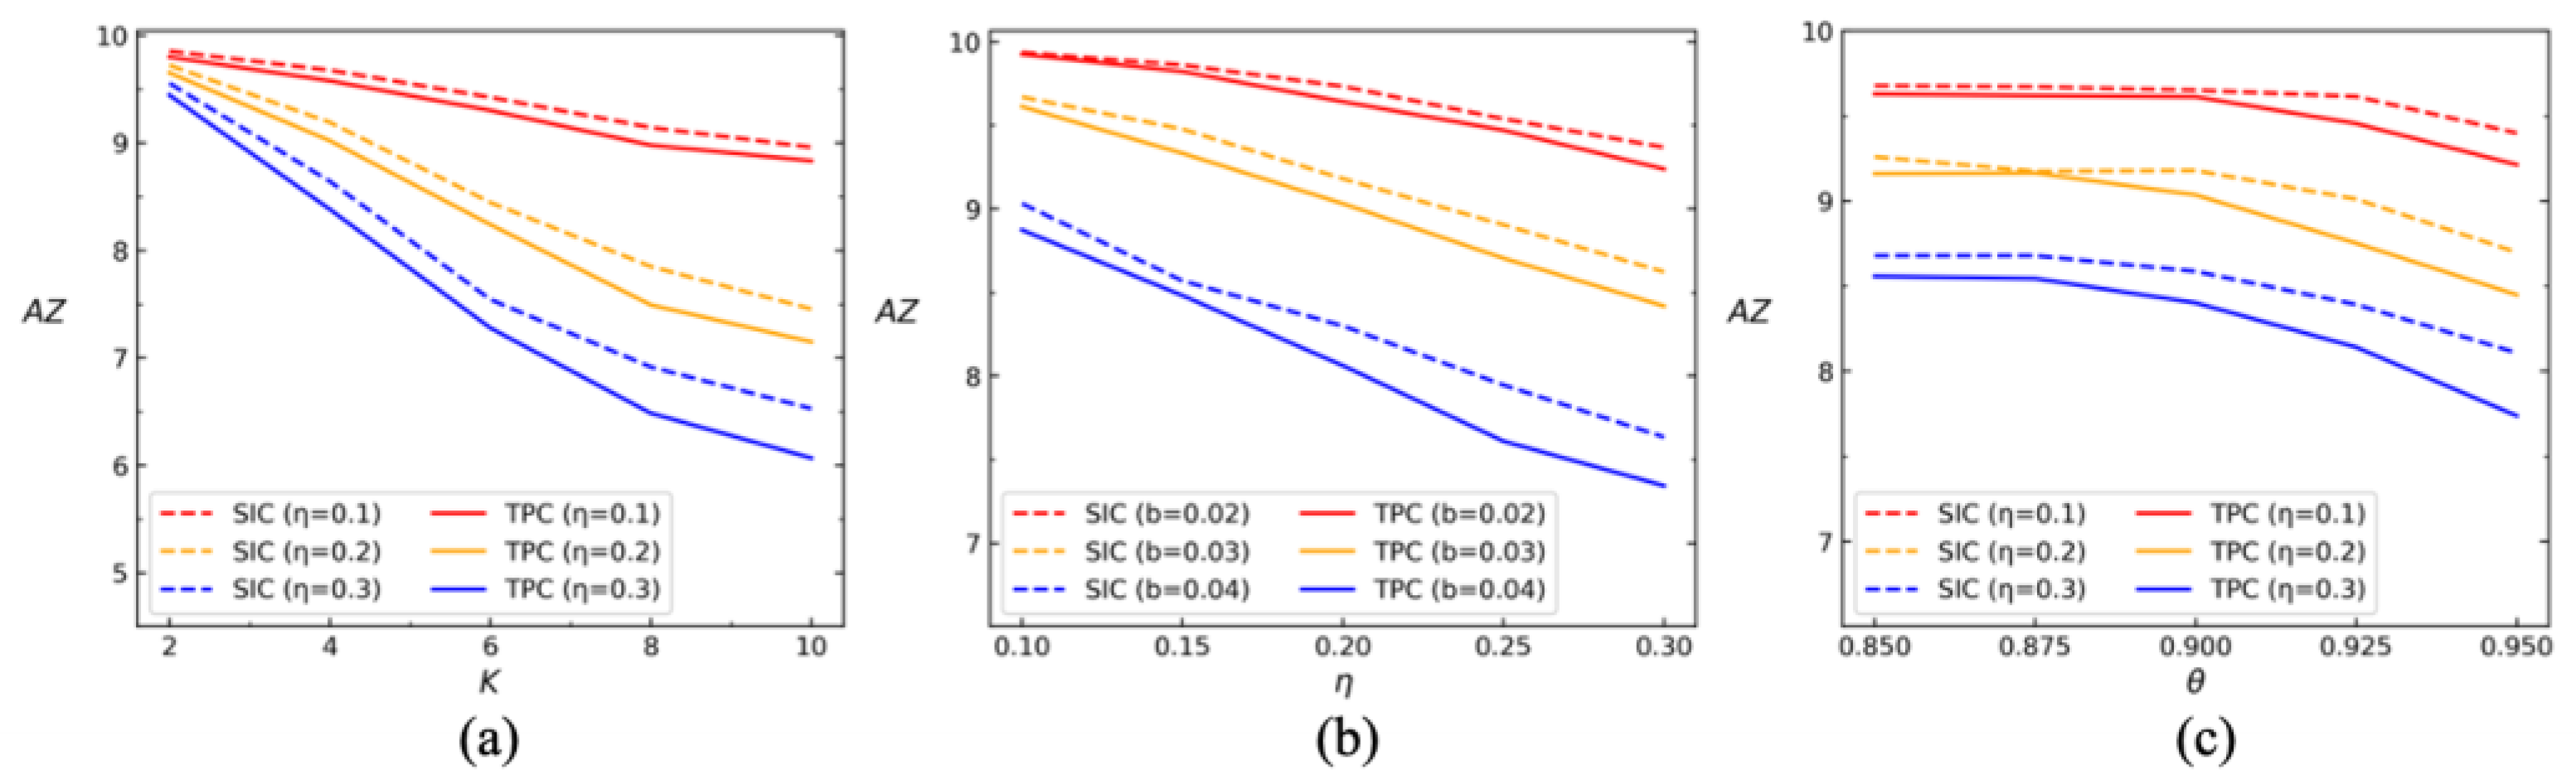
4.2. Comparison Analysis

In the proposed consensus framework TPC, we integrate social influence and social status to describe the social persuasion among individuals. Previous studies have primarily focused on trust relationships or social influence alone. To demonstrate the effectiveness of TPC in promoting consensus, we compare it with SIC and TRC through simulation experiment I-III (Appendix A). In simulation experiment II (the SIC model), we consider social influence (without social status), which means that individuals are influenced by those with higher social influence in the social network. In simulation experiment III (the TRC model), we consider the effect of trust relationships and suppose that individuals are solely influenced by their direct neighbors [2].
For the first comparison, we conduct simulation experiment I-III with n = 4 , T = 10 , K = 8 , μ = 0.85 , θ = 0.9 , and b = 0.03 . Specifically, in-degree centrality is chosen. Then, we set different values for m , ρ , and η , and run 1000 times to obtain the average values for C D t in each round t . An efficient CRP should show a rapid improvement in group consensus degree C D t . The results are presented in Figure 7.
For the second comparison, we further compare the effectiveness of social persuasion (TPC) and social influence (SIC). We conduct simulation experiment I and II with m = 20 , n = 4 , T = 10 , μ = 0.85 , θ = 0.9 , b = 0.03 , ρ = 0.2 , and η = 0.1 . Then, we set different centrality measures and vary the number of top persuaders K from 2 (10% of individuals) to 10 (50% of individuals). Each experiment is run 1000 times to obtain the average iteration number A Z required to achieve consensus. The results are presented in Table 2.
For the third comparison, we conduct simulation experiment I and II with m = 20 , n = 4 , T = 10 , μ = 0.85 , θ = 0.9 , b = 0.03 , ρ = 0.2 , and centrality measure be in-degree. We set different parameters K and η and run 1000 times to obtain values of AZ. The results are described in Figure 8a.
For the fourth comparison, we conduct simulation experiment I and II with m = 20 , n = 4 , T = 10 , K = 4 , μ = 0.85 , θ = 0.9 , ρ = 0.2 , and centrality measure be in-degree. We set different parameters η and b and run 1000 times to obtain values of AZ. The results are described in Figure 8b.
For the fifth comparison analysis, we conduct simulation experiment I and II with m = 20 , n = 4 , T = 10 , K = 4 , μ = 0.85 , b = 0.03 , ρ = 0.2 , and centrality measure be in-degree. We set different parameters θ and η and run 1000 times to obtain values of AZ. The results are described in Figure 8c.
From Figure 7 and Figure 8, and Table 2, we can obtain the following observations.
(1) Our proposed consensus framework TPC demonstrates significant efficiency in facilitating consensus under various parameters. Compared to SIC and TRC, TPC achieves consensus more quickly. SIC outperforms TRC by incorporating the effect of social influence. Similarly, TPC outperforms SIC by incorporating the effect of social status. These results highlight the importance of both social influence and social status in the consensus reaching process.
(2) As shown in Table 2, TPC consistently outperforms SIC across all centrality measures. This validates that integrating social persuasion, which integrates both social influence and social status, is more effective than considering social influence alone.
(3) As the number of top persuaders K increases, the average number of iterations to reach consensus A Z significantly decreases. This underscores the crucial role of top persuaders in facilitating group consensus, indicating that a higher number of top persuaders accelerates the consensus process.
(4) As the probability of adding edges η increases, the average C D t values increase (Figure 7) and A Z decreases (Figure 8). This suggests that enhancing trust relationships with top persuaders can significantly accelerate the consensus-reaching process.
(5) When the attenuation factor θ is greater than 0.9, A Z significantly decreases. However, when θ is below 0.9, A Z does not show significant change. This means that a too-low attenuation factor (severe attenuation) hinders the propagation of social influence through trust relationships, particularly diminishing the influence from higher-order neighbors.

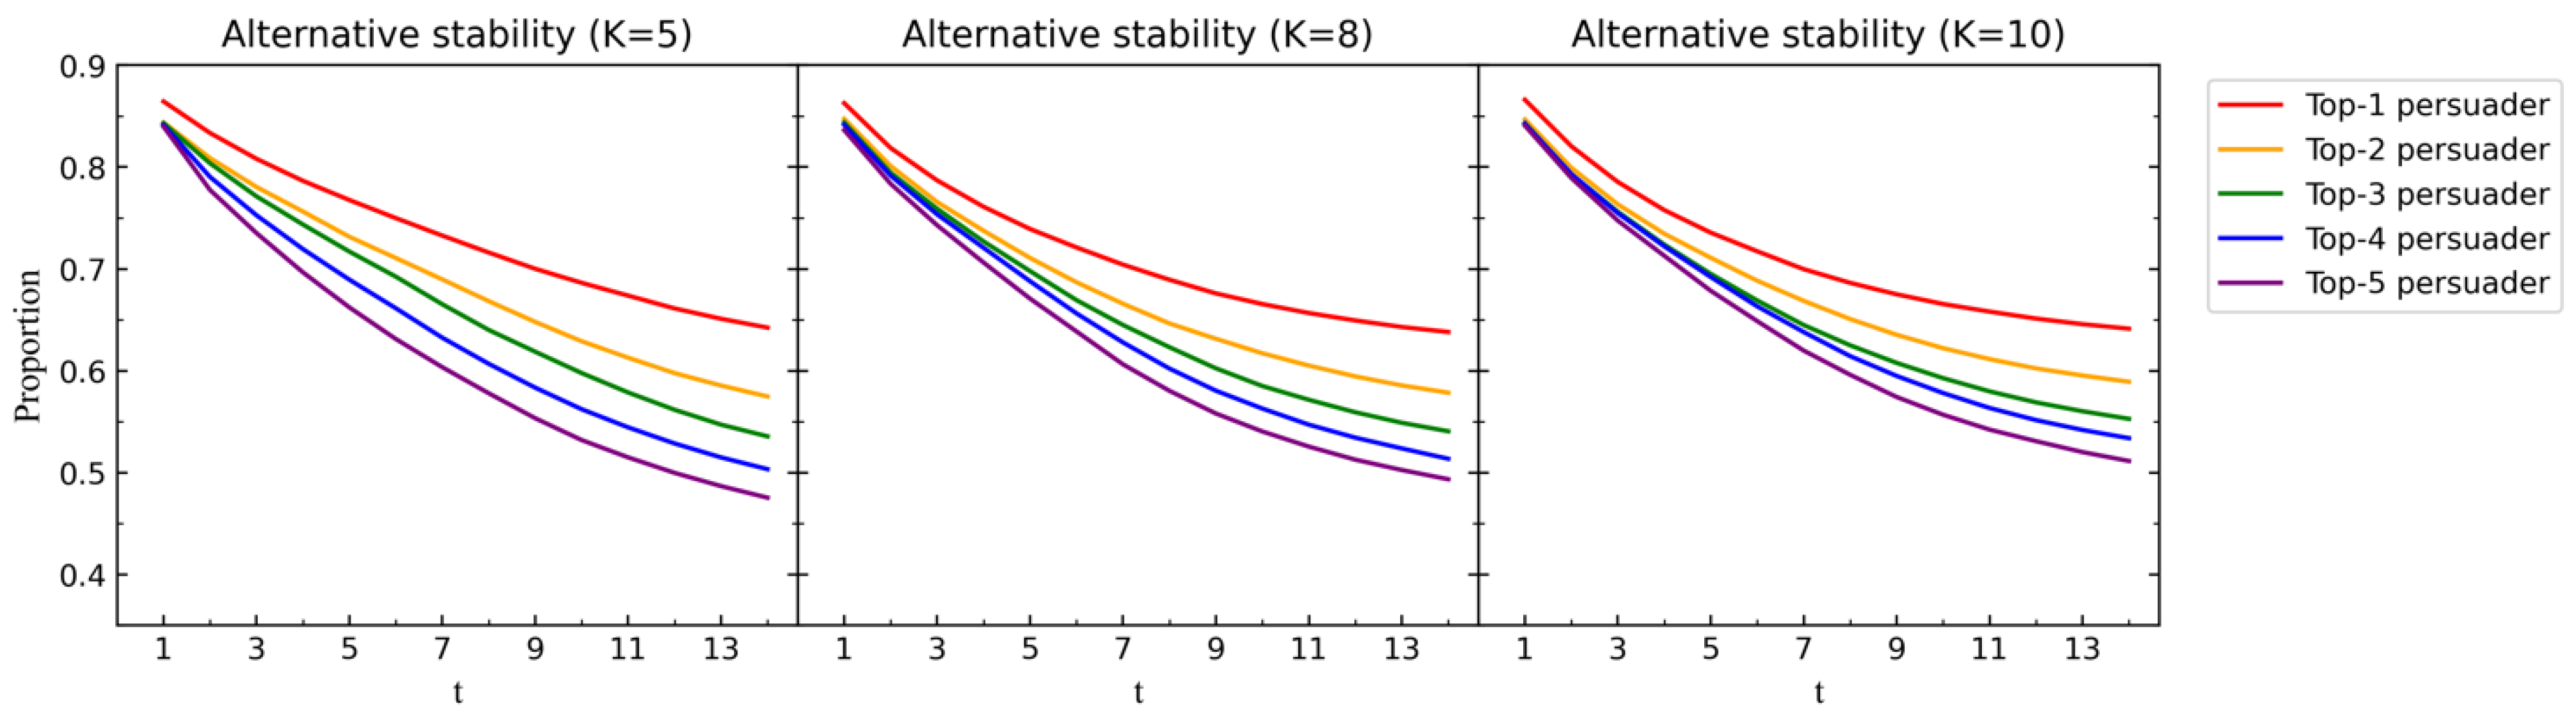
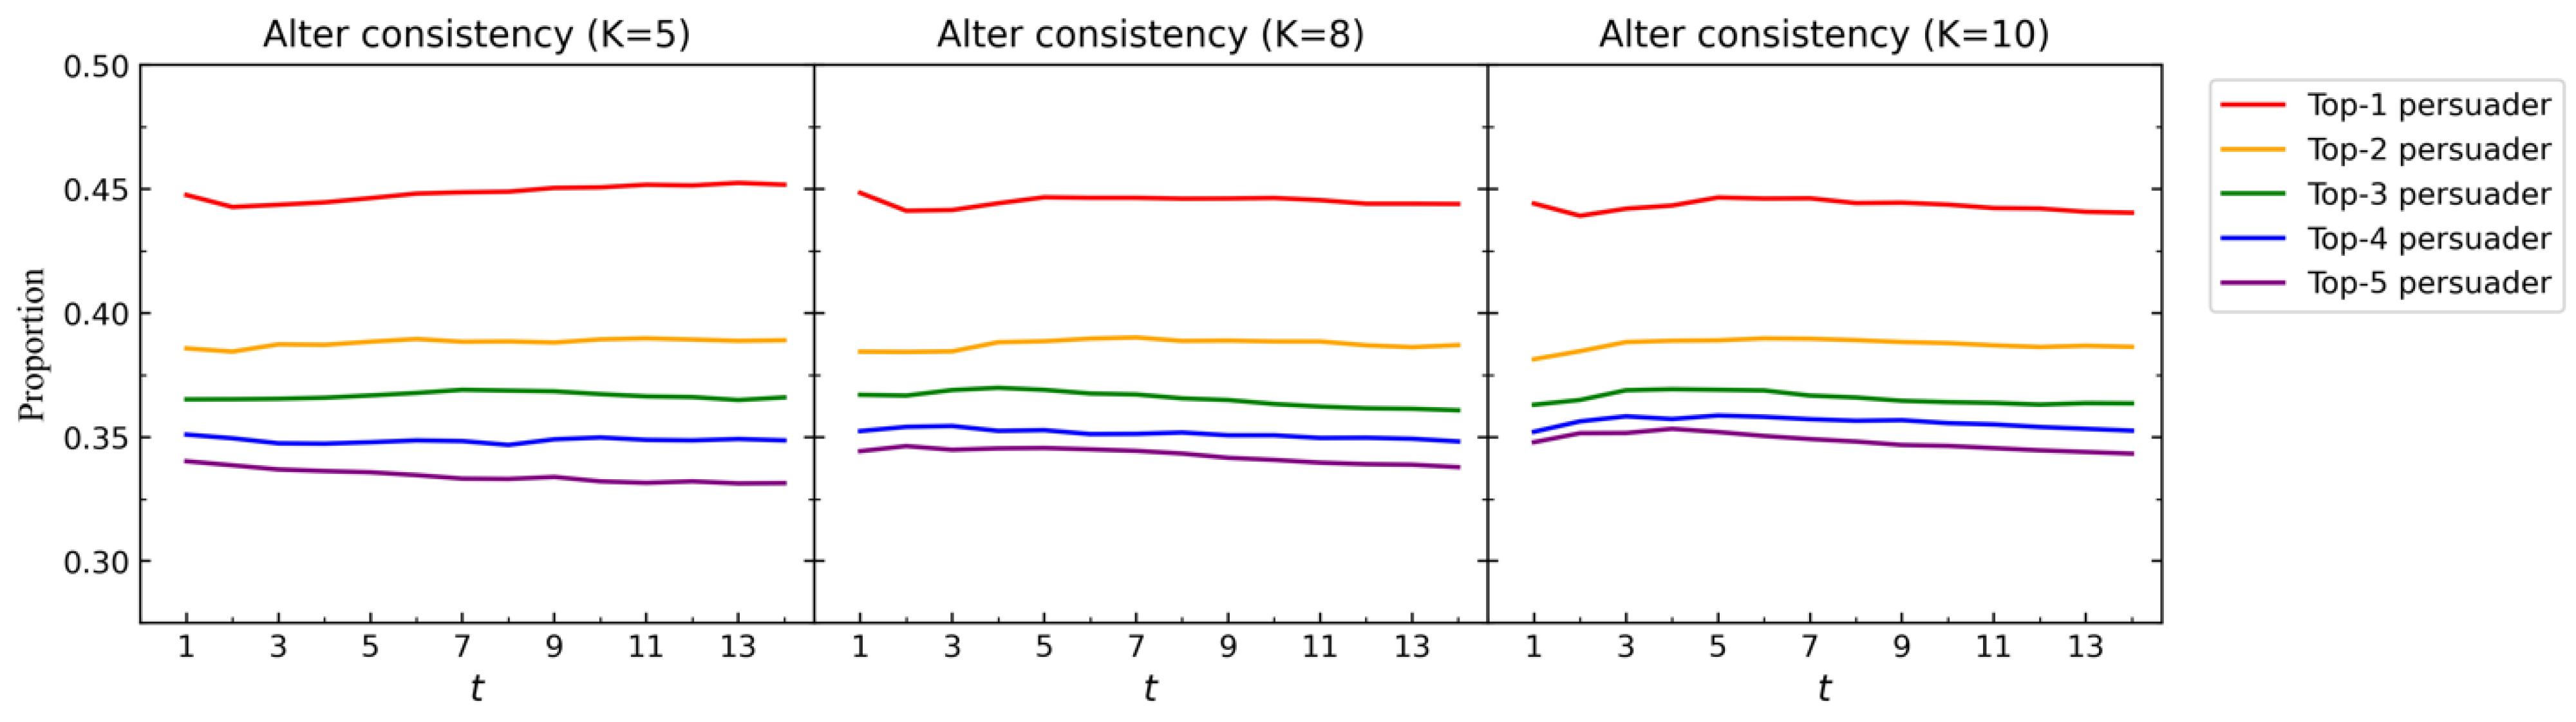
4.3. The Effect of Top Persuaders on Consensus Reaching

In Section 4.2, we observe the significant effect of social persuasion in promoting the consensus-reaching process. However, the specific role of top persuaders remains unclear. This section focuses on the initial top persuaders identified in the first round, denoted as T P * . Specifically, we propose three indicators to examine their performance throughout the consensus-reaching process.
First, we examine whether each v k T P * remains a top persuader in subsequent CRP rounds. This analysis helps determine if these initial TPs consistently influence the decision-making process. Specifically, we define T P R k , t to indicate v k ’s retention in T P t in round t , i.e., if v k T P t , then T P R k , t = 1 , otherwise T P R k , t = 0 . The results are presented in Figure 9.
Second, we examine whether each v k T P * maintains their initial preferences in the face of group suggestion and social persuasion from others. Let x ( 1 ) k , t be the best alternative of their current preference P k , t , and let x ( 1 ) k , 0 be the best alternative of their initial preference P k . 0 . We define A S k , t as the alternative stability of v k in round t , i.e., if x ( 1 ) k , t = x ( 1 ) k , 0 , then A S k , t = 1 , otherwise A S k , t = 0 . The results are presented in Figure 10.
Third, for each v k T P * , we examine whether their initial preferences align with the collective preference in subsequent CRP rounds. Let x ( 1 ) c , t be the best alternative of current collective preference P c , t . We define A C k , t as the alternative consistency of v k in round t , i.e., if x ( 1 ) c , t = x ( 1 ) k , 0 , then A C k , t = 1 , otherwise A C k , t = 0 . The results are presented in Figure 11.
We conduct simulation experiment IV (Appendix A) with m = 25 , n = 4 , T = 15 , θ = 0.85 , b = 0.03 , ρ = 0.2 , η = 0.3 , and in-degree centrality. Then, we set different values for K and run 10,000 times to obtain T P R k , t , A S k , t , and A C k , t in each round t . We particularly focus on the top 5 persuaders identified in the initial rounds of each experiment. From Figure 9, Figure 10 and Figure 11, we can obtain the following observations.
(1) The retention probability T P R of the top 1 persuader consistently remains the highest, maintaining a level of 80% throughout the entire process. This suggests a persistent influence of the top 1 persuader in the decision-making process. For persuaders ranked beyond the top 2, there is a notable downward trend in the first five rounds. This indicates that it becomes increasingly challenging for these persuaders to maintain their top positions over time.
(2) The alternative stability A S of the top 1 persuader gradually decreases over time but remains higher than other persuaders. This highlights the dominant stability of the top 1 persuader’s preferences throughout the decision-making process. For persuaders ranked beyond the top 2, they are more susceptible to external influence from group suggestion and social persuasion from others.
(3) The alternative consistency A C of the top 1 persuader is consistently the highest and remains stable around 0.45 throughout the entire process. In contrast, the A C for persuaders ranked from top 2 to top 5 is lower and exhibits a relatively stable pattern compared to the top 1 persuader. This suggests that the top 1 persuader has a greater influence on the collective preference and exhibits higher predictive ability.

5. Discussion

5.1. Theoretical and Practical Implications

This study contributes to the growing field of SNGDM by offering a novel perspective on top persuaders and their role in shaping consensus reaching. By integrating social influence with social status, the proposed model deepens the theoretical understanding of how social persuasion dynamically operates within social networks. Additionally, the incorporation of the “limited attention” phenomenon enriches the existing literature, emphasizing that decision makers selectively allocate cognitive resources across trust relationships rather than distributing them evenly. This perspective sheds new light on the evolution of trust relationships over time and lays the groundwork for future research on dynamic, feedback-driven CRPs.
From a practical standpoint, identifying and strategically utilizing TPs offers substantial benefits in a variety of real-world contexts. In corporate or governmental decision-making, guiding key influencers can accelerate consensus formation, reducing both the time and costs associated with large-scale negotiations. In social media marketing, identifying TPs enables highly targeted campaigns that effectively leverage opinion leaders to shape public sentiment. Furthermore, in emergency or crisis management, where swift and accurate consensus is critical, understanding which individuals wield disproportionate influence within a network becomes vital for timely and effective interventions.
However, beyond merely enhancing efficiency, it is essential to ensure the quality and reliability of the final decision by preventing the voices of non-TP members from being overshadowed by a few highly influential individuals. Although TPs can expedite the consensus reaching process, their disproportionate influence raises concerns about potentially suppressing diverse perspectives. Consequently, future research should explore mechanisms that balance the benefits of TPs with the need to preserve inclusiveness and decision quality.
The heightened risk of over-influence by TPs raises important questions about the ultimate quality of collective outcomes. If TPs dominate the decision-making process, the final consensus may reflect a narrower perspective, undermining the richness and diversity of group insights. To address this issue, future studies could incorporate safeguards such as minimum adjustment thresholds or multi-criteria consensus metrics, ensuring that minority opinions are adequately considered throughout the process. Another promising avenue is the development of adaptive reliability assessments, which dynamically adjust TPs’ weights based on the alignment and variability of group feedback. These mechanisms would prevent any single viewpoint from becoming overly dominant while maintaining the efficiency advantages provided by TPs.

5.2. Future Research Directions

Several limitations warrant further discussion. First, our framework relies on specific assumptions about the trust formation mechanism—particularly the integration of social influence and social status—which may oversimplify real-world dynamics in more complex network structures. Second, the simulations were conducted using synthetic datasets and controlled experimental settings. In large-scale, real-world social networks, user behavior is often more heterogeneous, and external noise factors, such as misinformation or evolving social contexts, may exert significant influence on the consensus process. Third, while our study focuses on top persuaders, it does not extensively address non-cooperative or adversarial behaviors, such as intentional opinion manipulation, which could hinder or disrupt consensus in certain scenarios.
Looking ahead, several promising research directions emerge. First, future work could incorporate dynamic and time-varying trust relationships to better capture the evolving nature of persuasion in rapidly changing social environments. Second, exploring the role of adversarial agents or malicious persuaders in shaping trust evolution would provide insights into developing robust defense mechanisms for consensus-based models. Third, employing more data-driven approaches—such as leveraging real-time user interactions, sentiment analysis, and machine learning techniques—could deepen our understanding of how top persuaders emerge and propagate their influence in diverse and large-scale networks. Furthermore, applying our proposed framework to specific real-world contexts (e.g., emergency decision-making, crowdsourcing innovation, or large-scale online policymaking) would offer concrete evidence of its scalability and practical utility, encouraging broader adoption in academic and applied domains.

6. Conclusions

In this study, we tackled the challenge of identifying and utilizing top persuaders (TPs)—individuals who wield disproportionately high influence on others—to enhance the efficiency and reduce the costs associated with consensus reaching. By leveraging social network theories, we integrated social influence (i.e., network centrality measures) with social status (i.e., alignment with the collective opinion) to develop a comprehensive social persuasion model. This model was subsequently incorporated into a novel CRP framework, providing fresh insights into trust degrees, feedback mechanisms, and trust relationship dynamics in SNGDM. Our simulations and comparative analyses show that (1) increasing the number of TPs substantially reduces the iterations required to achieve consensus; (2) establishing trust relationships between TPs and other individuals accelerates the consensus process; and (3) TPs retain a high and stable level of influence throughout the entire CRP rounds. By providing an integrated framework that captures individuals’ persuasive power, this study offers actionable insights for optimizing decision making processes in digitally connected environments.

Author Contributions

Conceptualization, formal analysis, software, visualization, writing—original draft preparation, B.P.; investigation, supervision, J.H.; resources, software, B.T.; writing—review and editing, investigation, Y.L.; conceptualization, project administration, S.L. All authors have read and agreed to the published version of the manuscript.

Funding

This research was funded by The Major Program of National Fund of Philosophy and Social Science of China (Grant No. 18ZDA088).

Data Availability Statement

All data generated or analyzed during this study are included in this published article.

Conflicts of Interest

The authors declare no conflicts of interest.

Appendix A. Simulation Experiments

Simulation Experiment I
Input: The number of individuals m , the number of alternatives n , the established maximum round T , the number of top persuaders K , the consensus threshold μ , and the parameters θ ,  b , ρ , and η .
Output: The consensus degree C D t and iteration number z .
Step 1: Generate initial data: (1) Generate a directed ER graph G ( V ,   E ) with probability b , and let A = a k l m × m be the adjacent matrix; (2) Generate individual preferences P k = ( p i j k ) n × n , where p i j k is uniformly and randomly from interval [ 0 ,   1 ] for i j , p i i k = 0.5 , and p i j k = 1 p j i k for i < j . Generate individual weights π k = 1 / m   ( k = 1,2 , , m ) ; (3) Generate self-confidence degree β k uniformly and randomly from interval [ 0 ,   1 ] .
Step 2: Let t = 0 , z = T , P k , t = P k , G t ( V , E t ) = G ( V , E ) , and A t = A .
Step 3: Compute P c , t = p i j c , t n × n same as step 2 in Algorithm 1.
Step 4: Compute C D t same as step 3 in Algorithm 1. If C D t μ and z = T , let z = t + 1 . If t = T , go to step 10; otherwise, go to the next step.
Step 5: First, compute social persuasion S P t = s p k l t m × m same as step 4(c) in Algorithm 1. Then, identify T P A , t , T P U , t , and R P U , t same as step 5(a) in Algorithm 1.
Step 6: (1) Let γ k l be the restricted social persuasion s p k l from v l to v k , such as in Equation (24); (2) Let   γ k ( m + 1 ) [ m i n l ( γ k l ) ,   m a x l ( γ k l ) ] be the weight v k assigns to the group suggestion. Then we can obtain ω ¯ k l = γ k l 1 β k / y = 1 , y k m + 1   γ k y and ω k l = γ k l 1 β k / y = 1 , y k m   γ k y .
Step 7: TP-based preference adjustment. Let v k T P U , t accept the group suggestion with probability ρ . If v k T P U , t and they accept the preference adjustment, compute the preference p i j k , t + 1 based on Equation (34). For other individuals ( v k T P U , t who do not accept the group suggestion and non-TP individuals), compute the preference p i j k , t + 1 based on Equation (35).
Step 8: TP-based trust relationships improvement. Let v k R P U , t accept the recommendation to trust another individual v l T P A , t with probability η . Once accepted, set a k l t = 1 .
Step 9: Update trust relationships G t + 1 D ,   E t + 1 and A t + 1 . Let t = t + 1 , then go to Step 3.
Step 10: Output C D t   ( t = 1,2 , , T ) and z.
Simulation experiment II
To analyze the effectiveness of SIC, we replace step 5 and 6 in simulation experiment I with step 5′ and 6′, which are presented below.
Step 5′: First, compute social influence matrix S I t = s k l t m × m same as step 4(a) in Algorithm 1. Then, identify the top persuaders T P t and resistant persuadees R P t in round t based on S P l t = k = 1 , k l m   s k l t and R P k t = 1 / l = 1 , l k m   s k l t .
Step 6′: (1) Let γ k l be the restricted social influence s k l from v l to v k , such as in Equation (24); (2) Let   γ k ( m + 1 ) [ m i n l ( γ k l ) ,   m a x l ( γ k l ) ] be the weight v k assigns to the group suggestion. Then, we can obtain ω ¯ k l = γ k l 1 β k / y = 1 , y k m + 1   γ k y and ω k l = γ k l 1 β k / y = 1 , y k m   γ k y .
Simulation experiment III
Input: The number of individuals m , the number of alternatives n , the established maximum round T , the consensus threshold μ , and the parameters b , ρ .
Output: The consensus degree C D t and iteration number z .
Step 1–4: Same as step 1–4 in Simulation experiment I.
Step 5: let γ k l be a trust value from v k to v l . If a k l = 0 , then set γ k l = 0 ; otherwise, generate γ k l uniformly and randomly from interval ( 0 ,   1 ] . Let γ k ( m + 1 ) ( 0 , 1 ] be the trust value v k assigns to the group suggestion. Then, we can obtain ω ¯ k l = γ k l 1 β k / y = 1 , y k m + 1   γ k y and ω k l = γ k l 1 β k / y = 1 , y k m   γ k y .
Step 6: All individuals accept the group suggestion with probability ρ . If they accept the preference adjustment, compute the preference p i j k , t + 1 based on Equation (34); otherwise, compute the preference p i j k , t + 1 based on Equation (35).
Step 7: Let t = t + 1 , then go to Step 3.
Step 8: Output C D t   ( t = 1,2 , , T ) and z.
Simulation experiment IV
To analyze the effect of top persuaders on consensus reaching, we replace step 4, 5 and 10 in simulation experiment I with step 4′, 5′ and 10′, which are presented below.
Output′: The retention probability T P R t , alternative stability A S t , and alternative consistency A C t .
Step 4′: If t = T , go to step 10; otherwise, go to the next step.
Step 5′: (1) Compute social persuasion S P t = s p i j t m × m same as step 4(c) in Algorithm 1. Then, identify T P t , T P A , t , T P U , t , and R P U , t same as step 5(a). (2) If t = 0 , let T P * = T P t , and for each individual v k , let x ( 1 ) k , 0 be the initial best alternative of their preference P k , 0 . (3) If t > 0 , let x ( 1 ) c , t and x ( 1 ) k , t be the best alternative of the current collective preference P c , t and individual preference P k , t . For each individual v k T P * , compute the following indicators: (a) the retention probability T P R , if v k T P t , then T P R k , t = 1 , otherwise T P R k , t = 0 ; (b) alternative stability A S t , if x ( 1 ) k , t = x ( 1 ) k , 0 , then A S k , t = 1 , otherwise A S k , t = 0 ; (c) alternative consistency A C , if x ( 1 ) c , t = x ( 1 ) k , 0 , then A C k , t = 1 , otherwise A C k , t = 0 .
Step 10′: Output T P R t , A S t , and A C t   ( t = 1,2 , , T ) .

References

  1. Kleinberg, J. The convergence of social and technological networks. Commun. ACM 2008, 51, 66–72. [Google Scholar] [CrossRef]
  2. Dong, Y.; Zha, Q.; Zhang, H.; Herrera, F. Consensus Reaching and Strategic Manipulation in Group Decision Making with Trust Relationships. IEEE Trans. Syst. Man Cybern. Syst. 2021, 51, 6304–6318. [Google Scholar] [CrossRef]
  3. Dong, Y.; Zha, Q.; Zhang, H.; Kou, G.; Fujita, H.; Chiclana, F.; Herrera-Viedma, E. Consensus reaching in social network group decision making: Research paradigms and challenges. Knowl. Based Syst. 2018, 162, 3–13. [Google Scholar] [CrossRef]
  4. Herrera-Viedma, E.; Cabrerizo, F.; Chiclana, F.; Wu, J.; Cobo, M.; Samuylov, K. Consensus in Group Decision Making and Social Networks. Stud. Inf. Control 2017, 26, 259–268. [Google Scholar] [CrossRef]
  5. Wu, J.; Chiclana, F.; Fujita, H.; Herrera-Viedma, E. A visual interaction consensus model for social network group decision making with trust propagation. Knowl. Based Syst. 2017, 122, 39–50. [Google Scholar] [CrossRef]
  6. Wu, J.; Dai, L.; Chiclana, F.; Fujita, H.; Herrera-Viedma, E. A minimum adjustment cost feedback mechanism based consensus model for group decision making under social network with distributed linguistic trust. Inf. Fusion. 2018, 41, 232–242. [Google Scholar] [CrossRef]
  7. Alonso, S.; Pérez, I.J.; Cabrerizo, F.J.; Herrera-Viedma, E. A linguistic consensus model for Web 2.0 communities. Appl. Soft Comput. 2013, 13, 149–157. [Google Scholar] [CrossRef]
  8. Cabrerizo, F.J.; Chiclana, F.; Al-Hmouz, R.; Morfeq, A.; Balamash, A.S.; Herrera-Viedma, E. Fuzzy decision making and consensus: Challenges. J. Intell. Fuzzy Syst. 2015, 29, 1109–1118. [Google Scholar] [CrossRef]
  9. Gupta, M. Consensus building process in group decision making-an adaptive procedure based on group dynamics. IEEE Trans. Fuzzy Syst. 2018, 26, 1923–1933. [Google Scholar] [CrossRef]
  10. Herrera, F.; Herrera-Viedma, E.; Verdegay, J.L. A model of consensus in group decision making under linguistic assessments. Fuzzy Sets Syst. 1996, 78, 73–87. [Google Scholar] [CrossRef]
  11. Xu, X.; Zhang, Q.; Chen, X. Consensus-based non-cooperative behaviors management in large-group emergency decision-making considering experts’ trust relations and preference risks. Knowl. Based Syst. 2020, 190, 105108. [Google Scholar] [CrossRef]
  12. Wu, T.; Liu, X.; Qin, J.; Herrera, F. Trust-Consensus Multiplex Networks by Combining Trust Social Network Analysis and Consensus Evolution Methods in Group Decision-Making. IEEE Trans. Fuzzy Syst. 2022, 30, 4741–4753. [Google Scholar] [CrossRef]
  13. Yu, S.-M.; Du, Z.-J.; Zhang, X.-Y.; Luo, H.-Y.; Lin, X.-D. Trust Cop-Kmeans Clustering Analysis and Minimum-Cost Consensus Model Considering Voluntary Trust Loss in Social Network Large-Scale Decision-Making. IEEE Trans. Fuzzy Syst. 2022, 30, 2634–2648. [Google Scholar] [CrossRef]
  14. Ureña, R.; Chiclana, F.; Melançon, G.; Herrera-Viedma, E. A social network based approach for consensus achievement in multiperson decision making. Inf. Fusion 2019, 47, 72–87. [Google Scholar] [CrossRef]
  15. Li, Y.; Huan, J.; Shen, J.; Chen, L.; Cao, J.; Cheng, Y. Social network large-scale group decision-making considering dynamic trust relationships and historical preferences of decision makers in opinion evolution. Inf. Fusion 2025, 117, 102837. [Google Scholar] [CrossRef]
  16. Liu, P.; Wang, X.; Wang, X.; Wang, P. The fuzzy graph model for conflict resolution considering power asymmetry based on social trust network. Inf. Sci. 2025, 689, 121442. [Google Scholar] [CrossRef]
  17. Ji, F.; Wu, J.; Chiclana, F.; Sun, Q.; Herrera-Viedma, E. A Trust Incentive Driven Feedback Mechanism With Risk Attitude for Group Consensus in Social Networks. In IEEE Transactions on Systems Man Cybernetics-Systems; IEEE: Piscataway, NJ, USA, 2025; pp. 1–14. [Google Scholar] [CrossRef]
  18. You, X.; Hou, F.; Chiclana, F. A reputation-based trust evaluation model in group decision-making framework. Inf. Fusion. 2024, 103, 102082. [Google Scholar] [CrossRef]
  19. Wang, F.; Zhang, H.; Wang, J. Strategic behavior in multi-criteria sorting with trust relationships-based consensus mechanism: Application in supply chain risk management. Eur. J. Oper. Res. 2025, 321, 907–924. [Google Scholar] [CrossRef]
  20. Zhang, Y.; Chen, X.; Gao, L.; Dong, Y.; Pedryczc, W. Consensus reaching with trust evolution in social network group decision making. Expert. Syst. Appl. 2022, 188, 116022. [Google Scholar] [CrossRef]
  21. Liu, X.; Xu, Y.; Montes, R.; Herrera, F. Social network group decision making: Managing self-confidence-based consensus model with the dynamic importance degree of experts and trust-based feedback mechanism. Inf. Sci. 2019, 505, 215–232. [Google Scholar] [CrossRef]
  22. Zhang, Z.; Gao, Y.; Li, Z. Consensus reaching for social network group decision making by considering leadership and bounded confidence. Knowl. Based Syst. 2020, 204, 106240. [Google Scholar] [CrossRef]
  23. Li, Y.; Kou, G.; Li, G.; Peng, Y. Consensus reaching process in large-scale group decision making based on bounded confidence and social network. Eur. J. Oper. Res. 2022, 303, 790–802. [Google Scholar] [CrossRef]
  24. Barberis, N.; Shleifer, A.; Vishny, R. A model of investor sentiment1. J. Financ. Econ. 1998, 49, 307–343. [Google Scholar] [CrossRef]
  25. Borgatti, S.P.; Mehra, A.; Brass, D.J.; Labianca, G. Network analysis in the social sciences. Science 2009, 323, 892–895. [Google Scholar] [CrossRef]
  26. Brass, D.J. Being in the right place: A structural analysis of individual influence in an organization. Adm. Sci. Q. 1984, 29, 518. [Google Scholar] [CrossRef]
  27. Lü, L.; Chen, D.; Ren, X.-L.; Zhang, Q.-M.; Zhang, Y.-C.; Zhou, T. Vital nodes identification in complex networks. Phys. Rep. 2016, 650, 1–63. [Google Scholar] [CrossRef]
  28. Zhang, Y.; Chen, X.; Pedrycz, W.; Dong, Y. Consensus Reaching Based on Social Influence Evolution in Group Decision Making. IEEE Trans. Cybern. 2023, 53, 4134–4147. [Google Scholar] [CrossRef]
  29. Wu, T.; Liu, X.; Gong, Z.; Zhang, H.; Herrera, F. The minimum cost consensus model considering the implicit trust of opinions similarities in social network group decision-making. Int. J. Intell. Syst. 2020, 35, 470–493. [Google Scholar] [CrossRef]
  30. Chaiken, S.L.; Gruenfeld, D.H.; Judd, C.M. Persuasion in negotiations and conflict situations. In The Handbook of Conflict Resolution: Theory and Practice; Jossey-Bass/Wiley: Hoboken, NJ, USA, 2000; pp. 144–165. [Google Scholar]
  31. Burt, R.S. Social contagion and innovation: Cohesion versus structural equivalence. Am. J. Sociol. 1987, 92, 1287–1335. [Google Scholar] [CrossRef]
  32. Knoke, D. Networks of political action: Toward theory construction. Soc. Forces 1990, 68, 1041. [Google Scholar] [CrossRef]
  33. Fang, X.; Hu, P.J.-H. Top persuader prediction for social networks. MISQ 2018, 42, 63–82. [Google Scholar] [CrossRef]
  34. EHerrera-Viedma; Martinez, L.; Mata, F.; Chiclana, F. A consensus support system model for group decision-making problems with multigranular linguistic preference relations. IEEE Trans. Fuzzy Syst. 2005, 13, 644–658. [Google Scholar] [CrossRef]
  35. Chiclana, F.; García, J.M.T.; Del Moral, M.J.; Herrera-Viedma, E. A statistical comparative study of different similarity measures of consensus in group decision making. Inf. Sci. 2013, 221, 110–123. [Google Scholar] [CrossRef]
  36. Choudhury, A.K.; Shankar, R.; Tiwari, M.K. Consensus-based intelligent group decision-making model for the selection of advanced technology. Decis. Support. Syst. 2006, 42, 1776–1799. [Google Scholar] [CrossRef]
  37. Herrera-Viedma, E.; Cabrerizo, F.; Kacprzyk, J.; Pedrycz, W. A review of soft consensus models in a fuzzy environment. Inf. Fusion. 2014, 17, 4–13. [Google Scholar] [CrossRef]
  38. Kacprzyk, J.; Fedrizzi, M. A ‘soft’ measure of consensus in the setting of partial (fuzzy) preferences. Eur. J. Oper. Res. 1988, 34, 316–325. [Google Scholar] [CrossRef]
  39. Herrera, F.; Herrera-Viedma, E.; Verdegay, J.L. A rational consensus model in group decision making using linguistic assessments. Fuzzy Sets Syst. 1997, 88, 31–49. [Google Scholar] [CrossRef]
  40. Cabrerizo, F.J.; Morente-Molinera, J.A.; Pedrycz, W.; Taghavi, A.; Herrera-Viedma, E. Granulating linguistic information in decision making under consensus and consistency. Expert. Syst. Appl. 2018, 99, 83–92. [Google Scholar] [CrossRef]
  41. Cabrerizo, F.; Moreno, J.; Pérez, I.; Herrera-Viedma, E. Analyzing consensus approaches in fuzzy group decision making: Advantages and drawbacks. Soft Comput. 2010, 14, 451–463. [Google Scholar] [CrossRef]
  42. Mata, F.; Martinez, L.; Herrera-Viedma, E. An adaptive consensus support model for group decision-making problems in a multigranular fuzzy linguistic context. IEEE Trans. Fuzzy Syst. 2009, 17, 279–290. [Google Scholar] [CrossRef]
  43. Herrera, F.; Herrera-Viedma, E. Choice functions and mechanisms for linguistic preference relations. Eur. J. Oper. Res. 2000, 120, 144–161. [Google Scholar] [CrossRef]
  44. Wasserman, S.; Faust, K. Social Network Analysis: Methods and Applications, 1st ed.; Cambridge University Press: Cambridge, UK, 1994. [Google Scholar] [CrossRef]
  45. Barabási, A.-L.; Pósfai, M. Network Science; Cambridge University Press: Cambridge, UK, 2016. [Google Scholar]
  46. Newman, M. Networks, 2nd ed.; Oxford University Press: Oxford, UK; New York, NY, USA, 2018; Available online: https://academic.oup.com/book/27884 (accessed on 1 January 2023).
  47. Cormen, T.H.; Stein, C.; Rivest, R.L.; Leiserson, C.E. Introduction to Algorithms, 3rd ed.; The MIT Press: Cambridge, MA, USA, 2009. [Google Scholar]
  48. Freeman, L.C. Centrality in social networks conceptual clarification. Soc. Netw. 1978, 1, 215–239. [Google Scholar] [CrossRef]
  49. White, D.R.; Borgatti, S.P. Betweenness centrality measures for directed graphs. Soc. Netw. 1994, 16, 335–346. [Google Scholar] [CrossRef]
  50. Bonacich, P. Factoring and weighting approaches to status scores and clique identification. J. Math. Sociol. 1972, 2, 113–120. [Google Scholar] [CrossRef]
  51. Bonacich, P. Power and centrality: A family of measures. Am. J. Sociol. 1987, 92, 1170–1182. [Google Scholar] [CrossRef]
  52. Bonacich, P. Some unique properties of eigenvector centrality. Soc. Netw. 2007, 29, 555–564. [Google Scholar] [CrossRef]
  53. Degroot, M.H. Reaching a consensus. J. Am. Stat. Assoc. 1974, 69, 118–121. [Google Scholar] [CrossRef]
  54. Dong, Y.; Ding, Z.; Martínez, L.; Herrera, F. Managing consensus based on leadership in opinion dynamics. Inf. Sci. 2017, 397, 187–205. [Google Scholar] [CrossRef]
  55. Quesada, F.J.; Palomares, I.; Martínez, L. Managing experts behavior in large-scale consensus reaching processes with uninorm aggregation operators. Appl. Soft Comput. 2015, 35, 873–887. [Google Scholar] [CrossRef]
  56. Erdős, P.; Rényi, A. On the evolution of random graphs. Publ. Math. Inst. Hung. Acad. Sci. 1960, 5, 17–61. [Google Scholar]
Figure 1. The general framework of GDM.
Mathematics 13 00385 g001
Figure 2. Example of social network.
Mathematics 13 00385 g002
Figure 3. The proposed consensus framework of SNGDM with social persuasion.
Mathematics 13 00385 g003
Figure 4. Uninorm operator’s behaviors.
Mathematics 13 00385 g004
Figure 5. Trust relationships of seven individuals in the social network.
Mathematics 13 00385 g005
Figure 6. Individuals will be influenced by those with higher social persuasion rather than by direct trust relationships.
Mathematics 13 00385 g006
Figure 7. Average C D t values under different m , ρ , and η values in simulation experiment I–III.
Mathematics 13 00385 g007
Figure 8. (ac) A Z under different parameters K , η , and θ values in simulation experiment I and II.
Mathematics 13 00385 g008
Figure 9. T P R under different parameters K values in simulation experiment IV.
Mathematics 13 00385 g009
Figure 10. A S under different parameters K values in simulation experiment IV.
Mathematics 13 00385 g010
Figure 11. A C under different parameters K values in simulation experiment IV.
Mathematics 13 00385 g011
Table 1. Summary of the symbols used in this study.
SymbolsMeaning
V = v 1 , v 2 , , v m ( m 2 ) Set   of   decision   makers   in   a   social   network ,   where   v k   denotes   the   k -th individual.
X = x 1 , x 2 , , x n ( n 2 ) Set   of   alternatives ,   where   x i   denotes   the   i -th alternative.
P k , t = ( p i j k , t ) n × n The   preference   of   individual   v k   where   p i j k , t [ 0 , 1 ]   denotes   v k s   preference   for   alternative   x i   over   x j   at   time   t .
P c , t = p i j c , t n × n The   collective   preference   of   the   group   for   alternative   x i   over   x j   at   time   t .
π k The   weight   of   individual   v k in the aggregated collective preference.
C D t The   consensus   degree   at   time   t .
C D t v k The   consensus   degree   of   individual   v k   at   time   t .
μ The consensus threshold.
T The maximum consensus time.
Q i The   dominance   degree   of   each   alternative   x i in the collective preference.
E = v k , v l v k , v l V ; k l Set   of   edges ,   where   v k , v l   denotes   a   trust   relationship   from   v k   to   v l .
A = a k l m × m The   adjacency   matrix ,   where   a k l = 1   denotes   the   edge   from   individual   v k   to   v l .
d k l The   length   of   the   shortest   path   from   individual   v k   to   v l .
C ( v k ) The   centrality   score   of   individual   v k .
β k The   self-confidence   degree   of   individual   v k .
K The number of top persuaders and resistant persuadees.
θ Attenuation factor.
S I = s k l m × m The   social   influence   among   individuals   in   the   social   network ,   where   s k l [ 0 , 1 ]   measures   the   strength   of   social   influence   that   v l   assigns   to   v k .
S T = r 1 , r 2 , , r m The   social   status   of   all   individuals ,   where   r k [ 0 , 1 ]   measures   the   social   status   of   individual   v k .
U Uninorm operator.
S P = s p k l m × m The   social   persuasion   among   individuals   in   the   social   network ,   where   s p k l [ 0 , 1 ]   measures   the   strength   of   social   persuasion   that   v l   assigns   to   v k .
S P l The   persuasive   power   of   individual   v l .
T P A The set of top persuaders with acceptable consensus degrees.
T P U The set of top persuaders with unacceptable consensus degrees.
S P = s p k l m × m The restricted social persuasion among individuals in the social network.
W = ω k l n × n The   influence   weight   among   individuals ,   where   ω k l 0 , 1 β k   denotes   the   influence   weight   individual   v l   assigns   to   v k .
R P k The   resistance   score   of   individual   v k .
R P U The set of resistant persuadees with unacceptable consensus degrees.
H The set of recommendations of trust relationships.
Table 2. A Z under different centrality measures and parameter K in simulation experiment I and II.
AZIn-DegreeClosenessBetweennessPercolationEigenvectorKatzPageRankUniform
KTPCSICTPCSICTPCSICTPCSICTPCSICTPCSICTPCSICTPCSIC
29.5849.6539.5129.6698.5898.7938.5918.7519.3539.4699.6049.7069.4779.6249.2269.643
48.9619.0878.8829.1787.9398.1157.9738.1039.1799.3019.039.1138.8419.0748.5799.153
68.2598.3828.198.4947.3817.617.3547.6149.0449.1698.2868.4228.1018.3567.8978.542
87.6157.8327.67.9456.9897.2366.9867.2328.9549.1237.6857.8087.4867.7157.3547.985
107.2687.5047.2297.6146.7867.0776.7917.0668.9519.0787.377.427.0867.3077.0287.585
Disclaimer/Publisher’s Note: The statements, opinions and data contained in all publications are solely those of the individual author(s) and contributor(s) and not of MDPI and/or the editor(s). MDPI and/or the editor(s) disclaim responsibility for any injury to people or property resulting from any ideas, methods, instructions or products referred to in the content.

