Abstract
Accurate segmentation of the pancreas in Computed Tomography (CT) scans is a challenging task, which may be crucial for the diagnosis and treatment planning of pancreatic cancer. The irregular shape of the pancreas, its low contrast relative to surrounding tissues, and its close proximity to other complex anatomical structures make it difficult to accurately delineate its contours. Furthermore, a significant class imbalance between foreground (pancreas) and background voxels in an abdominal CT series represents an additional challenge for deep-learning-based approaches. In this study, we developed a deep learning model for automated pancreas segmentation based on a 3D U-Net architecture enhanced with an attention mechanism to improve the model capability to focus on relevant anatomical features of the pancreas. The model was trained and evaluated on two widely used benchmark datasets for volumetric segmentation, the NIH Healthy Pancreas-dataset and the Medical Segmentation Decathlon (MSD) pancreas dataset. The proposed attention-guided 3D U-Net achieved a Dice score of 80.8 ± 2.1%, ASSD of 2.1 ± 0.3 mm, and HD95 of 8.1 ± 1.6 mm on the NIH dataset, and the values of 78.1 ± 1.1%, 3.3 ± 0.3 mm, and 12.3 ± 1.5 mm for the same metrics on the MSD dataset, demonstrating the value of attention mechanisms in improving segmentation performance in complex and low-contrast anatomical regions.
MSC:
68T07; 68T45
1. Introduction
The pancreas is a small but vital organ that plays essential roles in both digestive and endocrine functions. Despite its clinical importance, it occupies only about 0.5% of the abdominal volume in computed tomography (CT) scans [1], making it difficult to visualize and delineate precisely. Anatomically, the pancreas is located deep within the abdominal cavity and consists of three parts: the head, body, and tail. Accurate pancreas segmentation is crucial for many downstream clinical and research applications, including quantitative analysis, surgical planning, radiotherapy, and disease diagnosis. However, manual delineation is time-consuming and highly dependent on expert experience.
Pancreatic cancer remains one of the most lethal malignancies, with a five-year overall survival rate of only 13% reported between 2013 and 2019 [2]. Imaging plays a pivotal role in confirming the presence of a mass, assessing its extent, and supporting treatment planning. Although ultrasound is often used as an initial screening tool, current clinical guidelines recommend contrast-enhanced CT as the primary modality to evaluate pancreatic tumors and their potential spread [3]. Since imaging plays a central role in detecting pancreatic abnormalities and monitoring disease progression, pancreas segmentation forms a fundamental step in many computer-aided diagnosis and treatment planning pipelines. Even in studies primarily focused on tumor analysis, accurate organ-level segmentation is indispensable for anatomical localization, normalization, and further lesion-specific processing.
Given the critical importance of organ delineation in diagnosis and treatment, automated segmentation of the pancreas from medical images has become an essential component in modern computer-assisted clinical workflows. High-precision segmentation facilitates not only diagnostic interpretation but also supports radiotherapy planning, surgical navigation, and post-operative monitoring. However, several key challenges make this task particularly difficult, especially in 3D volumetric data. First, the boundary of the pancreas cannot be well defined due to the problem of fuzzy boundary perturbation caused by the similar density of the pancreas and the surrounding tissues, and its proximity to other organs. Second, the shape, size, and location of the pancreas vary greatly across individuals. This makes it difficult for Artificial Intelligence (AI)-based approaches to learn and represent its shape and location. Lastly, there is a serious imbalance between the size of the target and the background, which leads to the overfitting problem on the background region.
These challenges underscore the need for advanced computational approaches that can leverage spatial context and anatomical detail, motivating the use of deep learning–based 3D segmentation models in this domain. Building on these insights, this work develops a 3D Unet-shaped model with integrated attention mechanisms for pancreas segmentation. The goal is to achieve good segmentation accuracy while significantly reducing the model computational burden compared to conventional 3D models. The network employs an encoder–decoder design augmented with attention gates to better localize the pancreas and handle its variable shape. In training segmentation models, the choice of loss function is critical, especially for class-imbalanced tasks like pancreas segmentation, where the organ occupies only a tiny fraction of the volume. Additionally, we also conduct a comparison of loss functions in training this model, including the Dice loss and combinations of Dice with Focal loss to determine the optimal training strategy for this task. We evaluate the approach on two major public pancreas CT datasets: the NIH pancreas dataset (82 abdominal CT scans) and the pancreas segmentation task from the Medical Segmentation Decathlon (MSD, 281 CT scans) [4]. These datasets are well-established benchmarks, enabling us to evaluate the effectiveness and generalization capability of the model against the state-of-the-art. In summary, our use of an attention-enhanced 3D model, coupled with a systematic loss function analysis, addresses the challenges of accuracy and efficiency in pancreas segmentation. The following sections detail the model architecture, loss function formulations, and experimental results on the NIH and MSD datasets.
2. Related Work
Early approaches to pancreas segmentation from abdominal CT scans primarily employed statistical shape models [5]. However, with the advent of deep learning, Convolutional Neural Networks (CNNs) quickly became the dominant technique for medical image segmentation. Despite their powerful representational capabilities, CNN-based segmentation networks often struggle when applied to small organs like the pancreas, particularly due to the varied background content in CT images. This inconsistency can degrade performance and result in suboptimal segmentation outcomes. To counteract these challenges, some methods attempt to refine the region of interest (ROI) before performing dense predictions, yet such approaches only partially mitigate the issue.
Deep learning methods for medical segmentation can operate on 2D slices, 3D volumes, or a hybrid 2.5D strategy. The choice among these approaches often depends on the specific application requirements and the availability of computational resources. In 2D networks, the volumetric data is sliced along axial, sagittal, or coronal planes, and each slice is processed independently [6]. While computationally efficient, this method fails to capture spatial continuity between slices, limiting its ability to model 3D anatomical structures, particularly problematic in volumetric CT scans [7]. In contrast, 3D networks process the entire volume as input, enabling the extraction of rich spatial features and volumetric relationships. This results in higher segmentation accuracy but comes at the cost of significantly increased memory and computational requirements [8]. The approaches based on 2.5D networks offer a compromise between 2D and 3D models by stacking multiple adjacent slices as channels in a single input [9]. This allows the network to capture limited inter-slice context while retaining the efficiency and simplicity of 2D convolutional architectures. Although 2.5D models do not fully exploit volumetric information, they often outperform pure 2D methods with relatively modest increases in computational demand.
Despite their accuracy, existing 3D segmentation networks tend to be heavy-weight, with millions of parameters and high computational load. For pancreas CT segmentation, a typical 3D U-Net-based model can be slow and memory-intensive, which hinders deployment in clinical settings that may lack high-end GPUs. There is thus strong motivation to design 3D architectures that maintain high segmentation performance while being more efficient. Recent work has begun exploring efficiency measures such as using depthwise-separable convolutions, model pruning, or knowledge distillation to reduce model size and complexity [10].
U-Net, a popular neural network for biomedical image analysis [11], has been widely adopted for medical image segmentation on CT images [12]. The symmetric encoder-decoder structure with skip connections allows U-Net to efficiently capture both local and global features [11]. The encoder extracts key features through convolution and pooling operations [13], while the decoder restores the image through upsampling [14]. However, the U-Net performance is often suboptimal when dealing with organs as small and irregularly shaped as the pancreas. A hybrid two-stage U-Net has been proposed for segmenting the pancreas by Ghorpade et al. [15], while Milletari et al. [14] introduced the V-Net, a 3D counterpart of U-Net with residual convolutional units. Although these models demonstrated improved performance, the pancreas occupies less than 2% of the total CT volume, and its blurred boundaries often confuse the network, leading to inaccurate segmentation.
Another key advancement in medical segmentation models is the integration of attention mechanisms to improve focus on the target organ. Given the small size of the pancreas and low contrast, incorporating attention can help the network concentrate on relevant regions. Oktay et al. [16] introduced Attention U-Net, adding trainable attention gates that learn to suppress irrelevant regions in the feature maps while highlighting salient pancreatic tissue. These attention gates effectively act as soft region-of-interest masks, yielding better sensitivity to the pancreas and lesions. Follow-up works have adopted spatial and channel attention modules within segmentation networks to further enhance feature representation. For instance, recent 3D models employ channel-wise attention (e.g., squeeze-and-excitation blocks) and spatial attention to adaptively re-weight features, which has been shown to improve the detection of blurry organ boundaries [10]. By focusing the model’s capacity on hard-to-segment structures, attention mechanisms can boost accuracy without requiring deeper or wider networks.
Early deep models often used pixel-wise cross-entropy as loss function, but this can be inadequate when the background class dominates. Milletari et al. [14] incorporated a Dice-based objective in their V-Net. Recent studies often combine multiple loss functions to leverage their complementary strengths. For example, using a sum of Dice and cross-entropy is common to ensure both overlap and per-pixel accuracy are optimized [17]. Such hybrid loss schemes can stabilize training and yield better overall Dice scores by balancing organ coverage and boundary precision.
3. Methodology
3.1. Datasets
All experiments were conducted on two benchmarks made of publicly available datasets, whose details are provided below.
3.1.1. NIH Healthy Pancreas-CT Dataset
This dataset comprises 81 abdominal contrast-enhanced CT scans in DICOM format. Trained radiologists provided the pancreas segmentation masks for this dataset, which are released in the NIfTI standard format. Two CT scans were excluded from the dataset as they lacked the corresponding segmentation masks. The original number of slices of the CT scans varied between 181 and 466 for different patients, the slice thickness ranging from 1.5 to 2.5 mm; the slice dimension was 512 × 512 pixels, with pixel sizes varying around 0.5 mm in both dimensions [18].
3.1.2. MSD Tumors-Pancreas Dataset
This dataset comprises 281 abdominal contrast-enhanced CT scans in the NIfTI format that include labeled pancreas and pancreatic tumors. This dataset is sourced from the Medical Segmentation Decathlon (MSD) pancreas segmentation dataset. Each CT volume consists of 512 × 512 × L voxels, where L, which belongs to the [37, 751] range, is the number of slices along the patient’s axis dimension, and the slice thickness is equal to 2.5 mm [19]. For the purpose of this work, we focused exclusively on the pancreas class, treating it as a binary segmentation task. This decision was motivated by our goal to develop and benchmark a robust pancreas segmentation pipeline before extending to multi-class segmentation involving tumors.
3.2. Segmentation Model
We adopted a 3D U-Net architecture as the core framework for pancreatic segmentation in volumetric CT scans. The architecture follows a symmetric encoder-decoder structure, which is particularly well suited for biomedical image segmentation due to its ability to learn hierarchical features while preserving spatial resolution through skip connections. The model operates on 3D volumes and captures contextual information across all three spatial dimensions. In addition to the base U-Net structure, we integrated the attention mechanisms [16] into the decoder to improve focus on relevant anatomical regions, especially useful for detecting low contrast regions. Figure 1 illustrates the architecture of the model.
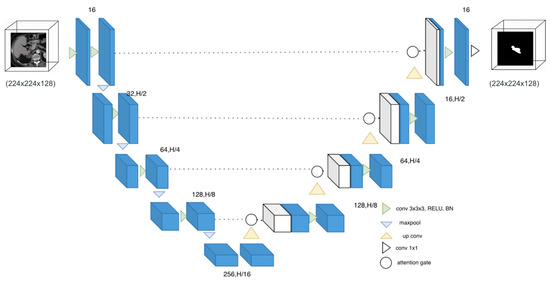
Figure 1.
Architecture diagram for the 3D U-Net model with attention mechanism.
3.2.1. Encoder Branch
The encoder is responsible for progressively extracting semantic features while reducing the spatial resolution of the input. It consists of four downsampling blocks, each comprising two consecutive 3D convolutional layers with a kernel size of 3 × 3 × 3, followed by batch normalization and ReLU activation. After each convolutional block, a 3D max-pooling layer with a stride of 2 is applied to reduce the spatial dimensions by half. The number of feature channels is doubled at each level of the encoder, starting from 2 and progressing to 16 in the deepest layer. This hierarchical design enables the model to capture both low-level spatial details and high-level contextual information.
3.2.2. Decoder Branch
The decoder is designed to reconstruct the segmentation mask by gradually upsampling the compressed feature maps back to the original input resolution. It consists of four decoding blocks, each beginning with a 3D transposed convolution (deconvolution) to upsample the feature maps by a factor of 2. This is followed by a concatenation with the corresponding encoder feature maps via skip connections. The concatenated features then pass through a pair of 3D convolutional layers, batch normalization, and ReLU activation. The number of filters in each decoder block is halved progressively, mirroring the encoder’s structure (from 16 back to 2). This symmetric design helps preserve spatial localization while leveraging rich semantic context.
3.2.3. Attention Module
The attention gate is designed to selectively emphasize informative spatial regions in the encoder feature map before it is merged with the decoder pathway. Let denote the encoder feature map and the corresponding decoder gating signal. Both feature maps are first projected into a common C-channel space through convolutions followed by Layer Normalization, yielding and . These projected tensors are added element-wise and passed through a ReLU non-linearity to fuse encoder and decoder context.
From this fused representation, the gate computes attention coefficients through a lightweight two-layer convolutional subnetwork: a reduction layer with channels and Layer Normalization, followed by a sigmoid-activated convolution producing a voxel-wise attention map . The original encoder features are then modulated by this map via element-wise multiplication, , ensuring that only the most informative spatial regions are propagated to the decoder.
A final convolution and normalization step align the attended features with the decoder’s representational scale before concatenation. This mechanism is applied at every skip-connection level, with filter sizes matching the number of decoder channels at that resolution. Overall, this gating mechanism adaptively filters skip-connection features based on decoder context, improving the model’s ability to highlight pancreas-relevant regions and suppress distractors in abdominal CT scans.
4. Experiments and Results
4.1. Preprocessing of CT Images
The CT images were preprocessed before being used as input to the segmentation network. Initially, both the intensity values and voxel spacing were standardized. The Hounsfield Unit (HU) values were windowed to a range of −100 to 240 HU to enhance soft tissue contrast. These clipped intensities were then linearly scaled to the range of 0 to 1, using the min-max normalization. Additionally, all volumes were resampled to a uniform voxel spacing of 1.0 × 1.0 × 1.0 mm3 to ensure consistent spatial resolution across the dataset. Finally, to standardize the input size and avoid any potential label leakage, a fixed cropping strategy was applied to all CT volumes. Each scan was cropped to a fixed spatial size of 224 × 224 × 128 voxels which corresponds to a region of 224 × 224 × 128 mm3, which we estimated a priori to be a sufficiently large volume to include the entire pancreas shape, centered approximately on the abdominal region based on the typical anatomical position of the pancreas. This approach ensured consistency across all cases without relying on ground truth masks.
For the MSD dataset, we combined the two labels (pancreas + tumor) in a single ground truth mask to have the complete pancreas area.
4.2. Training Strategy
This section outlines the training configuration used across the different segmentation models, including loss functions, optimization methods, data augmentation strategies, and evaluation metrics. Identical training pipelines were applied on both datasets.
To guide the models during training, a loss function based on the segmentation task has been selected. We used a combination of Focal loss and Dice loss. Dice loss was particularly useful in handling class imbalance between the pancreas and background regions, as it directly optimizes the overlap between predicted and ground truth masks. The Focal loss is an extension of the standard cross-entropy loss designed to address class imbalance by down-weighting easy examples and focusing the training on hard, misclassified samples [20]. It introduces a modulating factor in cross-entropy loss, where is the estimated probability of the model for the true class and is a tunable focusing parameter. The used loss is hence defined in the following:
with
and
where is the ground truth, is the model prediction, and N is the number of samples in the dataset.
By combining the Focal loss and the Dice Loss, we benefit from both pixel-level classification robustness and region-level segmentation accuracy. This hybrid strategy has proven effective in improving model performance, particularly for small or difficult structures such as the pancreas.
The model training has been implemented in TensorFlow version 2.16.1 on a NVIDIA T4 graphics processing unit (GPU) with 16 GB of VRAM, mounted on an 8-core machine with 48 GB of RAM. All models were trained using the Adam optimizer, which provides adaptive learning rate adjustment and efficient convergence. The initial learning rate was set to 6 × , and a scheduler was employed to dynamically reduce the learning rate when validation loss plateaued for 100 epochs through the function ReduceLROnPlateau. This adaptive strategy helped maintain steady learning progress and prevented overfitting in later stages of training.
To evaluate the generalization performance of the proposed model, a 5-fold cross-validation scheme was adopted for both the NIH and MSD pancreas datasets. The datasets were randomly partitioned into five disjoint subsets (folds), ensuring that no patient appeared in more than one fold. For each run, the model was trained on four folds and validated on the remaining one, rotating the validation fold across iterations. The final evaluation was conducted on a separate held-out test set that was not used during training or cross-validation. In the MSD dataset, the data were split into five folds of 46 cases each, with 51 cases reserved for the independent test set. Similarly, for the NIH dataset, we used five folds of 13 cases each, and 16 cases were held out for independent testing.
To further improve generalization and reduce overfitting, we applied on-the-fly data augmentation during training. Data augmentation transformations were applied in 3D and included the following transformations:
- Random rotations along each axis within ±10°;
- Random flips with a probability of 0.5;
- Random shifts of up to 10% of the image size in each axis.
These transformations were applied and were designed to preserve anatomical structure while diversifying the training data distribution.
4.3. Performance Evaluation Metric
Volume-based metrics: The Dice Similarity Coefficient (DSC) has been used as the primary metric to evaluate the model performance. The DSC measures the similarity between the segmentation mask predicted by the model and the ground truth annotation. The formula of the DSC is defined as follows [21]:
where and represent the prediction and the ground truth, respectively.
Surface-based metrics: To assess boundary accuracy, we also report two widely used surface distance metrics: the Average Symmetric Surface Distance (ASSD), which computes the mean bidirectional distance between the predicted and reference segmentation surfaces, providing a robust measure of overall contour deviation; the 95th percentile Hausdorff distance (HD95), which measures the 95th percentile of the symmetric surface-to-surface distances and is less sensitive to outlier points than the maximum Hausdorff distance. Both metrics are computed in physical units (millimeters). Their formulation can be found in this work [22].
4.4. Results
4.4.1. Segmentation Performance on the NIH Dataset
The 3D U-Net model was evaluated using 5-fold cross-validation on the preprocessed CT scans of the NIH dataset to ensure robust performance estimation.
Table 1 presents a comparison of DSC achieved by various U-Net–based models on the NIH pancreas CT dataset. Notably, our 3D Attention U-Net achieves a mean DSC of 80.8 ± 2.1%, which is competitive with several state-of-the-art approaches, and outperforms the same model where the attention mechanism was removed (3D Unet), whose performance was limited to 77.6 ± 1.6%. While Bharat et al. [23] report the highest DSC of 83.31%, their approach does not provide per-case variance or the range of performance. Similarly, Boers et al. [24] and Jain et al. [25] report scores of 78.10% and 81.75%, respectively, but do not disclose the consistency of their models across the test set. In contrast, our method not only achieves a strong average score but also reports a minimum DSC of 78.6% and a maximum of 84.1%, indicating stable and reliable performance across individual cases. Moreover, unlike prior literature, our evaluation includes boundary-focused surface metrics. The model attains a HD95 of 8.1 ± 1.6 mm and an ASSD of 2.1 ± 0.3 mm, demonstrating a considerable boundary conformity in addition to volumetric overlap.

Table 1.
Comparison of results on NIH dataset with Unet model for pancreas in the literature.
A visual representation of the segmentation obtained on a representative subject of the NIH dataset is illustrated in Figure 2.
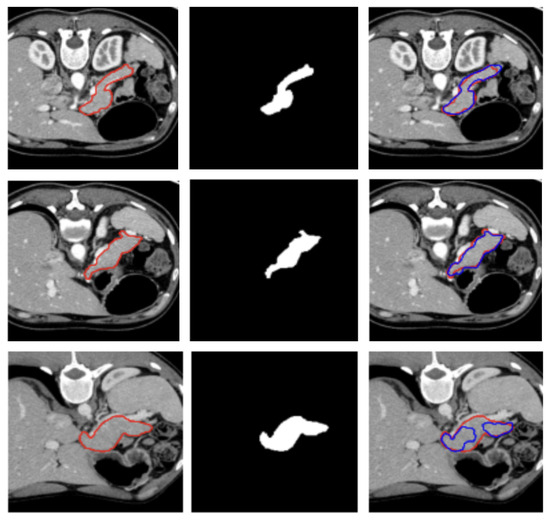
Figure 2.
Visualization of two representative test samples from the NIH dataset showing: the input image with the pancreas ground truth overlaid as a red contour (left), the corresponding pancreas mask (center), and the output of the model overlaid to the input image as a blue contour (right). The first sample (first and second row) illustrates an easy case with clear organ boundaries and the second sample (bottom row) depicts a more challenging case with low contrast, yet the model still captures the main structure.
This result suggests that the model generalizes well to unseen data and is not overly sensitive to the specific distribution of training cases. The low standard deviation further confirms the stability of the training process and the effectiveness of the preprocessing, architecture design, and data augmentation strategies employed.
4.4.2. Segmentation Performance on the MSD Dataset
Table 2 compares the performance of our 3D Attention U-Net with other U-Net–based models evaluated on the MSD pancreas dataset. Our method achieves a mean Dice score of 78.1% which is consistent with the performance reported in the literature. Moreover, our evaluation includes boundary-focused surface metrics. The model attains a HD95 of 12.3 ± 1.5 mm and an ASSD of 3.3 ± 0.3 mm, demonstrating a considerable boundary conformity in addition to volumetric overlap.
Table 2.
Comparison of results on MSD dataset with U-net models for pancreas in the literature.
Three examples of segmentation obtained on test samples of the MSD dataset are illustrated in Figure 3.
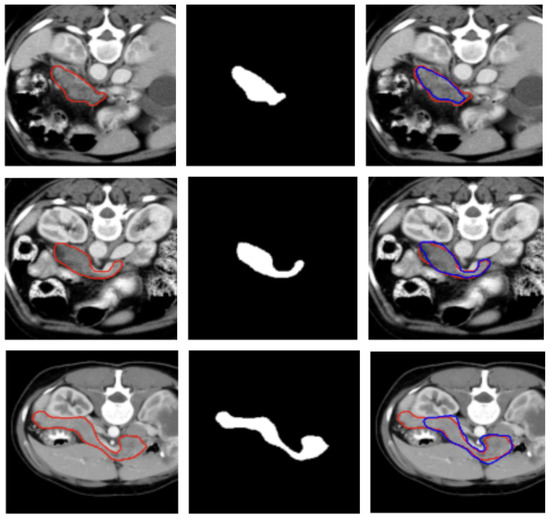
Figure 3.
Visualization of two representative test samples from the MSD dataset showing: the input image with the pancreas ground truth overlaid as a red contour (left), the corresponding pancreas mask (center), and the output of the model overlaid to the input image as a blue contour (right). The first sample (first and second row) illustrates an easy case with clear organ boundaries and the second sample (bottom row) depicts a more challenging case with low contrast, yet the model still captures the main structure.
4.5. Loss Assessment
To assess the contribution of each loss component, we conducted an ablation study comparing Dice loss, the combination of Dice with cross-entropy (CE) and Dice with focal loss. Table 3 reports the average DSC achieved by each configuration across the NIH and MSD pancreas datasets.
Table 3.
Ablation study on the effect of different loss functions for pancreas segmentation. The performance is reported in terms of average Dice coefficients and their standard deviation values on the NIH and MSD datasets.
Overall, the results show relatively small performance differences among the three different formulations of the loss functions in both datasets.
We conducted a Friedman test first across the three loss configurations and it indicated a statistically significant overall effect of the loss function (p = 0.0224 and p = 0.0408 for MSD and NIH datasets, respectively). However, the post-hoc pairwise comparison revealed a statistically significant differences only between the Dice + Focal Loss and the the Dice Loss only, for both the MSD and NIH datasets, with p = 0.03 in both cases.
5. Discussion
Given the anatomical complexity and low contrast of the pancreas with respect to the surrounding anatomical structures in CT images, the segmentation performance achieving a Dice around the 80% obtained in this work can be considered competitive with existing state-of-the-art methods in the literature, and demonstrates the strength of volumetric feature learning offered by 3D U-Net architectures.
Figure 2 and Figure 3 show, qualitatively, the results of our attention-based 3D U-Net model trained on NIH and MSD datasets, respectively, with a combined Focal and Dice loss. The figures show across different sample cases, how the model successfully delineates the pancreas with high spatial accuracy, as demonstrated by the strong alignment between predicted and ground truth contours. The use of Dice loss contributed to the precise overlap in the segmented regions, while Focal loss improved the model sensitivity to challenging areas, especially along class boundaries where the pancreas is thin or adjacent to low-contrast structures. Notably, even in slices where the pancreas is partially obscured or appears small and fragmented, the model maintains accurate contour predictions. This suggests that the attention mechanism effectively focuses on relevant anatomical regions, suppressing background noise and enhancing feature discrimination.
These visual results support the quantitative performance of the model reported in Table 1 and Table 2 and demonstrate its ability to produce reliable and anatomically consistent pancreas segmentation in volumetric CT data.
In addition to the typical DSC score, we evaluated and reported in Table 1 and Table 2 also the ASSD and the HD95 metrics to assess the segmentation performance of our model. The low ASSD values and the moderately higher HD95 we obtained indicate that the predictions of the model closely follow the ground-truth boundary for most of the organ surfaces, but exhibit localized regions of larger error. This pattern is typical for the pancreas, due to its high anatomical variability, especially in the pancreatic head and tail.
Regarding the comparative evaluation of the three configurations of the loss functions, the finding reported in Table 3 imply that the choice of loss function has a limited impact on overall model performance in this setting, likely due to the limited sample size or to the strong overlap-based optimization shared across the losses and the relatively small performance margins between them.
6. Conclusions
In this study, we developed a 3D volumetric network enhanced with attention mechanisms for pancreas segmentation in CT images. Our model achieved average Dice scores of 80.8% and 78.1% on the NIH and MSD datasets, respectively.
This study has several limitations. First, the experiments were conducted on datasets of limited size and heterogeneity, which may constrain the robustness of the learned representations. Second, the model may exhibit sensitivity to anatomical variability in pancreas shape and appearance, particularly given the substantial inter-patient differences commonly encountered in abdominal CT imaging. Finally, although the model performs well on the evaluated test sample, its ability to generalize to out-of-distribution sample remains limited and requires further investigation on more diverse clinical cohorts.
Future work could focus on incorporating larger, multi-center datasets to enable cross-dataset generalization experiments, thereby allowing for a more systematic assessment of the robustness of the model to domain shift and its adaptability across heterogeneous imaging sources. In addition, an important extension of this work is the integration of tumor segmentation pipelines leveraging the automated pancreas segmentation with the ultimate goal of predicting patients’ prognosis on the basis of imaging features.
Author Contributions
Conceptualization, C.S. and P.O.; Methodology, C.S., F.L., M.E.F. and P.O.; Software, I.C.T.T., C.S. and F.L.; Validation, C.S. and F.L.; Formal analysis, I.C.T.T.; Resources, M.E.F.; Data curation, I.C.T.T. and C.S.; Writing—original draft, I.C.T.T.; Writing—review & editing, C.S., F.L., M.E.F., P.O. and A.R.; Supervision, M.E.F., P.O. and A.R.; Project administration, A.R.; Funding acquisition, M.E.F. and A.R. All authors have read and agreed to the published version of the manuscript.
Funding
Research partly supported by European Commission under the NextGeneration EU programme through the projects: PNRR-M4C2-I1.4, CN00000013 Centro Nazionale di Ricerca in High Performance Computing, Big Data and Quantum Computing (ICSC), Spoke 8 In Silico medicine and Omics Data; PNRR-M4C2-I1.3, PE00000013 Future Artificial Intelligence Research (FAIR), Spoke 8 Pervasive AI; PNRR-M4C2-I1.5, ECS00000017 Tuscany Health Ecosystem (THE), Spoke 1 Advanced Radiotherapies and Diagnostics in Oncology. Research partly funded by INFN-CSN5 through the project Artificial Intelligence in Medicine (AIM).
Data Availability Statement
The original data used for this study can be found at https://www.cancerimagingarchive.net/collection/pancreas-ct/ and http://medicaldecathlon.com/ (accessed on 3 February 2024), NIH, and MSD, respectively. The segmentation masks generated in our analysis can be made available upon request.
Conflicts of Interest
The authors declare no conflicts of interest.
References
- Zhou, Z.; Bian, Y.; Pan, S.; Meng, Q.; Zhu, W.; Shi, F.; Chen, X.; Shao, C.; Xiang, D. A dual branch and fine-grained enhancement network for pancreatic tumor segmentation in contrast enhanced CT images. Biomed. Signal Process. Control. 2023, 82, 104516. [Google Scholar] [CrossRef]
- Siegel, R.L.; Giaquinto, A.N.; Jemal, A. Cancer statistics, 2024. CA Cancer J. Clin. 2024, 74, 12–49. [Google Scholar] [CrossRef] [PubMed]
- Conroy, T.; Pfeiffer, P.; Vilgrain, V.; Lamarca, A.; Seufferlein, T.; O’Reilly, E.; Hackert, T.; Golan, T.; Prager, G.; Haustermans, K.; et al. Pancreatic cancer: ESMO Clinical Practice Guideline for diagnosis, treatment and follow-up. Ann. Oncol. 2023, 34, 987–1002. [Google Scholar] [CrossRef] [PubMed]
- Moglia, A.; Cavicchioli, M.; Mainardi, L.; Cerveri, P. Deep learning for pancreas segmentation: A systematic review. arXiv 2024, arXiv:2407.16313. [Google Scholar] [CrossRef]
- Ma, J.; Lin, F.; Wesarg, S.; Erdt, M. A novel bayesian model incorporating deep neural network and statistical shape model for pancreas segmentation. In Proceedings of the International Conference on Medical Image Computing and Computer-Assisted Intervention, Granada, Spain, 16–20 September 2018; pp. 480–487. [Google Scholar]
- Zhang, Y.; Wu, J.; Liu, Y.; Chen, Y.; Chen, W.; Wu, E.X.; Li, C.; Tang, X. A deep learning framework for pancreas segmentation with multi-atlas registration and 3D level-set. Med. Image Anal. 2021, 68, 101884. [Google Scholar] [CrossRef] [PubMed]
- Wang, Y.; Zhang, J.; Cui, H.; Zhang, Y.; Xia, Y. View adaptive learning for pancreas segmentation. Biomed. Signal Process. Control. 2021, 66, 102347. [Google Scholar] [CrossRef]
- Yan, Y.; Zhang, D. Multi-scale U-like network with attention mechanism for automatic pancreas segmentation. PLoS ONE 2021, 16, e0252287. [Google Scholar] [CrossRef] [PubMed]
- Tondji, I.C.T.; Lizzi, F.; Scapicchio, C.; Retico, A. 2.5 D Deep Learning Model with Attention Mechanism for Pancreas Segmentation on CT Scans. In Proceedings of the 18th International Joint Conference on Biomedical Engineering Systems and Technologies (BIOSTEC 2025), Porto, Portugal, 20–22 February 2025. [Google Scholar]
- Lu, L.; Wu, M.; Sen, G.; Ren, F.; Hu, T. MDMU-Net: 3D multi-dimensional decoupled multi-scale U-Net for pancreatic cancer segmentation. PeerJ Comput. Sci. 2025, 11, e3059. [Google Scholar]
- Ronneberger, O.; Fischer, P.; Brox, T. U-net: Convolutional networks for biomedical image segmentation. In Proceedings of the International Conference on Medical Image Computing and Computer-Assisted Intervention, Munich, Germany, 5–9 October 2015; pp. 234–241. [Google Scholar]
- Huang, B.; Huang, H.; Zhang, S.; Zhang, D.; Shi, Q.; Liu, J.; Guo, J. Artificial intelligence in pancreatic cancer. Theranostics 2022, 12, 6931. [Google Scholar] [CrossRef]
- Litjens, G.; Kooi, T.; Bejnordi, B.E.; Setio, A.A.A.; Ciompi, F.; Ghafoorian, M.; Van Der Laak, J.A.; Van Ginneken, B.; Sánchez, C.I. A survey on deep learning in medical image analysis. Med. Image Anal. 2017, 42, 60–88. [Google Scholar] [CrossRef] [PubMed]
- Milletari, F.; Navab, N.; Ahmadi, S.A. V-net: Fully convolutional neural networks for volumetric medical image segmentation. In Proceedings of the 2016 Fourth International Conference on 3D Vision (3DV), Stanford, CA, USA, 25–28 October 2016; pp. 565–571. [Google Scholar]
- Ghorpade, H.; Kolhar, S.; Jagtap, J.; Chakraborty, J. An optimized two stage U-Net approach for segmentation of pancreas and pancreatic tumor. MethodsX 2024, 13, 102995. [Google Scholar] [CrossRef] [PubMed]
- Oktay, O.; Schlemper, J.; Folgoc, L.L.; Lee, M.; Heinrich, M.; Misawa, K.; Mori, K.; McDonagh, S.; Hammerla, N.Y.; Kainz, B.; et al. Attention U-Net: Learning Where to Look for the Pancreas. arXiv 2018, arXiv:1804.03999. [Google Scholar] [CrossRef]
- Li, J.; Chen, T.; Qian, X. Generalizable Pancreas Segmentation Modeling in CT Imaging via Meta-Learning and Latent-Space Feature Flow Generation. IEEE J. Biomed. Health Inform. 2023, 27, 374–385. [Google Scholar] [CrossRef] [PubMed]
- Scarpace, L.; Mikkelsen, T.; Cha, S.; Rao, S.; Tekchandani, S.; Gutman, D.; Saltz, J.H.; Erickson, B.J.; Pedano, N.; Flanders, A.E.; et al. The cancer genome atlas glioblastoma multiforme collection (TCGA-GBM). Cancer Imaging Arch. 2016. [Google Scholar] [CrossRef]
- Simpson, A.L.; Antonelli, M.; Bakas, S.; Bilello, M.; Farahani, K.; van Ginneken, B.; Kopp-Schneider, A.; Landman, B.A.; Litjens, G.; Menze, B.; et al. A large annotated medical image dataset for the development and evaluation of segmentation algorithms. arXiv 2019, arXiv:1902.09063. [Google Scholar] [CrossRef]
- Lin, T.Y.; Goyal, P.; Girshick, R.; He, K.; Dollár, P. Focal loss for dense object detection. In Proceedings of the IEEE International Conference on Computer Vision, Venice, Italy, 22–29 October 2017; pp. 2980–2988. [Google Scholar]
- Xia, F.; Peng, Y.; Wang, J.; Chen, X. A 2.5 D multi-path fusion network framework with focusing on z-axis 3D joint for medical image segmentation. Biomed. Signal Process. Control. 2024, 91, 106049. [Google Scholar] [CrossRef]
- Hu, P.; Li, J.; Wang, Y.; Kong, D. Deep learning in abdominal organ segmentation: A review. Intell. Oncol. 2025, 1, 277–289. [Google Scholar] [CrossRef]
- Giddwani, B.; Tekchandani, H.; Verma, S. Deep Dilated V-Net for 3D Volume Segmentation of Pancreas in CT images. In Proceedings of the 7th International Conference on Signal Processing and Integrated Networks (SPIN), Noida, India, 27–28 February 2020; pp. 591–596. [Google Scholar] [CrossRef]
- Boers, T.; Hu, Y.; Gibson, E.; Barratt, D.; Bonmati, E.; Krdzalic, J.; van der Heijden, F.; Hermans, J.; Huisman, H. Interactive 3D U-net for the segmentation of the pancreas in computed tomography scans. Phys. Med. Biol. 2020, 65, 065002. [Google Scholar] [CrossRef] [PubMed]
- Jain, S.; Sikka, G.; Dhir, R. An automatic cascaded approach for pancreas segmentation via an unsupervised localization using 3D CT volumes. Multimed. Syst. 2023, 29, 2337–2349. [Google Scholar] [CrossRef]
- Chen, H.; Liu, Y.; Shi, Z.; Lyu, Y. Pancreas segmentation by two-view feature learning and multi-scale supervision. Biomed. Signal Process. Control. 2022, 74, 103519. [Google Scholar] [CrossRef]


Disclaimer/Publisher’s Note: The statements, opinions and data contained in all publications are solely those of the individual author(s) and contributor(s) and not of MDPI and/or the editor(s). MDPI and/or the editor(s) disclaim responsibility for any injury to people or property resulting from any ideas, methods, instructions or products referred to in the content. |
© 2025 by the authors. Licensee MDPI, Basel, Switzerland. This article is an open access article distributed under the terms and conditions of the Creative Commons Attribution (CC BY) license (https://creativecommons.org/licenses/by/4.0/).