1. Introduction
The detection of exoplanets in space-based photometry depends on recognizing periodic transit signatures in stellar light curves and translating them into reliable scientific inferences. In the Kepler DR25 release, the processing pipeline provides two complementary views of the data: Threshold Crossing Events (TCEs) [
1], which list all periodic dimmings that surpass detection thresholds, and the curated Kepler Objects of Interest (KOIs) [
2], which include dispositions (CONFIRMED, CANDIDATE, FALSE POSITIVE) after automated and expert vetting. Although this TCE-to-KOI process has been highly productive, it remains unclear in many borderline cases where the signal-to-noise ratio is low, transit depths are marginal, durations are atypical, or the stellar environment complicates interpretation. These gray areas highlight two persistent needs: to treat uncertainty as a first-class quantity rather than an afterthought, and to make the criteria underlying dispositions transparent and reproducible.
This paper addresses both needs by introducing FAS-XAI, a unified methodological framework that combines fuzzy clustering, supervised learning, and explainable artificial intelligence (XAI) for interpretable transit vetting [
3]. The central idea is to use soft structures revealed directly in the transit signal space as an explicit bridge to curated labels and, ultimately, to decision support.
Concretely, we first apply Fuzzy C-Means (FCM) to representative TCE-level variables, period, duration, depth, and a measure of detection significance, to uncover latent structures and quantify ambiguity through membership degrees. FCM assigns each object a graded membership in every cluster (values between 0 and 1) rather than a single hard label. Membership increases as the object lies closer to a cluster center in the feature space (period, duration, depth, detection significance), and a single fuzziness parameter controls how sharply these memberships concentrate around the nearest center [
4]. This soft evidence allows us to move beyond mutually exclusive assignments and to capture the graded uncertainty commonly observed near detection thresholds.
We then link the unsupervised structure to KOI dispositions to assess how well the emergent clusters align with curated labels. Alongside descriptive analyses (cluster purity and per-cluster summaries), we report quantitative measures such as the Adjusted Rand Index (ARI) and Normalized Mutual Information (NMI) [
5]. We also introduce a “soft” evaluation that treats summed memberships to planet-like clusters as continuous probabilities and evaluates performance with ROC-AUC, thereby respecting the probabilistic nature of the fuzzy representation. In the second stage, we train supervised classifiers on KOI labels and enrich their feature sets with fuzzy memberships and the crisp cluster identifier. This integration is intended to improve discrimination and calibration while preserving interpretability: the memberships act as human-readable indicators of where each candidate lies within the transit signal space.
Interpretability is addressed explicitly through model-agnostic explanation tools [
6]. We employ SHAP and LIME, complemented by ELI5, to provide global and local attributes that identify which variables, both signal-related and stellar, drive predictions and errors. Incorporating stellar parameters from the Kepler DR25 catalog adds astrophysical context, enabling plausibility checks (e.g., depth consistent with
, duration consistent with orbital period and stellar radius) and helping to distinguish physically coherent planetary regimes from likely false positives [
7]. In this way, FAS-XAI aims not only to predict but also to explain and prioritize candidates for follow-up through a simple strategic rule that combines classifier probabilities, fuzzy memberships, and domain cues such as detection significance, depth, false-positive flags, and stellar radius.
Our contributions are threefold. First, we provide a unified, reproducible pipeline that connects fuzzy clustering, supervised prediction, and XAI in a mathematically grounded way for transit datasets. Second, we construct an enriched dataset that merges TCEs and KOIs (and, when applicable, stellar parameters) and appends fuzzy memberships as transparent features, enabling both soft and hard evaluations. Third, we deliver an evaluation protocol that spans unsupervised and supervised metrics (purity, ARI/NMI, soft ROC-AUC, F1, calibration), together with robust checks across the number of clusters , fuzziness , random seeds, and ablation studies that quantify the contribution of fuzzy information.
We hypothesize that fuzzy memberships capture meaningful structure in TCE space that partially aligns with KOI dispositions, and incorporating those memberships improves supervised classification and calibration without sacrificing interpretability. By placing uncertainty and explanation at the center of the workflow, FAS-XAI offers a principled route to more transparent vetting pipelines.
The remainder of the paper details the data and construction of the analysis set, formalizes the methodology and its implementation, presents empirical results on Kepler DR25, including cluster structure, alignment with KOIs, classification performance, and explanatory analyses, and discusses robustness, limitations, and paths to transfer the approach to other transit missions.
2. Related Work
In this section, we present a structured review of the literature to examine how the core components of the FAS-XAI framework, fuzzy clustering, explainable machine learning, and interpretable decision modeling, have been explored, whether jointly or independently, within the field of Astronomy and Astrophysics. Rather than merely summarizing previous work, we examine whether methodological integrations like FAS-XAI have been previously developed or applied to scientific discovery tasks, particularly in the analysis of astronomical signals and exoplanetary detection.
To this end, the review is organized into four thematic areas, linking methodological developments to their astrophysical applications:
We first examine the use of fuzzy clustering methods, focusing on their capacity to represent uncertainty, handle overlapping data, and identify gradual class boundaries, properties especially important in astrophysical data, where noise and probabilistic membership are inherent features (e.g., classification of variable stars, galaxy morphology, or exoplanet candidates).
We then explore the domain of XAI [
8], analyzing how interpretability techniques (e.g., SHAP, LIME, counterfactual explanations) have been adopted in Astronomy and Astrophysics to support the transparency and validation of machine learning models, such as those applied to light-curve analysis, transient detection, or stellar parameter estimation [
9].
The third thematic block investigates works that explicitly combine fuzzy clustering and XAI approaches. Here we assess whether these techniques have been integrated into a coherent framework for explainable decision support, an aspect that has received little attention so far in astrophysical research.
Finally, we analyze application-oriented studies within Astronomy, focusing on support for decision-making and classification systems that leverage uncertainty modeling or interpretability to improve scientific judgment. This includes pipelines for transit vetting, anomaly detection, and probabilistic classification of planetary candidates.
We conducted systematic searches in the Web of Science (WoS) database to guide this review [
10]. The search process begins with Fuzzy Clustering in Astronomy & Astrophysics, followed by Machine Learning, Deep Learning and XAI in Astronomy, and concludes with combined fuzzy-XAI approaches both in general and within astrophysical applications.
With this structure, we aim to position the FAS-XAI framework as a methodological bridge between uncertainty modeling and explainable discovery, addressing a persistent gap in current scientific practice: the lack of integrative and interpretable systems capable of supporting transparent, data-driven inference.
2.1. Fuzzy Clustering in Astronomy and Astrophysics
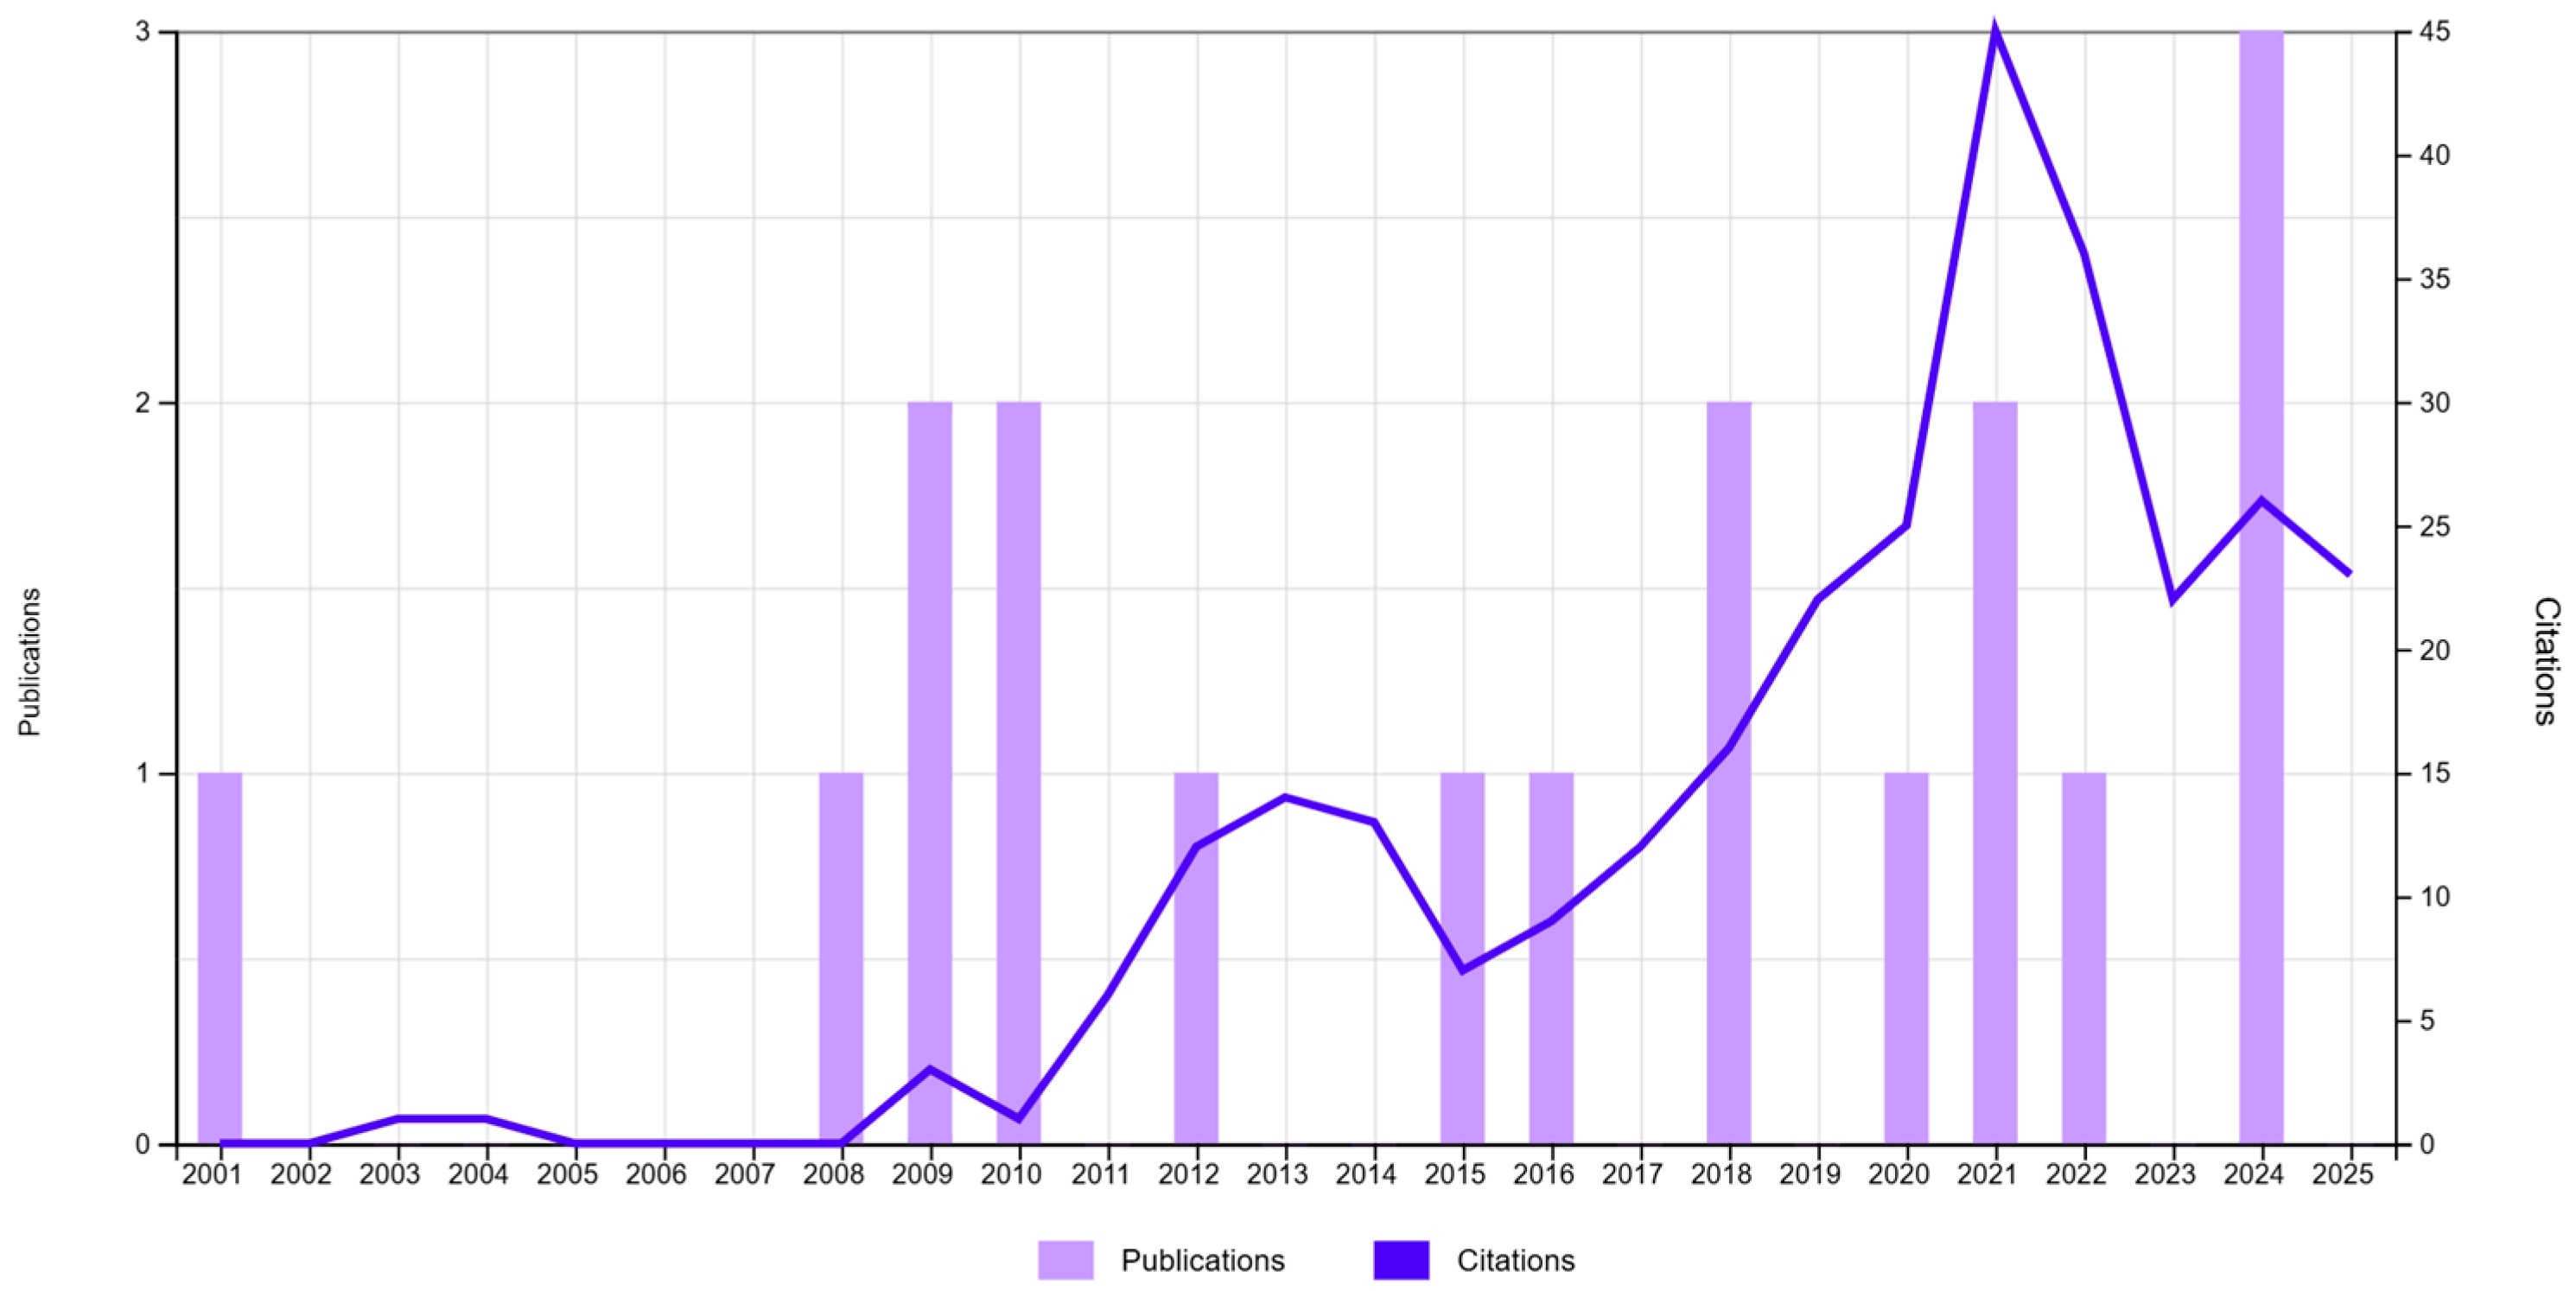
A systematic search was conducted in the Web of Science Core Collection (Clarivate Analytics) using the topic query TS = (“fuzzy clustering” OR “fuzzy c-means”) AND (“astronomy” OR “astrophysics”), which returned 18 scientific publications spanning the period 2001–2025 (
Figure 1). These works represent the limited but growing application of fuzzy clustering techniques to astronomical data analysis, where uncertainty, measurement noise, and overlapping class boundaries are intrinsic to the phenomena being studied.
The results reveal that fuzzy methods have been mainly employed for classification and segmentation tasks, rather than for model interpretability or decision support. Early works applied the FCM algorithm to the membership determination of stars in open clusters, where the soft assignment of stars to multiple potential clusters improved the robustness of traditional hard classifications [
11]. Subsequent studies extended these approaches to the categorization of variable stars, galaxy morphology, and gamma-ray burst (GRB) analysis, used fuzzy clustering to distinguish short, intermediate, and long GRBs in the BATSE catalog, demonstrating that probabilistic membership captures the continuity between burst classes better than crisp boundaries [
12].
More recent contributions explored fuzzy hierarchical clustering pipelines such as FuzzyCat—AstroLink, designed to identify overlapping substructures in cosmological simulations [
13]. These works highlight the ability of fuzzy clustering to reveal multi-scale patterns under uncertainty, a key feature for modeling astrophysical systems.
However, through the literature, fuzzy clustering is almost exclusively used as a stand-alone exploratory tool. None of the retrieved studies from literature integrate Fuzzy C-Means clustering with XAI or embed fuzzy methods within structured decision frameworks. This observation highlights a methodological gap: while fuzzy logic offers a natural way to model uncertainty and data overlaps, it is rarely related to interpretability models to enhance transparency and reasoning in astrophysical inference.
Our previous work, “Integrating Fuzzy C-Means Clustering and Explainable AI for Robust Galaxy Classification” [
3], addressed this challenge by introducing a first integration of fuzzy clustering and XAI techniques applied to the Galaxy Zoo dataset, demonstrating the potential of explainable fuzzy models for transparent galactic classification.
Building upon that foundation, the present study extends the same methodological principles to the detection and interpretation of exoplanetary transits, applying the FAS-XAI framework to bridge fuzzy clustering, supervised prediction, and model interpretability within a unified, explainable pipeline.
Overall, these studies show that fuzzy clustering helps uncover overlapping astrophysical structures and continuous class transitions, but its use remains limited to descriptive analysis rather than integrated modeling.
2.2. Explainable AI (XAI) in Astronomy and Astrophysics
In recent years, XAI has emerged as a key paradigm for improving transparency and trust in machine learning models, especially in areas where automated decisions must be scientifically interpretable. In astronomy and astrophysics, XAI has gained increasing attention as data-driven approaches, often based on deep learning and complex feature spaces, have become integral to the analysis of large-scale surveys, light curves, and cosmological simulations.
A systematic search conducted on the Web of Science Core Collection (Clarivate Analytics) using the query TS = (“explainable AI” OR “XAI” OR “interpretable machine learning”) AND (“astronomy” OR “astrophysics”) yielded a growing set of recent studies proposing interpretable frameworks for cosmological and astrophysical analysis. Among these, the C3NN: Cosmological Correlator Convolutional Neural Network was introduced as an interpretable architecture designed to reveal physical correlations in cosmological data [
14]. In another work, an interpretable machine-learning framework for modeling high-resolution spectroscopic data was presented, enabling transparent identification of spectral features driving stellar and galactic classifications [
15]. Similarly, another study demonstrated how interpretability can enhance cosmological model selection, combining physical insight with data-driven inference [
16]. In another study, the validation of 301 exoplanets is investigated by means of explainable artificial intelligence [
17]. Another study develops a guide to AI interpretability in discoveries in the field of astronomy [
18].
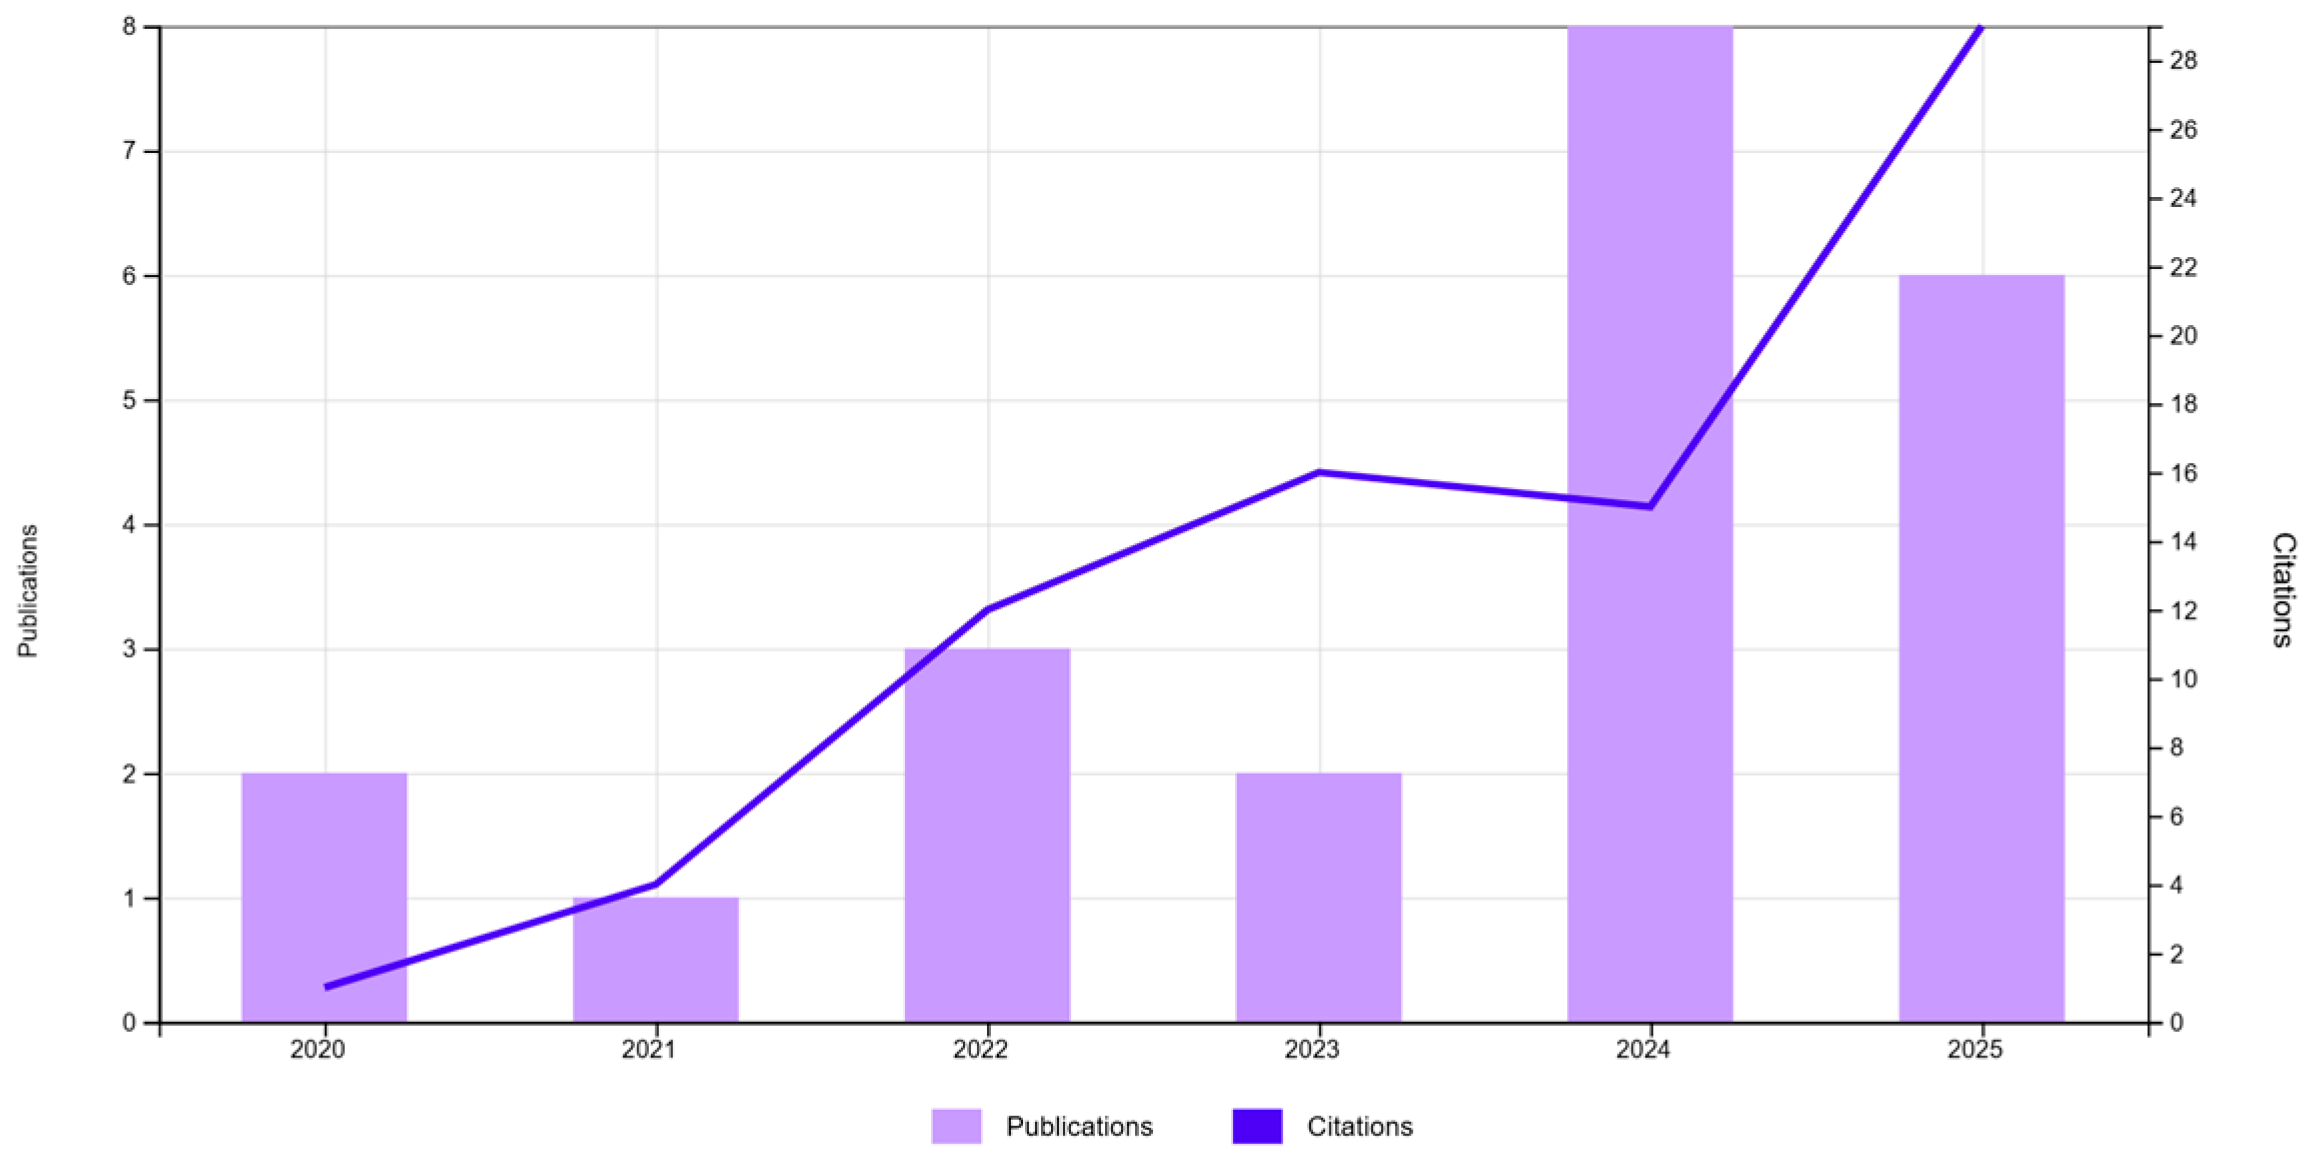
Despite this progress, most XAI applications in astronomy remain model-specific and post hoc, providing local explanations for neural predictions but not integrating uncertainty modeling or fuzzy representations. In this context, our previous study, “Integrating Fuzzy C-Means Clustering and Explainable AI for Robust Galaxy Classification”, contributed a first step toward combining interpretability and uncertainty through the integration of fuzzy clustering with XAI techniques in the Galaxy Zoo dataset [
3] (
Figure 2).
The present work extends that methodological foundation to the analysis of exoplanetary transit signals, integrating it into the FAS-XAI framework as a unified pipeline where fuzzy reasoning, supervised prediction, and XAI-based interpretability converge to support transparent, data-driven scientific decisions.
These works show that XAI has become a valuable tool for revealing physical drivers in complex astrophysical models, yet its use remains limited to post hoc analysis without incorporating fuzzy uncertainty or forming unified decision pipelines.
2.3. XAI and Fuzzy Clustering
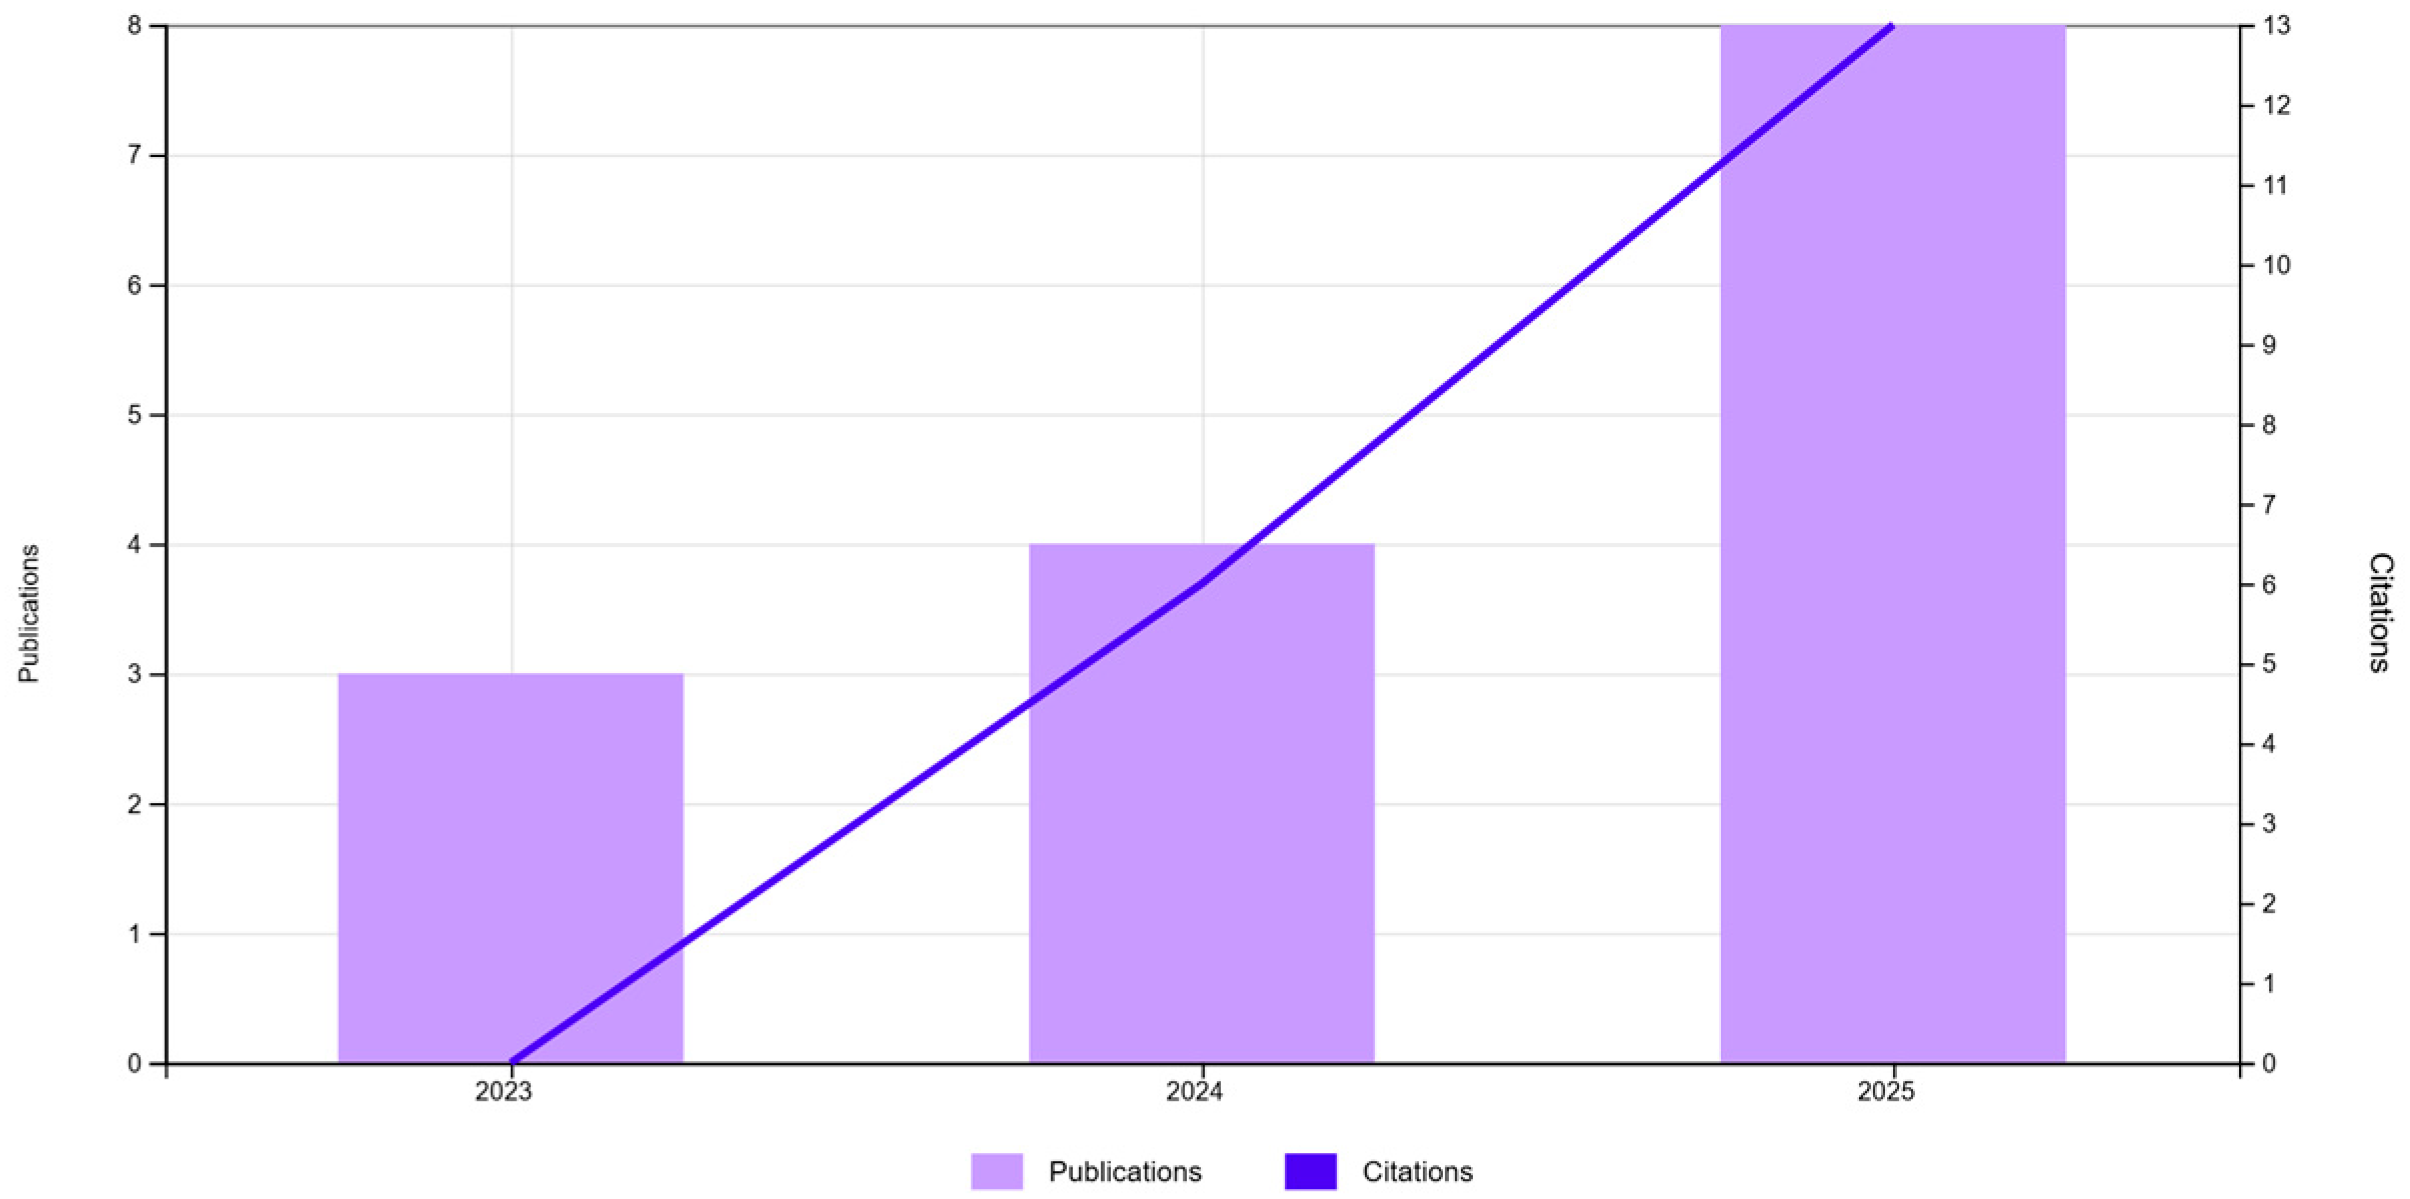
A systematic query TS = (“explainable AI” OR “XAI” OR “interpretable machine learning”) AND (“fuzzy c-means” OR “fuzzy clustering”) in the Web of Science Core Collection (Clarivate Analytics) indicates that the joint use of these techniques is still emerging. Over the last years, we identify 15 publications, with a clear upward trend (notably in 2023–2025) consistent with the increasing interest in interpretable models across scientific and industrial domains. This pattern suggests that the community is beginning to recognize the value of combining soft assignments with transparent explanations.
Methodologically, integration targets a long-standing challenge: astronomical inference is rarely binary. Signals often inhabit regions of uncertainty where class boundaries overlap, and instances exhibit partial memberships across clusters. Fuzzy C-Means (FCM) captures this reality by assigning degrees of membership rather than crisp labels. However, without interpretability, membership values alone do not fully support human decision-making.
Within the FAS-XAI model, we explicitly couple fuzzy clustering with post hoc explainability to explain why an event attains a given membership profile, rank features that drive those memberships, and translate these insights into actionable, human-readable rules. In practical terms, the goal is to make cluster memberships themselves explainable, so that analysts can understand, trust, and contest assignments, bridging the gap between uncertainty modeling and transparent decisions.
Empirically, the literature to date has only sparingly explored this combined route. Most prior works apply fuzzy clustering or XAI in isolation; the joint pipeline remains comparatively underused, though it is gaining relevance as it is applied to diverse sectors. Our contribution leverages this momentum: using FAS-XAI, we apply interpretability within uncertain spaces, clarifying how and to what extent instances participate in multiple clusters, and supporting human-in-the-loop decisions in classification workflows.
Figure 3 above summarizes the temporal trend of publications and citations for the joint query (15 items overall). The most relevant specific studies from WoS are listed in
Table 1 and briefly summarized below.
Among the studies retrieved, no previous work within Astronomy and Astrophysics explicitly integrates FCM with XAI. The only identified contribution applying both techniques in this domain corresponds to the author’s own research, “Integrating Fuzzy C-Means Clustering and Explainable AI for Robust Galaxy Classification” [
3]. In that work, fuzzy clustering was employed to determine the diffuse degrees of membership of galaxies within morphological clusters, followed by the application of XAI techniques to interpret the contribution and relevance of the features shaping each fuzzy partition.
In summary, the reviewed studies show that combining fuzzy clustering with XAI is an emerging but still largely unexplored direction. Existing work demonstrates that this integration improves transparency, feature attribution, and decision support in areas of uncertainty, but no previous study has applied it to the verification of exoplanet transits. This highlights the relevance of the present work, which extends the FCM-XAI paradigm to a new astrophysical environment through the unified FAS-XAI framework.
Finally, this review also confirms that, beyond the methods themselves, Astronomy still lacks integrated, application-oriented frameworks, such as transit-vetting pipelines, anomaly detection, or probabilistic candidate classification, that combine uncertainty modeling with interpretability to support scientific decision-making.
3. Materials and Methods
This section outlines the methodological foundations and implementation details of the FAS-XAI framework as applied to the analysis of exoplanetary transit events. The goal is to develop an explainable, adaptive, and uncertainty-aware approach capable of identifying and interpreting patterns in photometric data where signals display ambiguous or overlapping characteristics.
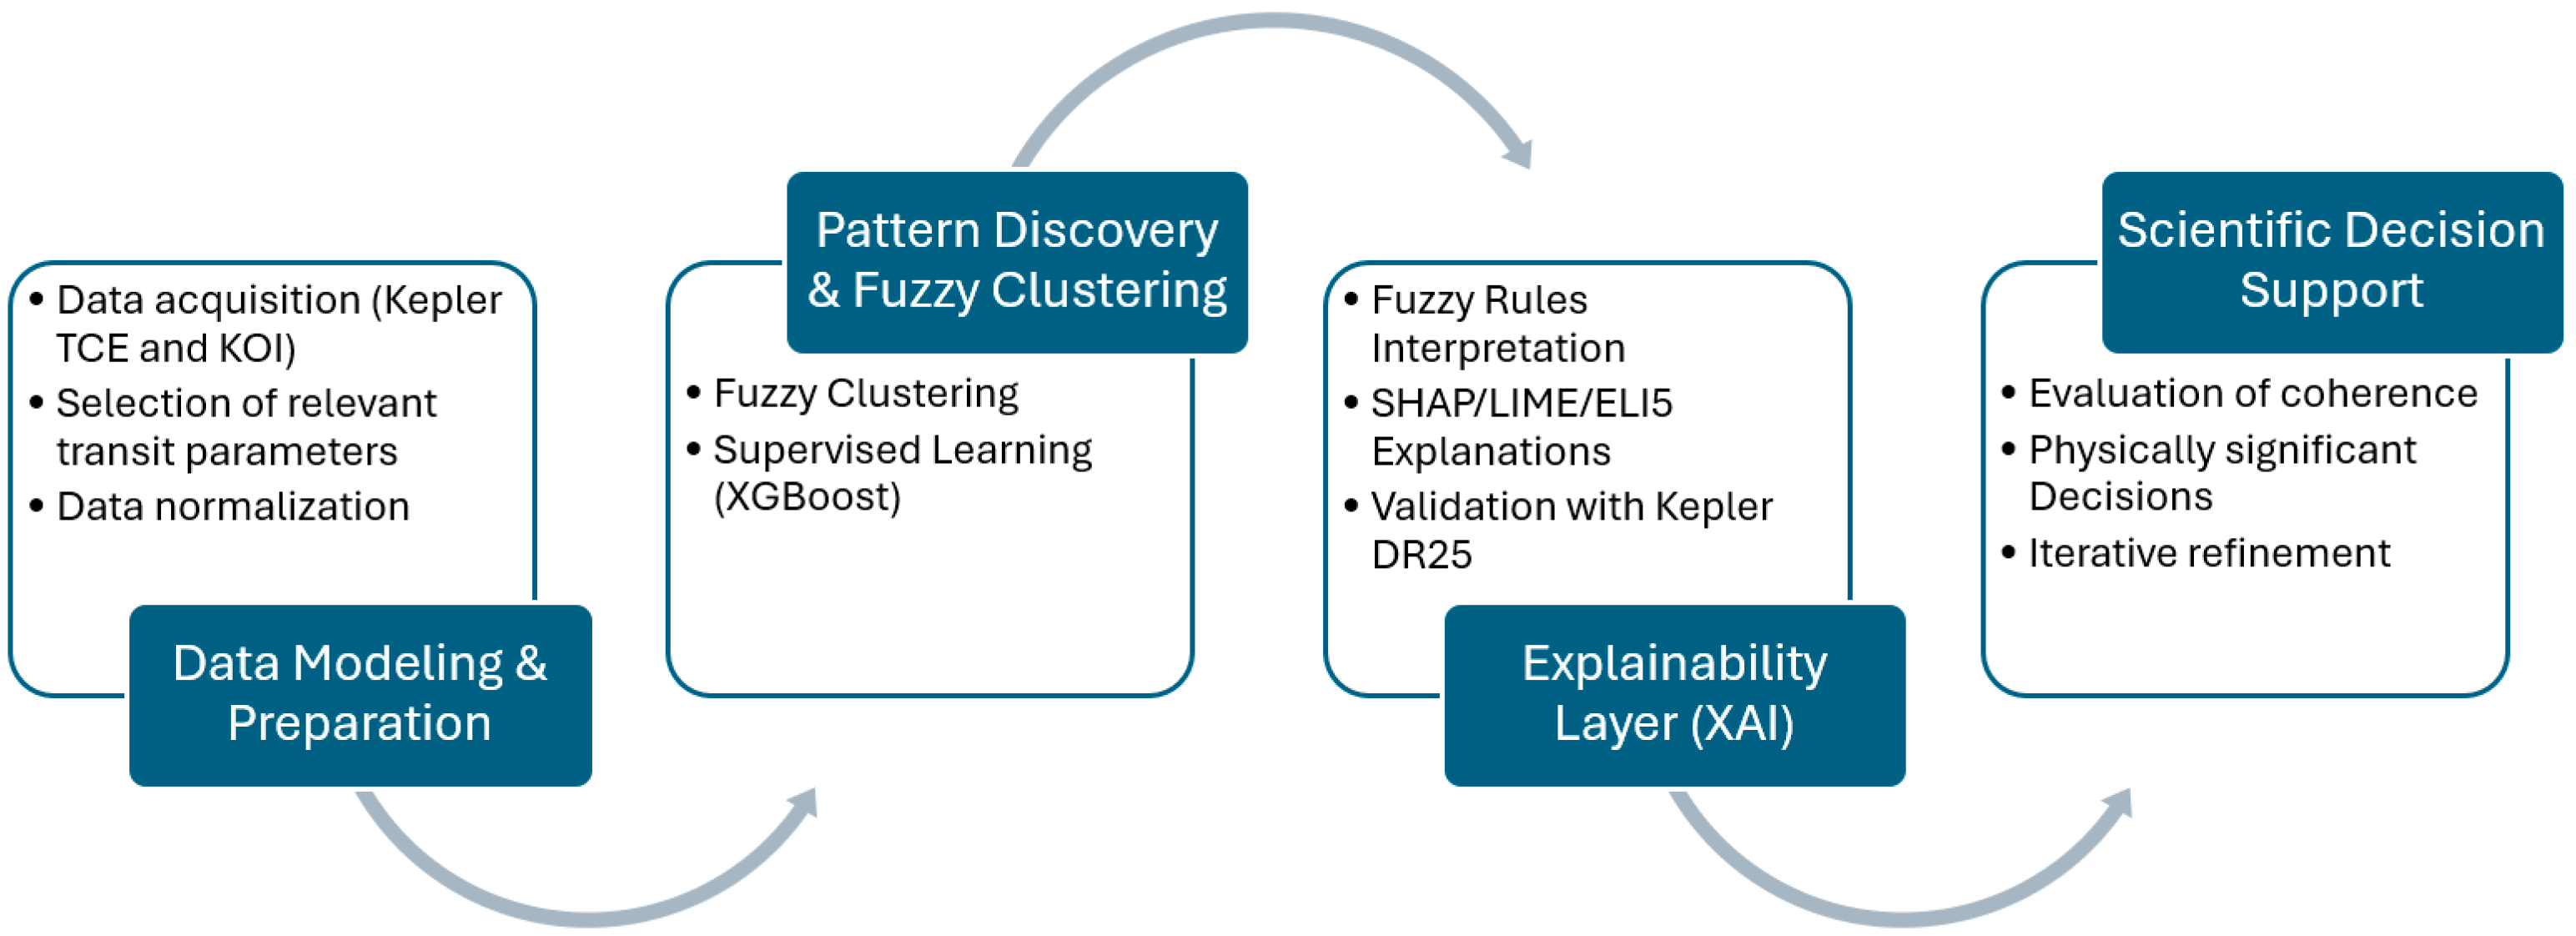
The framework integrates three complementary components: fuzzy clustering, modeling uncertainty and discovering latent structures in the feature space; supervised learning, to predict the probability that a transit signal corresponds to a genuine exoplanet; and XAI, which provides transparent and interpretable explanations of both the clustering behavior and the predictive outcomes (see
Figure 4).
Together, these components form a unified analytical pipeline that supports scientific decision-making under uncertainty, enabling researchers to visualize how photometric and astrophysical parameters drive both cluster membership and model predictions [
26].
3.1. Data Modeling and Preparation
The datasets used in this study were obtained from the NASA Exoplanet Archive (NExScI, Caltech/IPAC), which hosts the final Kepler Data Release 25 (DR25) products. Three complementary catalogs were selected to provide a complete view of the detection, vetting, and astrophysical characterization processes of the Kepler mission: TCE [
1], KOI cumulative catalog [
2], and the Kepler Stellar Properties Catalog (Q1–Q17 DR25) [
7]. All datasets were accessed through the archive’s Table Access Protocol (TAP) service, using structured ADQL queries to extract only the variables relevant to the FAS-XAI framework.
The TCE catalog contains all periodic, transit-like detections that exceeded the 7.1σ threshold in the Transiting Planet Search (TPS) module of the Kepler pipeline. Each entry corresponds to an automatically detected event characterized by parameters such as orbital period, transit duration, depth, model signal-to-noise ratio, and impact parameter. This dataset includes 34,032 records and represents the most comprehensive collection of potential transit detections, encompassing both astrophysical and instrumental signals. It provides the foundation for the fuzzy clustering stage of the FAS-XAI pipeline, allowing the analysis of uncertain and overlapping regimes in the detection space.
The KOI cumulative table represents the next stage of the Kepler vetting process, where TCEs were reviewed through a combination of automated and human analysis. Each KOI entry includes a disposition label (CONFIRMED, CANDIDATE, or FALSE POSITIVE) and refined model parameters. This subset, comprising 8054 vetted entries, was used to link the fuzzy clusters derived from TCE data with expert classifications, providing the ground truth for the supervised learning phase of FAS-XAI. The kepid field was used as the key to align TCE and KOI records, ensuring consistency across both detection levels.
Finally, stellar properties were obtained from the Kepler Stellar Properties Catalog Q1–Q17 DR25, which compiles the final stellar parameters for 200,038 observed targets. The catalog provides physical quantities such as effective temperature (
teff), surface gravity (
logg), stellar radius (
radius), mass (
mass), and apparent magnitude (
kepmag). These stellar attributes serve as an astrophysical context layer within the FAS-XAI framework, allowing model explanations and fuzzy memberships to be validated in terms of physical plausibility rather than statistical separation alone. The specific ADQL queries and corresponding Kepler DR25 datasets used in this study are summarized in
Table 2.
Together, these three datasets form a multilevel structure: the TCE catalog represents raw detections, the KOI catalog provides expert-vetted classifications, and the stellar catalog offers physical context. Their integration enables the FAS-XAI framework to operate coherently across uncertainty modeling, supervised inference, and explainable interpretation, bridging data-driven analysis with astrophysical reasoning.
3.2. Pattern Discovery and Fuzzy Clustering
This stage of the FAS-XAI framework aims to uncover latent patterns within the TCE dataset and to establish a methodological bridge between unsupervised fuzzy clustering and supervised learning.
The process unfolds in three complementary phases: discovery of fuzzy structures in the TCE parameter space; validation of the internal coherence of those structures using XGBoost; and supervised classification of vetted exoplanet dispositions based on the intersection of the TCE and KOI catalogs.
Together, these steps form the analytical core of the framework, bridging uncertainty modeling with predictive interpretability.
3.2.1. Fuzzy C-Means Clustering of TCE Events
The first phase applies FCM clustering to the normalized subset of the TCE DR25 catalog [
1], the variables most relevant to transit geometry and signal strength:
tce_period,
tce_duration,
tce_depth, and
tce_model_snr. The optional inclusion of
tce_impact provides an additional geometric perspective of the transit event.
The algorithm partitions the TCE feature space into
fuzzy clusters by minimizing the objective function:
where
is the degree of membership of event
to cluster
,
is the cluster centroid, and
is the fuzzification coefficient (set to
in this study). The memberships satisfy the normalization condition
.
Internal validity metrics, including the Partition Coefficient (PC) [
27], Fuzzy Silhouette Index (FSI) [
28], and Xie–Beni Index [
29], were used to guide the selection of
and evaluate partition quality.
This fuzzy representation enables a continuous mapping of similarity across the TCE space, capturing transitions and overlaps that are frequent in the Kepler detection process.
Each TCE is thus described not by a single label, but by a vector of fuzzy memberships , reflecting its uncertainty and mixed nature.
3.2.2. Cluster Reliability Assessment via XGBoost
Once the fuzzy partition was obtained, a supervised model based on XGBoost was used to evaluate the reliability and separability of the identified clusters [
30]. This step does not aim to predict astrophysical outcomes but rather to verify the consistency of the fuzzy segmentation.
The model was trained to reproduce the FCM cluster assignments using the same TCE features as inputs (tce_period, tce_duration, tce_depth, tce_model_snr).
The predictive performance of XGBoost was evaluated across three complementary subsets:
All samples: the entire dataset, providing a global view of cluster separability.
Core samples: events with high cluster membership (e.g., ), corresponding to well-defined cluster centers.
Border samples: events with intermediate membership (e.g., ), representing regions of overlap between clusters.
By comparing the predictive consistency across these subsets, the framework assesses the degree of structural coherence in the fuzzy model.
High reproducibility by XGBoost indicates stable and well-separated clusters, whereas performance degradation in border samples reflects the natural uncertainty modeled by fuzzy logic.
This stage therefore provides a supervised validation of unsupervised fuzzy structure, ensuring that the detected regimes in TCE space are both meaningful and learnable.
3.2.3. Supervised Learning on the TCE–KOI Intersection
In the third phase, XGBoost was applied to the intersection of the TCE and KOI catalogs to model the expert-labeled classifications from the Kepler vetting pipeline.
The objective was to determine to what extent the fuzzy and physical features could predict the KOI disposition, that is, whether a transit-like signal corresponds to a FALSE POSITIVE, CANDIDATE, or CONFIRMED planet.
The input features combined three information layers:
Base transit parameters: log_tce_period, log_tce_duration, log_tce_depth, tce_model_snr,
Fuzzy descriptors: fcm_u1, fcm_u2, fcm_u3, and fcm_entropy,
Diagnostic features (optional): grazing_flag, used when available to account for grazing or partial transits.
The target variable
was encoded numerically as:
The model was trained using regularized logistic loss:
where
is the binary cross-entropy and
penalizes model complexity.
The inclusion of fuzzy memberships as input features allows XGBoost to leverage uncertainty as structured information, representing ambiguous detections not as noise but as evidence of transitional behavior between classes. This final stage thus integrates the fuzzy and supervised components into a unified predictive pipeline.
The model output, together with subsequent interpretability analysis (
Section 3.3), enables a transparent exploration of how physical, statistical, and fuzzy factors jointly contribute to exoplanet classification.
3.3. Explainability Layer (XAI)
The third stage of the FAS-XAI framework introduces an explainability layer aimed at interpreting both the relationships revealed by fuzzy clustering and the predictions produced by supervised models.
Its goal is to provide a quantitative and transparent understanding of the factors driving cluster membership and planetary classification, while validating these outcomes against the physical properties of the Kepler DR25 Stellar Properties Catalog.
This layer consists of three main components: Interpretation of fuzzy rules and membership analysis; Model-based explainability (SHAP, LIME, and ELI5) and Astrophysical validation using Kepler DR25.
3.3.1. Interpretation of Fuzzy Rules
Within the fuzzy clustering context, each event is represented by a membership vector , where denotes the degree of membership of event to cluster , and .
From these values, the membership entropy can be defined as a measure of the uncertainty associated with each event:
Low values of indicate crisp assignments (cluster cores), while higher values correspond to transitional or overlapping regions between clusters.
The combined analysis of and enables the derivation of interpretable fuzzy rules, provides a linguistic and interpretable representation of the decision structure learned by the model, bridging the gap between numerical clustering and conceptual reasoning.
3.3.2. Model-Based Explainability (SHAP, LIME, and ELI5)
The SHAP method is grounded in cooperative game theory, where each feature
acts as a player contributing to the model’s prediction [
31].
The Shapley value for feature
and instance
is defined as:
where
is the full set of features and
represents the model restricted to subset
.
Each prediction can then be decomposed additively as:
where
is the expected model output and
represents the contribution of feature
for instance
.
This formulation allows both global interpretation (feature importance) and local interpretation (instance-level contributions).
LIME approximates the original model
locally by an interpretable surrogate model
within a neighborhood
around a specific instance
:
where
quantifies the discrepancy between the original and surrogate models, weighted by proximity
, and
penalizes the complexity of
.
This local optimization provides intuitive, human-readable explanations of individual predictions, particularly in borderline or uncertain cases [
32].
ELI5 decomposes model predictions into per-feature contributions [
33]. For a linear model:
the contribution of feature
is simply:
For ensemble models such as XGBoost, ELI5 traces the decision path across all trees and sums the information gain associated with each feature:
where
is the subset of trees, where feature
contributes to the decision path of instance
.
3.3.3. Astrophysical Validation Using Kepler DR25
To ensure the physical consistency of the explanations generated by FAS-XAI, the model outputs were cross-validated with stellar parameters from the Kepler DR25 Stellar Properties Catalog [
7].
Each TCE event was linked to its host star via the identifier kepid, retrieving key physical attributes from the catalog, the effective temperature , which defines the stellar spectral type and surface radiation; the logarithm of the surface gravity , used to distinguish between main-sequence stars, subgiants, and giants; the stellar radius , essential for estimating the planet-to-star radius ratio and, consequently, the transit depth; the stellar mass , which constrains orbital parameters and transit duration; and the Kepler apparent magnitude , representing stellar brightness in the Kepler photometric band and determining the detectability of transit signals.
The goal of this step is to assess whether the patterns revealed by fuzzy clustering and the XAI-derived explanations correspond to physically meaningful regimes. For instance, the depth of the transit signal can be approximated as:
which allows checking whether signals classified as CONFIRMED correspond to physically plausible values of
.
Similarly, the effective temperature and Kepler magnitude were analyzed to verify that the identified clusters and model explanations are consistent with stellar brightness and detectability constraints.
Through this validation, the FAS-XAI explainability layer ensures that statistical and fuzzy patterns align with astrophysical laws, thereby reinforcing the scientific credibility of the methodology.
3.4. Scientific Decision Support
The final stage of the FAS-XAI framework integrates the analytical and interpretative components into a unified process for scientific decision support. At this stage, the results obtained from fuzzy clustering, supervised classification, and explainability analysis are synthesized to guide coherent, physically meaningful, and transparent reasoning in the evaluation of exoplanet candidates. This phase emphasizes how the model’s interpretability contributes to the iterative refinement of both the analytical framework and the underlying scientific understanding.
The process unfolds across three complementary dimensions: evaluation of coherence, physically significant decisions, and iterative refinement.
3.4.1. Evaluation of Coherence
In this step, the internal coherence of the FAS-XAI framework is assessed by comparing the structural information derived from fuzzy clustering with the predictive outcomes of the supervised model.
The goal is to verify that the clusters identified in the TCE parameter space correspond to meaningful and distinguishable regimes within the KOI classifications.
A high degree of alignment between diffuse belongings and model predictions indicates that the learned structures are consistent from both a statistical and astrophysical point of view.
This evaluation is not limited to numerical accuracy but extends to the interpretive agreement among the XAI techniques, SHAP, LIME, and ELI5, applied to cluster-membership prediction, and SHAP specifically for the supervised classification based on the combined TCE + KOI dataset.
When the same variables consistently emerge as relevant across fuzzy clustering, predictive modeling, and interpretability analysis, the framework achieves a stronger epistemic coherence, one in which data-driven segmentation aligns with scientific reasoning.
3.4.2. Physically Significant Decisions
Once the coherence between clustering and prediction has been established, the results are interpreted in the context of physical and astrophysical meaning.
The FAS-XAI framework does not aim to produce purely statistical classifications; rather, it seeks to support decisions that are scientifically interpretable and consistent with the physical principles of planetary transit detection.
By combining fuzzy memberships, predictive probabilities, and explainability outputs, each event can be evaluated holistically: whether its cluster association, model confidence, and SHAP feature contributions correspond to physically plausible transit parameters.
This process allows scientists to distinguish between statistically ambiguous cases and those that have a consistent astrophysical interpretation reinforcing confidence in true planetary detections while identifying potential false positives. In this way, decision-making transcends numerical performance metrics and becomes a scientific reasoning process, where interpretability and physical plausibility converge.
3.4.3. Iterative Refinement
The FAS-XAI framework is conceived as an iterative and adaptive methodology. Insights derived from the explainability layer and astrophysical validation are used to refine the fuzzy clustering, the supervised learning model, or both.
This may involve adjusting clustering parameters, refining the selection of features, retraining models with modified input representations, or incorporating additional astrophysical variables to enhance interpretability.
Through this continuous feedback loop, the framework evolves toward greater stability, transparency, and scientific coherence.
Each iteration contributes to improving both model performance and explanatory depth, ensuring that future analyses become more aligned with physical understanding and observational constraints.
4. Results
This section presents the experimental results obtained through the implementation of the FAS-XAI framework applied to exoplanet detection using data from the Kepler mission.
The analysis follows the dual-track structure described in the methodology: the first track focuses on unsupervised fuzzy clustering of the TCE dataset to identify latent structures in the transit parameter space, while the second part addresses supervised classification of KOI to evaluate the predictive alignment between data-driven clusters and curated astrophysical labels.
In both tracks, XAI techniques are employed to interpret model behavior, quantify the relevance of key features, and assess the coherence between computational patterns and astrophysical reasoning.
The final stage integrates these results into a scientific decision-support layer, evaluating the consistency of the inferred structures with physically meaningful criteria derived from the Kepler DR25 stellar catalog.
4.1. Fuzzy Clustering Results
4.1.1. Variable Selection and Correlation Analysis
Before performing fuzzy clustering, a subset of physically meaningful and statistically independent parameters was selected from the TCE catalog.
The variables retained:
tce_period,
tce_duration,
tce_depth, and
tce_model_snr, describe key aspects of the detected transit signal: periodicity, duration, depth, and signal-to-noise ratio (SNR). The
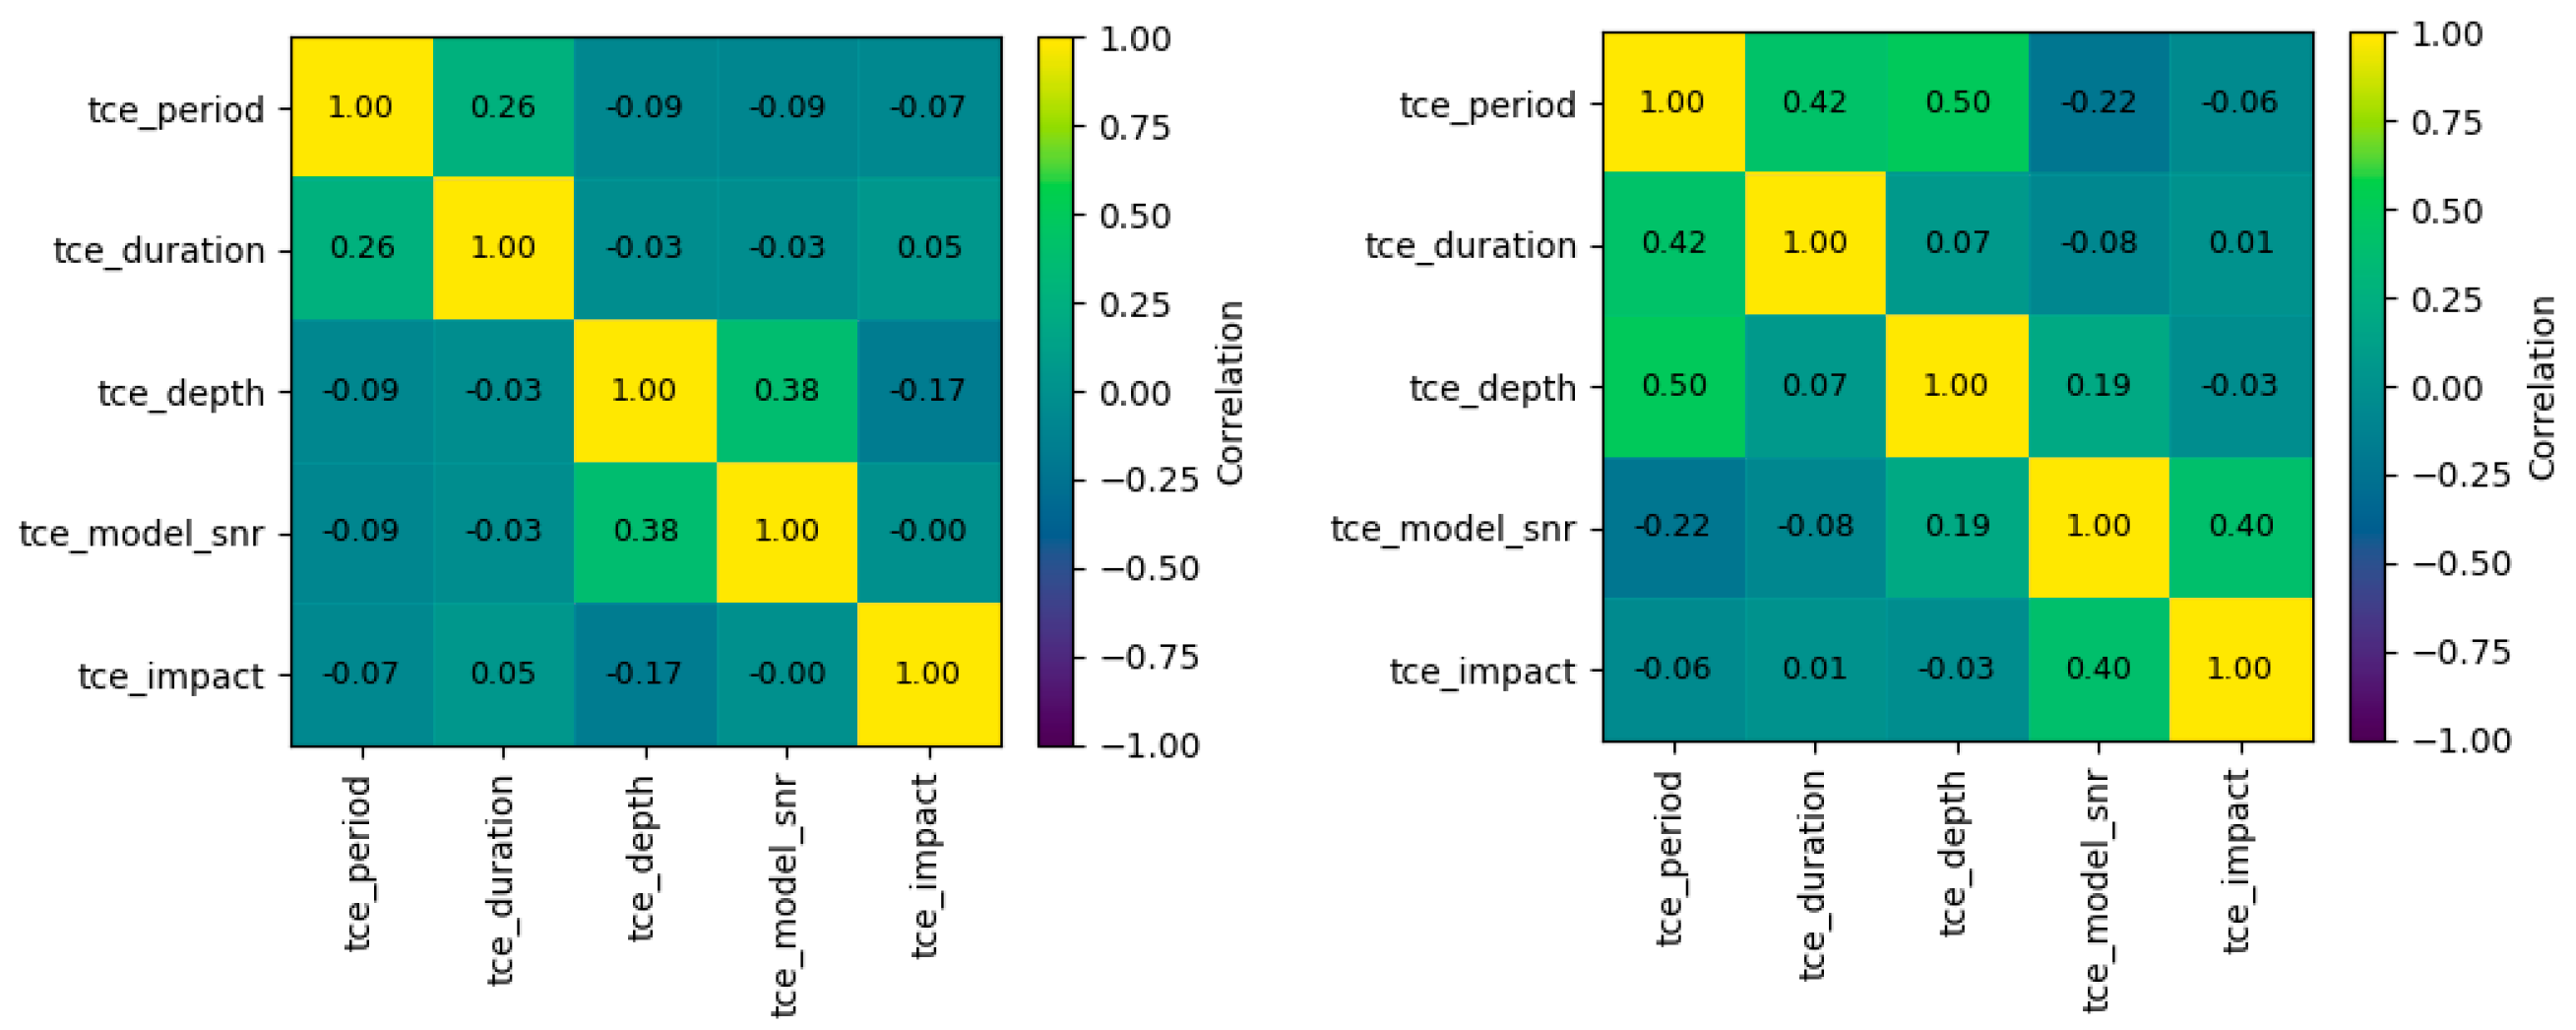
tce_impact parameter was also examined as an auxiliary variable, given its geometric relevance in distinguishing grazing or partial transits. To assess inter-variable relationships and ensure an appropriate representation for clustering, both Pearson (linear) and Spearman (rank-based) correlation matrices were computed (
Figure 5).
Overall, correlations among the selected features were found to be moderate to low, supporting their joint inclusion as complementary descriptors of transit morphology. The most significant relationships appeared between period–depth and period–duration, consistent with physical expectations that longer orbital periods tend to produce longer and deeper transit events.
Given the skewed distribution of several parameters, particularly
tce_period and
tce_depth, a logarithmic transformation (
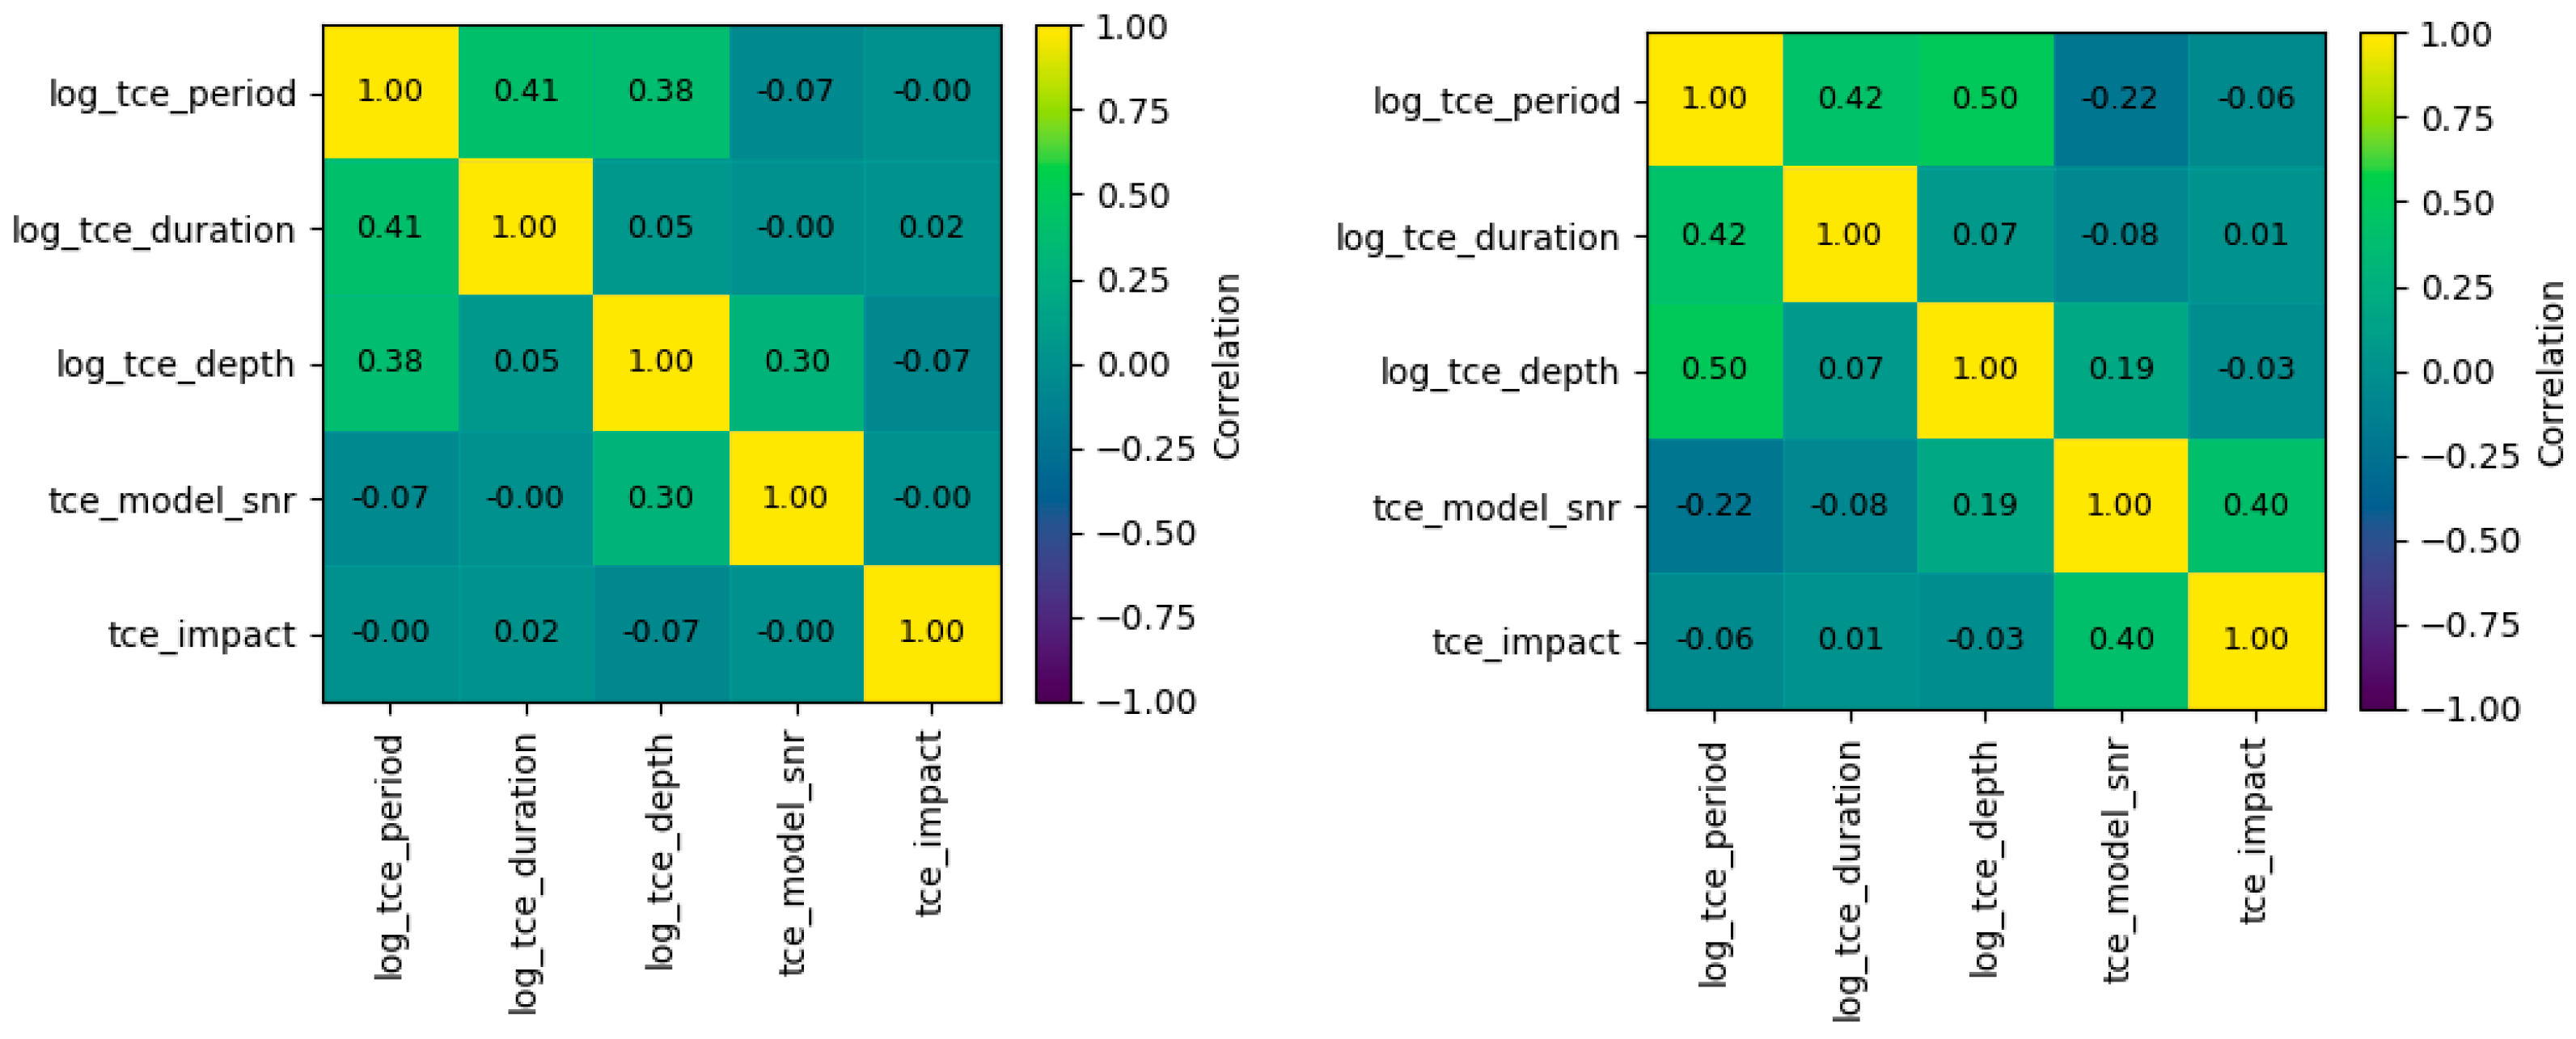
log10) was applied to stabilize variance and linearize relationships. Post-transformation correlation matrices (
Figure 6) confirmed a clearer structure, with enhanced monotonic correlations and reduced outlier sensitivity.
Table 3 summarizes the variation in Pearson and Spearman coefficients before and after the transformation.
Pearson and Spearman correlations were both computed because they reveal different forms of dependence among the TCE parameters. Pearson captures linear relationships, while Spearman is sensitive to monotonic trends and remains robust to strong skewness and outliers, common characteristics in Kepler transit parameters.
The comparison between both metrics allowed us to verify that the selected features are not dominated by redundant linear dependencies, and the logarithmic transformation stabilizes the relationships, making Pearson correlations more representative after rescaling. Therefore, this dual evaluation provides practical justification for the feature preprocessing options used prior to clustering, ensuring that the variables retain complementary information and are suitable for FCM segmentation.
4.1.2. Fuzzy Clustering and Membership Analysis
The fuzzy partition of the Threshold Crossing Events (TCE) parameter space was performed using the FCM algorithm. The optimal number of clusters was determined by evaluating a set of internal validity indices, including the Fuzzy Partition Coefficient (FPC), Xie–Beni Index (XB), and Silhouette Score (
Table 4). These metrics jointly assess compactness, separability, and overall partition quality.
Among the tested configurations, k = 3 offered the most interpretable partition and stable membership structure, consistent with the lowest deterioration in XB and a still-acceptable FPC value (0.5585). The silhouette score (0.2983) indicates moderate but meaningful separation between overlapping fuzzy regions, reflecting the continuous nature of astrophysical transit signals.
The physical centroids corresponding to the three fuzzy clusters (
Table 5) were obtained by transforming the normalized and log-scaled parameters back to their original physical units. These centroids represent the typical regimes identified within the TCE feature space.
The clustering results reveal a structured organization of the TCE dataset.
Cluster C0 groups short-period, shallow, low-SNR events, typically corresponding to weak or spurious detections.
Cluster C1 encompasses long-period, moderate-SNR signals with extended durations, representing transit-like events potentially linked to planetary candidates.
Cluster C2 contains medium-period, high-SNR detections with pronounced depths, characteristic of strong signals, possibly confirmed planets or eclipsing binaries.
The Fuzzy Partition Coefficient (FPC = 0.5585) and Partition Entropy (PE = 0.763) quantify the uncertainty of assignments, while the Xie–Beni Index (XB = 0.496) indicates a compact and moderately well-separated configuration.
These results confirm that the fuzzy approach successfully captures the inherent ambiguity in transit detections, where overlapping boundaries between physical classes are expected due to instrumental noise and astrophysical variability.
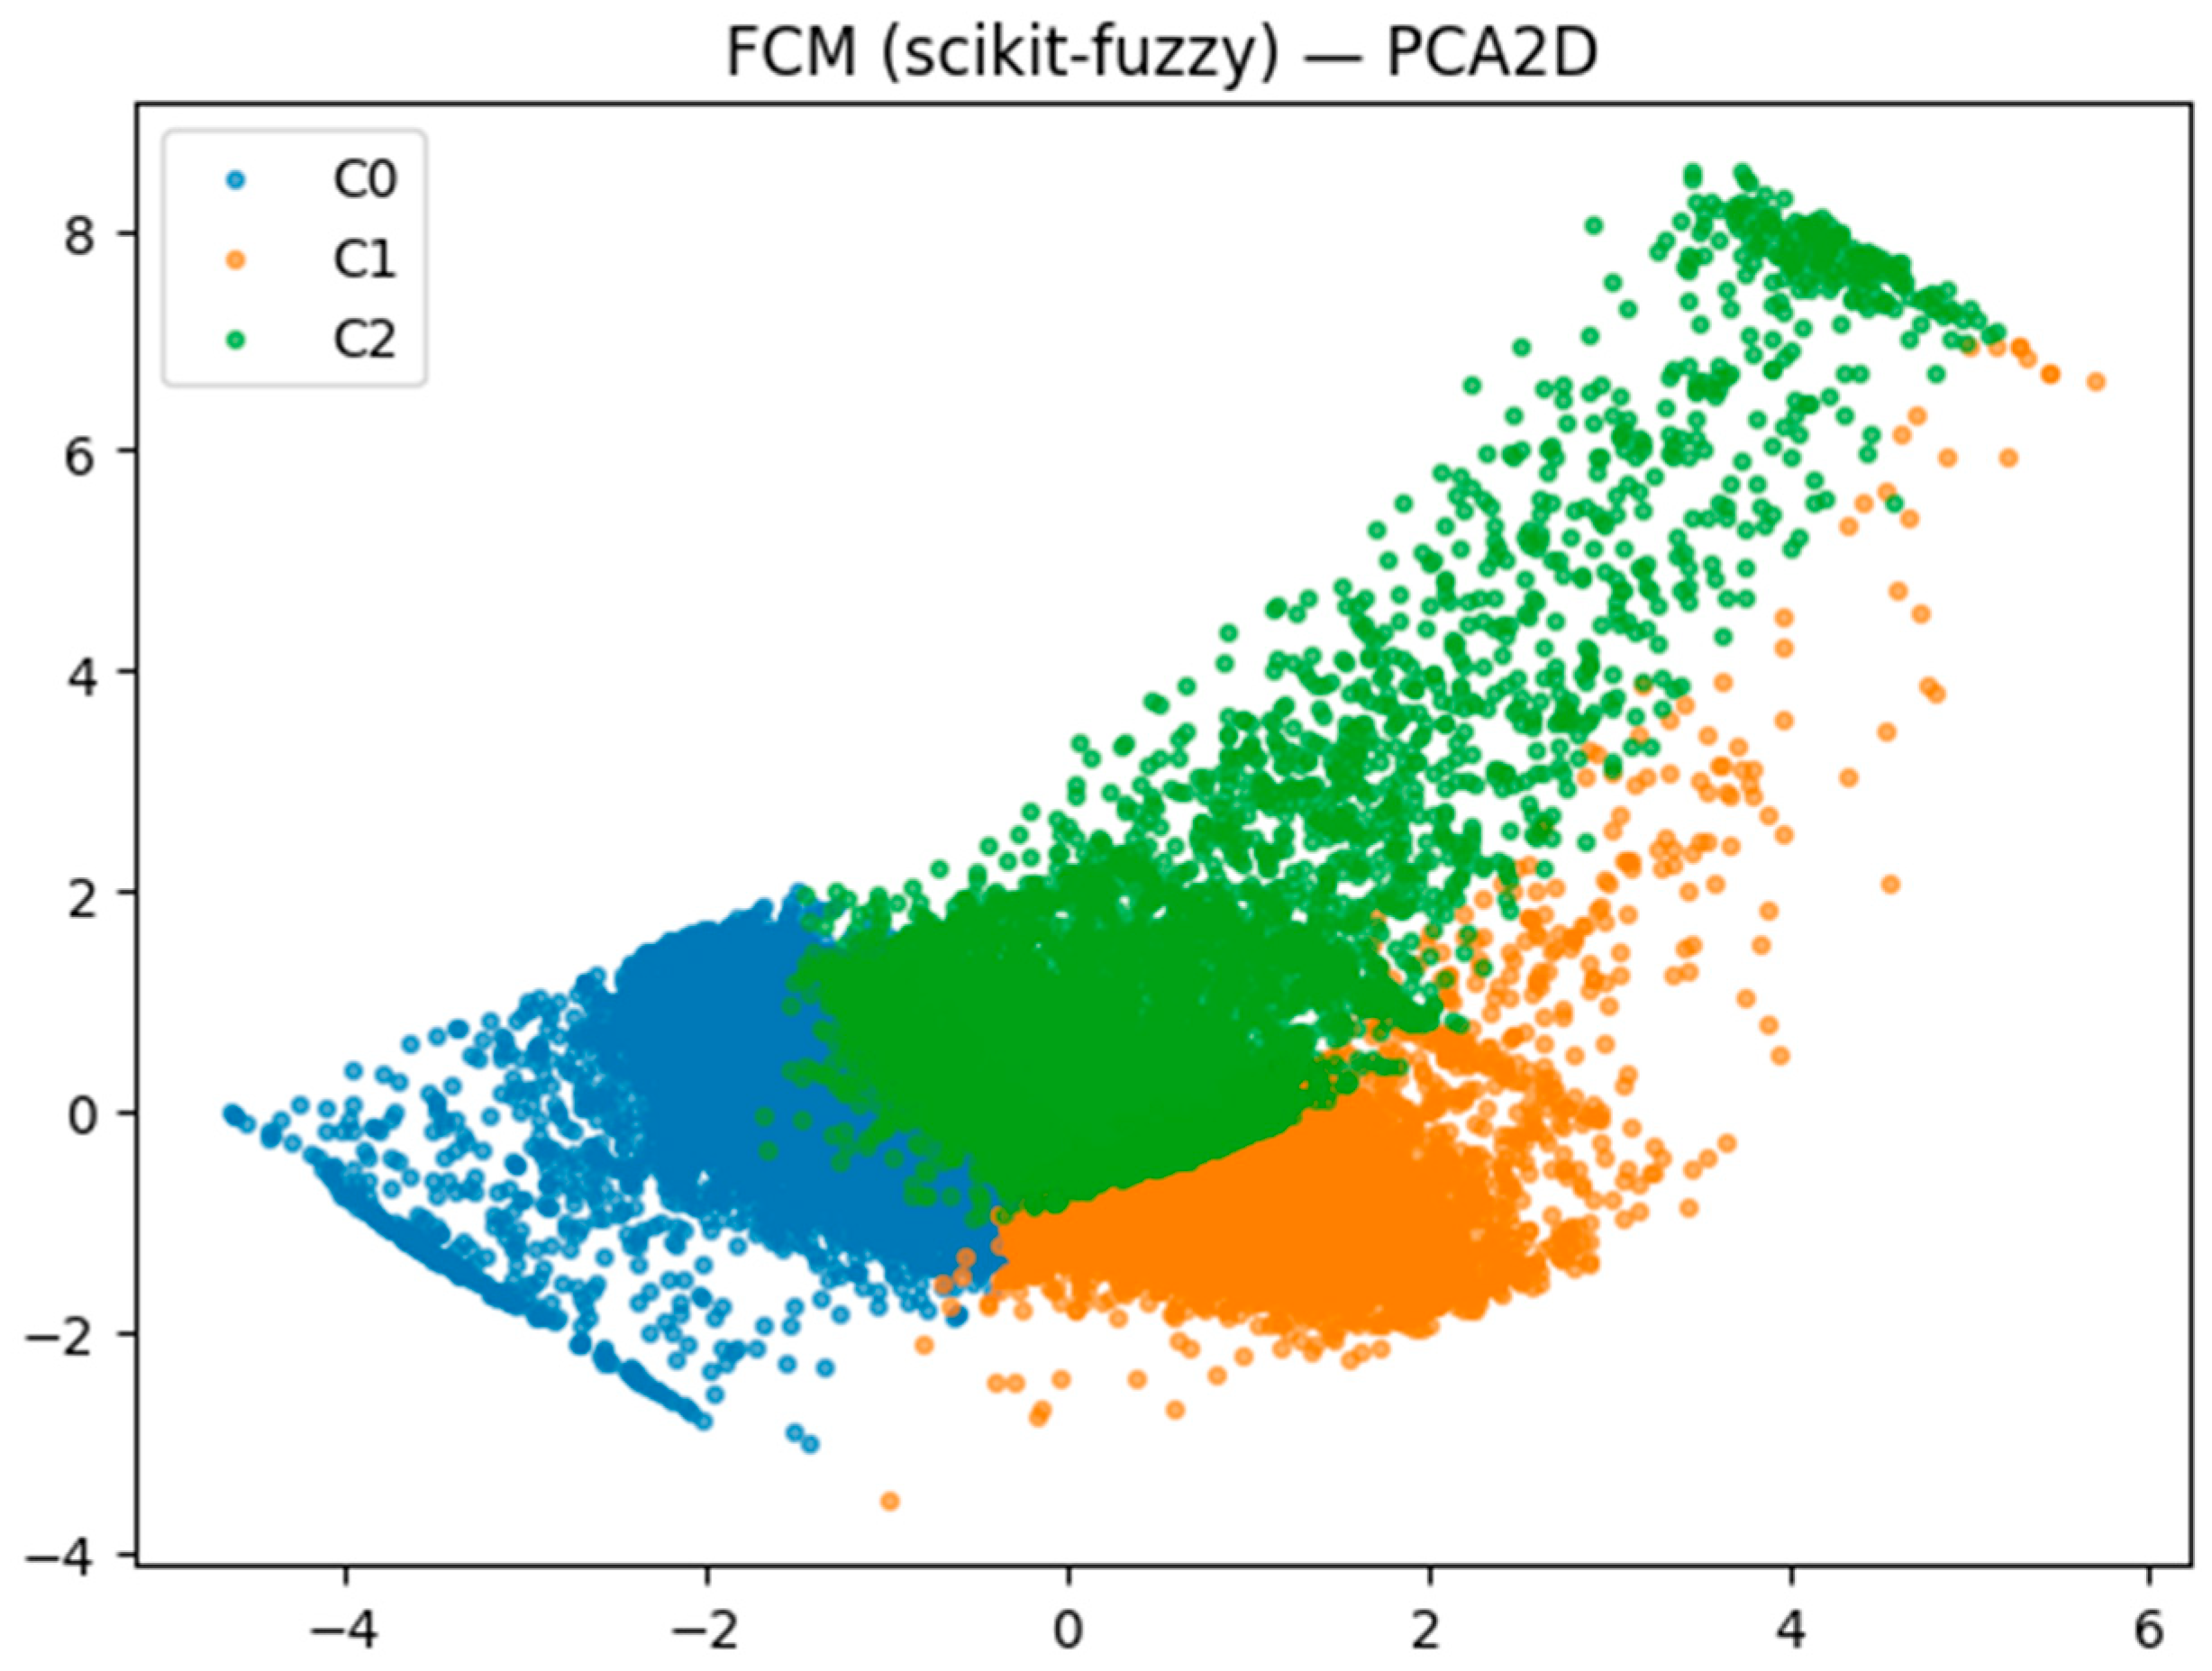
The 2D projection of memberships via Principal Component Analysis (PCA) (
Figure 7) illustrates the spatial continuity between clusters, with soft boundaries where objects exhibit intermediate membership degrees.
This behavior reinforces the fuzzy model’s ability to represent the probabilistic nature of the Kepler detection pipeline, where many borderline cases exist between true planetary candidates and false positives.
A supplementary test including the tce_impact parameter was also performed to evaluate its potential influence on the fuzzy partition. The results show only slight variations in cluster validity indices, FPC = 0.5585 vs. 0.4900, XB = 0.4962 vs. 0.6848, and Silhouette = 0.2983 vs. 0.2700, indicating no substantial improvement in compactness or separability when incorporating the impact parameter.
Consequently, the final configuration retained the four most informative variables, period, duration, depth, and model SNR, as they adequately describe the organization of the transit signal space.
To assess the physical coherence of the fuzzy clusters, a grazing flag was introduced to distinguish between central and limb-crossing transits, derived from the tce_impact parameter.
This indicator was defined using two thresholds: a soft threshold (SOFT_THR = 0.80), identifying moderately grazing configurations, and a hard threshold (HARD_THR = 0.85), corresponding to clearly limb-crossing geometries near the stellar edge.
Although the inclusion of this flag did not significantly modify the overall cluster structure, internal analysis revealed physically consistent patterns: grazing systems tend to exhibit shorter durations, higher depths, and larger signal-to-noise ratios, corresponding to stronger but less frequent transits.
These results confirm that the fuzzy clusters capture coherent astrophysical regimes, where membership entropy correlates with the geometric uncertainty of the transit configuration.
4.2. Validation of Fuzzy Clusters Using XGBoost
To quantitatively validate the fuzzy clustering structure, an XGBoost classifier was trained to reproduce the fuzzy cluster assignments obtained from the FCM model.
The features were expressed in logarithmic form, log_tce_period, log_tce_duration, and log_tce_depth, while tce_model_snr remained in its original scale. This logarithmic transformation was applied to compress the wide dynamic range of the transit parameters, linearize their multiplicative relationships (such as between duration and period), and improve both model stability and interpretability by enhancing feature correlation and separability within the data.
Three evaluation subsets were considered:
All: includes all transit events (complete dataset).
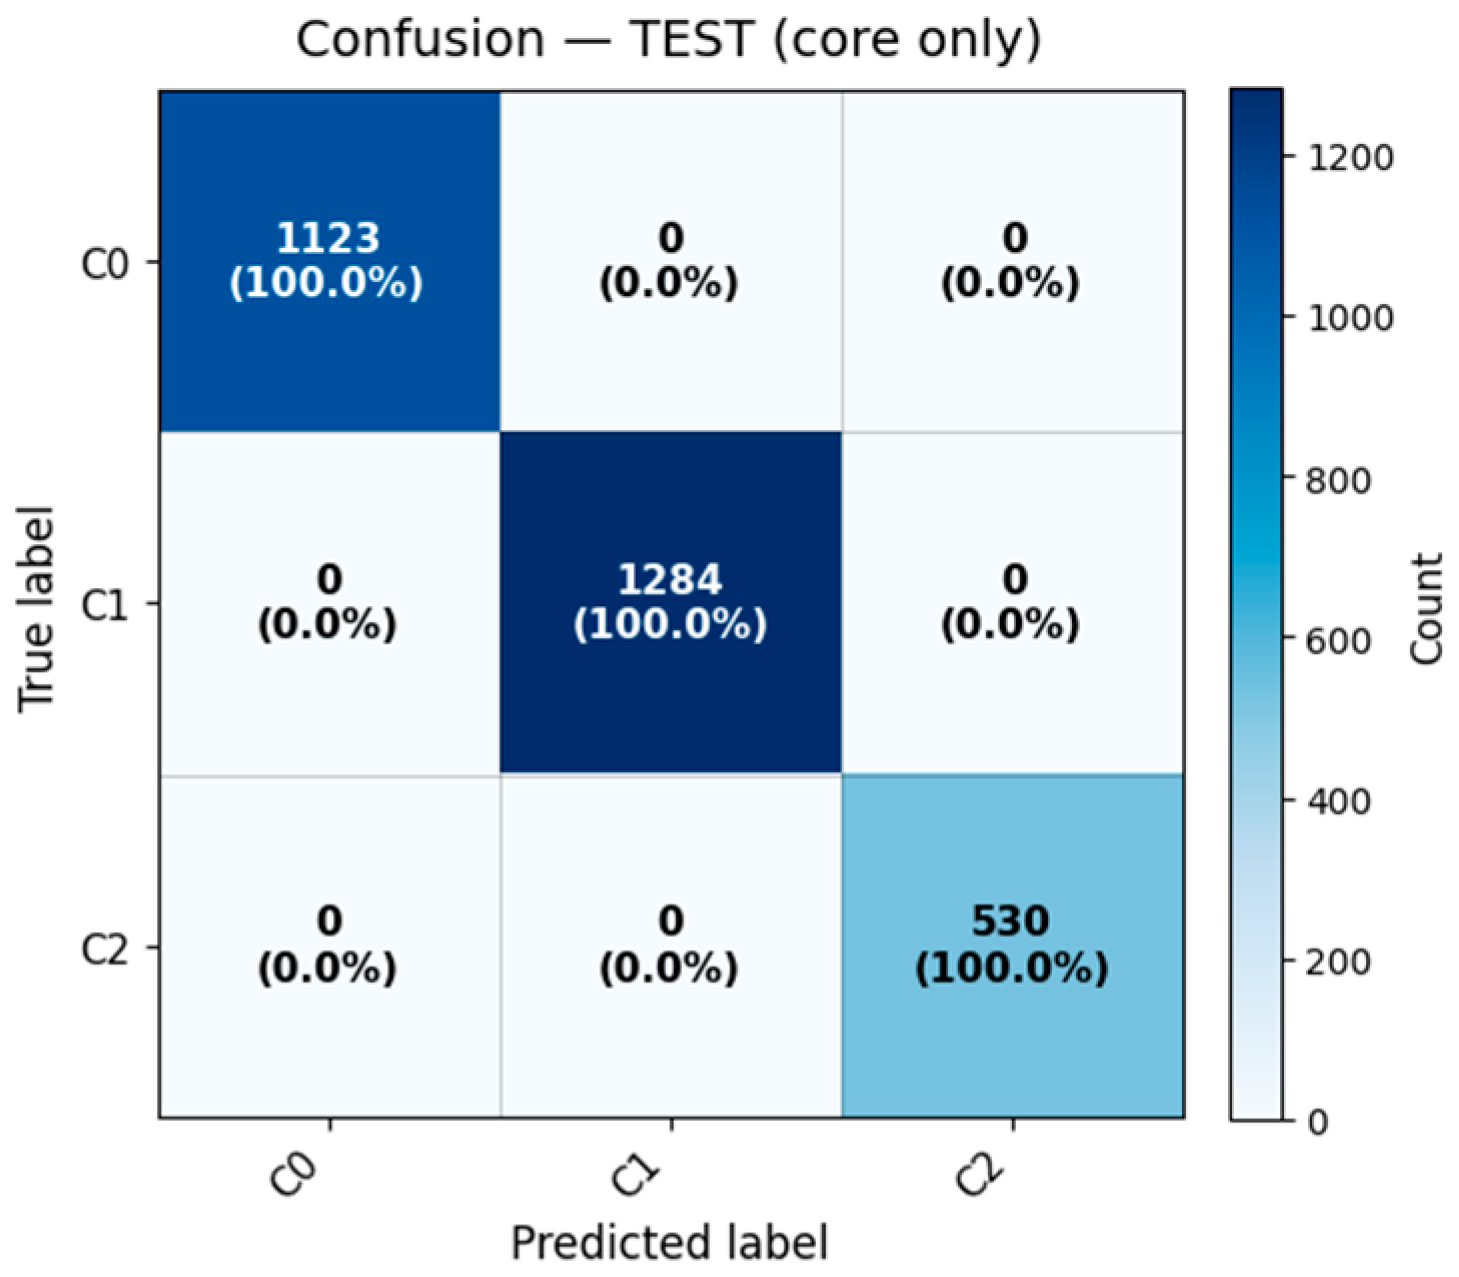
Core only: events with high membership degree (uₘₐₓ ≥ 0.7), representing the cluster centers.
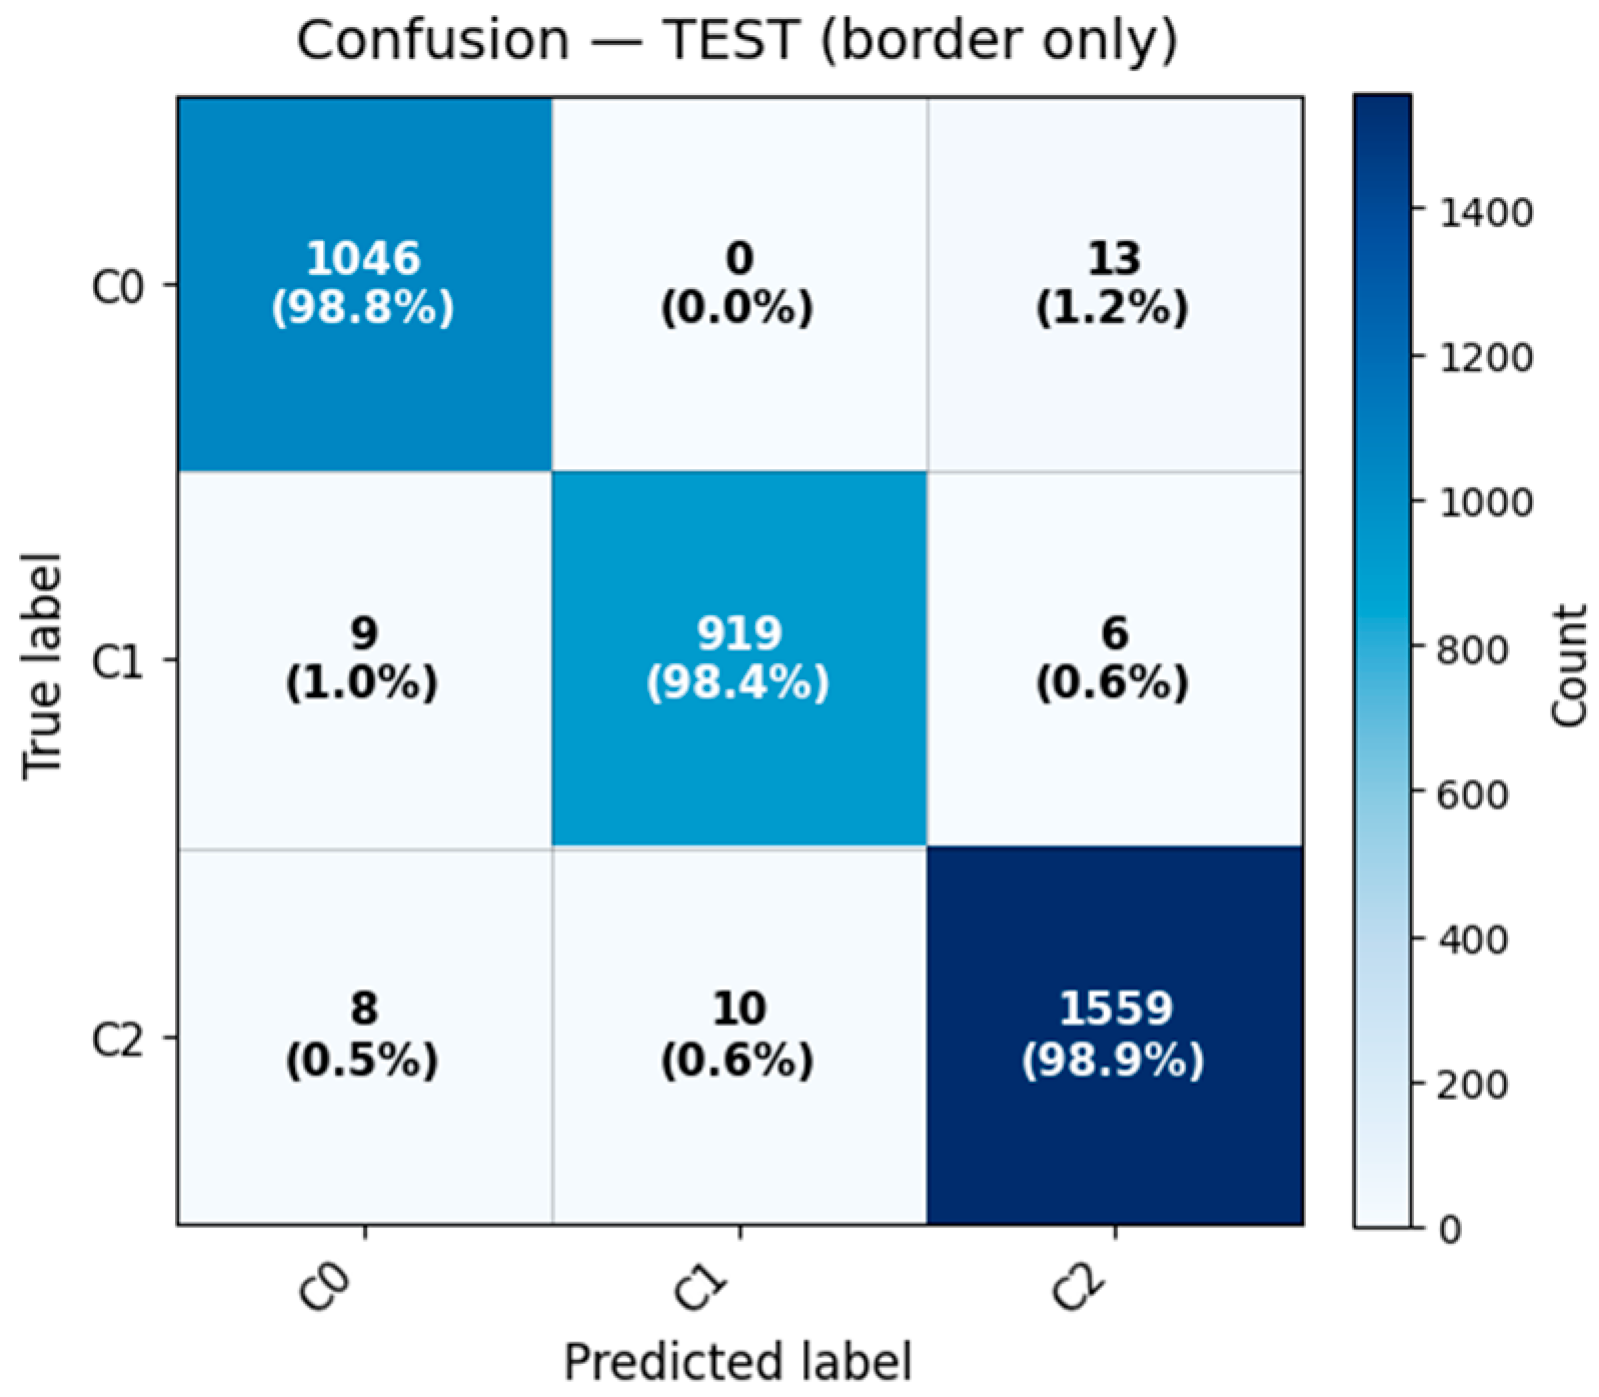
Border only: events with intermediate membership (
uₘₐₓ < 0.7), corresponding to transition regions between clusters (
Table 6).
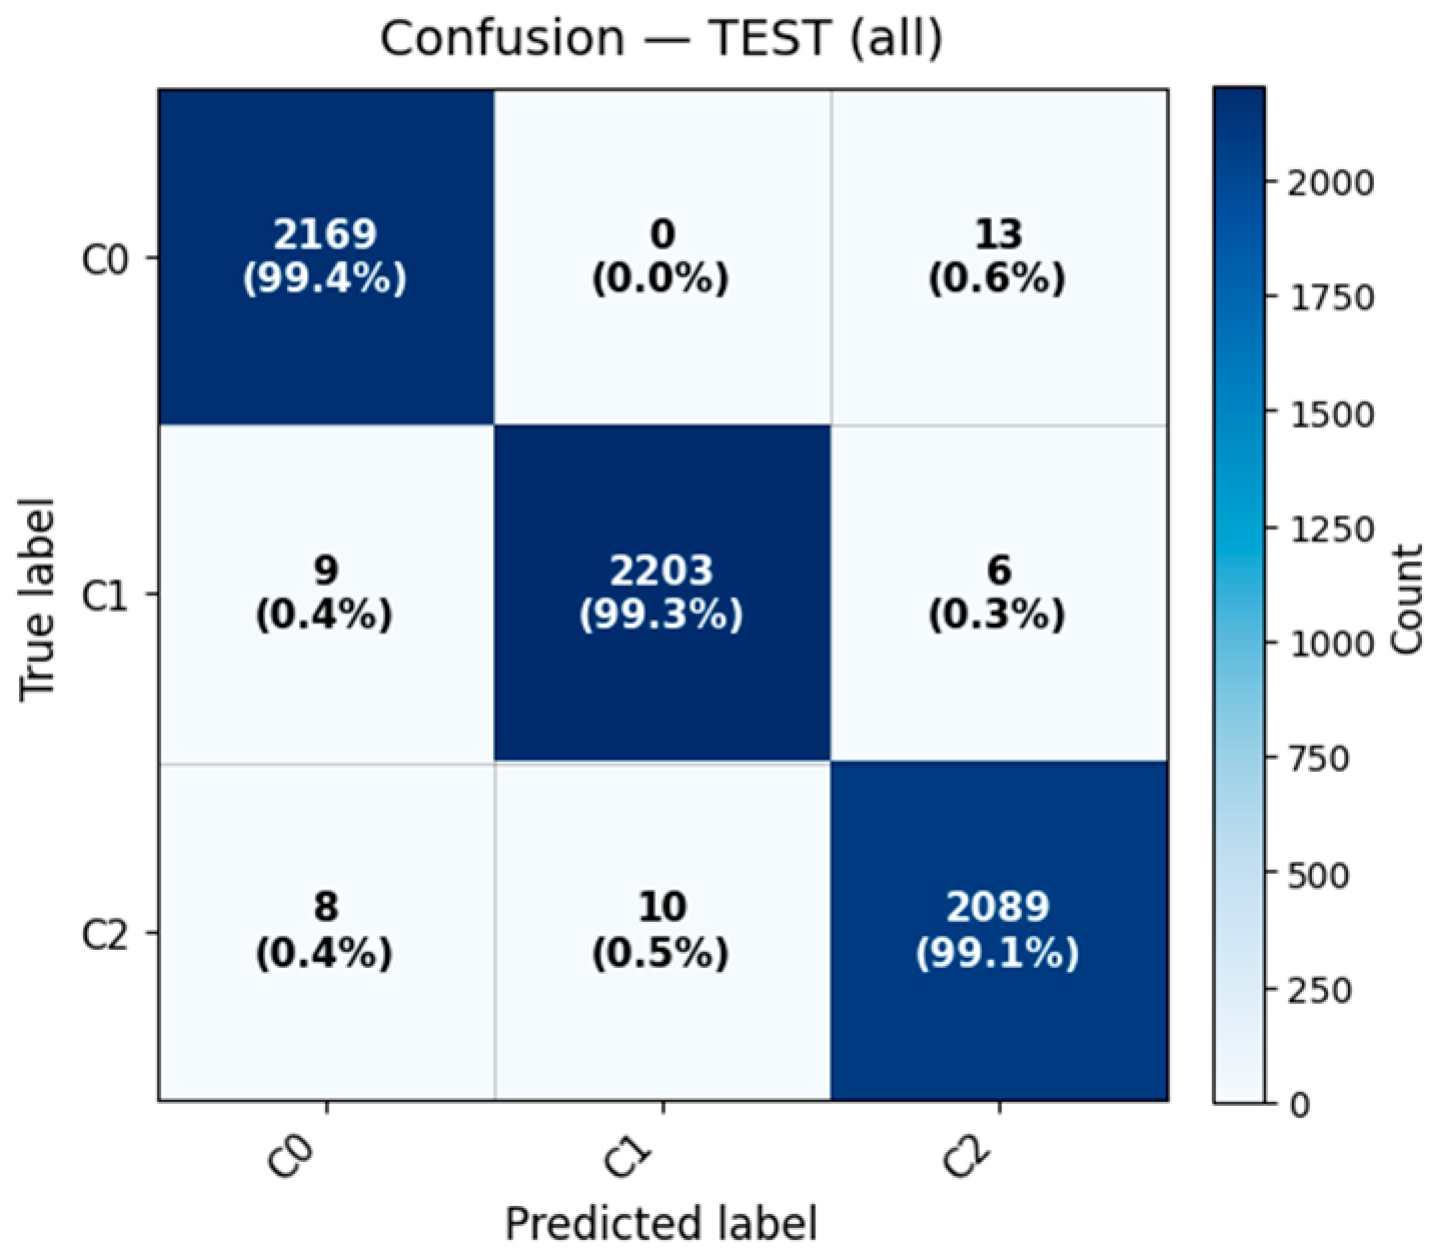
The results indicate that the supervised model reproduces the fuzzy segmentation with exceptional precision across all subsets. Perfect performance in the core subset confirms the internal separability of the clusters, while the slight reduction in border regions (≈1–2%) is consistent with the expected ambiguity near cluster overlaps.
Figure 8,
Figure 9 and
Figure 10 show the confusion matrices for the three subsets (all, core only, border only), both in raw counts and normalized form. Each figure demonstrates the almost perfect agreement between the predicted and true FCM labels, even in the most ambiguous regions.
To assess “soft” consistency, the XGBoost probability outputs
were compared to the fuzzy membership degrees
on the test set:
These results show a high correlation (r ≈ 0.89) between the probabilistic predictions and fuzzy memberships, confirming that the supervised model captures not only the crisp classification but also the uncertainty structure of the fuzzy partition.
The combined quantitative and visual results demonstrate that:
The fuzzy clusters are statistically coherent and reproducible.
The supervised model captures both the core structure and the fuzzy transitions between clusters.
The XGBoost–FCM consistency validates the robustness of the fuzzy partition stage before applying the final XAI interpretability analysis.
4.3. Explainability Analysis (SHAP, LIME, ELI5)
The third stage of the analysis focuses on interpreting the fuzzy clustering structure through XAI methods applied to the supervised model trained for cluster validation.
4.3.1. SHAP Analysis of Cluster Membership
To analyze the internal structure of the fuzzy clusters, SHAP values were computed on the XGBoost model trained to reproduce FCM memberships.
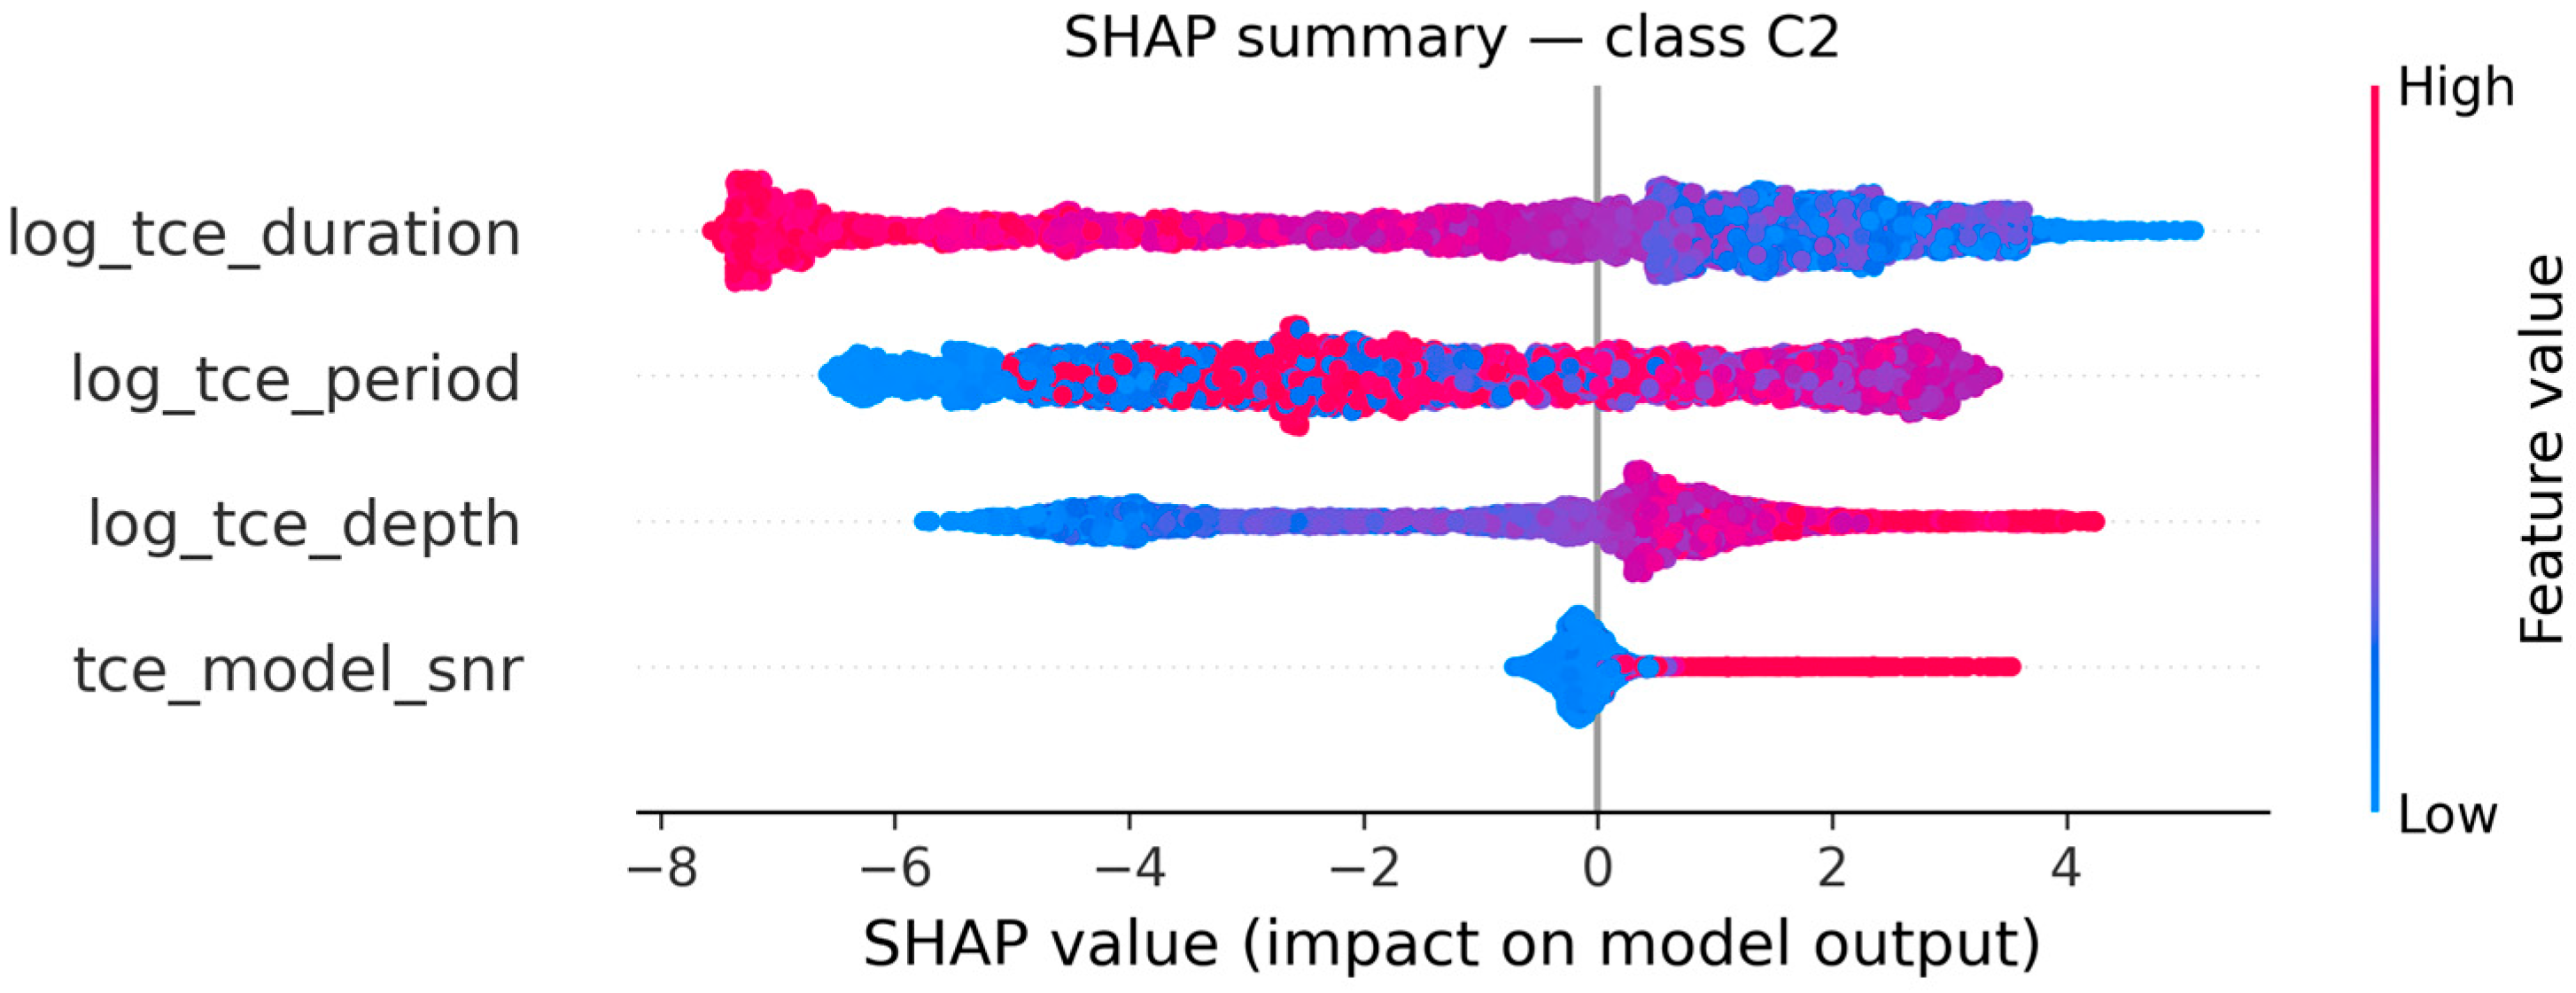
The SHAP summary plots for each fuzzy cluster (C0, C1, C2) provide a detailed view of the contribution and direction of influence of each feature.
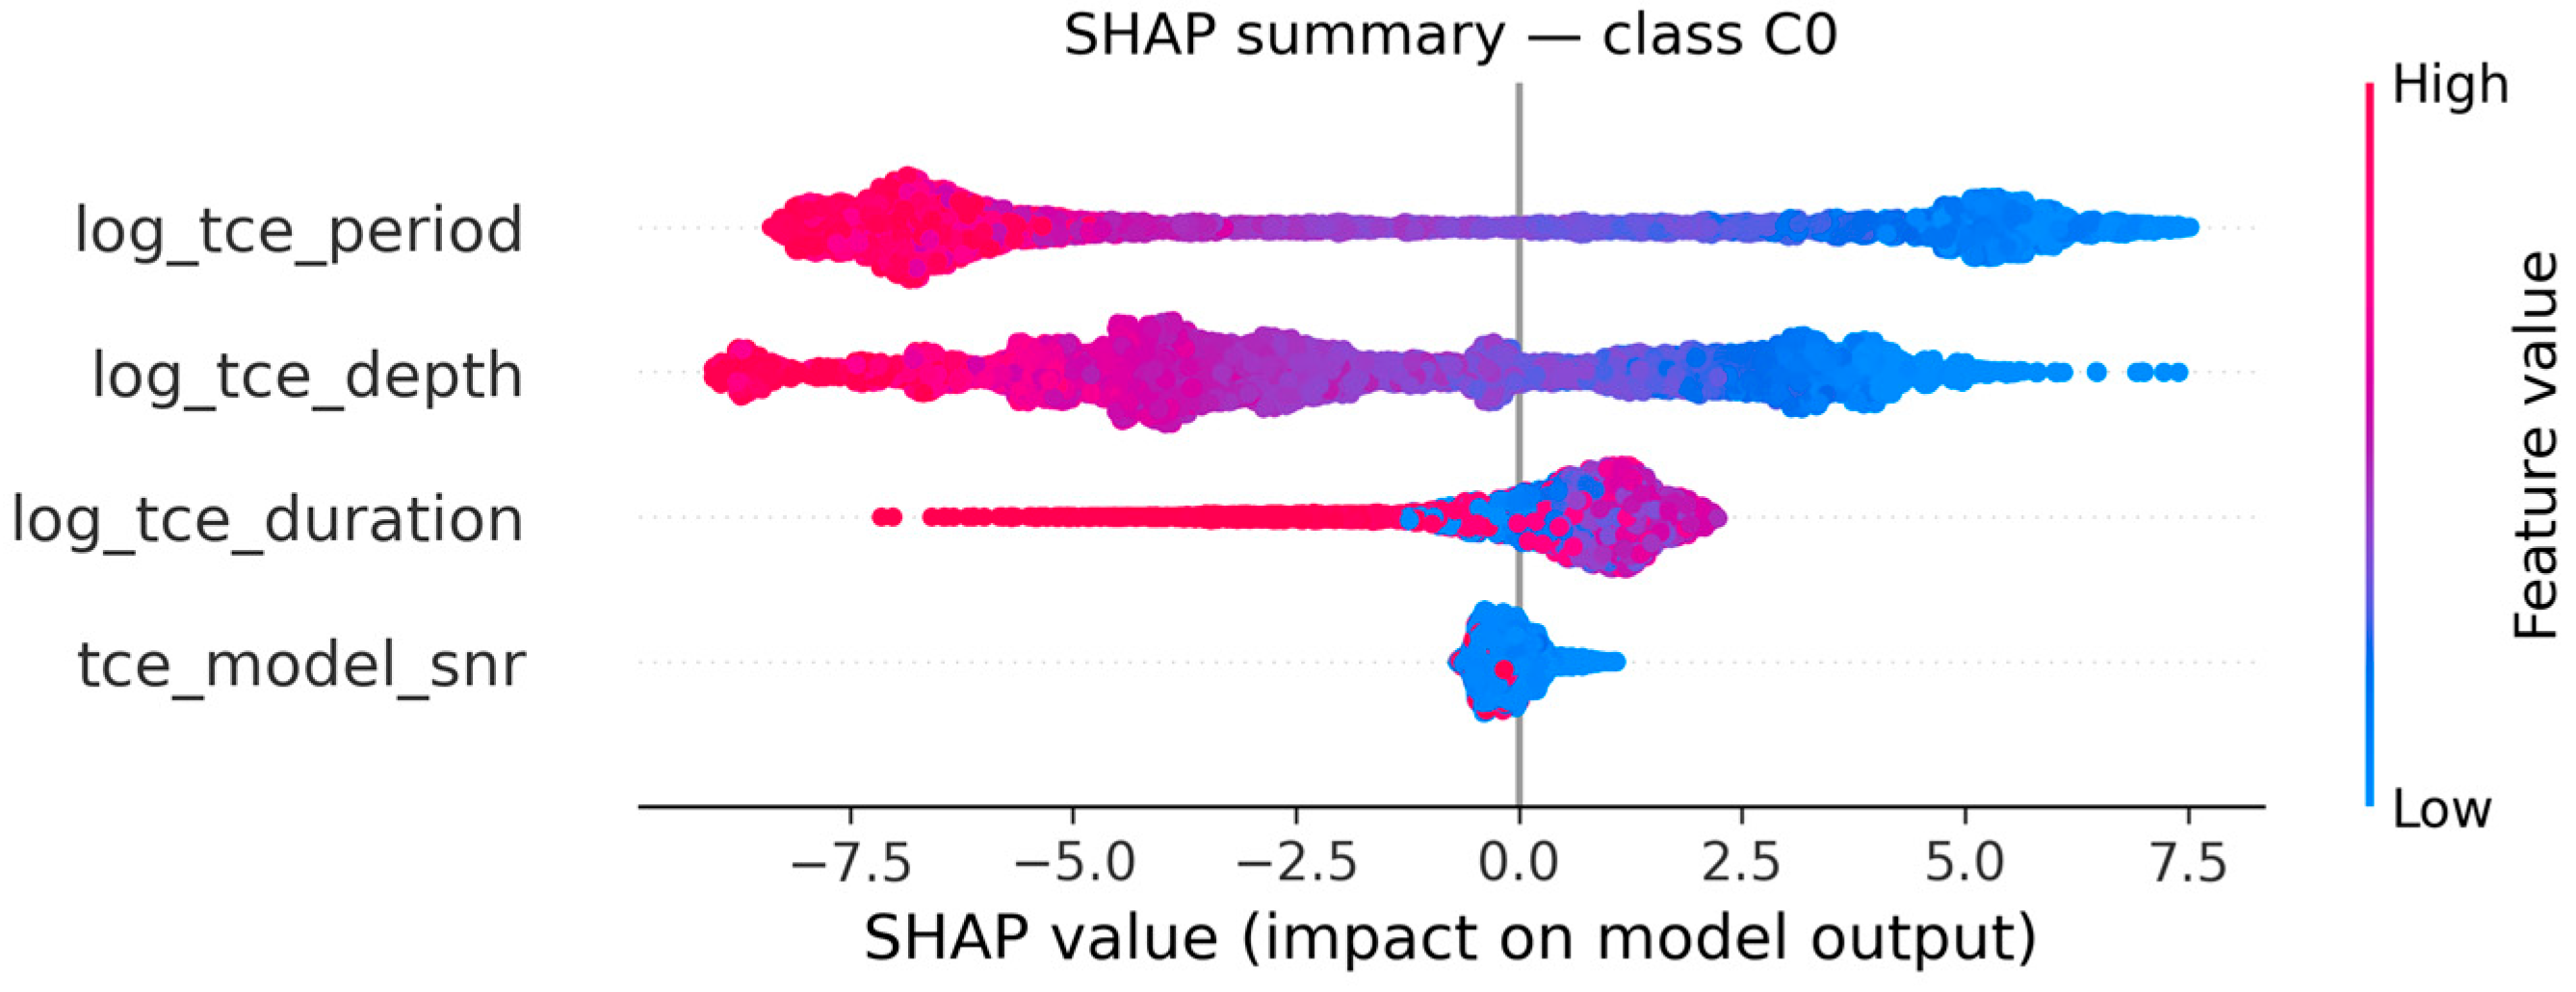
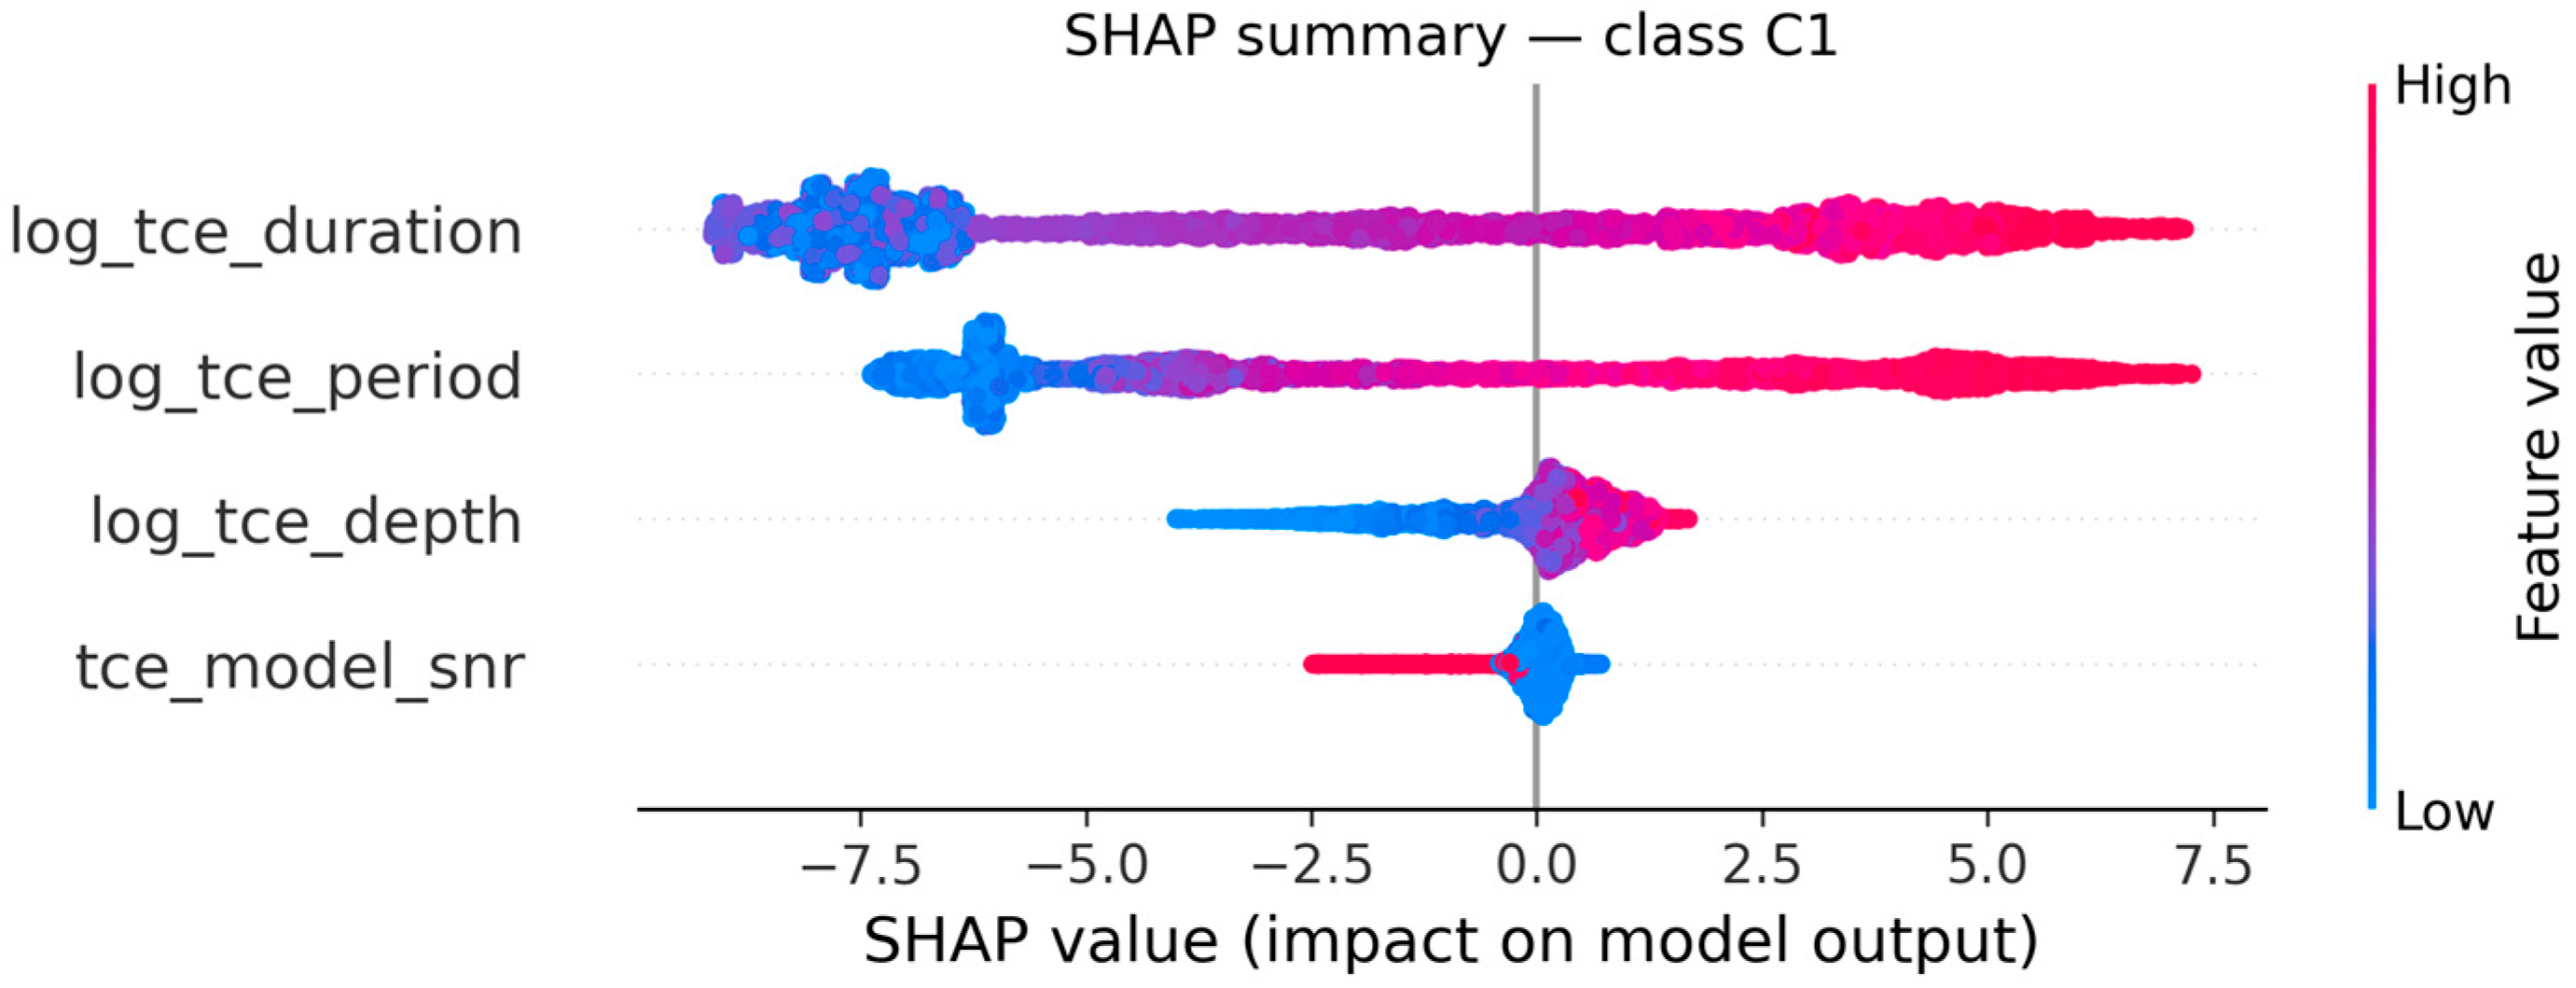
Each point represents a Threshold Crossing Event (TCE), with colors indicating the normalized feature value (red = high, blue = low), and the position along the x-axis representing the impact of that feature on the model’s output for the corresponding class.
Cluster C0 is mainly influenced by short orbital periods and shallow transit depths. Low values of
log_tce_period and
log_tce_depth (blue points to the right) strongly increase the probability of belonging to this cluster, indicating compact, low-amplitude transits with modest SNR values,
Figure 11.
This pattern is consistent with the physical centroid of C0 (period ≈ 1.6 days, depth ≈ 60 ppm, SNR ≈ 56), representing frequent but low-contrast transit detections.
The SHAP distribution for C1 reveals that log_tce_duration and log_tce_period are the dominant drivers, both showing strong positive contributions for higher values (red points to the right).
This cluster corresponds to long-period, deep, and extended transits, aligning with the centroid parameters (period ≈ 200 days, duration ≈ 11 h).
The influence of
tce_model_snr is minor, confirming that cluster membership is primarily shaped by geometric and temporal factors rather than signal intensity,
Figure 12.
Cluster C2 exhibits a different behavior, where log_tce_depth and tce_model_snr play significant roles.
High SNR and deep transits (red points toward positive SHAP values) characterize this group, while log_tce_duration and log_tce_period show intermediate ranges that distinguish it from the short and long-period clusters.
This behavior matches the centroid of C2 (period ≈ 30 days, duration ≈ 3.3 h, depth ≈ 650 ppm), which gathers robust detections of moderate periodicity and strong contrast,
Figure 13.
In summary, the SHAP analysis reveals a coherent and interpretable structure: log_tce_period and log_tce_duration globally dominate cluster formation, log_tce_depth contributes to refining the boundary between shallow and deep signals, and tce_model_snr acts as a confidence enhancer, increasing cluster certainty for high-quality transits.
The interpretability achieved through SHAP confirms that the fuzzy clusters represent distinct, physically consistent regimes in the Kepler TCE parameter space.
4.3.2. LIME. Local Interpretable Model-Agnostic Explanations
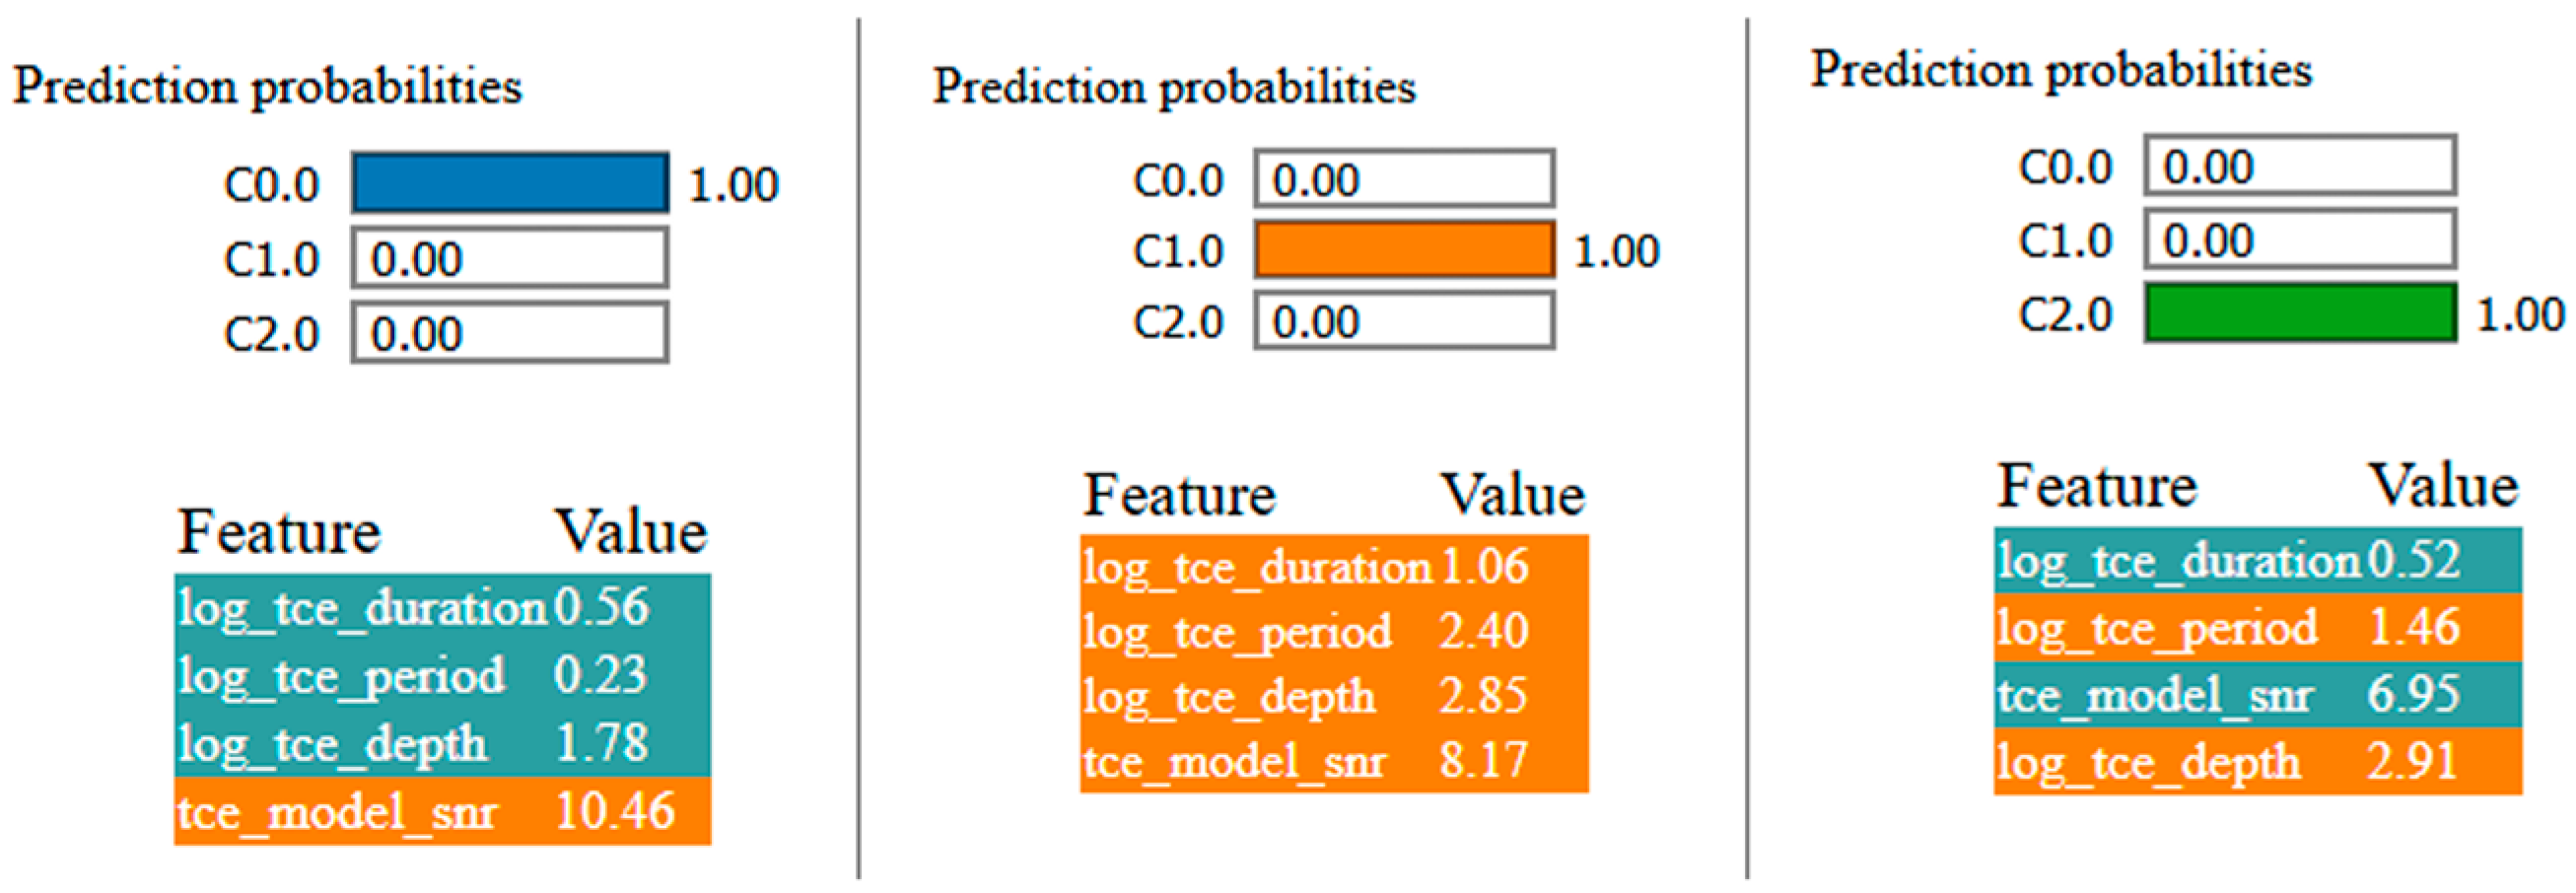
To complement the global SHAP interpretation, LIME was employed to generate local explanations for representative events belonging to each fuzzy cluster (C0, C1, and C2). Each explanation decomposes the XGBoost prediction into an additive contribution of the input features, showing how specific parameter values influence the cluster assignment probability.
The selected instance exhibits short duration (log_tce_duration ≈ 0.56), short period (log_tce_period ≈ 0.23), and low depth (log_tce_depth ≈ 1.78), with a moderate signal-to-noise ratio (tce_model_snr ≈ 10.5). LIME indicates that the combination of short period and shallow depth contributes most strongly to the probability of belonging to C0, yielding a prediction confidence of 1.00.
This local pattern aligns with the global SHAP analysis, confirming that C0 corresponds to compact, low-contrast transit signals.
For C1, the explanatory rules emphasize long duration (log_tce_duration > 0.99), long period (log_tce_period > 1.33), and high depth (log_tce_depth > 2.5), while SNR has a minor effect. These characteristics jointly push the event toward C1 with complete confidence (probability = 1.00).
Such local explanations reinforce the physical interpretation of C1 as the long-period, deep-transit regime, confirming that the classifier accurately replicates the fuzzy cluster boundaries in this region.
The C2 example shows intermediate values of period and duration (log_tce_period ≈ 1.46, log_tce_duration ≈ 0.52) but high depth and SNR (log_tce_depth ≈ 2.91, tce_model_snr ≈ 6.95). LIME assigns this observation to C2 with full confidence, identifying depth and signal strength as the main positive contributors.
This combination describes the transition region between short and long-period events, where transit remains highly significant but occurs at moderate periodicities.
In all cases, LIME explanations are consistent with the SHAP global importance rankings and provide intuitive, rule-based insights into individual model decisions. They confirm that the classifier and by extension, the fuzzy partition relies on physically meaningful thresholds across period, duration, and depth, while SNR modulates the confidence of classification,
Figure 14.
4.3.3. ELI5. Global and Local Feature Contributions
Finally, the ELI5 framework was applied to the XGBoost classifier to analyze the model’s internal logic and assess the relative weight of each variable. Two complementary analyses were performed:
Global permutation importance, which quantifies how much the model performance decreases when each feature is randomly shuffled, and Local explanation, which decomposes a single prediction into additive per-feature contributions along the decision path of the ensemble.
The analysis carried out to obtain the overall importance of the characteristics highlights a consistent hierarchy of influence among the four characteristics, (
Table 7):
These results confirm the findings from SHAP: orbital period and transit duration are the main explanatory variables, followed by depth, while SNR plays a marginal role in determining cluster membership.
This ranking reflects the strong dependence of the fuzzy segmentation on geometric and temporal parameters, rather than on detection quality.
A representative instance was also examined using ELI5’s local explanation (
Figure 15).
The additive decomposition shows how each feature contributes to the predicted class probabilities (C0, C1, C2) through the ensemble’s internal decision thresholds. For this case, log_tce_period (+4.66) and log_tce_duration (+3.79) are the most positive contributors toward the predicted class (C1), while large values of log_tce_depth and tce_model_snr provide moderate support.
This localized view aligns well with the LIME and SHAP analyses, illustrating that long-period and long-duration events dominate the model’s internal logic for the C1 regime, while short and shallow events tend toward C0 and high-SNR, deep events toward C2.
4.4. Data Integration and Preprocessing
In this stage, the FAS-XAI framework is validated against the official KOI catalog.
The process involves merging the TCE and KOI datasets to construct a multiclass classification problem with physically meaningful labels (FALSE POSITIVE, CANDIDATE, CONFIRMED). Subsequently, an XGBoost classifier is trained using both transit-related features and fuzzy membership variables, followed by an explainability analysis based on SHAP values.
4.4.1. KOI Integration and Supervised Modeling
The TCE–KOI datasets were merged using the unique identifiers (kepid, tce_plnt_num = koi_tce_plnt_num), retaining only the three standard KOI dispositions: FALSE POSITIVE (0), CANDIDATE (1), and CONFIRMED (2).
The resulting dataset includes two main feature groups:
Transit-signal variables (log_tce_period, log_tce_duration, log_tce_depth, tce_model_snr), and fuzzy-structure variables derived from the FCM phase (membership degrees u1…u3). After the merger and type harmonization, the combined dataset comprised N = 8053 samples with the following class distribution:
FALSE POSITIVE (0): 3964 samples (49.2%)
CANDIDATE (1): 1360 samples (16.9%)
CONFIRMED (2): 2729 samples (33.9%)
This integrated TCE–KOI base serves as the foundation for the supervised learning and explainability analyses presented in the following subsections.
4.4.2. Predictive Model and Performance Evaluation
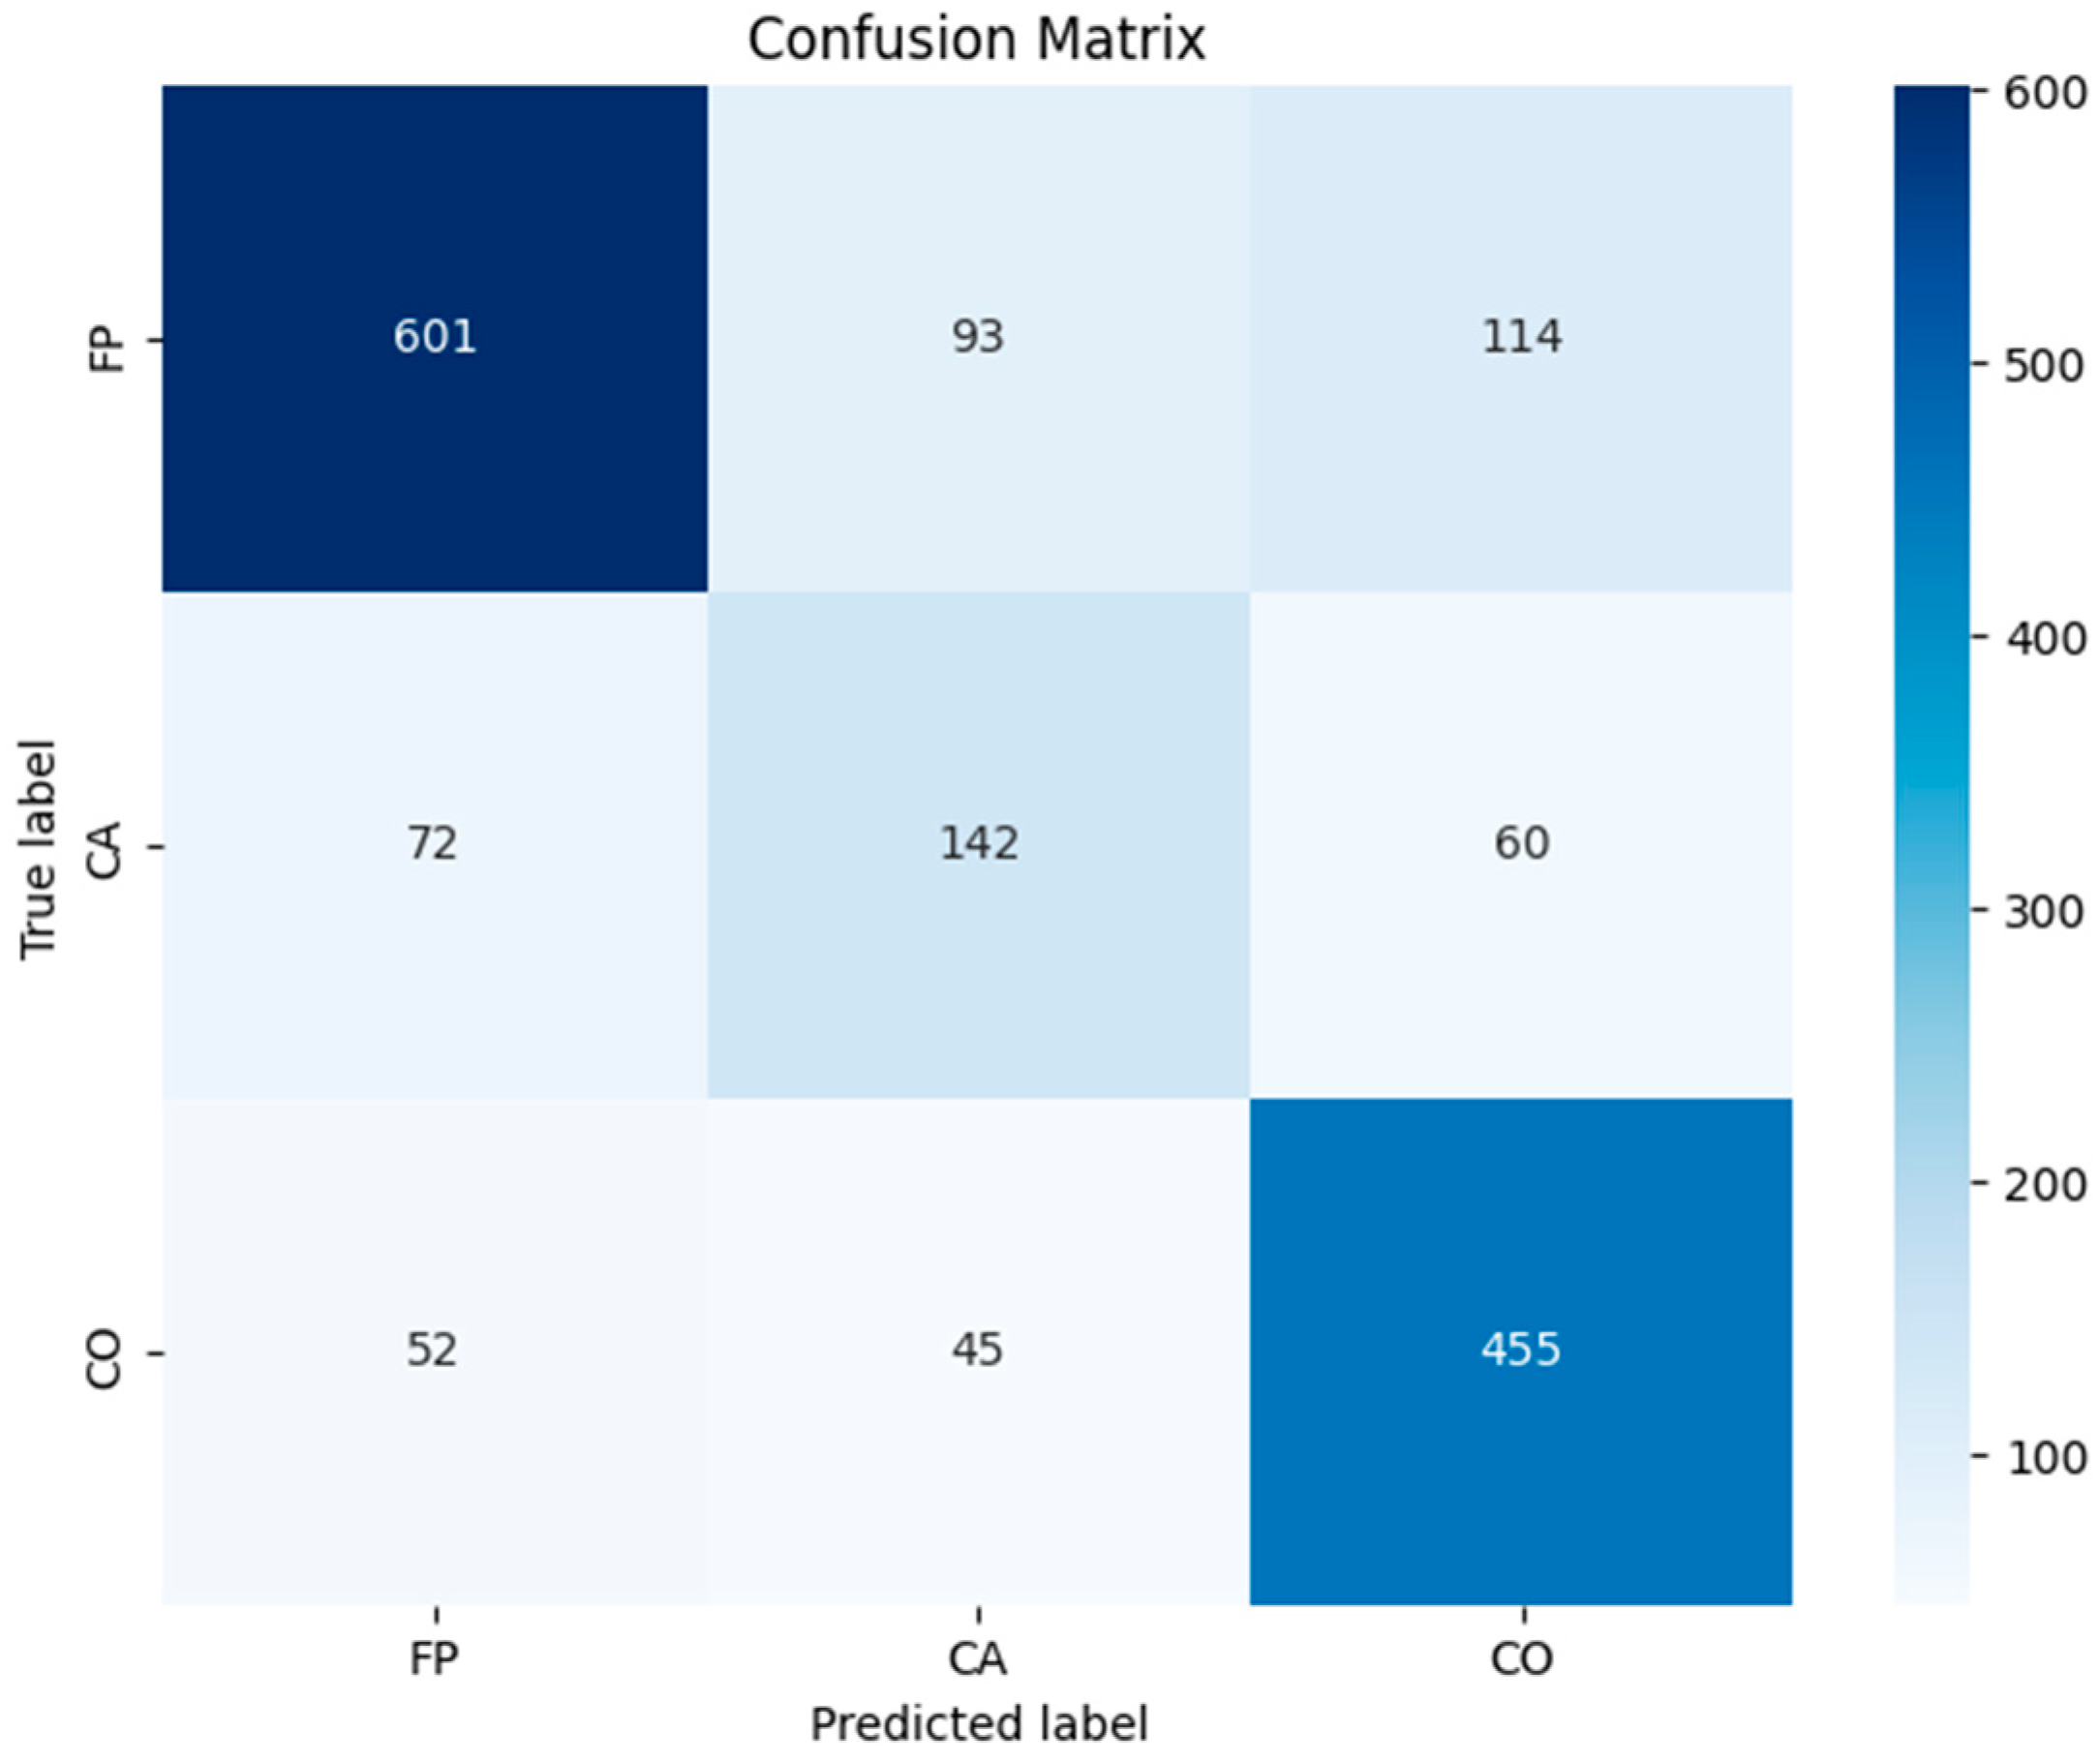
We trained a multiclass XGBoost classifier on the integrated TCE–KOI dataset using a group-aware split by star to avoid information leakage across transits of the same target. Concretely, we applied GroupShuffleSplit (test size = 0.2, random_state = 42) with groups defined by kepid; if groups were unavailable, a stratified split on y was used as a fallback. Class imbalance was handled through inverse-frequency class weights applied to the training samples.
The results obtained are summarized below in
Table 8 and in the confusion matrix,
Figure 16.
The classifier clearly separates CONFIRMED and FALSE POSITIVE cases, while CANDIDATE objects remain the most challenging, consistent with their transitional nature in the KOI vetting process. The relatively high OVR ROC–AUC (0.855) indicates a strong ranking capability even in cases where categorical boundaries are less distinct. These findings confirm that transit-signal features, later complemented by fuzzy membership information, enable the prediction of KOI dispositions with competitive accuracy under a leakage-safe evaluation protocol.
4.4.3. Feature Importance Analysis (SHAP)
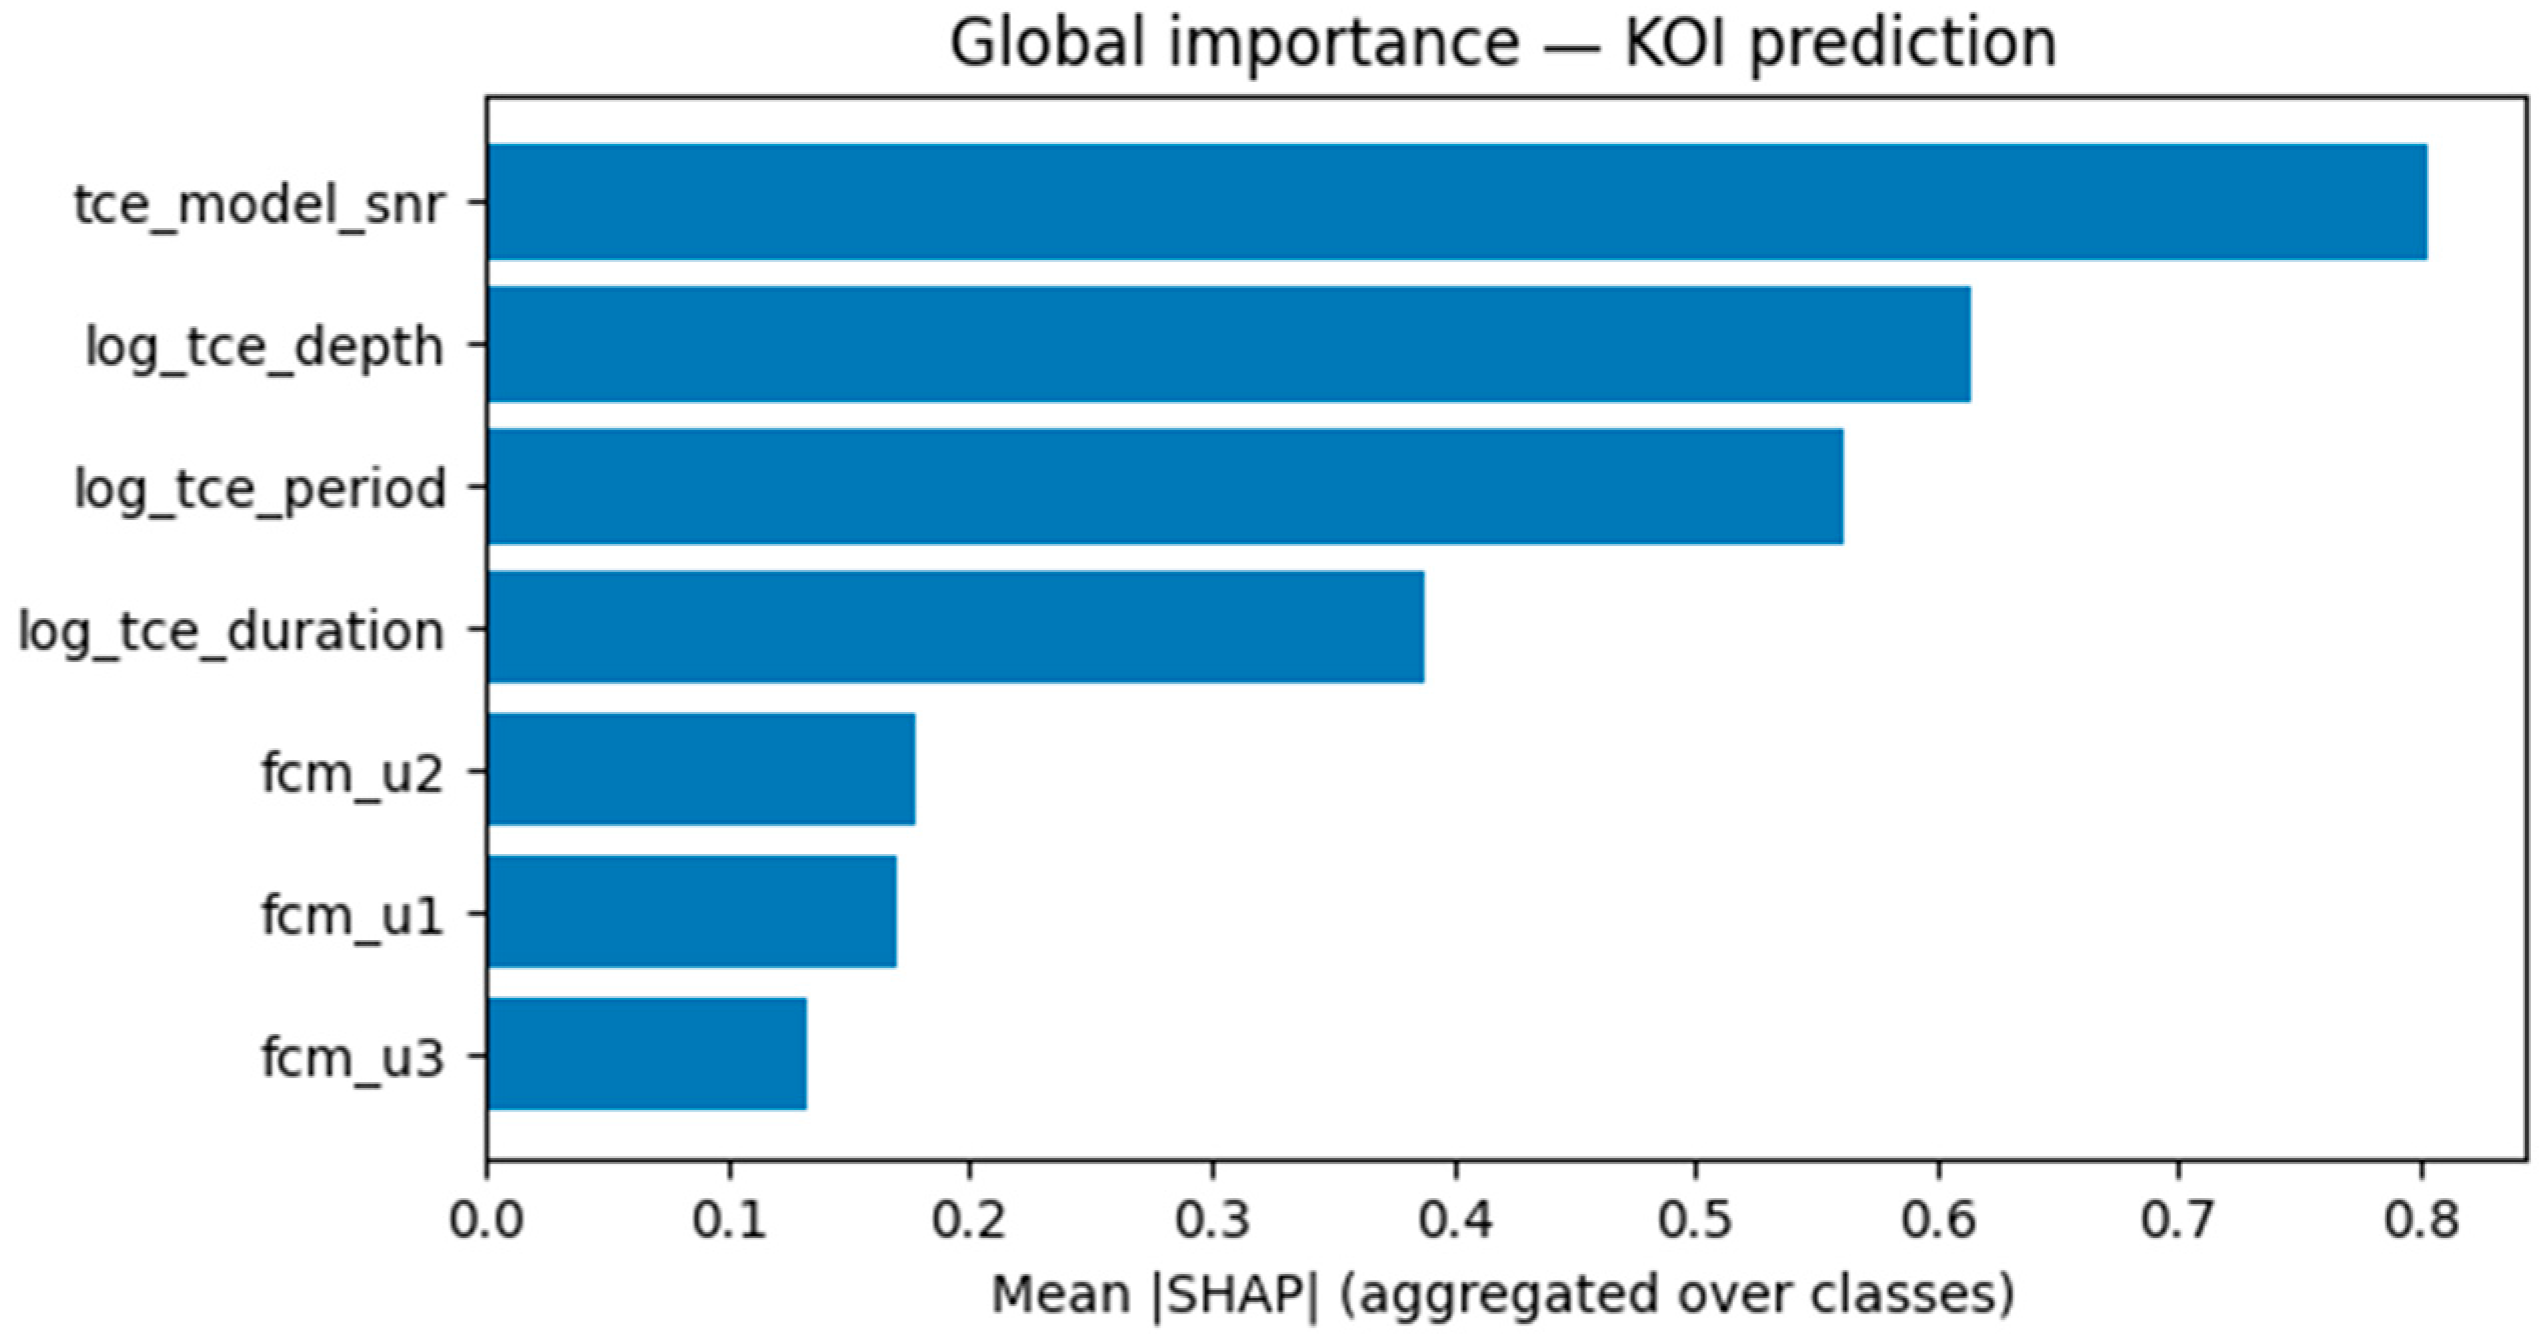
To interpret the contribution of each input variable to the KOI classification, we applied SHapley Additive Explanations (SHAP) to the trained XGBoost model.
Figure 17 and
Table 9 summarize the global importance of all features, measured as the mean absolute SHAP value aggregated across classes.
The analysis reveals that tce_model_snr (signal-to-noise ratio) and log_tce_depth (transit depth) are the most influential predictors, followed by log_tce_period and log_tce_duration. These four parameters correspond to core descriptors of the transit signal shape and quality, reflecting the model’s reliance on physically interpretable features.
In contrast, the fuzzy membership variables (fcm_u1-u3) derived from the FCM clustering contribute less strongly but still capture residual information related to uncertainty and transitional behavior among TCEs. Their inclusion slightly improves overall calibration and interpretability, confirming that fuzzy-based descriptors provide complementary evidence in the classification of ambiguous cases.
4.4.4. Cluster–KOI Consistency and Cross-Validation
To evaluate how the fuzzy segmentation derived from transit-signal parameters corresponds to the official KOI dispositions, we analyzed both the soft membership distributions from Fuzzy C-Means and the discrete classifications produced by XGBoost.
This comparison aims to assess whether the clusters discovered in the TCE feature space, defined by , , , and SN, capture astrophysically meaningful regions related to the KOI categories (FALSE POSITIVE, CANDIDATE, and CONFIRMED).
The results, summarized in
Table 10, show that confirmed exoplanets exhibit the highest mean membership to Cluster C2 (
), while candidates distribute more evenly between Clusters C1 and C2 (
), reflecting their intermediate and uncertain nature. False positives present diffuse and unstructured memberships, consistent with the heterogeneity expected from spurious detections and instrumental noise.
Soft-concordance metrics (MSE = 0.19; mean cosine = 0.59) indicate a moderate but consistent alignment between fuzzy memberships and model-predicted probabilities, with the highest per-class correlation for confirmed planets ().
Although global clustering metrics such as ARI (0.019) and NMI (0.018) remain low, typical when comparing soft and discrete partitions, the qualitative agreement reveals that FCM captures a continuous transition across signal quality rather than replicating categorical KOI thresholds.
The mean predicted probabilities from XGBoost reinforce this interpretation, (see
Table 11). Confirmed objects achieve
, false positives
, and candidates
, demonstrating that the classifier effectively separates well-defined cases while maintaining uncertainty for borderline examples. This behavior aligns closely with the fuzzy membership structure, confirming that both models are sensitive to the same underlying signal gradients.
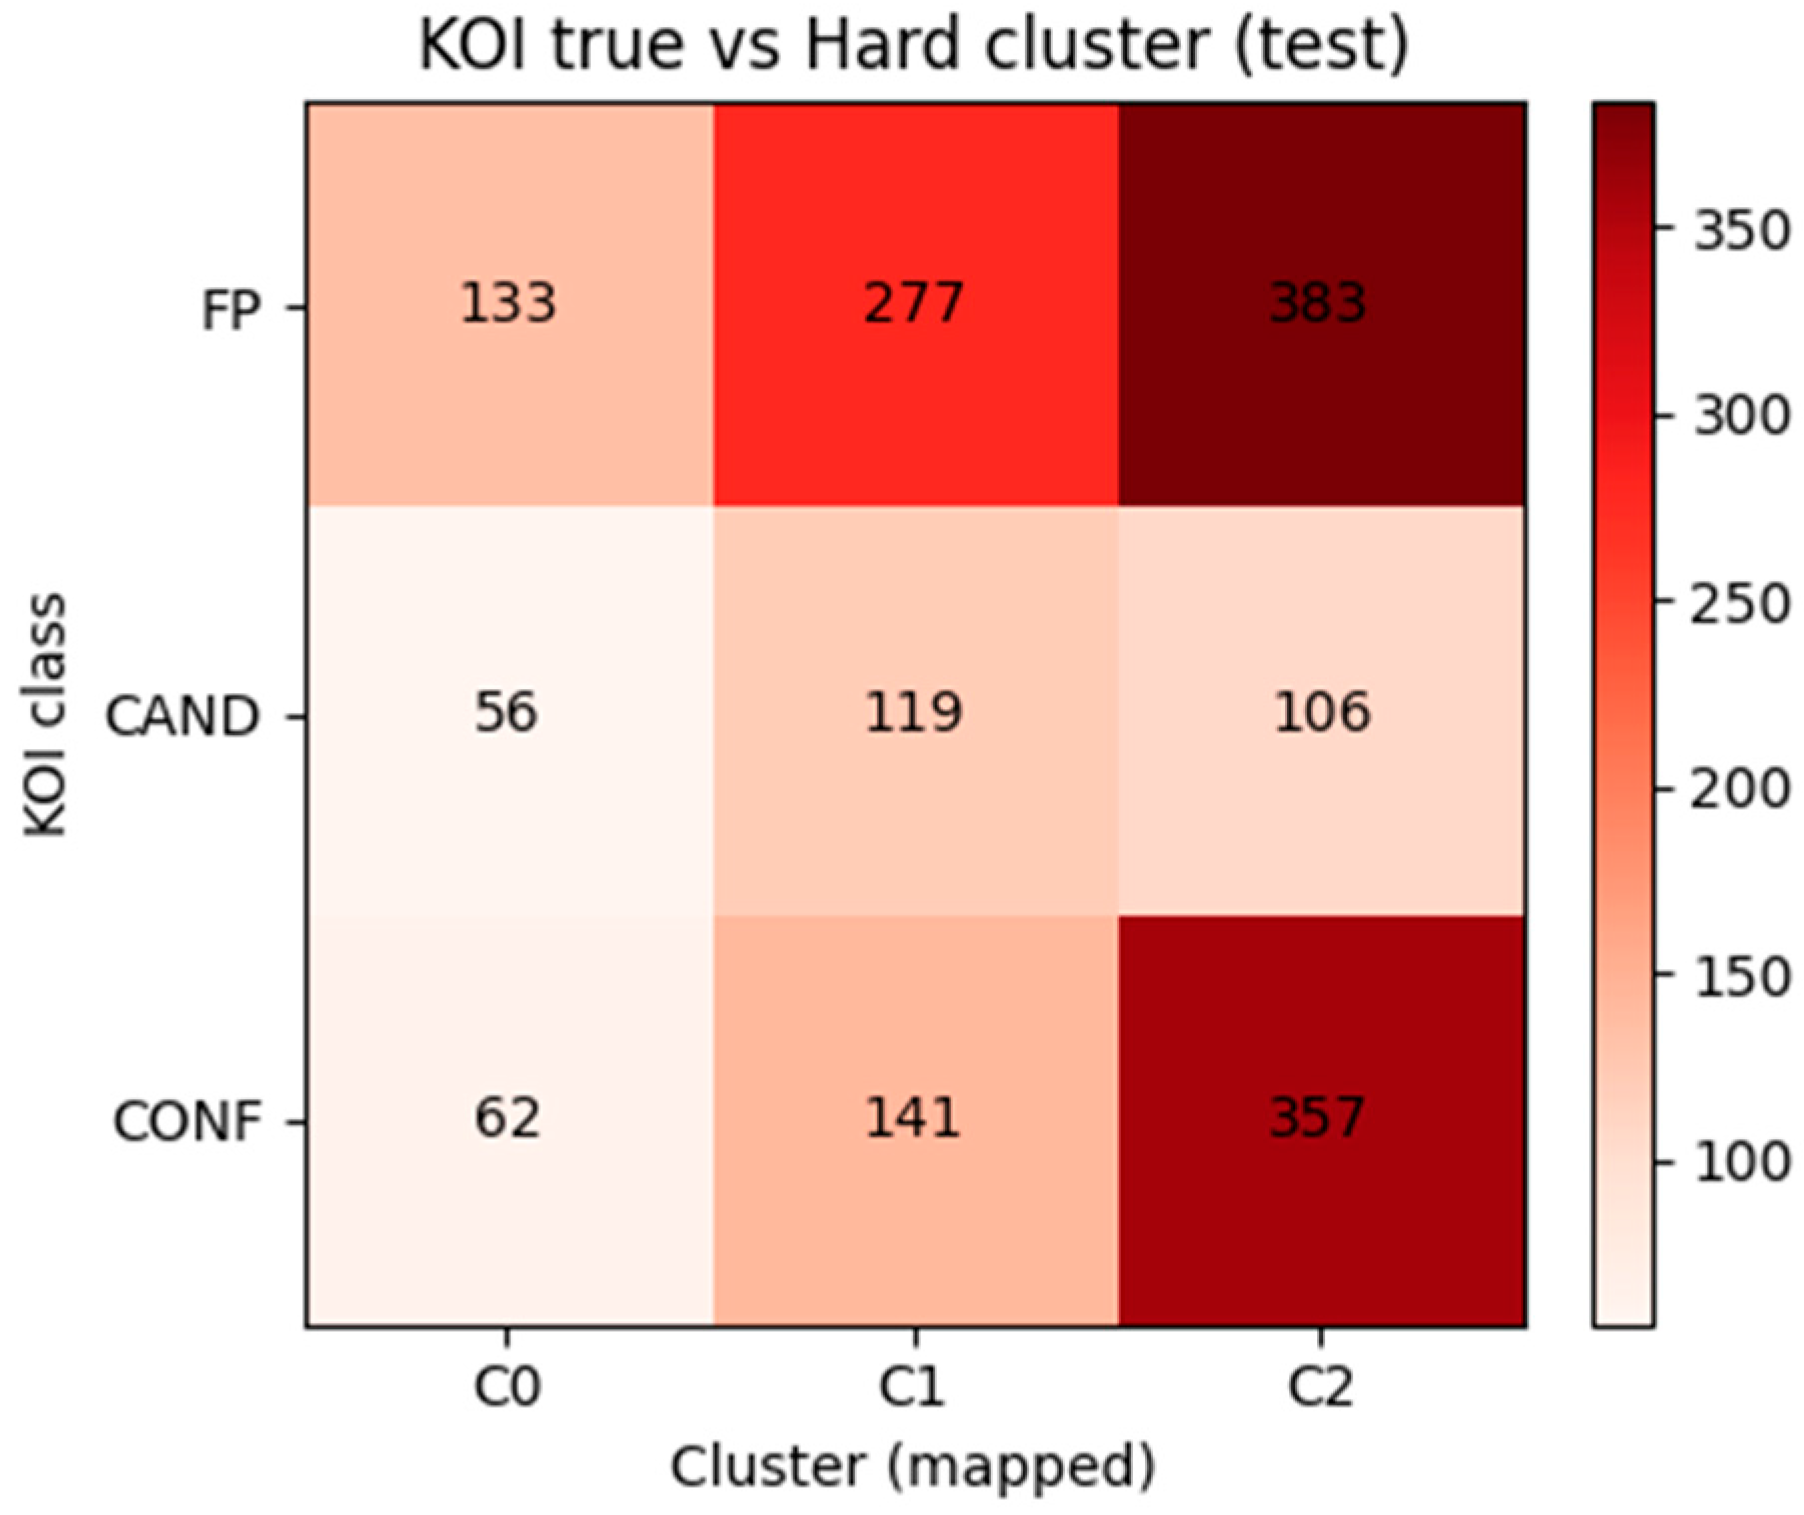
Figure 18 compares KOI classes to their most likely hard cluster assignments, showing partial overlap and dispersion among candidates, consistent with the continuous nature of the astrophysical validation process.
In summary, the cross-validation between fuzzy clustering and KOI dispositions demonstrates that the FAS-XAI framework captures a physically meaningful hierarchy of signal reliability. Rather than enforcing categorical separations, it models the gradual transition from noise to confirmed planetary transits, providing a more nuanced and interpretable view of exoplanet validation.
4.4.5. Stellar Cross-Validation with Kepler DR25
To physically validate the fuzzy clusters derived from transit signal parameters, we cross-matched each TCE with stellar parameters from the Kepler DR25 catalog. Using stellar radius and mass , we estimated the planet-to-star size ratio, the transit depth (, Equation (10)), and the expected duration for a central, circular transit .
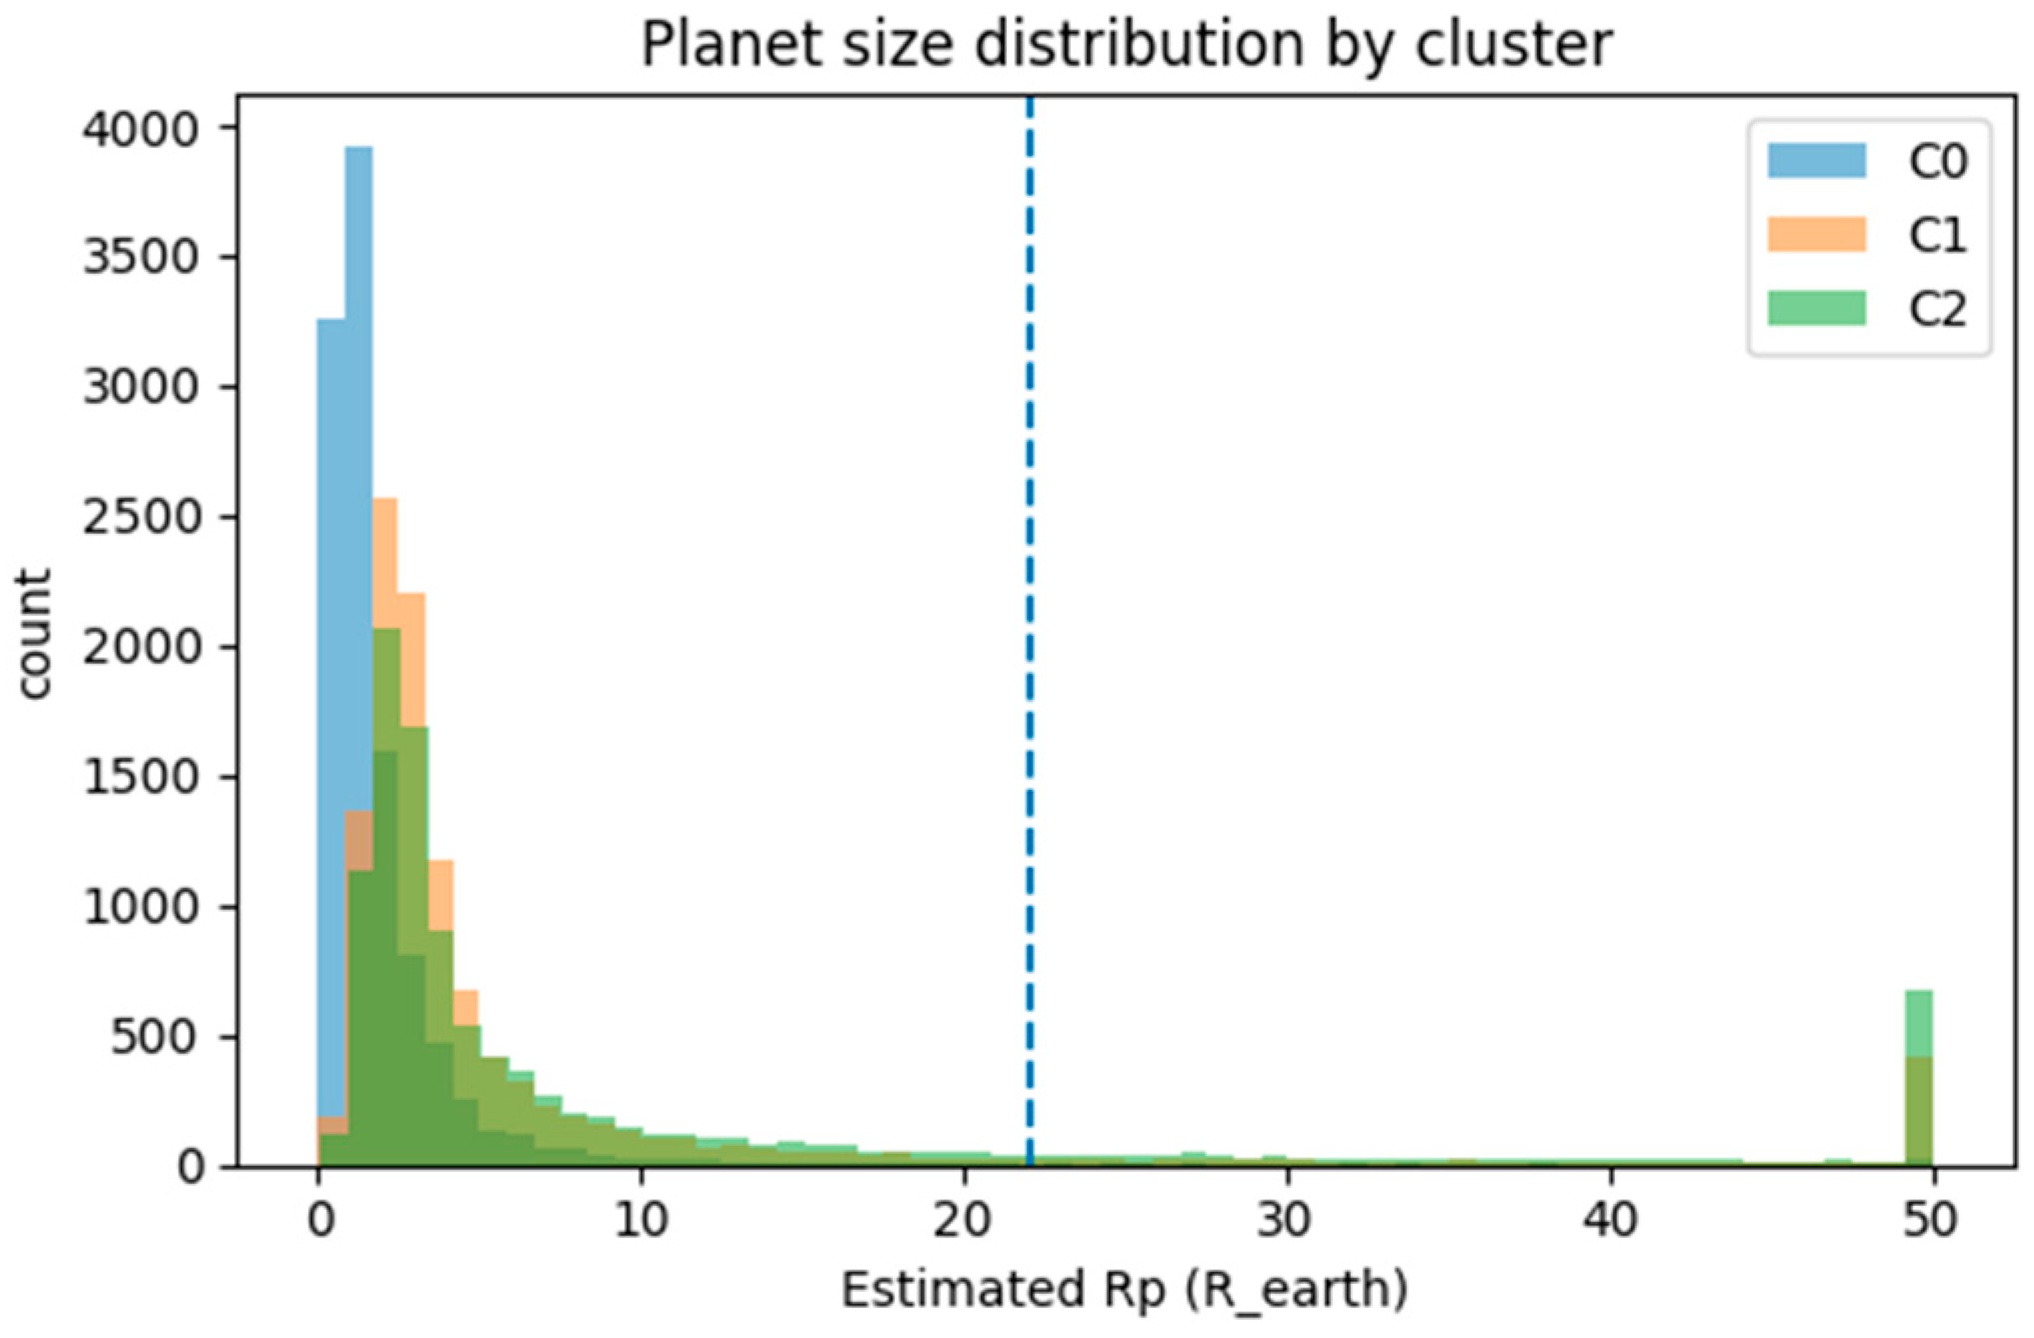
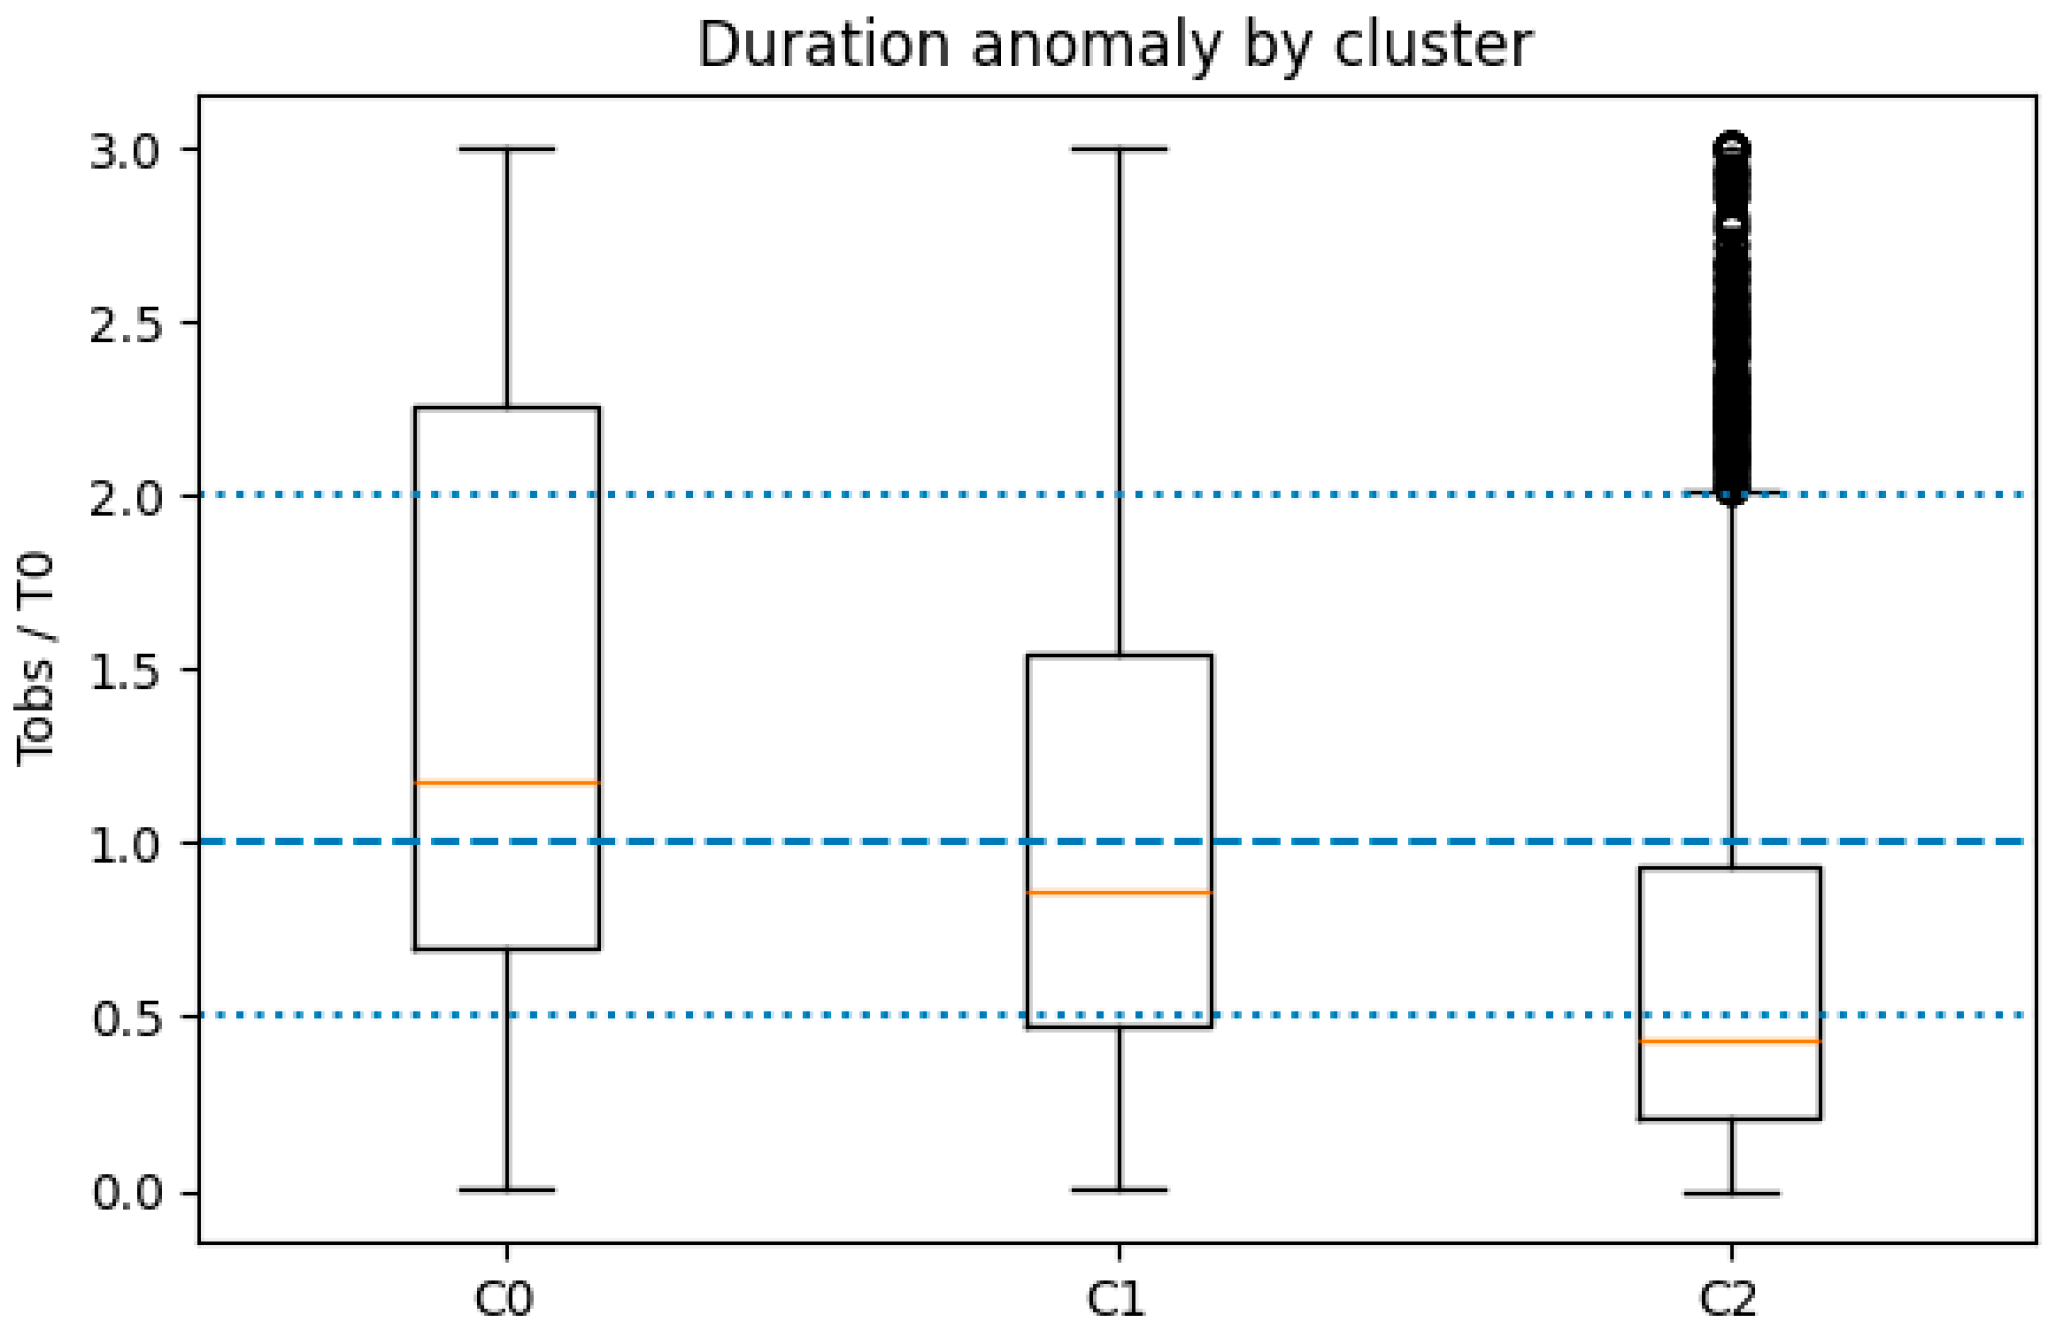
From these quantities, we derived an approximate planetary radius , the scaled orbital distance , and the duration anomaly, defined as .
The resulting distributions (
Figure 19 and
Figure 20) confirm that the three fuzzy clusters obtained in TCE space correspond to physically distinct transit regimes:
C0. “Short & shallow” (n ≈ 10.9 k): dominated by small, near-central signals with a median and . The slight tail toward (~29%) likely reflects uncertainties in stellar parameters or eccentric transits in ultra-short orbits. The fraction of giant-like events is minimal (~0.5%).
C1. “Long & deep” (n ≈ 11.1 k): characterized by larger radii () and long-period transits (). A significant portion () exhibits , suggesting high-impact or eccentric events. The fraction of large-radius outliers (~7%) indicates mild contamination by eclipsing binaries or stellar misestimations.
C2. “Medium & strong” (n ≈ 10.5 k): represents intermediate-period, high-SNR transits (, ), with most cases showing shorter-than-expected durations ( in ~53%). This group includes a non-negligible tail (~14%) of very deep or oversized transits, aligning with the CONF–FP mixture observed in the KOI cross-validation.
These patterns reinforce the physical coherence of the FCM clustering: each group corresponds to a distinct orbital–photometric regime, and the fuzzy memberships help delineate ambiguous or transitional regions between planet-like and non-planetary signals.
4.5. Summary and Final Remarks
The proposed FAS-XAI framework successfully integrated fuzzy clustering, supervised learning, and XAI techniques to analyze and interpret transit signals from the Kepler TCE catalog.
Starting from physically meaningful parameters, period, duration, depth, and signal-to-noise ratio (SNR), the fuzzy partition () revealed three coherent regimes: C0 (short & shallow), C1 (long & deep), and C2 (medium & strong). These clusters correspond to distinct astrophysical behaviors that were subsequently validated using stellar properties from the Kepler DR25 catalog.
The combination of XGBoost and XAI tools provided interpretability at two complementary levels of the FAS-XAI pipeline. In the cluster consistency phase, SHAP, LIME, and ELI5 were applied to the model trained to reproduce fuzzy memberships, revealing the main factors driving each cluster and offering both global and local explanations of the fuzzy segmentation. In the KOI classification phase, SHAP values were used to interpret the supervised model distinguishing CONFIRMED, CANDIDATE, and FALSE POSITIVE cases, identifying the signal and fuzzy variables that most strongly influenced each disposition.
Cross-validation between fuzzy memberships and KOI labels revealed partial alignment, expected due to the intrinsic ambiguity of borderline cases, but demonstrated that fuzzy clustering captures the same transitional regions that the Kepler vetting pipeline classifies as Candidates.
Finally, incorporating stellar parameters from Kepler DR25 confirmed that the fuzzy clusters correspond to physically consistent transit regimes:
Cluster C0 concentrates on short-period, near-central events dominated by terrestrial-size planets.
Cluster C1 contains long-period, high-impact or eccentric transits.
Cluster C2 represents intermediate or mixed signals with a higher signal-to-noise ratio (SNR) and a non-negligible tail of oversized events, consistent with the mixture of planetary and astrophysical false positives observed in the KOI cross-validation.
Overall, this case study demonstrates how FAS-XAI bridges machine learning and physical interpretability, providing a replicable and generalizable methodology for scientific domains where uncertainty and partial membership are intrinsic.
5. Discussion, Limitations and Future Works
5.1. Discussion
The results presented in this study demonstrate that the proposed FAS-XAI framework provides a coherent, interpretable, and physically grounded methodology for analyzing complex astrophysical datasets.
Unlike traditional classification approaches that treat signal vetting as a hard decision problem, FAS-XAI captures the continuous and uncertain nature of the Kepler transit catalog through its fuzzy–explainable architecture. This aligns with recent findings in the literature showing that astronomical signals often exhibit gradual rather than binary separations, as observed in fuzzy analyses of gamma-ray bursts [
12], galaxy morphology [
3], and cosmological structures [
13].
The fuzzy clustering component revealed latent structures within the TCE parameter space, identifying three distinct regimes (C0–C2) that were subsequently validated both statistically and physically. Like prior work using fuzzy methods to classify stars in open clusters or to structure cosmological simulations, the soft memberships obtained here capture overlapping physical regimes that crisp algorithms fail to identify.
A key outcome of this work is the demonstration that XAI can be effectively combined with fuzzy logic to enhance both transparency and interpretive depth. Recent studies in astrophysics have underscored the need for interpretable modeling, interpretable CNNs for cosmology [
14], physically meaningful spectral feature attribution [
15], and interpretable AI-powered discoveries in astronomy [
18]. In the present work, the use of SHAP, LIME, and ELI5 explains cluster consistency at both global and local levels, while SHAP applied to KOI classification offers a quantitative link between feature importance and astrophysical plausibility.
It is important to note that the objective of this study is not to assert the superiority of performance over other alternative classifiers, but rather to demonstrate the coherence, interpretability, and physical consistency of the FAS-XAI framework as an integrated methodological process. Furthermore, the SHAP feature-importance analysis can be regarded as a form of sensitivity analysis, as it quantifies the marginal contribution of each input variable to the model output in a consistent and model-agnostic manner.
The cross-validation with the Kepler DR25 Stellar Properties Catalog confirmed that the fuzzy clusters correspond to physically meaningful regimes of orbital geometry and signal morphology. The observed correlations between cluster membership, duration anomaly (), and planetary radius () demonstrate that FAS-XAI captures astrophysical variability rather than mere statistical artifacts.
Moreover, the framework naturally identifies transitional regions, particularly among Candidate KOIs, where observational uncertainty, stellar noise, or eccentricity can blur the boundary between planetary and non-planetary signals. This property illustrates one of the main advantages of fuzzy modeling in scientific data analysis: the ability to represent and quantify ambiguity rather than suppress it.
In this sense, FAS-XAI provides not only a technical framework but also a conceptual bridge that reconciles statistical uncertainty with physical coherence, addressing a central challenge in modern data-driven astrophysics. The integration of fuzzy reasoning and explainability offers a path toward transparent AI systems capable of supporting scientific discovery in exoplanet research and beyond.
5.2. Limitations and Scope
Although the results confirm the robustness and explanatory power of the FAS-XAI framework, several methodological limitations should be acknowledged.
First, the fuzzy partition depends on the selected feature set, which, although physically motivated, may omit subtle descriptors of stellar variability or instrumental artifacts.
Second, the KOI labels themselves are not free from bias, as they originate from human-in-the-loop vetting procedures.
Finally, the current model assumes a fixed number of clusters (); exploring adaptive or hierarchical fuzzy partitions could reveal additional structure.
Nevertheless, these limitations do not undermine the main conclusion: FAS-XAI bridges data-driven and physically interpretable modeling, demonstrating its potential for broader application across scientific domains.
It is also worth noting that the supervised stage of the framework does not depend on the specific choice of XGBoost. Any sufficiently expressive non-interpretable classifier (e.g., Random Forest, LightGBM, SVM) could be integrated in this step without altering the methodological contribution of the model. The role of the classifier in FAS-XAI is not to maximize performance per se, but to provide a stable mapping between fuzzy structure, KOI labels, and the XAI interpretability layer.
These considerations define a controlled methodological scope, ensuring reproducibility and paving the way for the future extensions discussed below.
5.3. Future Work
Future extensions of the FAS-XAI framework will focus on improving adaptability, robustness, and applicability across astrophysical and interdisciplinary contexts. Several methodological and scientific directions are envisioned:
Methodological enhancements. Future developments will explore adaptive or hierarchical variants of Fuzzy C-Means that allow the number of clusters to emerge from the data rather than being predefined, as well as Bayesian fuzzy modeling and feature-selection schemes to improve robustness in higher-dimensional settings. The explainability layer may also be expanded with counterfactual or causal XAI techniques (e.g., Causal SHAP, Anchors) to strengthen model auditing and clarify decision boundaries.
Comparative benchmarking. A systematic quantitative comparison with alternative clustering and classification methods (e.g., k-means, Gaussian mixtures, hierarchical clustering, SVMs, or neural networks) will be pursued to assess the generalizability and added value of integrating fuzzy logic with explainable modeling.
Sensitivity and stability analysis. Additional studies may examine the influence of alternative photometric or stellar-variability features, as well as bootstrap-based stability measures, to further evaluate uncertainty in both the clustering and classification stages.
Application for new missions. Applying FAS-XAI to upcoming or ongoing surveys such as TESS, PLATO, or CHEOPS represents a natural extension of this work. These missions provide different noise regimes and stellar populations, offering an opportunity to test the framework under distinct astrophysical conditions.
Broader scientific impact. Beyond exoplanet vetting, the integration of fuzzy logic and explainability may support analyses in domains characterized by uncertainty and overlapping regimes, such as galaxy morphology, stellar variability, or biophysical signal interpretation.
Confidence intervals and stability analysis. Future work may incorporate bootstrap-based confidence intervals and additional stability assessments to complement the current validation pipeline, providing a quantitative measure of uncertainty in both the clustering structure and the supervised classification results.
6. Conclusions
We proposed and validated a dual modeling framework, FAS-XAI, that integrates unsupervised fuzzy clustering, supervised learning, and XAI to support transparent and physically consistent analysis of exoplanet transit data. The framework was applied to the Kepler TCE catalog, combining signal-level features (period, duration, depth, and SNR) with fuzzy memberships derived from FCM clustering.
In the first phase, the unsupervised analysis revealed three coherent clusters, C0 (short & shallow), C1 (long & deep), and C2 (medium & strong), that reflect distinct physical regimes of transit morphology.
Cluster validation using XGBoost confirmed the internal coherence of the fuzzy segmentation, achieving high classification performance (accuracy = 0.993 on core members). The application of SHAP, LIME, and ELI5 provided interpretability at both global and local levels, confirming that log(period), log(duration), and log(depth) are the main drivers of the fuzzy structure.
In the second phase, we cross-matched the TCE and KOI catalogs to evaluate the predictive capacity of fuzzy-enhanced features for exoplanet classification. A multiclass XGBoost model achieved strong performance (ROC–AUC = 0.855), clearly distinguishing CONFIRMED and FALSE POSITIVE cases while maintaining soft uncertainty for CANDIDATE signals. SHAP analysis showed that tce_model_snr and log_tce_depth dominate KOI classification, while fuzzy memberships contribute complementary interpretive information in ambiguous regions.
Additional validation using stellar parameters from Kepler DR25 confirmed that the fuzzy clusters correspond to physically consistent regimes of planetary size, orbital distance, and duration anomaly. Cluster C0 concentrates short, near-central, terrestrial-size events; C1 captures long-period, high-impact or eccentric transits; and C2 represents intermediate, high-SNR signals that include both genuine planets and astrophysical false positives.
Although the present work assumes a fixed number of clusters () and relies on the KOI catalog for external validation, these controlled constraints ensure reproducibility and preserve physical interpretability. Overall, the results demonstrate that combining fuzzy logic, supervised prediction, and XAI yields a robust, interpretable, and physically grounded framework for astrophysical data analysis.
Beyond the Kepler mission, FAS-XAI establishes a foundation for integrating quantitative uncertainty and physical reasoning within explainable machine learning, enhancing transparency and reproducibility in scientific discovery. Ultimately, FAS-XAI embodies a hybrid paradigm where physical understanding and data-driven inference coexist within transparent AI systems.
