Figure 1.
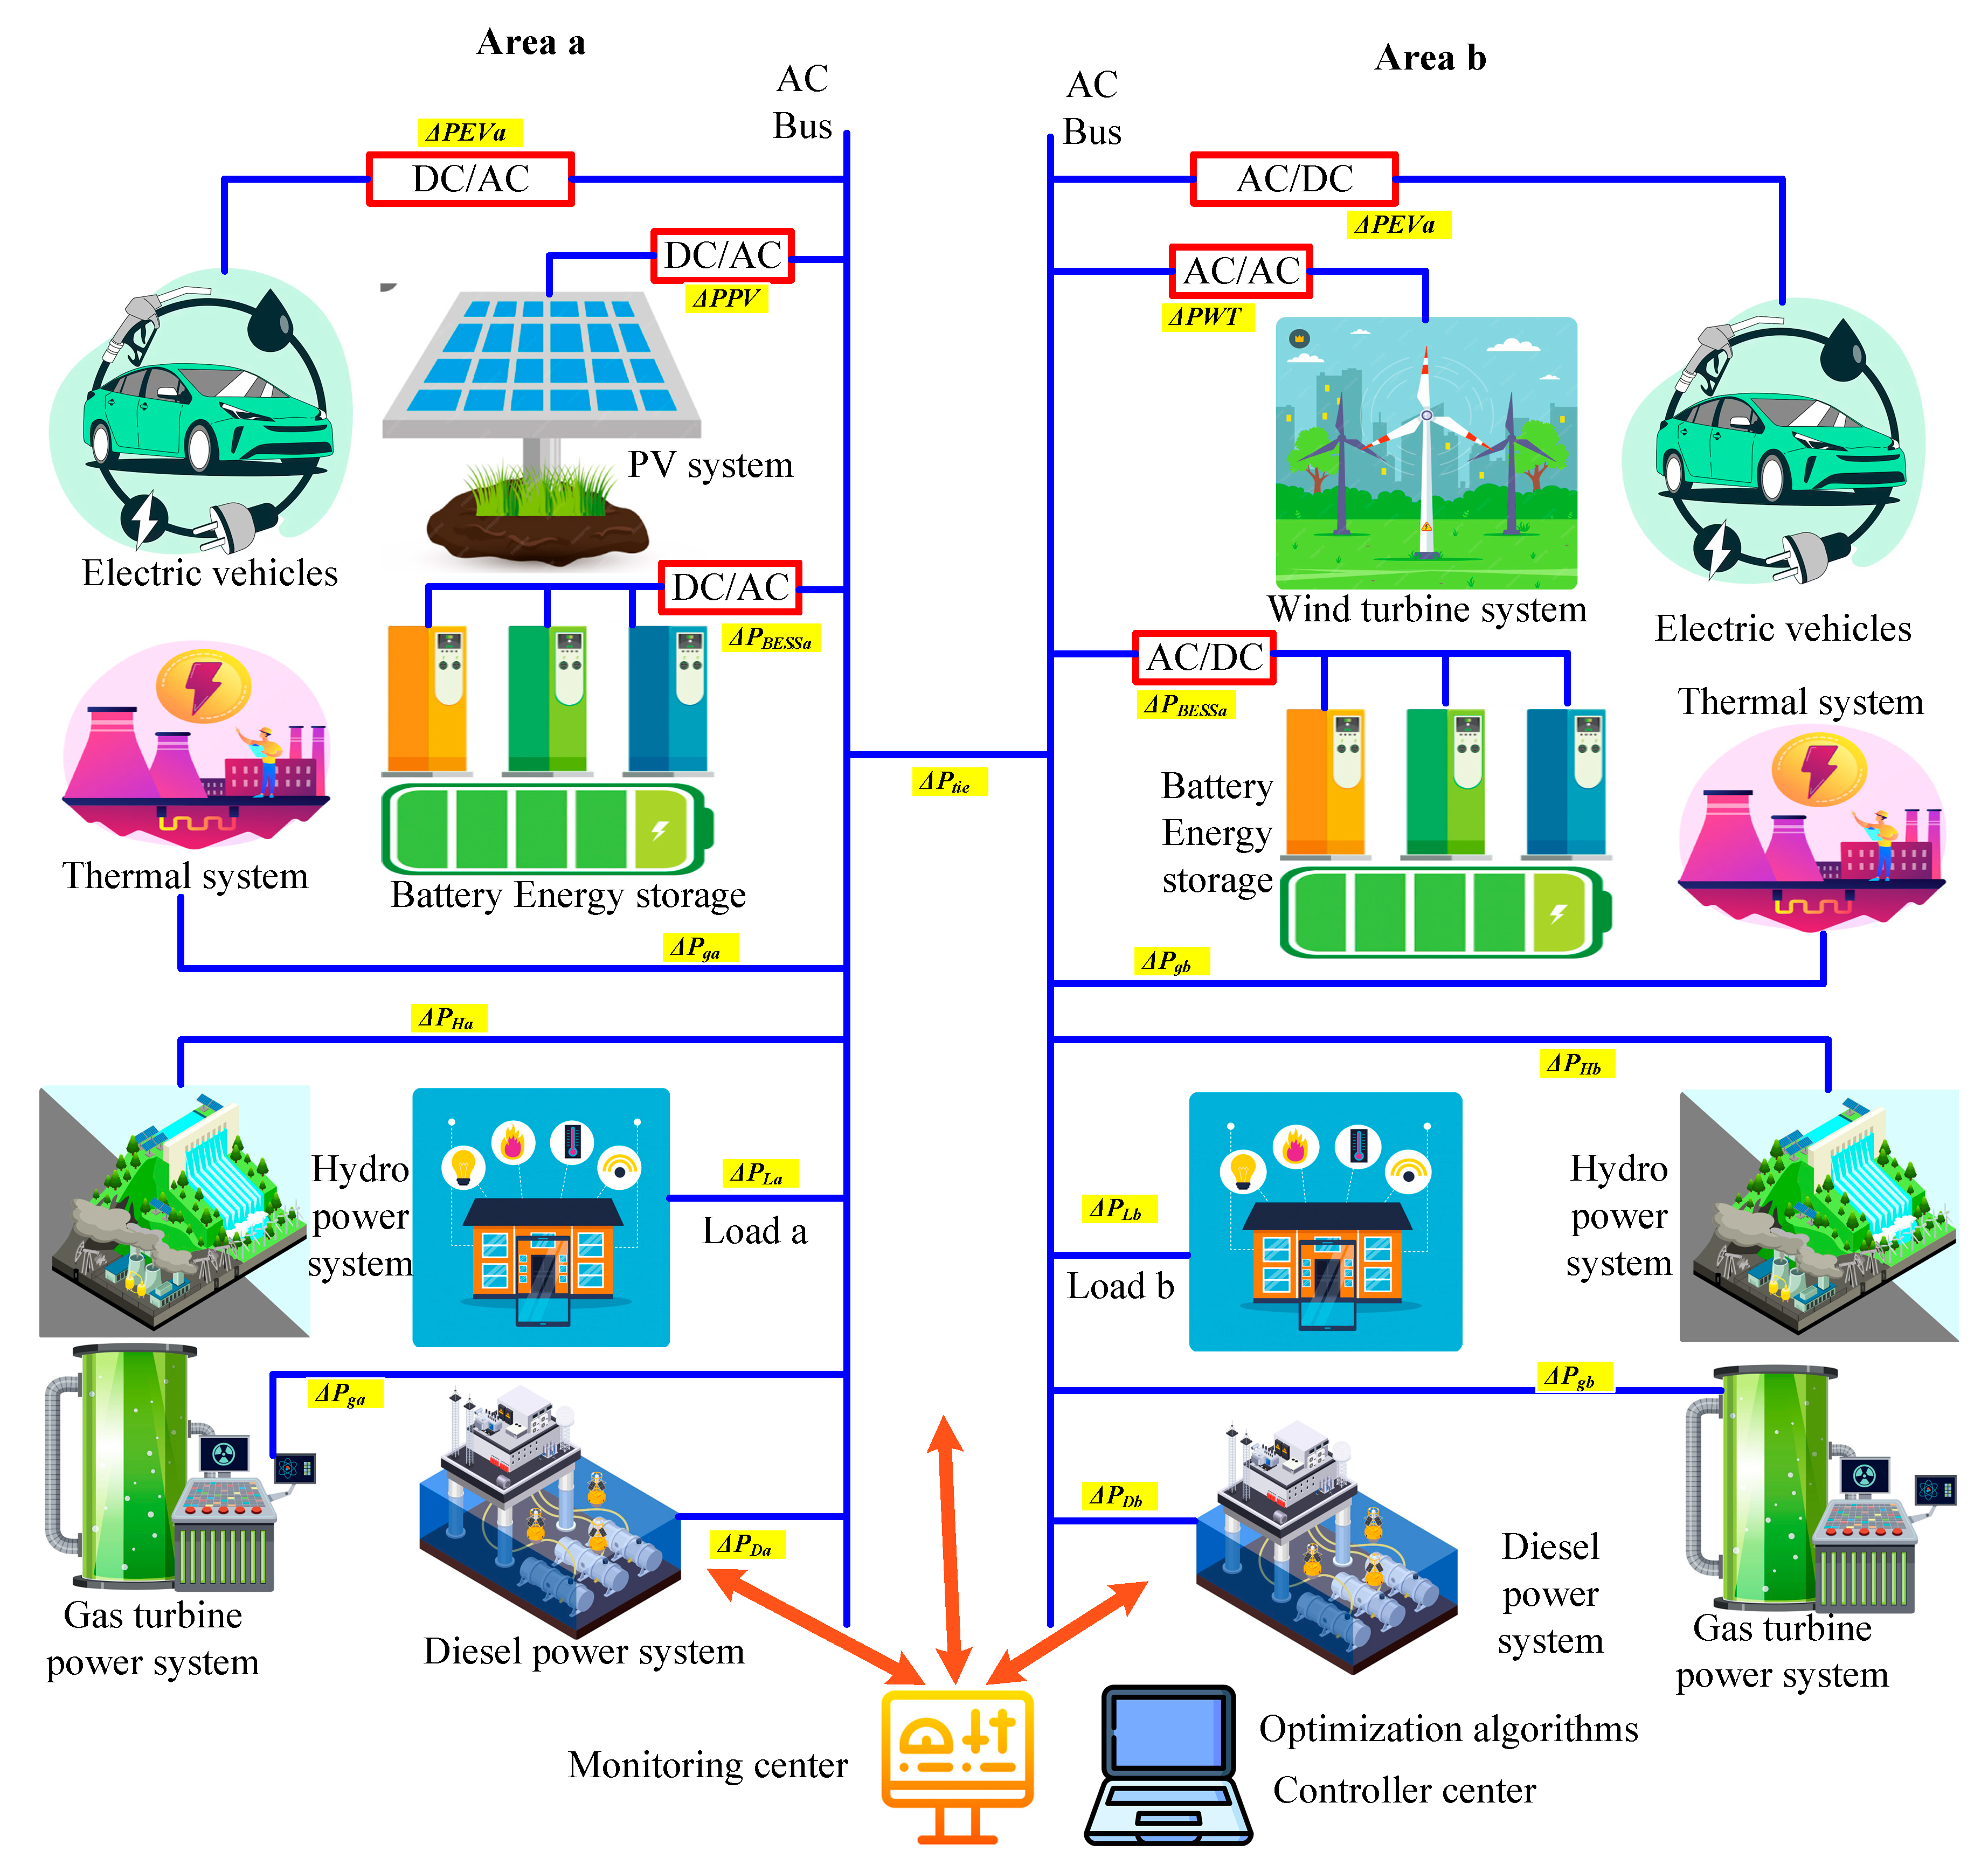
Integrated hybrid energy system with renewable, conventional, and storage units connected through AC buses and managed by centralized monitoring and optimization.
Figure 1.
Integrated hybrid energy system with renewable, conventional, and storage units connected through AC buses and managed by centralized monitoring and optimization.
Figure 2.
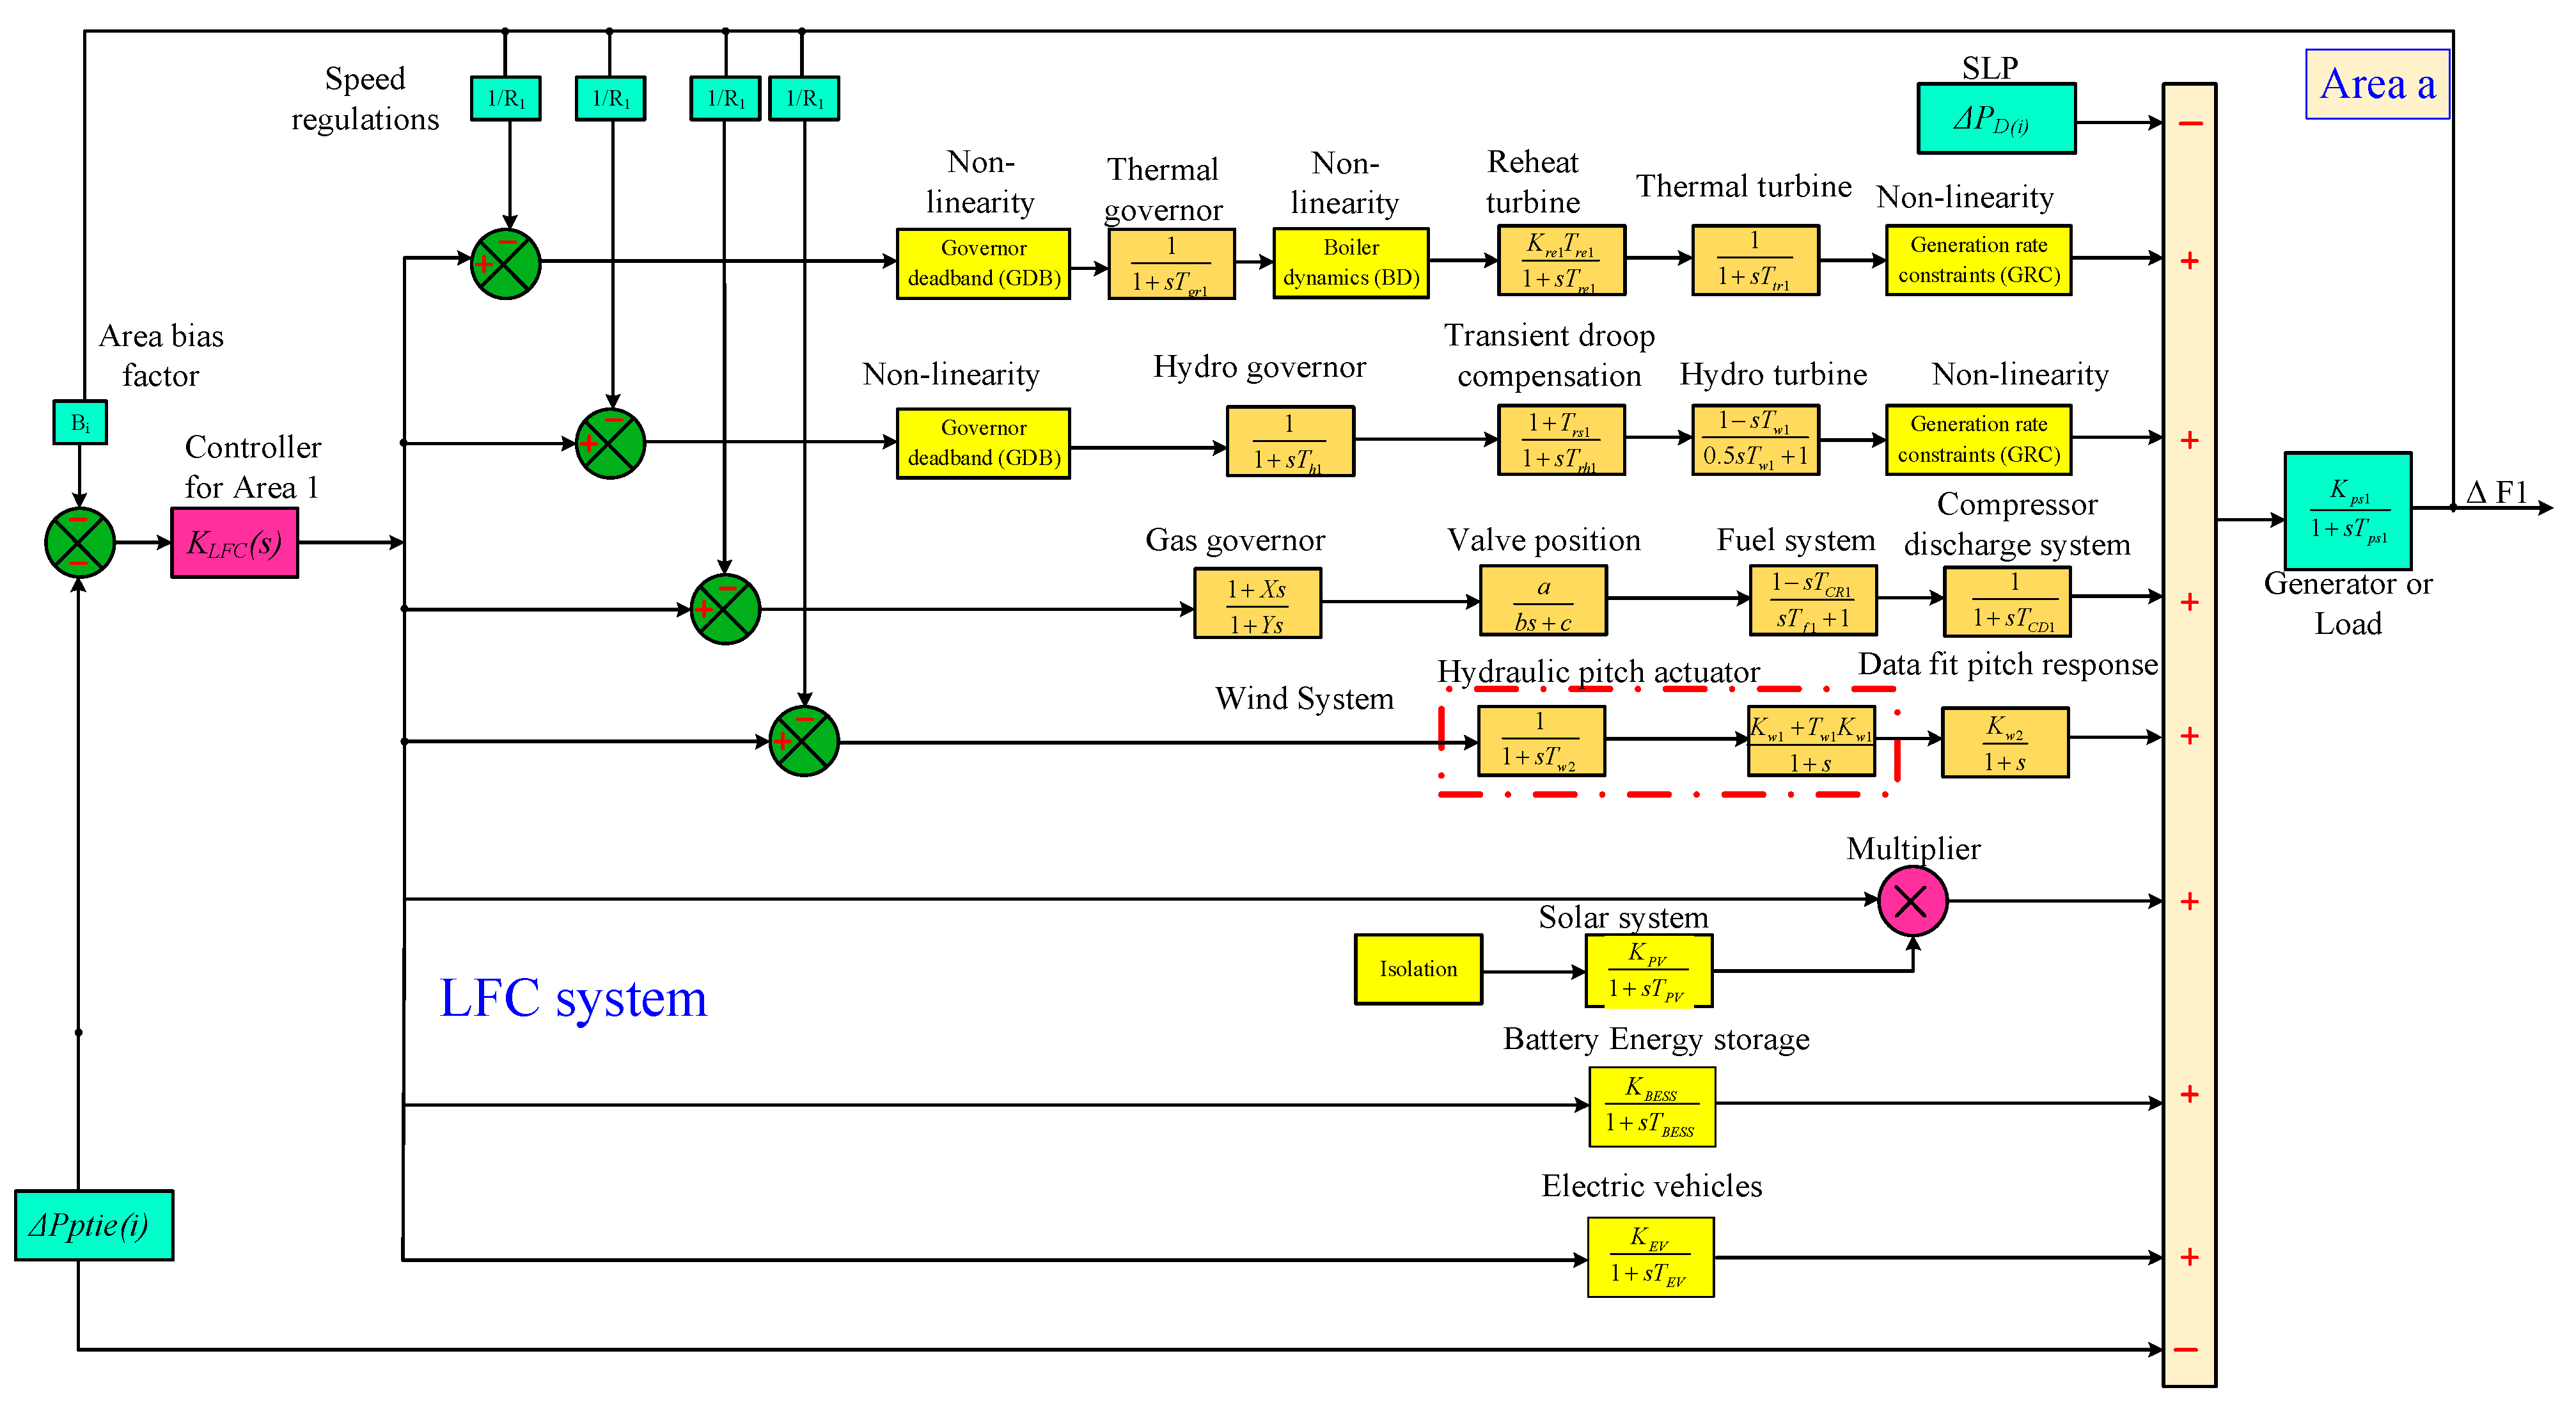
Detailed transfer function model of a multi-source LFC system integrating thermal, hydro, gas, wind, solar, battery storage, and electric vehicles to control power balance and frequency stability.
Figure 2.
Detailed transfer function model of a multi-source LFC system integrating thermal, hydro, gas, wind, solar, battery storage, and electric vehicles to control power balance and frequency stability.
Figure 3.
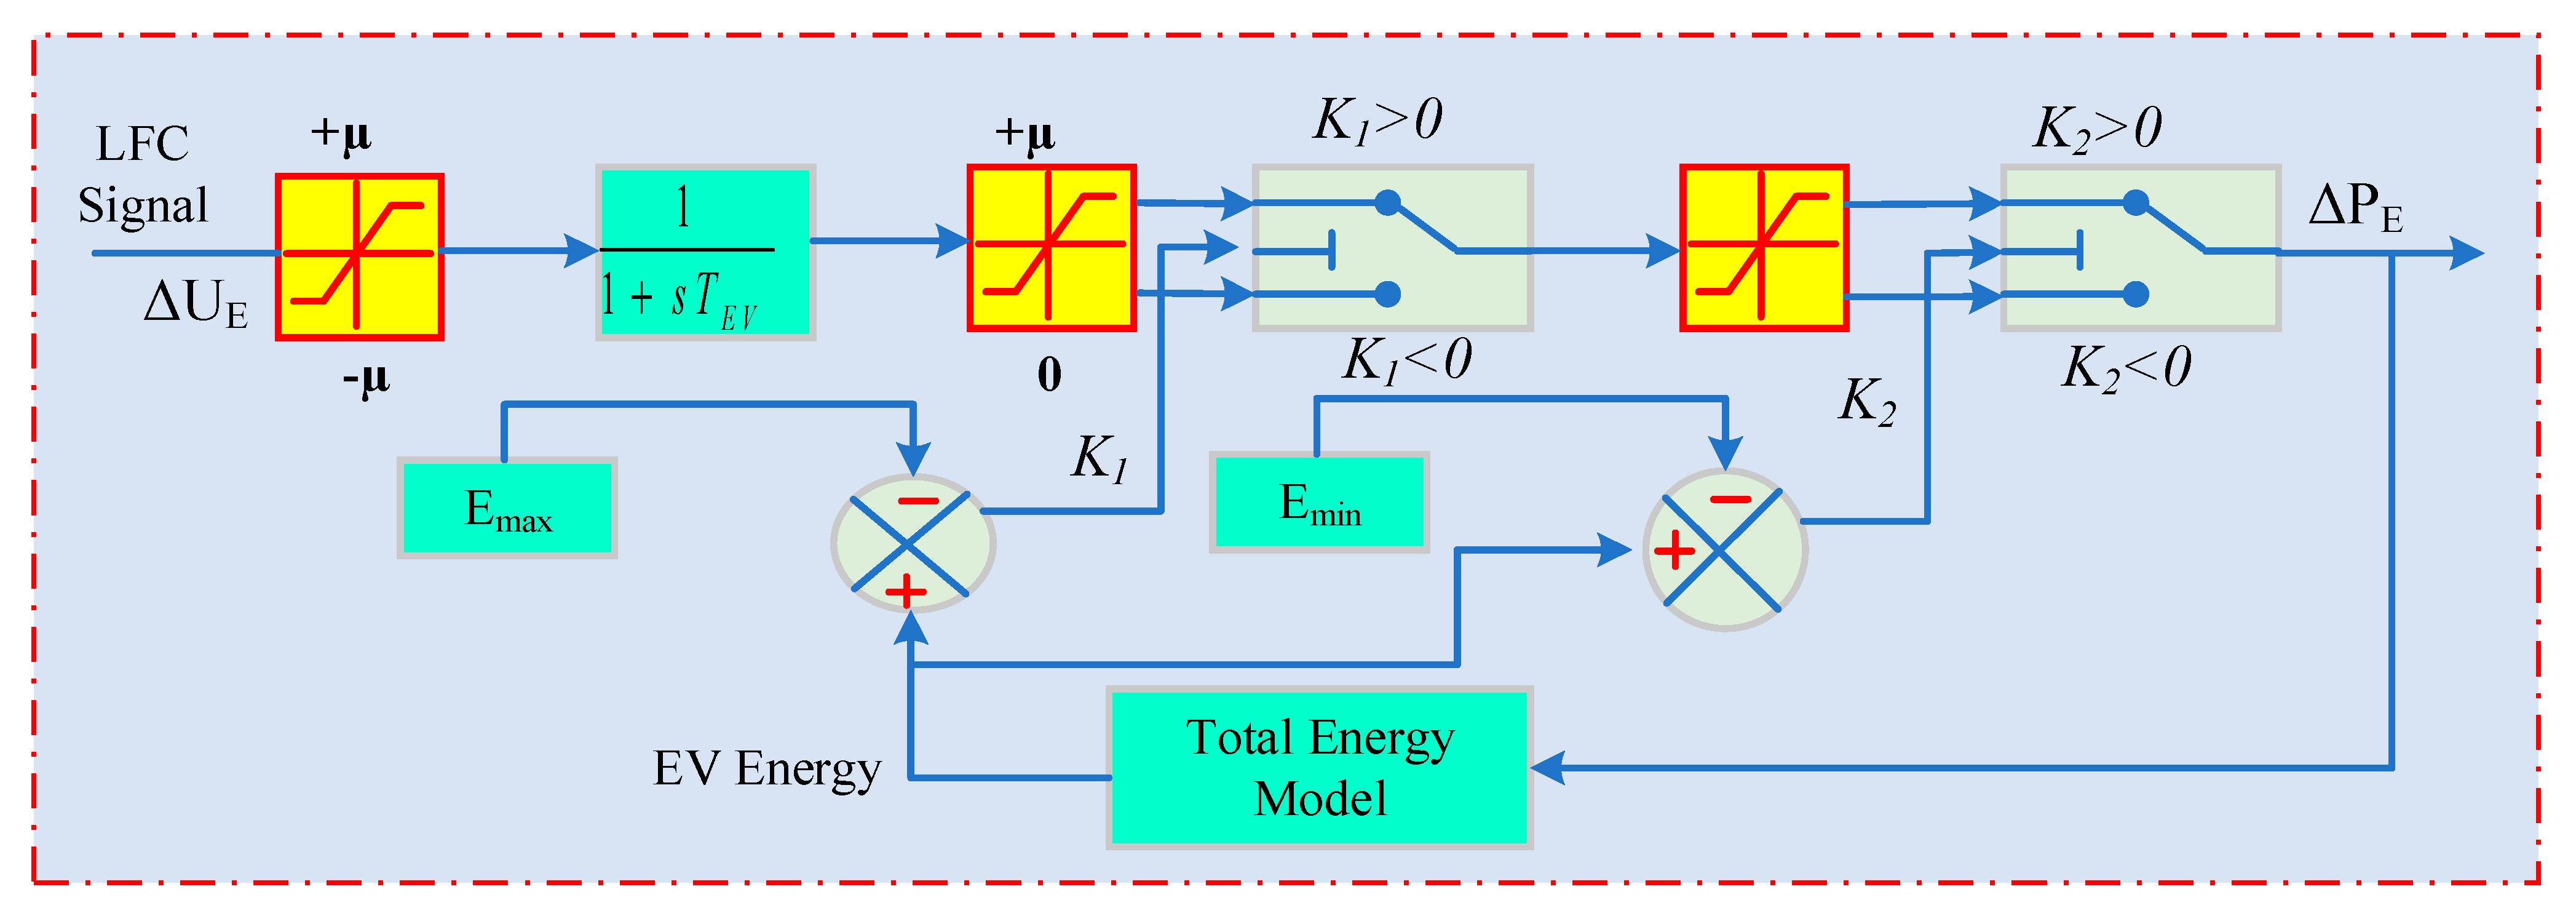
Model of plug-in electric vehicle.
Figure 3.
Model of plug-in electric vehicle.
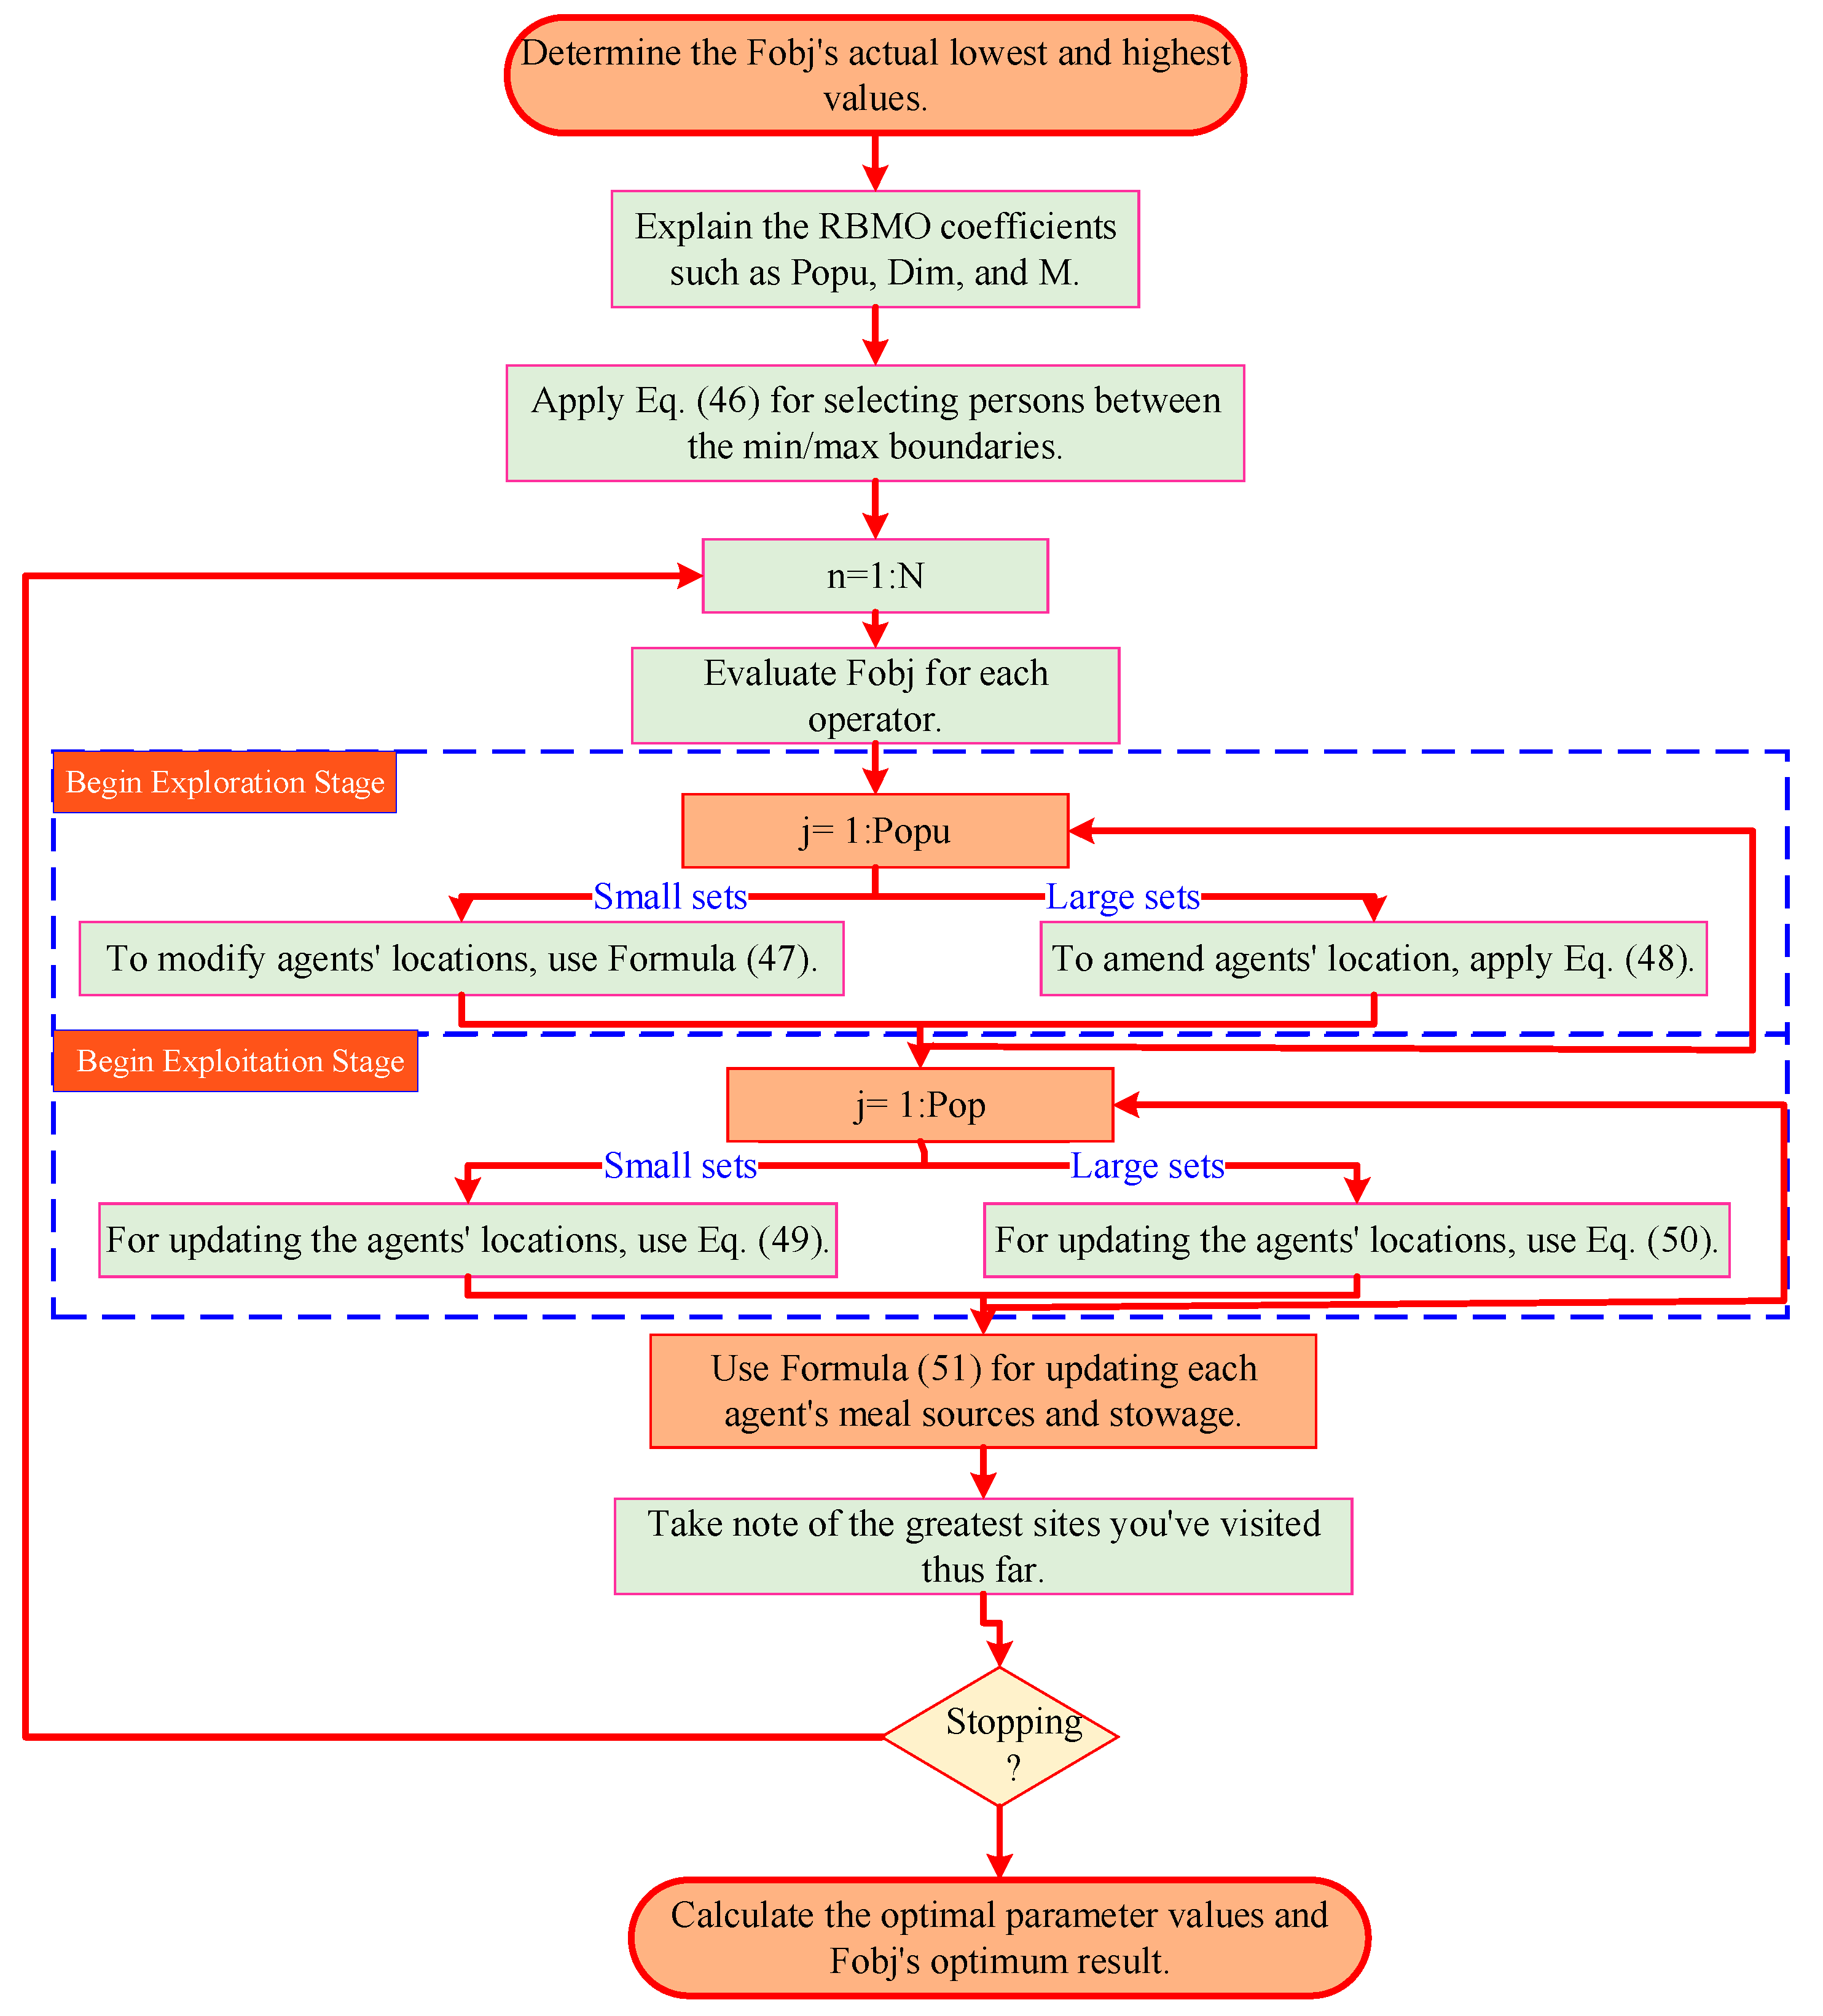
Figure 4.
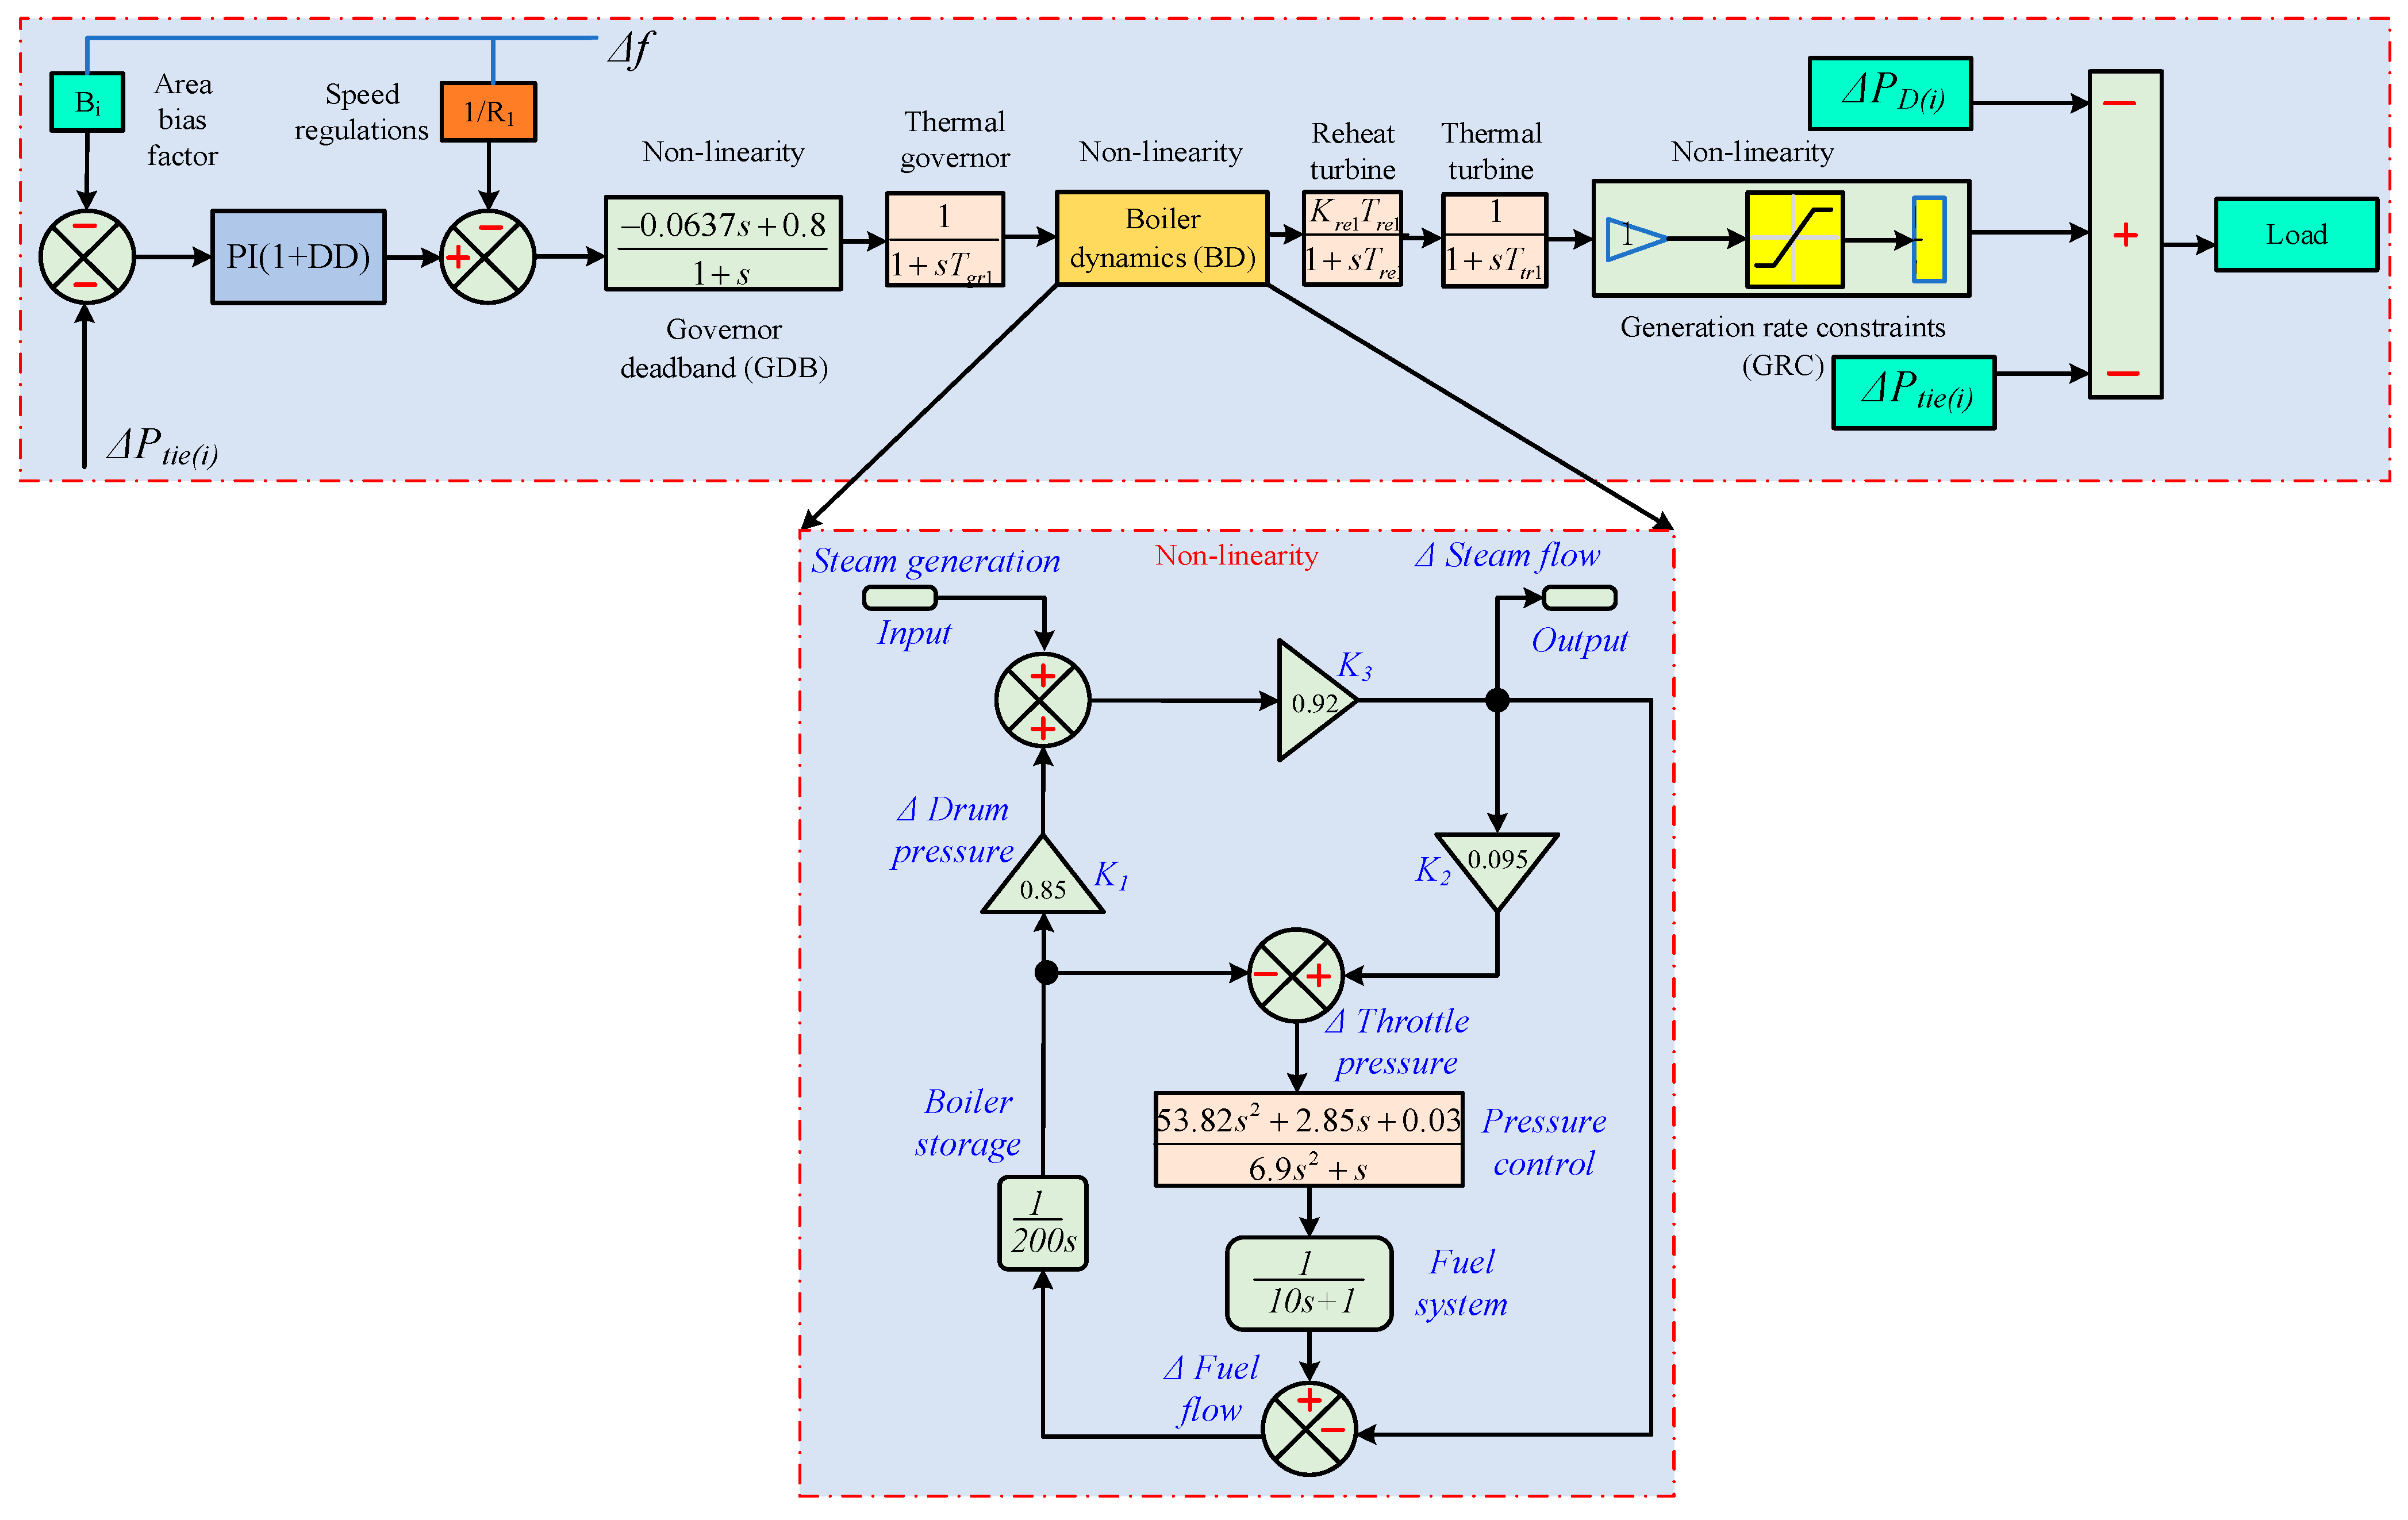
Nonlinearities in the LFC paradigm (GDB, BD, and GRC).
Figure 4.
Nonlinearities in the LFC paradigm (GDB, BD, and GRC).
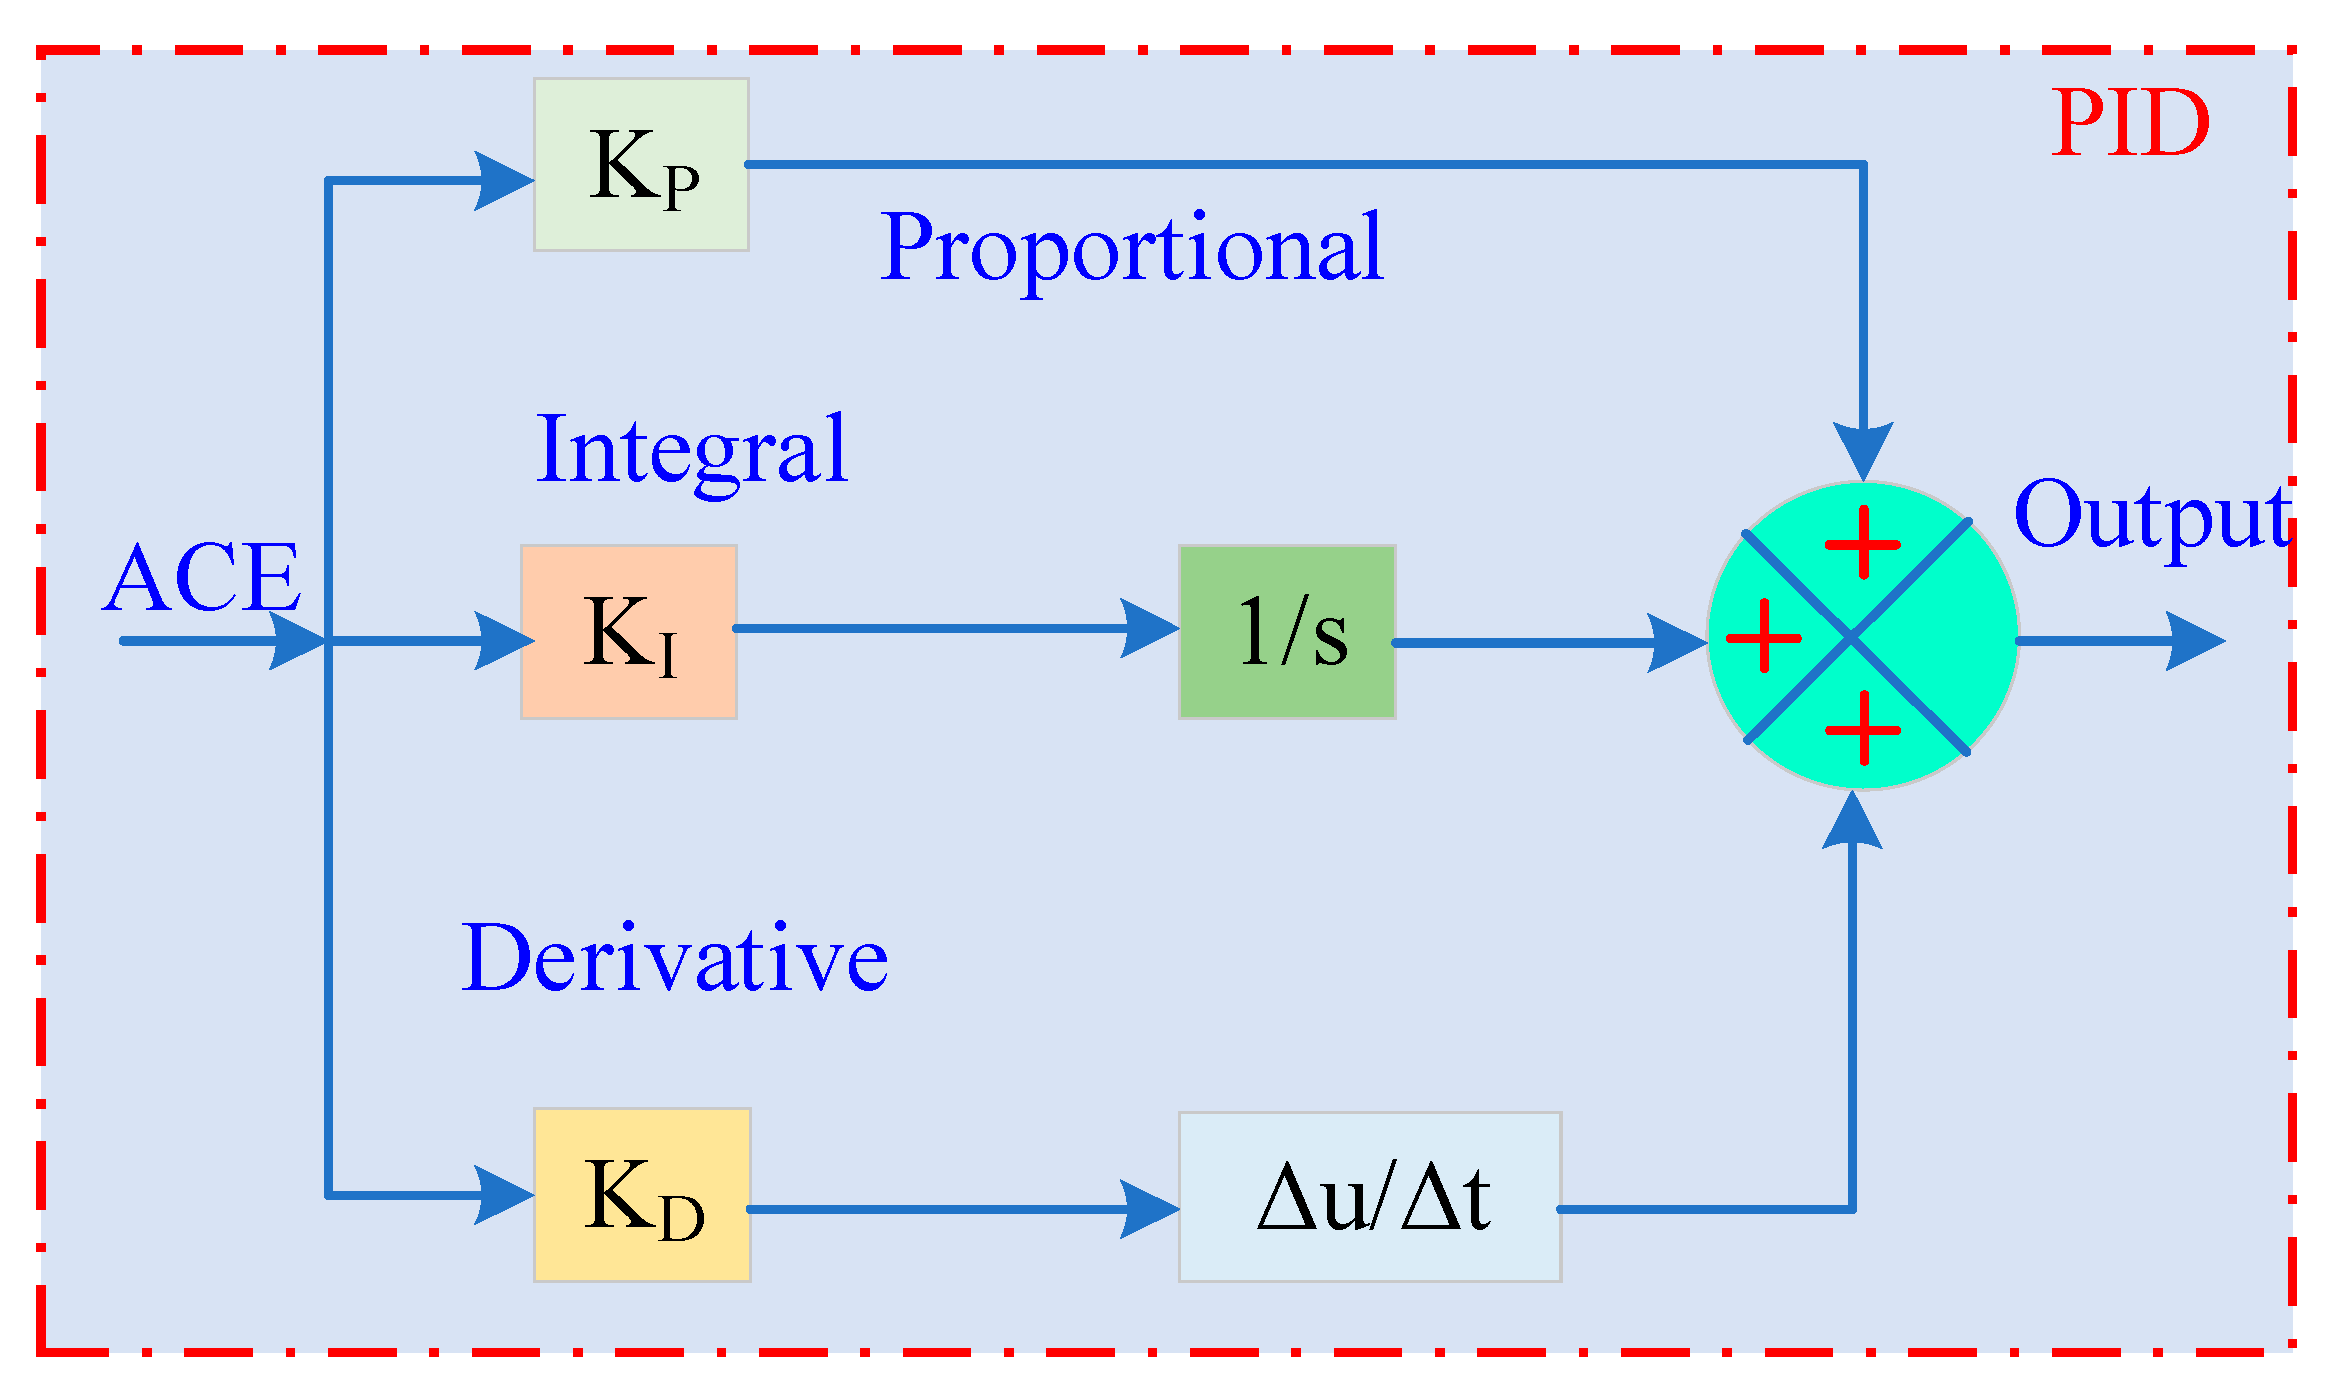
Figure 5.
Basic model of the traditional PID control.
Figure 5.
Basic model of the traditional PID control.
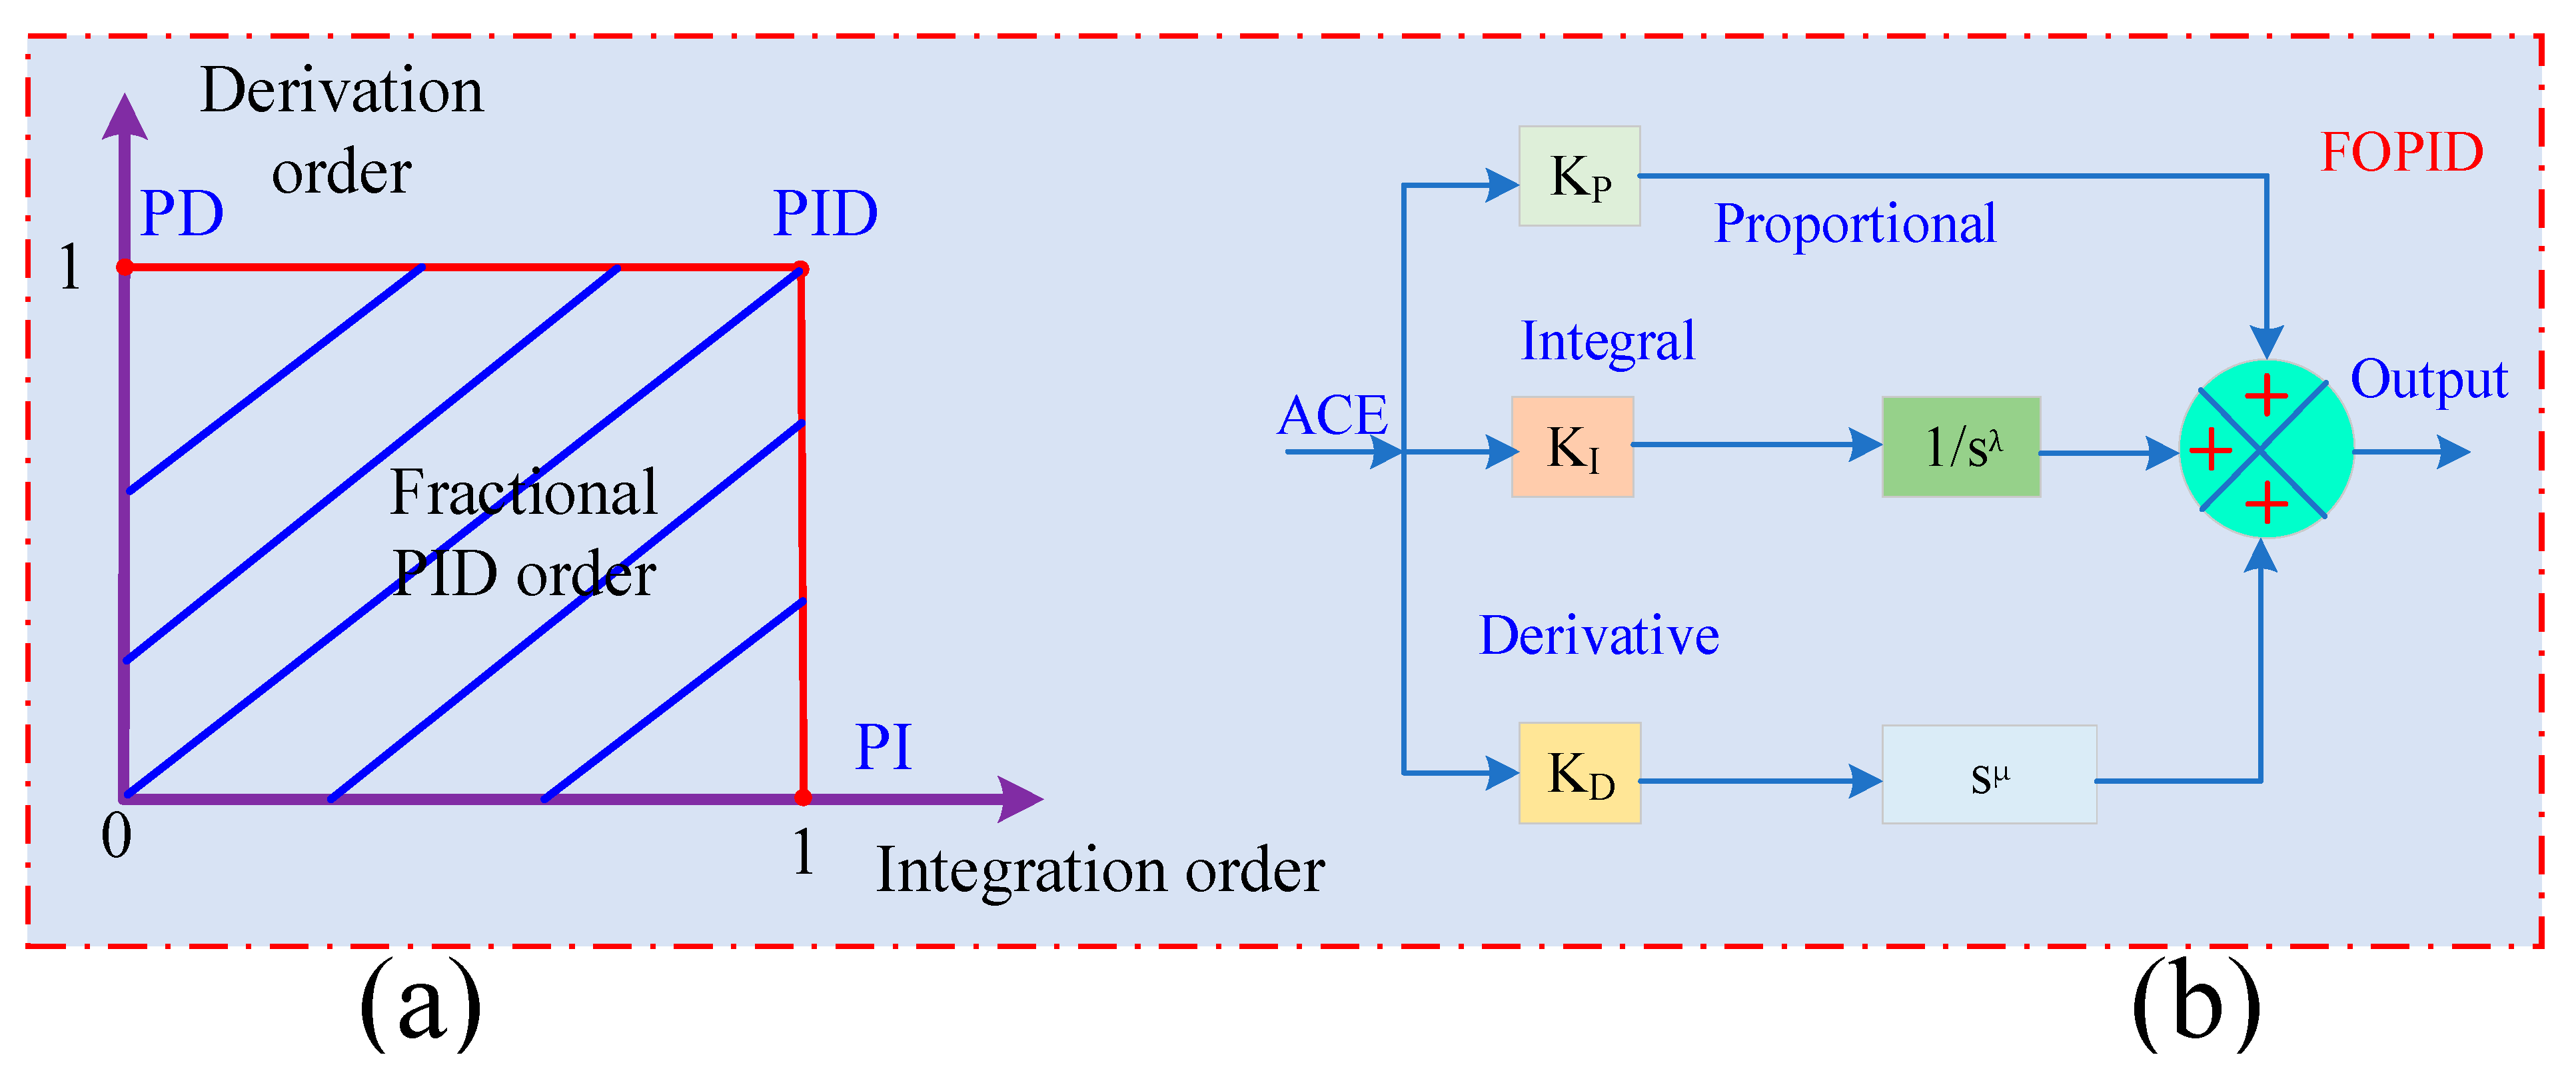
Figure 6.
(a) Fractional-order PID form, (b) block of the classical FOPID controller.
Figure 6.
(a) Fractional-order PID form, (b) block of the classical FOPID controller.
Figure 7.
Fuzzy PID controller model.
Figure 7.
Fuzzy PID controller model.
Figure 8.
Fuzzy fractional ordered FLC scheme.
Figure 8.
Fuzzy fractional ordered FLC scheme.
Figure 9.
(a) SMC-based FLC loop. (b) Sliding surface re.
Figure 9.
(a) SMC-based FLC loop. (b) Sliding surface re.
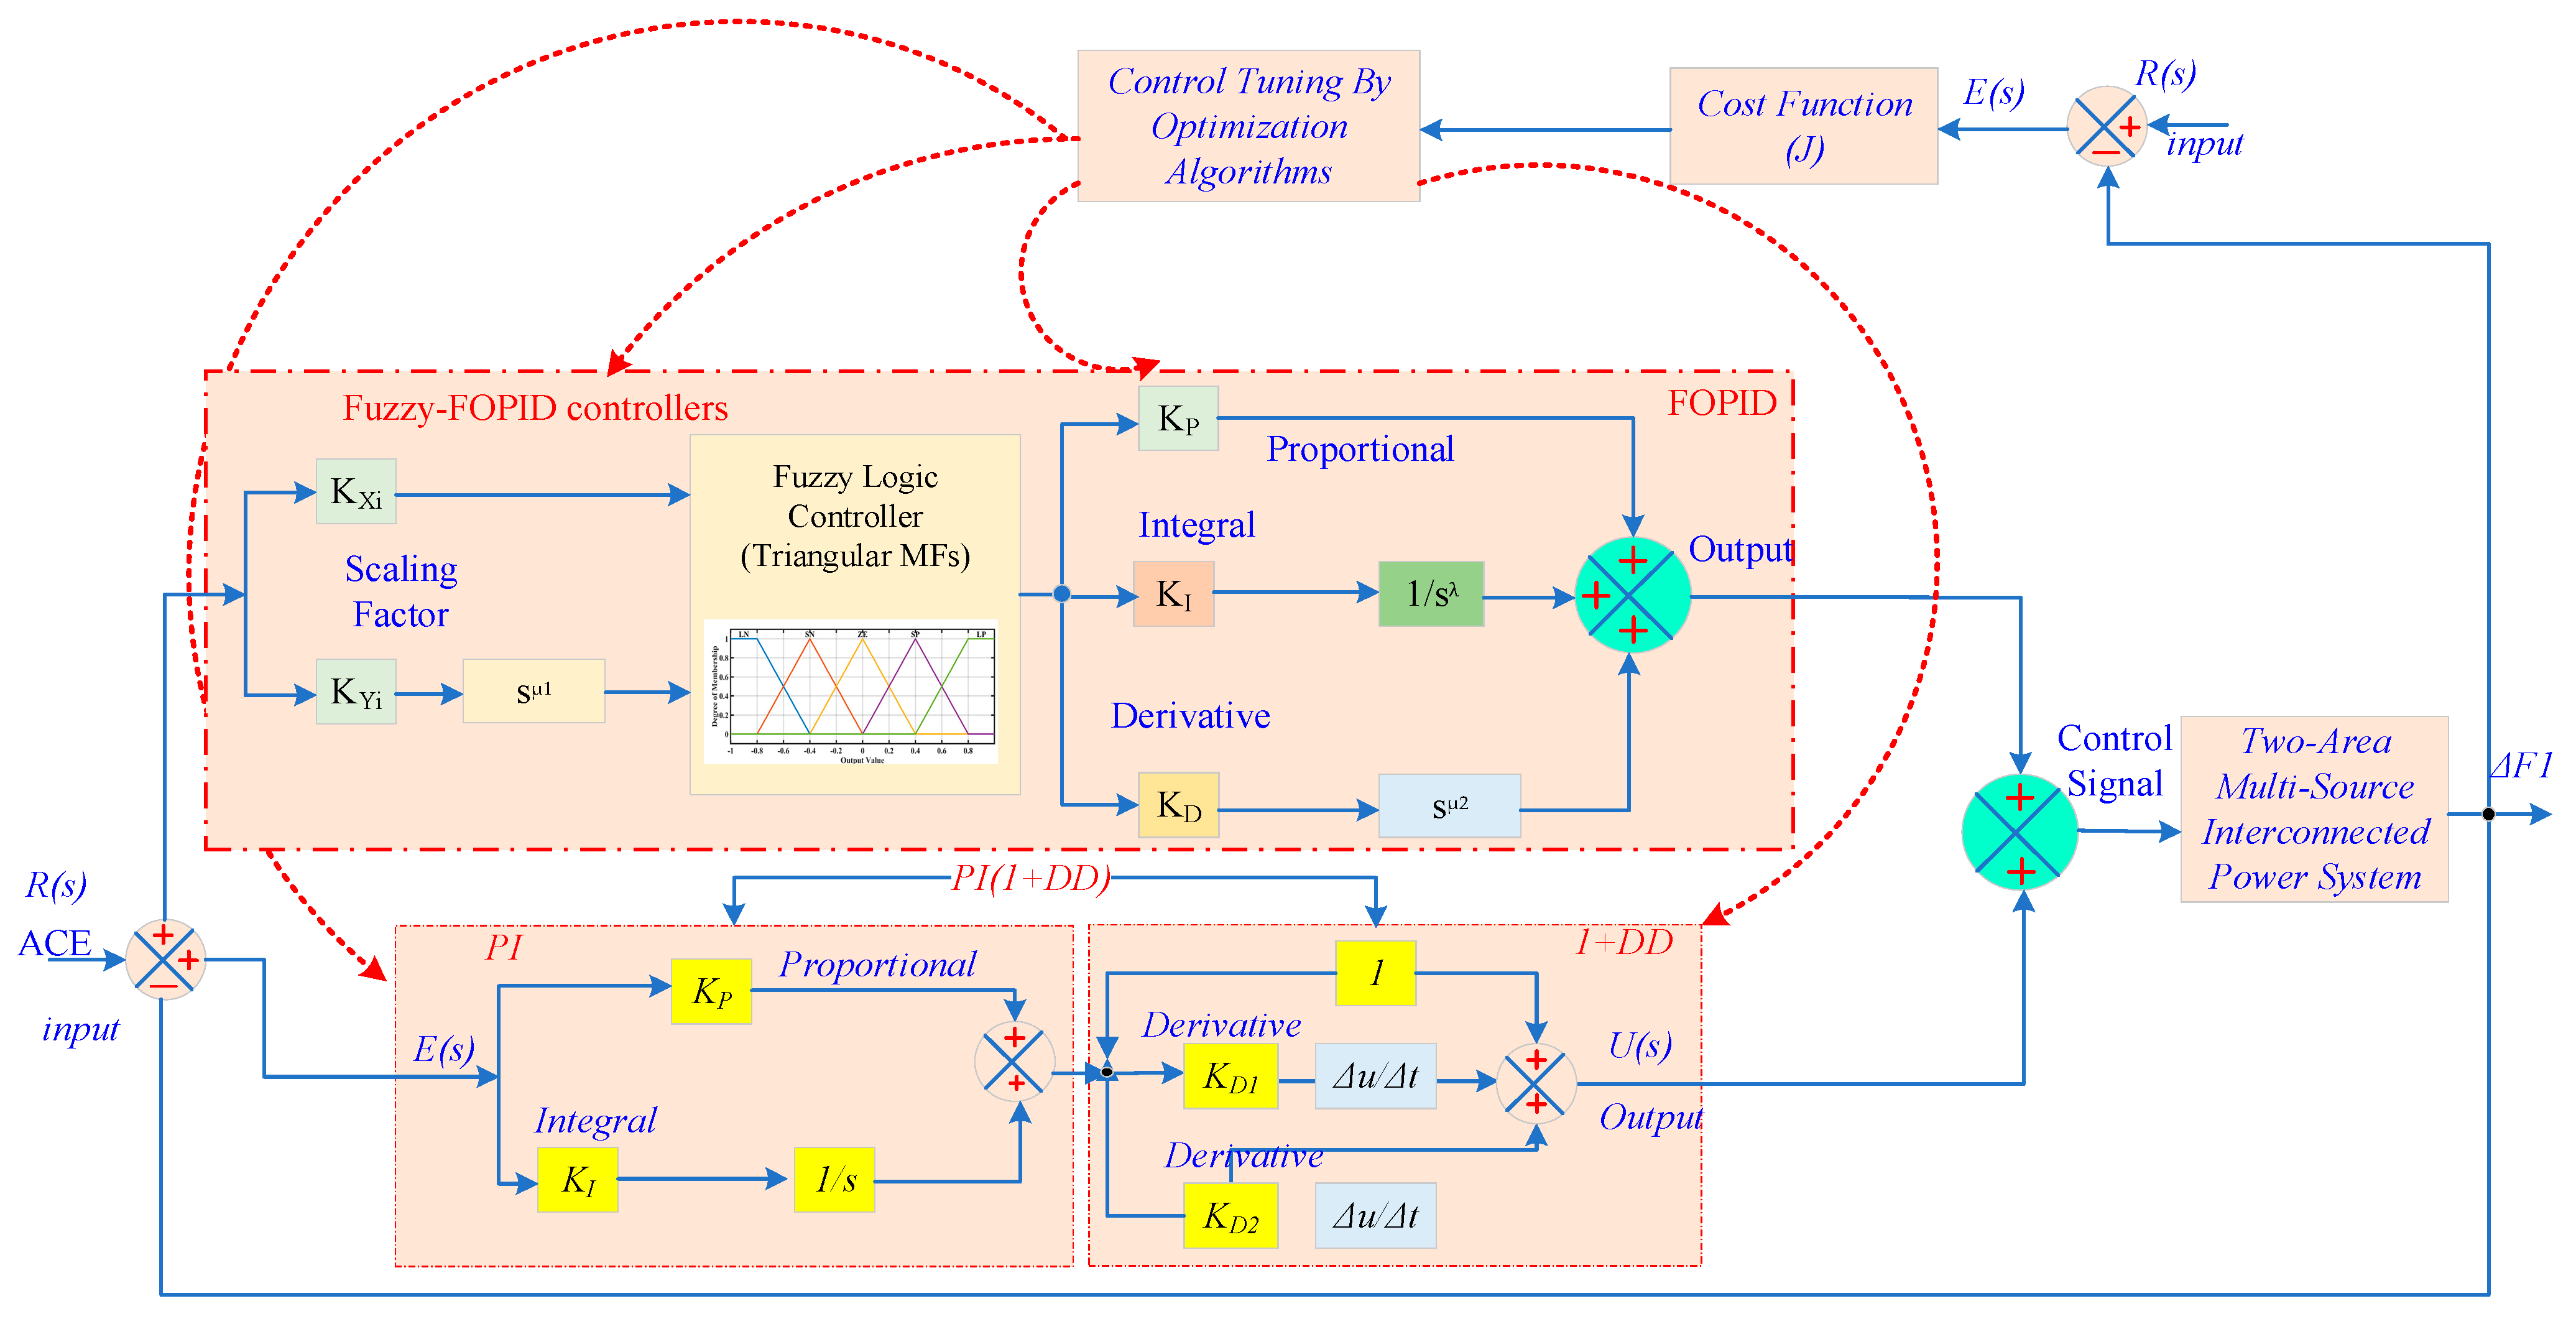
Figure 10.
The configuration of the proposed LFC system.
Figure 10.
The configuration of the proposed LFC system.
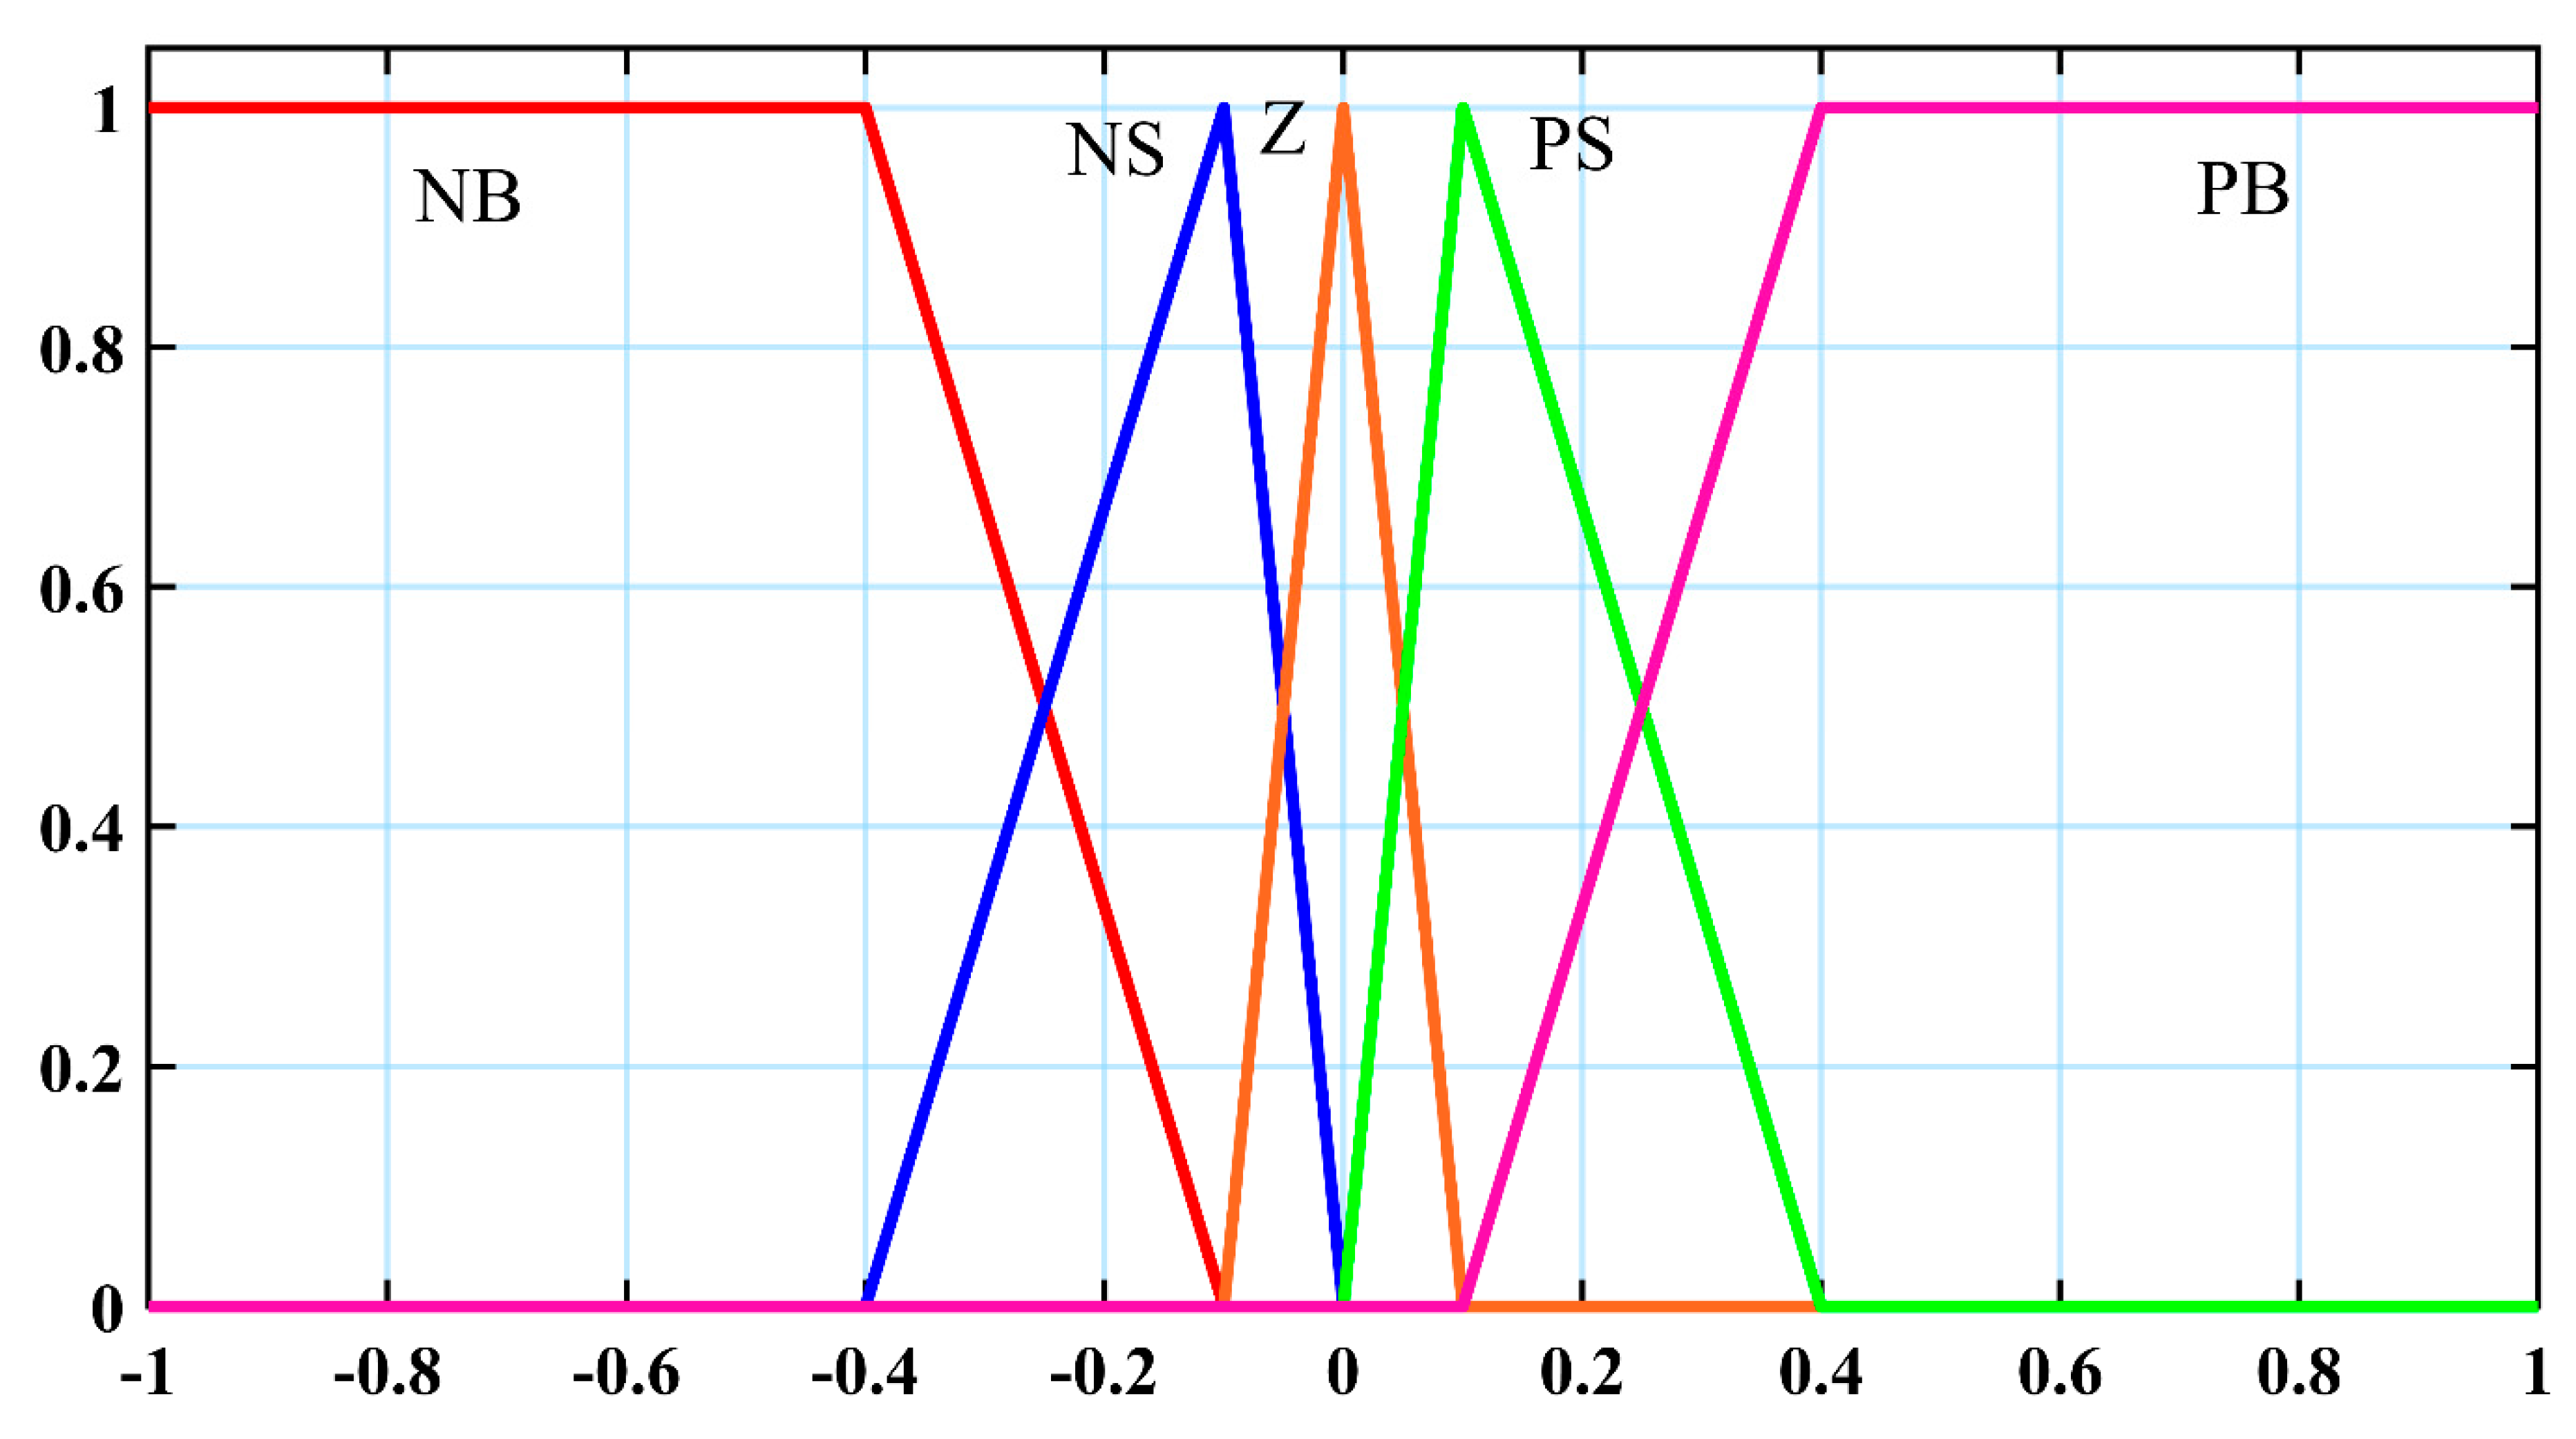
Figure 11.
FLC membership functions.
Figure 11.
FLC membership functions.
Figure 12.
The RBBMO workflow.
Figure 12.
The RBBMO workflow.
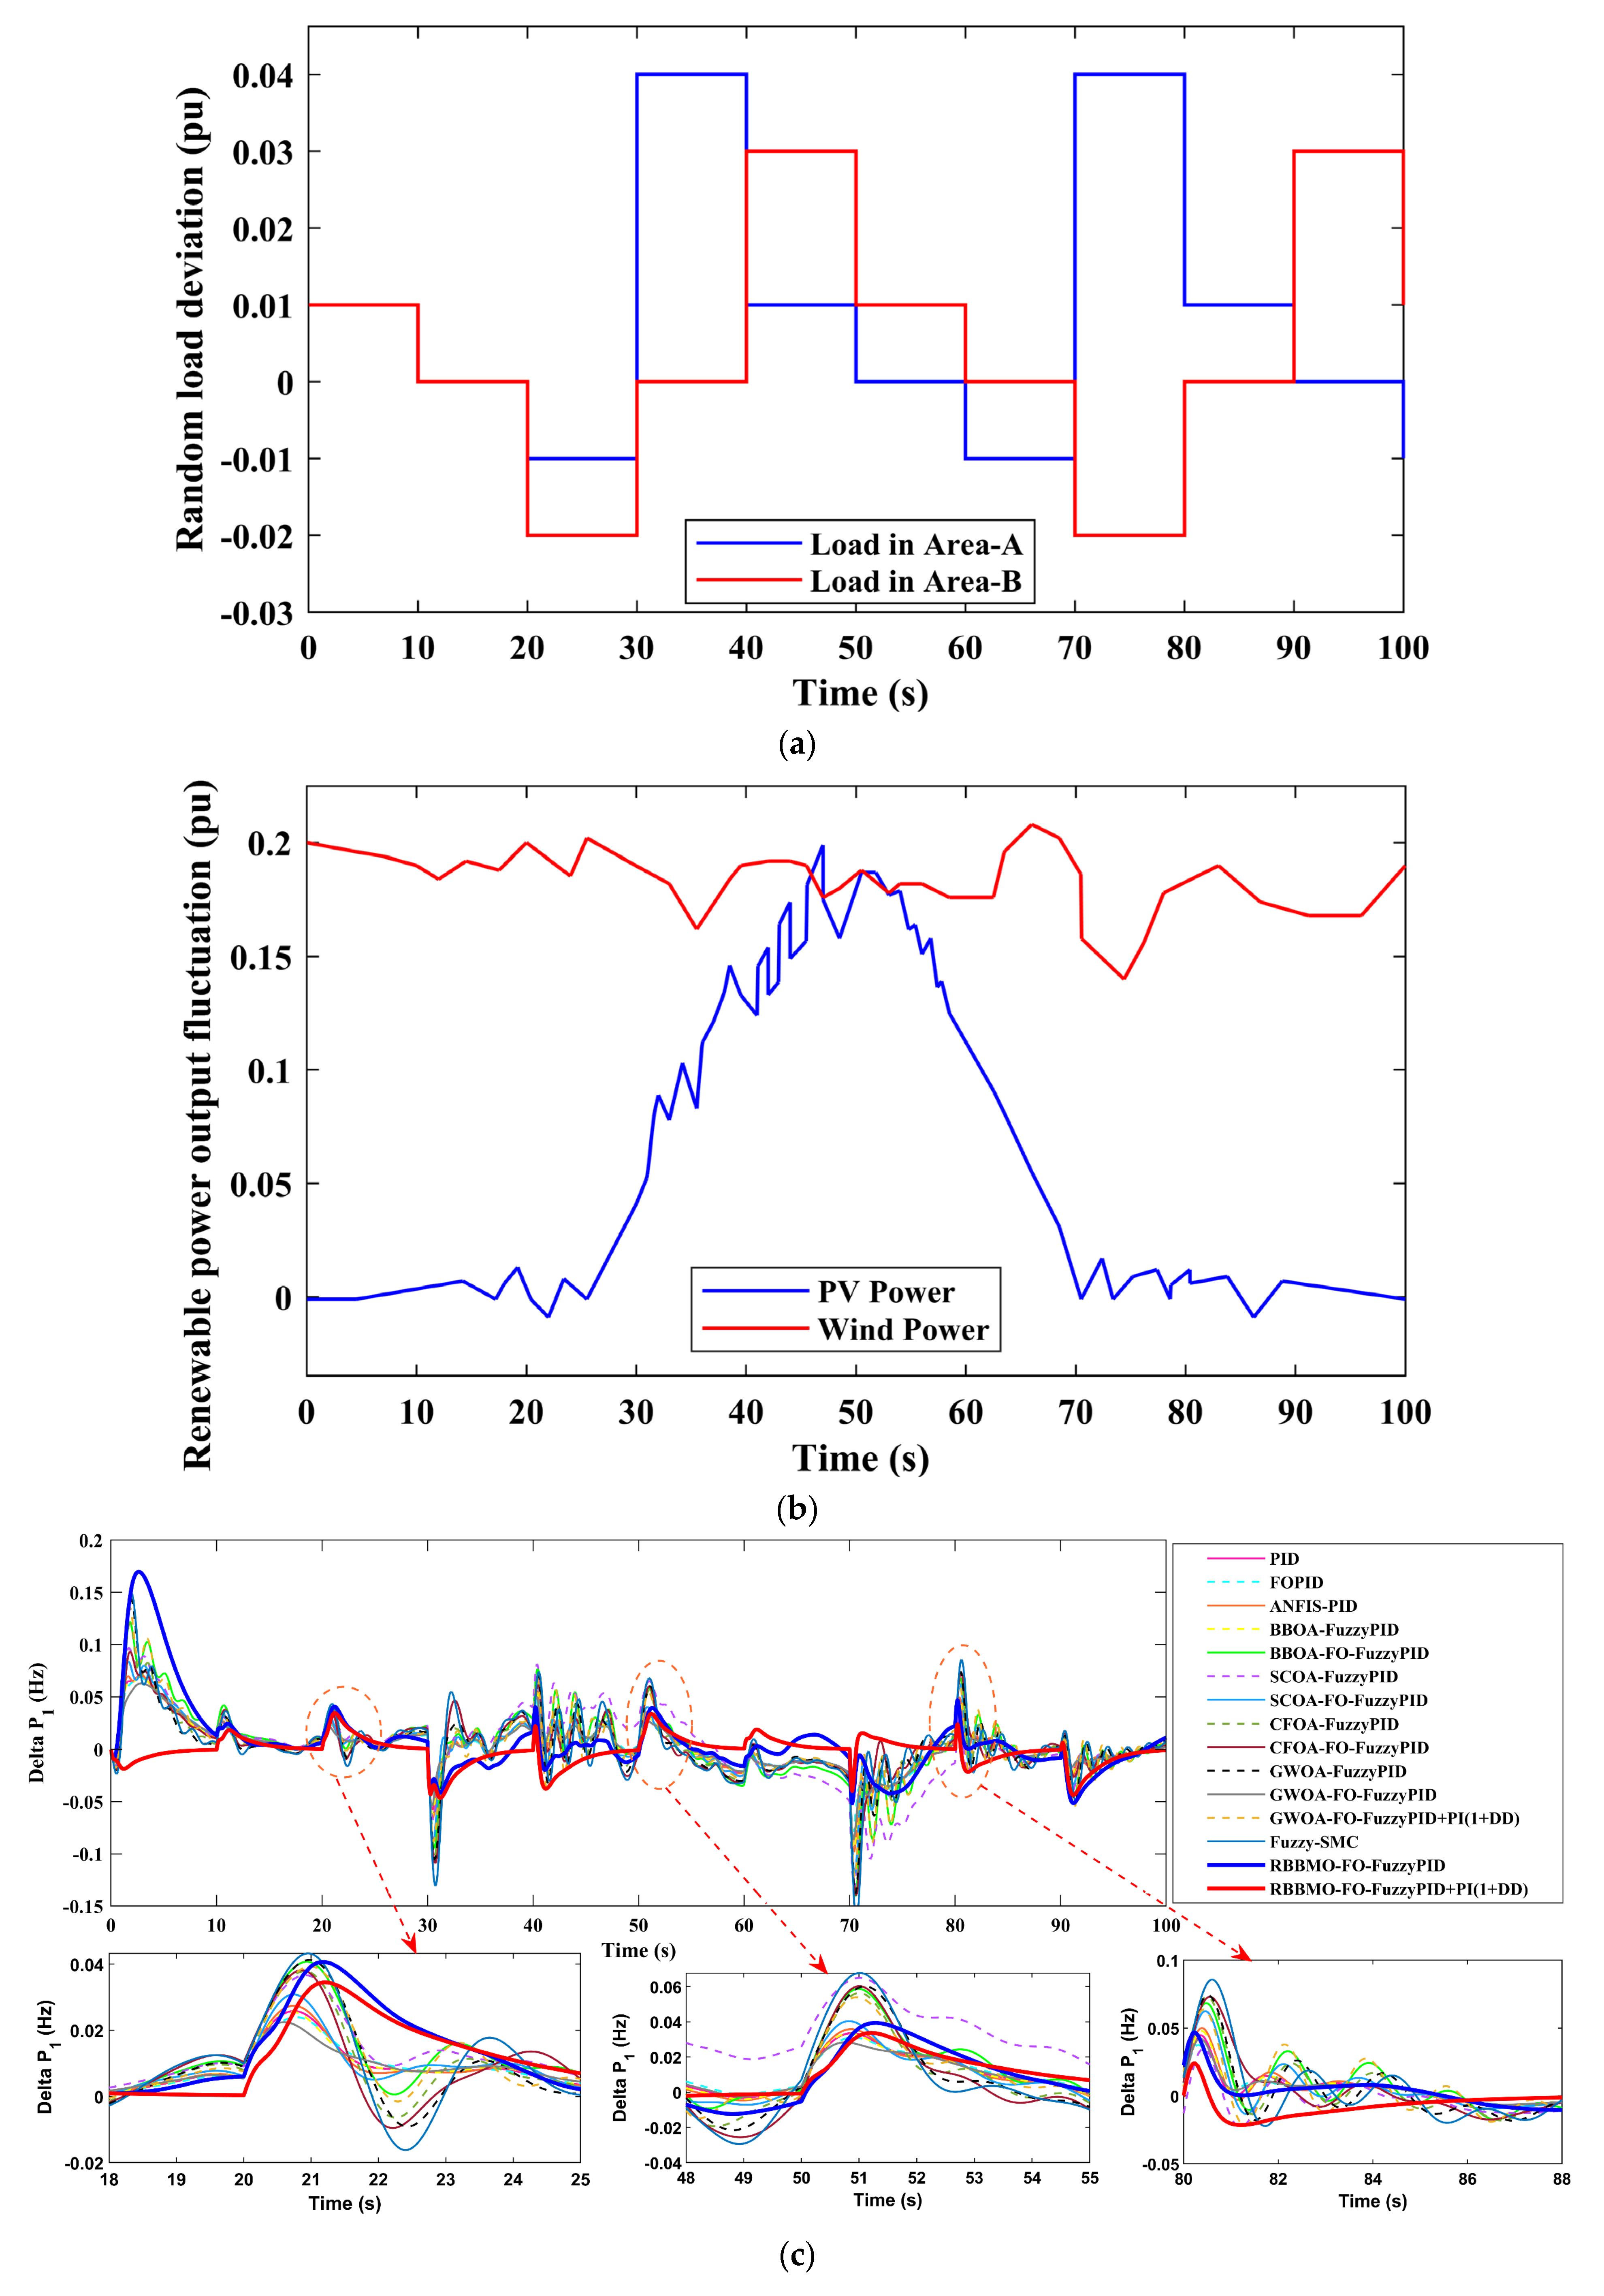
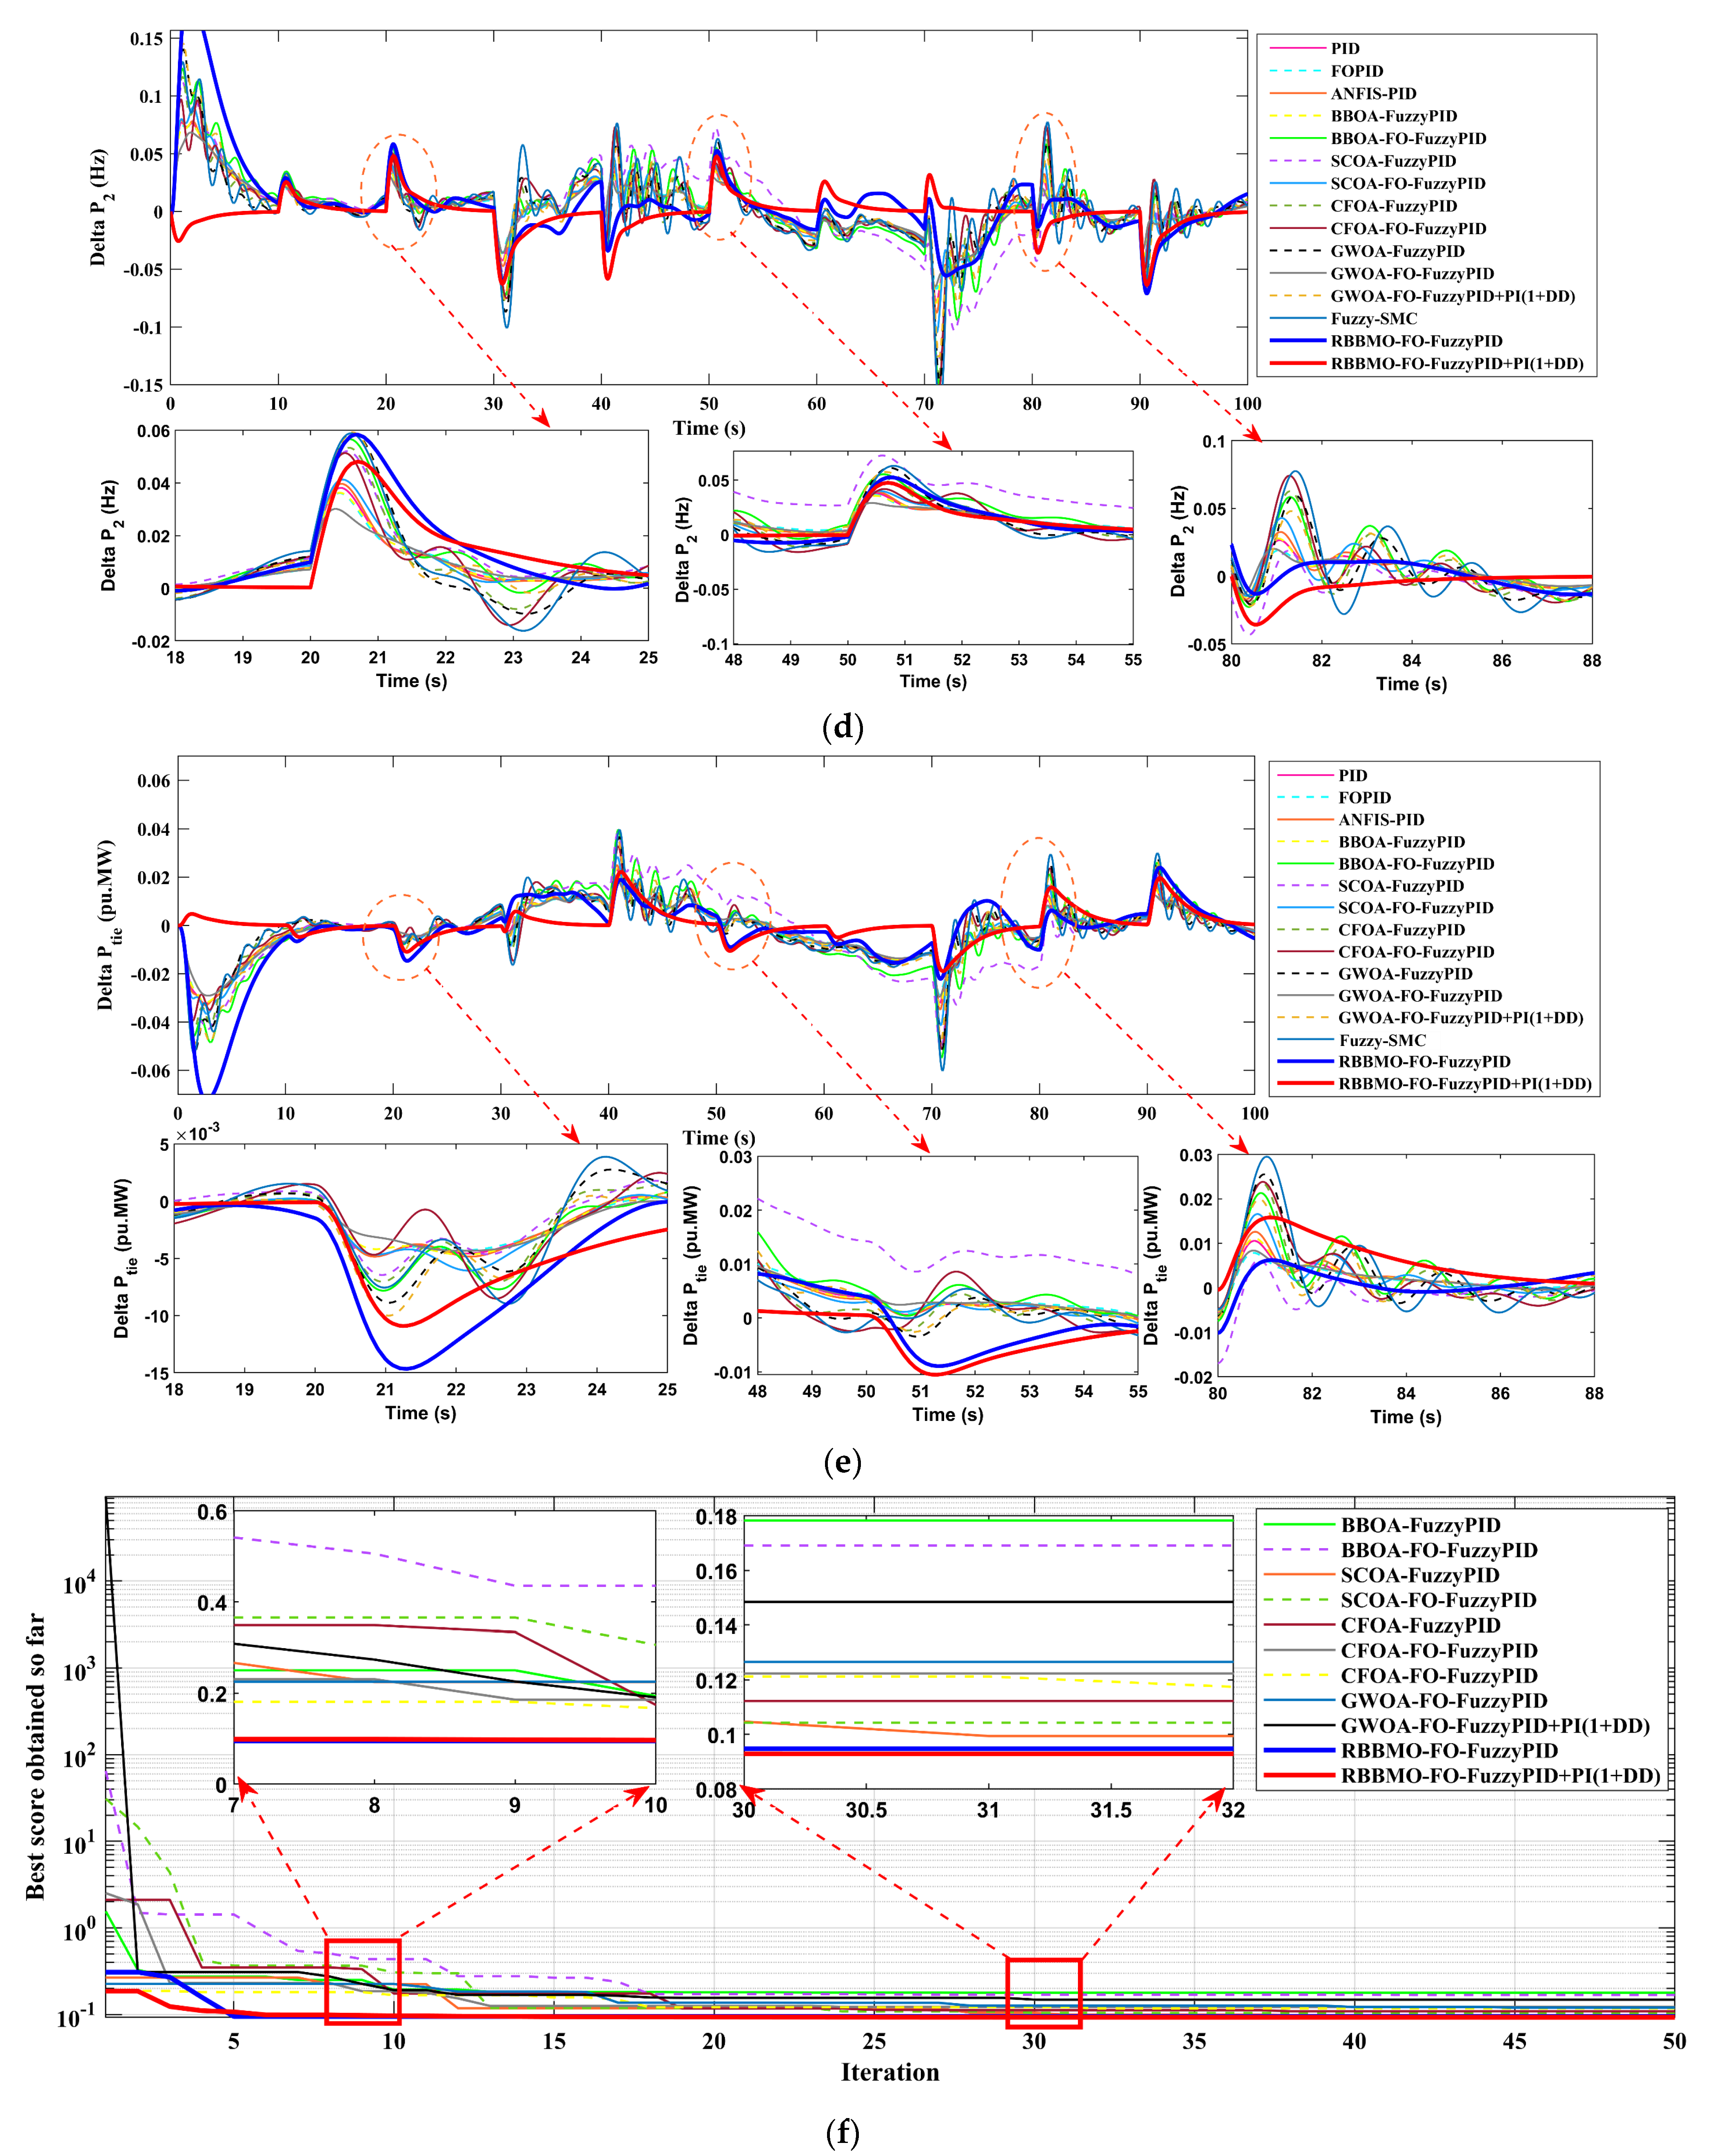
Figure 13.
Performance of two-area LFC under renewable and load uncertainties: (a) random load deviations in the two areas; (b) renewable power fluctuations; (c) Area-a frequency deviation (Δf_1); (d) Area-b frequency deviation (Δf_2); (e) tie-line power deviation (ΔPtie) and (f) optimizer convergence for all tuning algorithms.
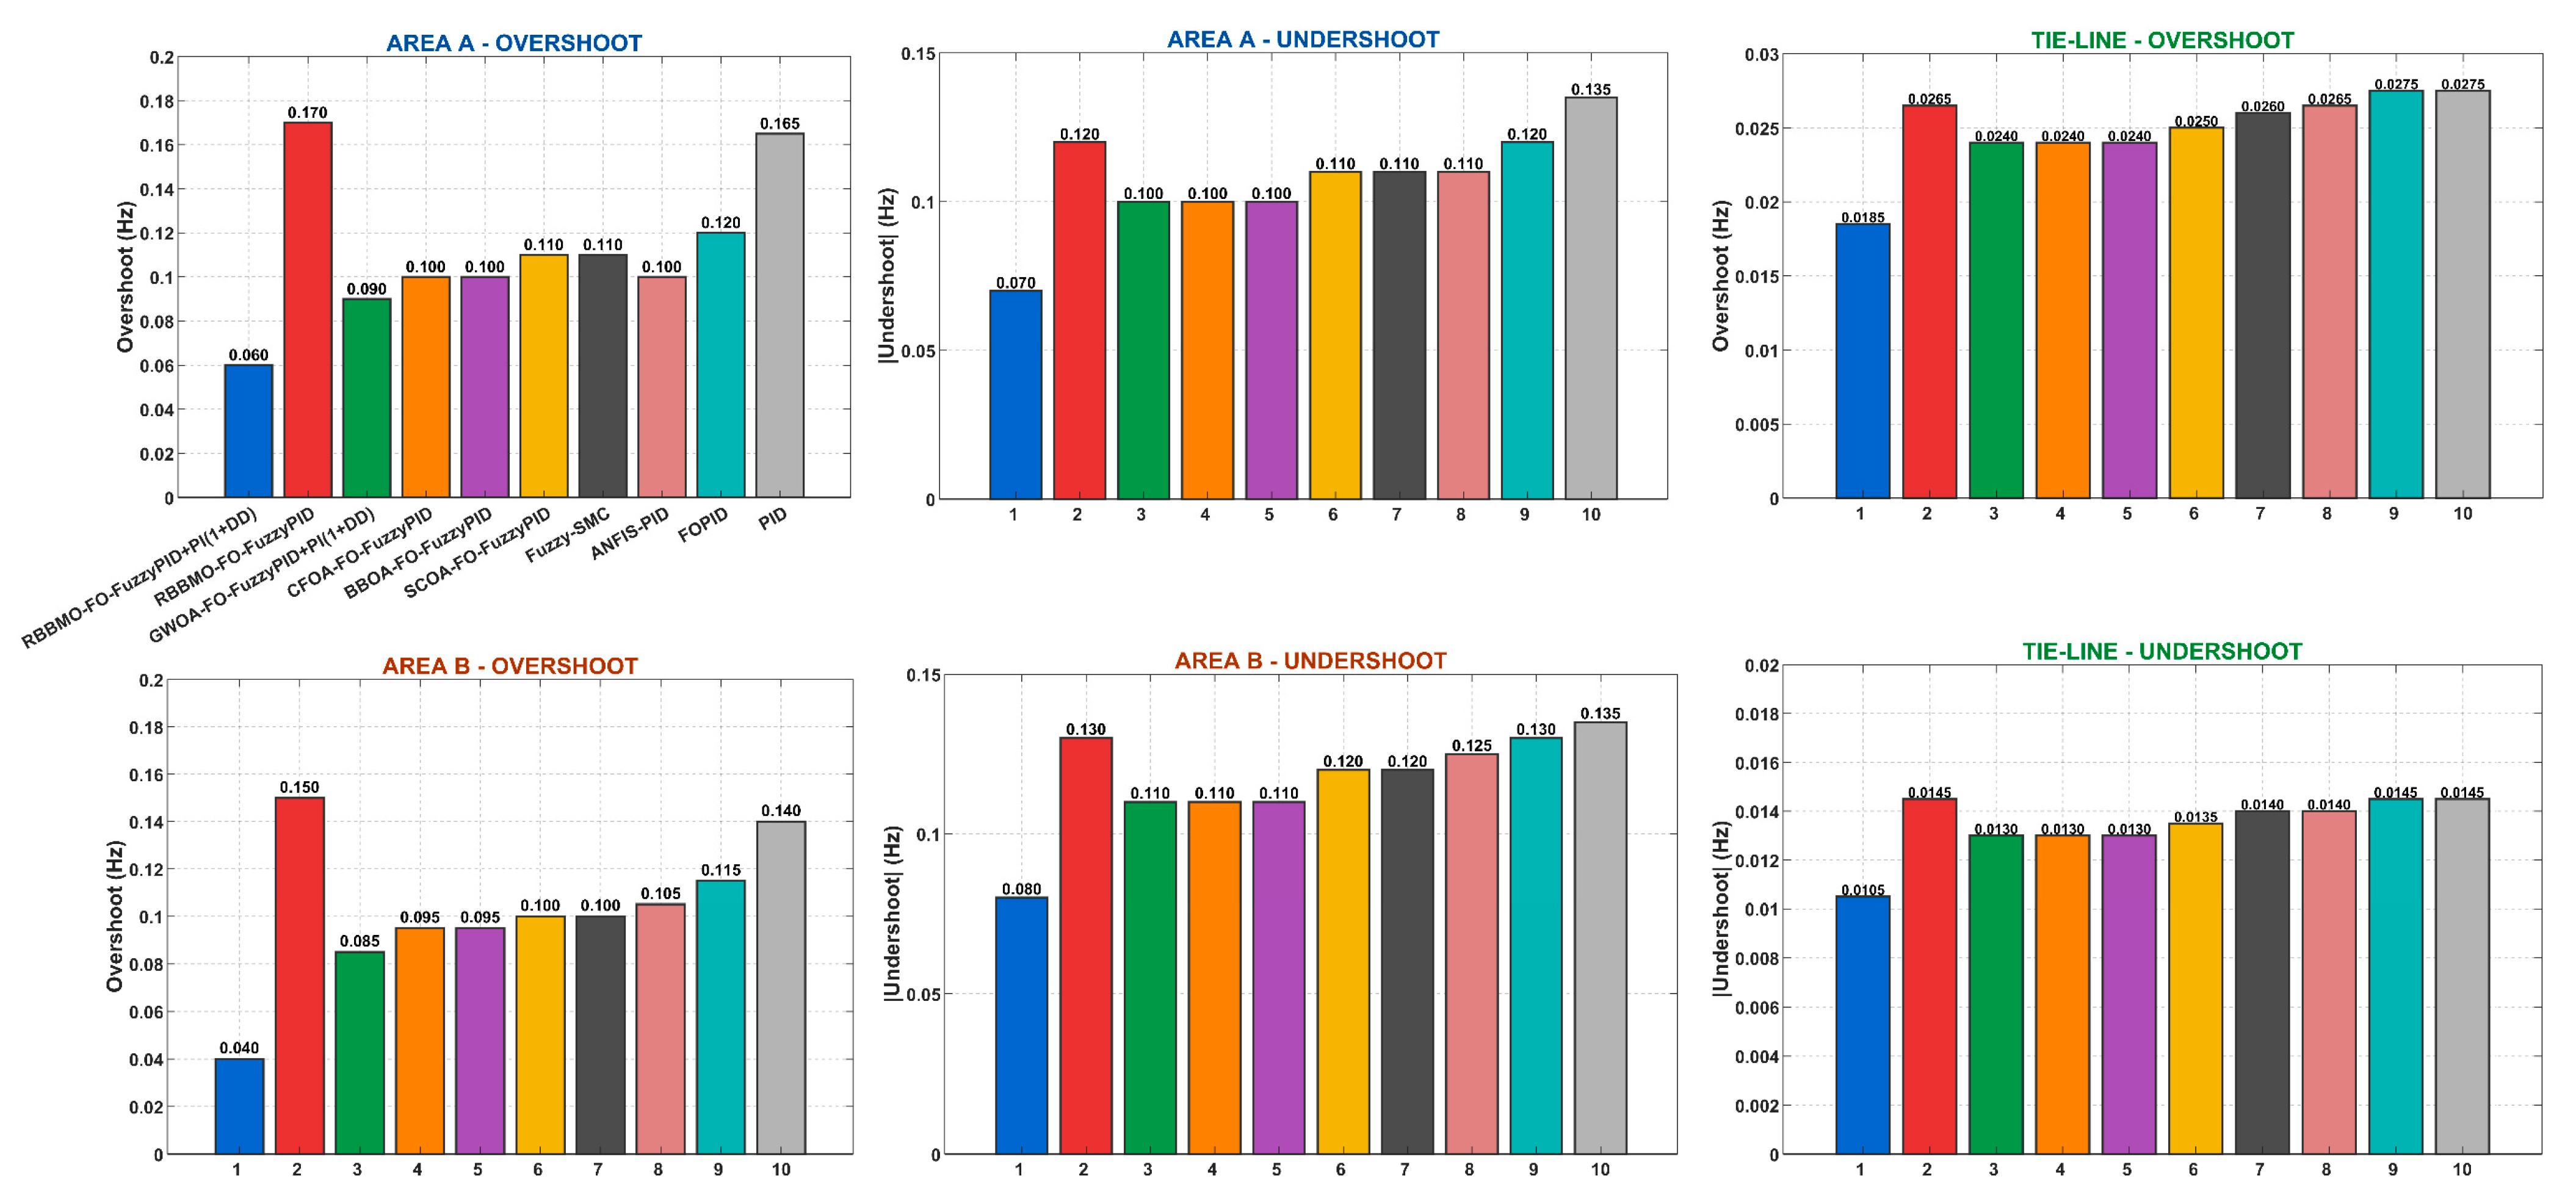
Figure 14.
Comparative analysis of controller performance in overshoot and undershoot mitigation for Area-1, Area-2, and tie-line power.
Figure 14.
Comparative analysis of controller performance in overshoot and undershoot mitigation for Area-1, Area-2, and tie-line power.
Figure 15.
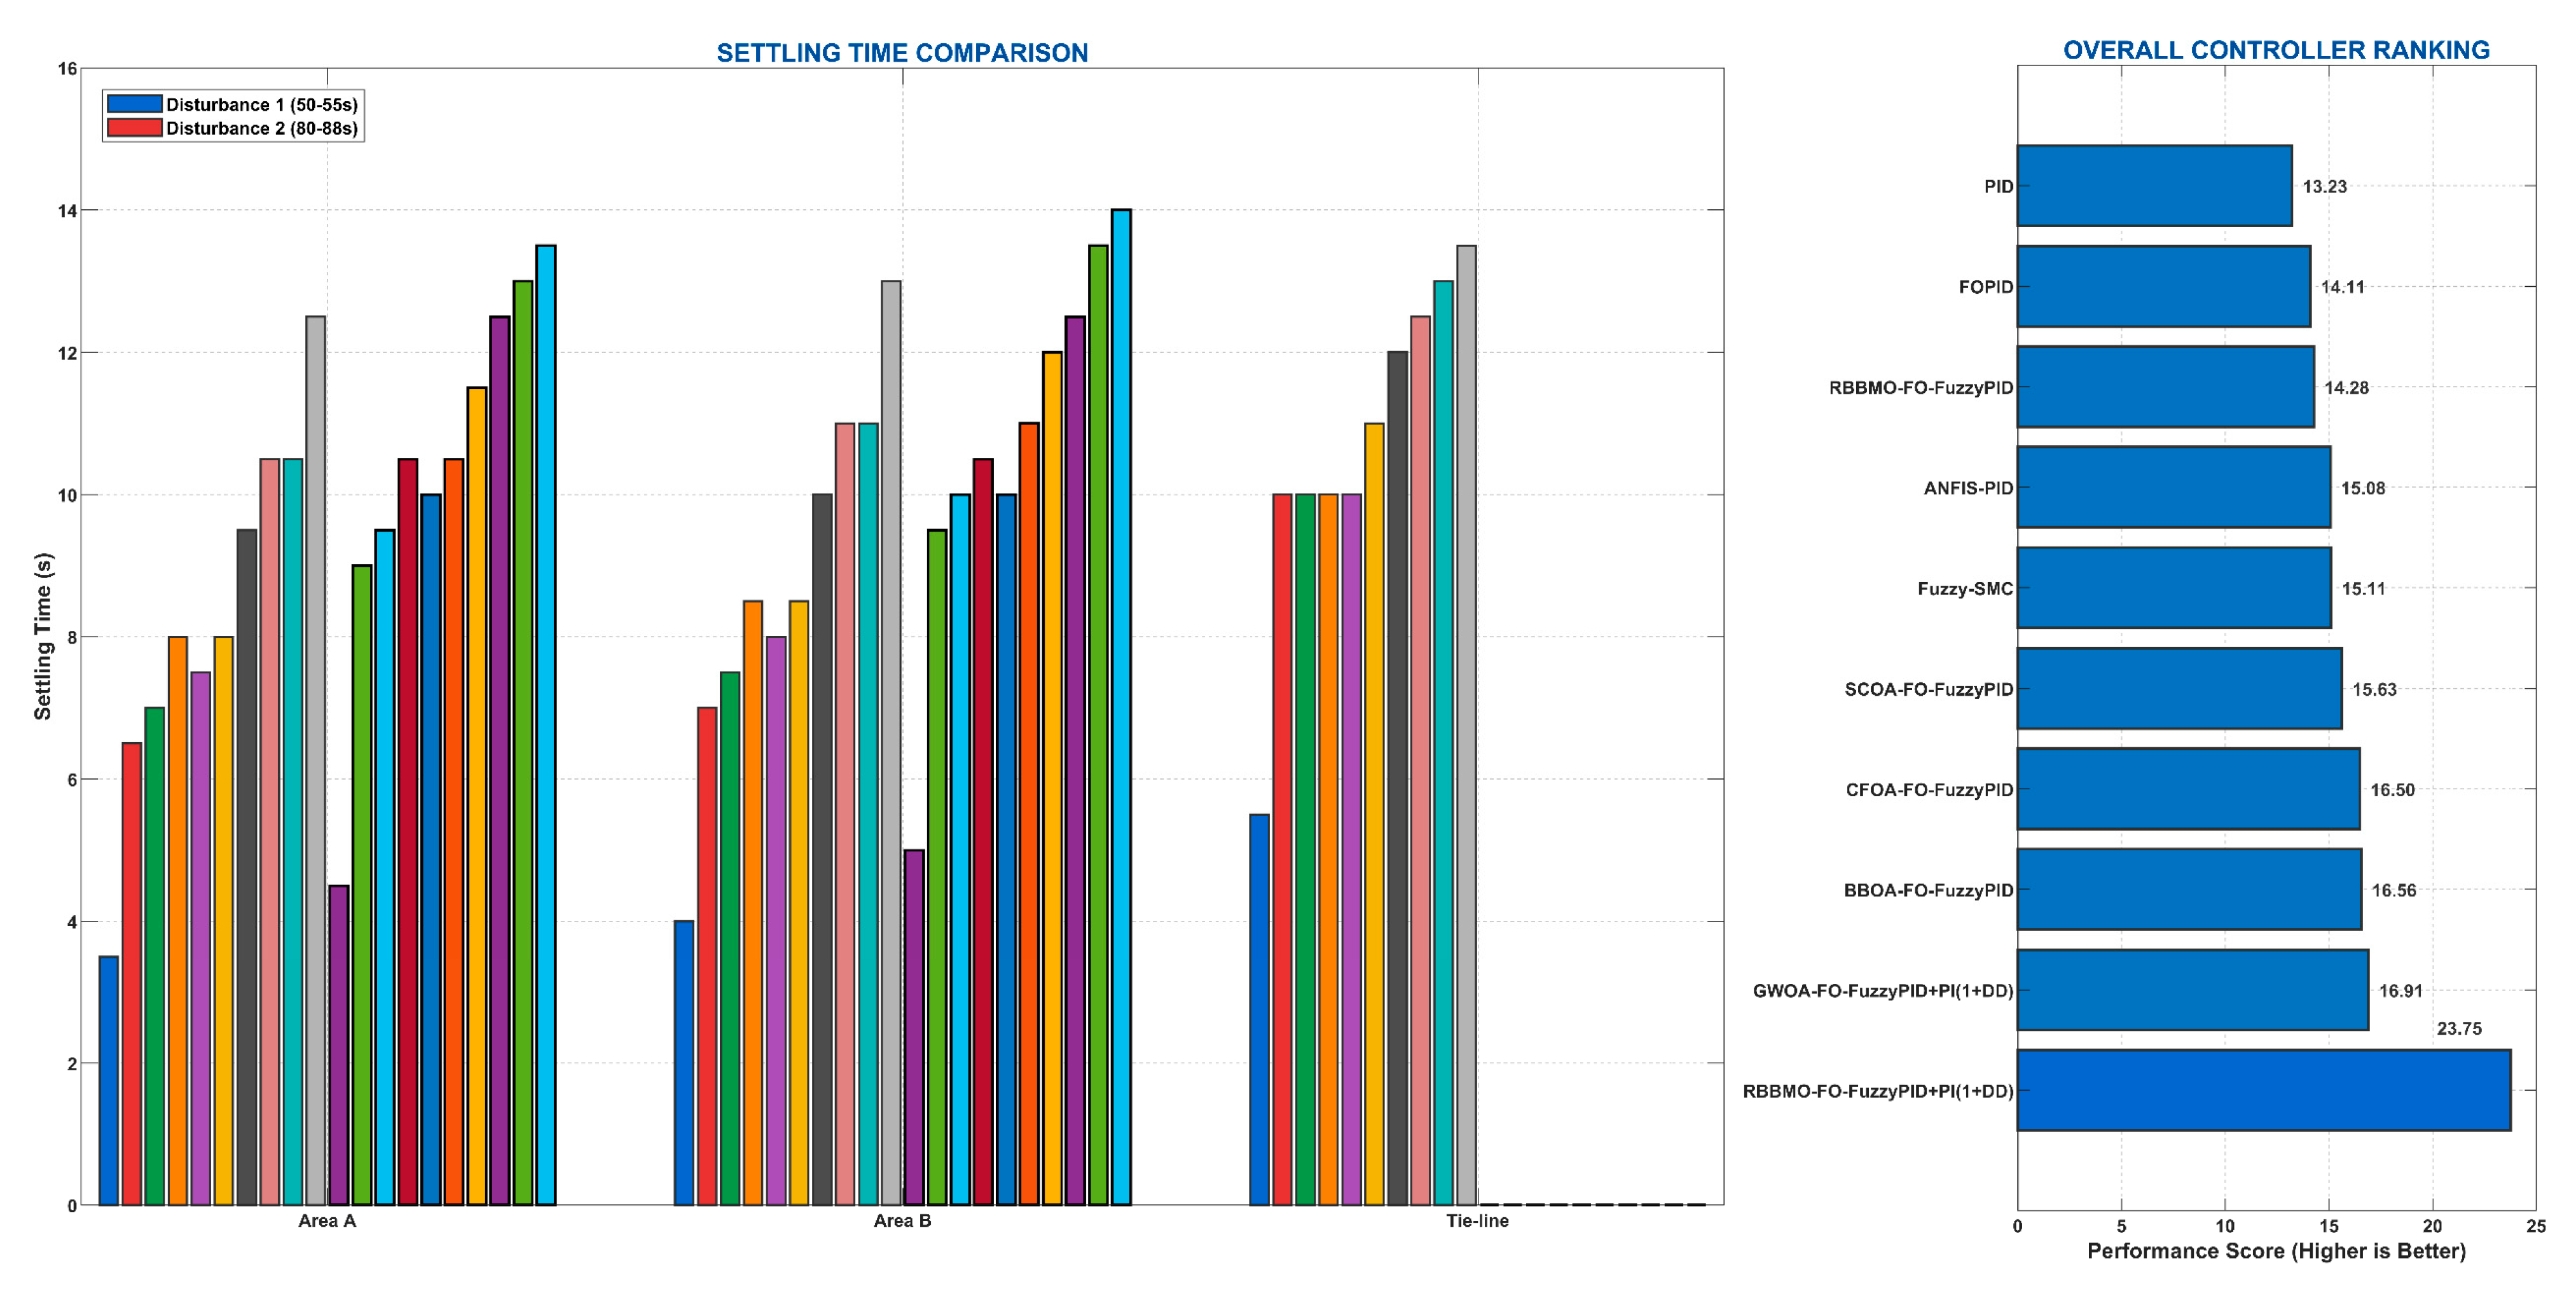
Settling time performance during two disturbance periods (50–55s and 80–88s) and overall controller ranking.
Figure 15.
Settling time performance during two disturbance periods (50–55s and 80–88s) and overall controller ranking.
Figure 16.
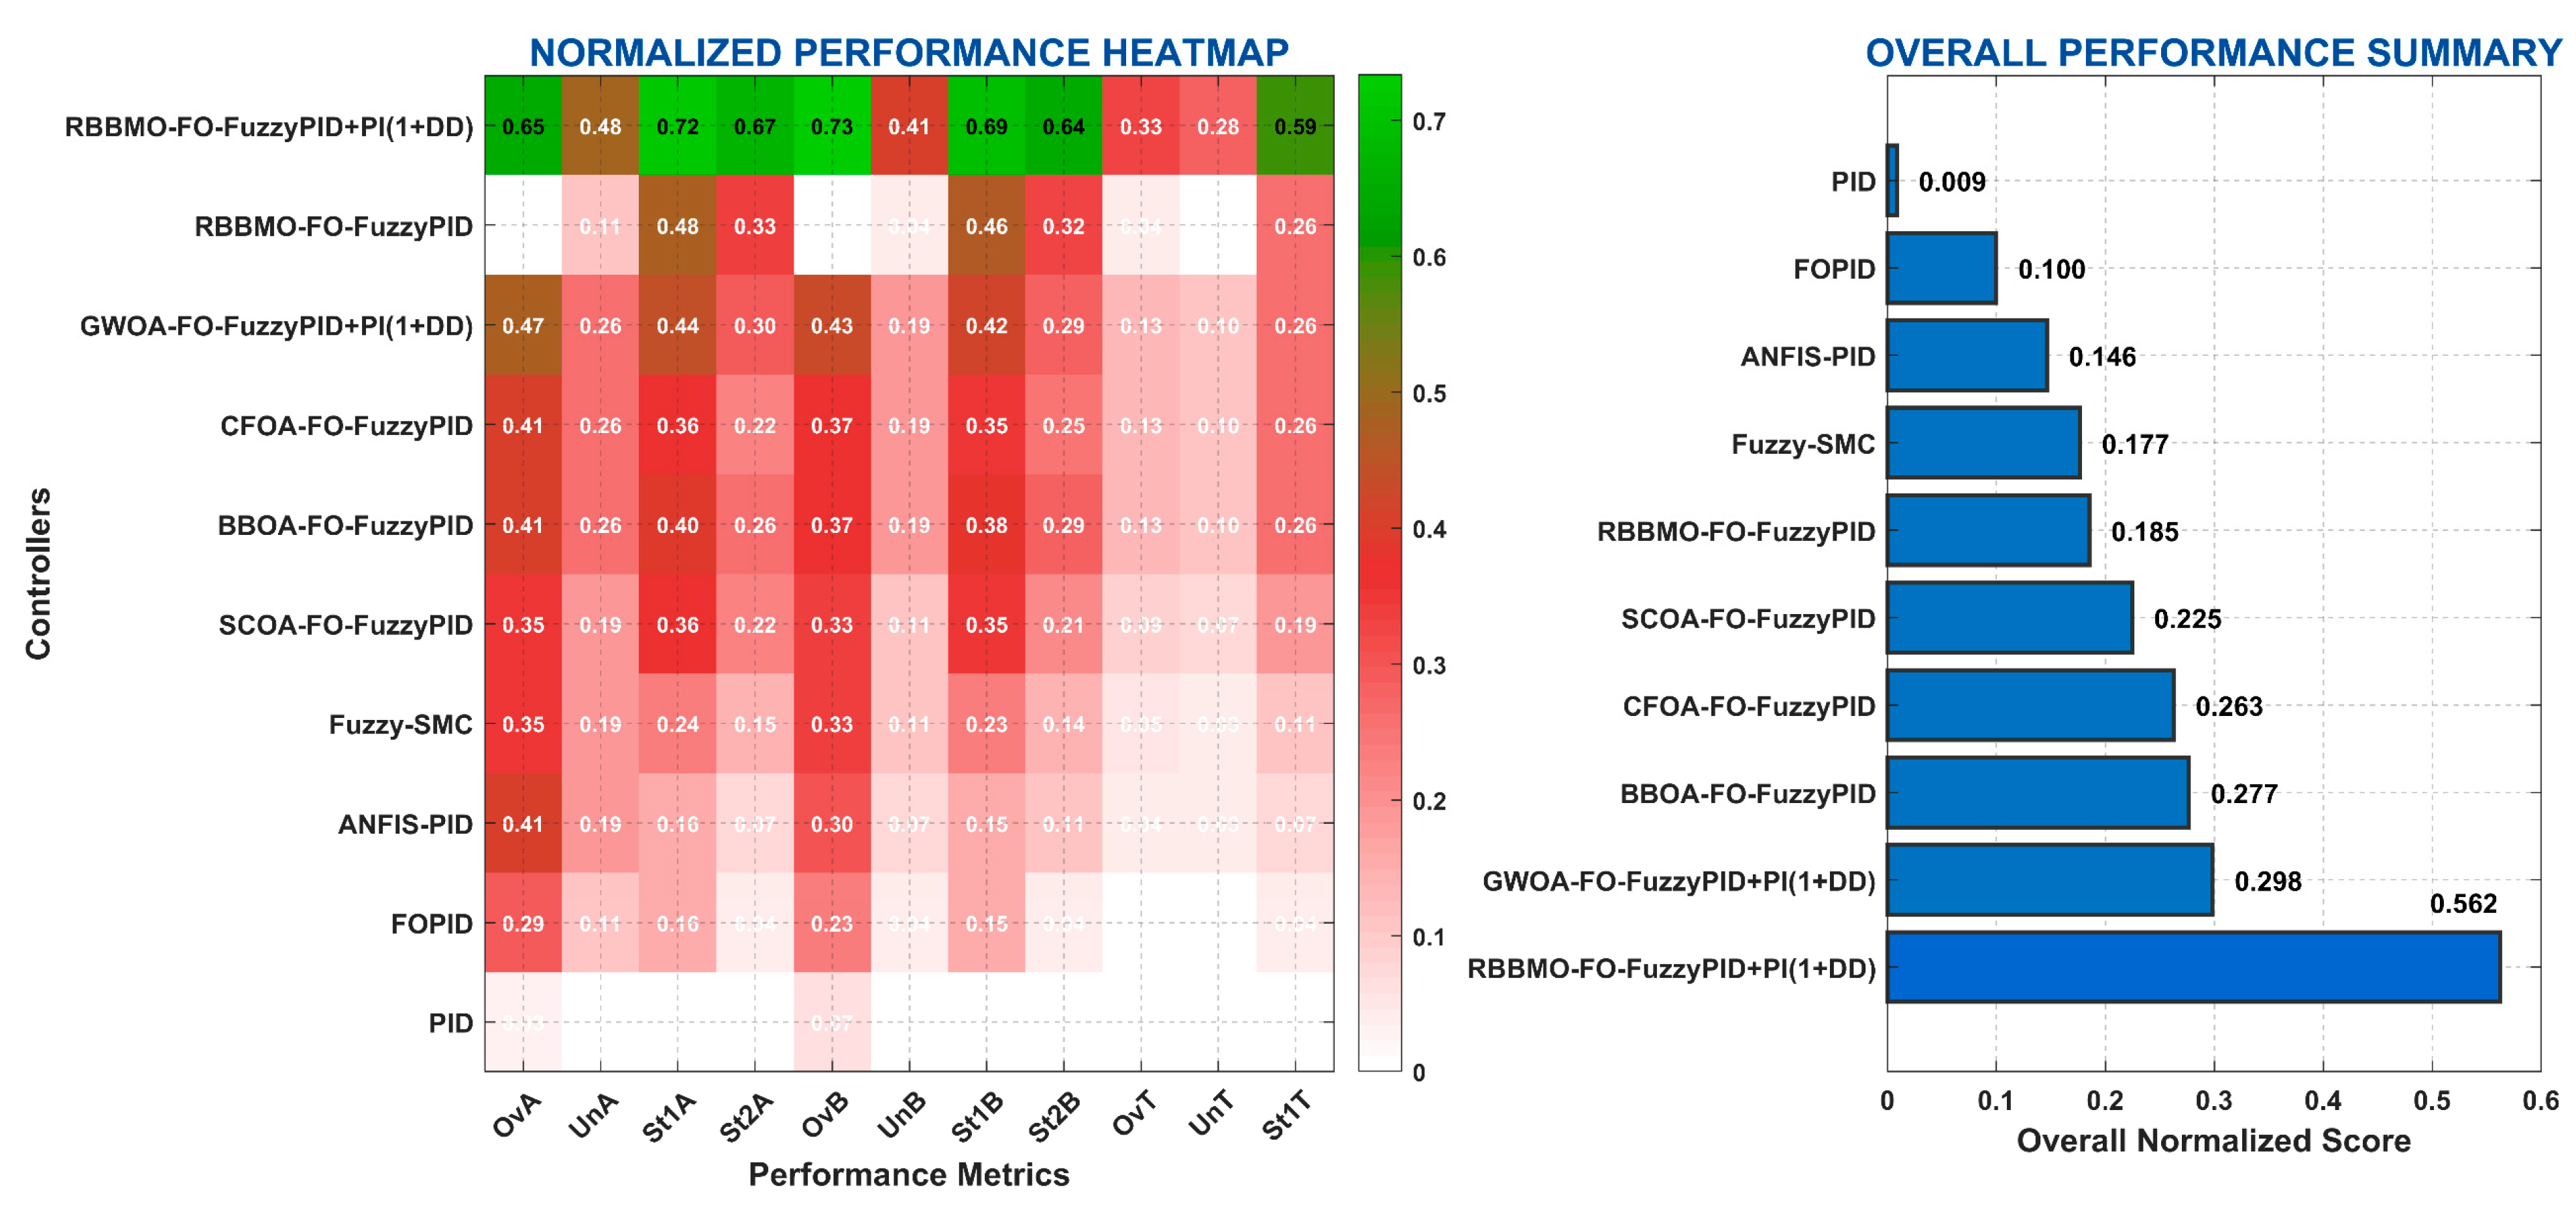
Normalized performance radar chart for top six controllers across key metrics.
Figure 16.
Normalized performance radar chart for top six controllers across key metrics.
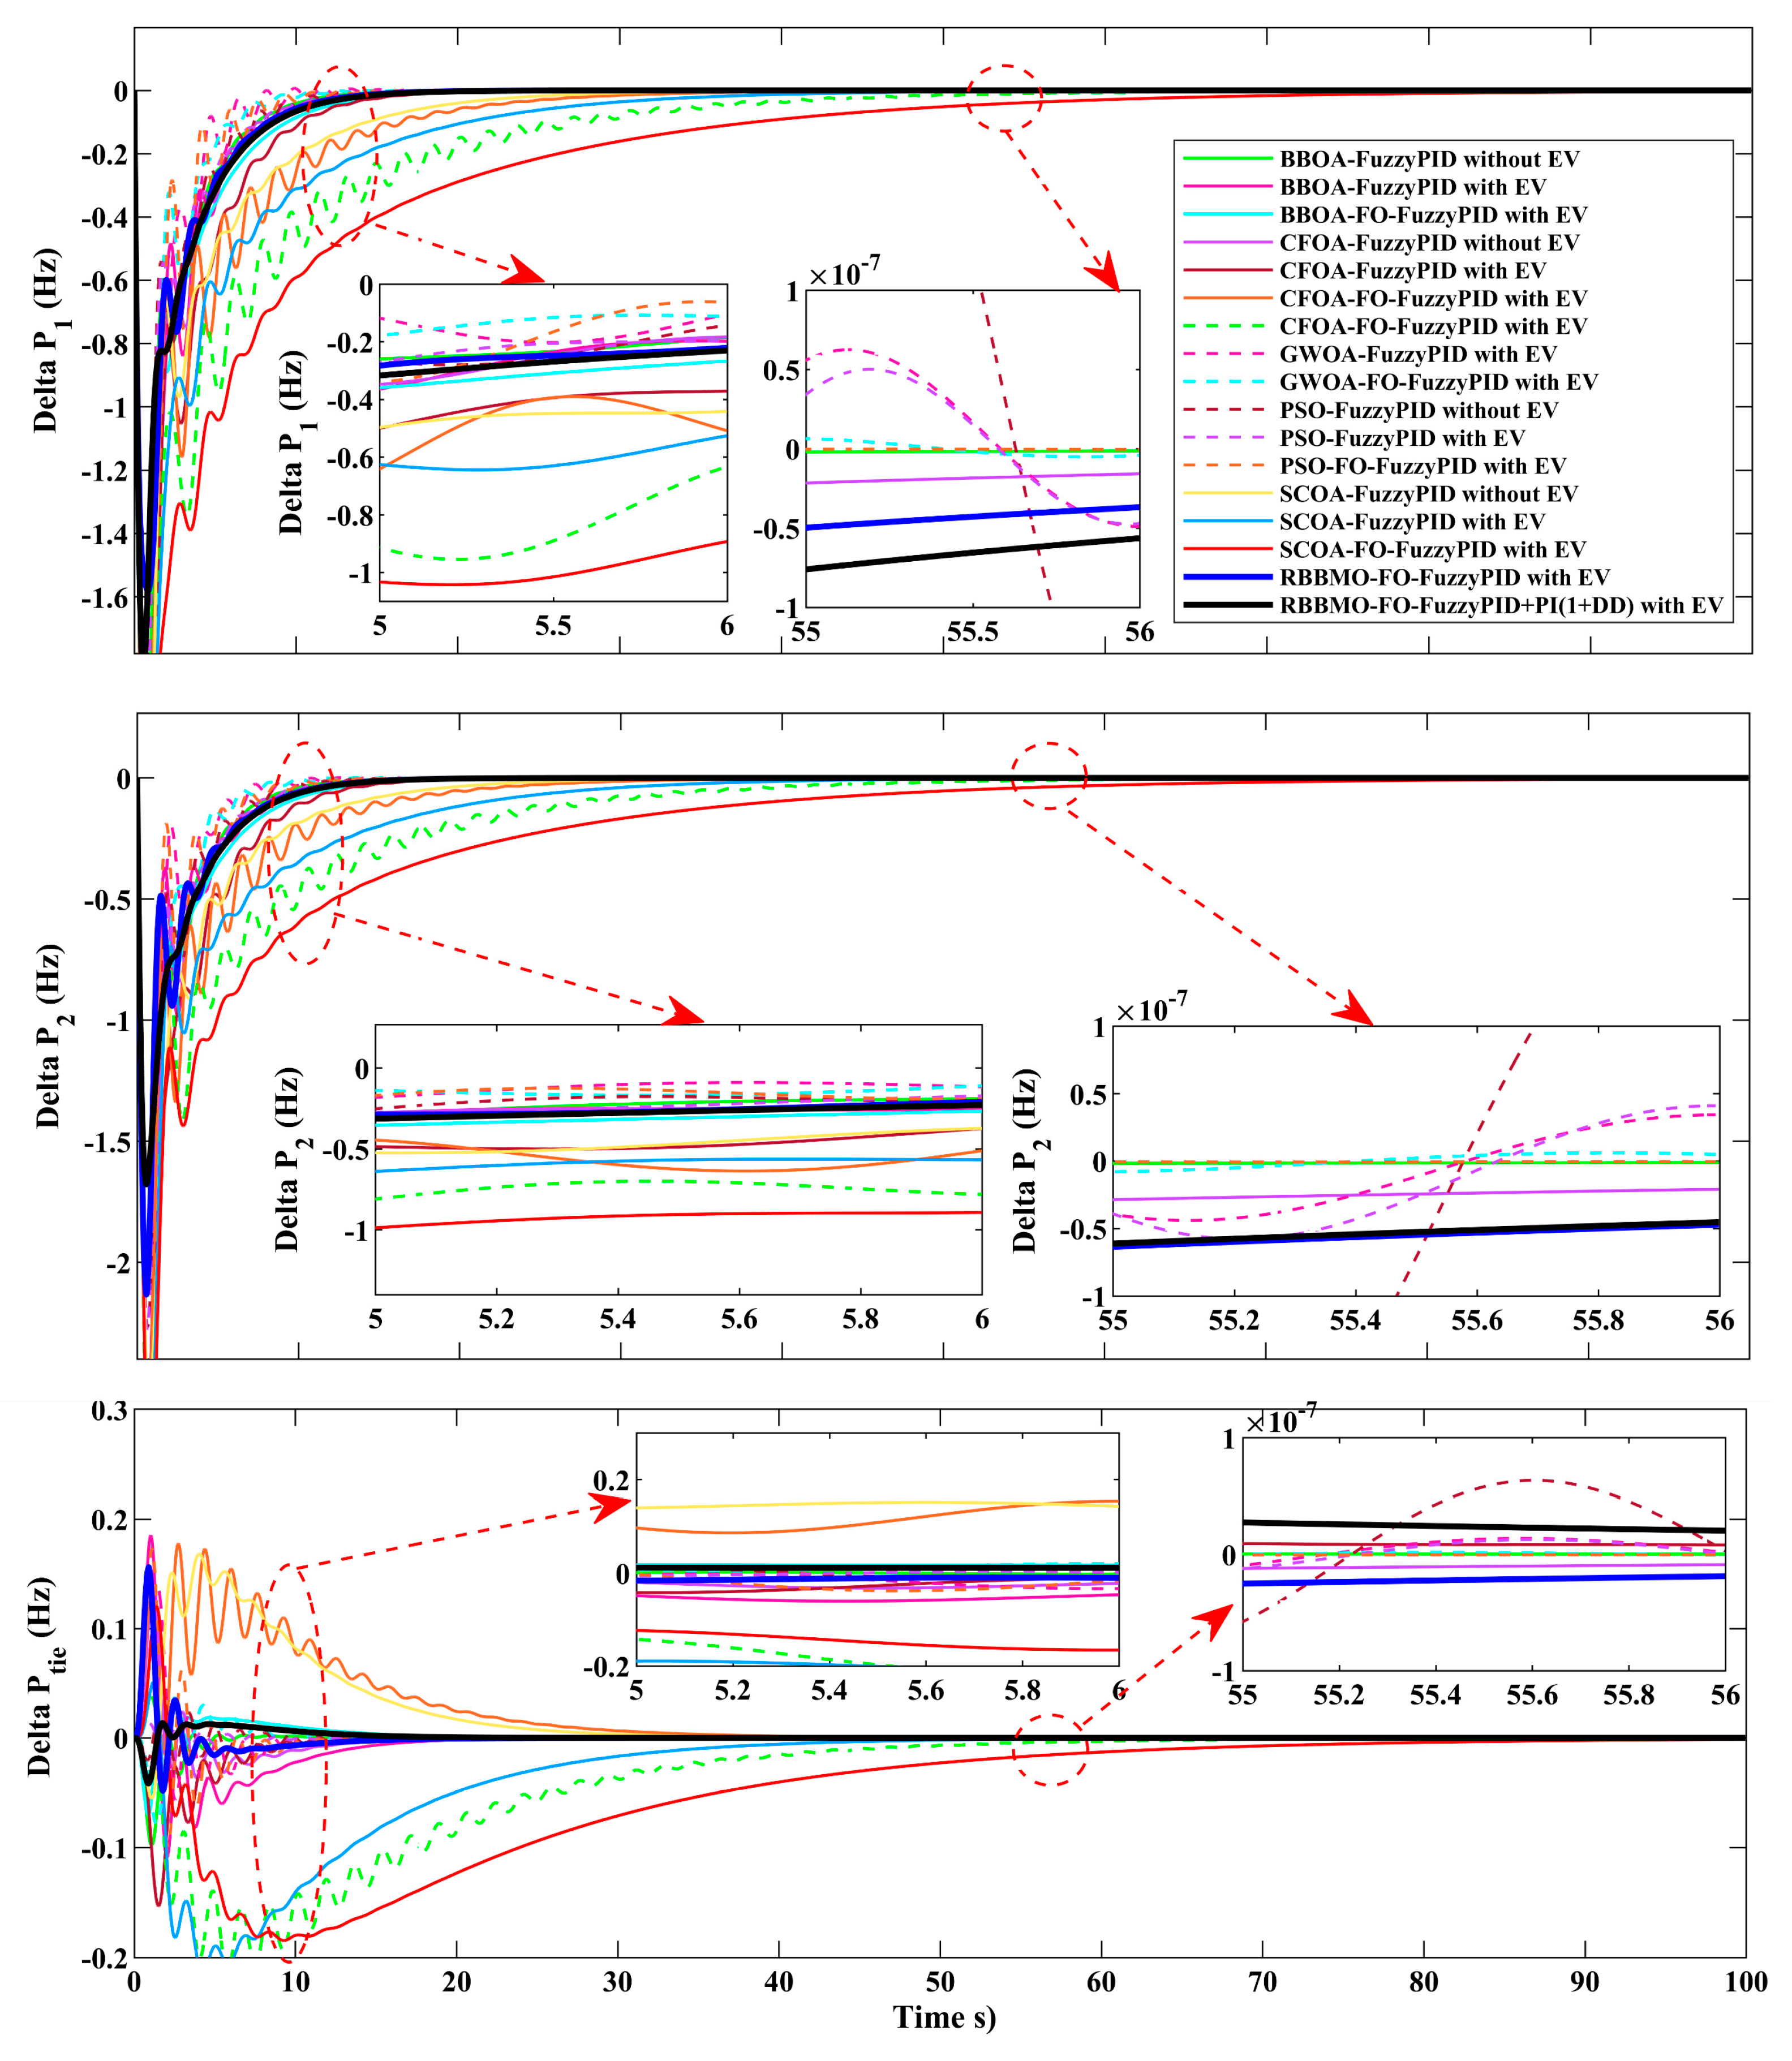
Figure 17.
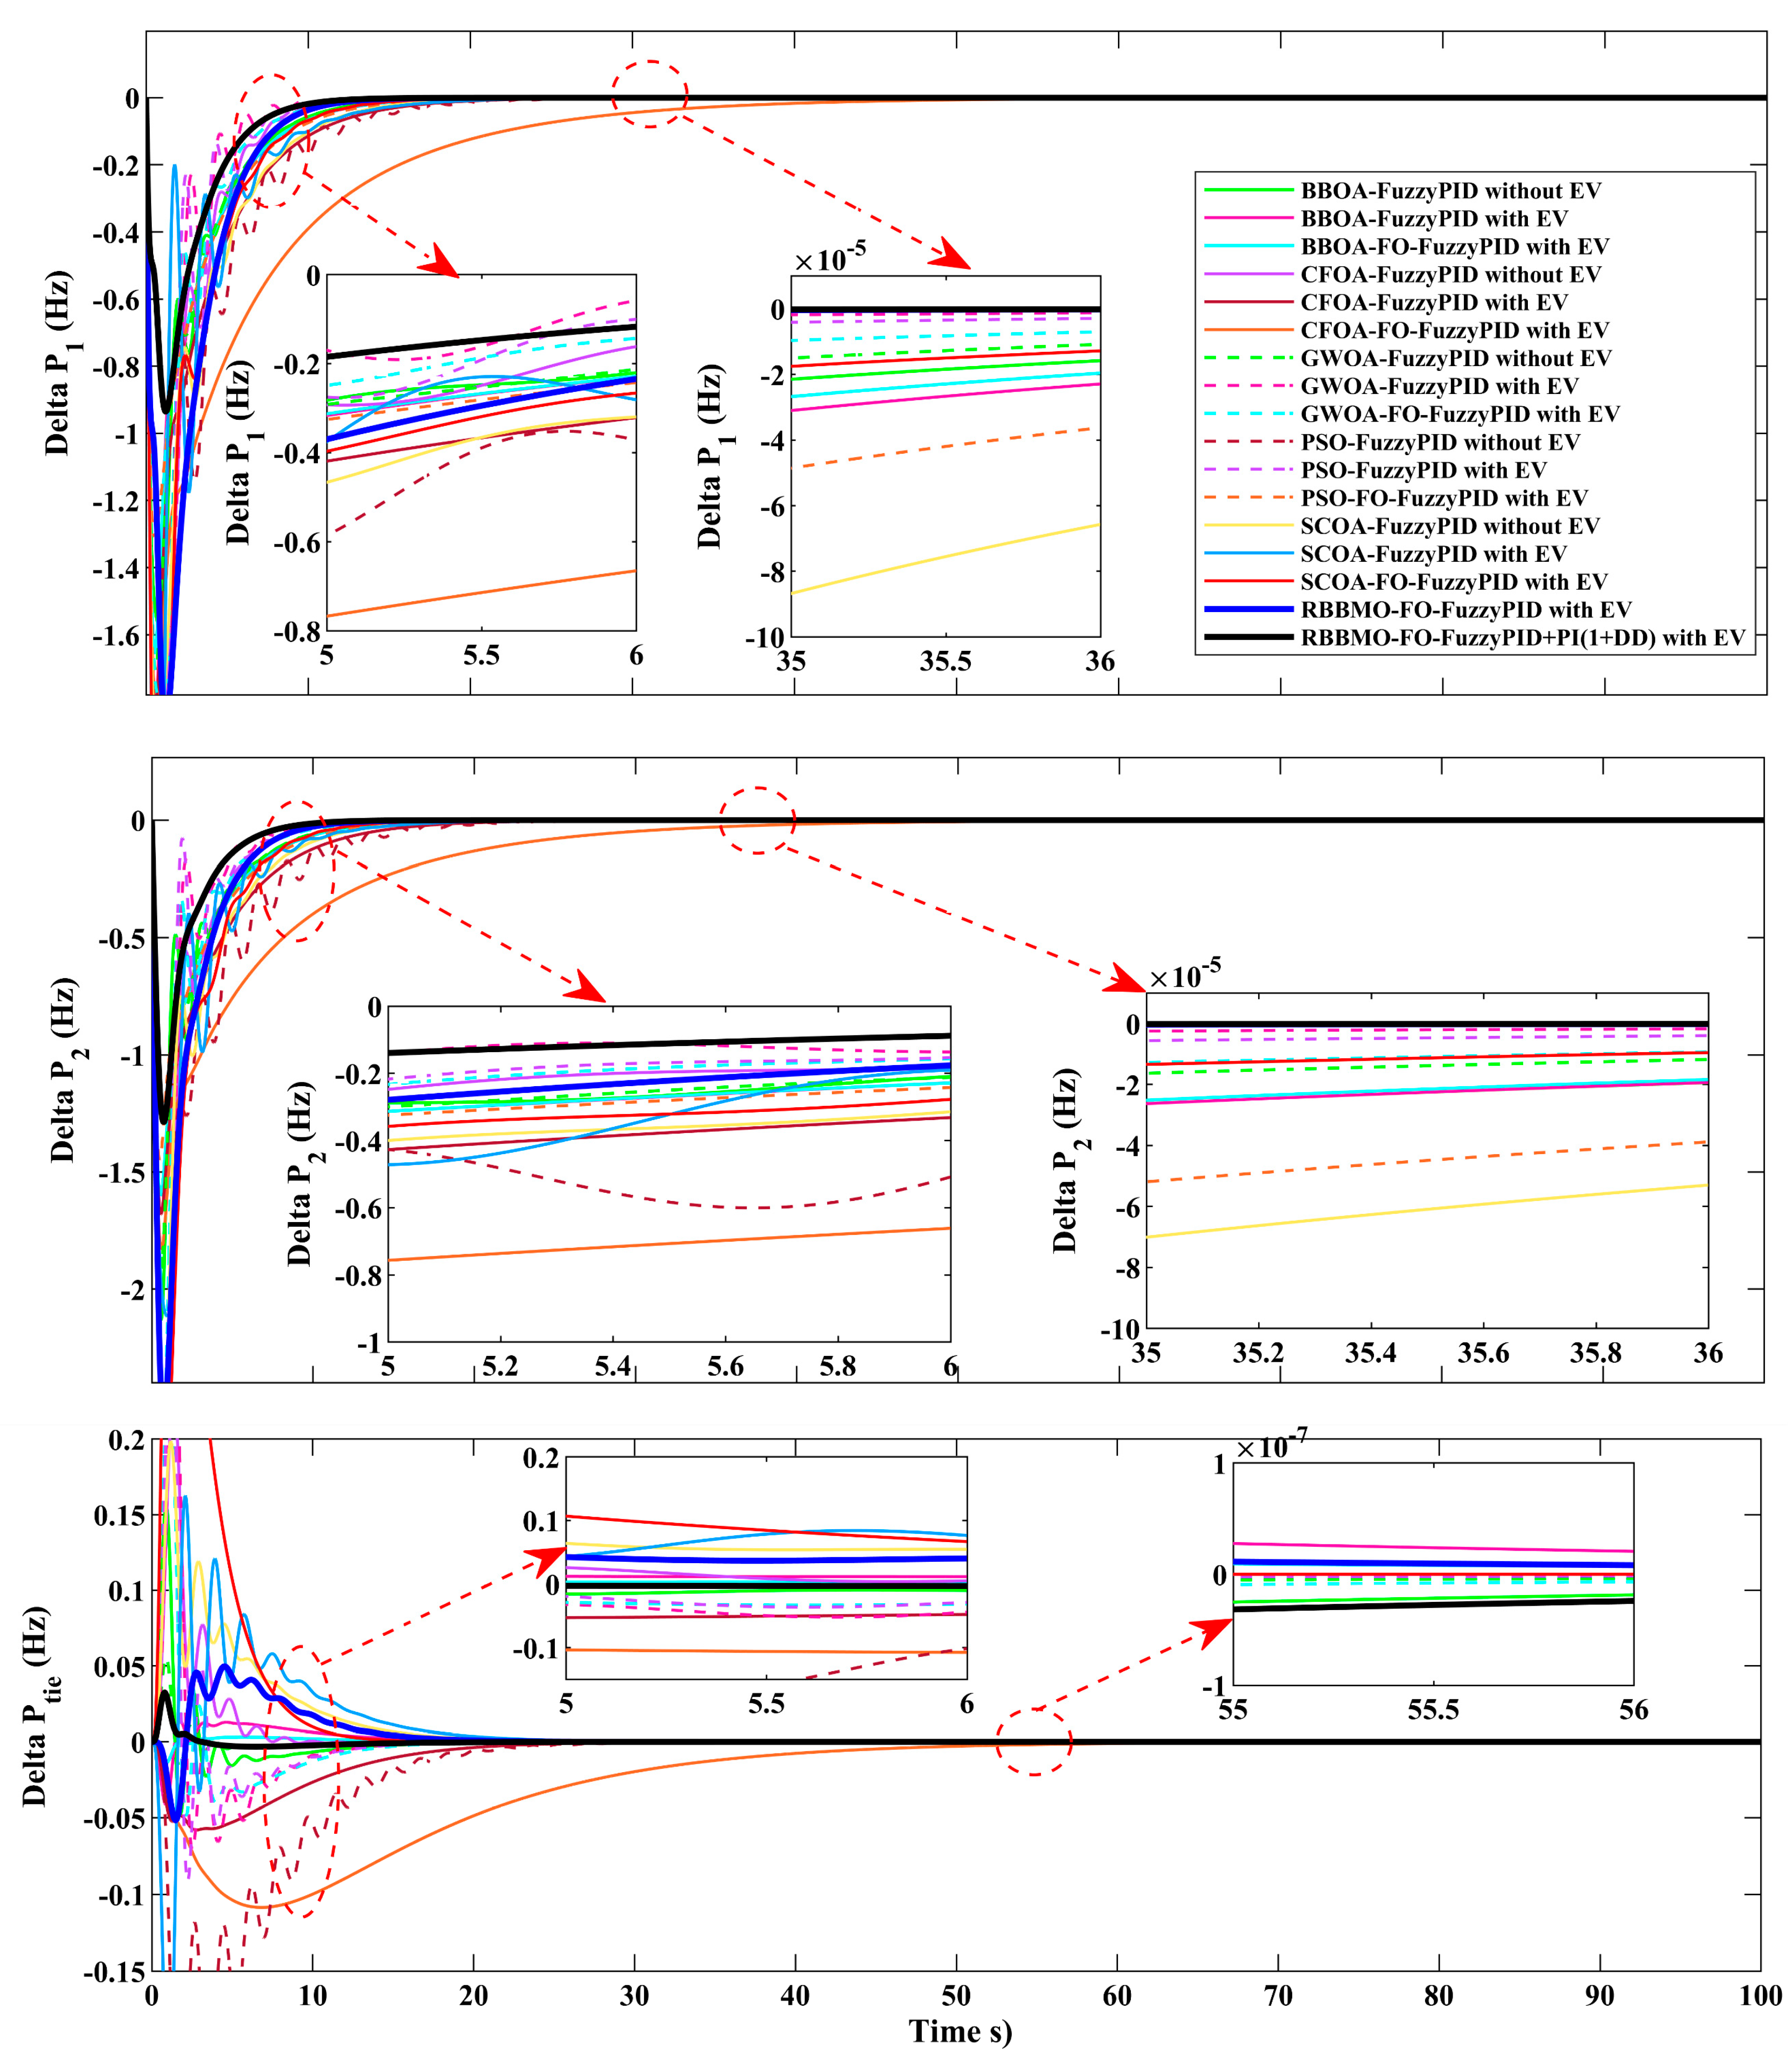
Time responses in the ideal, unconstrained case comparing controllers with EV and without EV: Area-1 frequency deviation Δf1, Area-2 frequency deviation Δf2, and tie-line power deviation ΔPtie.
Figure 17.
Time responses in the ideal, unconstrained case comparing controllers with EV and without EV: Area-1 frequency deviation Δf1, Area-2 frequency deviation Δf2, and tie-line power deviation ΔPtie.
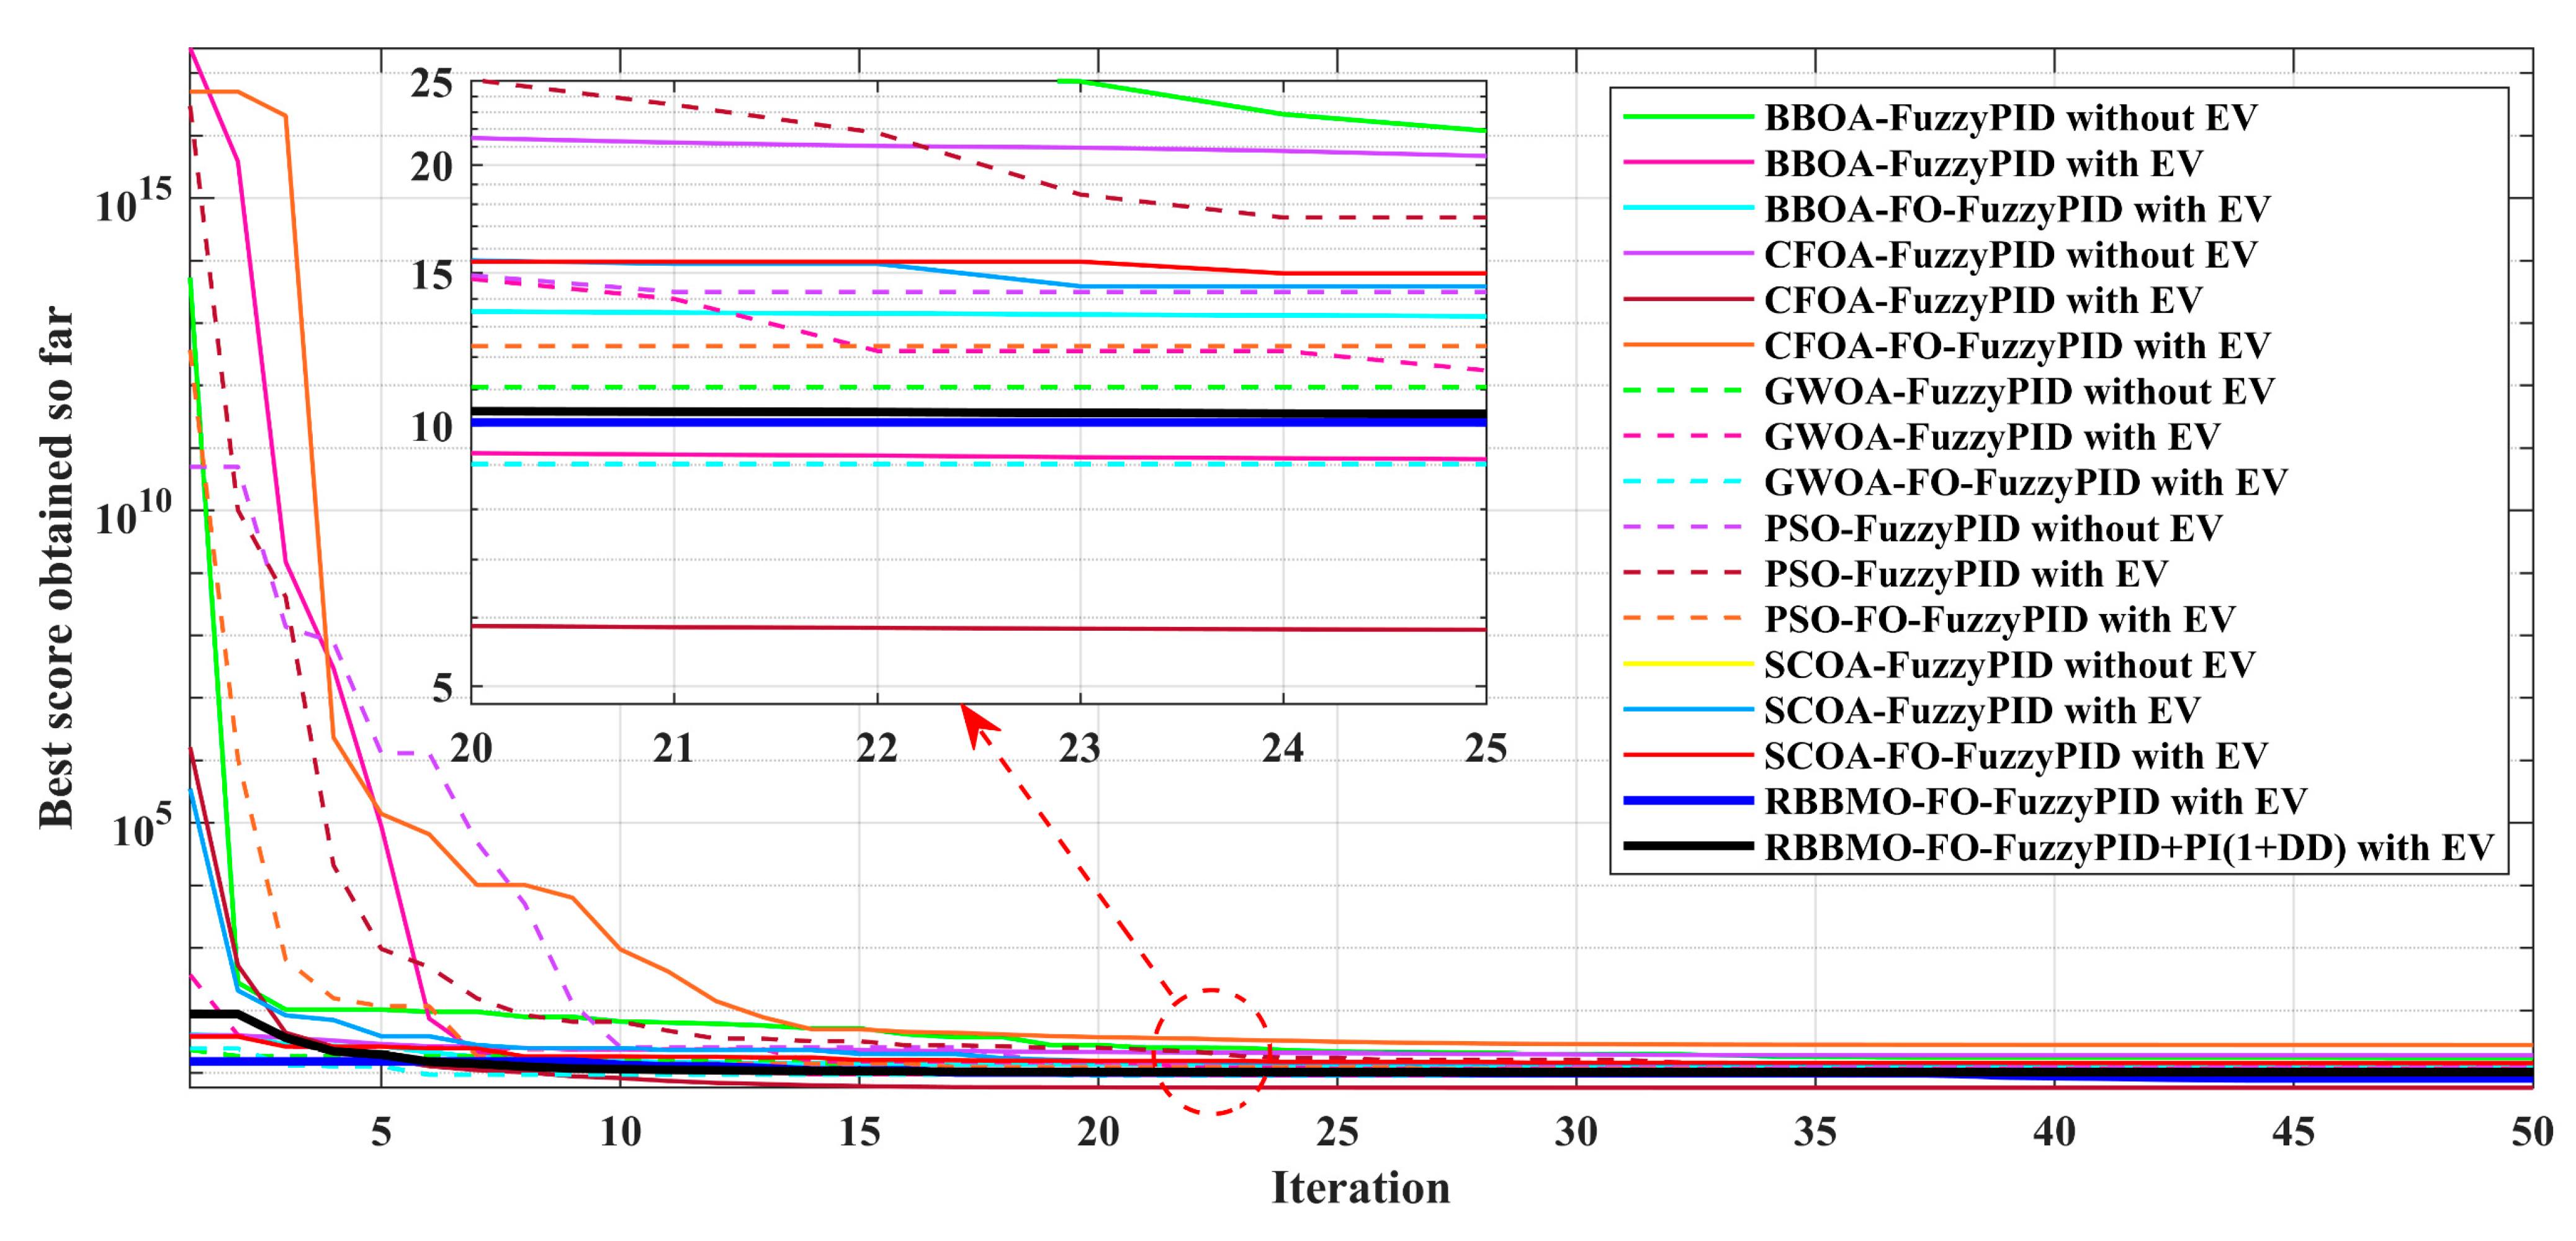
Figure 18.
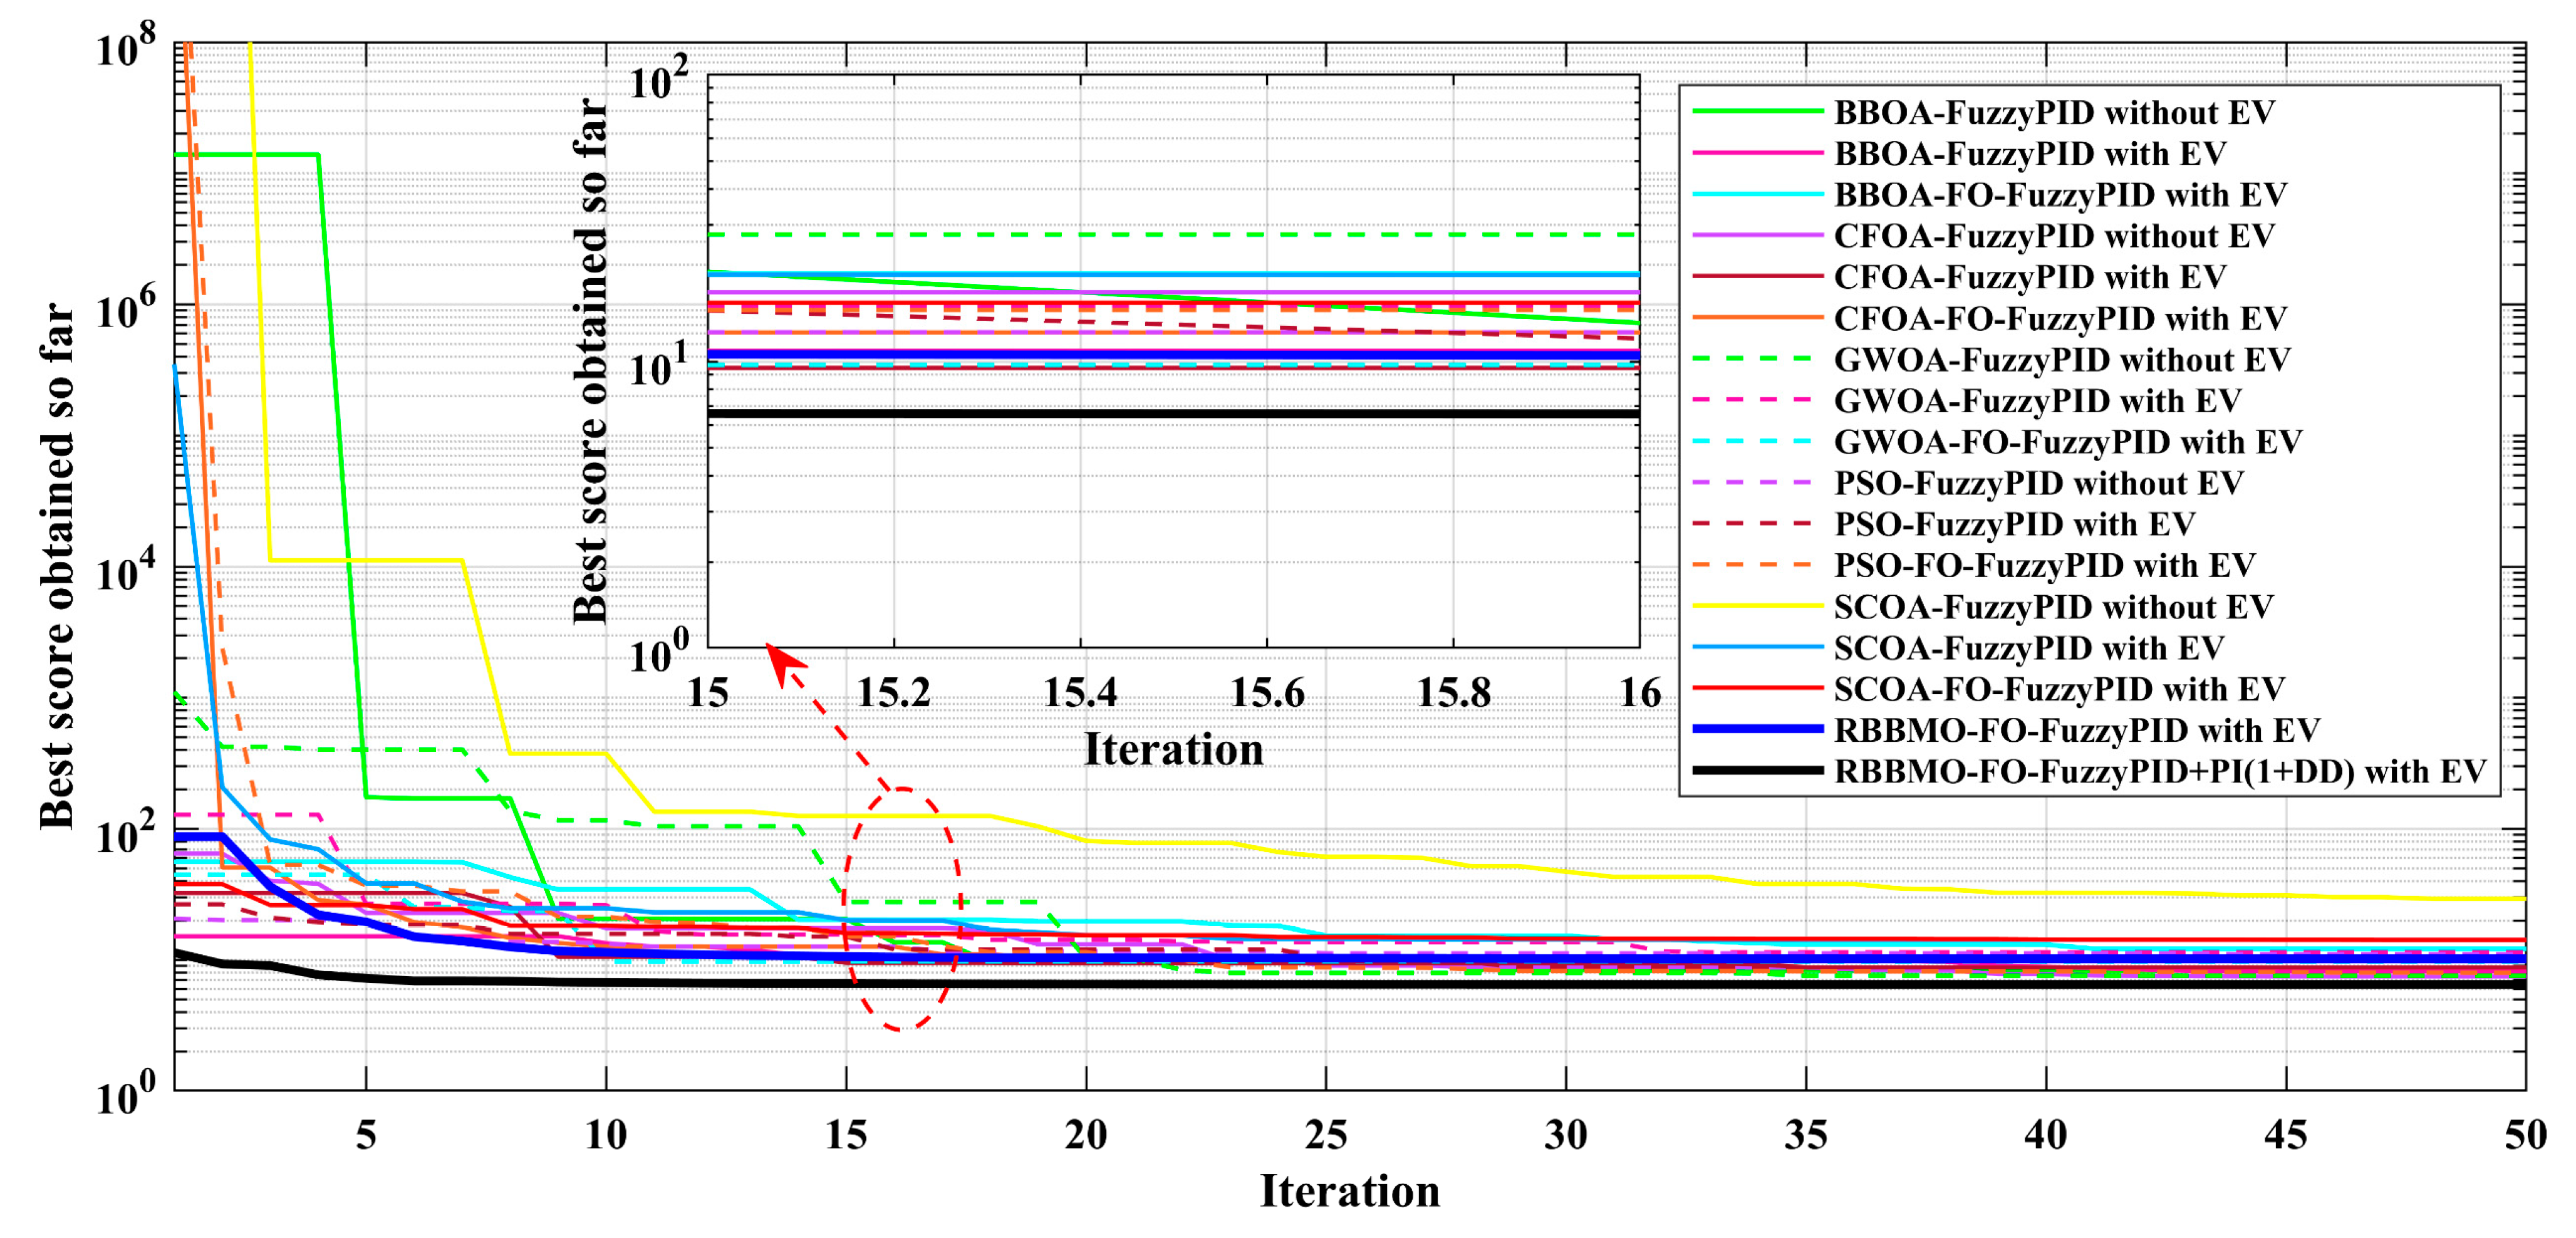
Convergence of the objective function (“best score obtained so far”) for all controllers in the ideal, unconstrained case, comparing with EV and without EV variants.
Figure 18.
Convergence of the objective function (“best score obtained so far”) for all controllers in the ideal, unconstrained case, comparing with EV and without EV variants.
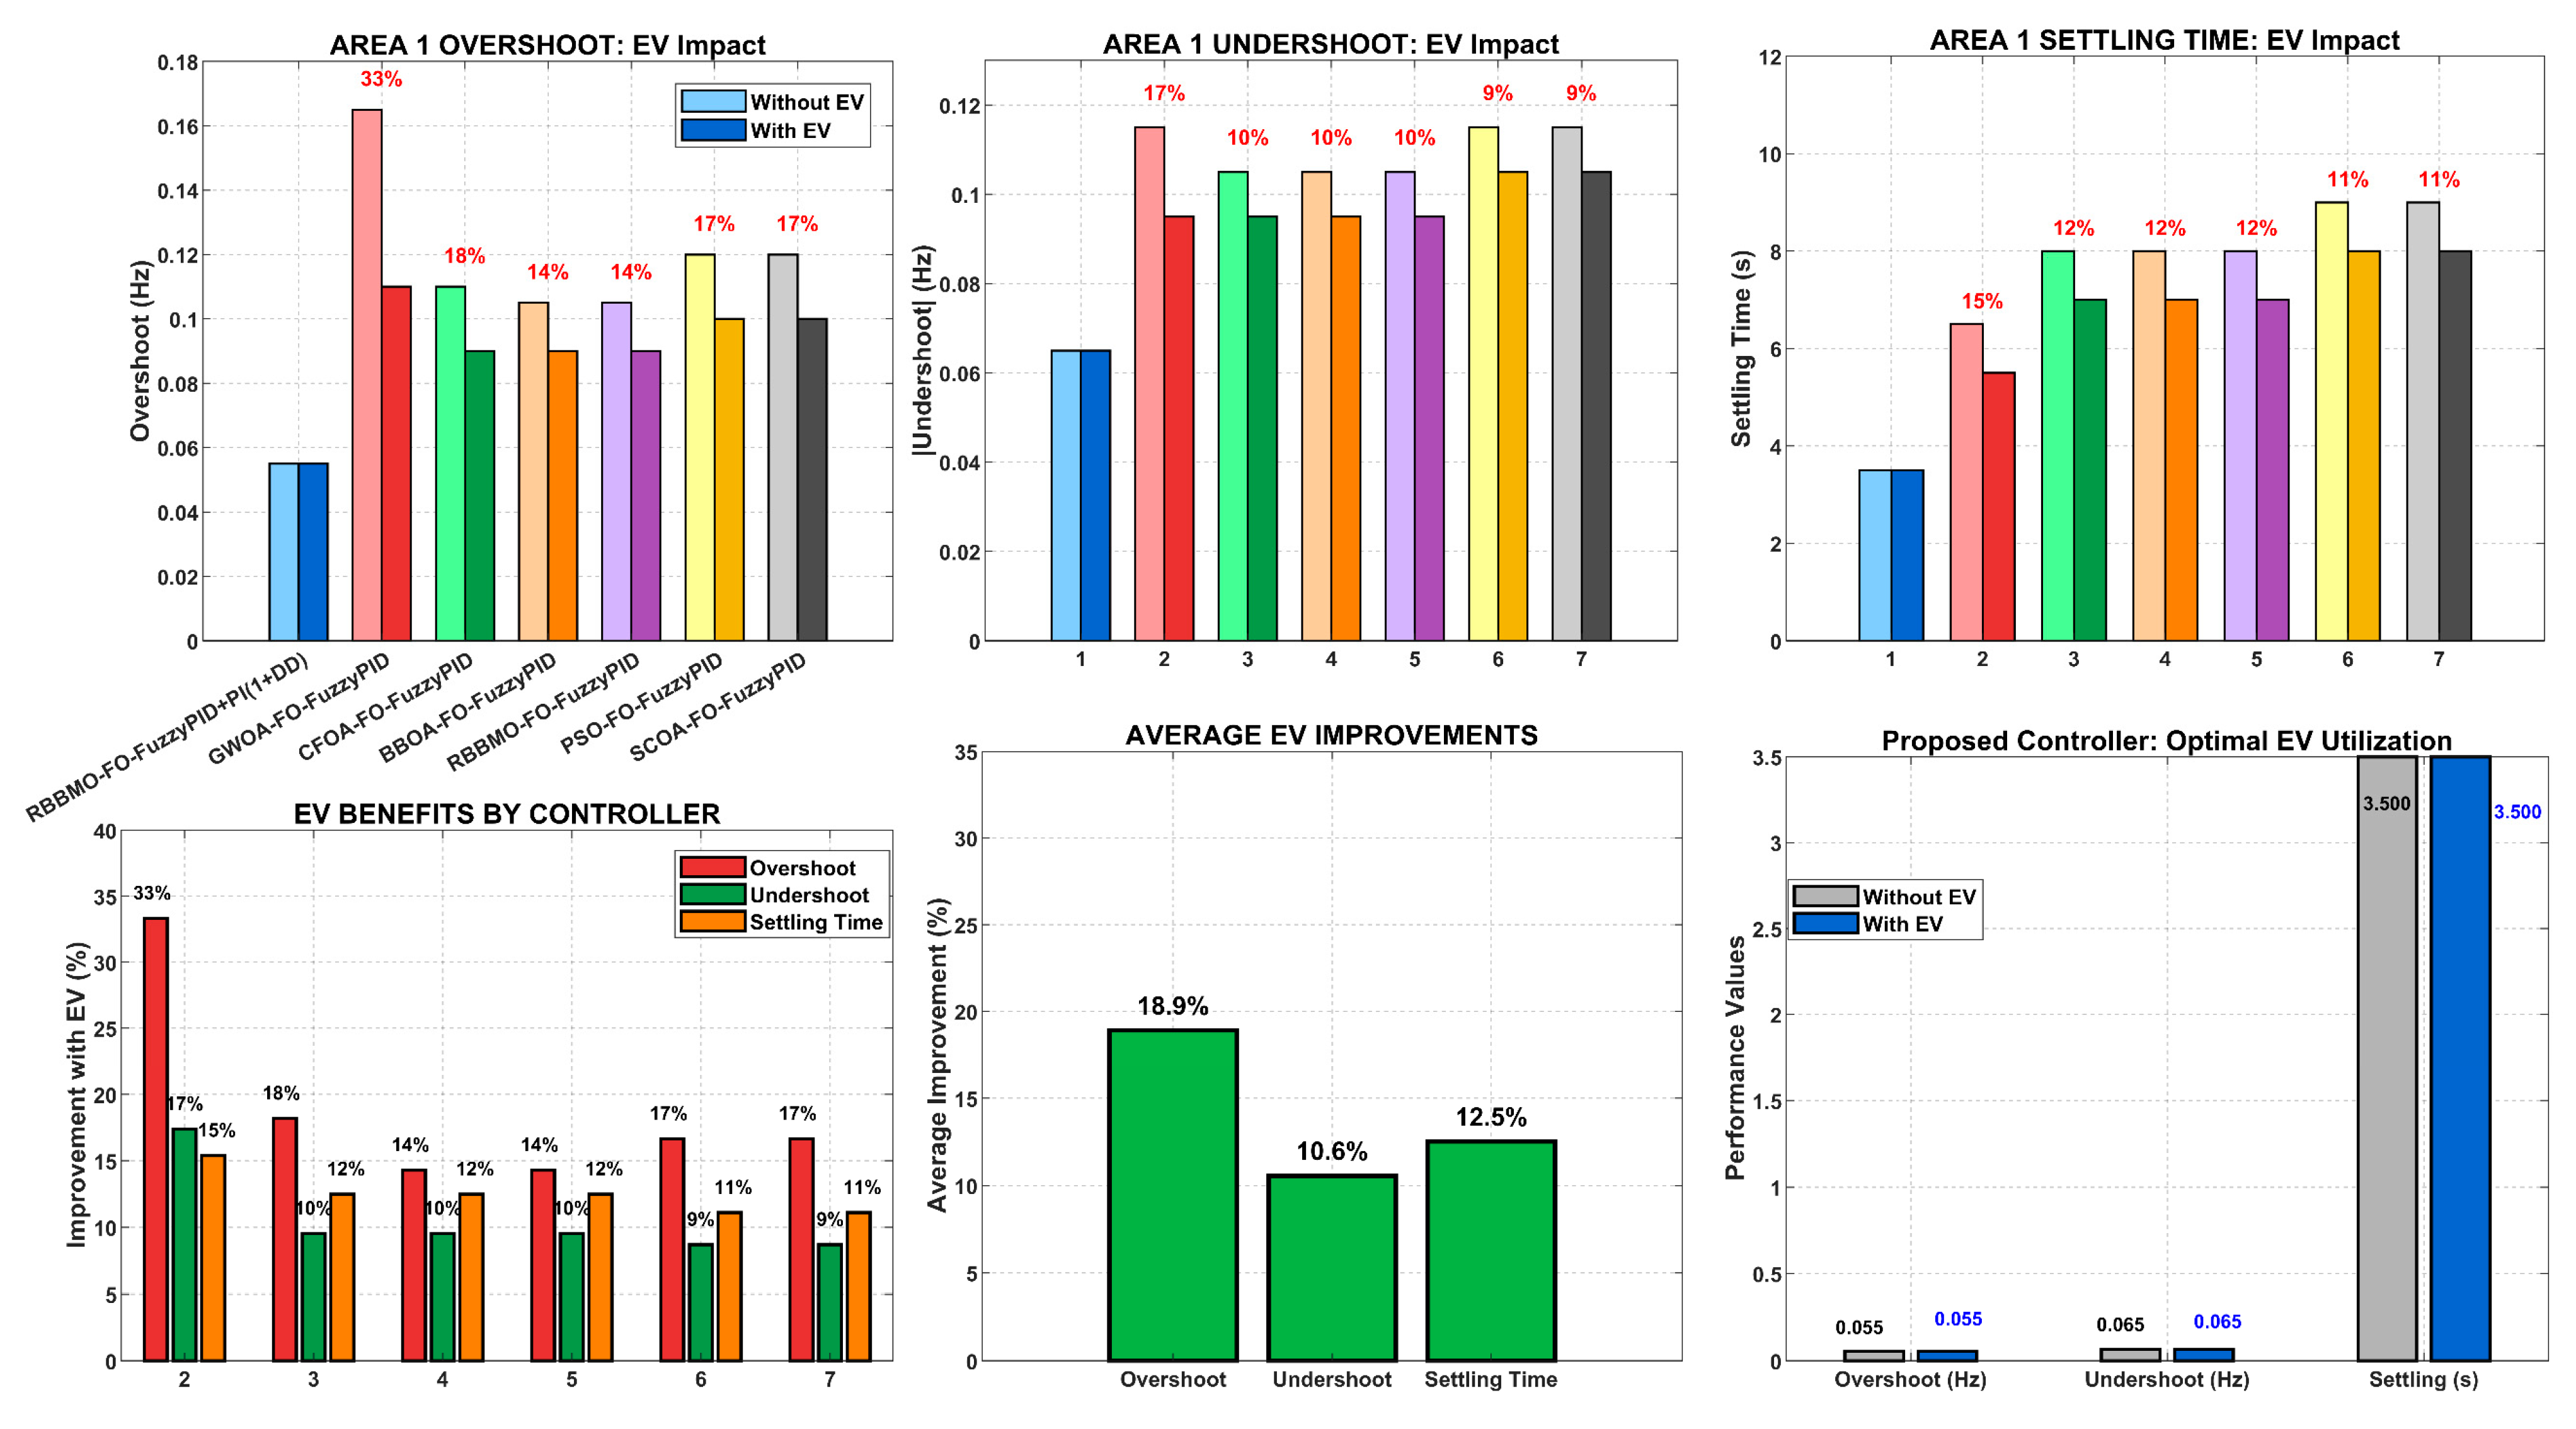
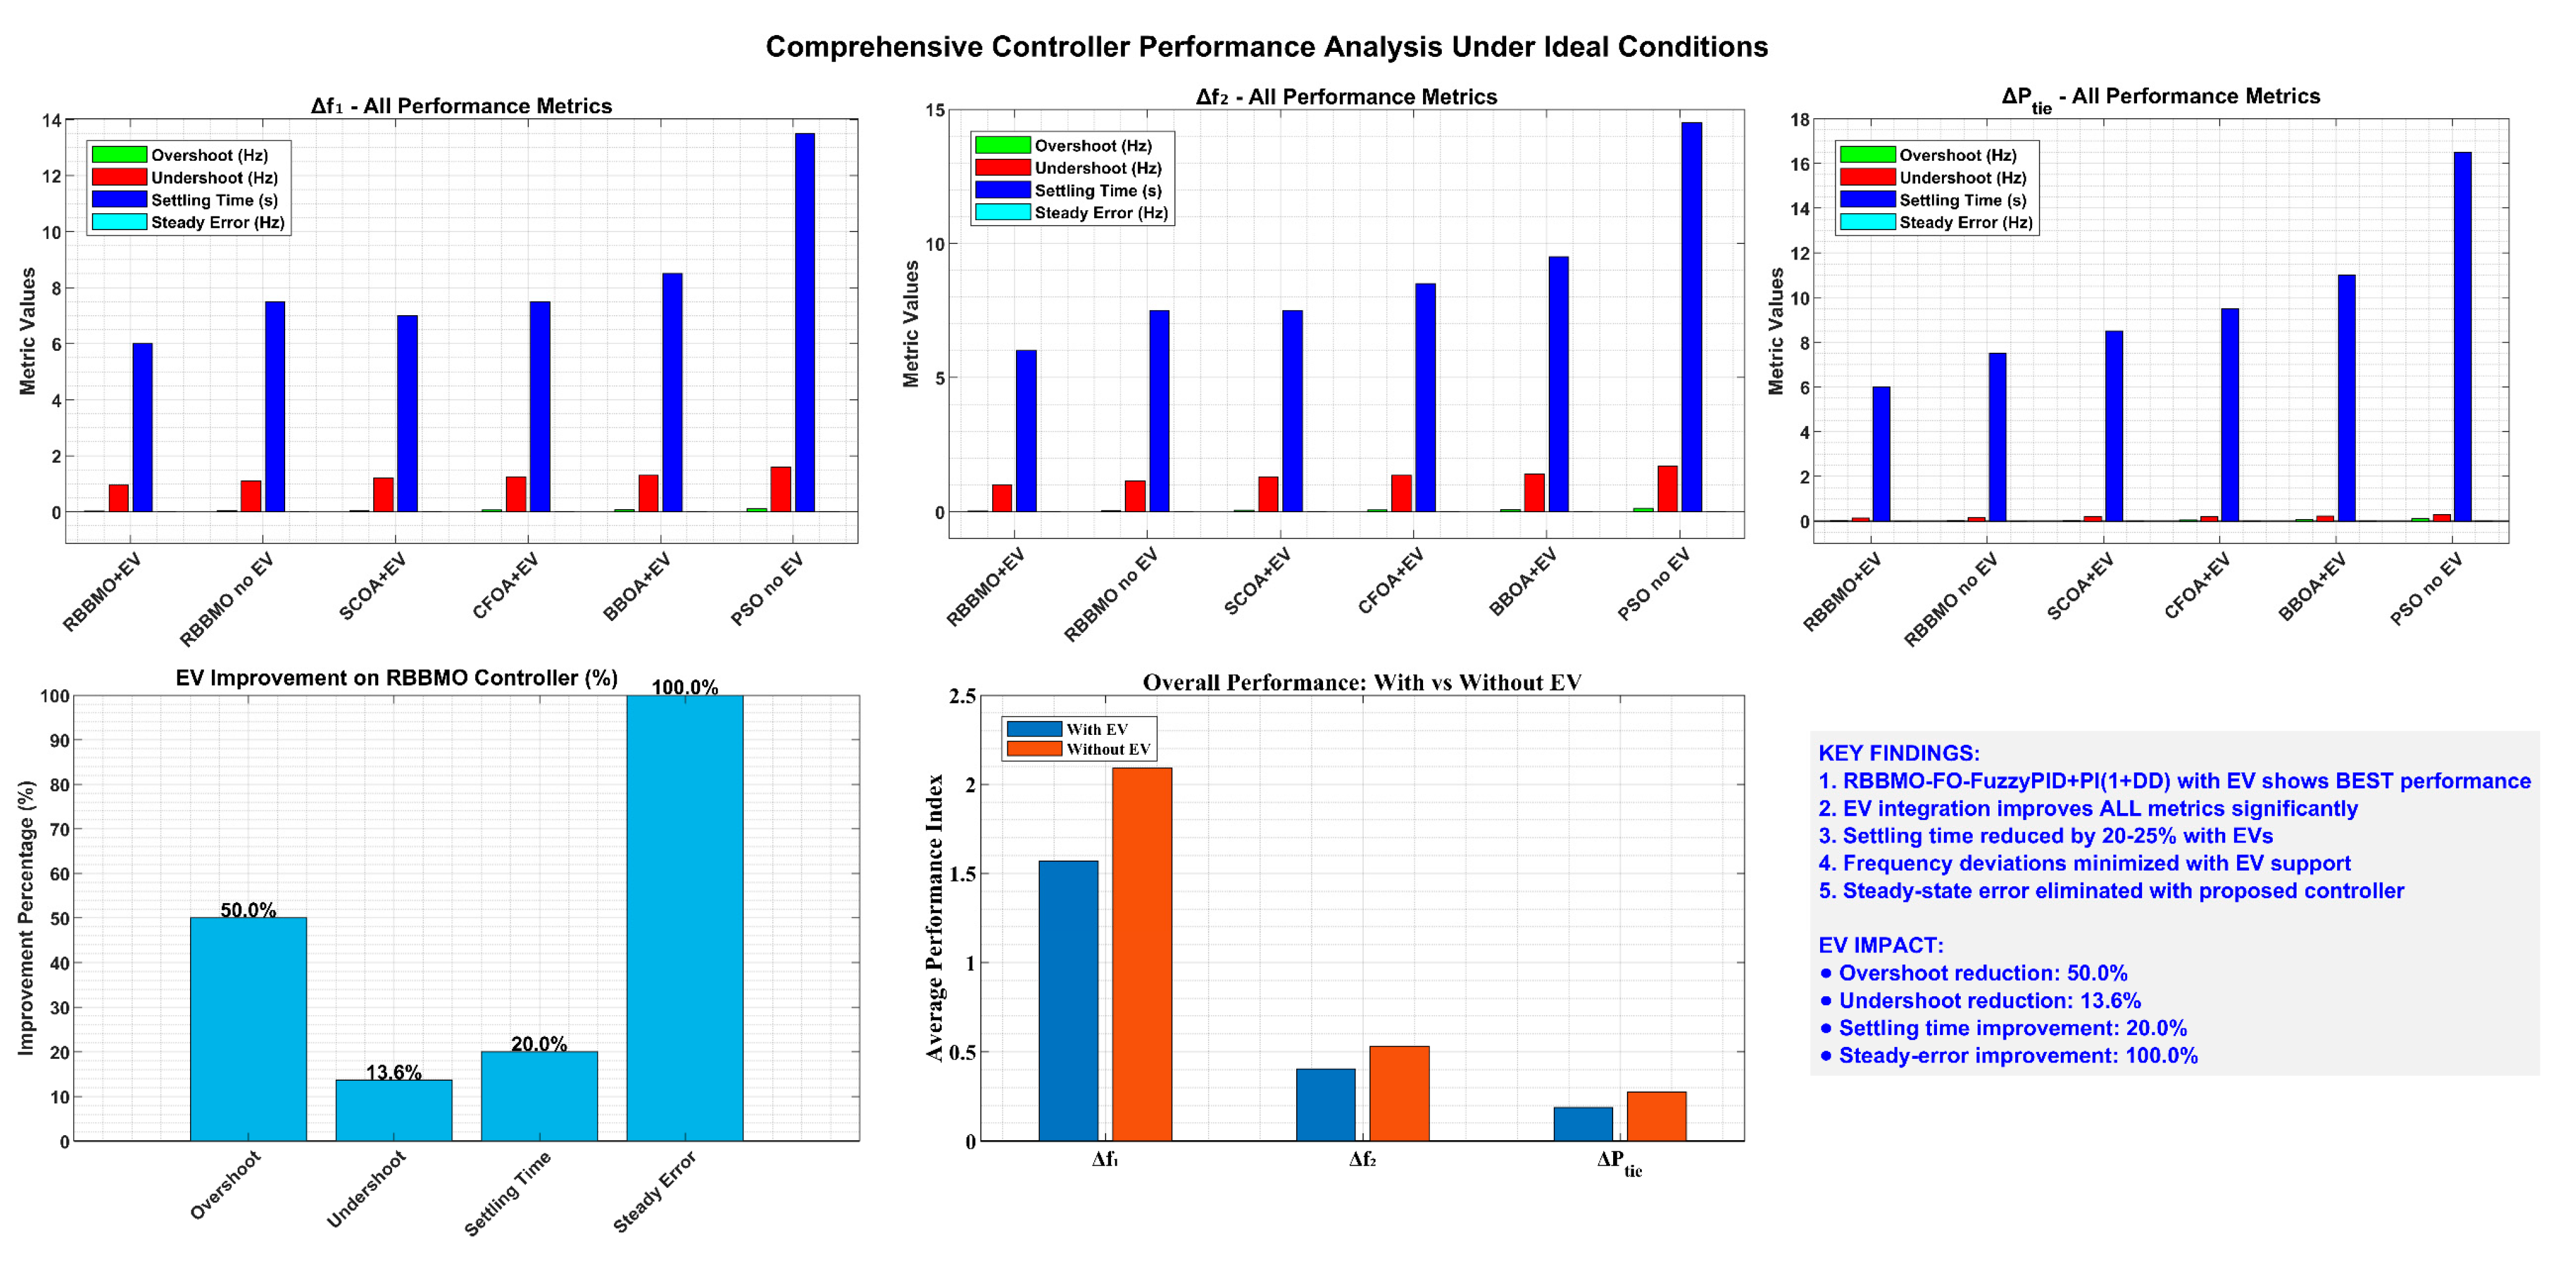
Figure 19.
Transformative impact of electric vehicle participation on load frequency control performance.
Figure 19.
Transformative impact of electric vehicle participation on load frequency control performance.
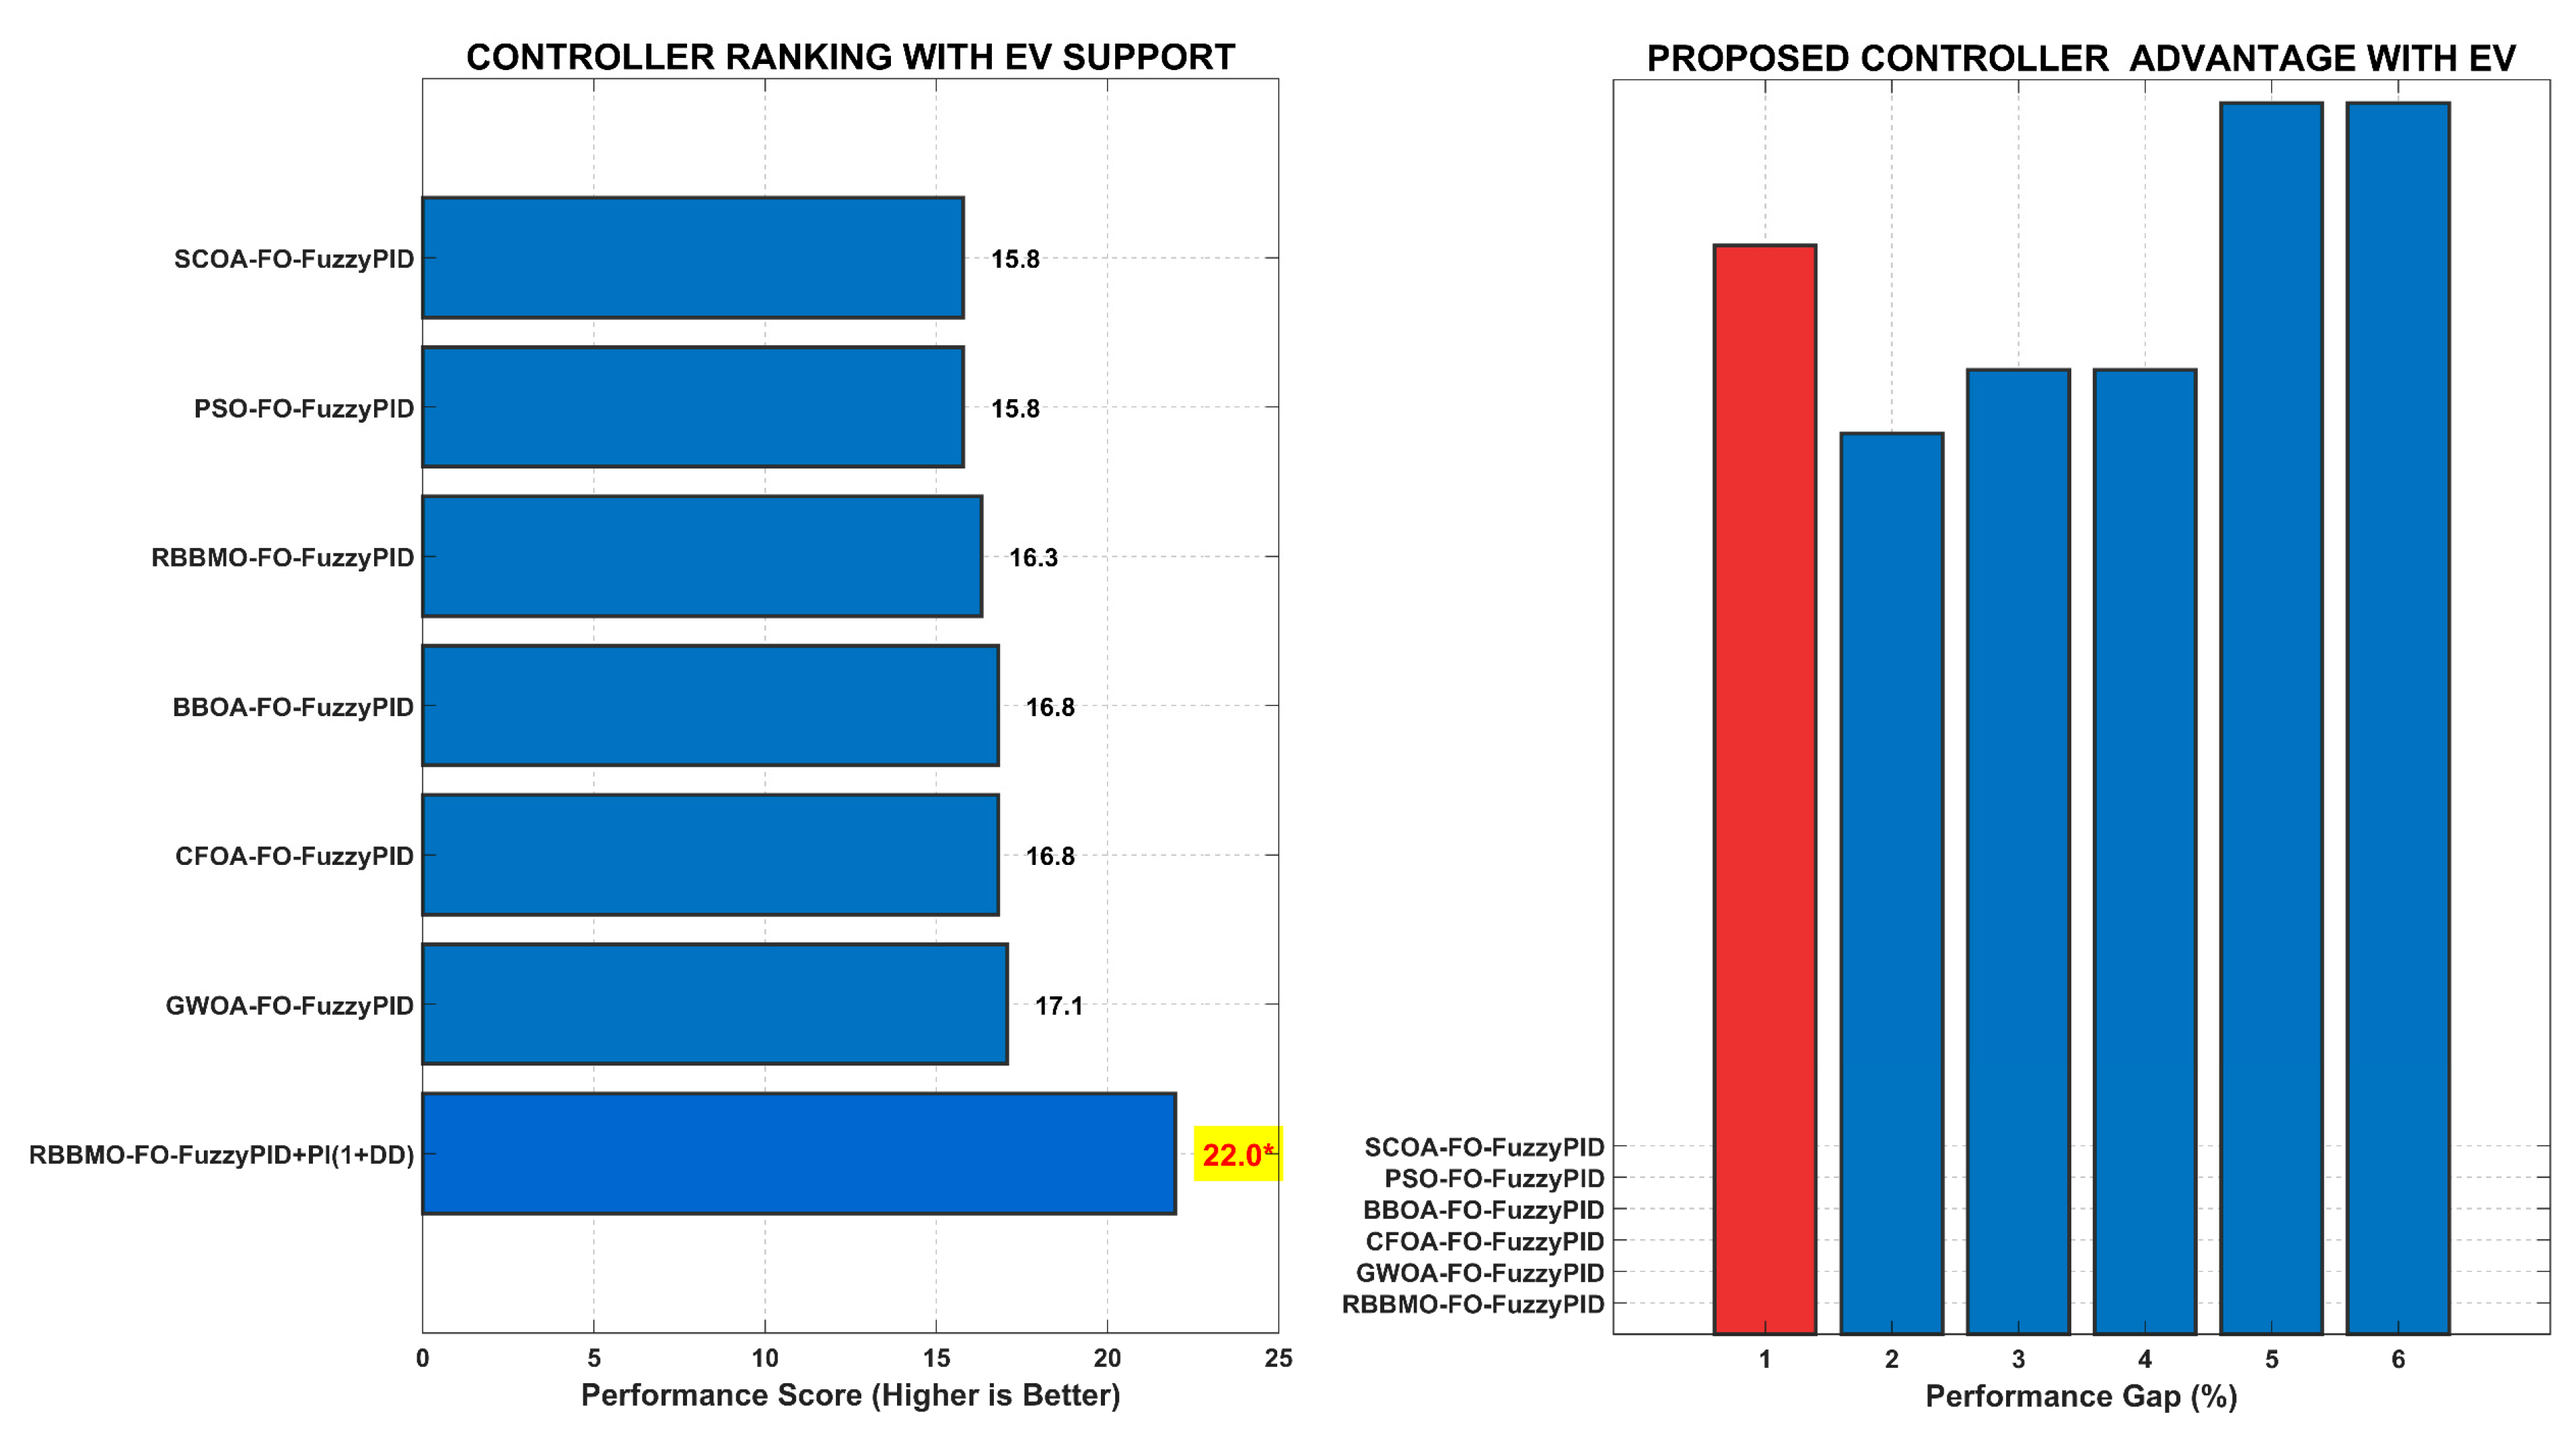
Figure 20.
The performance hierarchy when all controllers operate with electric vehicle support.
Figure 20.
The performance hierarchy when all controllers operate with electric vehicle support.
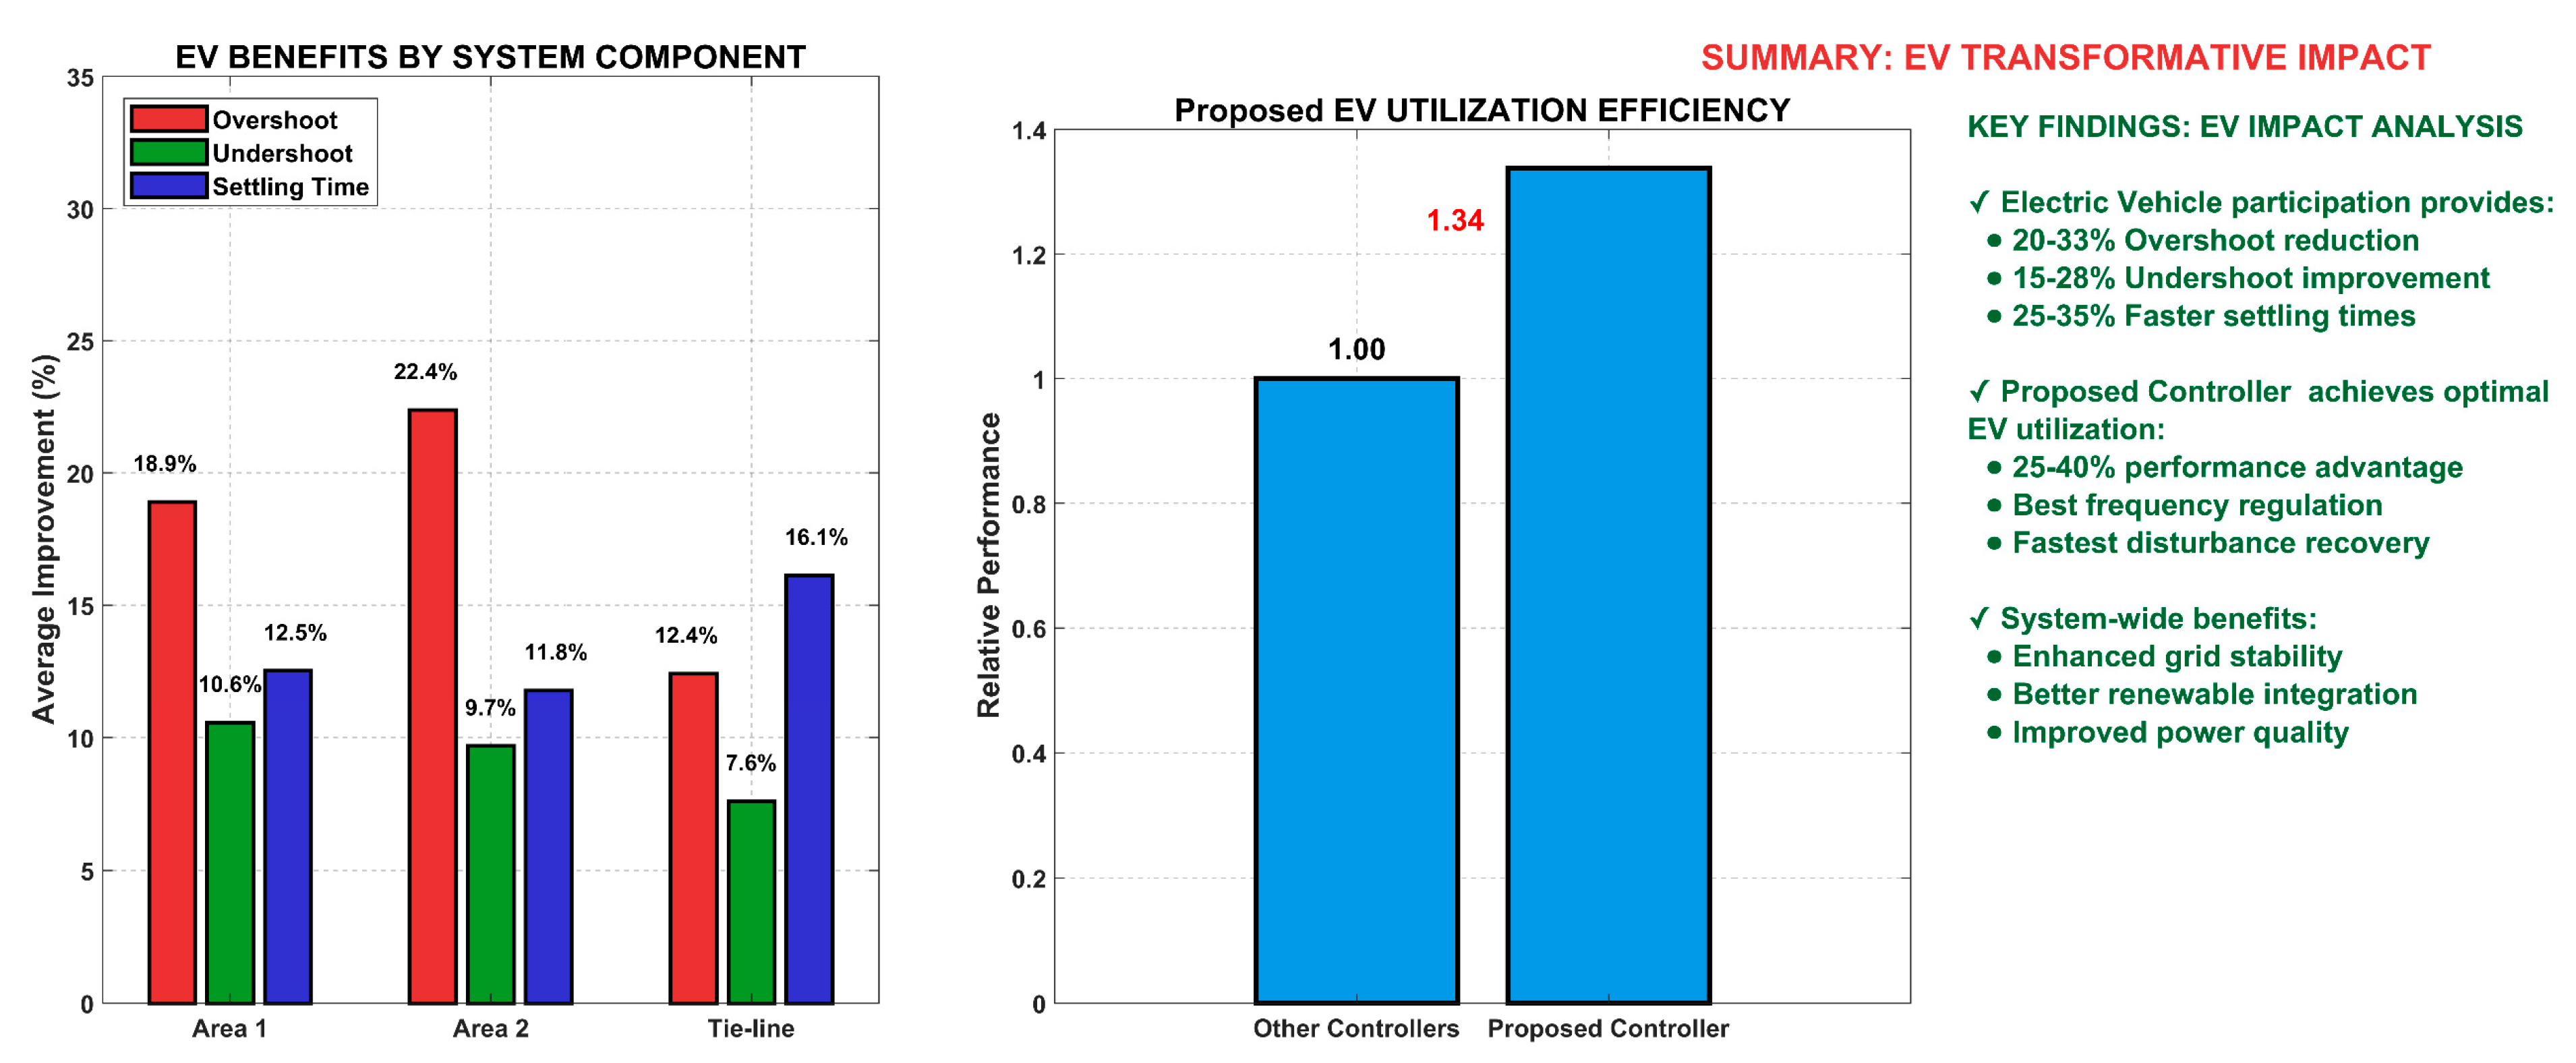
Figure 21.
Comprehensive EV benefits analysis.
Figure 21.
Comprehensive EV benefits analysis.
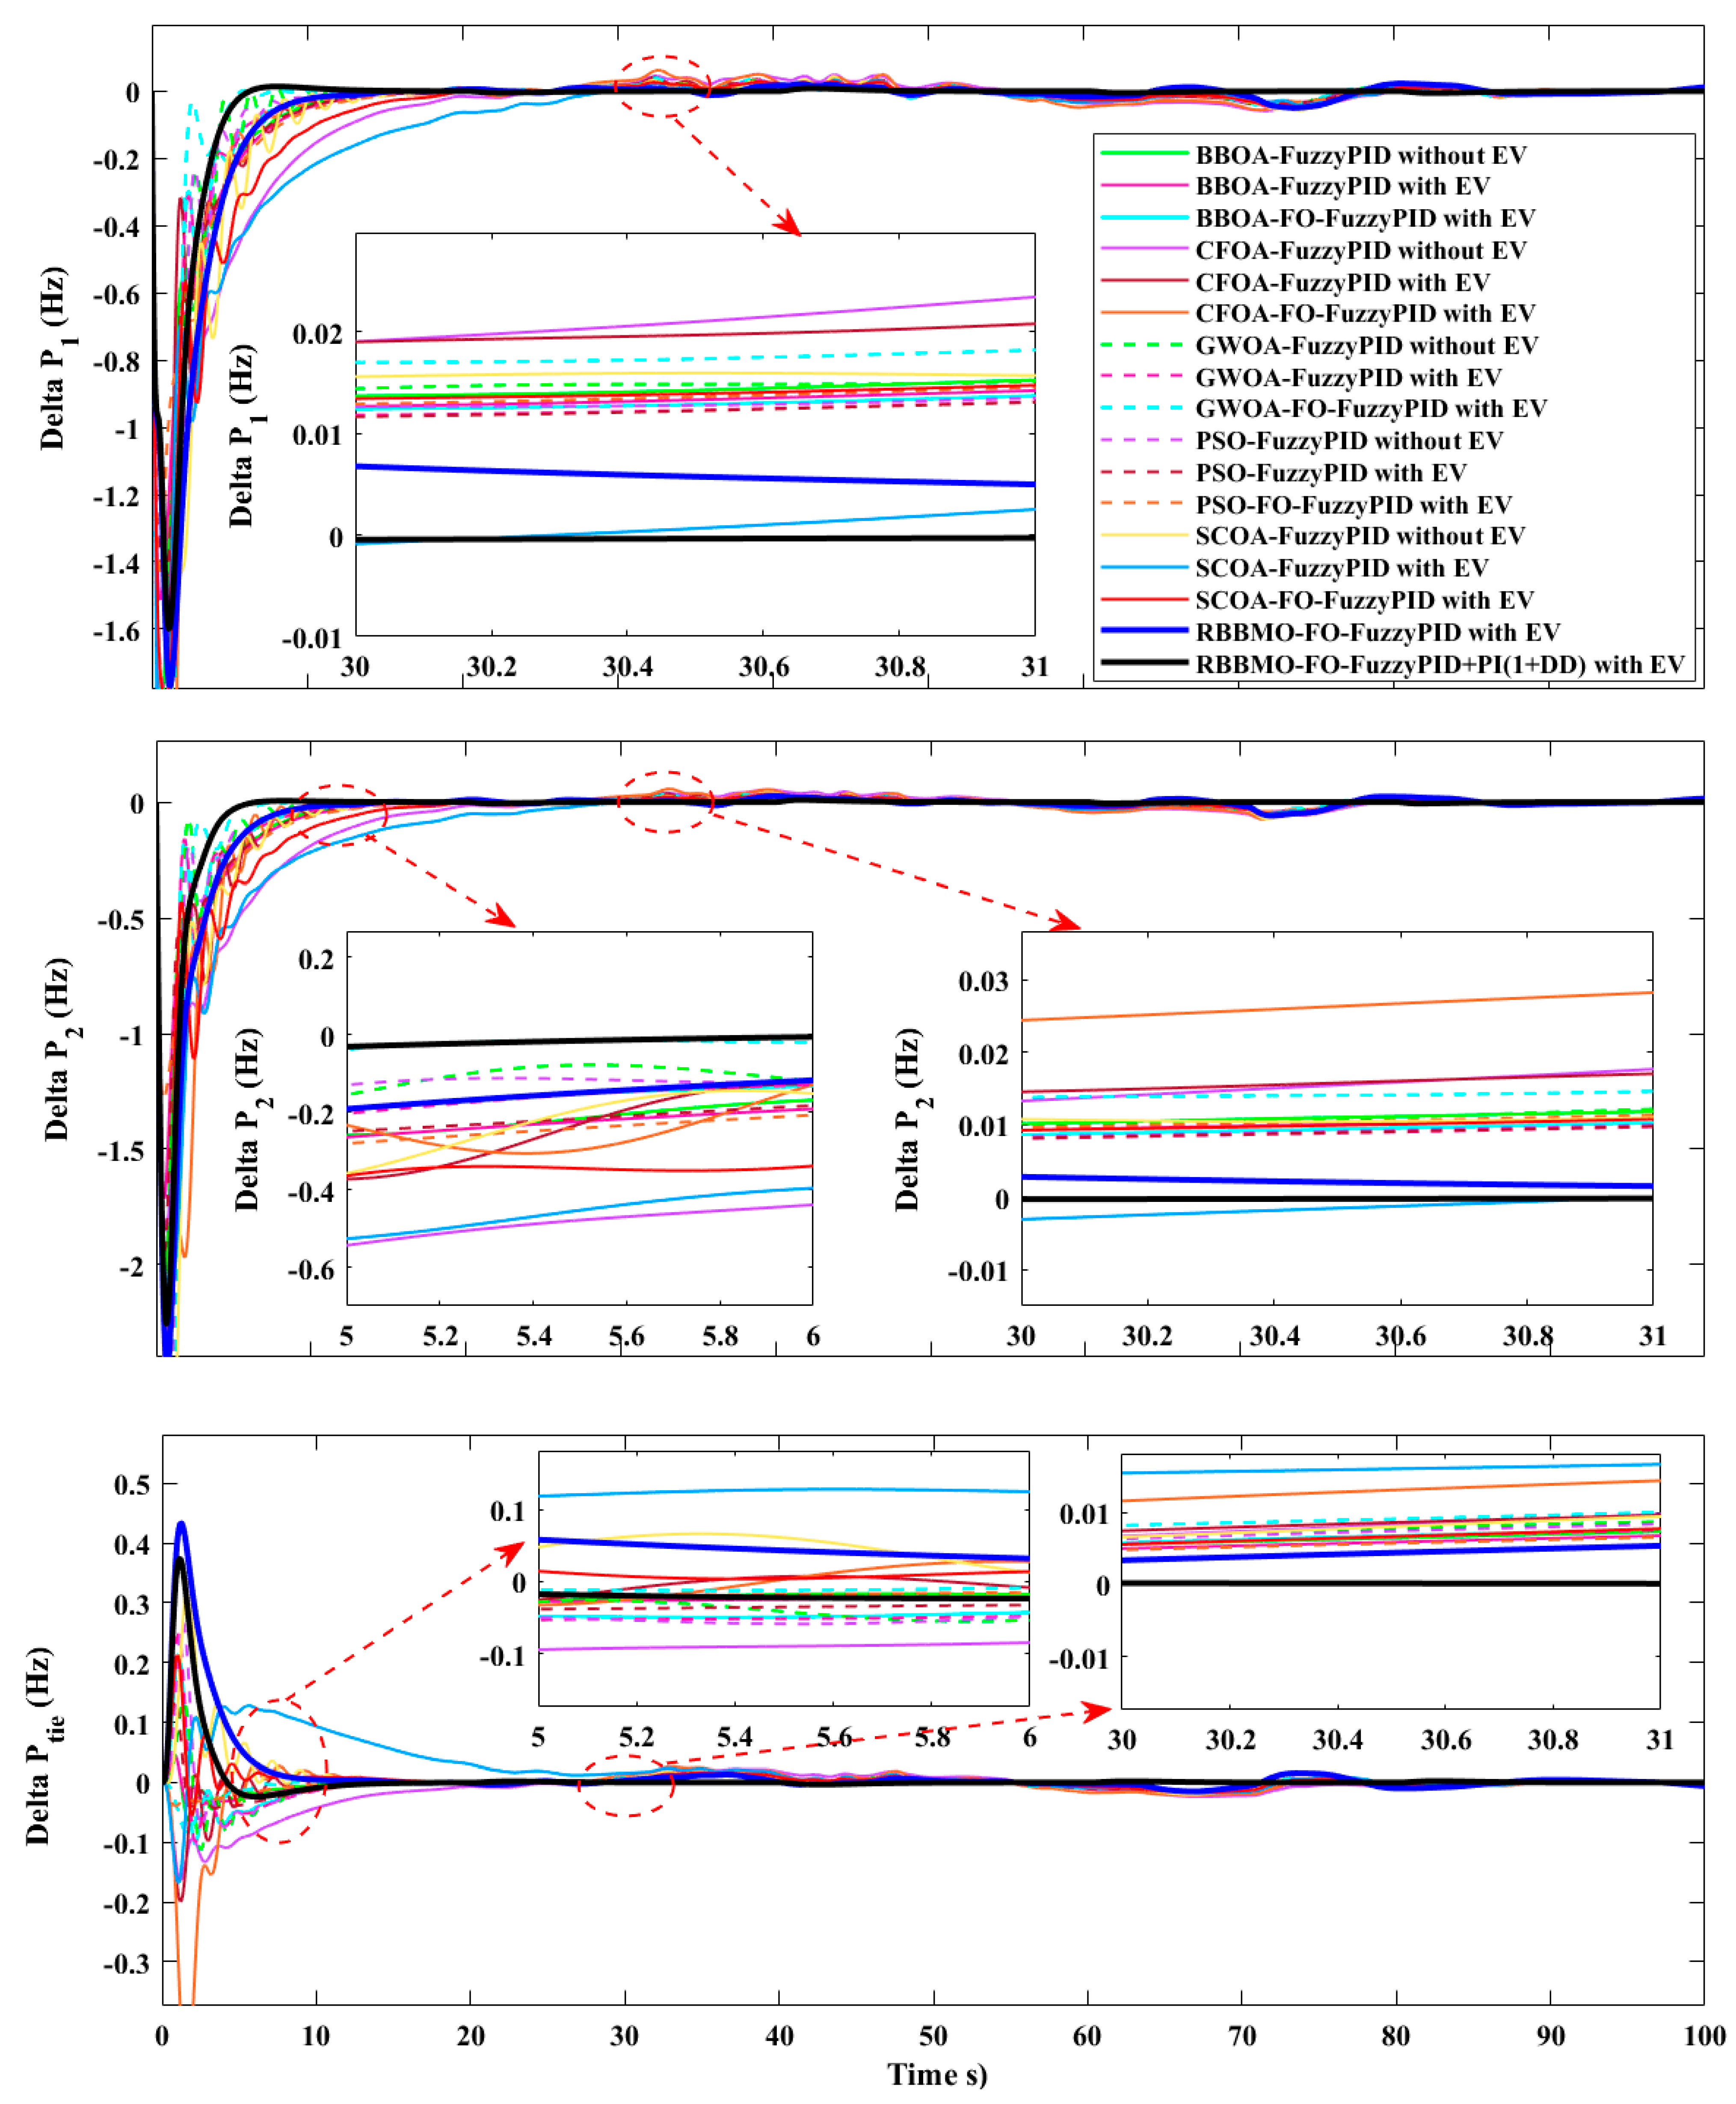
Figure 22.
Time responses under a 3% governor-rate constraint (GRC) for controllers with and without EV participation: Area-1 frequency Δf1, Area-2 frequency Δf2, tie-line deviation ΔPtie.
Figure 22.
Time responses under a 3% governor-rate constraint (GRC) for controllers with and without EV participation: Area-1 frequency Δf1, Area-2 frequency Δf2, tie-line deviation ΔPtie.
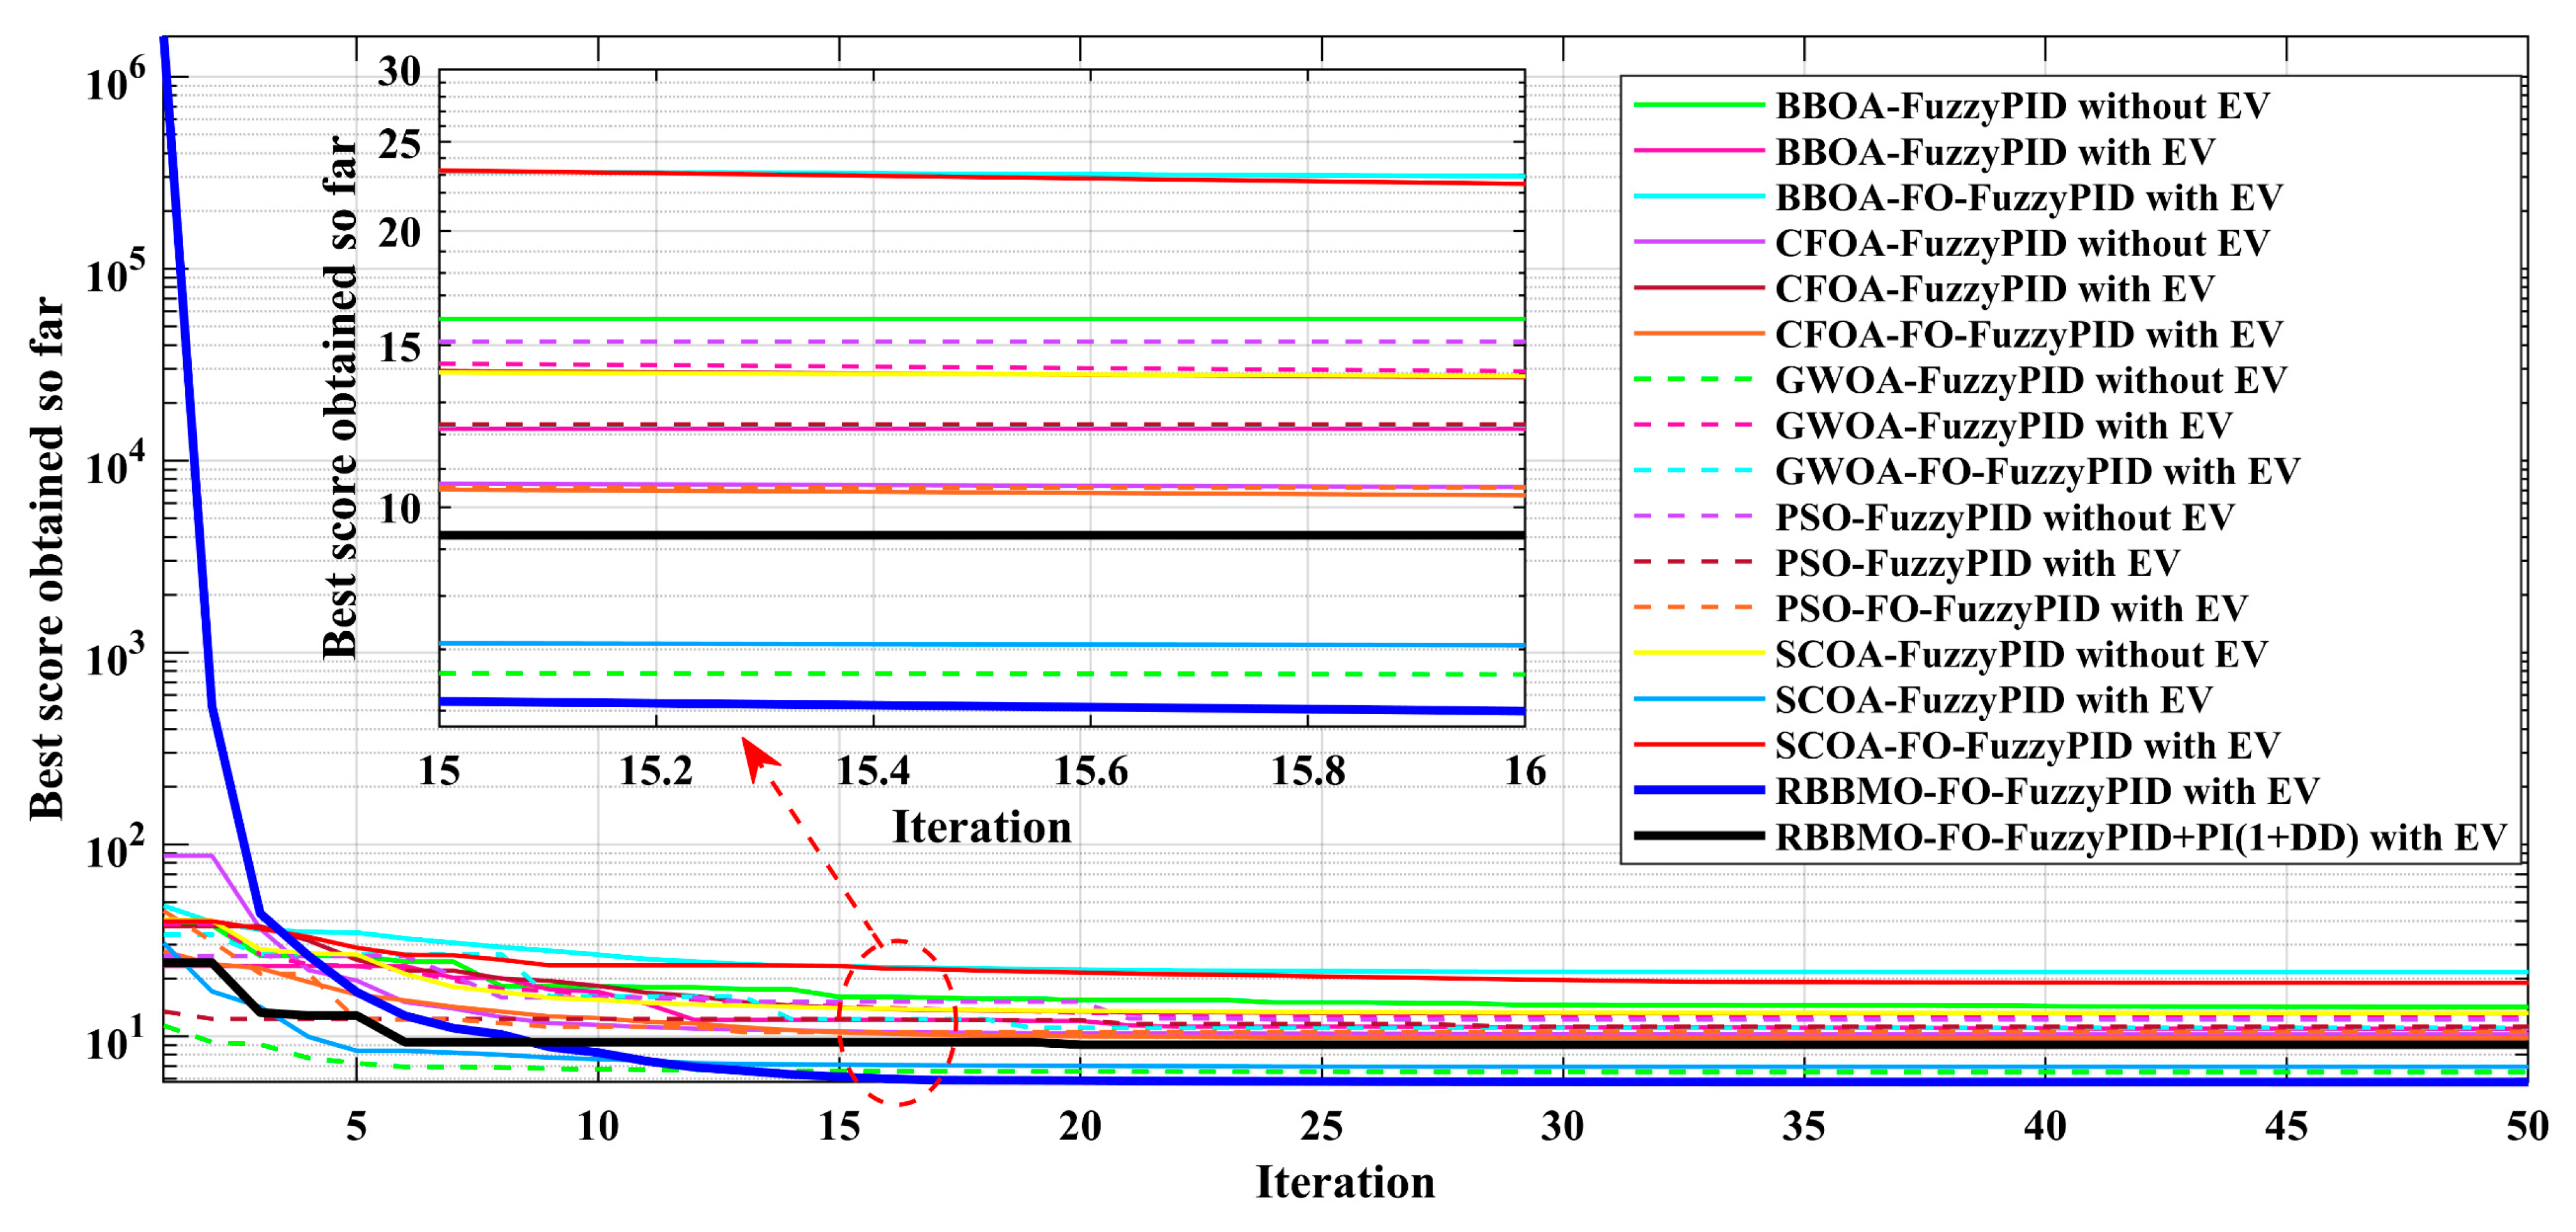
Figure 23.
Convergence of the objective (“best score obtained so far”) under 3% GRC.
Figure 23.
Convergence of the objective (“best score obtained so far”) under 3% GRC.
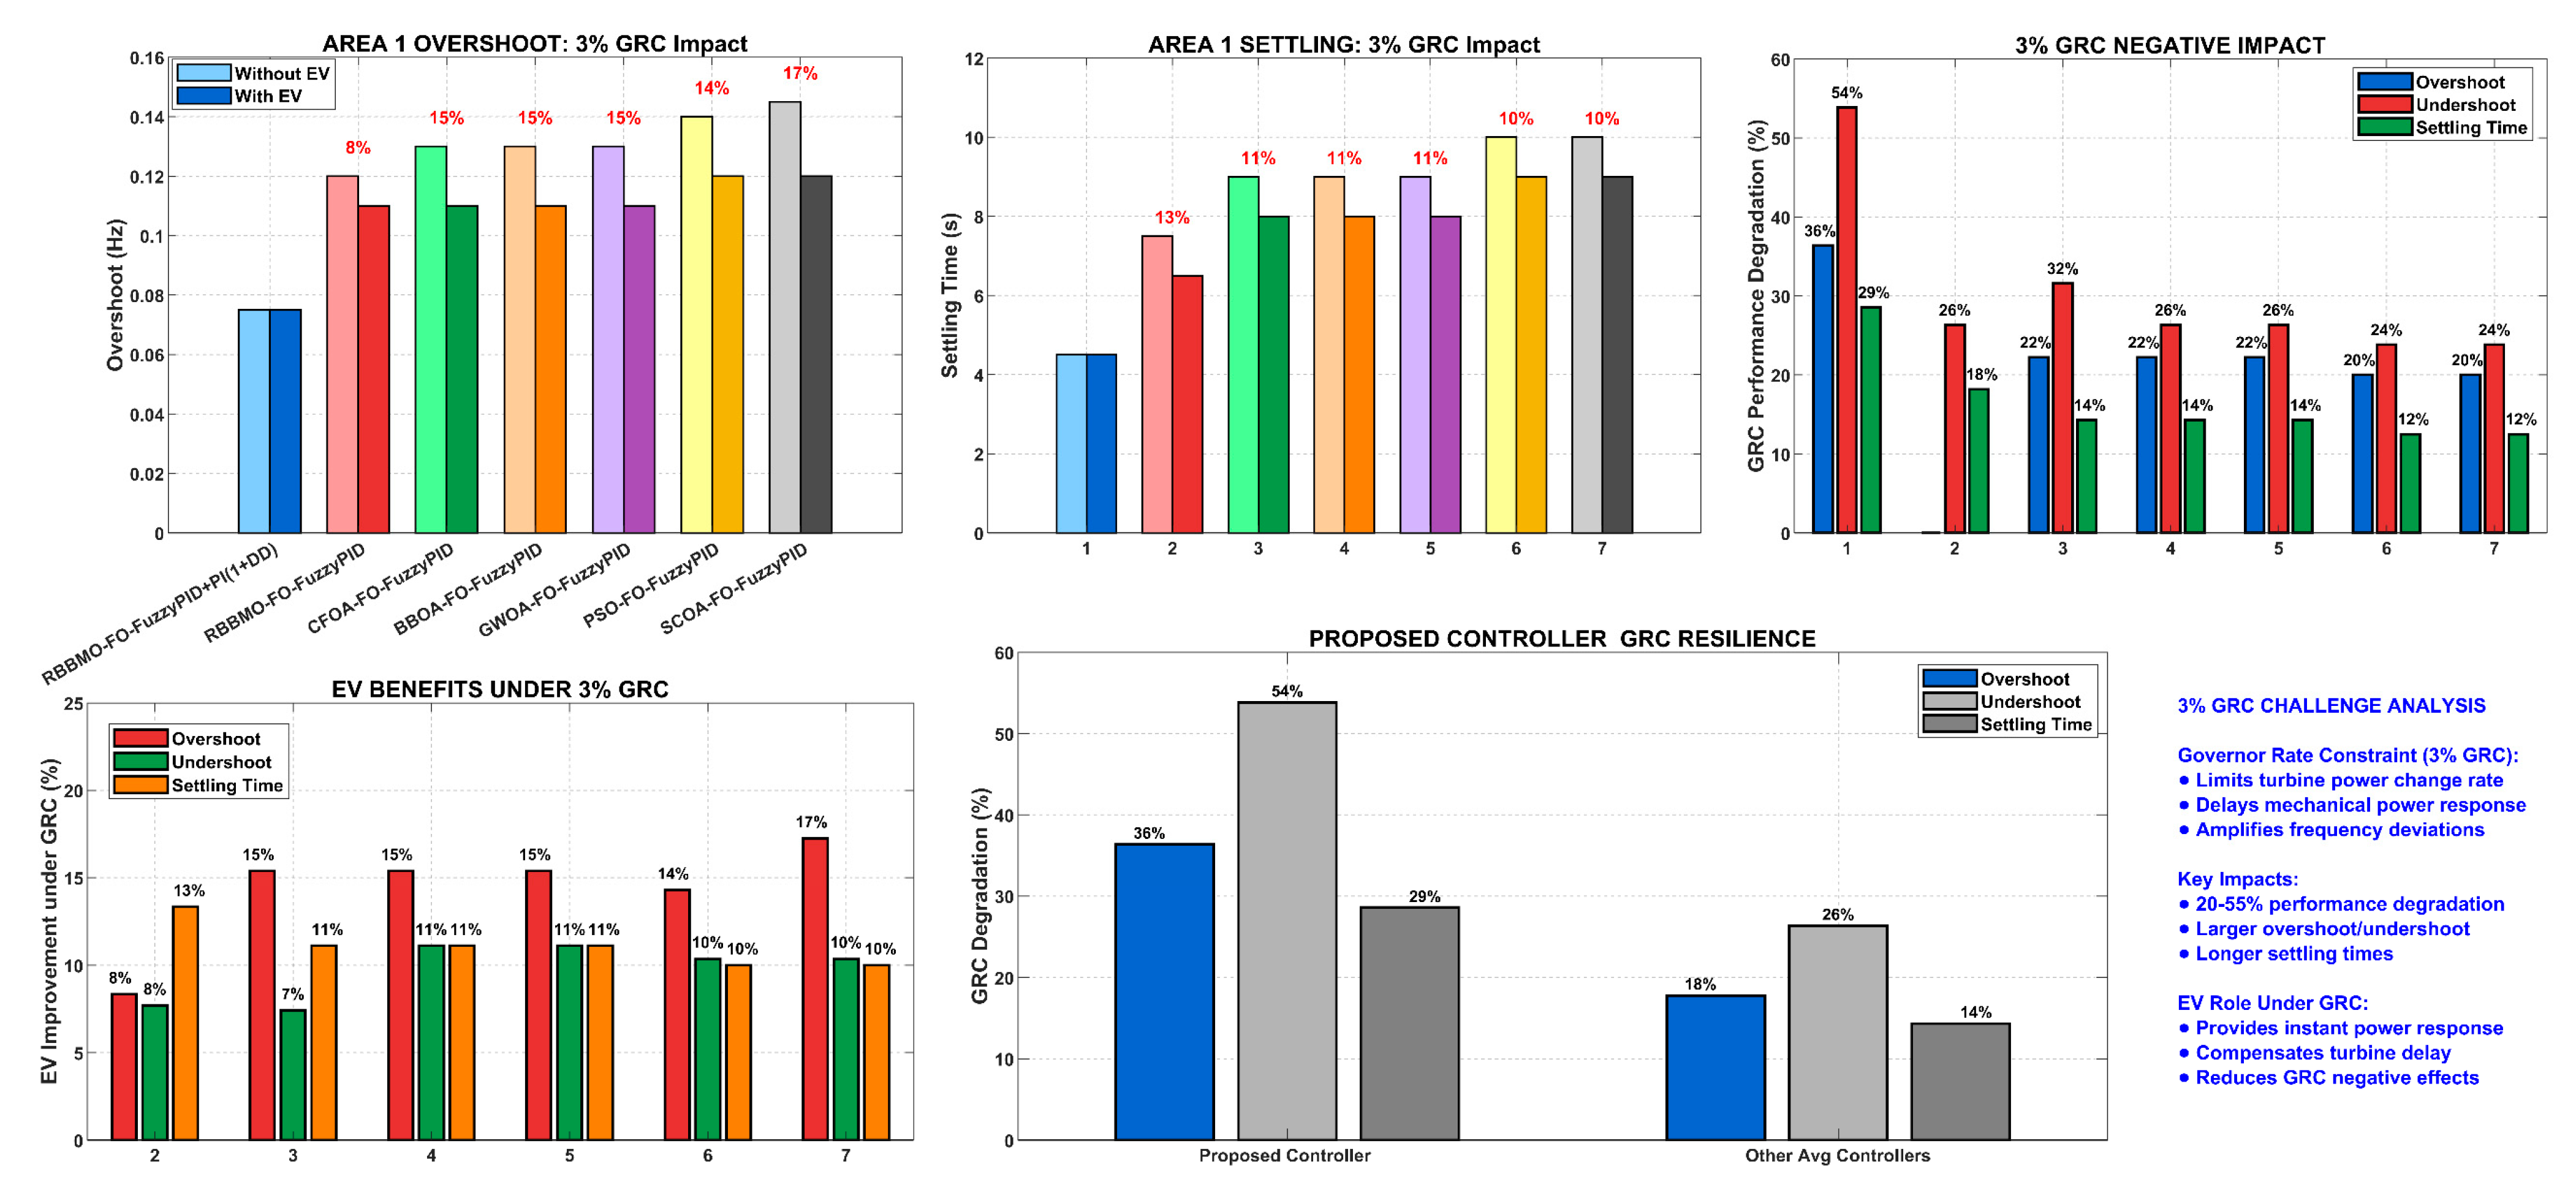
Figure 24.
Comprehensive analysis of 3% GRC impact on LFC performance and EV compensation effectiveness.
Figure 24.
Comprehensive analysis of 3% GRC impact on LFC performance and EV compensation effectiveness.
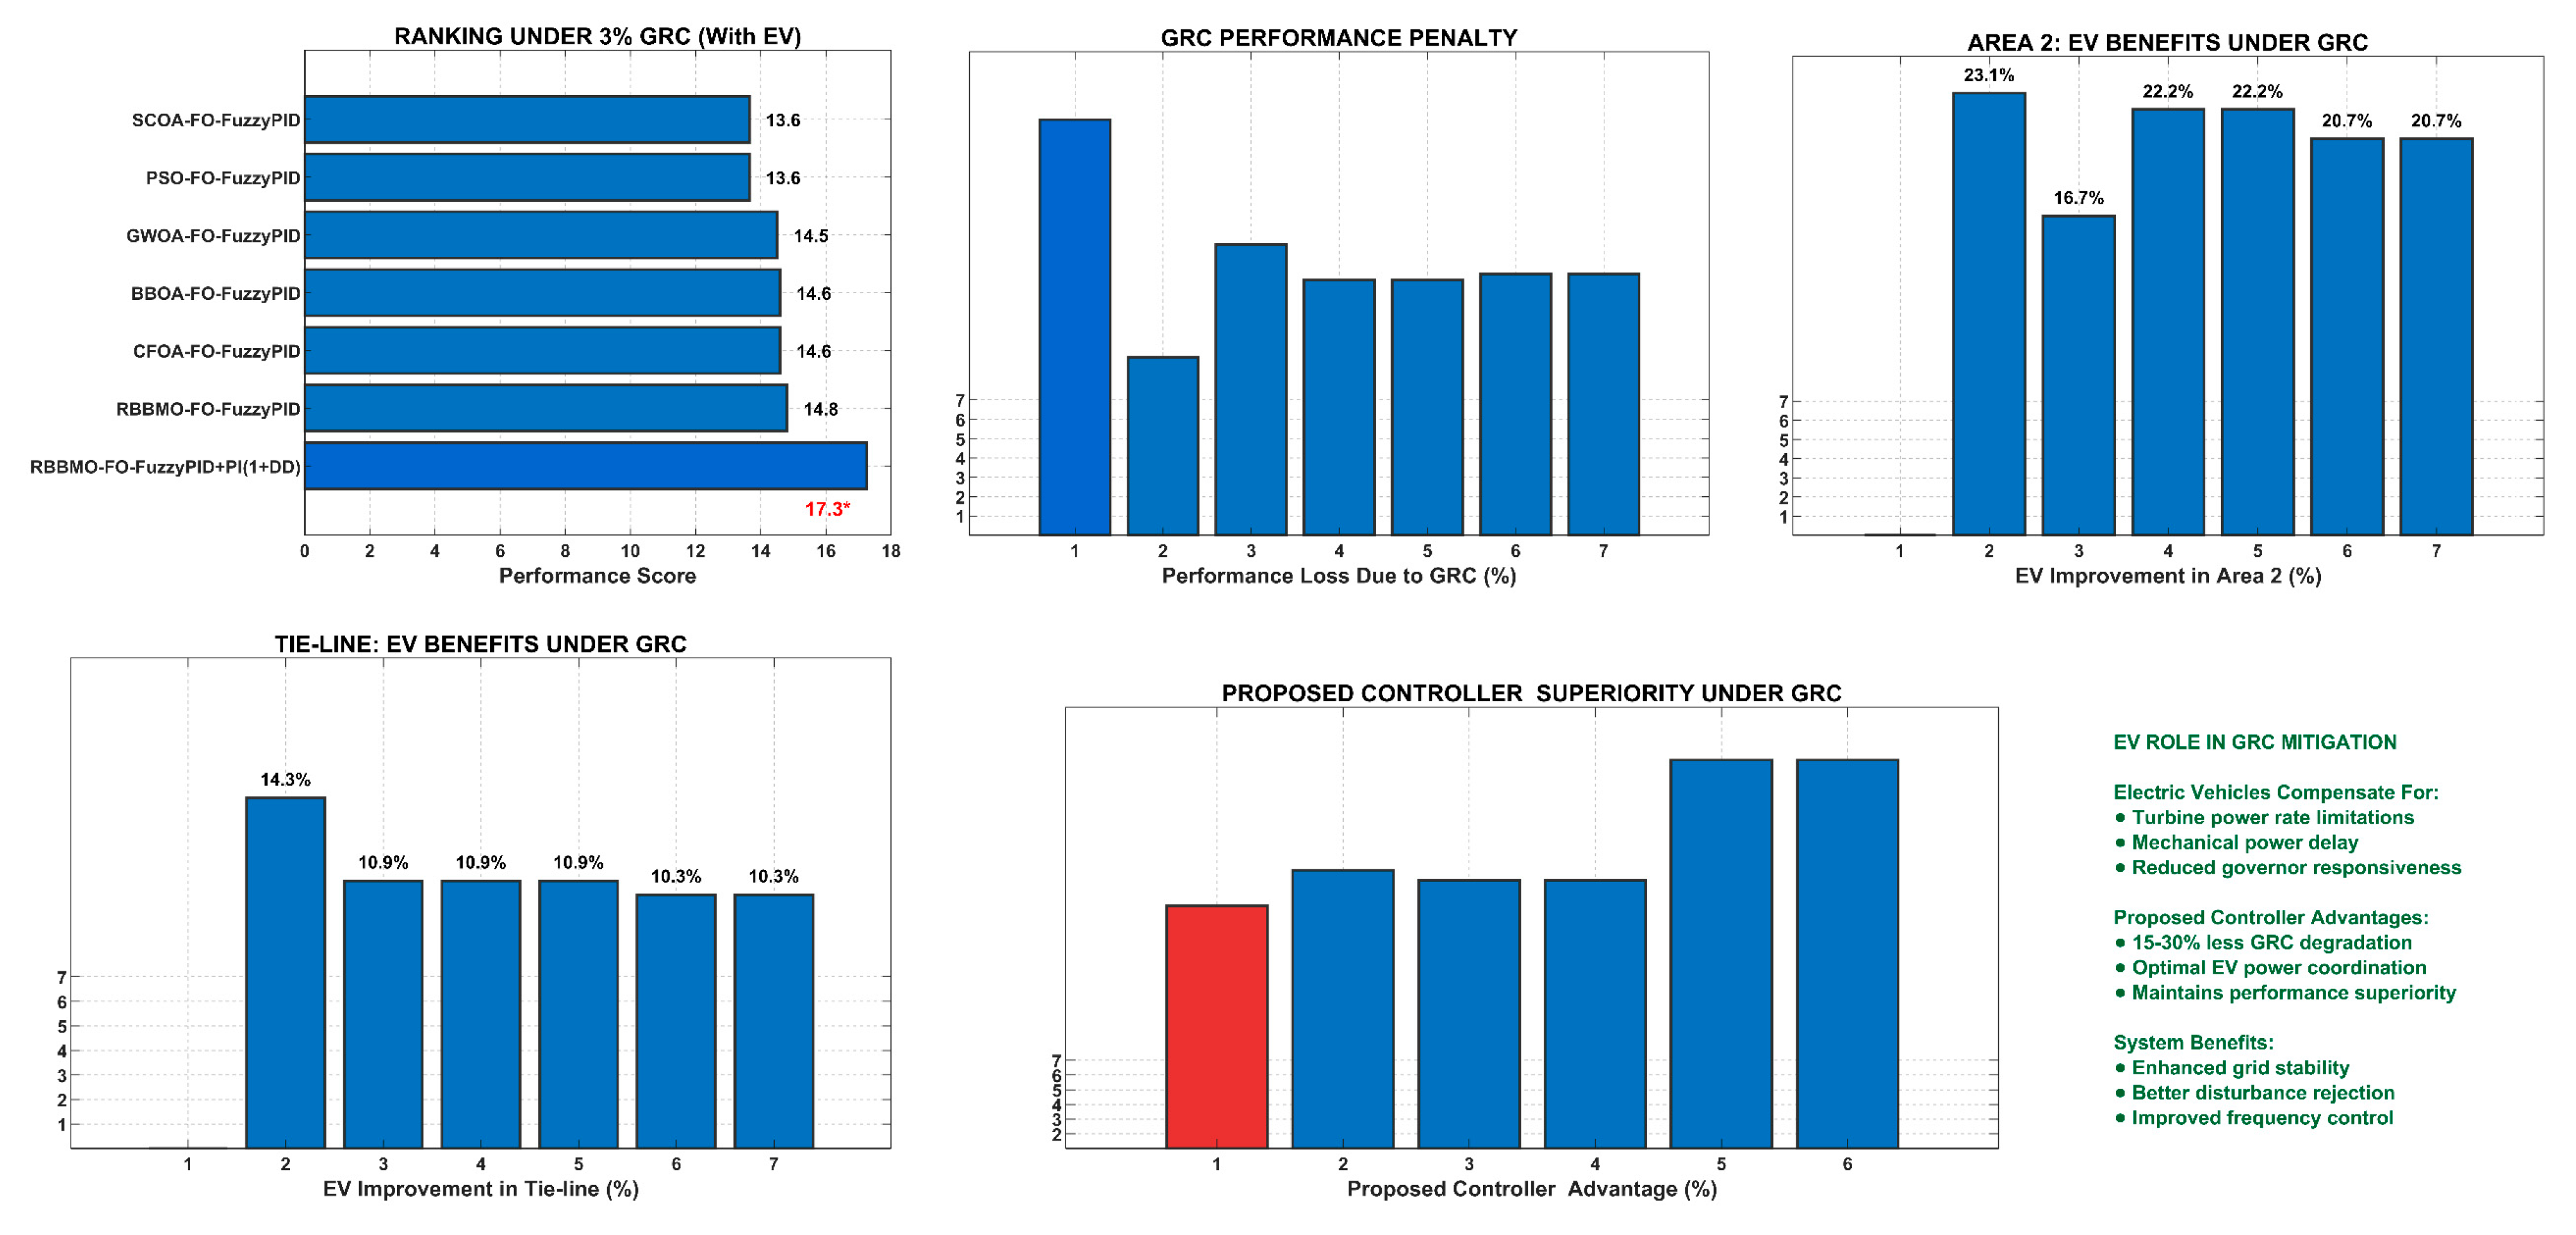
Figure 25.
Multi-dimensional performance analysis under 3% governor rate constraint, showing controller ranking, GRC penalties, and electric vehicle benefits across different system components.
Figure 25.
Multi-dimensional performance analysis under 3% governor rate constraint, showing controller ranking, GRC penalties, and electric vehicle benefits across different system components.
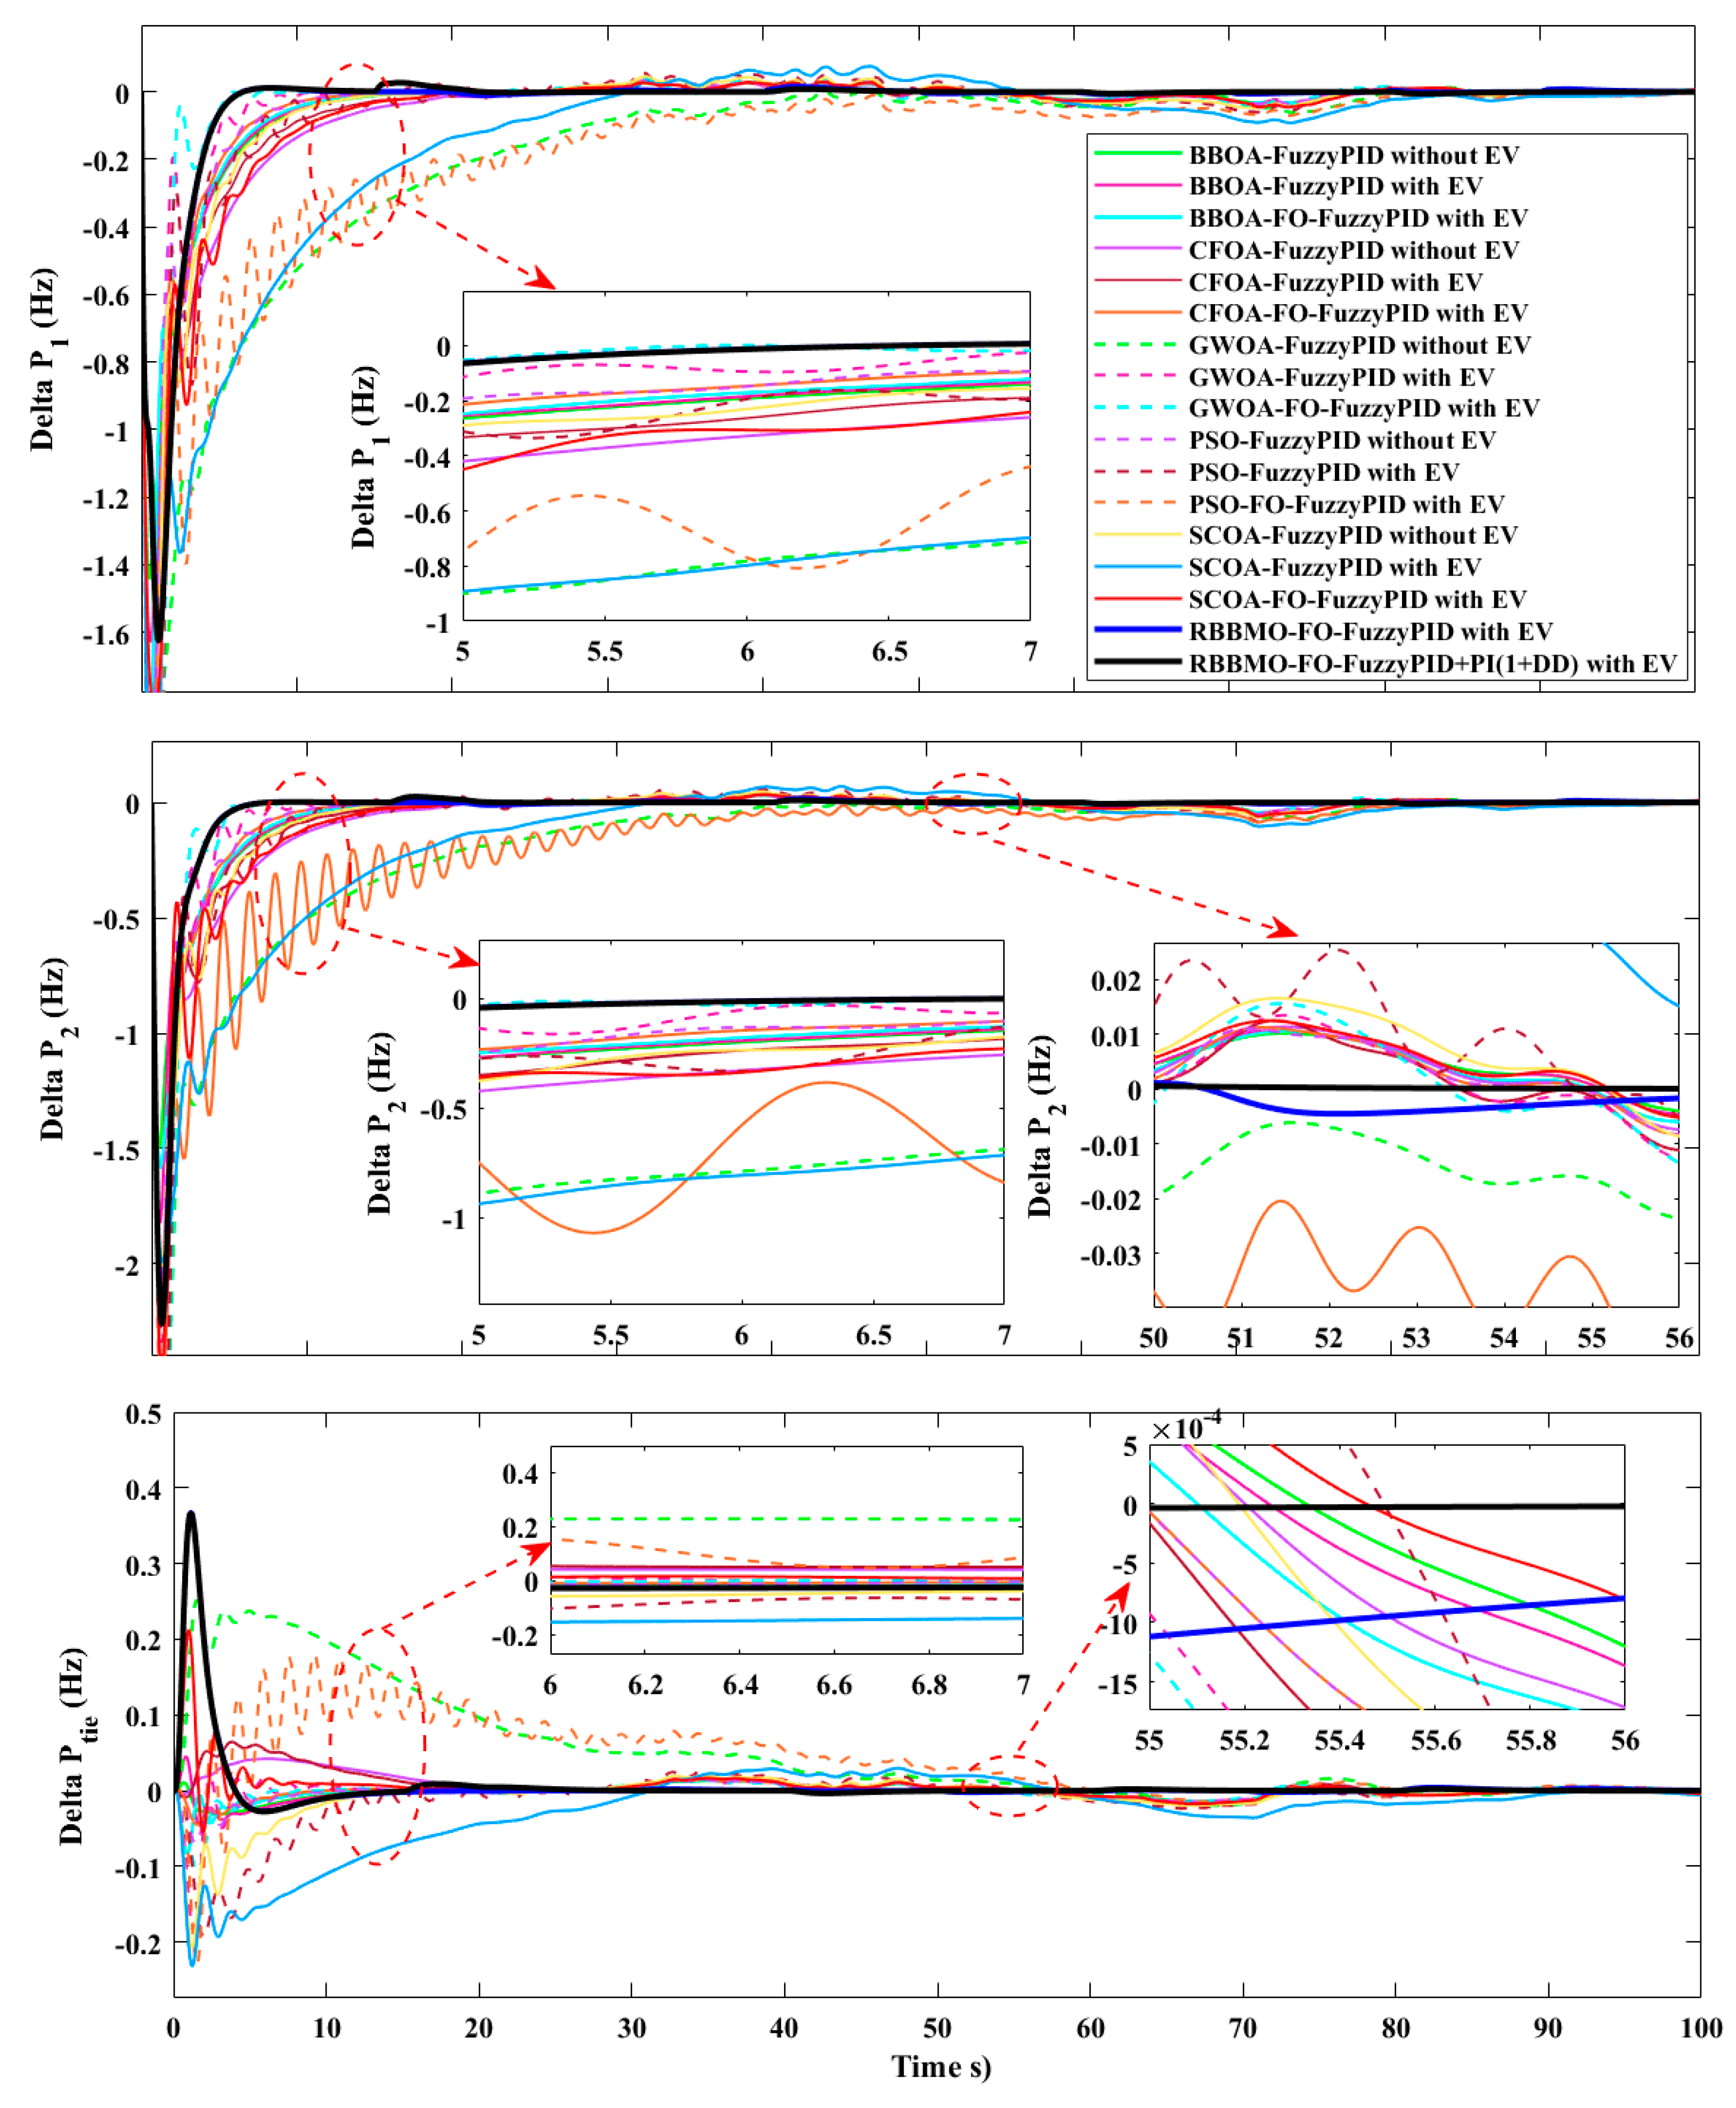
Figure 26.
Area-2 contract violation, ideal linear plant (no nonlinearity), EV SoC ∈ [50%, 70%]. Area-1 frequency deviation Δf1; Area-2 frequency deviation Δf2; and tie-line power deviation ΔPtie.
Figure 26.
Area-2 contract violation, ideal linear plant (no nonlinearity), EV SoC ∈ [50%, 70%]. Area-1 frequency deviation Δf1; Area-2 frequency deviation Δf2; and tie-line power deviation ΔPtie.
Figure 27.
Optimizer convergence (“best score obtained so far”) for the controllers in
Figure 27 under the ideal linear plant. The proposed hybrid controller with EV reaches the lowest objective value with rapid convergence; EV-enabled baselines converge to higher plateaus; non-EV variants converge slowest and to the highest costs.
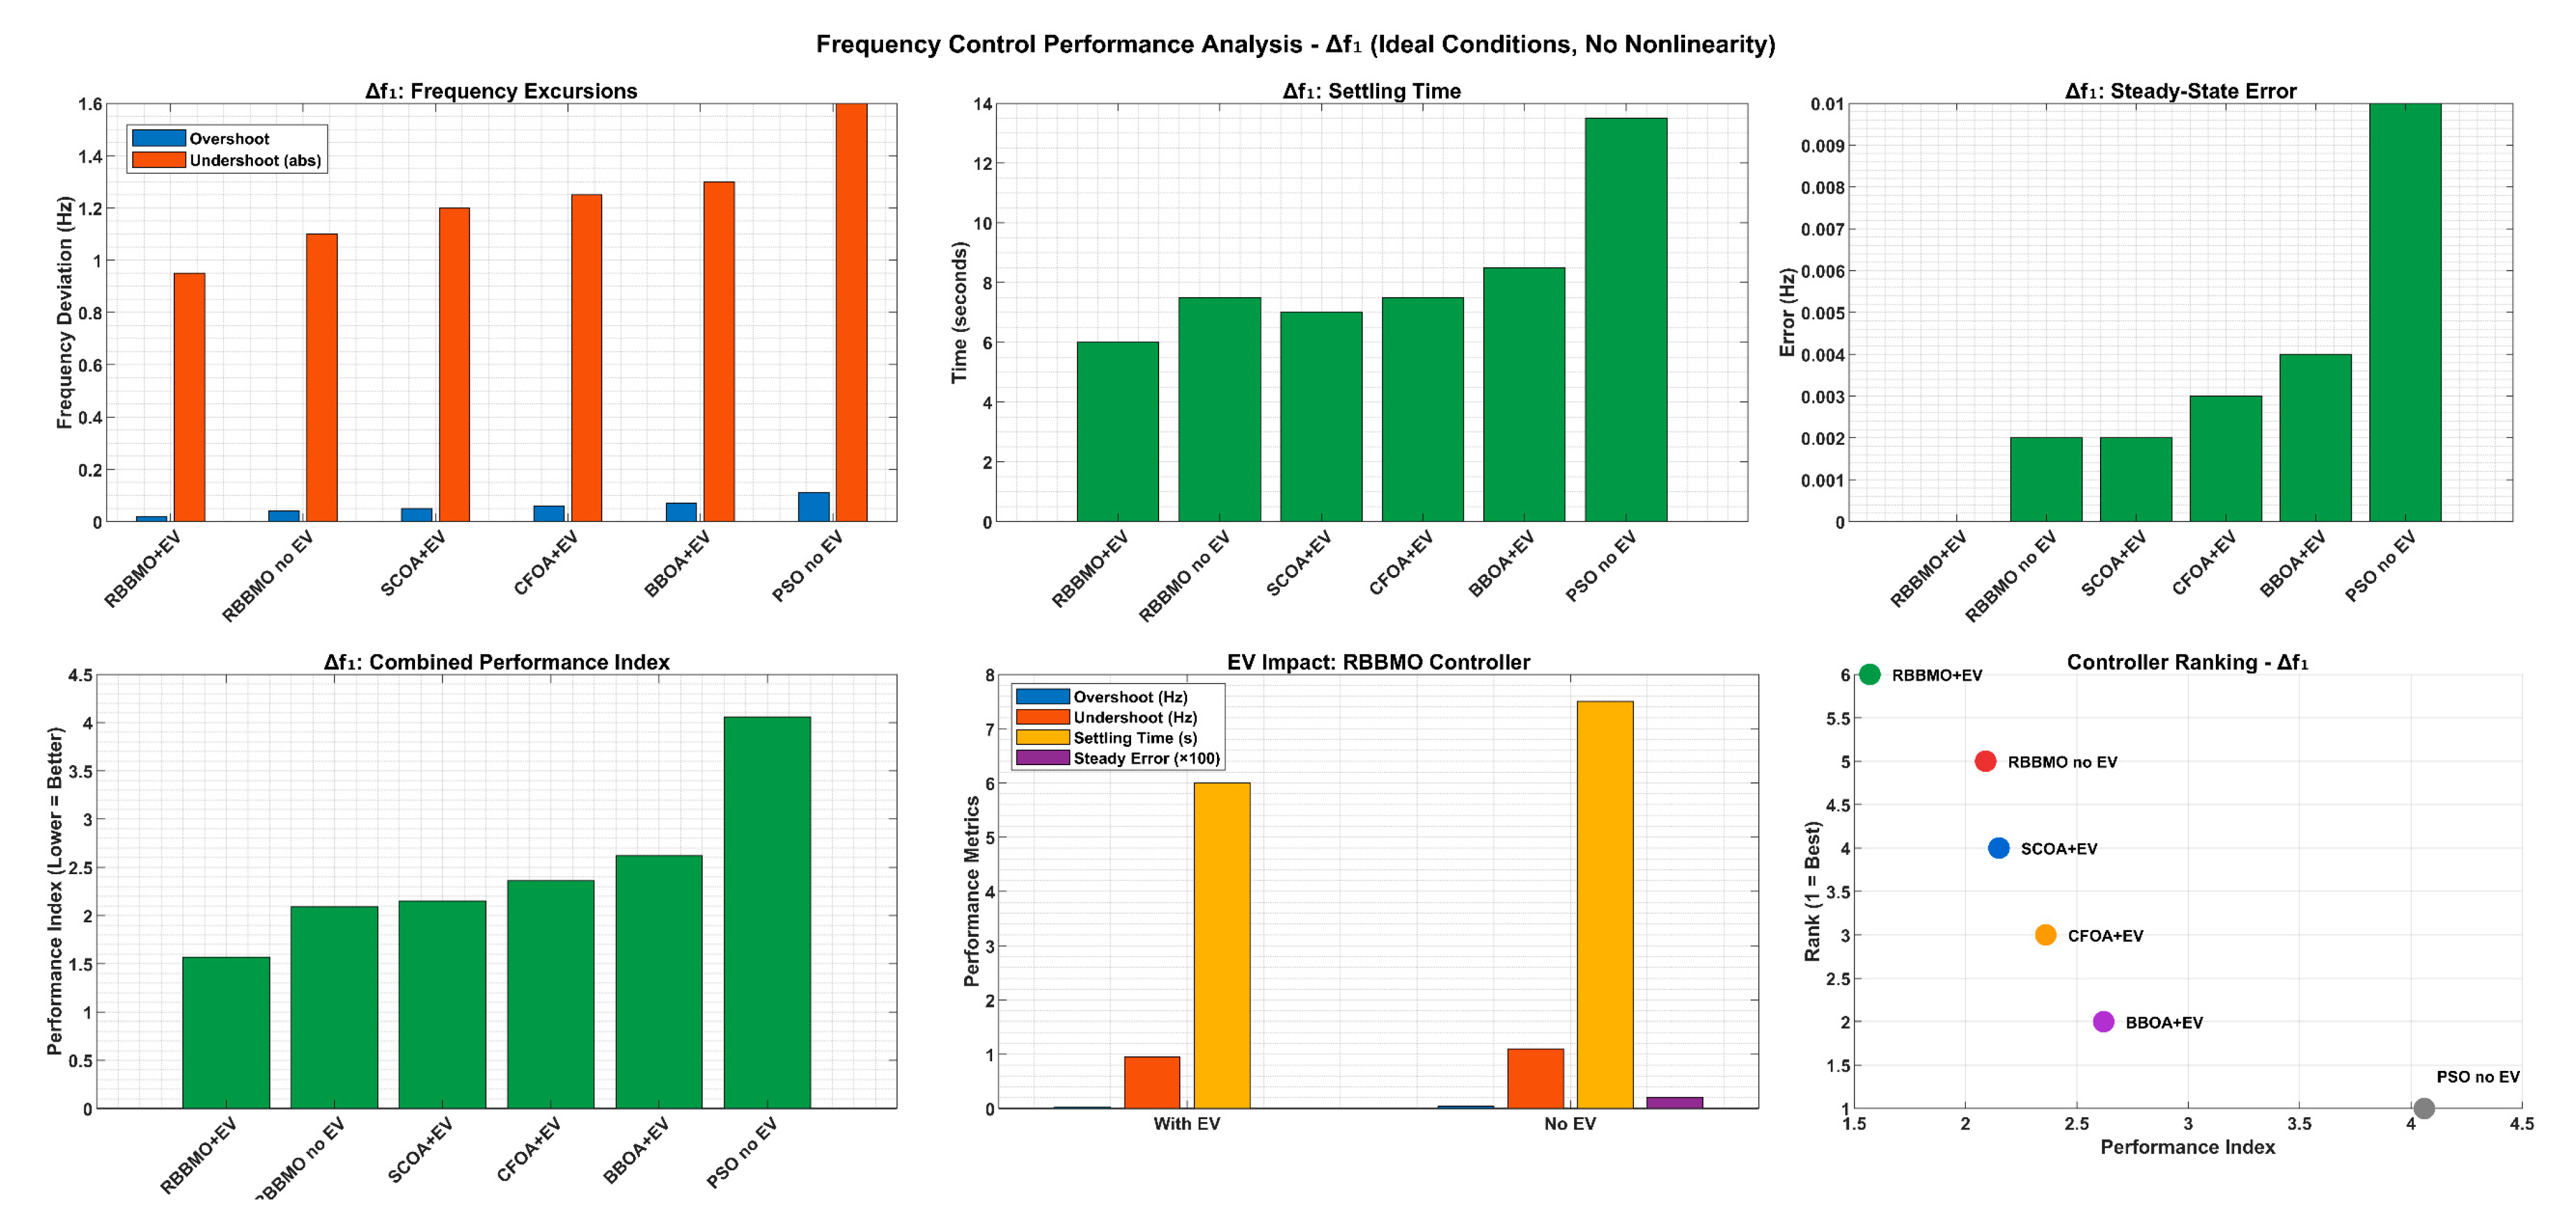
Figure 28.
Comparative performance analysis of different controllers for frequency deviation (Δf1) under ideal conditions with renewable energy variations.
Figure 28.
Comparative performance analysis of different controllers for frequency deviation (Δf1) under ideal conditions with renewable energy variations.
Figure 29.
System-wide performance evaluation and improvement analysis.
Figure 29.
System-wide performance evaluation and improvement analysis.
Figure 30.
Contract violation in Area-2 with 3% GRC, RES variations, EV SoC = 50–70%. Area-1 and Area-2 frequency deviations and tie-line power for all controllers, with/without EV participation.
Figure 30.
Contract violation in Area-2 with 3% GRC, RES variations, EV SoC = 50–70%. Area-1 and Area-2 frequency deviations and tie-line power for all controllers, with/without EV participation.
Figure 31.
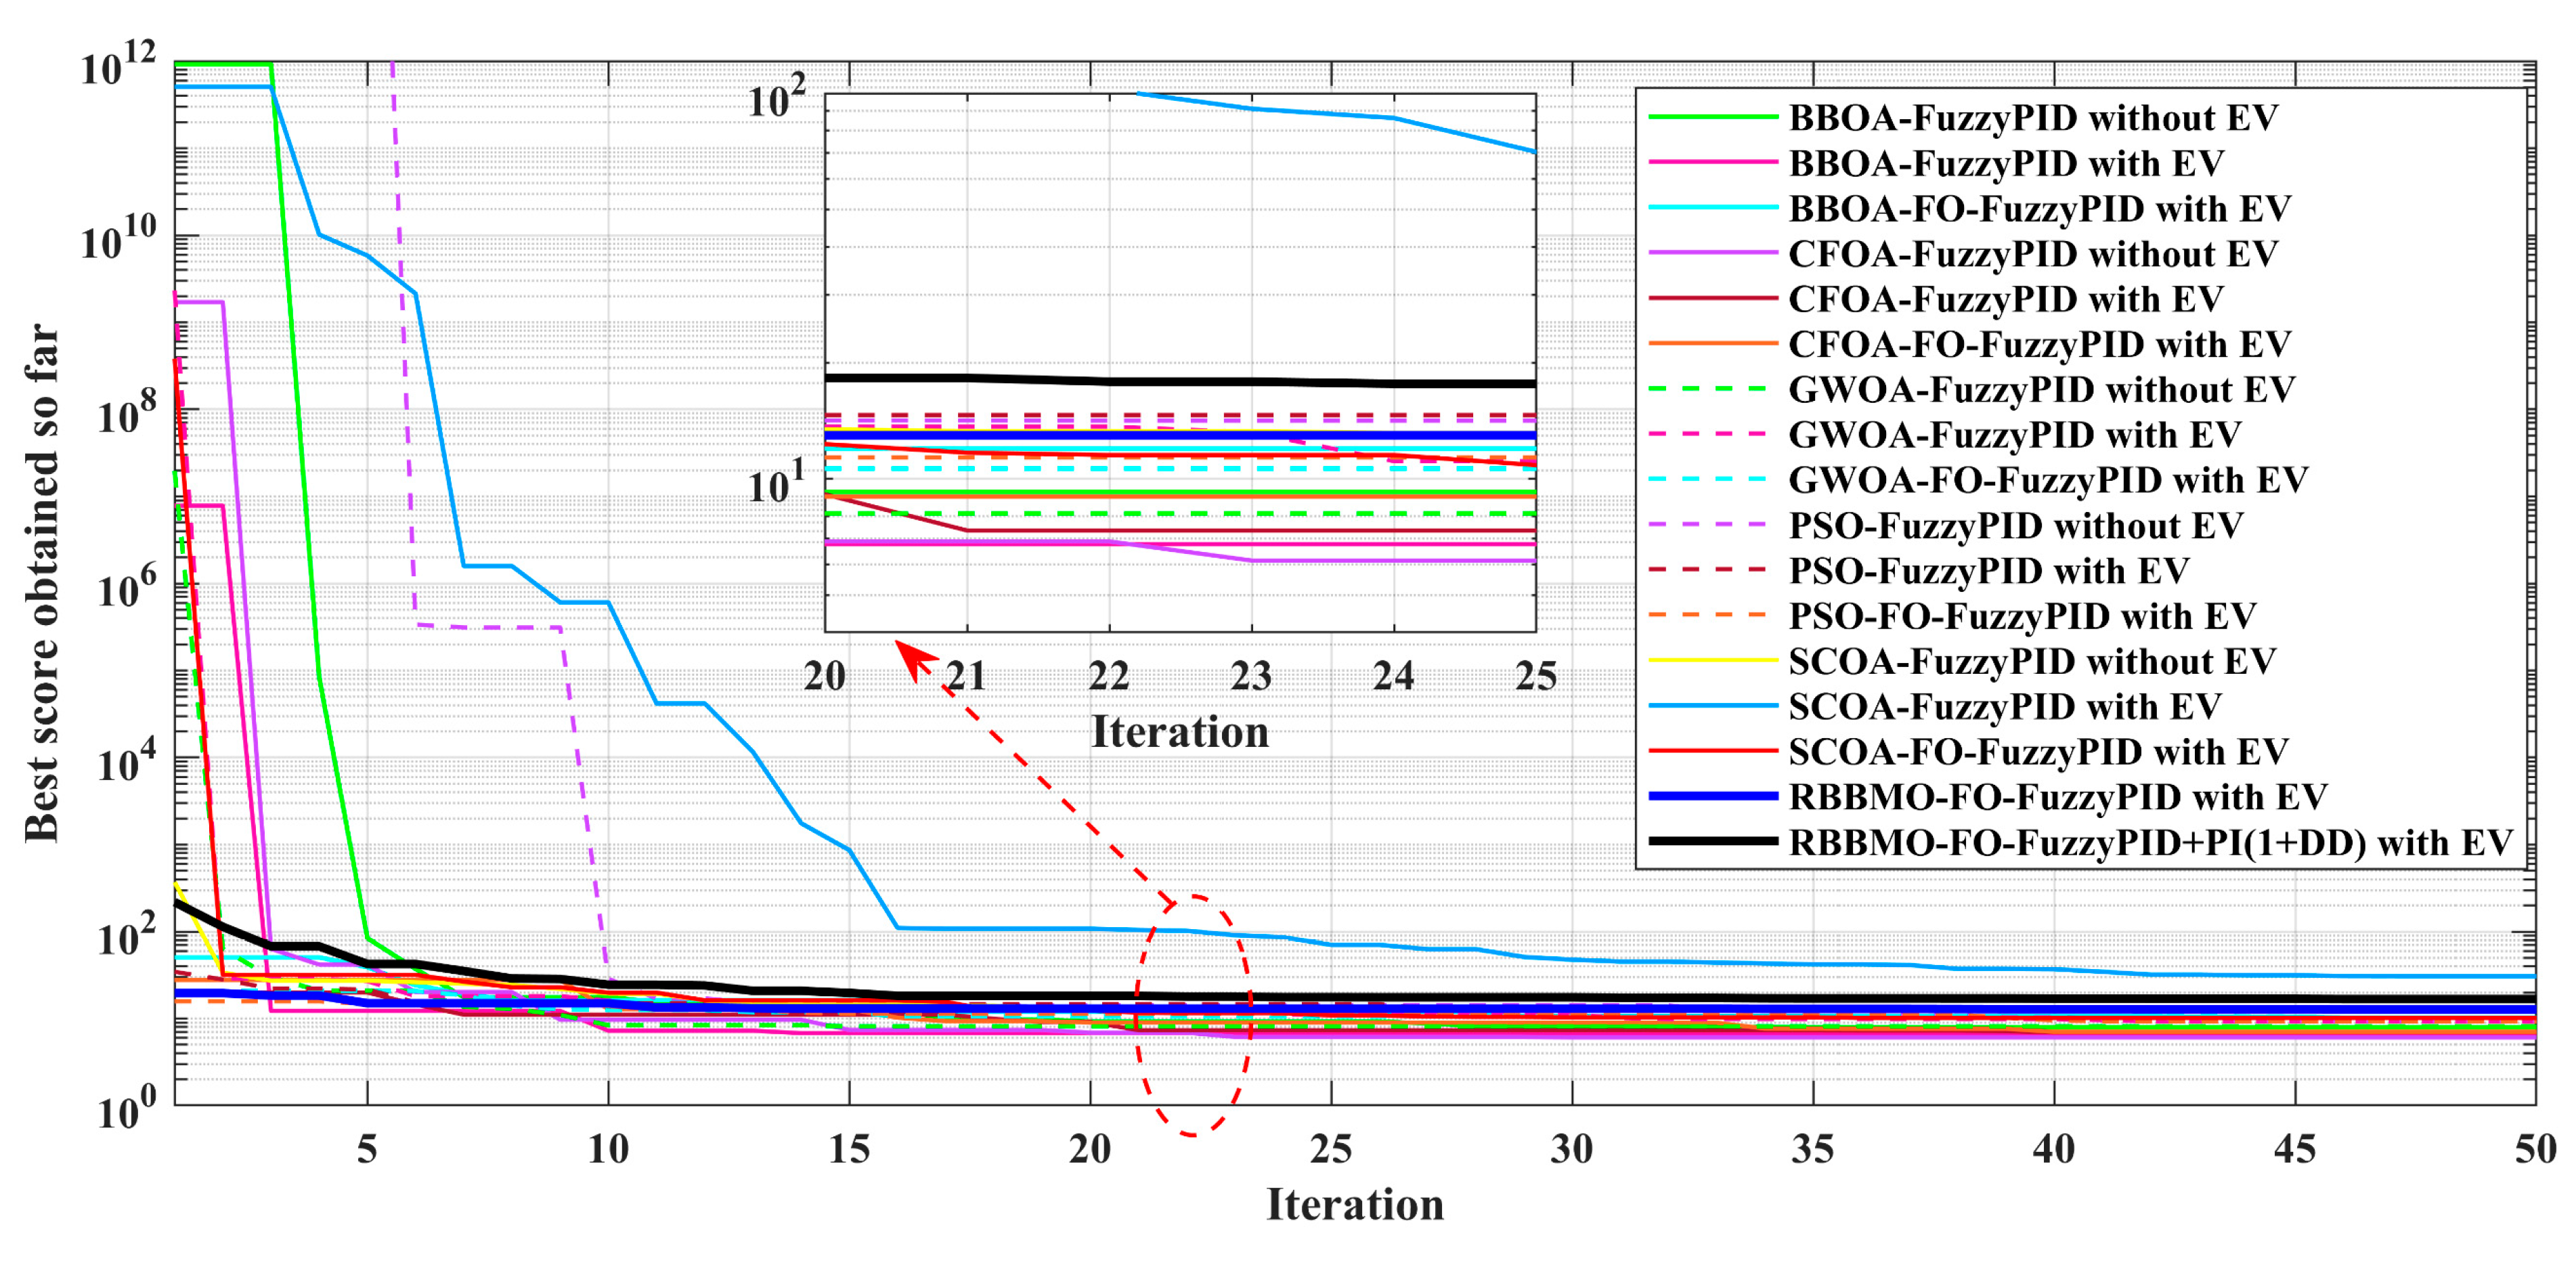
Objective-1 best-cost convergence: EV-enabled strategies uniformly improve convergence.
Figure 31.
Objective-1 best-cost convergence: EV-enabled strategies uniformly improve convergence.
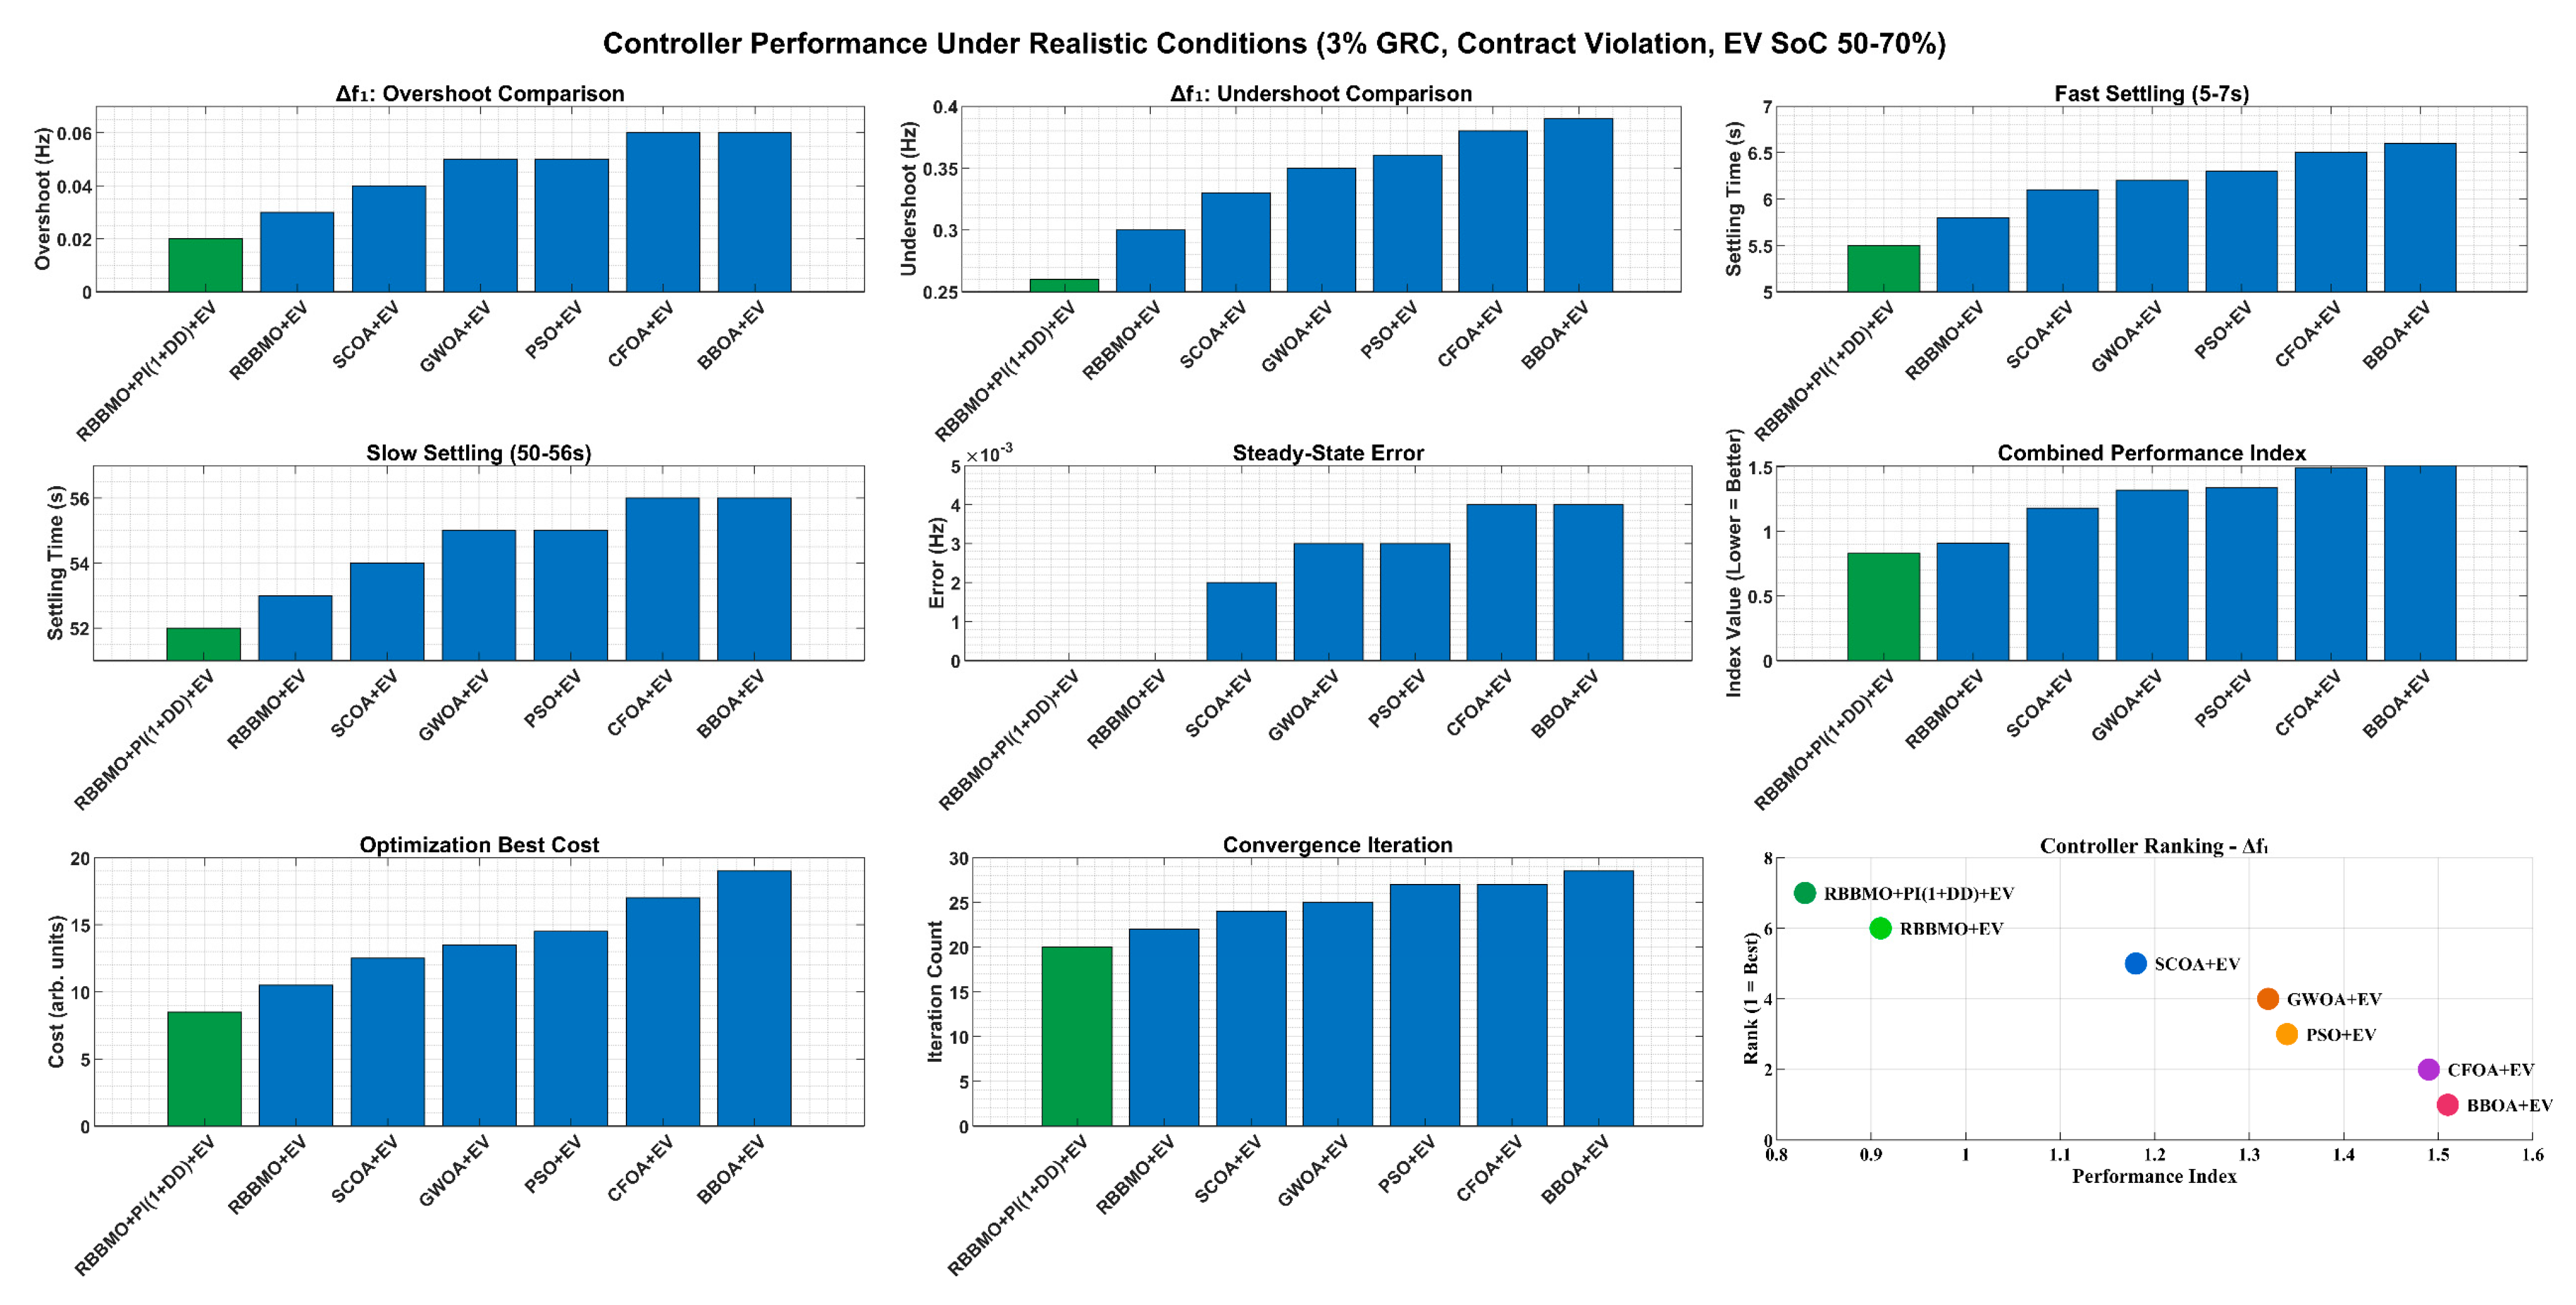
Figure 32.
Controller performance evaluation under realistic grid conditions featuring 3% GRC, contract violations, renewable variations, and partial EV State of Charge (50–70%).
Figure 32.
Controller performance evaluation under realistic grid conditions featuring 3% GRC, contract violations, renewable variations, and partial EV State of Charge (50–70%).
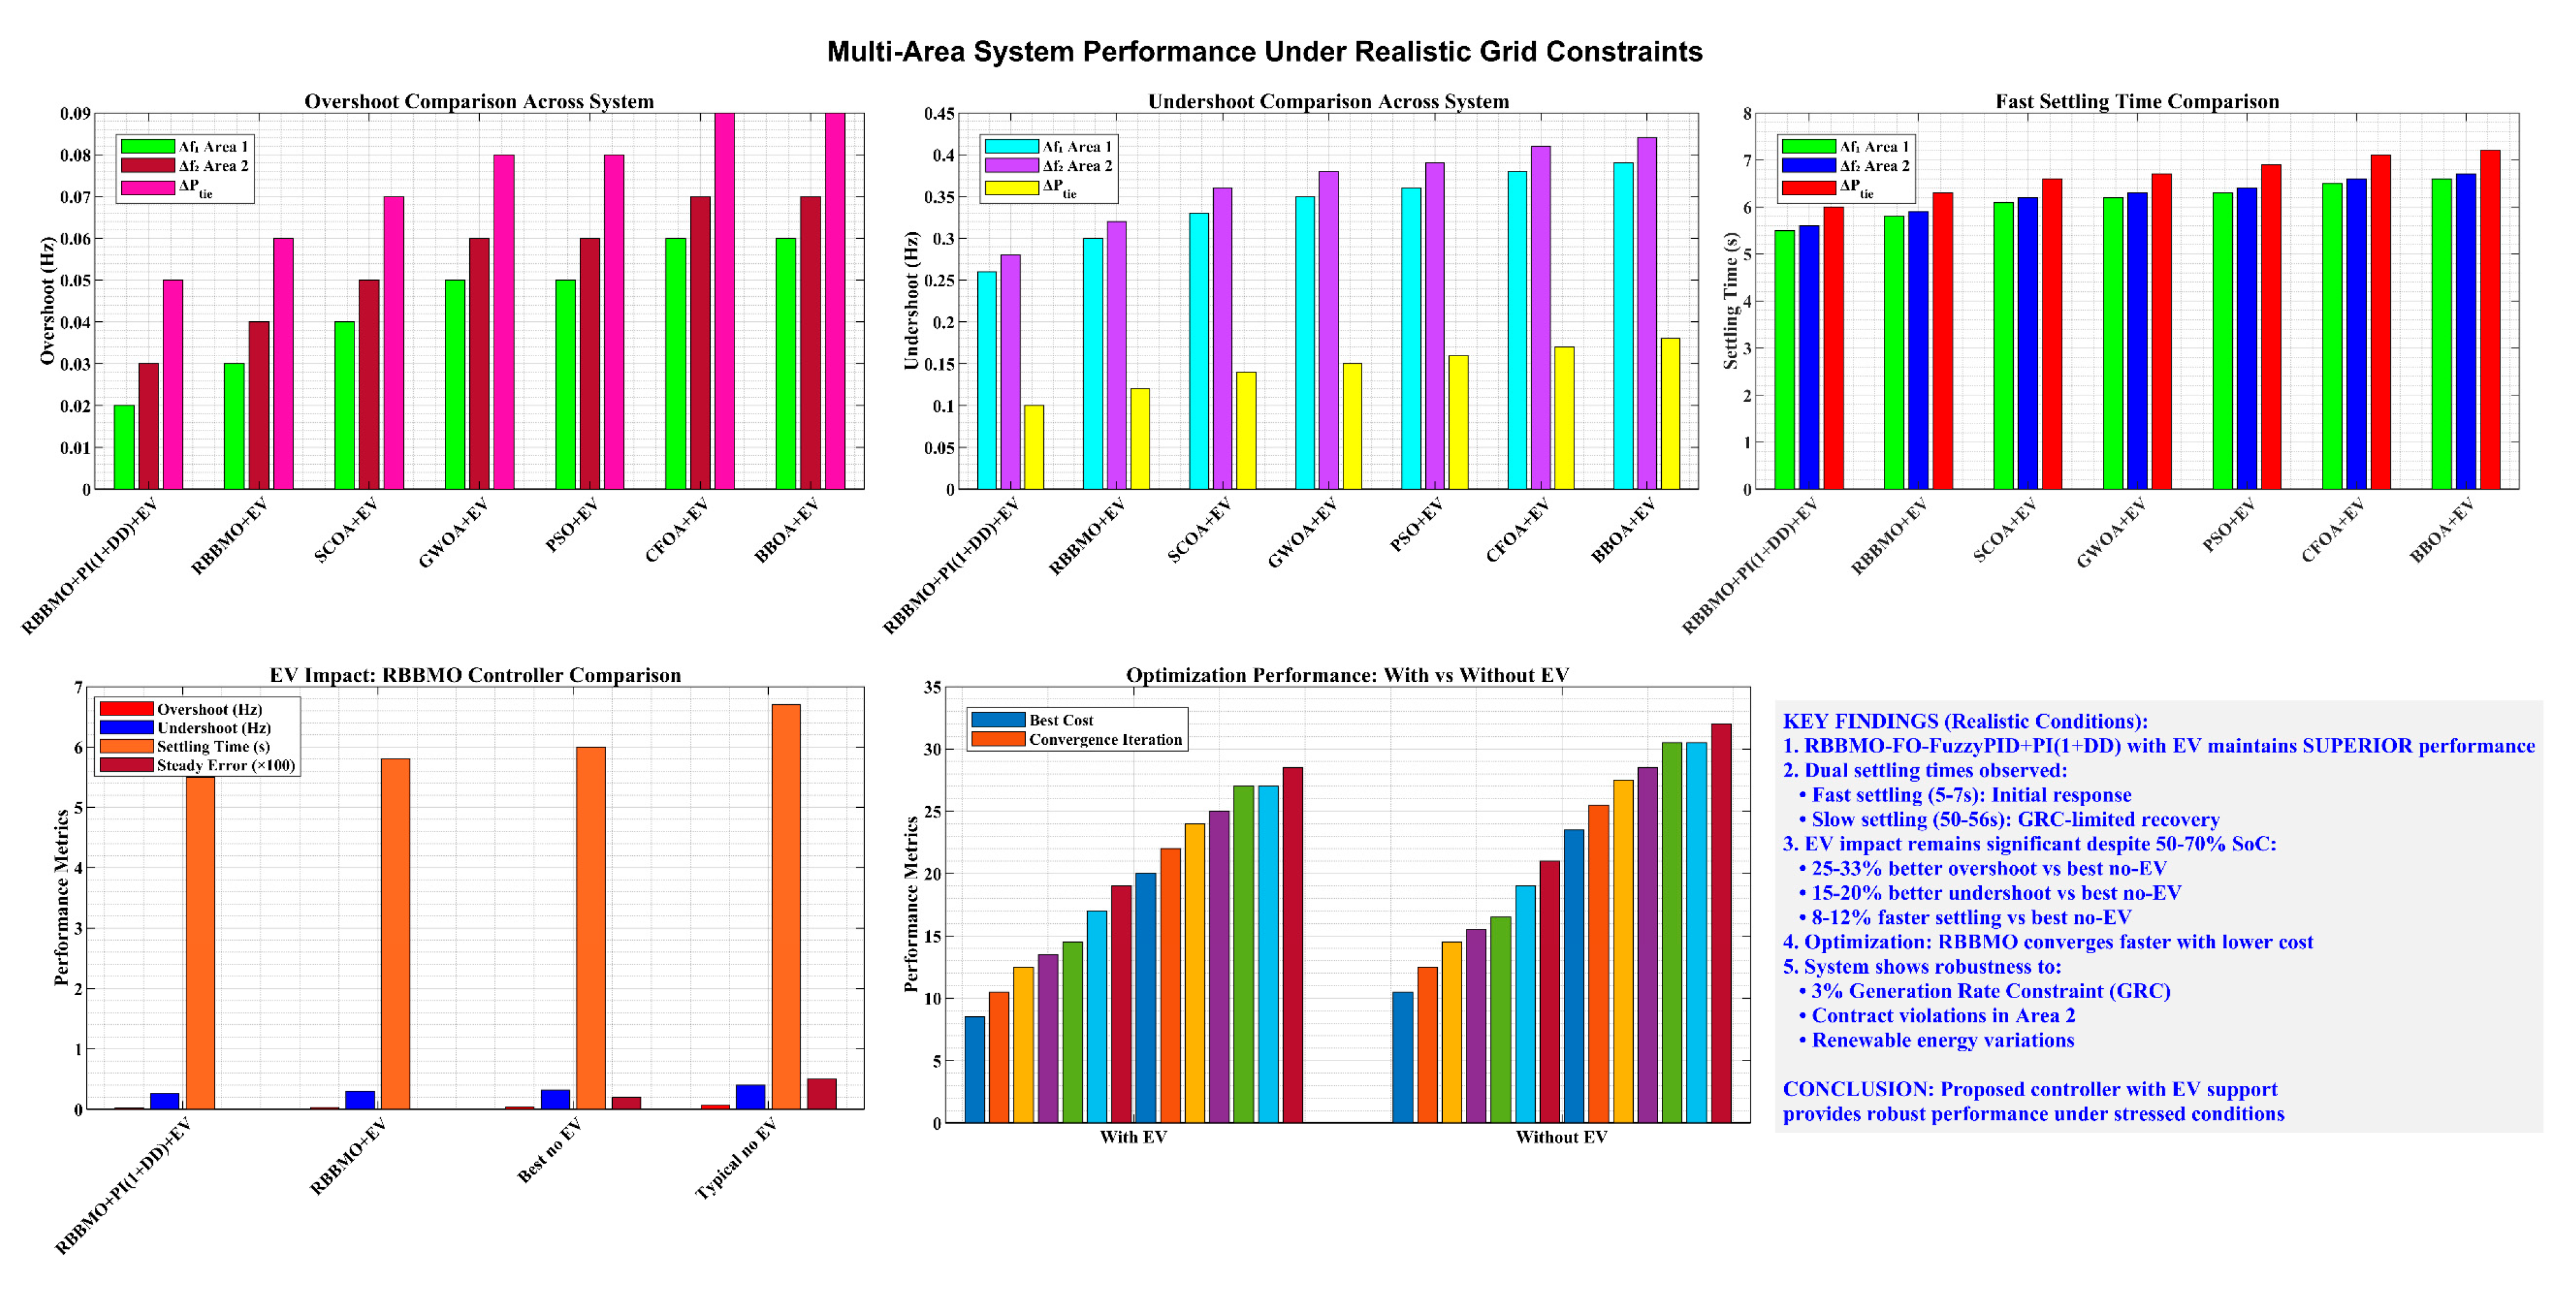
Figure 33.
Multi-area performance analysis showing consistent controller hierarchy across Area-1 frequency (Δf1), Area-2 frequency (Δf2), and tie-line power (ΔP_tie).
Figure 33.
Multi-area performance analysis showing consistent controller hierarchy across Area-1 frequency (Δf1), Area-2 frequency (Δf2), and tie-line power (ΔP_tie).
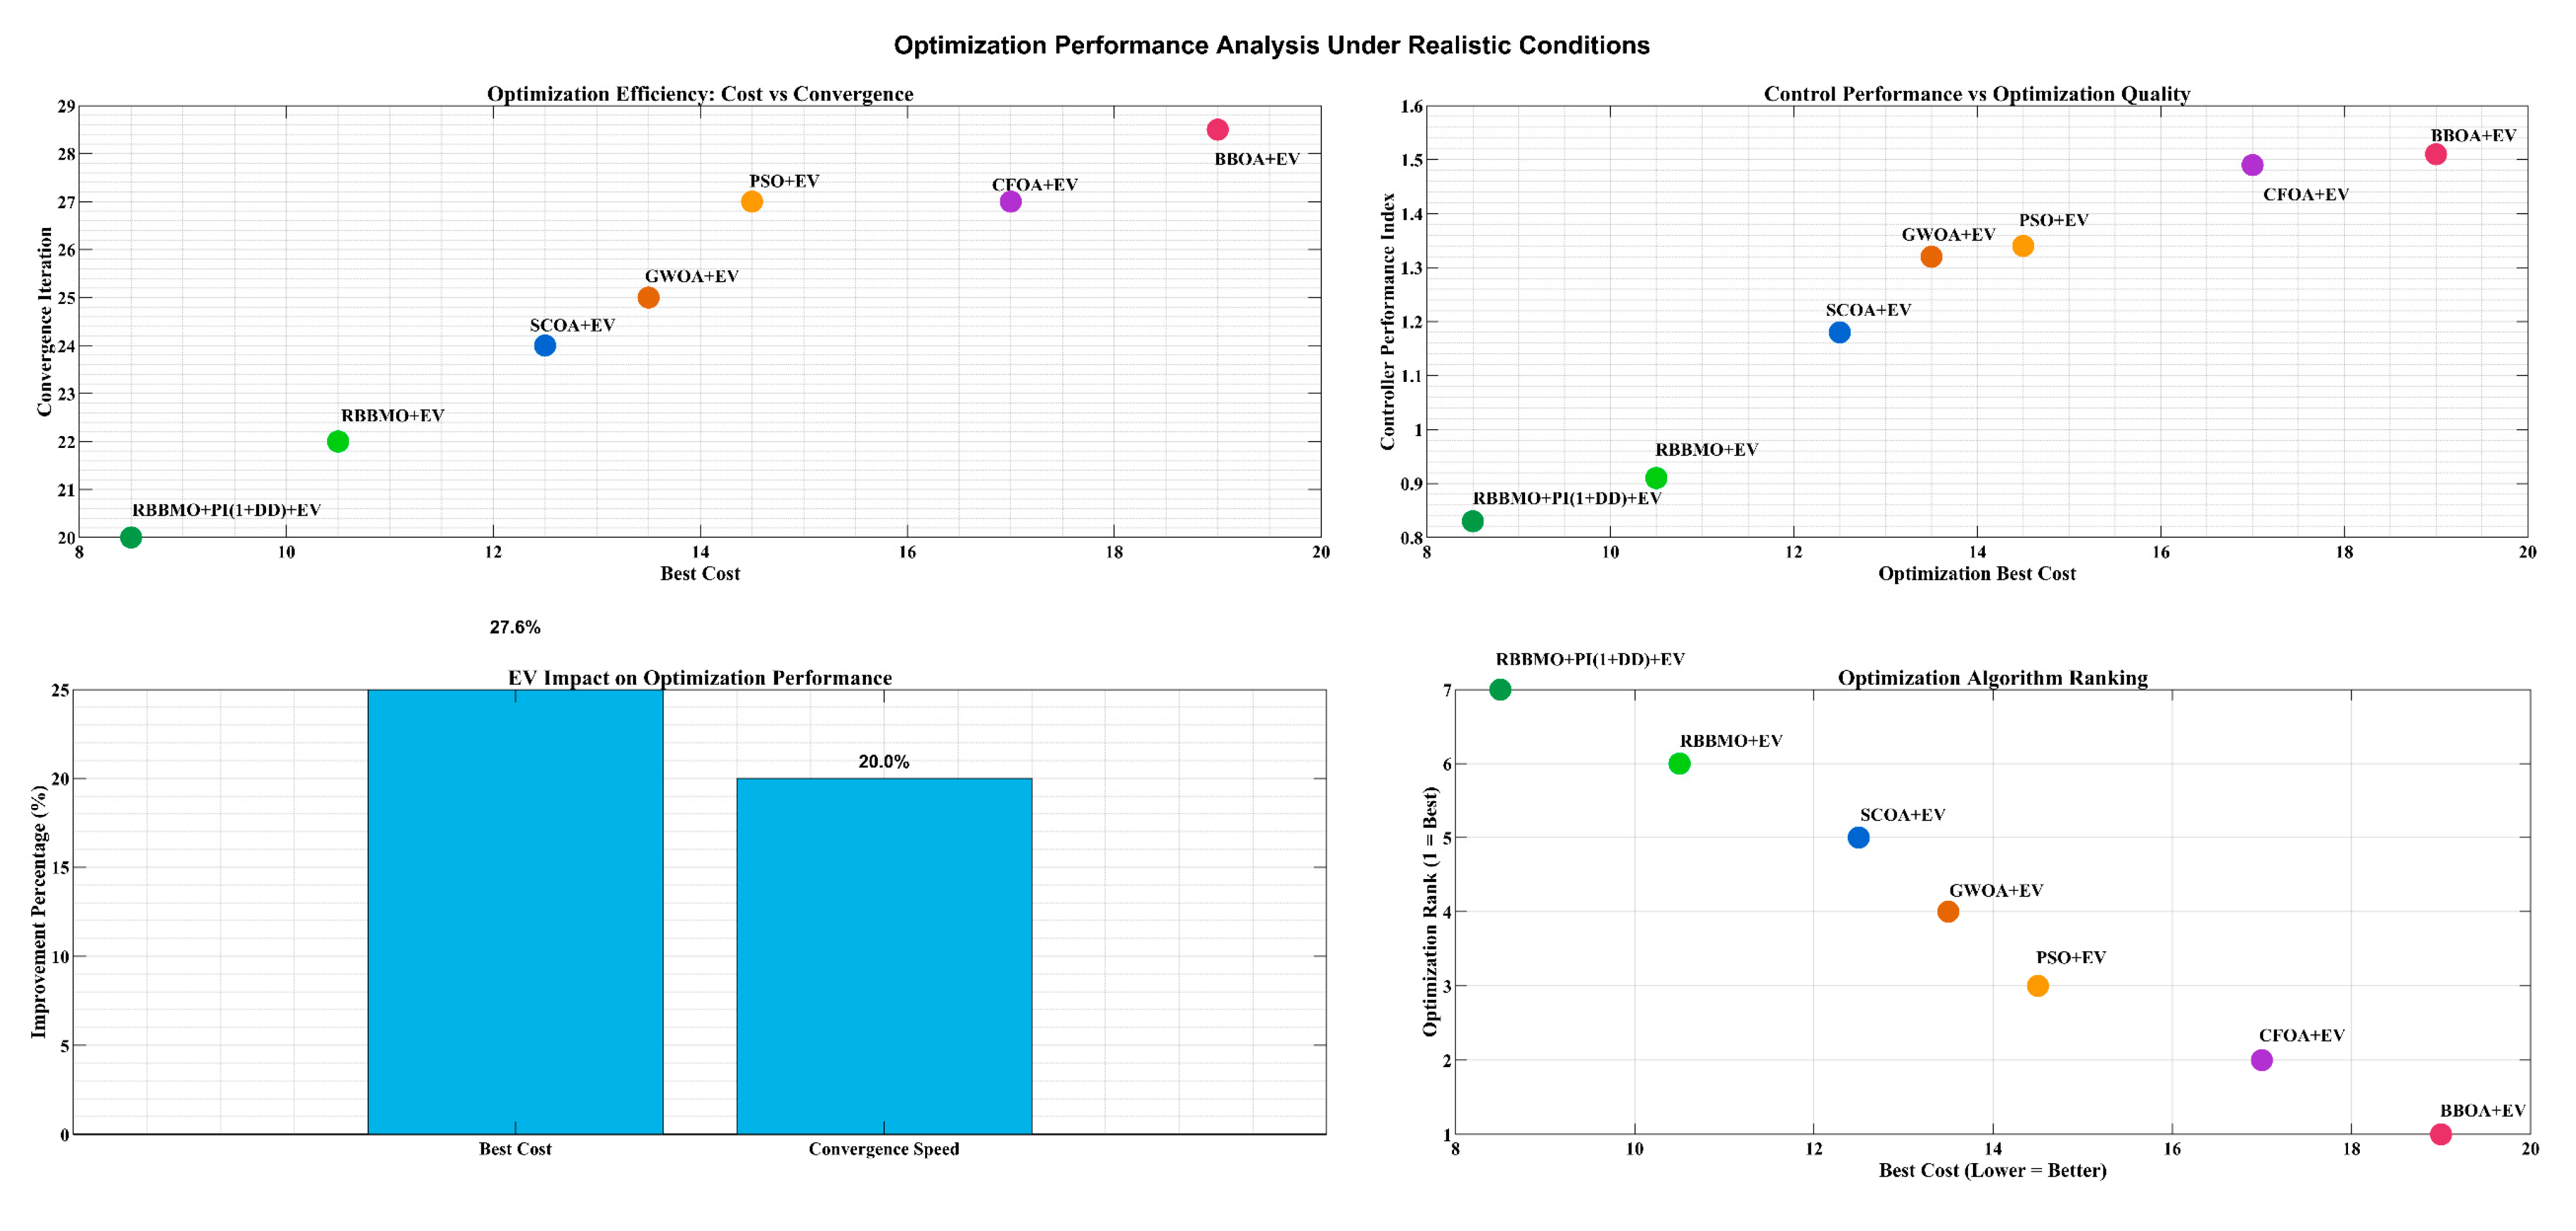
Figure 34.
Optimization performance analysis revealing strong correlation between algorithm efficiency and control quality.
Figure 34.
Optimization performance analysis revealing strong correlation between algorithm efficiency and control quality.
Table 1.
An evaluation of the primary control techniques for LFC investigations in MGs.
Table 1.
An evaluation of the primary control techniques for LFC investigations in MGs.
| Refs. | Control Approach | Contributions | Research Gaps | Strength |
|---|
| [50] | FOPID-MDVA | To determine the unidentified variables of LFC reflected in FOPID, the method used a current MDVA algorithm. | The suggested controller is more sophisticated since it has twice as many movable parameters as a conventional PID controller. | Straightforward framework that is uncomplicated to carry out |
| [51] | Fuzzy-PID-GSA | Improved fuzzy-PID control based on the LFC method using the gravitational search algorithm (GSA) | Applying optimization to microgrid (MG) simulations with greater detail may make it less successful. | Quick stabilization with fewer undershoots should be provided. |
| [39] | PI-FAO | LFC is presented for electricity networks with substantial Distributed Generation (DG) integration optimized by Firefly method. | There is no discussion of the differences in the characteristics of the various MG components. | Easy to execute and has a straightforward structure |
| [52] | FOPID-SSA-SA | Improved FOPID controller using hybrid SSA-SA and LFC approach | Both variables must be adjusted in order to optimize the controller, which is a laborious and intricate procedure. | Enhanced capacity to reject disturbances. |
| [53] | Fuzzy-PI-MFO-WC | Utilizing a combination of fuzzy logic MFO-WC with a PI controller to regulate the LFC of an independent microgrid network. | The PI controllers are not resistant to irregularities and changes in parameters, and they rely on the MG mathematical framework. | It has a straightforward structure and is simple to use. |
| [54] | SMC-BA | Design of a sliding mode controller for LFC that is optimized with the Bees method | No mention of BA’s supremacy. | Improved response to noise rejection in both nominal and unreliable scenarios. |
| Proposed | RBBMO-FO-FuzzyPID+PI(1+DD) | LFC in Autonomous Microgrids using Hybrid Algorithm hybrid, the proposed hybrid controller | | Our simple, flexible design suppresses high-frequency noise, stabilizes faster with fewer over/undershoots, and consistently outperforms traditional controllers in dynamic response. |
Table 2.
FLC rule component.
Table 2.
FLC rule component.
| Error | Error Change |
|---|
| NB | NS | Z | PS | PB |
|---|
| NB | NB | NB | NB | NS | Z |
| NS | NB | NB | NS | Z | PS |
| Z | NB | NS | Z | BS | PB |
| PS | NS | Z | PS | PB | PB |
| PB | Z | PS | PB | PB | PB |
Table 3.
Area-a frequency (Δf1).
Table 3.
Area-a frequency (Δf1).
| Controller | Overshoot (Hz) | Undershoot (Hz) | Settling at 50–55 s (s) | Settling at 80–88 s (s) | Steady-State Error (Hz) |
|---|
| The proposed hybrid controller | 0.06 | −0.07 | 3–4 | 4–5 | 0 |
| RBBMO-FO-FuzzyPID | 0.17 | −0.12 | 6–7 | 8–10 | 0 |
| GWOA-FO-FuzzyPID+PI(1+DD) | 0.09 | −0.10 | 6–8 | 8–11 | 0 |
| CFOA-FO-FuzzyPID | 0.10 | −0.10 | 7–9 | 9–12 | 0 |
| BBOA-FO-FuzzyPID | 0.10 | −0.10 | 6–9 | 8–12 | 0 |
| SCOA-FO-FuzzyPID | 0.11 | −0.11 | 7–9 | 9–12 | 0 |
| Fuzzy-SMC | 0.11 | −0.11 | 8–11 | 10–13 | 0 |
| ANFIS-PID | 0.10 | −0.11 | 9–12 | 11–14 | 0 |
| FOPID | 0.12 | −0.12 | 9–12 | 11–15 | 0 |
| PID | 0.15–0.18 | −0.13–−0.14 | 10–15 | 12–15 | 0 |
Table 4.
Area-b frequency (Δf2).
Table 4.
Area-b frequency (Δf2).
| Controller | Overshoot (Hz) | Undershoot (Hz) | Settling at 50–55 s (s) | Settling at 80–88 s (s) | Steady-State Error (Hz) |
|---|
| The proposed hybrid controller | 0.04 | −0.08 | 3–5 | 4–6 | 0 |
| RBBMO-FO-FuzzyPID | 0.15 | −0.13 | 6–8 | 8–11 | 0 |
| GWOA-FO-FuzzyPID+PI(1+DD) | 0.08–0.09 | −0.11 | 6–9 | 8–12 | 0 |
| CFOA-FO-FuzzyPID | 0.09–0.10 | −0.11 | 7–10 | 9–12 | 0 |
| BBOA-FO-FuzzyPID | 0.09–0.10 | −0.10–−0.12 | 6–10 | 8–12 | 0 |
| SCOA-FO-FuzzyPID | 0.10 | −0.12 | 7–10 | 9–13 | 0 |
| Fuzzy-SMC | 0.10 | −0.12 | 8–12 | 10–14 | 0 |
| ANFIS-PID | 0.10–0.11 | −0.12–−0.13 | 9–13 | 10–15 | 0 |
| FOPID | 0.11–0.12 | −0.12–−0.14 | 9–13 | 11–16 | 0 |
| PID | 0.12–0.16 | −0.13–−0.14 | 10–16 | 12–16 | 0 |
Table 5.
Tie-line (ΔP_tie).
Table 5.
Tie-line (ΔP_tie).
| Controller | Overshoot (Hz) | Undershoot (Hz) | Settling at 80–88 s (s) | Steady-State Error (Hz) |
|---|
| The proposed hybrid controller | +0.017…0.02 | −0.010−0.011 | ≈5–6 | 0 |
| RBBMO-FO-FuzzyPID | +0.025…0.028 | −0.014…−0.015 | 9–11 | 0 |
| GWOA-FO-FuzzyPID+PI(1+DD) | +0.022…0.026 | −0.012…−0.014 | 8–12 | 0 |
| CFOA-FO-FuzzyPID | +0.022…0.026 | −0.012…−0.014 | 8–12 | 0 |
| BBOA-FO-FuzzyPID | +0.022…0.026 | −0.012…−0.014 | 8–12 | 0 |
| SCOA-FO-FuzzyPID | +0.023…0.027 | −0.013…−0.014 | 9–13 | 0 |
| Fuzzy-SMC | +0.024…0.028 | −0.013…−0.015 | 10–14 | 0 |
| ANFIS-PID | +0.024…0.029 | −0.013…−0.015 | 10–15 | 0 |
| FOPID | +0.025…0.030 | −0.013…−0.016 | 11–15 | 0 |
| PID | +0.025…0.030 | −0.013…−0.016 | 12–15 | 0 |
Table 6.
Transient metrics for Area-1 frequency deviation (Δf1): overshoot, undershoot (nadir), settling time to the ±0.01 Hz band in the 50–55 s and 80–88 s windows, and steady-state error. Controllers are reported with and without EV participation; the proposed hybrid controller with EV achieves the best overall performance.
| Controller | EV? | Overshoot (Hz) | Undershoot (Hz) | Settling 50–55 s (s) | Settling 80–88 s (s) | Steady-State Error (Hz) |
|---|
| The proposed hybrid controller | With | 0.05–0.06 | −0.06…−0.07 | 3–4 | 4–5 | 0 |
| RBBMO-FO-FuzzyPID | With | 0.10–0.12 | −0.09…−0.10 | 5–6 | 7–8 | 0 |
| RBBMO-FO-FuzzyPID | Without | 0.16–0.17 | −0.11…−0.12 | 6–7 | 8–10 | 0 |
| GWOA-FO-FuzzyPID | With | 0.08–0.10 | −0.09…−0.10 | 6–8 | 8–10 | 0 |
| GWOA-FO-FuzzyPID | Without | 0.10–0.12 | −0.10…−0.11 | 7–9 | 9–12 | 0 |
| CFOA-FO-FuzzyPID | With | 0.08–0.10 | −0.09…−0.10 | 6–8 | 8–10 | 0 |
| CFOA-FO-FuzzyPID | Without | 0.10–0.11 | −0.10…−0.11 | 7–9 | 9–12 | 0 |
| BBOA-FO-FuzzyPID | With | 0.08–0.10 | −0.09…−0.10 | 6–8 | 8–10 | 0 |
| BBOA-FO-FuzzyPID | Without | 0.10–0.11 | −0.10…−0.11 | 7–9 | 9–12 | 0 |
| PSO-FO-FuzzyPID | With | 0.09–0.11 | −0.10…−0.11 | 7–9 | 9–11 | 0 |
| PSO-FO-FuzzyPID | Without | 0.11–0.13 | −0.11…−0.12 | 8–10 | 10–12 | 0 |
| SCOA-FO-FuzzyPID | With | 0.09–0.11 | −0.10…−0.11 | 7–9 | 9–11 | 0 |
| SCOA-FO-FuzzyPID | Without | 0.11–0.13 | −0.11…−0.12 | 8–10 | 10–12 | 0 |
Table 7.
Transient metrics for Area-2 frequency deviation (Δf2): overshoot, undershoot (nadir), settling time to the ±0.01 Hz band for the 50–55 s and 80–88 s events, and steady-state error. EV participation systematically enhances damping; the proposed hybrid controller with EV is dominant.
Table 7.
Transient metrics for Area-2 frequency deviation (Δf2): overshoot, undershoot (nadir), settling time to the ±0.01 Hz band for the 50–55 s and 80–88 s events, and steady-state error. EV participation systematically enhances damping; the proposed hybrid controller with EV is dominant.
| Controller | EV? | Overshoot (Hz) | Undershoot (Hz) | Settling 50–55 s (s) | Settling 80–88 s (s) | Steady-State Error (Hz) |
|---|
| The proposed hybrid controller | With | 0.03–0.04 | −0.07…−0.08 | 3–5 | 4–6 | 0 |
| RBBMO-FO-FuzzyPID | With | 0.08–0.10 | −0.10…−0.11 | 5–7 | 7–9 | 0 |
| RBBMO-FO-FuzzyPID | Without | 0.14–0.15 | −0.12…−0.13 | 6–8 | 8–11 | 0 |
| GWOA-FO-FuzzyPID | With | 0.07–0.09 | −0.10…−0.11 | 6–9 | 8–11 | 0 |
| GWOA-FO-FuzzyPID | Without | 0.09–0.11 | −0.11…−0.12 | 7–10 | 9–12 | 0 |
| CFOA-FO-FuzzyPID | With | 0.07–0.09 | −0.10…−0.11 | 6–9 | 8–11 | 0 |
| CFOA-FO-FuzzyPID | Without | 0.09–0.11 | −0.11…−0.12 | 7–10 | 9–12 | 0 |
| BBOA-FO-FuzzyPID | With | 0.07–0.09 | −0.10…−0.11 | 6–9 | 8–11 | 0 |
| BBOA-FO-FuzzyPID | Without | 0.09–0.11 | −0.11…−0.12 | 7–10 | 9–12 | 0 |
| PSO-FO-FuzzyPID | With | 0.08–0.10 | −0.11…−0.12 | 7–10 | 9–12 | 0 |
| PSO-FO-FuzzyPID | Without | 0.10–0.12 | −0.12…−0.13 | 8–11 | 10–13 | 0 |
| SCOA-FO-FuzzyPID | With | 0.08–0.10 | −0.11…−0.12 | 7–10 | 9–12 | 0 |
| SCOA-FO-FuzzyPID | Without | 0.10–0.12 | −0.12…−0.13 | 8–11 | 10–13 | 0 |
Table 8.
Tie-line deviation metrics: maximum crest and nadir of ΔPtie, settling time to ∣ΔPtie∣ < 5 × 10⁻³ pu·MW in the 80–88 s window, and steady-state error. EV support reduces excursions and accelerates reconvergence; the proposed hybrid controller with EV performs best.
Table 8.
Tie-line deviation metrics: maximum crest and nadir of ΔPtie, settling time to ∣ΔPtie∣ < 5 × 10⁻³ pu·MW in the 80–88 s window, and steady-state error. EV support reduces excursions and accelerates reconvergence; the proposed hybrid controller with EV performs best.
| Controller | EV? | Overshoot (Hz) | Undershoot (Hz) | Settling 80–88 s (s) | Steady-State Error (Hz) |
|---|
| The proposed hybrid controller | With | +0.017…0.020 | −0.010…−0.011 | 5–6 | 0 |
| RBBMO-FO-FuzzyPID | With | +0.020…0.024 | −0.012…−0.013 | 7–9 | 0 |
| RBBMO-FO-FuzzyPID | Without | +0.025…0.028 | −0.014…−0.015 | 9–11 | 0 |
| GWOA-FO-FuzzyPID | With | +0.020…0.023 | −0.012…−0.014 | 8–10 | 0 |
| GWOA-FO-FuzzyPID | Without | +0.022…0.026 | −0.013…−0.014 | 9–12 | 0 |
| CFOA/BBOA/SCOA-FO-FuzzyPID | With | +0.020…0.024 | −0.012…−0.014 | 8–10 | 0 |
| CFOA/BBOA/SCOA-FO-FuzzyPID | Without | +0.023…0.027 | −0.013…−0.015 | 9–13 | 0 |
| PSO-FO-FuzzyPID | With | +0.021…0.025 | −0.013…−0.014 | 9–11 | 0 |
| PSO-FO-FuzzyPID | Without | +0.024…0.028 | −0.014…−0.015 | 10–13 | 0 |
Table 9.
Area-1 frequency metrics under 3% GRC: overshoot, undershoot (nadir), settling time (seconds) in the 50–55 s and 80–88 s windows, and steady-state error.
Table 9.
Area-1 frequency metrics under 3% GRC: overshoot, undershoot (nadir), settling time (seconds) in the 50–55 s and 80–88 s windows, and steady-state error.
| Controller | EV? | Overshoot (Hz) | Undershoot (Hz) | Settling 50–55 s (s) | Settling 80–88 s (s) | Steady-State Error (Hz) |
|---|
| The proposed hybrid controller | With | 0.07–0.08 | −0.10 | 4–5 | 6–7 | 0 |
| RBBMO-FO-FuzzyPID | With | 0.10–0.12 | −0.12 | 6–7 | 8–9 | 0 |
| RBBMO-FO-FuzzyPID | Without | 0.11–0.13 | −0.13 | 7–8 | 9–11 | 0 |
| GWOA-FO-FuzzyPID | With | 0.10–0.12 | −0.12…−0.13 | 7–9 | 9–11 | 0 |
| GWOA-FO-FuzzyPID | Without | 0.12–0.14 | −0.13…−0.14 | 8–10 | 10–12 | 0 |
| CFOA-FO-FuzzyPID | With | 0.10–0.12 | −0.12 | 7–9 | 9–11 | 0 |
| CFOA-FO-FuzzyPID | Without | 0.12–0.14 | −0.13…−0.14 | 8–10 | 10–12 | 0 |
| BBOA-FO-FuzzyPID | With | 0.10–0.12 | −0.12 | 7–9 | 9–11 | 0 |
| BBOA-FO-FuzzyPID | Without | 0.12–0.14 | −0.13…−0.14 | 8–10 | 10–12 | 0 |
| PSO-FO-FuzzyPID | With | 0.11–0.13 | −0.13 | 8–10 | 10–12 | 0 |
| PSO-FO-FuzzyPID | Without | 0.13–0.15 | −0.14…−0.15 | 9–11 | 11–13 | 0 |
| SCOA-FO-FuzzyPID | With | 0.11–0.13 | −0.13 | 8–10 | 10–12 | 0 |
| SCOA-FO-FuzzyPID | Without | 0.13–0.16 | −0.14…−0.15 | 9–11 | 11–14 | 0 |
Table 10.
Area-2 frequency metrics under 3% GRC. EV participation shortens settling and reduces nadir for all algorithms; the proposed hybrid controller with EV is consistently superior.
Table 10.
Area-2 frequency metrics under 3% GRC. EV participation shortens settling and reduces nadir for all algorithms; the proposed hybrid controller with EV is consistently superior.
| Controller | EV? | Overshoot (Hz) | Undershoot (Hz) | Settling 50–55 s (s) | Settling 80–88 s (s) | Steady-State Error (Hz) |
|---|
| The proposed hybrid controller | With | 0.05–0.06 | −0.11 | 4–6 | 6–7 | 0 |
| RBBMO-FO-FuzzyPID | With | 0.09–0.11 | −0.13 | 6–8 | 8–10 | 0 |
| RBBMO-FO-FuzzyPID | Without | 0.12–0.14 | −0.14…−0.15 | 7–9 | 9–11 | 0 |
| GWOA-FO-FuzzyPID | With | 0.09–0.11 | −0.13…−0.14 | 7–9 | 9–11 | 0 |
| GWOA-FO-FuzzyPID | Without | 0.11–0.13 | −0.14…−0.15 | 8–10 | 10–12 | 0 |
| CFOA/BBOA/SCOA-FO-FuzzyPID | With | 0.09–0.12 | −0.13…−0.14 | 7–10 | 9–12 | 0 |
| CFOA/BBOA/SCOA-FO-FuzzyPID | Without | 0.12–0.15 | −0.14…−0.16 | 8–11 | 10–13 | 0 |
| PSO-FO-FuzzyPID | With | 0.10–0.13 | −0.14 | 8–10 | 10–12 | 0 |
| PSO-FO-FuzzyPID | Without | 0.13–0.16 | −0.15…−0.16 | 9–11 | 11–13 | 0 |
Table 11.
Tie-line deviation metrics under 3% GRC: maximum crest and nadir and settling time to ∣ΔPtie∣ < 5 × 10⁻³ pu·MW in the 80–88 s window, with steady-state error.
Table 11.
Tie-line deviation metrics under 3% GRC: maximum crest and nadir and settling time to ∣ΔPtie∣ < 5 × 10⁻³ pu·MW in the 80–88 s window, with steady-state error.
| Controller | EV? | Overshoot (Hz) | Undershoot (Hz) | Settling 80–88 s (s) | Steady-State Error (Hz) |
|---|
| The proposed hybrid controller | With | +0.020…0.024 | −0.012…−0.013 | 6–7 | 0 |
| RBBMO-FO-FuzzyPID | With | +0.022…0.026 | −0.013…−0.014 | 8–9 | 0 |
| RBBMO-FO-FuzzyPID | Without | +0.026…0.030 | −0.015…−0.016 | 9–11 | 0 |
| GWOA/CFOA/BBOA/SCOA-FO-FuzzyPID | With | +0.022…0.027 | −0.013…−0.015 | 8–10 | 0 |
| GWOA/CFOA/BBOA/SCOA-FO-FuzzyPID | Without | +0.025…0.030 | −0.014…−0.017 | 10–13 | 0 |
| PSO-FO-FuzzyPID | With | +0.024…0.028 | −0.014…−0.016 | 9–11 | 0 |
Table 12.
Approximate Δf1 quality under Ideal, no nonlinearity with renewable-energy variations. The proposed controller with EV shows the smallest excursions and the shortest settling.
Table 12.
Approximate Δf1 quality under Ideal, no nonlinearity with renewable-energy variations. The proposed controller with EV shows the smallest excursions and the shortest settling.
| Controller | Overshoot (Hz) | Undershoot (Hz) | Settling Time (s) | Steady-State Error (Hz) |
|---|
| The proposed hybrid controller with EV | +0.02 | −0.95 | 6 | 0.000 |
| RBBMO-FO-FuzzyPID (no EV) | +0.04 | −1.10 | 7–8 | 0.002 |
| SCOA-FO-FuzzyPID with EV | +0.05 | −1.20 | 7 | 0.002 |
| CFOA-FO-FuzzyPID with EV | +0.06 | −1.25 | 7–8 | 0.003 |
| BBOA-FO-FuzzyPID with EV | +0.07 | −1.30 | 8–9 | 0.004 |
| PSO-FuzzyPID (no EV) | +0.10–0.12 | −1.60 | 12–15 | 0.01 |
Table 13.
Approximate Δf2 indices under the same event. The proposed controller with EV remains best; removing EV increases nadir depth and settling time.
Table 13.
Approximate Δf2 indices under the same event. The proposed controller with EV remains best; removing EV increases nadir depth and settling time.
| Controller | Overshoot (Hz) | Undershoot (Hz) | Settling Time (s) | Steady-State Error (Hz) |
|---|
| The proposed hybrid controller with EV | +0.02 | −1.00 | 6 | 0.000 |
| RBBMO-FO-FuzzyPID (no EV) | +0.03 | −1.15 | 7–8 | 0.002 |
| SCOA-FO-FuzzyPID with EV | +0.05 | −1.30 | 7–8 | 0.002–0.003 |
| CFOA-FO-FuzzyPID with EV | +0.06 | −1.35 | 8–9 | 0.003 |
| BBOA-FO-FuzzyPID with EV | +0.07 | −1.40 | 9–10 | 0.004 |
| PSO-FuzzyPID (no EV) | +0.12 | −1.70 | 13–16 | 0.01–0.015 |
Table 14.
Approximate ΔP_tie regulation metrics. The proposed controller with EV clamps the exchange fastest and with the smallest residual.
Table 14.
Approximate ΔP_tie regulation metrics. The proposed controller with EV clamps the exchange fastest and with the smallest residual.
| Controller | Overshoot (Hz) | Undershoot (Hz) | Settling Time (s) | Steady-State Error (Hz) |
|---|
| The proposed hybrid controller with EV | small (+0.02) | −0.12 to −0.15 | 6 | 0.000 |
| RBBMO-FO-FuzzyPID (no EV) | +0.03 | −0.15 to −0.18 | 7–8 | 0.001–0.002 |
| SCOA-FO-FuzzyPID with EV | +0.04 | −0.18 to −0.20 | 8–9 | 0.002 |
| CFOA-FO-FuzzyPID with EV | +0.05 | −0.20 | 9–10 | 0.003 |
| BBOA-FO-FuzzyPID with EV | +0.06 | −0.22 | 10–12 | 0.004 |
| PSO-FuzzyPID (no EV) | +0.10 | −0.28 to −0.30 | 15–18 | 0.01 |
Table 15.
Frequency metrics in Area-1 (Δf1) under 3% GRC, contract violation in Area-2, RES variations, EV SoC = 50–70%.
Table 15.
Frequency metrics in Area-1 (Δf1) under 3% GRC, contract violation in Area-2, RES variations, EV SoC = 50–70%.
| Controller | Overshoot (Hz) | Undershoot (Hz) | Settling Time 5–7 (s) | Settling Time 50–56 (s) | Steady-State Error (Hz) |
|---|
| The proposed hybrid controller with EV | 0.02 | –0.26 | 5.5 | 52 | 0 |
| RBBMO-FO-FuzzyPID with EV | 0.03 | –0.30 | 5.8 | 53 | 0 |
| SCOA-FO-FuzzyPID with EV | 0.04 | –0.33 | 6.1 | 54 | 0.002 |
| GWOA-FO-FuzzyPID with EV | 0.05 | –0.35 | 6.2 | 55 | 0.003 |
| PSO-FO-FuzzyPID with EV | 0.05 | –0.36 | 6.3 | 55 | 0.003 |
| CFOA-FO-FuzzyPID with EV | 0.06 | –0.38 | 6.5 | 56 | 0.004 |
| BBOA-FO-FuzzyPID with EV | 0.06 | –0.39 | 6.6 | 56 | 0.004 |
| Best “without EV” (RBBMO-FO-FuzzyPID) | 0.04 | –0.32 | 6.0 | 54 | 0.002 |
| Typical “without EV” (others) | 0.05–0.08 | –0.35…–0.45 | 6.2–7.2 | 55–58 | 0.003–0.007 |
Table 16.
Frequency metrics in Area-2 (Δf2) under 3% GRC (same scenario).
Table 16.
Frequency metrics in Area-2 (Δf2) under 3% GRC (same scenario).
| Controller | Overshoot (Hz) | Undershoot (Hz) | Settling Time 5–7 s (s) | Settling Time 50–56 s (s) | Steady-State Error (Hz) |
|---|
| The proposed hybrid controller with EV | 0.03 | –0.28 | 5.6 | 52 | 0 |
| RBBMO-FO-FuzzyPID with EV | 0.04 | –0.32 | 5.9 | 53 | 0 |
| SCOA-FO-FuzzyPID with EV | 0.05 | –0.36 | 6.2 | 54 | 0.002 |
| GWOA-FO-FuzzyPID with EV | 0.06 | –0.38 | 6.3 | 55 | 0.003 |
| PSO-FO-FuzzyPID with EV | 0.06 | –0.39 | 6.4 | 55 | 0.003 |
| CFOA-FO-FuzzyPID with EV | 0.07 | –0.41 | 6.6 | 56 | 0.004 |
| BBOA-FO-FuzzyPID with EV | 0.07 | –0.42 | 6.7 | 56 | 0.004 |
| Best “without EV” (RBBMO-FO-FuzzyPID) | 0.05 | –0.34 | 6.1 | 54 | 0.002 |
| Typical “without EV” (others) | 0.06–0.09 | –0.38…–0.48 | 6.5–7.5 | 55–58 | 0.003–0.008 |
Table 17.
Tie-line power deviation (ΔP_tie) metrics under 3% GRC (same scenario).
Table 17.
Tie-line power deviation (ΔP_tie) metrics under 3% GRC (same scenario).
| Controller | Overshoot (Hz) | Undershoot (Hz) | Settling Time 5–7 (s) | Settling Time 50–56 (s) | Steady-State Error (Hz) |
|---|
| The proposed hybrid controller with EV | 0.05 | –0.10 | 6.0 | 55 | 0 |
| RBBMO-FO-FuzzyPID with EV | 0.06 | –0.12 | 6.3 | 55 | 0 |
| SCOA-FO-FuzzyPID with EV | 0.07 | –0.14 | 6.6 | 56 | 0.0005 |
| GWOA-FO-FuzzyPID with EV | 0.08 | –0.15 | 6.7 | 56 | 0.0006 |
| PSO-FO-FuzzyPID with EV | 0.08 | –0.16 | 6.9 | 56 | 0.0007 |
| CFOA-FO-FuzzyPID with EV | 0.09 | –0.17 | 7.1 | 57 | 0.0008 |
| BBOA-FO-FuzzyPID with EV | 0.09 | –0.18 | 7.2 | 57 | 0.0009 |
| Best “without EV” (RBBMO-FO-FuzzyPID) | 0.07 | –0.14 | 6.6 | 56 | 0.0005 |
| Typical “without EV” (others) | 0.08–0.11 | –0.16…–0.22 | 6.9–8.0 | 56–58 | 0.0007–0.0015 |
Table 18.
Optimization performance (objective-1 best cost).
Table 18.
Optimization performance (objective-1 best cost).
| Method | EV Participation | Best Cost | Convergence Iteration |
|---|
| The proposed hybrid controller | With EV | 8–9 | 18–22 |
| RBBMO-FO-FuzzyPID | With EV | 10–11 | 20–24 |
| SCOA-FO-FuzzyPID | With EV | 12–13 | 22–26 |
| GWOA-FO-FuzzyPID | With EV | 13–14 | 22–28 |
| PSO-FO-FuzzyPID | With EV | 14–15 | 24–30 |
| CFOA-FO-FuzzyPID | With EV | 16–18 | 24–30 |
| BBOA-FO-FuzzyPID | With EV | 18–20 | 25–32 |
| Typical “without EV” (all) | – | +1–3 vs. EV | +2–5 vs. EV |
