Abstract
In the process of decarbonizing electricity generation, renewable energy sources are actively being integrated into traditional power systems. As a result, the inertia of the energy system is reduced, and the speed of transition processes is accelerated. This can lead to instability under small disturbances. This necessitates changing traditional approaches to implementing algorithms for emergency control automation. The paper proposes a methodology to solve the problem of small-signal stability analysis in low-inertia energy systems. The task of the small-signal stability analysis problem is reduced to multi-class classification problems. The proposed methodology can be divided into two main parts: selecting the most informative input features and classifying control actions. The IEEE24 mathematical model of the power system serves as a data source. Measurements from this model are received via phasor measurement units. Among the feature selection algorithms considered, the Random Forest algorithm proved to be the most effective. In terms of efficiency in solving the control action selection problem, the LightGBM algorithm proved dominant. Its accuracy in noise-free data was 98%. With 20 dB of data noise, the algorithm’s accuracy decreased slightly: 97%. The algorithm’s time delay was only 0.07 ms.
Keywords:
power system; small signal stability; emergency control; machine learning; low inertia; renewable energy sources MSC:
68T01
1. Introduction
The operation of modern electric power systems (EPS) relies on the integrated use of automated and automatic control means aiming to ensure both reliability and economic efficiency. To synthesize control laws for normal and transitional processes in traditional EPSs, deterministic methods are employed. Their procedure includes solving differential-algebraic equation systems describing energy conversion and transient processes under fault [1]. These principles for selecting optimal control actions (CA) work effectively in traditional EPSs dominated by fossil fuel-based generators providing sufficient inertial components.
Small-signal stability (SSS) of EPS is the ability of a system to maintain stability under small disturbances. Typically, such phenomena do not lead to changes in the power system topology. Such disturbances include load fluctuations, minor generation changes, switching of small loads, etc. The SSS in traditional EPSs is achieved due to the presence of large rotating masses.
It is worth noting that in traditional EPSs the participation rate of power-electronics-based control devices, energy storage systems [2] and renewable energy sources (RES) is minimal [3,4].
However, in the decarbonization process of electricity generation, a transformation of traditional EPSs is currently taking place. It includes adoption of RES, power-electronic-based control devices, flexible alternating current transmission systems, and energy storage systems coupled with the decommissioning of fossil fuel plants. These changes lead to decreased inertial components and increased oscillatory behavior and transient process velocity. The stochastic nature of the electricity generation process is also amplified. The combination of these factors negatively affects the stability of the EPS to SSS. To solve this problem, deterministic approaches may not be effective due to the increased requirements for speed and additivity. Subsequently, enhancing the adaptivity and responsiveness of emergency control (EC) systems [5] capable of solving the CA problem in conditions of low inertia and faster transient processes is important [6].
Machine learning (ML) algorithms are one of the promising areas for improving adaptability and speed of action when solving the CA selection problem [7]. These algorithms are able to identify hidden correlations in previously accumulated data. The procedure for these algorithms involves training a model based on a set of datasets. The trained model does not require multiple operations, as in traditional EC algorithms. By using a set of decision rules, these algorithms provide high performance.
Supervisory control and data acquisition [8,9] or phasor data concentrator systems [10] are used as a source of data for training ML algorithms.
In terms of ML algorithm synthesis of the Emergency Control Law for EPS, it can be reduced to a multiclass classification problem with multidimensional feature spaces. In this formulation of the problem, the electrical regime parameters will be input features with CA selection as the target variable. The following types of CA can be applied as classes: load scheduling (LS) and generator tripping (GT). Both types of CA are aimed at maintaining stability along the dangerous power lines identified after the EP. To enhance responsiveness of data, the procedure of selecting highly informative features based on ML algorithms can be applied as well.
The purpose of this article is to develop a method for selecting CA for preserving SSS based on ML algorithms. In Section 2 the literature review is given. Section 3 describes the basis for the proposed methodology. Section 4 gives the description of performed numerical experiments and presents more suitable ML algorithms for selecting informative features and CA selection. Section 5 describes the problem of small-signal stability. In the Conclusion, final points and directions for future research are described.
2. Current State of the Problem
Currently, ML-based methods for solution of the SSS estimation and CA selection problem are receiving increasingly broader theoretical development [11,12,13,14,15,16,17,18,19,20,21,22,23,24,25,26,27,28]. The most common of them are methods operating in real time. In [11,12,13,14,15,16,17,18,19,20,21,22,23,24,25,26,27,28] the following ML-based SSS estimation and CA selection algorithms are used:
- eXtreme Gradient Boosting;
- Convolutional neural network;
- Graph neural network;
- K-nearest neighbors;
- Support vector machine;
- Naive Bayes classifier;
- Decision trees.
In [11] a methodology for assessing SSS and selecting CA based on the eXtreme Gradient Boosting is proposed. The problem is reduced to a classification problem. Further it will be denoted as M1. The following are used as input features: measurements of active and reactive powers of synchronous generators (SG), active and reactive loads of nodes, flows of active and reactive powers along the branches of the protected EPS model, the damping coefficient of oscillations of the electrical mode parameters. The CA selection was used as the target variable. The methodology was tested during a numerical experiment using the EPS IEEE39 model. To train the M1-based model, a dataset consisting of 6300 electrical modes was used. The dataset was generated using the method of randomly changing loads maintaining the state of the branches and SG of the calculation model. The average error of t M1 was 7.56%.
In [12] a method for real-time correction of the settings of power system stabilizer (PSS) devices using the classification of loss or preservation of SSS based on the CNN algorithm is applied. In the future the method will be denoted as M2. On the basis of the IEEE68 model the 30,000 transient processes were simulated. The resulting accuracy of M2 was 99.99%.
A method of the EPS SSS estimation was proposed in [13]. The base of the method in the CNN algorithm is laid out. The problem is reduced to a classification problem. Hereinafter, it will be referred to as M3. The instantaneous voltage signals in the nodes with SG were used as input data. The dataset generation consisting of 1805 transient process calculations using the IEEE9 model was performed. The classification accuracy of M3 is 99.00%. An average classification delay of M3 for one mode is 0.234 ms. The disadvantages of the study include insufficient testing volume due to the use of the simplest EPS model.
In [14] the EPS SSS estimation method using graph neural network algorithm is proposed. The method allows us to take into account the EPS topology and consider the influence of single outages on the SSS reserve. The problem is reduced to a regression problem. Further it will be considered as M4. The following are used as input features: EPS topology in the form of an adjacency matrix, amplitude and phase of voltages in the nodes, the active and reactive powers of the SG and loads in the EPS nodes. The frequency and damping ratio of oscillations of the signal are used as the target variables. For dataset generation the mathematical model of EPS IEEE39 is used. Based on this model 5250 modes using the method of randomly changing the loads in the EPS nodes with a simultaneous single outage of the SG are generated. The average error of M4 is 6%.
In [15], an artificial neural network with two hidden layers was used to perform EPS SSS estimation. Hereinafter, it will be referred to as M5. The imaginary and real parts of the eigenvalues of the IEEE14 mathematical model are used as input data. The total volume of the generated dataset was 20,000 modes. The authors compare the accuracy and time delay of M5 with KNN, SVM, NBC and DT methods. The M5 algorithm has the lowest computational delay.
The SSS EPS estimation using the convolutional neural network was used in [16]. The problem is reduced to the binary class classification problem. Further it will be denoted as M6. For training M6 the NESTA162 model was involved. The values of active and reactive power flows, as well as voltage levels in the nodes of the EPS mathematical model were used as input data. The safe/unsafe state is used as a target variable. The total volume of the dataset was 1,000,000 modes. When a dataset generating single outages of the electric network elements with a simultaneous change in loads and generations of the model nodes was considered, the following structure of M6 in [16] was applied: convolutional layer, max pooling layer, equalization layer, and the fully connected layer. The accuracy of M6 on the test sample is 98.54% with a delay of 86 ms.
In [17] a universal convolutional neural network-based technique for solving SSS EPS estimation and transient stability (TS) estimation problems is proposed. According to [17] the technique operates in real time. The same technique for TS estimation is proposed in [18]. The problem is reduced to the classification problem. Further the technique will be referred to as M7. The input data are the voltage measurements in the EPS nodes, the analysis of which is performed on a calculation window of 0.2 s. The IEEE39, IEEE50 and IEEE68 mathematical models were used to test the methodology. During the testing, the classification accuracy values from 98.4% to 100.0% were obtained. The authors point out the difficulty in overtraining the M7, and the accuracy values of 98.0% may indirectly indicate possible overtraining.
The SSS EPS estimation problem in [19] is solved by using a convolutional neural network. Further it will be denoted as M8. Dataset generation is performed based on mathematical modeling using the WSCC9 model. This algorithm was chosen based on the accuracy and time delay defined after comparison with an artificial neural network and support vector machine. As a result, an accuracy of 98.7% was obtained for M8.
Table 1 provides a comparison of the methods proposed in [11,12,13,14,15,16,17,18,19]. The sign «+» in columns 3 and 4 of Table 1 indicates the possibility of the method for solving SSS assessment and CA selection, respectively. From column 4 of Table 1 it follows that in the considered studies, insufficient elaboration of the problem of CA selection to ensure SSS is highlighted. Furthermore, in most studies, the selection of ML algorithms is performed based on expert assessment. Also, the problem of preliminary processing of the dataset to identify informative features is considered in a limited form in [11,12,13,14,15,16,17,18,19]. The solution to selecting the informative feature problem can be formulated as an objective function:
where AC and T are the accuracy and the time delay of CA selection, respectively, α1 and α2 are weighting coefficients reflecting the degree of importance of AC or T in solving the classification problem.

Table 1.
Comparative table of SSS estimation and CA selection methods.
Some of the fastest algorithms for selecting informative features belong to the group of determining statistical relationships based on calculating the correlation coefficient [20], Mahalanobis distance [21] and cause-and-effect analysis [22].
In [20] a methodology of EPS TS estimation based on the eXtreme Gradient Boosting algorithm is presented. Further it will be referred to as M9. This method considers the electrical network topology. To select informative features, the parameters of electrical mode with a correlation coefficient > 10% in relation to the class were used.
A method for solving the CA selection problem to perform EPS TS estimation based on the mixed-integer linear programming algorithm is proposed in [21]. To reduce the dimensionality of the problem, the Mahalanobis distance is used, which has the property of invariance to the scale of features. Hereinafter, it will be referred to as M10.
In [22] an algorithm for analyzing cause-and-effect relationships to determine informative features is used. Further it will be denoted as M11. Testing M11 is performed based on synthetic data obtained by using the IEEE68 mathematical model.
An alternative to the algorithms for selecting informative features based on M9-M11 can be the following: reducing the dimensionality of a multidimensional space based on the principal component analysis [23] and a diffusion map [24].
The authors of [23] proposed a technique for estimating EPS TS by using a probabilistic artificial neural network and selecting informative features using principal component analysis. Further it will be denoted as M12. In this technique a threshold value of 0.5% was chosen to select informative features. Testing M12 is performed using synthetic data obtained from the IEEE39 mathematical model.
The disadvantage of M12 is identifying linear dependencies of features in relation to a class. To overcome it, in [24] a nonlinear diffusion maps method for reducing the dimensionality of space is proposed. Hereinafter it will be referred to as M13. The use of dimensionality reduction algorithms allows classification in three-dimensional space of the synchronous generator number and two diffusion coordinates. In the generated three-dimensional space, a dividing surface can be determined with high accuracy, ensuring the classification of EPS TS.
For feature selection based on various ML algorithms, the following can be distinguished: the model-independent local interpretation algorithm [25], Random Forest (RF) [26], semi-supervised feature selection method [27] and mutual information calculation in combination with the binary particle swarm method [28]. These methods are used to solve the problem of synthesizing the EPS EC law and estimating TS.
The paper [25] proposed a method based on the eXtreme Gradient Boosting algorithm in combination with a method for selecting informative features based on the model-independent local interpretation algorithm. Further it will be denoted as M14. To test M14, IEEE39 models and a fragment of the North Carolina electrical grid were used.
The paper [26] applied an iterative principle of selecting informative features using the Random Forest algorithm. Hereinafter it will be denoted as M15.
To improve the adaptability of M15, a method for using labeled and unlabeled data is proposed in [27]. Further, it will be denoted as M16.
The study [28] presented a two-stage procedure for selecting informative features. In the first stage, the coefficients of mutual informativeness of the feature in relation to the class are calculated; in the second stage, the binary particle swarm method is applied. In the future, it will be referred to as M17. The numerical experiment of M17 was performed using the NPCC140 mathematical model.
The application of the methods M9–M17 for determining informative features allows us to identify the minimum necessary set of data that ensures the maximization of the objective function (1). The characteristics of these methods are presented in Table 2.
Table 2.
Analysis of the informative feature selection methods.
The studies considered in Table 2 are aimed at solving the problems of synthesizing the EPS EC law or evaluating the EPS TS [29] based on ML algorithms. For selecting informative feature algorithms based on the application of the theory of descriptive statistics, the following is true: low computational bottlenecks and high speed in case of absence of analyzing hidden and implicit relationships in the data. Using dimensionality reduction algorithms leads to a decrease in the speed of selecting informative features. Despite this, applying special ML algorithms for selecting features contributes to developing adaptive tools. As a result, the dimensionality reduction problem in the synthesis of the EPS EC law or evaluating the EPS TS, ensuring the necessary speed and considering the features and relationships of the parameters of the electrical mode of the protected EPS [30], can be solved.
To overcome the problems identified in [11,12,13,14,15,16,17,18,19,20,21,22,23,24,25,26,27,28], this paper proposes a universal method for selecting informative features and CA selection problem. The proposed method is designed for solving the SSS maintenance problem in the post-accident mode of operation of the RES [31]. The detailed description of the proposed method is given in the following section.
The scientific novelty of the method lies in the following provisions:
- A methodology allows to implement the formation of training data, data preparation, training and testing of ML algorithms for solving the EPS EC problem;
- A methodology for selecting informative features for selecting CA in order to ensure SSS in the post-accident operating mode of EPS with a reduced value of constant inertia due to a significant share of RES has been determined;
- A methodology for selecting optimal CA for maintaining SSS in the post-emergency EPS operating mode has been formulated;
- Analysis of computational delays [32] of CA selection for maintaining SSS in post-emergency EPS operation mode has been performed.
3. Methodology of Informative Feature Selection and CA Selection for EPS SSS Estimation
The methodology of selecting informative features and CA selection for maintaining SSS EPS is based on the sequential procedure expressed in processing and converting data. This procedure is shown in Figure 1. In more detail, the procedure of the proposed methodology shown in Figure 1 includes the following steps: data preparation; feature selection; cluster analysis; training models; evaluation of model classification.
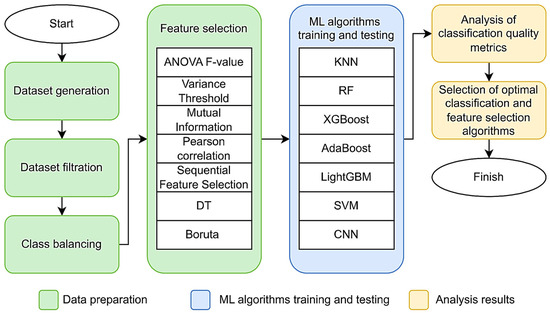
Figure 1.
The proposed method for selecting CA to ensure EPS SSS and feature selection.
Data preparation. A dataset describing EPS EC is used as the initial data. The dataset is obtained using deterministic algorithms of CA selection [33]. It contains a set of features and a class describing the place in EPS and the type of CA implementation. The following were used as input features in the dataset:
where P(G) and Q(G) are active and reactive powers of generating equipment, respectively; P(L) and Q(L) represent active and reactive powers of loads in EPS nodes, respectively; P(ij) and Q(ij) are flows of active and reactive powers from node i to node j, respectively; V and Vg are voltage modules and angles of EPS nodes; I(L) denotes current load of network equipment; ΔP(G) is the amount of active power imbalance.
The target variable vector Y contains seven classes, each corresponding to an element of the EPS. Their description is given in Section.
It is worth noting that the data from the model is read by using the PMUs, after forming a dataset filtered to remove gaps, noise and outliers in the original data. Specialized high-speed filters designed for processing data obtained from PMUs [34] can be used to solve this problem. To ensure data homogeneity, a class balancing procedure is used based on the synthetic minority oversampling technique algorithm [35].
Feature selection. The next stage of the methodology is the selection of informative features. As a rule, this stage is performed based on specialized algorithms [36]. To determine informative features to ensure maximization of the objective function (1) the set of algorithms proposed in [37,38,39,40,41,42,43] is used. The first of them, proposed in [37], is a well-known statistical ANOVA method:
where and n denote the number of groups and the total number of observations, respectively; and SSB and SSW denote sum of squares between and within, respectively.
The higher the F-value in expression (2), the more important the features of the group.
The next feature selection algorithm used in this paper is a Variance Threshold method [38] that can be represented as follows:
where xi and μ represent the value of the i-th element of the future and the mean of x; and m is the number of observations of the feature.
It is worth noting that the feature selection procedure based on (3) is performed by comparison the σ2 with a predefined threshold d. In this work the value of this threshold is d = 0 meaning that all features with σ2 = 0 will be excluded from the DATASET.
The third informative feature selection algorithm is a Mutual Information method [39]. Its essence lies in the relationship between the features and the target variable, and it can be represented as
where is Mutual Information; p(x, y) is the joint probability of x and y; p(x) and p(y) are the marginal probabilities of x and y, respectively.
MI(X, Y) = 0 means that the input feature is not correlated with the target variable.
The essence of the next algorithm is a Pearson correlation [40]:
where xi and —values of input features and their average; yi and —values of the target variable and their average.
The procedure of Sequential Feature Selection algorithms proposed in [41] includes the following methods: ANOVA, Variance Threshold, Recursive Feature Elimination with Random Forest and Least Absolute Shrinkage and Selection Operator. The first two are presented in expressions (2) and (3), respectively. The Recursive Feature Elimination method with Random Forest can be expressed as follows:
where Tj—the set of nodes in trees where feature j is used.
The Least Absolute Shrinkage (LAS) and Selection Operator method are expressed as follows:
where yi—the true value of the target variable for the i-th observation, y’i is the predicted value of the target variable for the i-th observation, βj is the coefficient corresponding to the j-th feature, and γ is the regularization parameter that controls the degree of reduction in the coefficients.
The informative future algorithm based on DT is reduced to the frequency of using an attribute to define objects in classes:
where is the objects’ numbers defined based on the i-th feature f; and Ntotal are the total object numbers.
The base of the Boruta feature selection method proposed in [43] is the Random Forest algorithm that is reduced to the following:
where is the importance score of the i-th feature f; is the Gini importance of the i-th feature f in the t-th tree of the Random Forest; and T is the total number of trees in the forest.
Thus, using the algorithms proposed in [37,38,39,40,41,42,43], which are based on Formulas (3)–(10), the most informative features from the DATASET are selected. Their brief description and computational load are presented in Table 3. In the last column of Table 3, the following notations are applied: n and p are the number of observations and features, respectively, k is the size of the future set, t is the number of trees, and O(…) is the Big-O notation operator [44].
Table 3.
Analysis of the used feature selection algorithms.
As can be seen from the last column of Table 3, the simple F-value ANOVA method has a linear complexity of O(n), which ensures fast preliminary removal of insignificant features. The Mutual Information and Pearson Correlation methods are characterized by a complexity of O(n·p), demonstrating efficiency in estimating linear and nonlinear relationships, but are limited by scalability on large datasets. The Sequential Feature Selection method has a moderate complexity of O(kp), depending on the number of iterations. Decision trees achieve a trade-off between accuracy and performance, having a complexity of O(n·p·log(p)). The Boruta algorithm, with a complexity of O(n·t), has a high potential for detecting significant features, but requires significant computational resources with a large number of iterations.
Cluster analysis. After completing the stage of selecting informative features, cluster analysis begins. This analysis is produced based on the t-distributed Stochastic Neighbor Embedding (t-SNE) algorithm [45]. The Mean Shift-based algorithm cluster analysis allows to determine the presence of concentrated areas of classes in the data and to identify the possibility of using classification algorithms. The choice of the Mean Shift [46] clustering algorithm is justified by its following abilities: automatic determination of the optimal number of clusters, robustness to the noise and anomalies in the data, and adaptivity to various forms of data distributions in the feature space. To evaluate the quality of the clustering result, the following metrics were used: Silhouette coefficient, Davies–Bouldin index, Calinski–Harabasz index, Adjusted Rand index, Homogeneity score and V-measure score [47].
Training models. After the cluster analysis stage, the procedure of training ML algorithms used for CA classification begins. The choice of ML algorithms is justified by a combination of factors: accuracy; computational complexity; and adaptability.
The list of selected ML algorithms used in this study is presented in Table 4. In the last column of Table 4, the following symbols are used: m is the number of samples; d and p are feature dimensionality and the number of features, respectively, N is the size of the training dataset; M is the number of trees; and i is the number of iterations.
Table 4.
Analysis of the used ML algorithms.
A1. The K-nearest neighbors algorithm is easy to implement and widely universal, but its performance significantly deteriorates as the volume and dimensionality of data grow.
A2. The Random Forest algorithm is characterized by stability and reliability, allowing it to effectively process heterogeneous features.
A3. The eXtreme Gradient Boosting algorithm helps improve classification accuracy by regularly growing weak models, but an increase in the number of iterations and the depth of the trees leads to an increase in computational complexity.
A4. AdaBoost is aimed at improving base classifiers, focusing on poorly classified instances, but its performance significantly depends on the quality of the initial models.
A5. Light Gradient-Boosting Machine implements an optimized tree construction procedure, achieving greater efficiency compared to the traditional Random Forest.
A6. Support vector machine aims to maximize the inter-class distance by finding the optimal separating hyperplane. The level of computational complexity of the algorithm increases up to the cubic order with an increase in the number of instances and the choice of special kernel functions. In addition to this, the efficiency of the algorithm is inversely proportional to the growth of the dataset size.
A7. Neural networks with convolutional architectures are the most suitable algorithm for analyzing spatial structures characteristic of visual data, but their use is accompanied by high demands on computational resources.
Since the control action selection problem is reduced to multi-class classification problems, the training result of the machine learning algorithms A1–A7 is , where is the feature space of dimension j; and and are the sets of input features and class labels, respectively. In this paper, the number of class labels was set to K = 7.
Evaluation of model classification. After the procedure of training models, the classification evaluation metrics [55] are calculated: accuracy, precision, recall, F1 and the time delay of classification execution CA. Calculating the value of the objective function (1), the procedure for constructing the variation matrix can be performed, in which the classification algorithms are located on the abscissa axis, and the feature selection algorithms are located on the ordinate axis, and the values of the function (1) are in the variation matrix cells. The best combination of the classification algorithm and the feature selection algorithm gives the maximum value of the function (1).
Figure 2 shows a conceptual illustration of the algorithm variation matrix. It allows us to clearly demonstrate the change in the objective function (1) depending on the selected classification algorithm and feature selection. The values in Figure 2 are indicated without reference to the specific data used in this study. Once the optimal feature selection and CA classification algorithms have been determined, they can be integrated into the existing EPS EC system structure.
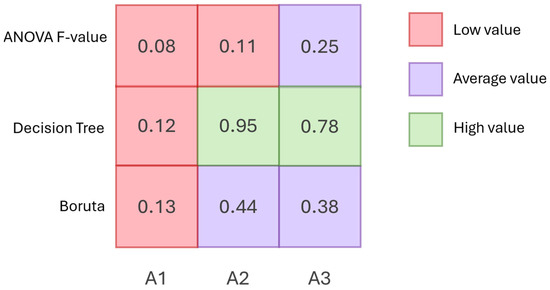
Figure 2.
A simplified example of an algorithm variation matrix.
4. Case Study
For the numerical experiment, a modified mathematical model of EPS IEEE24 [56] was used. This model is shown in Figure 3. As can be seen from this figure, in addition to the traditional synchronous generators (SG), the model includes wind generators (WG). To simulate the power change in WG, the output power graphs from work [56] were used.
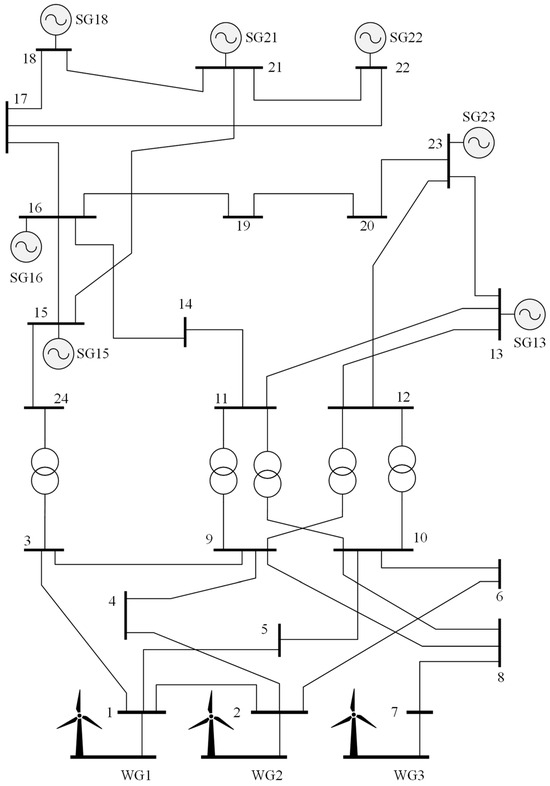
Figure 3.
Modified IEEE24 mathematical model.
Table 5 presents the parameters of node loads. In this table the following designations are applied: P and Q are active and reactive power of loads, respectively; Vmax, and Vmin are maximum and minimum loads voltage, respectively; and LS is a sign of participation in EPS EC due to the implementation of the CA of the load scheduling type.
Table 5.
Parameters of IEEE24 model nodes.
It is worth noting that in the EPS model shown in Figure 3, bus numbers 3, 7 and 8, 10–12, 14 and 17 have no load. Subsequently, they are absent from Table 5.
Table 6 presents the parameters of synchronous generators (SG) of the EPS model shown in Figure 3. The following designations are used in this table: Pref., Pmax and Pmin are rated, maximum and minimum active power of the SG, respectively; Qmax and Qmin are the maximum and minimum reactive power of the SG, respectively; and GT is a sign of participation in EPS EC due to the implementation of the CA of the generator tripping type.
Table 6.
SG and WG parameters.
The dataset was formed using the procedure described in the study [57]. The load values were varied by adding a random variable in 20% which had normal distribution relative to the reference values of the base nodes listed in Table 5. According to these changes the load of generators was corrected simultaneously. It is required to maintain active and reactive power balance in EPS. The procedure of changing EPS power flow was automated.
The modified algorithm presented in the study [33] was used as a deterministic algorithm for selecting CA to ensure EPS SSS. As a result, the dataset with 3500 electrical modes was obtained. Then it was divided into training and testing parts in a ratio of 80/20. The class number of the dataset and the description of the classes are given in Table 7.
Table 7.
Description of CA classes.
Figure 4 shows the distribution graphs of the normalized values of seven features of the dataset, for the designation of which the following notations are used: F1—active power flow between nodes 14 and 11, F2—active power flow between nodes 19 and 20, F3—active power flow between nodes 5 and 10, F4—reactive power flow between nodes 12 and 23, F5—reactive power flow between nodes 21 and 15, F6—reactive power flow between nodes 19 and 16, and F7—reactive power flow between nodes 12 and 10.
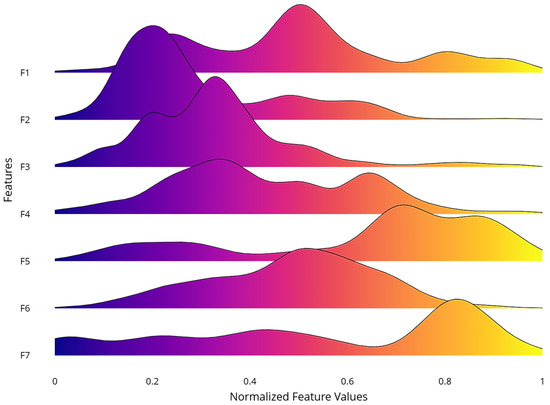
Figure 4.
Distributions of normalized features of the formed synthetic data sample.
To visualize the generated synthetic dataset in three-dimensional space, the t-SNE [58] algorithm was used, the results of which are shown in Figure 5.
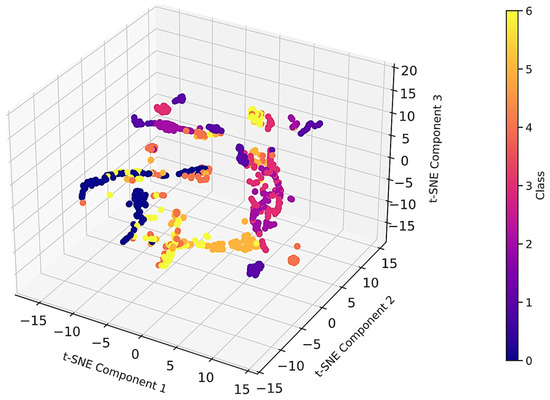
Figure 5.
Image of a data sample in three-dimensional space of t-SNE components.
The analysis of the possibility of using classification algorithms was performed using the calculation of data clustering quality metrics through the use of the Mean Shift [59] algorithm. Table 8 shows the results of calculating the clustering quality metrics.
Table 8.
Classification of quality metrics.
Clustering quality metrics demonstrate a moderate level of quality of applying the Mean Shift algorithm to the dataset used. The Silhouette coefficient indicates weak internal separation of objects within clusters, while the Davies–Bouldin index, remaining below one, confirms the presence of noticeable space for improving the clarity of boundaries between clusters. The Calinski–Harabasz index has a large positive value, indicating a relatively good ratio of internal cohesion and external separability. The Adjusted Rand index Homogeneity score and V-measure score confirm the partial correlation of the formed clusters with the reference classes.
To obtain the optimal hyperparameters of the ML algorithms used, the grid search algorithm [60] was applied. The optimal hyperparameters of the algorithms are given in Table 9.
Table 9.
Results of determining ML algorithm hyperparameter values.
For the CNN algorithm, the input data was transformed into a matrix form. Figure 6 shows this transformed CNN input data. The following structure was used for the CNN: input layer, hidden layers (convolutional layer, pooling layer, convolutional layer, pooling layer, and alignment), and output layer.
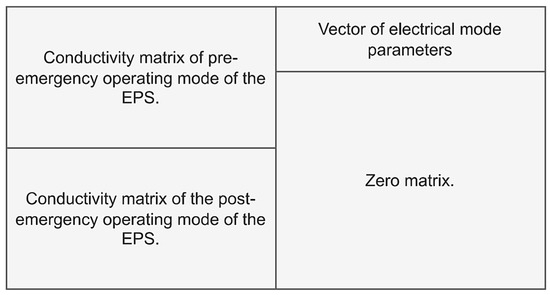
Figure 6.
Representation of input data as an image for the CNN algorithm.
Table 10 presents the parameters of informative future algorithms. In Table 10, the following parameter notations are used: k is the number of selected features, d is the dispersion threshold, n_neighbors is the number of neighbors of the KNN algorithm, max_depth is the maximum depth of the decision tree, and n_estimators is the number of trees in the Random Forest.
Table 10.
Parameters of feature selection algorithms used.
Figure 7, Figure 8 and Figure 9 show the results of evaluating the accuracy, computational delay and objective function (1) for the considered feature selection algorithms and classification algorithms.
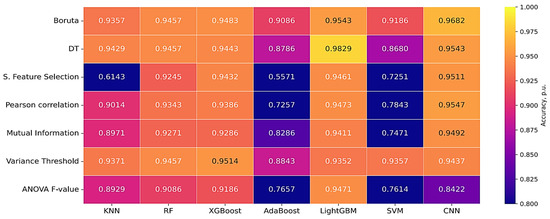
Figure 7.
Results of classification accuracy assessment.
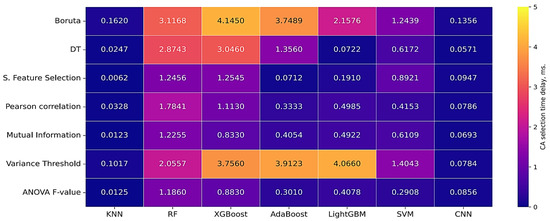
Figure 8.
Results of evaluation of computational delay of classification algorithms.
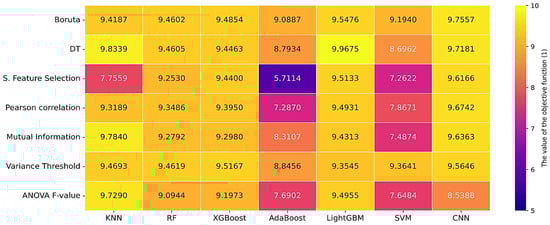
Figure 9.
Results of calculating the values of the objective function (1).
To calculate the objective function (1), the following values of the weighting coefficients were used: α1 = 10 and α2 = 0.01. Based on the analysis of the obtained values of accuracy, computational delay and the value of the objective function (1), the optimal algorithms for selecting CA in order to ensure EPS SSS are LightGBM and DT.
To demonstrate the results of training the LightGBM algorithm using the informative features determined by the DT algorithm in the used IEEE24 model, EP was simulated with the disconnection of line 14–11, leading to the violation of EPS SSS; then, CA were selected that ensure the preservation of EPS SSS (CA class 4).
Figure 10 shows the analysis of the eigenvalues of the Jacobian matrix [61], a positive value of the real part of the eigenvalue indicates non-storage of EPS SSS. The implementation of CA leads to a negative value of the eigenvalue and preservation of EPS SSS.
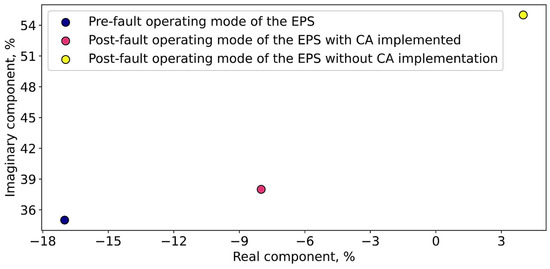
Figure 10.
Change in the eigenvalues of the Jacobian matrix taking into account the implementation of CA according to the criterion of ensuring EPS.
The sensitivity to noise in the source data for the LightGBM classification algorithm and the DT feature selection algorithm was assessed. For this, a series of calculations with the addition of a noise level of 0 to 20 dB to the source data was used. The results of changing the classification accuracy in noise conditions in the source data are shown in Table 11. The last column of Table 11 indicates the difference between algorithm accuracy obtained in conditions of a clean, noise-free signal and accuracies obtained in noisy signal conditions.
Table 11.
CA classification results when adding noise to informative features.
As can be seen from the last column of Table 11, the presence of notice in the source data has minor negative effects. Adding noise to the original data in 20 dB results in an insignificant decrease in accuracy by 0.0118 p.u. Thus, LightGBM algorithm is the robustness to noise in the original data.
5. Discussion
SSS is a phenomenon in which small disturbances lead to loss of EPS stability. When an EP occurs, accompanied by the disconnection of generating or grid equipment, the maximum value of active power transmitted through the elements of the electric grid is reduced. To ensure SSS in post-emergency mode, CAs are used to minimize the flow of active power through the elements of the electric grid. The traditional method for selecting optimal CAs that ensure minimal load and generation shedding is the use of deterministic optimization algorithms. The disadvantage of this class of algorithms is their high computational complexity and the inability to consider the entire list of possible EPSs. Machine learning algorithms allow for the selection of CAs with high speed and adaptability, ensuring the control of modern low-inertia EPSs. However, the use of ML is also associated with a number of difficulties. One of the key issues is the need to collect large volumes of high-quality data for model training. Since many events are rare or even unique, collecting representative data becomes a significant challenge. Furthermore, prediction accuracy depends on numerous factors, including the quality of the source data, the choice of features, and the model’s hyperparameters.
Another important issue is the interpretation of results obtained using ML. Many modern models are “black boxes,” whose internal mechanisms remain unclear to users. This creates problems with trust and decision-making based on ML model recommendations. The need to develop interpretable models remains a priority research area in the field of intelligent energy management.
Furthermore, it is important to note that the effectiveness of selected intelligent energy management systems should be assessed not only in terms of preventing instability but also in terms of economic consequences. For example, excessive reduction in transmission power can lead to an unjustified increase in network operating costs. Therefore, the optimal solution must balance technical and economic factors.
It is also necessary to consider the limitations of existing standards and regulations. Some countermeasures may violate existing grid operating regulations, requiring careful verification of each solution before implementation. This increases the complexity of the decision-making process and reduces the potential benefits of implementing new technologies.
It is important to emphasize that developing effective SSS management methods requires an interdisciplinary approach, incorporating knowledge from electrical engineering, mathematics, computer science, and economics. Only an integrated approach will enable the creation of reliable and cost-effective solutions to ensure the stable operation of modern electrical grids.
6. Conclusions
Modern EPS are characterized by significant changes in terms of increasing the speed of transient processes and increasing the requirements for EPS EC adaptability. The study has proposed a structure of the centralized EPS EC system to ensure SSS and CA selection based on ML algorithms. It can be considered as a high-speed backup stage operating during a cascade accident.
An analysis of existing methods for SSS assessment, CA selection, and informative future selection based on machine learning algorithms has been conducted. Their strengths and weaknesses are identified. It is found that most of the existing methods reviewed lack an assessment of time efficiency.
A methodology for selecting CA to ensure EPS SSS based on ML algorithms has been proposed. This methodology allows step-by-step data processing: data preparation; feature selection; cluster analysis; training models; and evaluation of model classification. Based on the numerical evaluation, the most suitable combination of the algorithm for selecting informative features with the CA selection algorithm for solving the SSS assessment problem is shown.
To test the methodology, a synthetic dataset obtained based on the modified IEEE24 power system model was used. This mathematical model has a complex closed structure with two voltage classes, which allows representing the full scope of possible transient processes. The total dataset size after processing was 3500.
The numerical evaluation results show that the DT algorithm provides the maximum value of the objective function (1) for solving the informative feature selection problem. The LightGBM algorithm proved to be the most effective for solving the classification problem of CA selection. The combined latency of the DT and LightGBM algorithms was 0.07 ms. The accuracy of the LightGBM algorithm in noise-free data was 98%. With data noise in the range of 0 to 20 dB, the algorithm’s accuracy ranged from 98 to 97%, respectively.
These results demonstrate the effectiveness of the proposed methodology in enhancing the adaptability and responsiveness of EPS EC algorithms.
Future Research Directions
- Application of the method to larger and more complex power system models.
- Use of real PMU measurement data for training and validation.
- Real-time implementation in digital simulators or pilot EPSs.
- Extension to multi-agent or decentralized CA selection for large-scale networks.
- Exploration of hybrid or reinforcement learning approaches for adaptive emergency control under variable operating conditions.
In summary, the study demonstrates that ML-enhanced CA selection provides a significant improvement in centralized EPS EC performance, ensuring SSS with minimal computational delay, high accuracy, and robustness under challenging post-emergency conditions. This approach lays the foundation for next-generation intelligent power system control frameworks that combine deterministic and data-driven methodologies.
Author Contributions
Conceptualization, M.S. (Mihail Senyuk), S.B., I.O., I.Z. and M.S. (Murodbek Safaraliev); Methodology, M.S. (Mihail Senyuk), S.B., M.N., I.O., I.Z. and M.S. (Murodbek Safaraliev); Software, M.S. (Mihail Senyuk), M.N., I.O., I.Z. and M.S. (Murodbek Safaraliev); Validation, M.S. (Mihail Senyuk), M.N. and I.O.; Formal analysis, M.S. (Mihail Senyuk), S.B., M.N. and I.O.; Investigation, M.S. (Mihail Senyuk), S.B. and I.Z.; Resources, I.Z.; Data curation, M.N., I.O., I.Z. and M.S. (Murodbek Safaraliev); Writing—original draft, M.S. (Mihail Senyuk), S.B., M.N., I.Z. and M.S. (Murodbek Safaraliev); Writing—review and editing, S.B., M.N., I.O., I.Z. and M.S. (Murodbek Safaraliev); Visualization, S.B.; Supervision, M.S. (Mihail Senyuk), I.Z. and M.S. (Murodbek Safaraliev); Project administration, M.N., I.Z. and M.S. (Murodbek Safaraliev); Funding acquisition, S.B. and M.N. All authors have read and agreed to the published version of the manuscript.
Funding
This research received no external funding.
Data Availability Statement
The data presented in this study are available on request from the corresponding author due to the data used in the study containing confidential information.
Acknowledgments
The research funding from the Ministry of Science and Higher Education of the Russian Federation (Ural Federal University Program of Development within the Priority-2030 Program) is gratefully acknowledged.
Conflicts of Interest
The authors declare no conflict of interest.
Abbreviations
The following abbreviations are used in this manuscript:
| AC | Accuracy |
| AdaBoost | Adaptive Boosting |
| ANN | Artificial Neural Network |
| Boruta | Boruta Feature Selection Algorithm |
| CA | Control Action |
| CAT | Control Action Table |
| CNN | Convolutional neural network |
| DRL | Deep reinforcement learning |
| DT | Decision tree |
| EC | Emergency Control |
| EP | Emergency Process |
| EP+ | Most Hazardous Emergency Process |
| EPS | Electric Power System |
| GNN | Graph Neural Network |
| GT | Generator Tripping |
| KNN | K-Nearest Neighbors |
| LightGBM | Light Gradient Boosting Machine |
| LS | Load Scheduling |
| ML | Machine Learning |
| m | Number of Samples |
| n | Number of Observations/Neighbors |
| NBC | Naive Bayes Classifier |
| N | Training Set Size |
| O(…) | Big-O Notation (Computational Complexity) |
| P | Active Power |
| p | Number of Features |
| PCA | Principal Component Analysis |
| PMU | Phasor Measurement Unit |
| RF | Random Forest |
| RES | Renewable Energy Sources |
| SG | Synchronous Generator |
| SSS | Small-Signal Stability |
| SVM | Support Vector Machine |
| t | Number of Trees in Iteration |
| t-SNE | t-distributed Stochastic Neighbor Embedding |
| TS | Transient Stability |
| Vmax/Vmin | Maximum/Minimum Node Voltage |
| WG | Wind Generator |
| XGBoost | eXtreme Gradient Boosting |
| α1, α2 | Weighting Coefficients in Objective Function |
| CA Class | Control Action Classification Groups |
| F1–F7 | Normalized Feature Values of Active/Reactive Power Flows |
| Pmax/Pmin | Maximum/Minimum Active Power of Generator |
| Qmax/Qmin | Maximum/Minimum Reactive Power of Generator |
References
- Li, X.; Zhang, J.; Tian, Z.; Zha, X.; Wang, W.; Huang, M.; Shao, C. Transient Stability Analysis of Converter-Based Islanded Microgrids Based on Iterative Equal Area Criterion Considering Reactive Power Loop Dynamics and Varying Damping. J. Mod. Power Syst. Clean Energy 2024, 12, 1170–1182. [Google Scholar] [CrossRef]
- Shobana, S.; Gnanavel, B. Optimised coordinated control of hybrid AC/DC microgrids along PV-wind-battery: A hybrid based model. Int. J. Bio-Inspired Comput. 2022, 20, 193–208. [Google Scholar] [CrossRef]
- Tiismus, H.; Maask, V.; Astapov, V.; Korõtko, T.; Rosin, A. State-of-the-Art Review of Emerging Trends in Renewable Energy Generation Technologies. IEEE Access 2025, 13, 10820–10843. [Google Scholar] [CrossRef]
- Suman, S.; Chatterjee, D.; Mohanty, R. Power quality improvement for microgrid-connected PV-based converters under partial shading conditions using mixed optimisation algorithms. Int. J. Bio-Inspired Comput. 2023, 21, 123–136. [Google Scholar] [CrossRef]
- Cao, Q.; Shen, C. Data-Enabled Koopman-Based Load Shedding for Power System Frequency Safety. J. Mod. Power Syst. Clean Energy 2025, 13, 766–777. [Google Scholar] [CrossRef]
- Ye, C.; Jiang, K.; Liu, D.; Zhang, C.; Zhang, D.; Liu, Z. Emergency Control Strategy for High Proportion Renewable Power System Considering the Frequency Aggregation Response of Multi-Type Power Generations. IEEE Access 2024, 12, 188325–188335. [Google Scholar] [CrossRef]
- Hossain, R.R.; Kumar, R. Machine Learning Accelerated Real-Time Model Predictive Control for Power Systems. IEEE/CAA J. Autom. Sin. 2023, 10, 916–930. [Google Scholar] [CrossRef]
- Yang, J.Z.; Liu, C.W. A Precise Calculation of Power System Frequency. IEEE Power Eng. Rev. 2001, 21, 71. [Google Scholar] [CrossRef]
- Yang, Z.; Gao, R.; He, W. A Review of The Research on Kalman Filtering in Power System Dynamic State Estimation. In Proceedings of the 2021 IEEE 4th Advanced Information Management, Communicates, Electronic and Automation Control Conference (IMCEC), Chongqing, China, 18–20 June 2021; pp. 856–861. [Google Scholar] [CrossRef]
- Beryozkina, S.; Senyuk, M.; Berdin, A.; Dmitrieva, A.; Dmitriev, S.; Erokhin, P. The Accelerate Estimation Method of Power System Parameters in Static and Dynamic Processes. IEEE Access 2022, 10, 61522–61529. [Google Scholar] [CrossRef]
- Yang, Y.; Zhang, X.; Yang, L. Data-driven power system small-signal stability assessment and correction control model based on XGBoost. Energy Rep. 2022, 8, 710–717. [Google Scholar] [CrossRef]
- Gurung, S.; Naetiladdanon, S.; Sangswang, A. A Surrogate Based Computationally Efficient Method to Coordinate Damping Controllers for Enhancement of Probabilistic Small-Signal Stability. IEEE Access 2021, 9, 32882–32896. [Google Scholar] [CrossRef]
- Dorado-Rojas, S.A.; Bogodorova, T.; Vanfretti, L. Time Series-Based Small-Signal Stability Assessment using Deep Learning. In Proceedings of the 2021 North American Power Symposium (NAPS), College Station, TX, USA, 14–16 November 2021; pp. 1–6. [Google Scholar] [CrossRef]
- Su, Y.; Guo, M.; Yao, H.; Guan, L.; Huang, J.; Zhu, S.; Zhong, Z. Power System Small-signal Stability Assessment Model Based on Residual Graph Convolutional Networks. J. Phys. Conf. Ser. 2021, 2095, 012011. [Google Scholar] [CrossRef]
- Dorado-Rojas, S.A.; de Castro Fernandes, M.; Vanfretti, L. Synthetic Training Data Generation for ML-based Small-Signal Stability Assessment. In Proceedings of the 2020 IEEE International Conference on Communications, Control, and Computing Technologies for Smart Grids (SmartGridComm), Tempe, AZ, USA, 11–13 November 2020; pp. 1–7. [Google Scholar] [CrossRef]
- Arteaga, J.-M.H.; Hancharou, F.; Thams, F.; Chatzivasileiadis, S. Deep Learning for Power System Security Assessment. In Proceedings of the 2019 IEEE Milan PowerTech, Milan, Italy, 23–27 June 2019; pp. 1–6. [Google Scholar] [CrossRef]
- Azman, S.K.; Isbeih, Y.J.; El Moursi, M.S.; Elbassioni, K. A Unified Online Deep Learning Prediction Model for Small Signal and Transient Stability. IEEE Trans. Power Syst. 2020, 35, 4585–4598. [Google Scholar] [CrossRef]
- Senyuk, M.; Beryozkina, S.; Safaraliev, M.; Nadeem, M.; Odinaev, I.; Kamalov, F. Methodology for Transient Stability Enhancement of Power Systems Based on Machine Learning Algorithms and Fast Valving in a Steam Turbine. Mathematics 2024, 12, 1644. [Google Scholar] [CrossRef]
- Cun, X.; Chen, X.; Geng, G.; Jiang, Q. Online Tracking of Small-Signal Stability Rightmost Eigenvalue Based on Reference Point. IEEE Access 2023, 11, 40469–40478. [Google Scholar] [CrossRef]
- Yang, S.; Fan, X.; Zhang, B.; Hao, Z.; Masahide, H. A Unified Scheme for Power System Transient Stability Simulation and Transient Stability Assessment. In Proceedings of the 2019 IEEE 8th International Conference on Advanced Power System Automation and Protection (APAP), Xi’an, China, 21–24 October 2019; pp. 1682–1686. [Google Scholar] [CrossRef]
- Fu, Y.; Zhang, X.; Chen, L.; Tian, Z.; Hou, K.; Wang, H. Analytical Representation of Data-driven Transient Stability Constraint and Its Application in Preventive Control. J. Mod. Power Syst. Clean Energy 2022, 10, 1085–1097. [Google Scholar] [CrossRef]
- Bellizio, F.; Cremer, J.L.; Sun, M.; Strbac, G. A causality based feature selection approach for data-driven dynamic security assessment. Electr. Power Syst. Res. 2021, 201, 107537. [Google Scholar] [CrossRef]
- Wahab, N.I.A.; Mohamed, A.; Hussain, A. Feature Selection and Extraction Methods for Power Systems Transient Stability Assessment Employing Computational Intelligence Techniques. Neural Process. Lett. 2012, 35, 81–102. [Google Scholar] [CrossRef]
- Arvizu, C.M.C.; Messina, A.R. Dimensionality Reduction in Transient Simulations: A Diffusion Maps Approach. IEEE Trans. Power Deliv. 2016, 31, 2379–2389. [Google Scholar] [CrossRef]
- Zhang, S.; Zhang, D.; Qiao, J.; Wang, X.; Zhang, Z. Preventive control for power system transient security based on XGBoost and DCOPF with consideration of model interpretability. CSEE J. Power Energy Syst. 2021, 7, 279–294. [Google Scholar] [CrossRef]
- Senyuk, M.; Odinaev, I.; Pichugova, O.; Ahyoev, J. Methodology for Forming a Training Sample for Power Systems Emergency Control Algorithm Based on Machine Learning. In Proceedings of the 2023 Belarusian-Ural-Siberian Smart Energy Conference (BUSSEC), Ekaterinburg, Russia, 25–29 September 2023; pp. 54–59. [Google Scholar] [CrossRef]
- Li, J.; Liu, B.; Zhang, S.; Ma, J.; Wang, J.; Ma, J.; Shi, C.; Wang, B. Feature selection method for future-state power grid operation mode based on semi-supervised learning. J. Phys. Conf. Ser. 2024, 2849, 012095. [Google Scholar] [CrossRef]
- Chen, Z.; Han, X.; Fan, C.; Zheng, T.; Mei, S. A Two-Stage Feature Selection Method for Power System Transient Stability Status Prediction. Energies 2019, 12, 689. [Google Scholar] [CrossRef]
- Moiseichenkov, A.; Dmitrieva, A.; Senyuk, M. Development and Testing of an Algorithm for Determining the Angular Velocity of Rotation and Acceleration of a Synchronous Generator Rotor in Transient Processes Based on Phasor Measurement Units. In Proceedings of the 2023 International Ural Conference on Electrical Power Engineering (UralCon), Magnitogorsk, Russia, 29 September–1 October 2023; pp. 133–138. [Google Scholar] [CrossRef]
- Yang, Z.; Kui, W.; Buhan, Z. A real-time dynamic equivalent solution for large interconnected power systems. In Proceedings of the 2011 4th International Conference on Electric Utility Deregulation and Restructuring and Power Technologies (DRPT), Weihai, China, 6–9 July 2011; pp. 871–875. [Google Scholar] [CrossRef]
- Chuvychin, V.; Gurov, N.; Kiene, S. Application of new emergency control principle in power systems. In Proceedings of the 2009 IEEE Bucharest PowerTech, Bucharest, Romania, 28 June–2 July 2009; pp. 1–6. [Google Scholar] [CrossRef]
- Yu, P.; Xiong, X.; He, X.; Zhu, J.; Liang, J.; Nan, D. Emergency Load Shedding Strategy with Warning and Delay Time Based on Energy Storage. Prot. Control Mod. Power Syst. 2025, 10, 28–41. [Google Scholar] [CrossRef]
- Smolovik, S.V.; Koshcheev, L.A.; Lisitsyn, A.A.; Denisenko, A.I. Special Automation for Isolated Power Systems Emergency Control. In Proceedings of the 2021 IEEE Conference of Russian Young Researchers in Electrical and Electronic Engineering (El-ConRus), St. Petersburg, Moscow, Russia, 26–29 January 2021; pp. 1558–1561. [Google Scholar] [CrossRef]
- Hu, G.-S.; Xie, J.; Zhu, F.-F. Classification of power quality disturbances using wavelet and fuzzy support vector machines. In Proceedings of the 2005 International Conference on Machine Learning and Cybernetics, Guangzhou, China, 18–21 August 2005; Volume 7, pp. 3981–3984. [Google Scholar] [CrossRef]
- Bao, Y.; Yang, S. Two Novel SMOTE Methods for Solving Imbalanced Classification Problems. IEEE Access 2023, 11, 5816–5823. [Google Scholar] [CrossRef]
- Sreehari, E.; Babu, L.D.D. Feature Selection Techniques for Data Analysis and Decision Making in Interdisciplinary Areas: A Systematic Review. IEEE Access 2024, 12, 188845–188873. [Google Scholar] [CrossRef]
- Raufi, B.; Longo, L. Comparing ANOVA and PowerShap Feature Selection Methods via Shapley Additive Explanations of Models of Mental Workload Built with the Theta and Alpha EEG Band Ratios. BioMedInformatics 2024, 4, 853–876. [Google Scholar] [CrossRef]
- Kamalov, F.; Sulieman, H.; Alzaatreh, A.; Emarly, M.; Chamlal, H.; Safaraliev, M. Mathematical Methods in Feature Selection: A Review. Mathematics 2025, 13, 996. [Google Scholar] [CrossRef]
- Alalhareth, M.; Hong, S.-C. An Improved Mutual Information Feature Selection Technique for Intrusion Detection Systems in the Internet of Medical Things. Sensors 2023, 23, 4971. [Google Scholar] [CrossRef]
- Nasir, I.M.; Khan, M.A.; Yasmin, M.; Shah, J.H.; Gabryel, M.; Scherer, R.; Damaševičius, R. Pearson Correlation-Based Feature Selection for Document Classification Using Balanced Training. Sensors 2020, 20, 6793. [Google Scholar] [CrossRef]
- Thelagathoti, R.K.; Tom, W.A.; Chandel, D.S.; Jiang, C.; Krzyzanowski, G.; Olou, A.; Fernando, M.R. A Hybrid Sequential Feature Selection Approach for Identifying New Potential mRNA Biomarkers for Usher Syndrome Using Machine Learning. Biomolecules 2025, 15, 963. [Google Scholar] [CrossRef]
- Huynh-Cam, T.-T.; Nalluri, V.; Chen, L.-S.; Yang, Y.-Y. IS-DT: A New Feature Selection Method for Determining the Important Features in Programmatic Buying. Big Data Cogn. Comput. 2022, 6, 118. [Google Scholar] [CrossRef]
- Samara, M.N.; Harry, K.D. Integrating Boruta, LASSO, and SHAP for Clinically Interpretable Glioma Classification Using Machine Learning. BioMedInformatics 2025, 5, 34. [Google Scholar] [CrossRef]
- Phalke, S.; Vaidya, Y.; Metkar, S. Big-O Time Complexity Analysis of Algorithm. In Proceedings of the 2022 International Conference on Signal and Information Processing (IConSIP), Pune, India, 26–27 August 2022; pp. 1–5. [Google Scholar] [CrossRef]
- Skrodzki, M.; van Geffen, H.; Chaves-de-Plaza, N.F.; Höllt, T.; Eisemann, E.; Hildebrandt, K. Accelerating Hyperbolic t-SNE. IEEE Trans. Vis. Comput. Graph. 2024, 30, 4403–4415. [Google Scholar] [CrossRef]
- Duan, L.; Xue, W.; Huang, J.; Zheng, X. Joint Sample Position Based Noise Filtering and Mean Shift Clustering for Imbalanced Classification Learning. Tsinghua Sci. Technol. 2024, 29, 216–231. [Google Scholar] [CrossRef]
- Rezaei, M.; Fränti, P. Can the Number of Clusters Be Determined by External Indices? IEEE Access 2020, 8, 89239–89257. [Google Scholar] [CrossRef]
- Li, J.; Zhang, J.; Zhang, S. Quantum KNN Classification with K Value Selection and Neighbor Selection. IEEE Trans. Comput.-Aided Des. Integr. Circuits Syst. 2024, 43, 1332–1345. [Google Scholar] [CrossRef]
- Yu, Y.; Liu, L.; Chang, Z.; Li, Y.; Shi, K. Detecting Forest Fires in Southwest China from Remote Sensing Nighttime Lights Using the Random Forest Classification Model. IEEE J. Sel. Top. Appl. Earth Obs. Remote Sens. 2024, 17, 10759–10769. [Google Scholar] [CrossRef]
- Song, H.; Hu, L. Dynamic measurement error detection method of high voltage current transformer based on reinforcement learning. In Proceedings of the 2021 International Conference on Wireless Communications and Smart Grid (ICWCSG), Hangzhou, China, 13–15 August 2021; pp. 418–421. [Google Scholar] [CrossRef]
- Lee, D.; Kim, K. AdaBoost.RDT: AdaBoost Integrated with Residual-Based Decision Tree for Demand Prediction of Bike Sharing Systems Under Extreme Demands. IEEE Access 2024, 12, 144316–144336. [Google Scholar] [CrossRef]
- Hokmabad, H.N.; Husev, O.; Belikov, J. Day-Ahead Solar Power Forecasting Using LightGBM and Self-Attention Based Encoder-Decoder Networks. IEEE Trans. Sustain. Energy 2025, 16, 866–879. [Google Scholar] [CrossRef]
- Ravikumar, B.; Thukaram, D.; Khincha, H.P. Comparison of Multiclass SVM Classification Methods to Use in a Supportive System for Distance Relay Coordination. IEEE Trans. Power Deliv. 2010, 25, 1296–1305. [Google Scholar] [CrossRef]
- Liu, M.; Jiao, L.; Liu, X.; Li, L.; Liu, F.; Yang, S. C-CNN: Contourlet Convolutional Neural Networks. IEEE Trans. Neural Netw. Learn. Syst. 2021, 32, 2636–2649. [Google Scholar] [CrossRef]
- Salmanpour, M.R.; Alizadeh, M.; Mousavi, G.; Sadeghi, S.; Amiri, S.; Oveisi, M.; Rahmim, A.; Hacihaliloglu, I. Machine Learning Evaluation Metric Discrepancies Across Programming Languages and Their Components in Medical Imaging Domains: Need for Standardization. IEEE Access 2025, 13, 47217–47229. [Google Scholar] [CrossRef]
- Senyuk, M.; Beryozkina, S.; Zicmane, I.; Safaraliev, M.; Klassen, V.; Kamalov, F. Bulk Low-Inertia Power Systems Adaptive Fault Type Classification Method Based on Machine Learning and Phasor Measurement Units Data. Mathematics 2025, 13, 316. [Google Scholar] [CrossRef]
- Senyuk, M.D.; Klassen, V.V.; Popovtsev, V.V. Adaptive Methodology for Determining Frequency Control Law in Isolated Power Systems Based on Machine Learning Algorithms. In Proceedings of the 2024 IEEE International Multi-Conference on Engineering, Computer and Information Sciences (SIBIRCON), Novosibirsk, Russia, 30 September–2 October 2024; pp. 494–499. [Google Scholar] [CrossRef]
- Sarmina, B.G.; Sun, G.-H.; Dong, S.-H. Principal Component Analysis and t-Distributed Stochastic Neighbor Embedding Analysis in the Study of Quantum Approximate Optimization Algorithm Entangled and Non-Entangled Mixing Operators. Entropy 2023, 25, 1499. [Google Scholar] [CrossRef]
- Trassinelli, M.; Ciccodicola, P. Mean Shift Cluster Recognition Method Implementation in the Nested Sampling Algorithm. Entropy 2020, 22, 185. [Google Scholar] [CrossRef] [PubMed]
- Zhu, N.; Zhu, C.; Zhou, L.; Zhu, Y.; Zhang, X. Optimization of the Random Forest Hyperparameters for Power Industrial Control Systems Intrusion Detection Using an Improved Grid Search Algorithm. Appl. Sci. 2022, 12, 10456. [Google Scholar] [CrossRef]
- Abbass, M.J.; Lis, R.; Rebizant, W. Advanced Voltage Stability Assessment in Renewable-Powered Islanded Microgrids Using Machine Learning Models. Energies 2025, 18, 2047. [Google Scholar] [CrossRef]


Disclaimer/Publisher’s Note: The statements, opinions and data contained in all publications are solely those of the individual author(s) and contributor(s) and not of MDPI and/or the editor(s). MDPI and/or the editor(s) disclaim responsibility for any injury to people or property resulting from any ideas, methods, instructions or products referred to in the content. |
© 2025 by the authors. Licensee MDPI, Basel, Switzerland. This article is an open access article distributed under the terms and conditions of the Creative Commons Attribution (CC BY) license (https://creativecommons.org/licenses/by/4.0/).