Article

Limit Analysis Theory and Numerical Simulation Study on the Cover Thickness of Tunnel Crown in Soil–Rock Strata

1
School of Traffic and Transportation, Beijing Jiaotong University, Beijing 100044, China
2
Jinan Rail Transit Group Construction Investment Co., Ltd., Jinan 250101, China
3
School of Civil Engineering, Shandong Jianzhu University, Jinan 250101, China
*
Author to whom correspondence should be addressed.
Mathematics 2025, 13(20), 3293; https://doi.org/10.3390/math13203293
Submission received: 11 September 2025 / Revised: 7 October 2025 / Accepted: 10 October 2025 / Published: 15 October 2025

Abstract

When constructing subway tunnels in composite strata consisting of overlying soil and underlying rock, placing the tunnel within the overburden rock strata and setting a certain thickness of safety cover rock on top is an effective way to ensure the safety of tunnel construction and the stability of the surrounding rock. However, there is currently no unified understanding or standard regarding the safe overburden thickness of the tunnel and its general rules. To investigate the effect of changes in the roof overlying rock thickness on the surrounding rock stability of subway tunnels, this study is based on the typical soil–rock strata of an underground tunnel section of Jinan Metro Line 4 in China. A total of 4 different conditions for the thickness of the overlying soil layer were considered, and 48 comparison schemes were designed. A systematic study of numerical simulation comparisons of tunnel excavation under different cover rock thicknesses was conducted. The deformation and plastic zone evolution characteristics of the surrounding rock were revealed under different cover rock thicknesses, and the existence of an optimal cover rock thickness range for tunnel crowns in soil–rock strata was identified. Based on this, a theoretical analysis model for the failure of the tunnel roof overlying rock was constructed. Using the upper-bound approach limit analysis method, the theoretical formula for the critical overburden thickness of the tunnel crown was derived. The influence of different rock mechanical parameters and tunnel design parameters on the critical overburden thickness was analyzed. The results were compared with numerical simulation results to verify the effectiveness of the proposed method. The research findings provide theoretical references for selecting reasonable buried depths and support designs for mining-bored tunnels in soil–rock composite strata.

1. Introduction

With the rapid development of the global economy and the acceleration of urbanization, the construction of urban rail transit has become a crucial part of the urbanization process. It provides important support for improving public services, ensuring the safe operation of cities, and meeting the public’s pursuit of a higher quality of life [1,2,3,4,5]. As of December 2024, 54 cities in China have opened urban rail transit lines, with a total operational mileage of 10,945.6 km. In eastern and southern coastal regions of China, such as Qingdao, Dalian, Jinan, and Guangzhou, composite strata with upper soil and lower rock layers are widely distributed due to the sedimentary history and conditions. When constructing subway tunnels in soil–rock composite strata, the upper soil layer has lower strength and poor self-stability compared to the lower rock layer. Placing the tunnel in the underlying rock layer while ensuring the safe overburden thickness can significantly reduce the risks and difficulties of tunnel excavation, minimize the impact on the surrounding environment, allow for flexible excavation methods, reduce support measures, and save construction costs [6,7,8].
The overlying soil and underlying rock strata play a crucial role in controlling the self-stability of the surrounding rock of the tunnel roof and the overlying rock thickness. However, there is no unified understanding or standard regarding the safe overburden thickness for tunnels and their general patterns. Over the past decade, many scholars, both domestically and internationally, have conducted extensive research on the stability of tunnel surrounding rock using methods such as model tests, theoretical analysis, and numerical simulations. For example, in terms of model testing, Yang et al. [9] developed a large-scale similar model experiment to investigate the deformation and failure characteristics of the surrounding rock in TBM tunnels buried deep in composite rocks. They revealed the evolution of internal principal stress and strain inside the surrounding rock under constant boundary load conditions. Huang et al. [10] explored the impact of weak interlayers on the failure mode of the surrounding rock in tunnels. Xu et al. [11] revealed the pressure, deformation, and failure mechanisms of the surrounding rock under different working conditions, considering the terrain of ravines. Shi et al. [12] combined physical model tests with discrete element modeling (DEM) to uncover the V-shaped sidewall extrusion failure mechanism during shallow tunnel excavation in ravine terrains. They proposed the critical burial depth ratio (L2/D) as a stability evaluation indicator, providing a theoretical basis for engineering design and construction optimization. In numerical simulation, Chakeri et al. [13] analyzed stress redistribution, deformation, and surface settlement patterns during tunnel cross-construction in soft soil strata using 3D numerical simulation. They revealed the influence range and the stratum interaction mechanism when tunnels intersect vertically. Huang et al. [14], based on model testing and numerical simulation, studied the progressive failure mechanism of shallow buried soft rock tunnels under overload conditions. They proposed an analytical model of loosening pressure considering joint surface influence and clarified the critical role of joint direction and quantity in surrounding rock stability. Zhang et al. [15] used the discrete element method to simulate tunnel excavation in composite strata containing cavities, analyzing the impact of the distance between the cavity and the arch roof, as well as the distance between the soil–rock interface and the arch roof, on composite stratum collapse. Zhang et al. [16] analyzed the influence of burial depth and soil–rock interface location on surrounding rock deformation. Hu et al. [17] revealed the mechanical properties of the surrounding rocks of shallow tunnels and support structures for shallow buried tunnels passing through inclined soil–rock interfaces at different tunnel locations. In terms of theoretical analysis, Li et al. [18] used measured data to fit the Peck formula regression, revealing the pattern of surface displacement caused by ultra-large diameter shield construction in composite strata. Liang et al. [19], based on upper-bound analysis and variable endpoint variational methods, derived the collapse curve expression for the surrounding rocks of a shallow tunnel using the Hoek–Brown criterion. They revealed the effect of variable endpoint conditions on collapse morphology and, through a comparison with the fixed endpoint method’s results, proved that this method better reflects the surrounding rock failure mechanism, providing a theoretical basis for engineering safety design.
In previous studies, research on the deformation and failure mechanisms of tunnel surrounding rock in composite soil–rock strata has been insufficient [20,21]. In-depth studies on the safe overburden thickness of subway tunnels and the general patterns of its variation are of great significance for guiding the design and construction of tunnels in soil–rock strata, with important scientific and practical engineering value [22,23]. This paper, based on the typical soil–rock strata section of the Jinan Metro Line 4 tunnel project in China, considers four different cover soil thickness conditions. A total of 48 comparative schemes were designed, and a systematic numerical simulation comparison study of tunnel excavation under different cover thicknesses was conducted. The deformation and plastic zone evolution characteristics of the tunnel surrounding rock under various cover thicknesses were revealed. On this basis, a theoretical analytical model for the failure of the tunnel roof overlying rock was constructed. Using the upper bound theorem, the critical safety thickness of the crown was derived, and the theoretical solution was compared with the numerical simulation results to verify the effectiveness of the proposed method. The research findings provide theoretical references for the reasonable buried depth selection and support design of mining-bored tunnels in soil–rock composite strata.

2. Project Overview

The Jinan Metro Line 4 in Shandong Province, China, is a significant project that spans the eastern and western districts. The first phase of Line 4 starts at Xiaogaozhuang Station in the west and ends at Pengjiazhuang Station in the east. The total length of the line is approximately 40.3 km, and the entire route is constructed underground. A total of 33 stations are set, all of which are underground stations. The construction of the tunnel sections is mainly carried out using shield tunneling and cut-and-cover methods. In areas with favorable geological conditions along the route, the mining method is applied for underground excavation.
The tunnel section between Lixia Square Station and Olympic Sports Center Station spans from DK24 + 425.733 to DK25 + 093.815, with a length of 668.082 m. The mining method is used for construction. The left and right tunnels of the section are designed with a single-hole, single-line approach. The longitudinal profile of the strata and the tunnel design cross-section are shown in Figure 1 and Figure 2.
The tunnel section between Lixia Square Station and Olympic Sports Center Station of the Jinan Metro Line 4 is located in a typical soil–rock composite strata. The upper part consists of soil layers, mainly including mixed fill and silty clay, with a thickness of approximately 7 to 9 m. The lower part is composed of rock layers, primarily moderately weathered limestone. In the soil–rock composite strata, the upper soil layer is relatively weak compared to the lower rock layer, which has poor self-supporting capacity. The lower rock layer, on the other hand, has higher strength and certain self-bearing capacity. Therefore, embedding the tunnel in the lower rock layer and ensuring that the thickness of the tunnel crown to the soil–rock interface is sufficient are key factors in ensuring the safety and stability of the tunnel. This paper, based on the Jinan Metro Line 4, conducts research on the deformation and failure mechanisms of tunnels in soil–rock composite strata through systematic numerical simulations.

3. Numerical Simulation of Tunnel Surrounding Rock Deformation and Failure Under Different Overburden Thicknesses

3.1. Model Construction and Solution Design

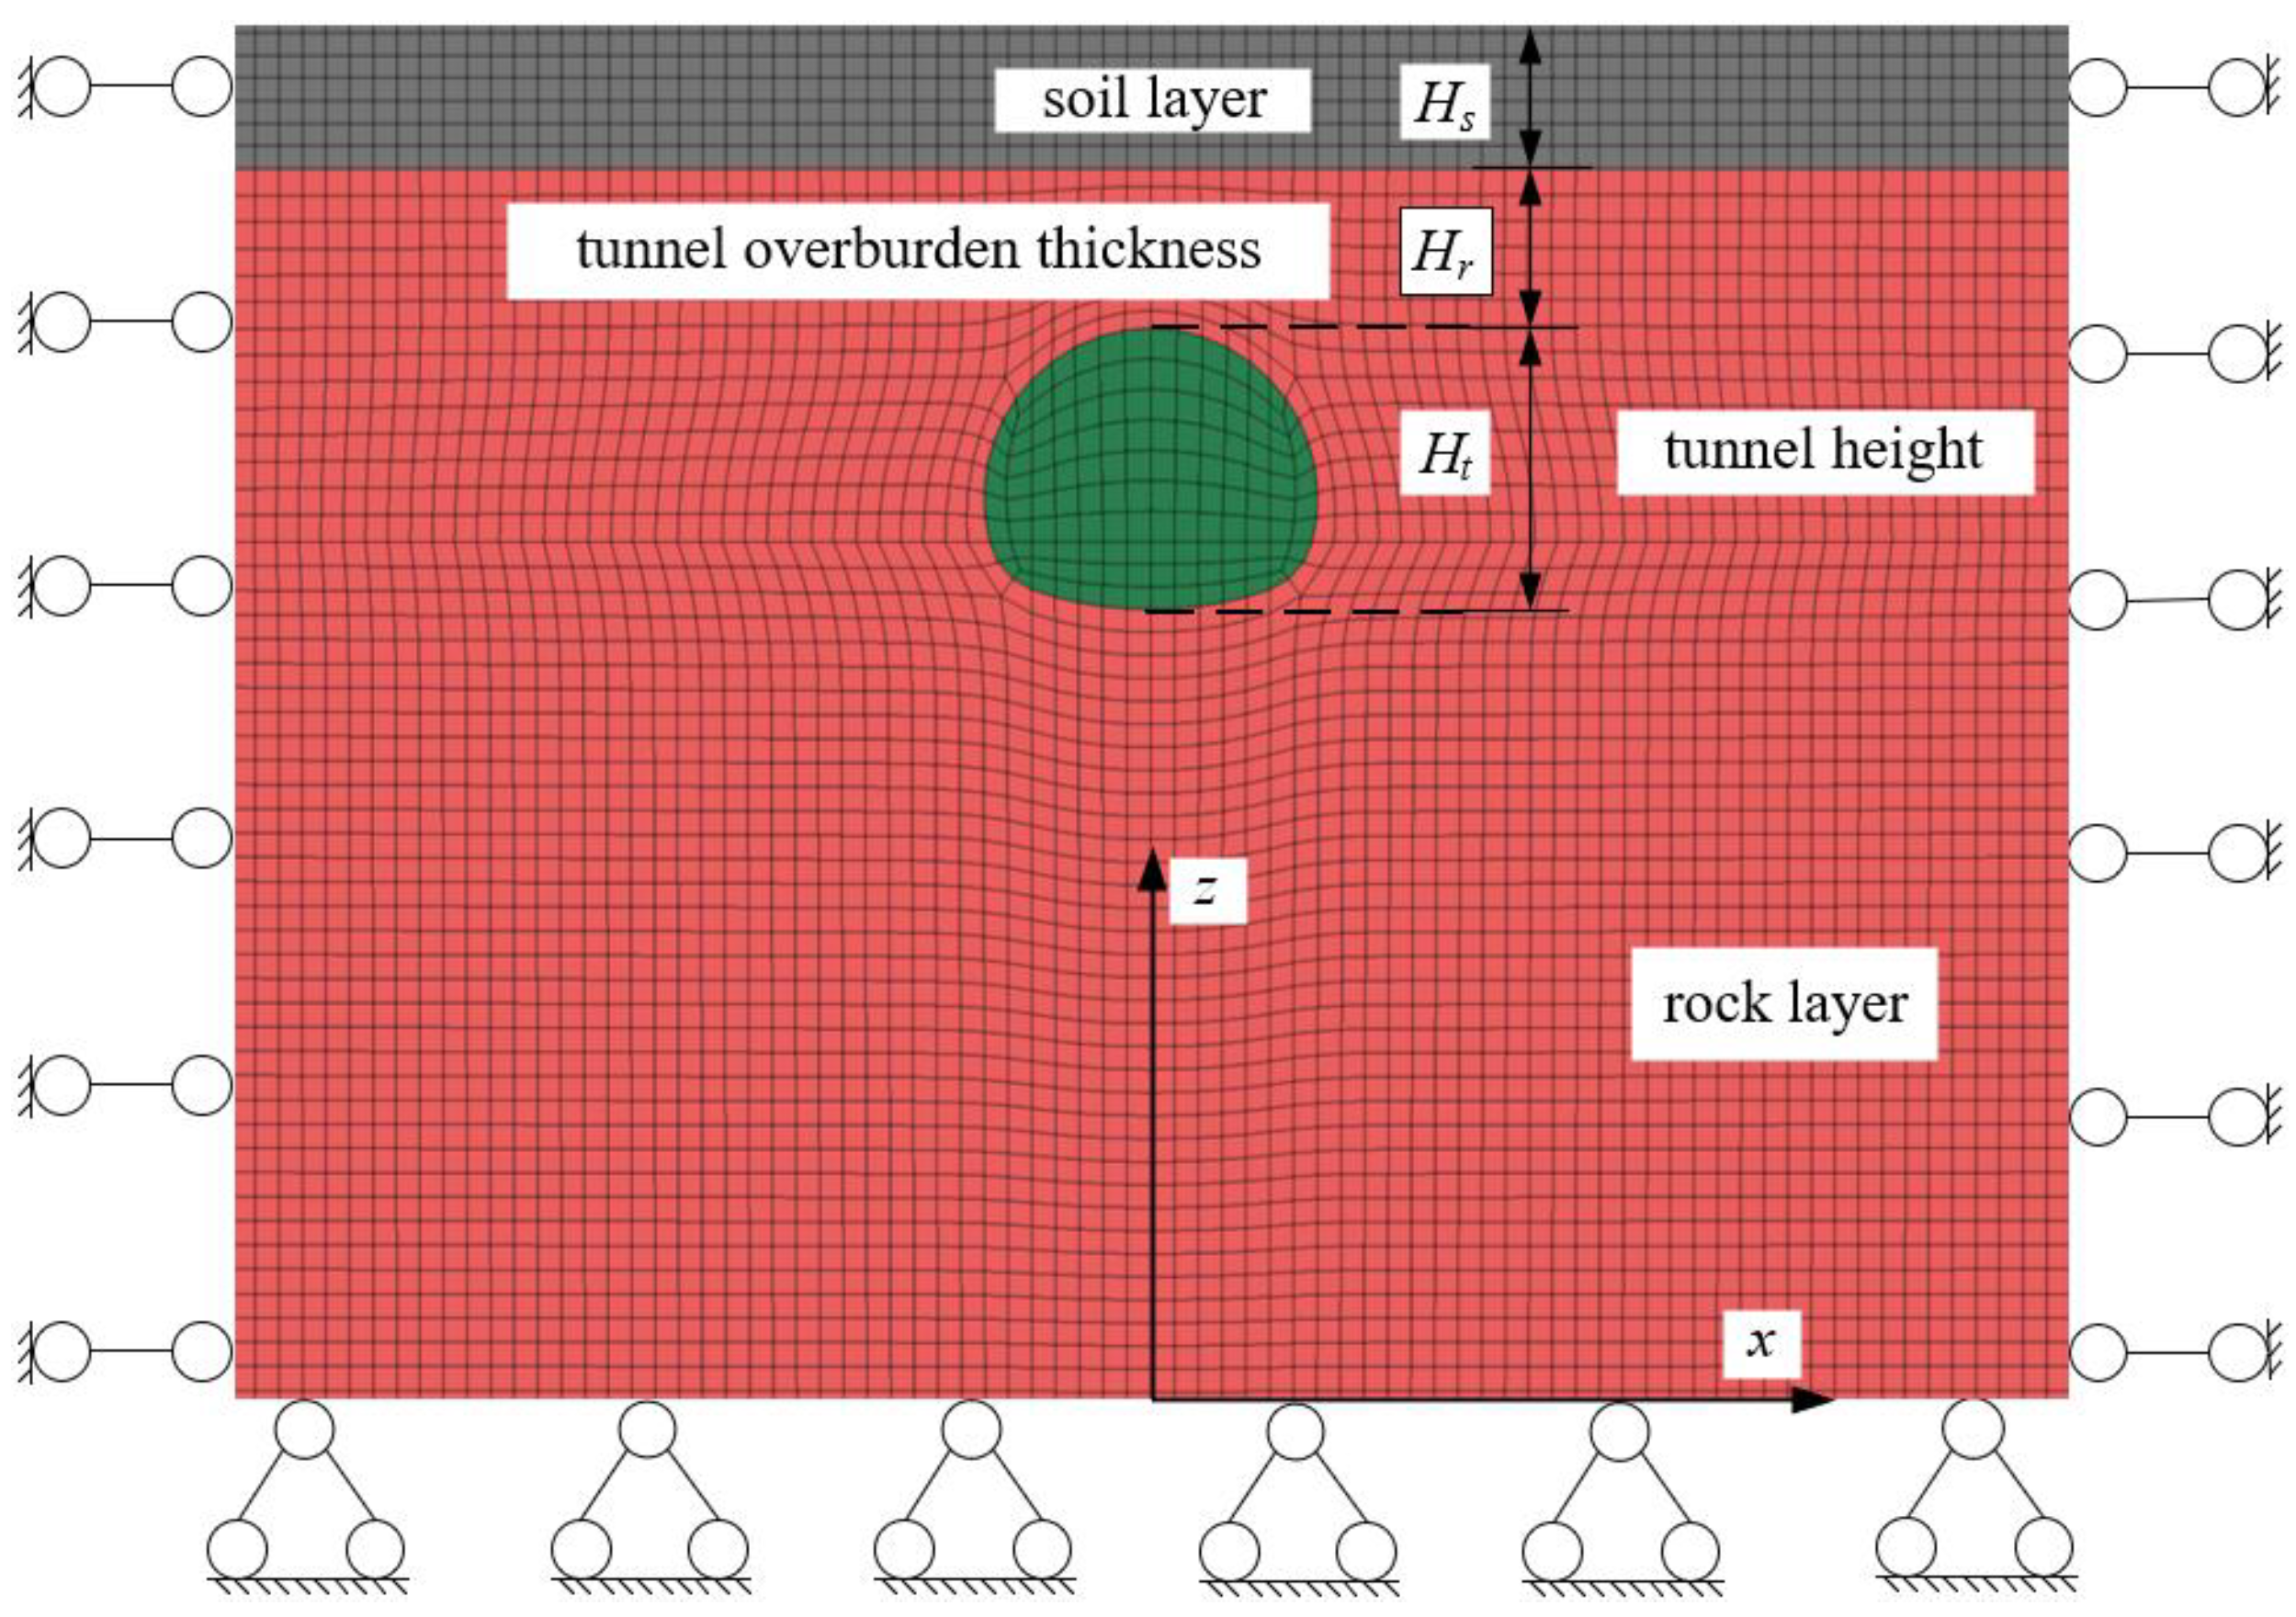
To investigate the impact of the critical overburden thickness of the crown on the stability of surrounding rock in soil–rock strata mining-bored tunnels, this study is based on the typical single-hole double-track tunnel project of the Hong-Li section of Jinan Metro Line 4. Analysis was performed using FLAC-3D 6.0 finite difference software. Based on the plane strain assumption, a unit thickness was adopted along the tunnel alignment, corresponding to a model thickness of 1 m. A three-dimensional numerical calculation model for tunnel excavation in soil–rock composite strata was subsequently established, as shown in Figure 3. In this model, based on the site stratum conditions, the upper soil layer is considered as silty clay with a thickness of H s , while the lower rock layer is modeled as weathered limestone. The overburden thickness between the tunnel crown and the soil–rock interface is denoted as H r , and the tunnel excavation height is H t .
In this paper, based on the typical mining-bored tunnels project of Jinan Metro Line 4, the site stratigraphic conditions are considered. A comparative study of numerical simulations is conducted, taking into account four different thicknesses of the upper soil layer: 3 m, 6 m, 9 m, and 12 m. For each soil layer thickness, the variation in arch crown cover thickness, ranging from 1 m to 12 m, is considered. In total, 48 numerical simulation scenarios are designed. During the simulation process, the convergence criterion based on the maximum unbalanced force was employed. Convergence was considered achieved when the maximum unbalanced force diminished below a threshold of 1 × 10⁻⁵. Boundary conditions were applied such that horizontal displacement constraints were imposed on all four sides (front, back, left, and right) of the model, while both horizontal and vertical displacement constraints were applied to the bottom boundary. After the model reached initial stress equilibrium, tunnel excavation was initiated. To ensure both computational accuracy and efficiency, the model was meshed using hexahedral (brick) elements. The width of the model boundaries was defined as 70 m, and the invert of the tunnel was located 30 m above the bottom model boundary. The physical and mechanical parameters of the strata are determined based on the on-site tunnel investigation report, as detailed in Table 1.

3.2. Comparison and Analysis of Numerical Simulation Results

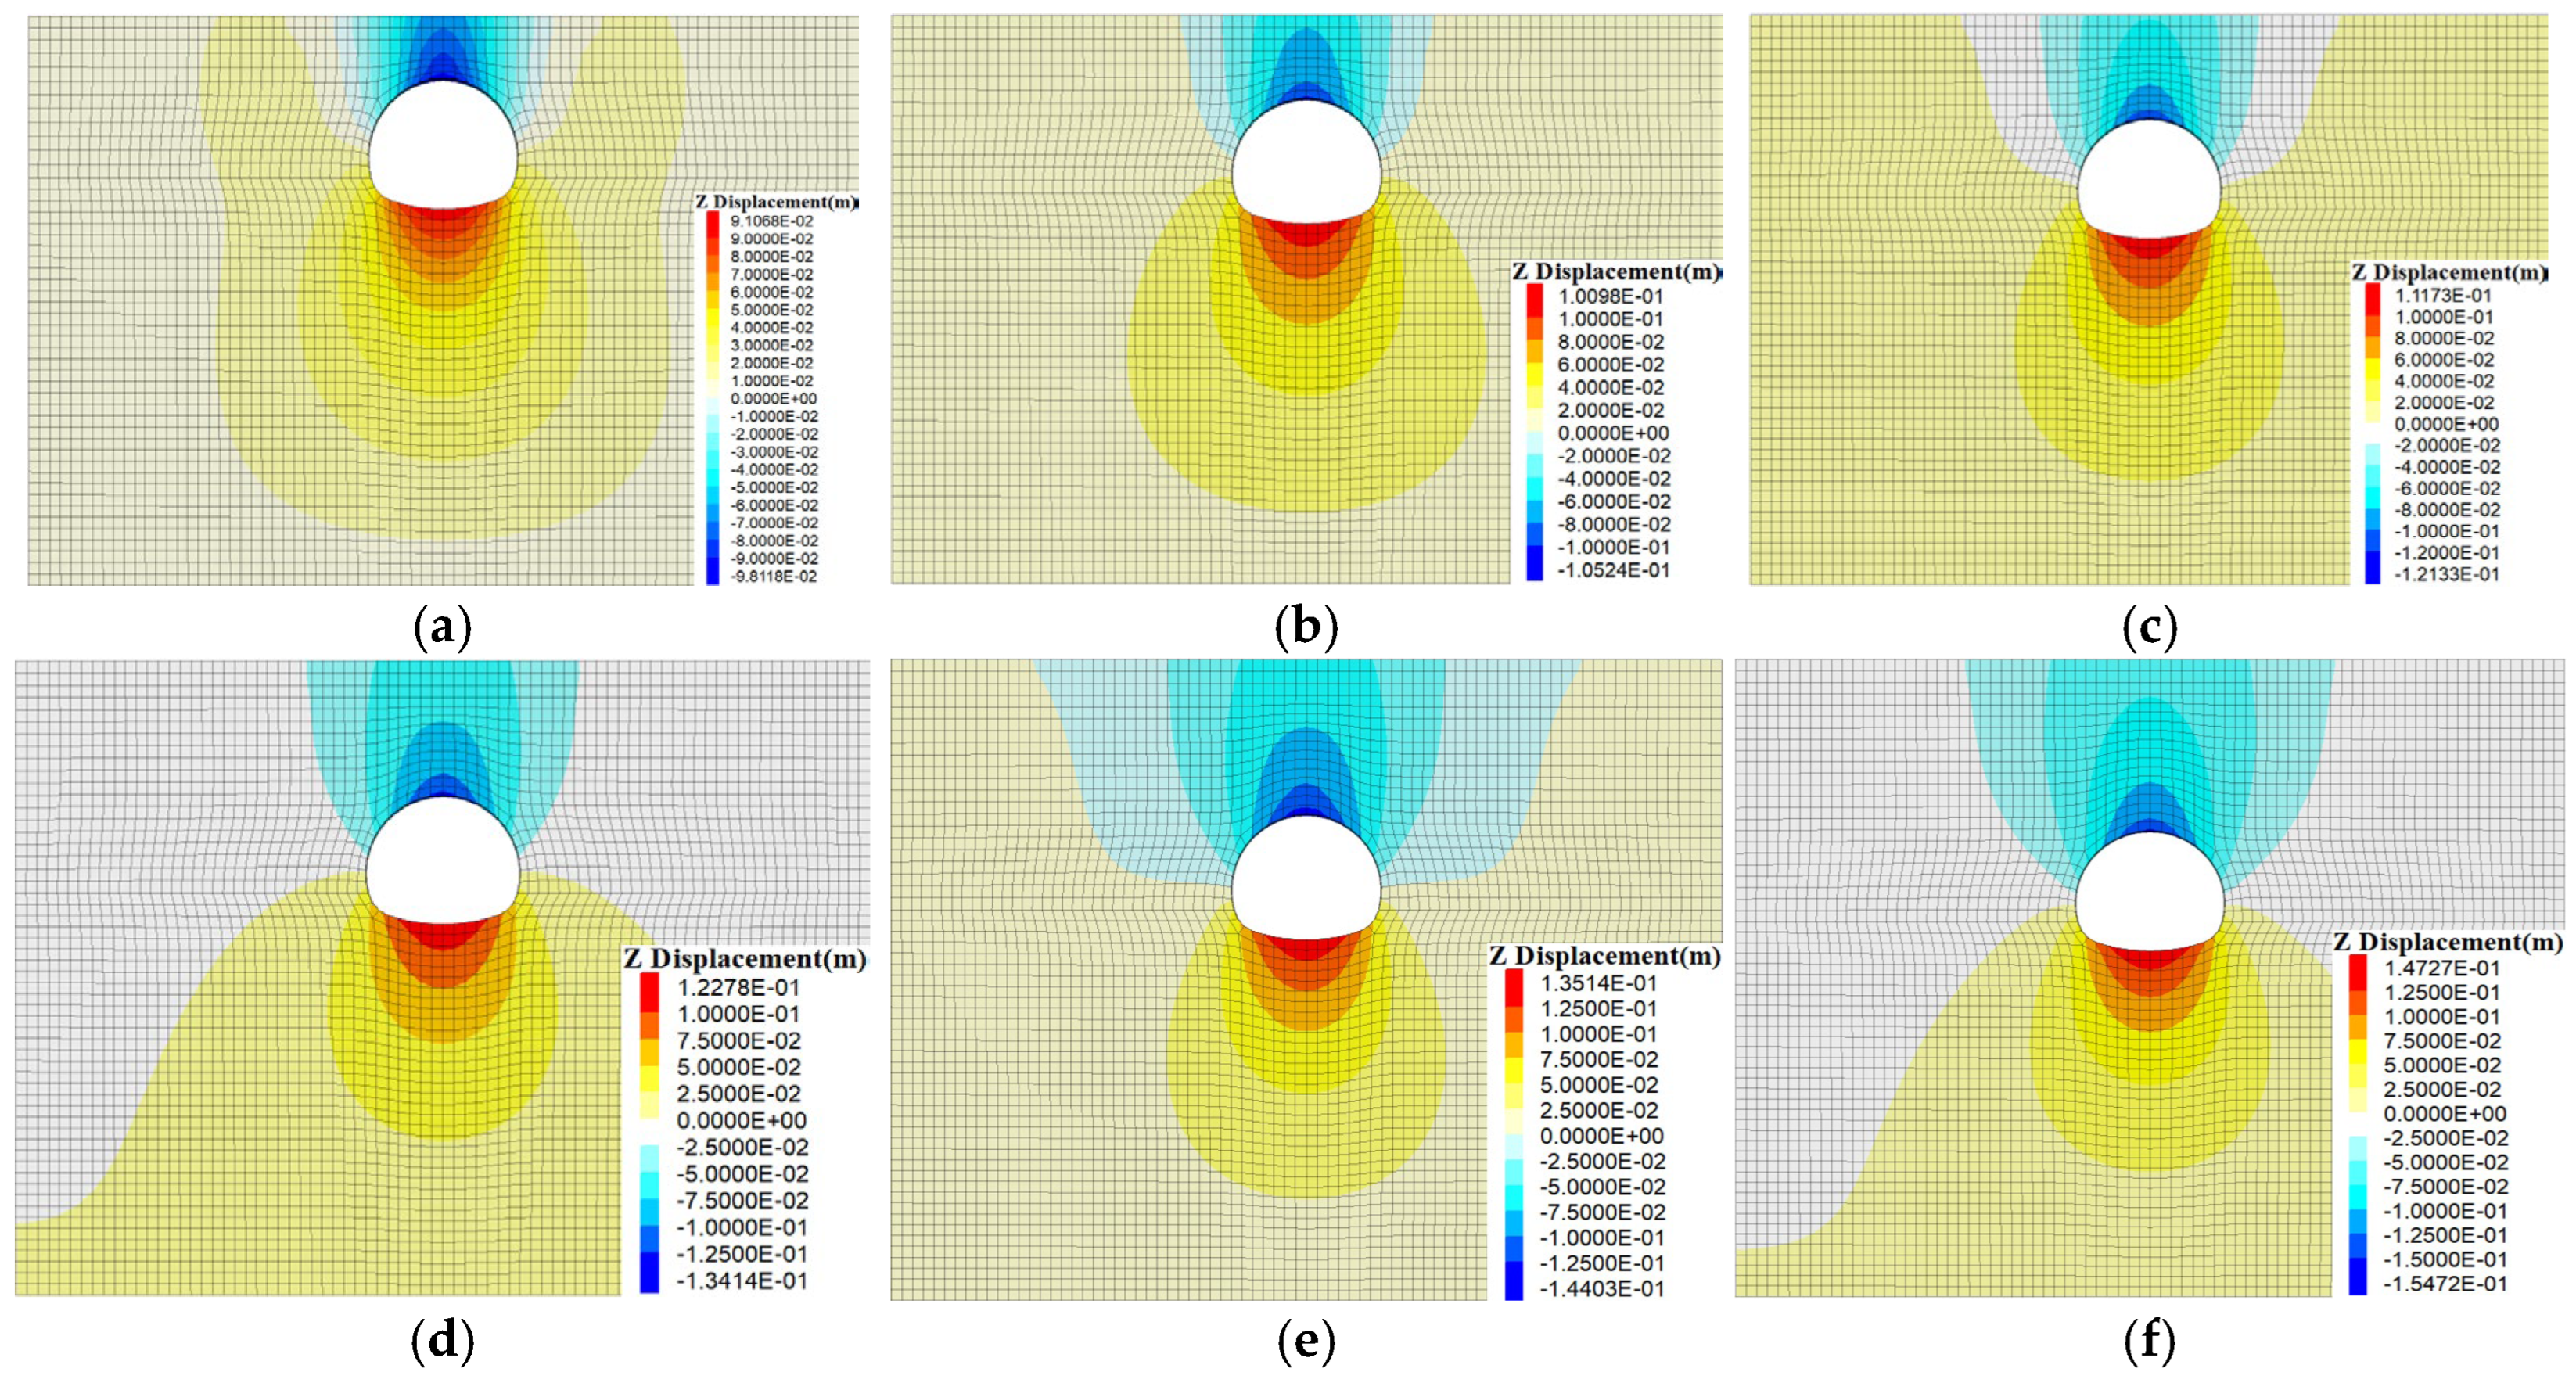
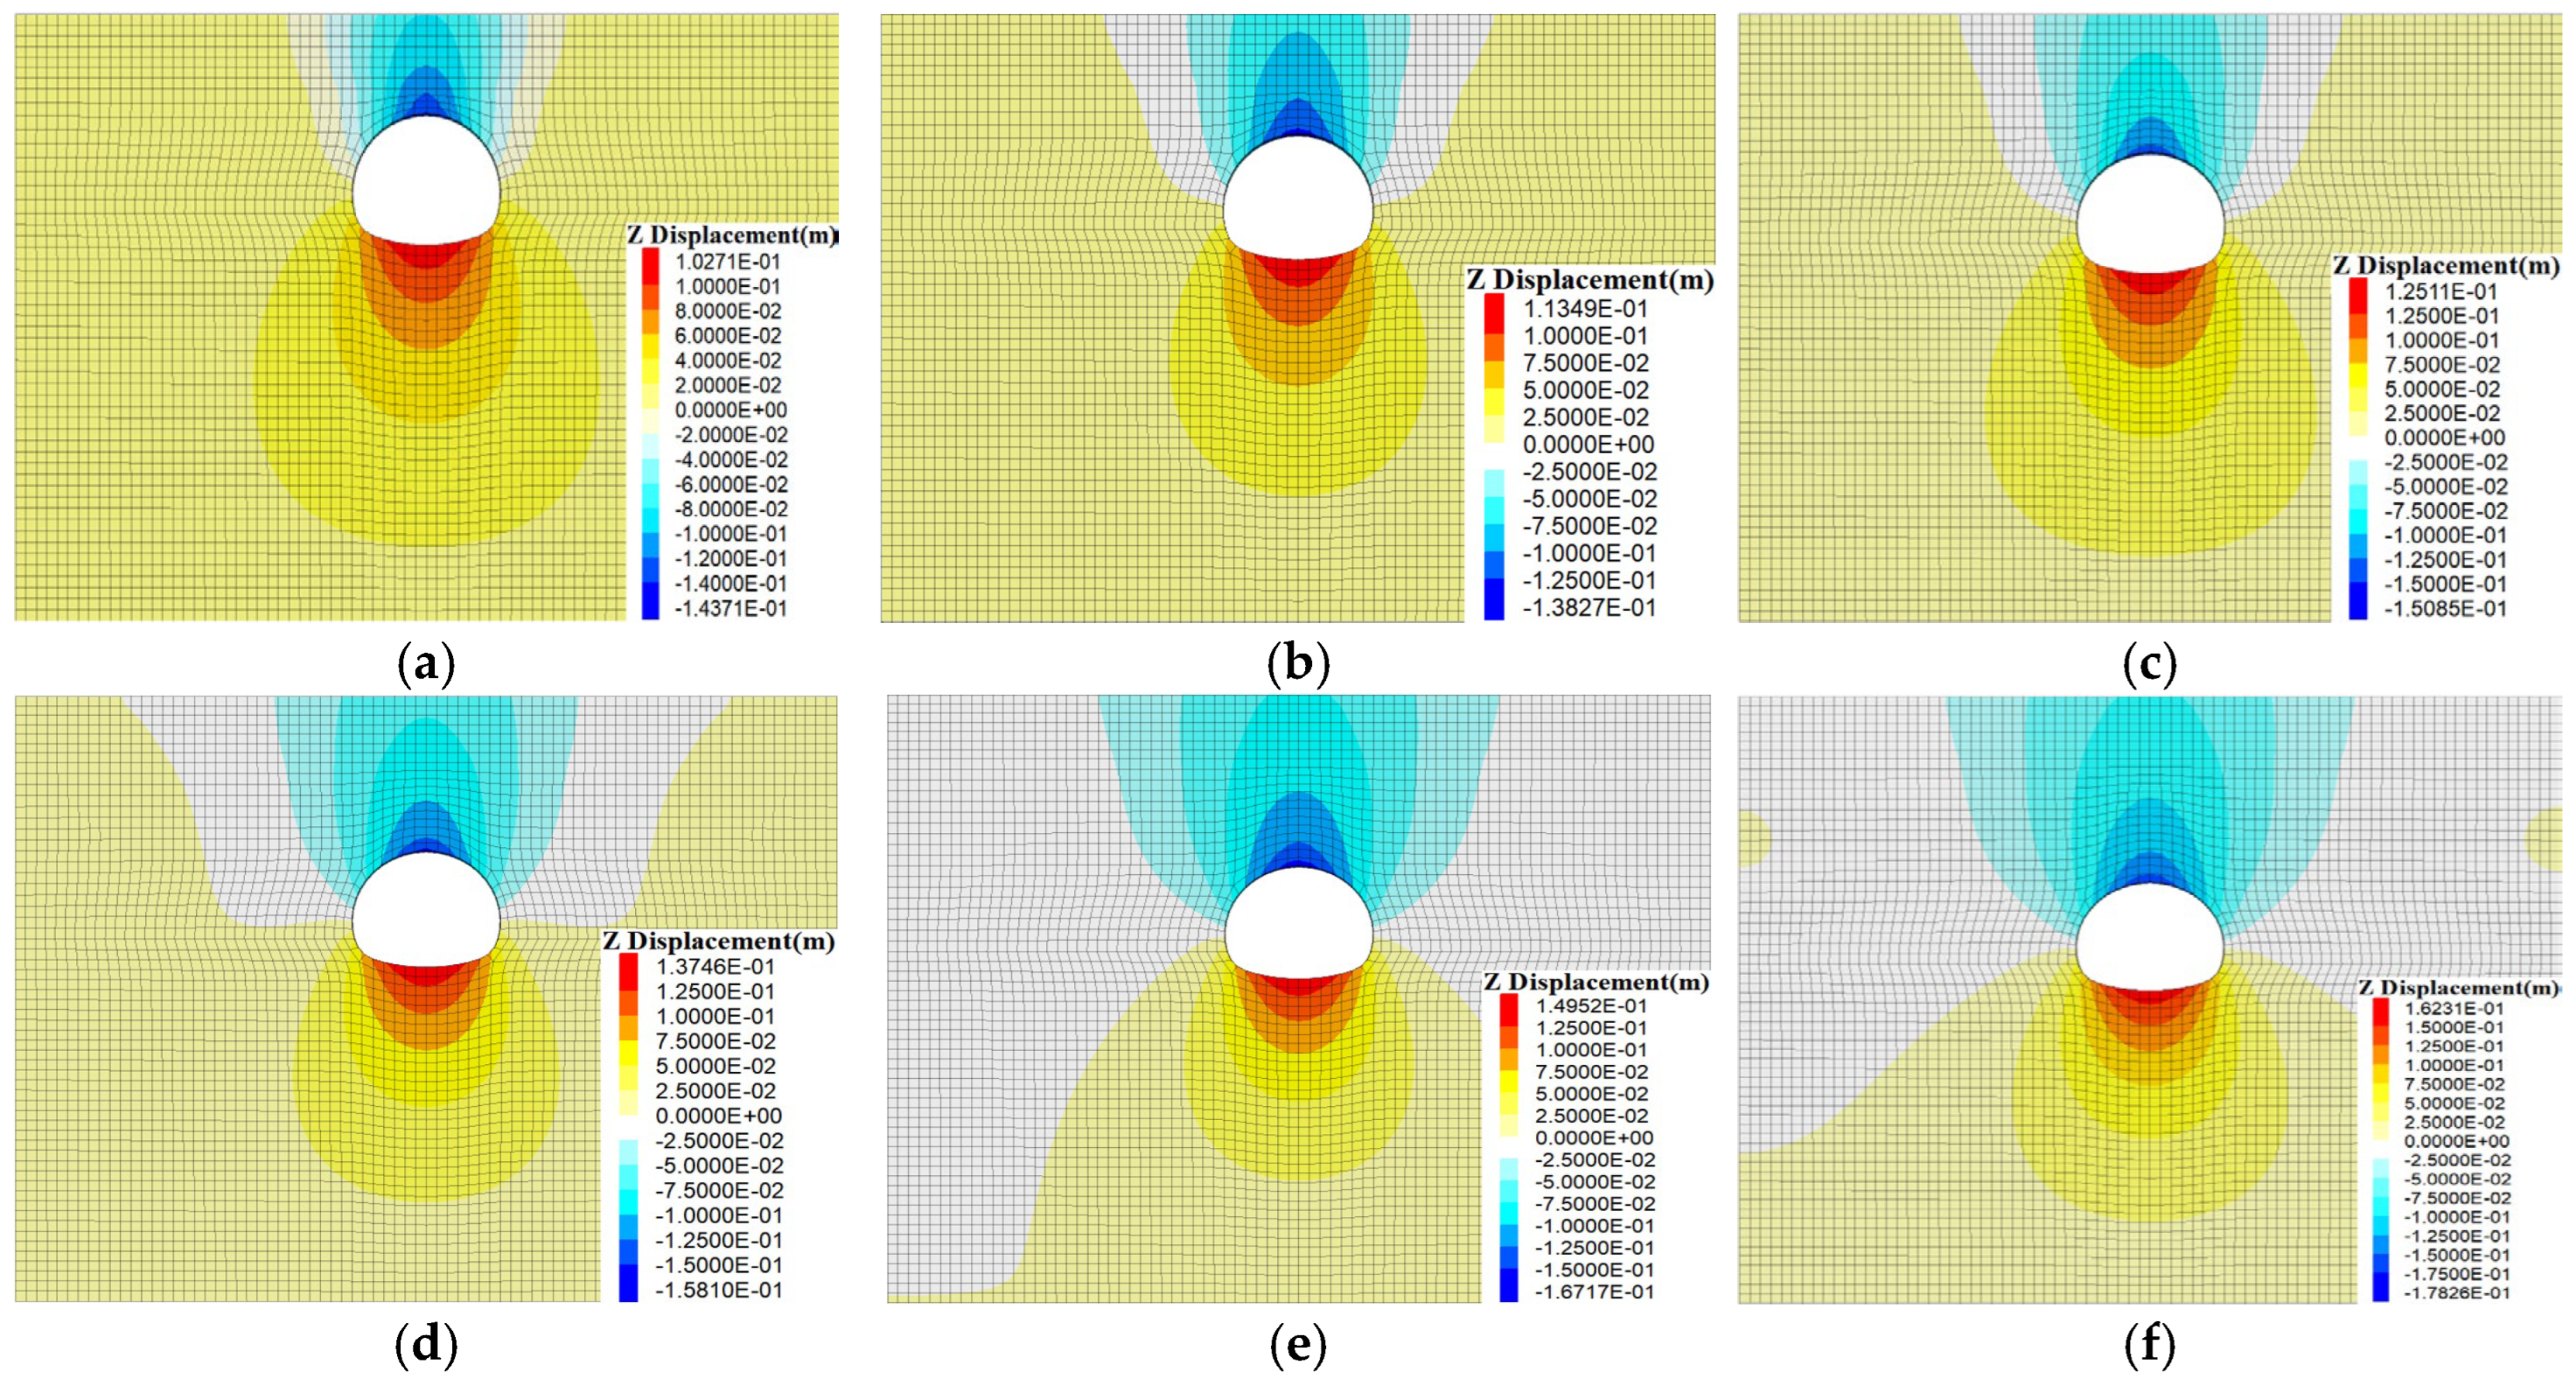
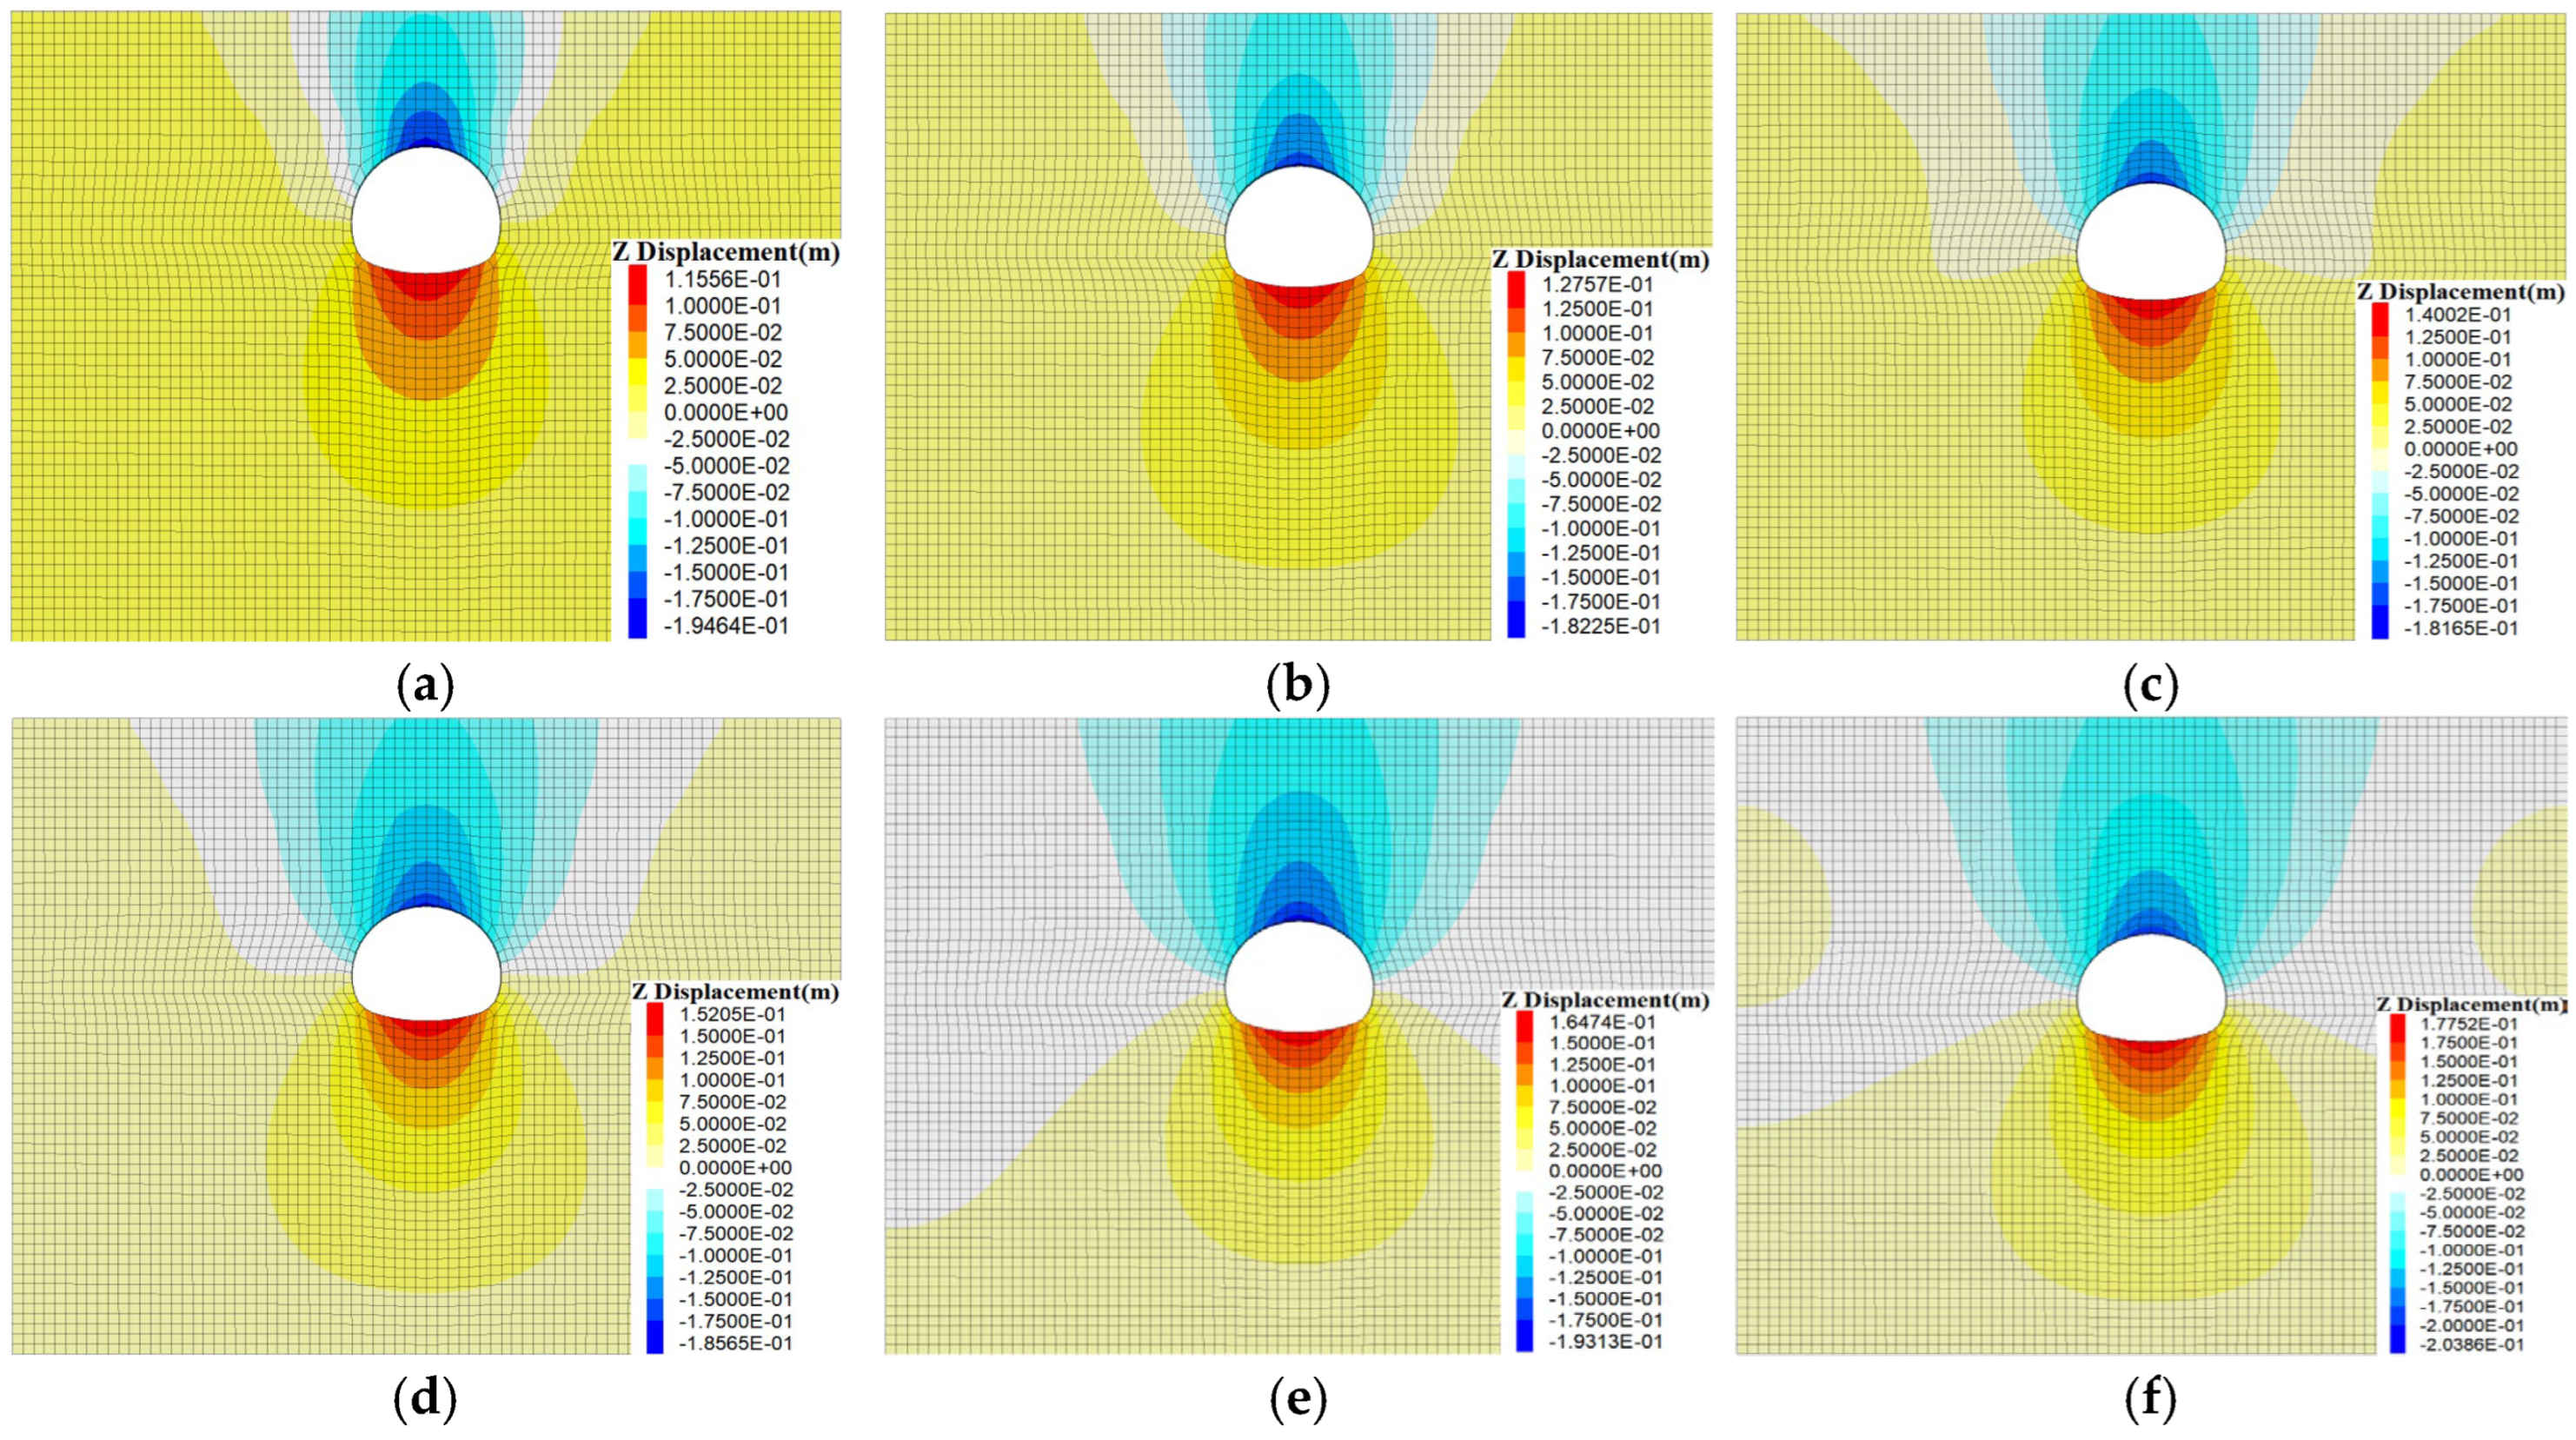
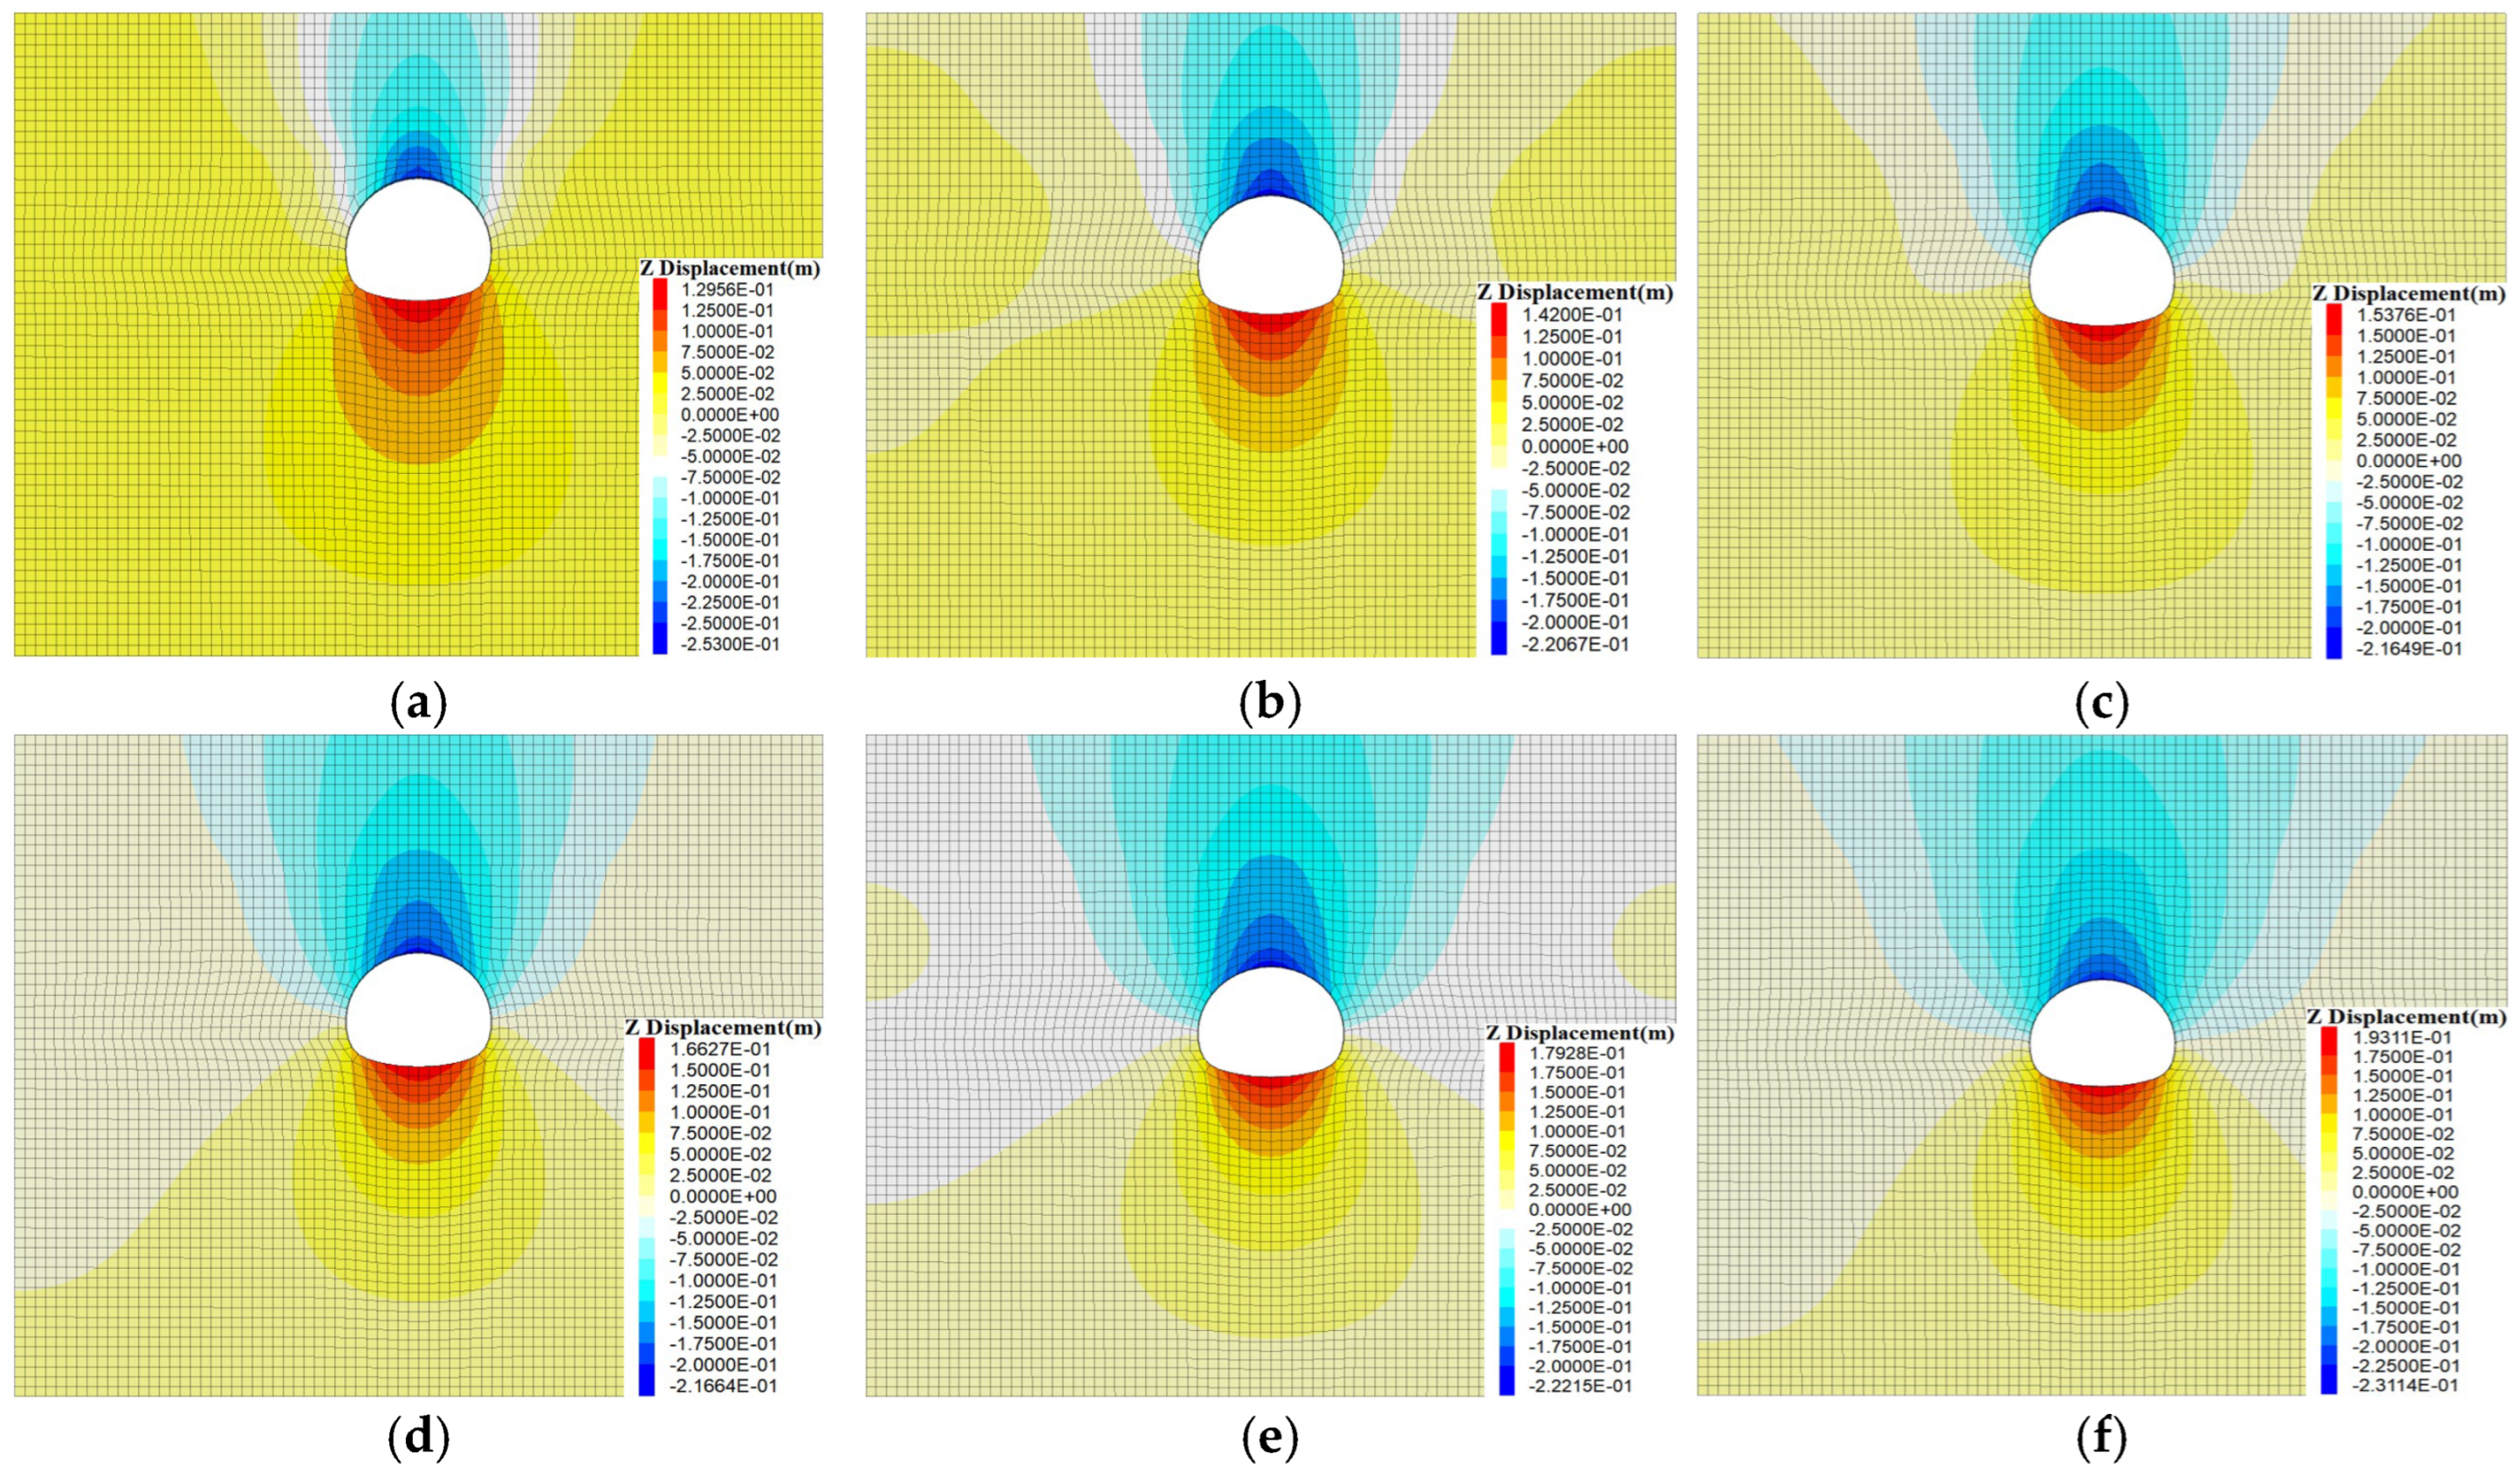
In the numerical calculation process, the initial stress balance is performed first, followed by tunnel excavation. To solely study and compare the effect of roof overlying rock thickness on the deformation and failure characteristics of tunnels in soil–rock composite strata, the influence of tunnel support was neglected in the numerical simulation. Figure 4, Figure 5, Figure 6 and Figure 7 show the vertical settlement displacement contour maps for different overburden thicknesses under four soil layer thicknesses; z-displacement represents the vertical settlement in the model. From Figure 4, Figure 5, Figure 6 and Figure 7, it can be observed that when the soil layer thickness is constant, the vertical displacement of tunnel settlement decreases initially and then increases as the overburden thickness increases. Under all four conditions, as the soil layer thickness increases, the surrounding settlement displacement of the tunnel generally increases.
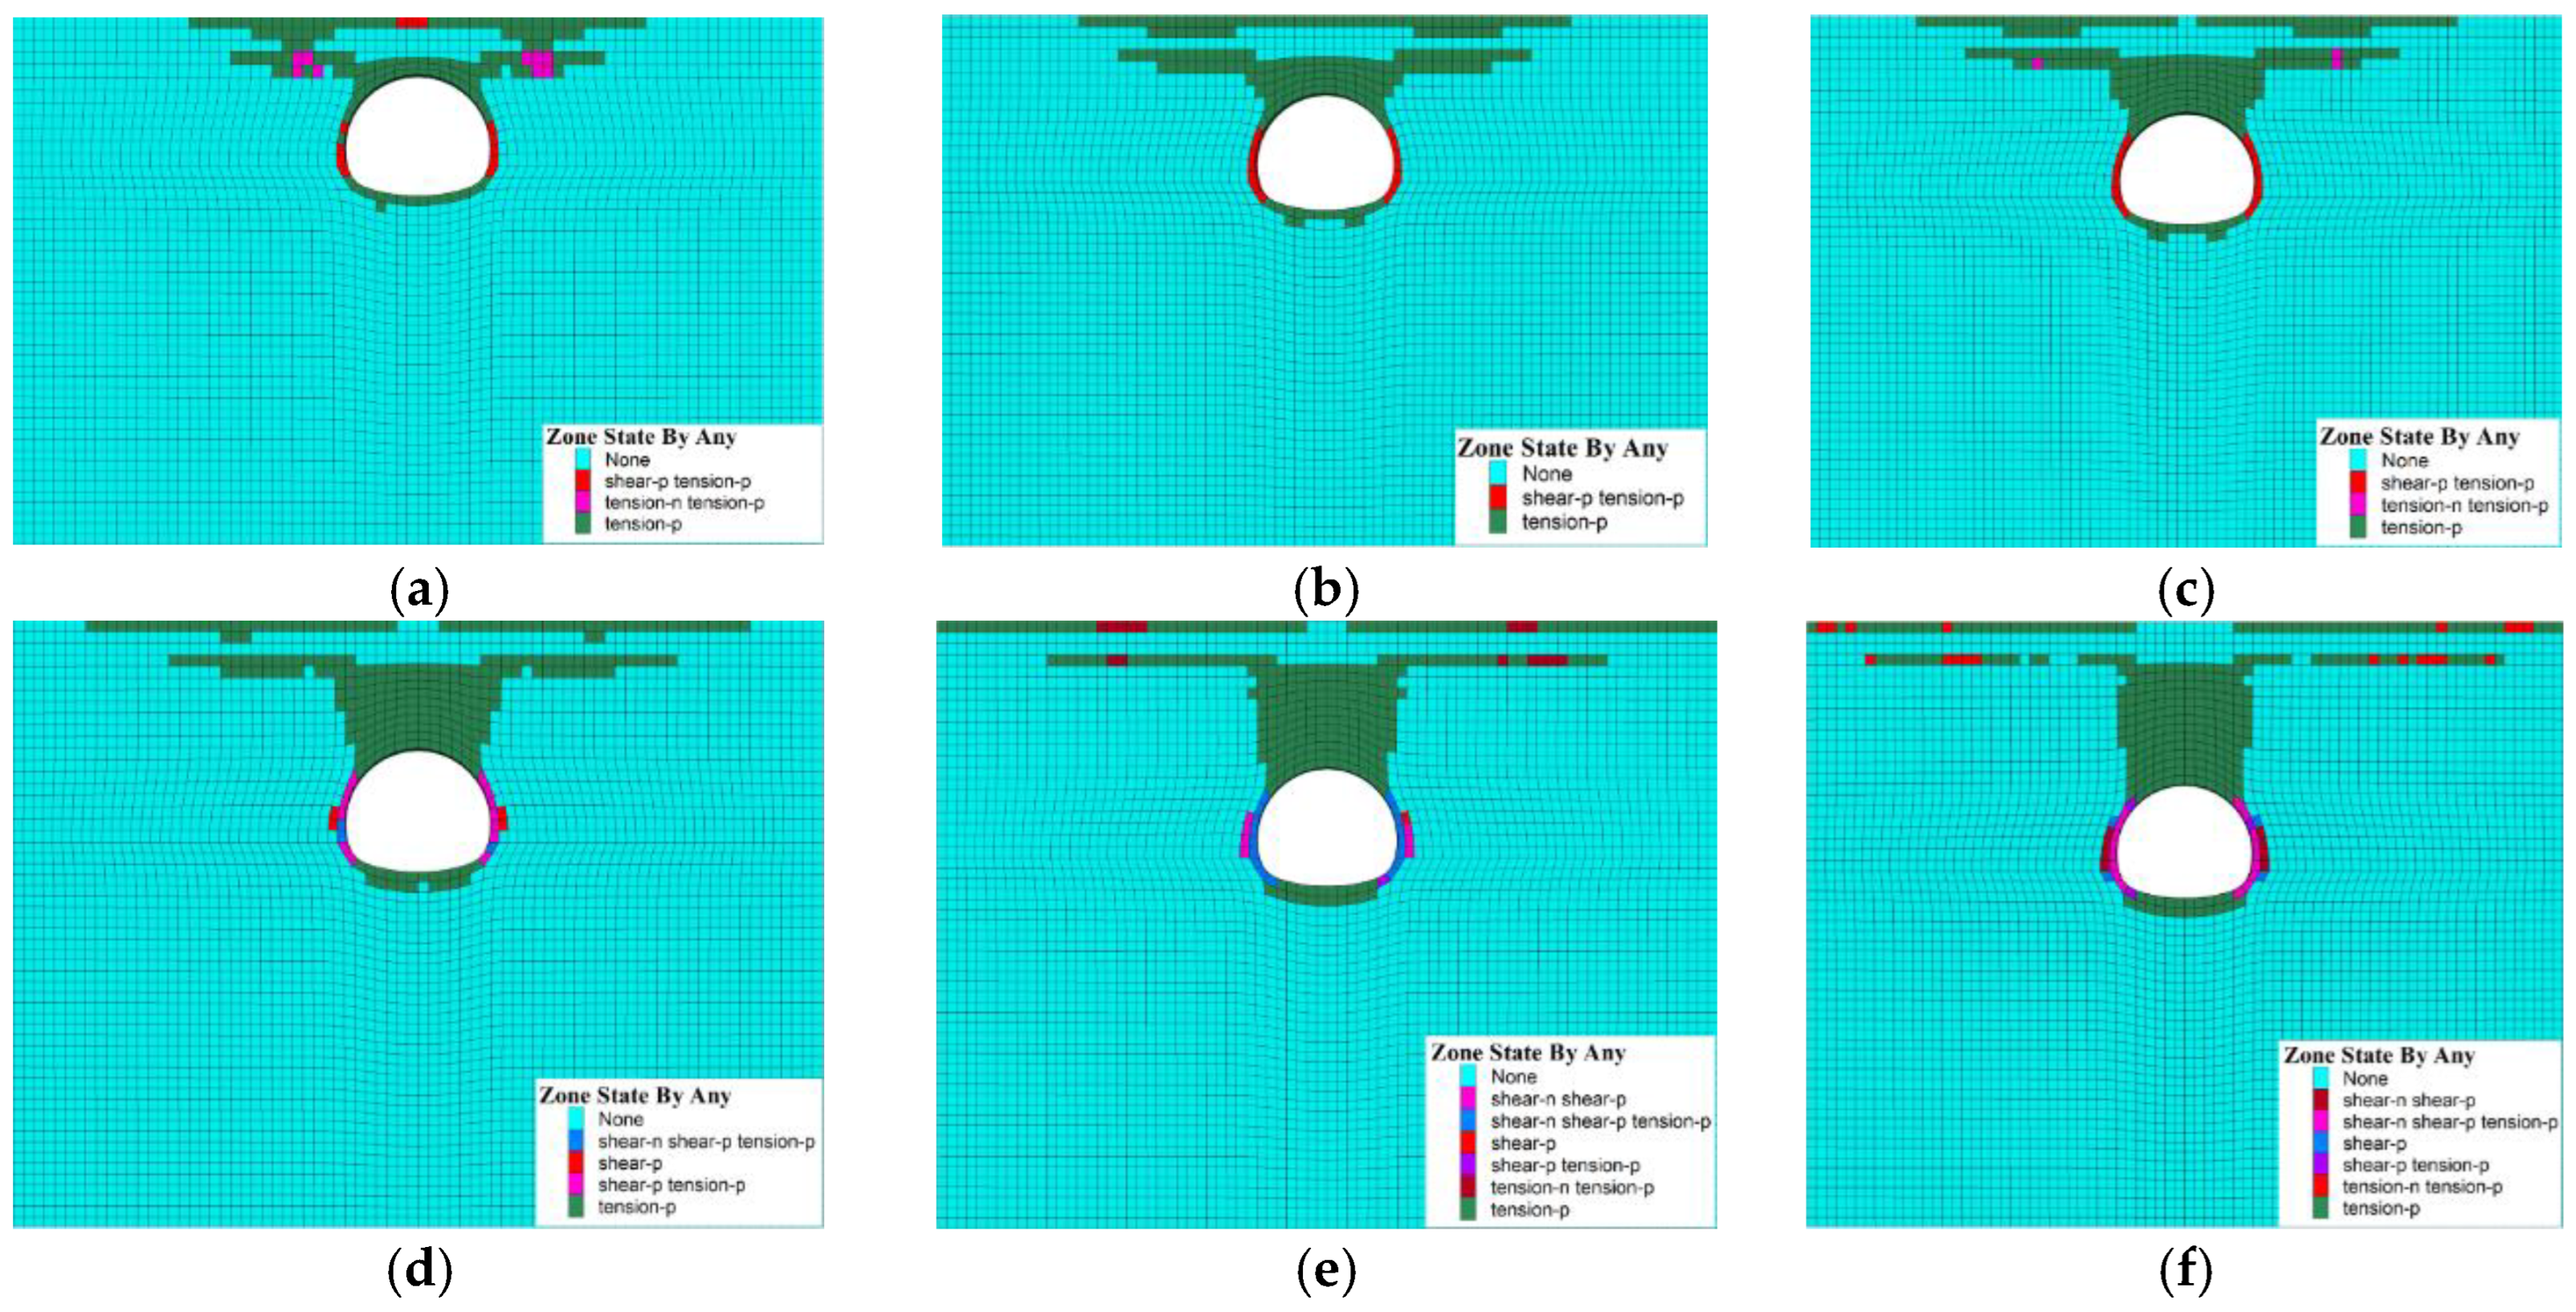
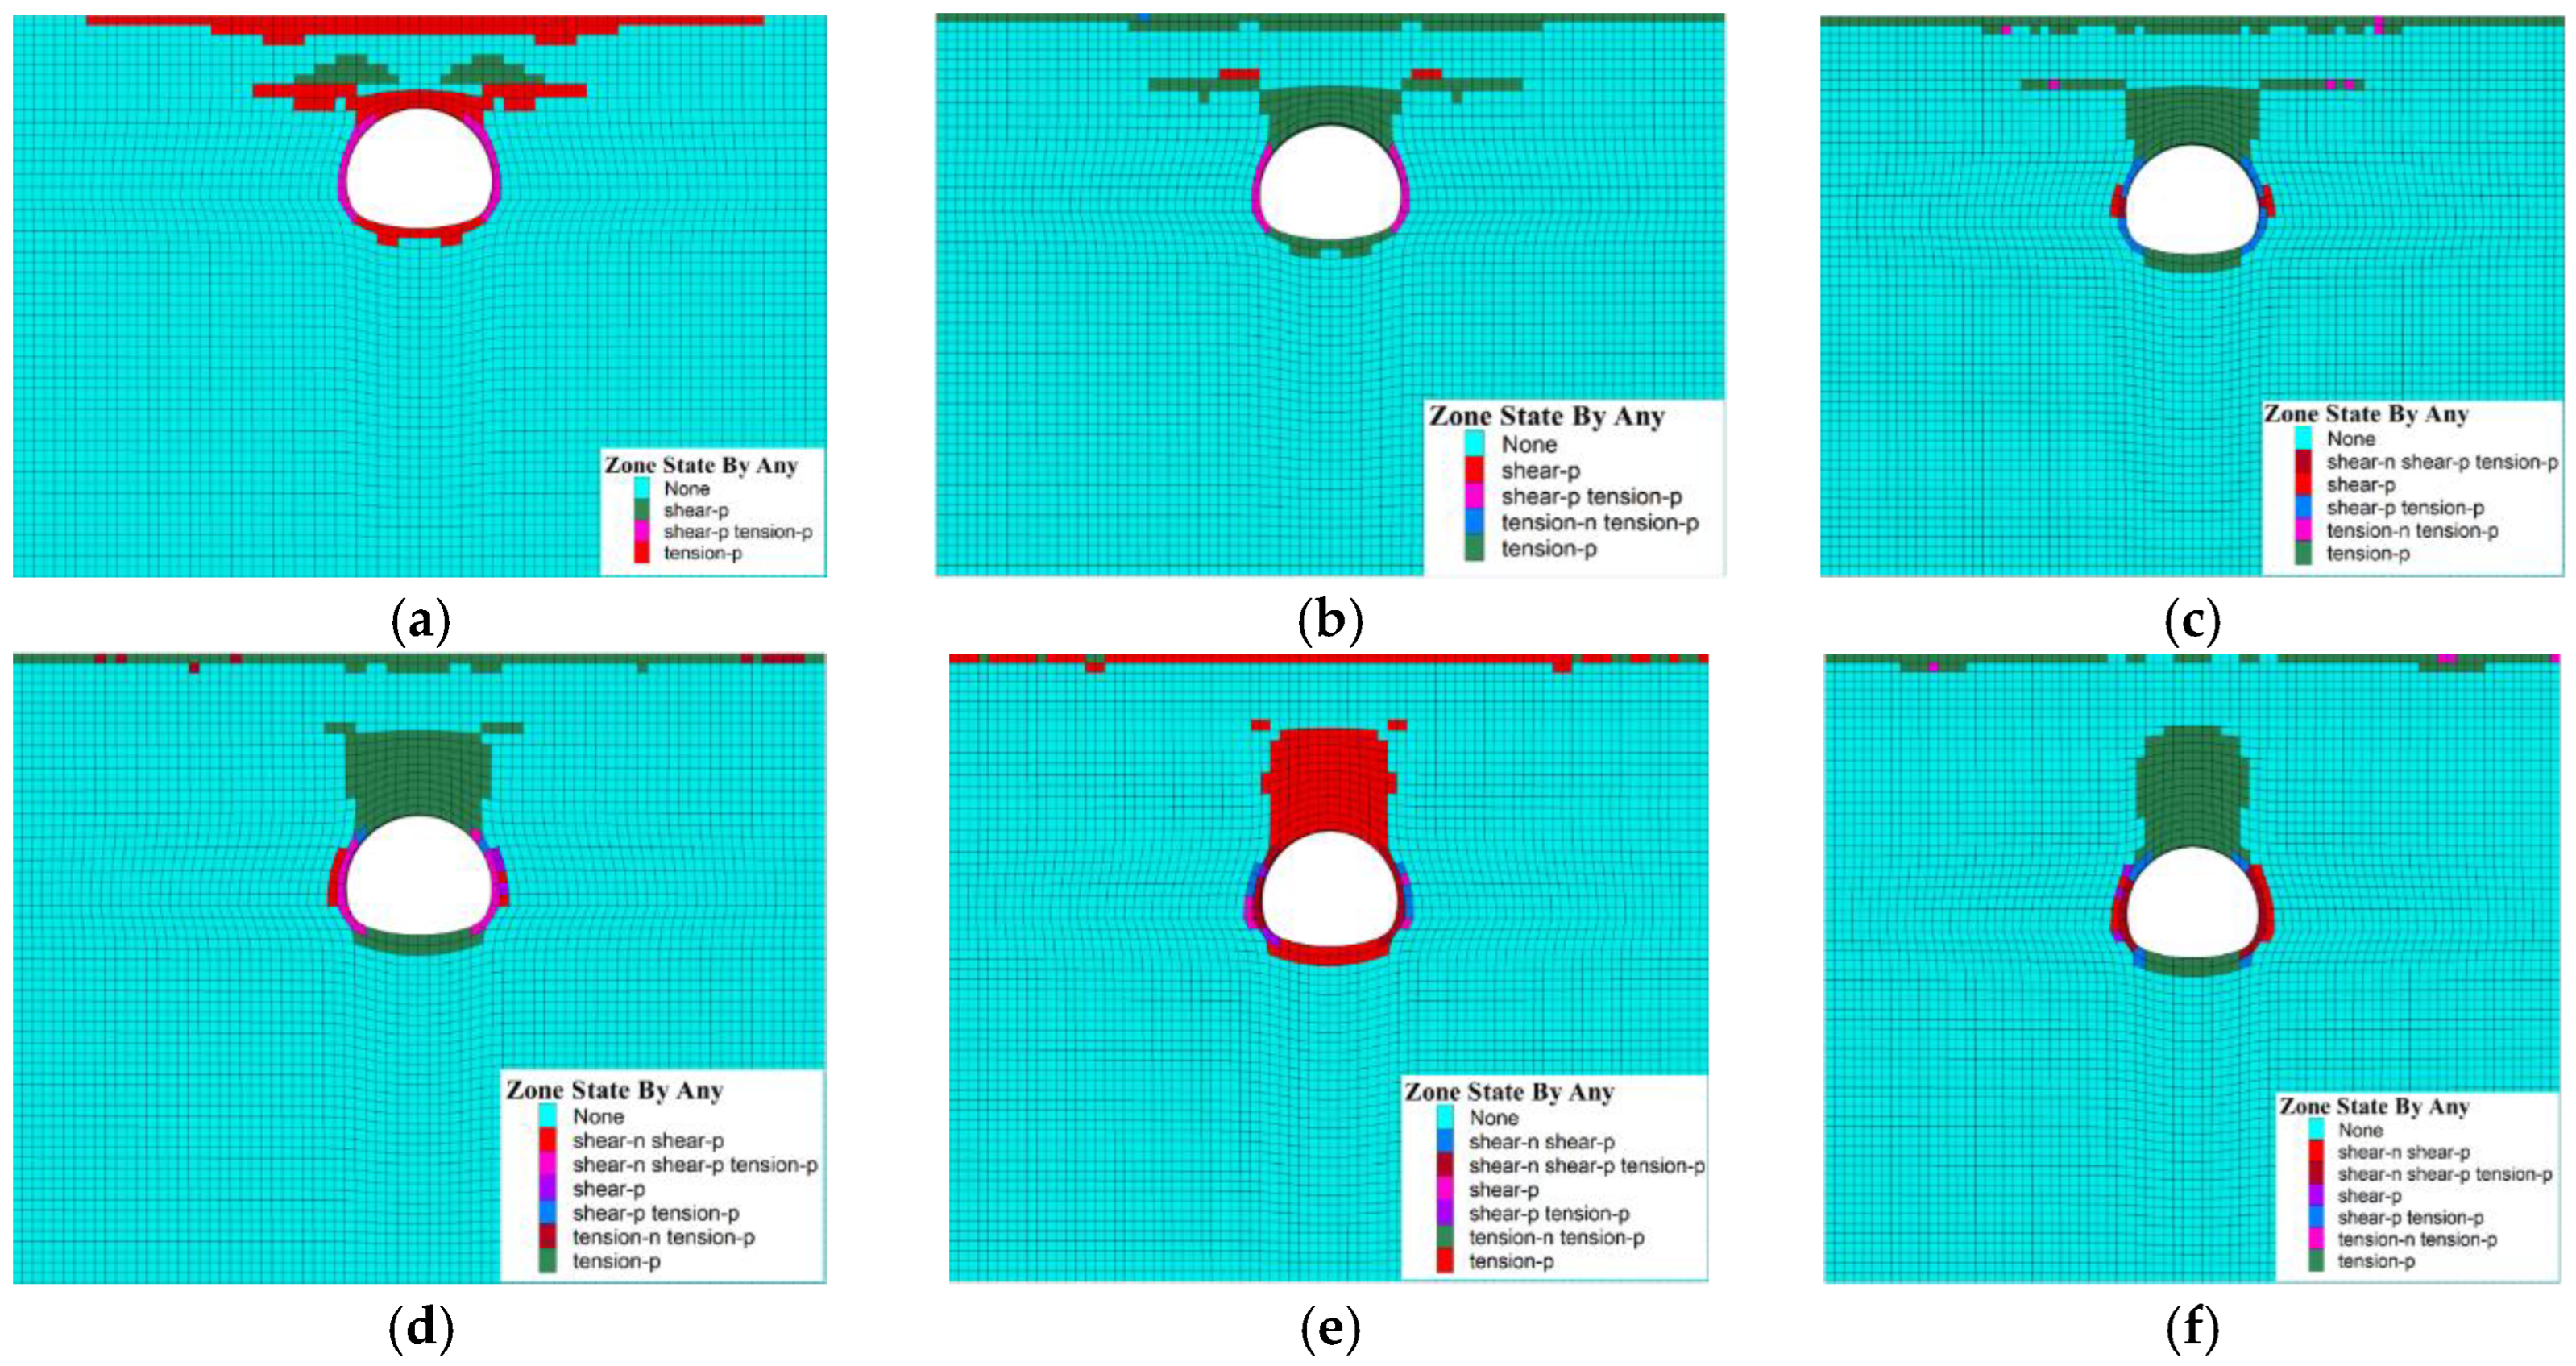
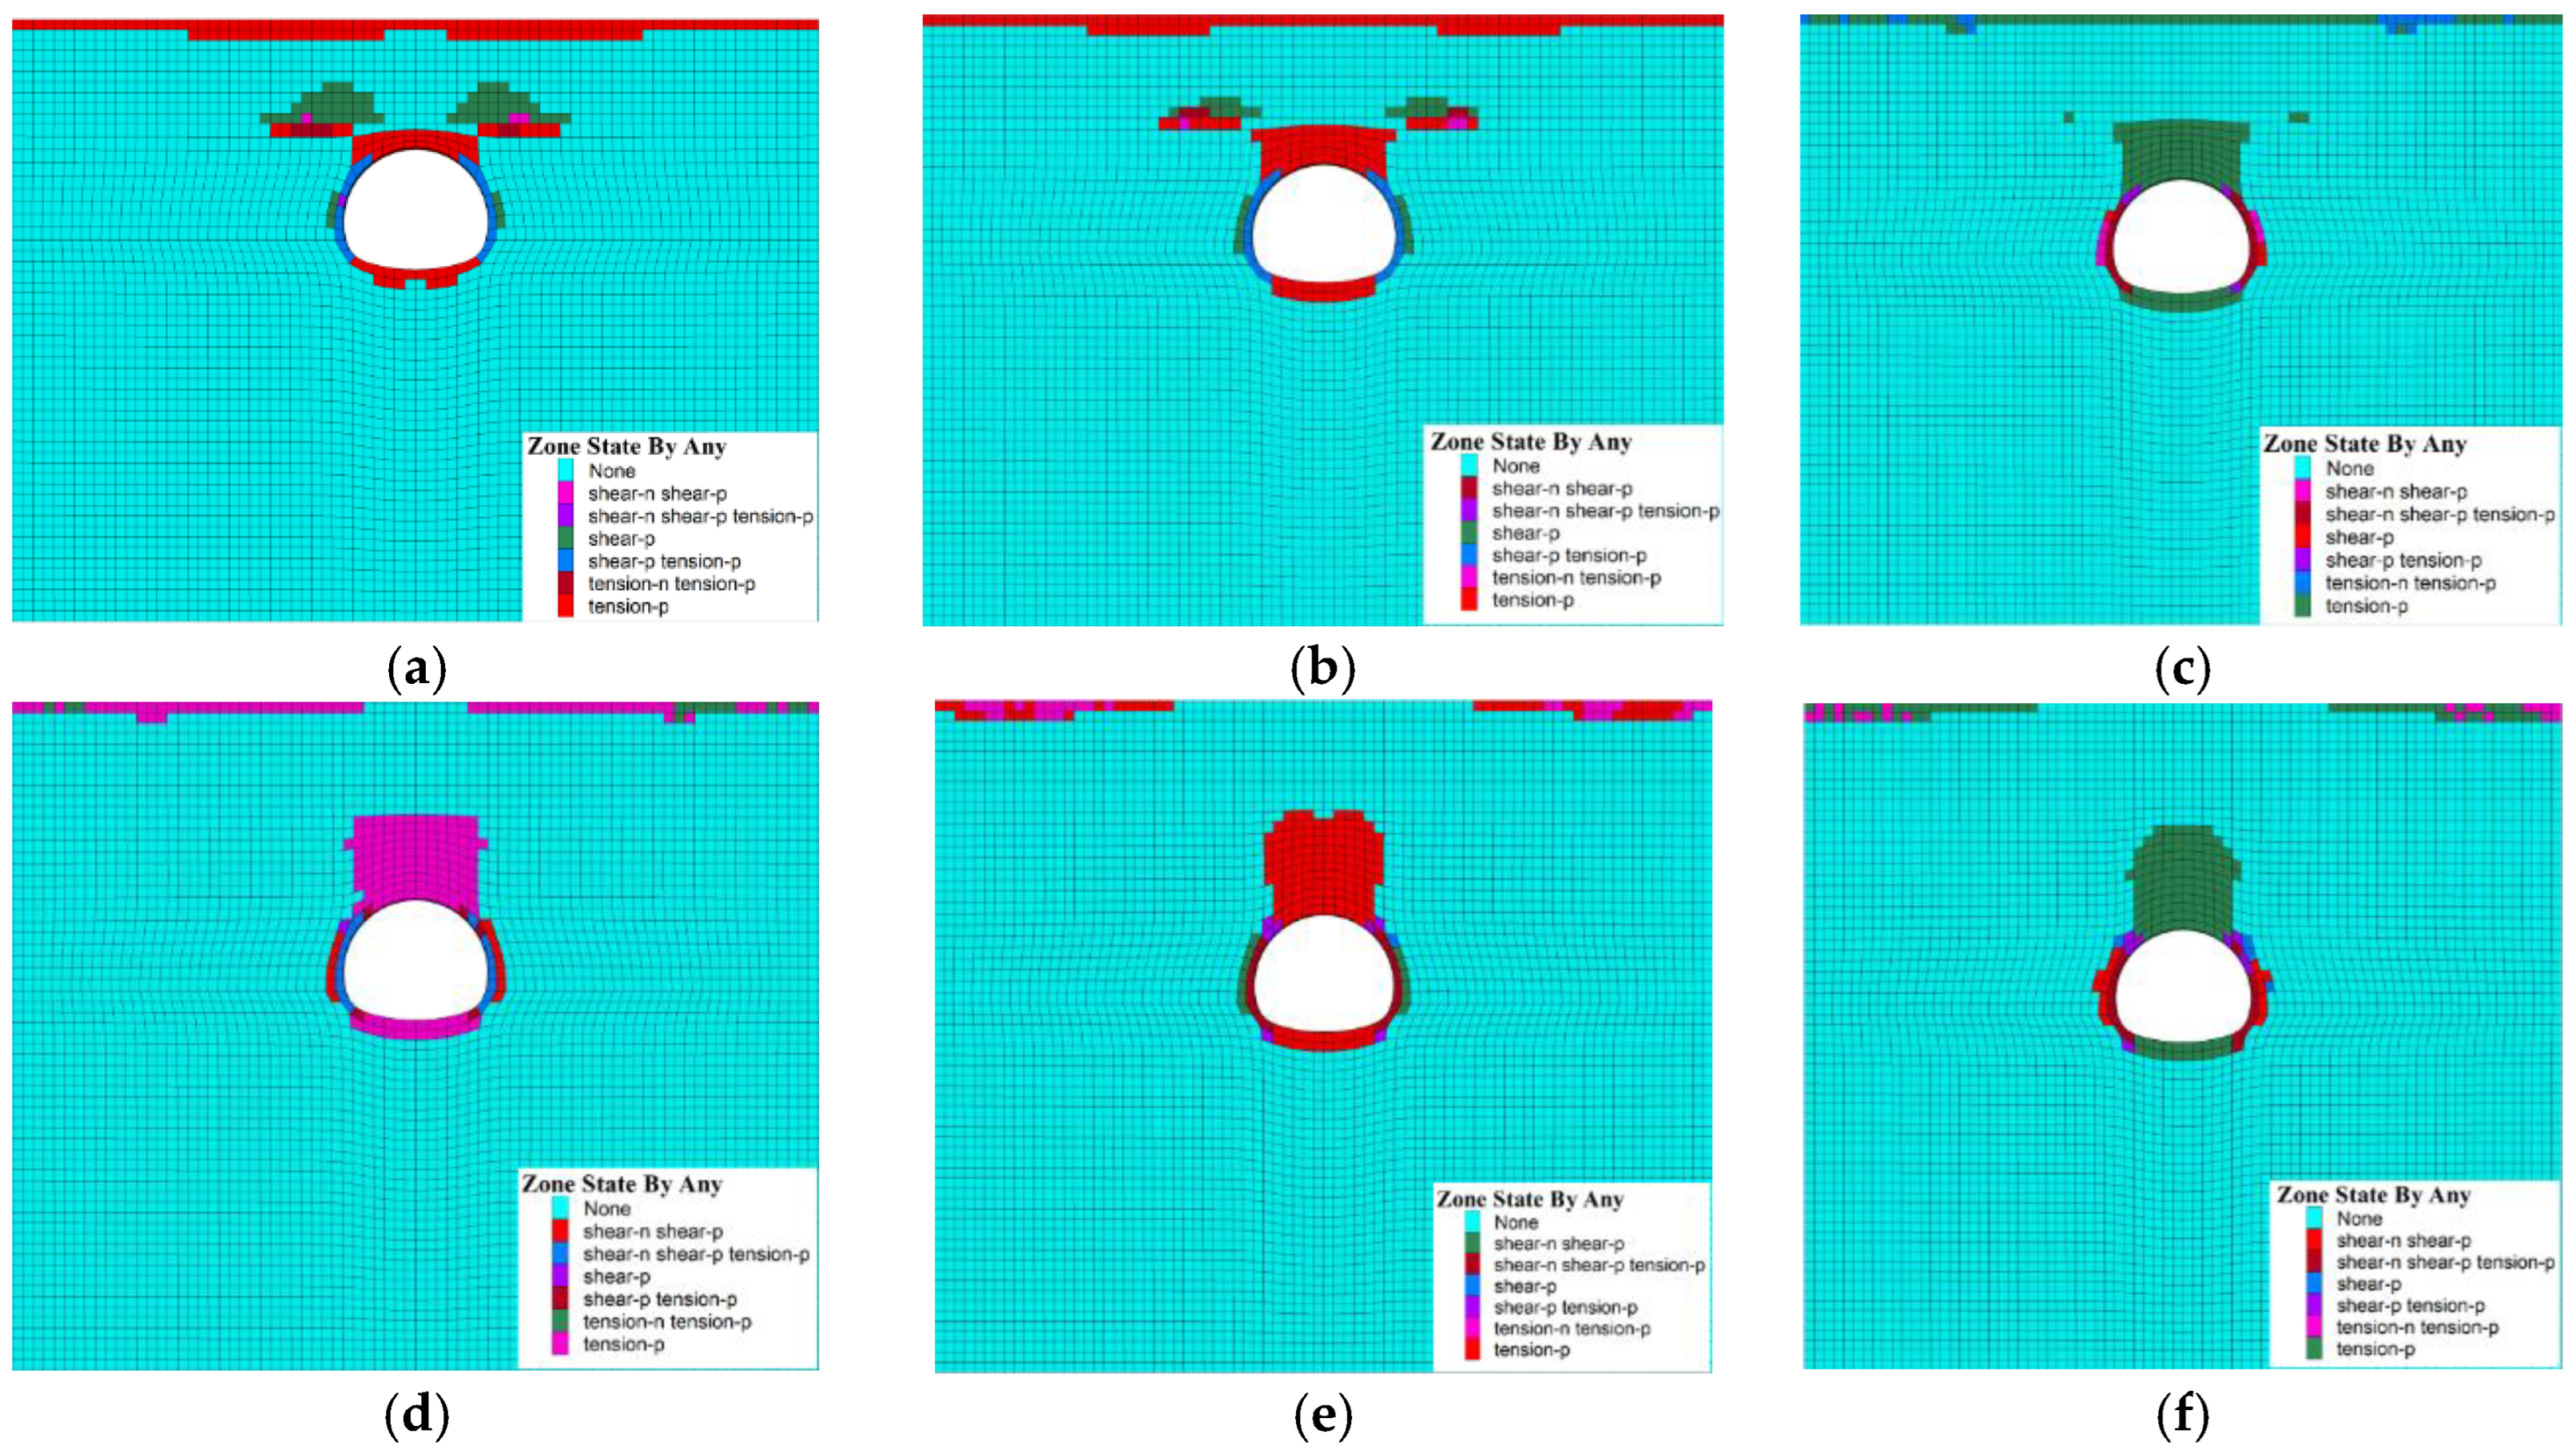
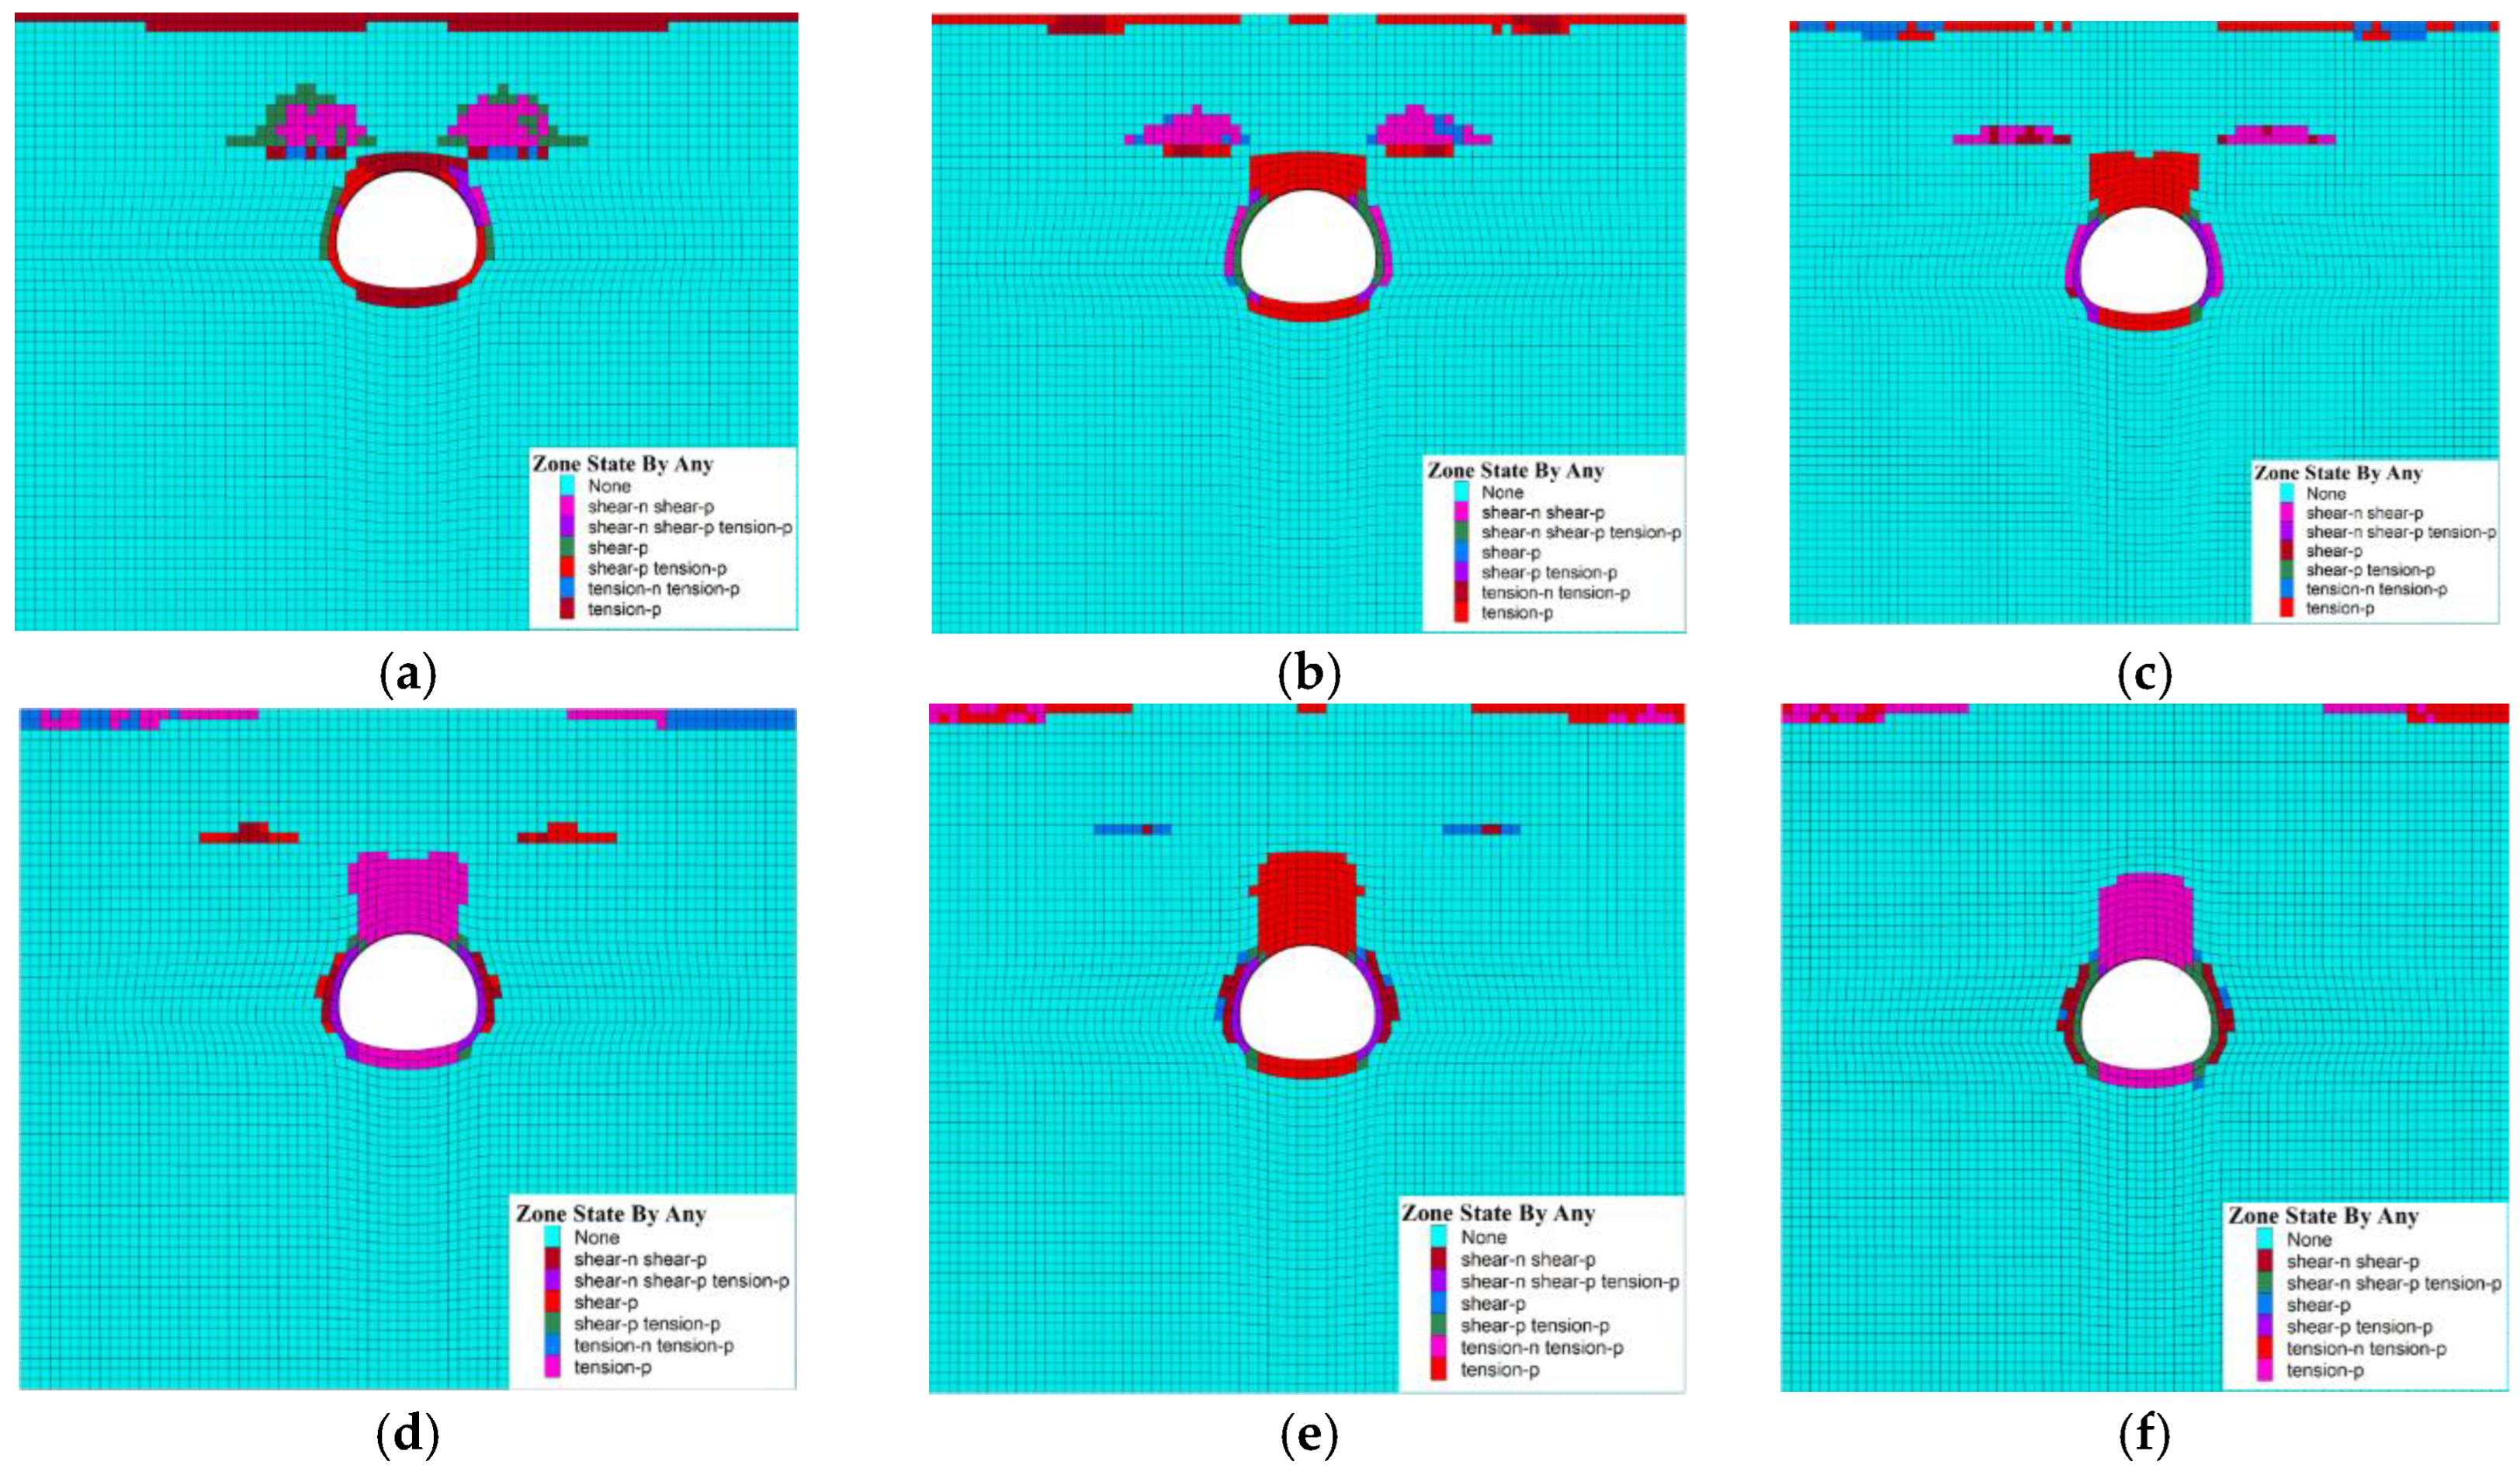
Figure 8, Figure 9, Figure 10 and Figure 11 show the plastic zone contour maps for different overburden thicknesses under four soil layer thicknesses. When the tunnel roof overlying rock thickness is small, the plastic zone in the strata is concentrated at the boundary between soil and rock and the tunnel crown, showing a trend of extension toward the surface. As the overburden thickness increases, the plastic zone at the soil–rock interface and the plastic zone at the tunnel crown tend to separate. When the overburden thickness reaches a certain level, the plastic zone in the surrounding rock occurs only at the tunnel crown, and the area of the plastic zone increases with increasing burial depth. Under all four conditions, as the soil layer thickness increases, the degree of separation of the plastic zones in the upper and lower parts intensifies, concentrating more around the crown. Therefore, for tunnels in soil–rock composite strata, the surrounding rock between the upper soil layer and the tunnel crown is the key area for deformation and failure.
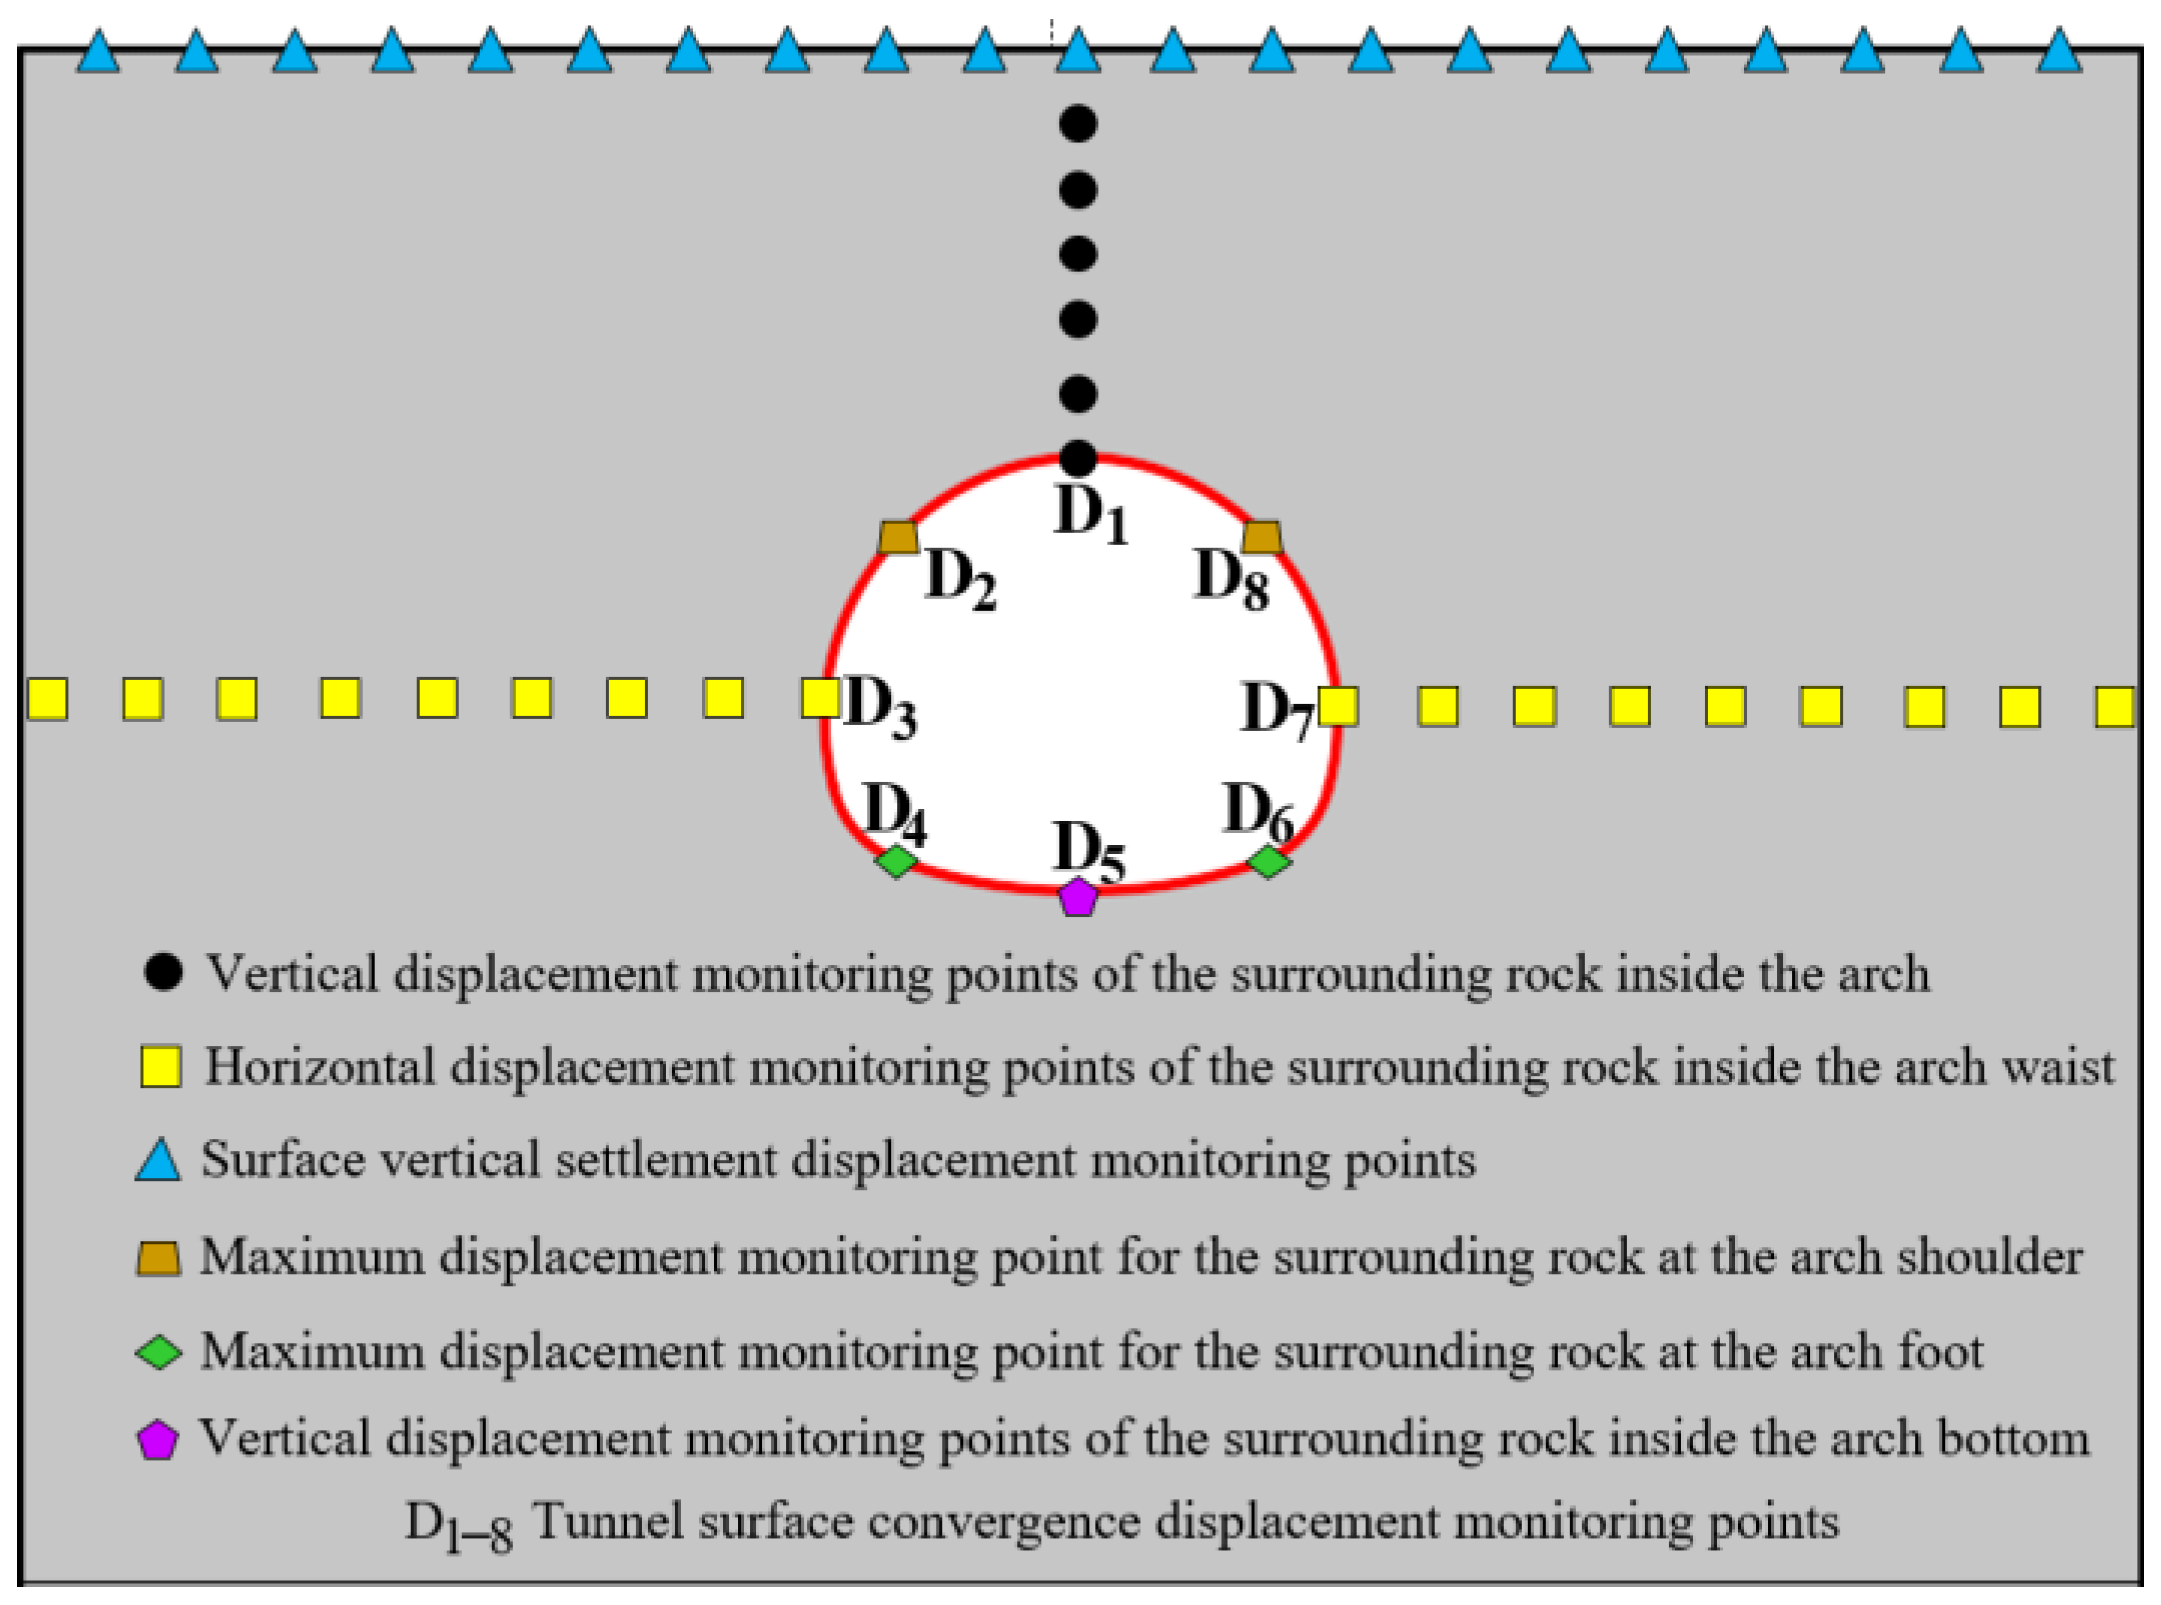
In the numerical simulation process, in order to further investigate the impact of overburden thickness on the deformation and failure of surrounding rock around the tunnel, a series of measurement points were set at the upper surface of the tunnel calculation model, tunnel surface location, the area between the tunnel crown and the ground surface, and the tunnel arch waist and bottom to the surrounding rock, as shown in Figure 12. Based on this, vertical surface settlement displacement, tunnel surrounding surface convergence displacement, vertical displacement of surrounding rock inside the crown, and horizontal displacement of surrounding rock inside the arch waist were extracted. The deformation calculation results of the surrounding rock were plotted, as shown in Figure 13, Figure 14, Figure 15, Figure 16 and Figure 17.
(1)
Vertical settlement displacement on the surface
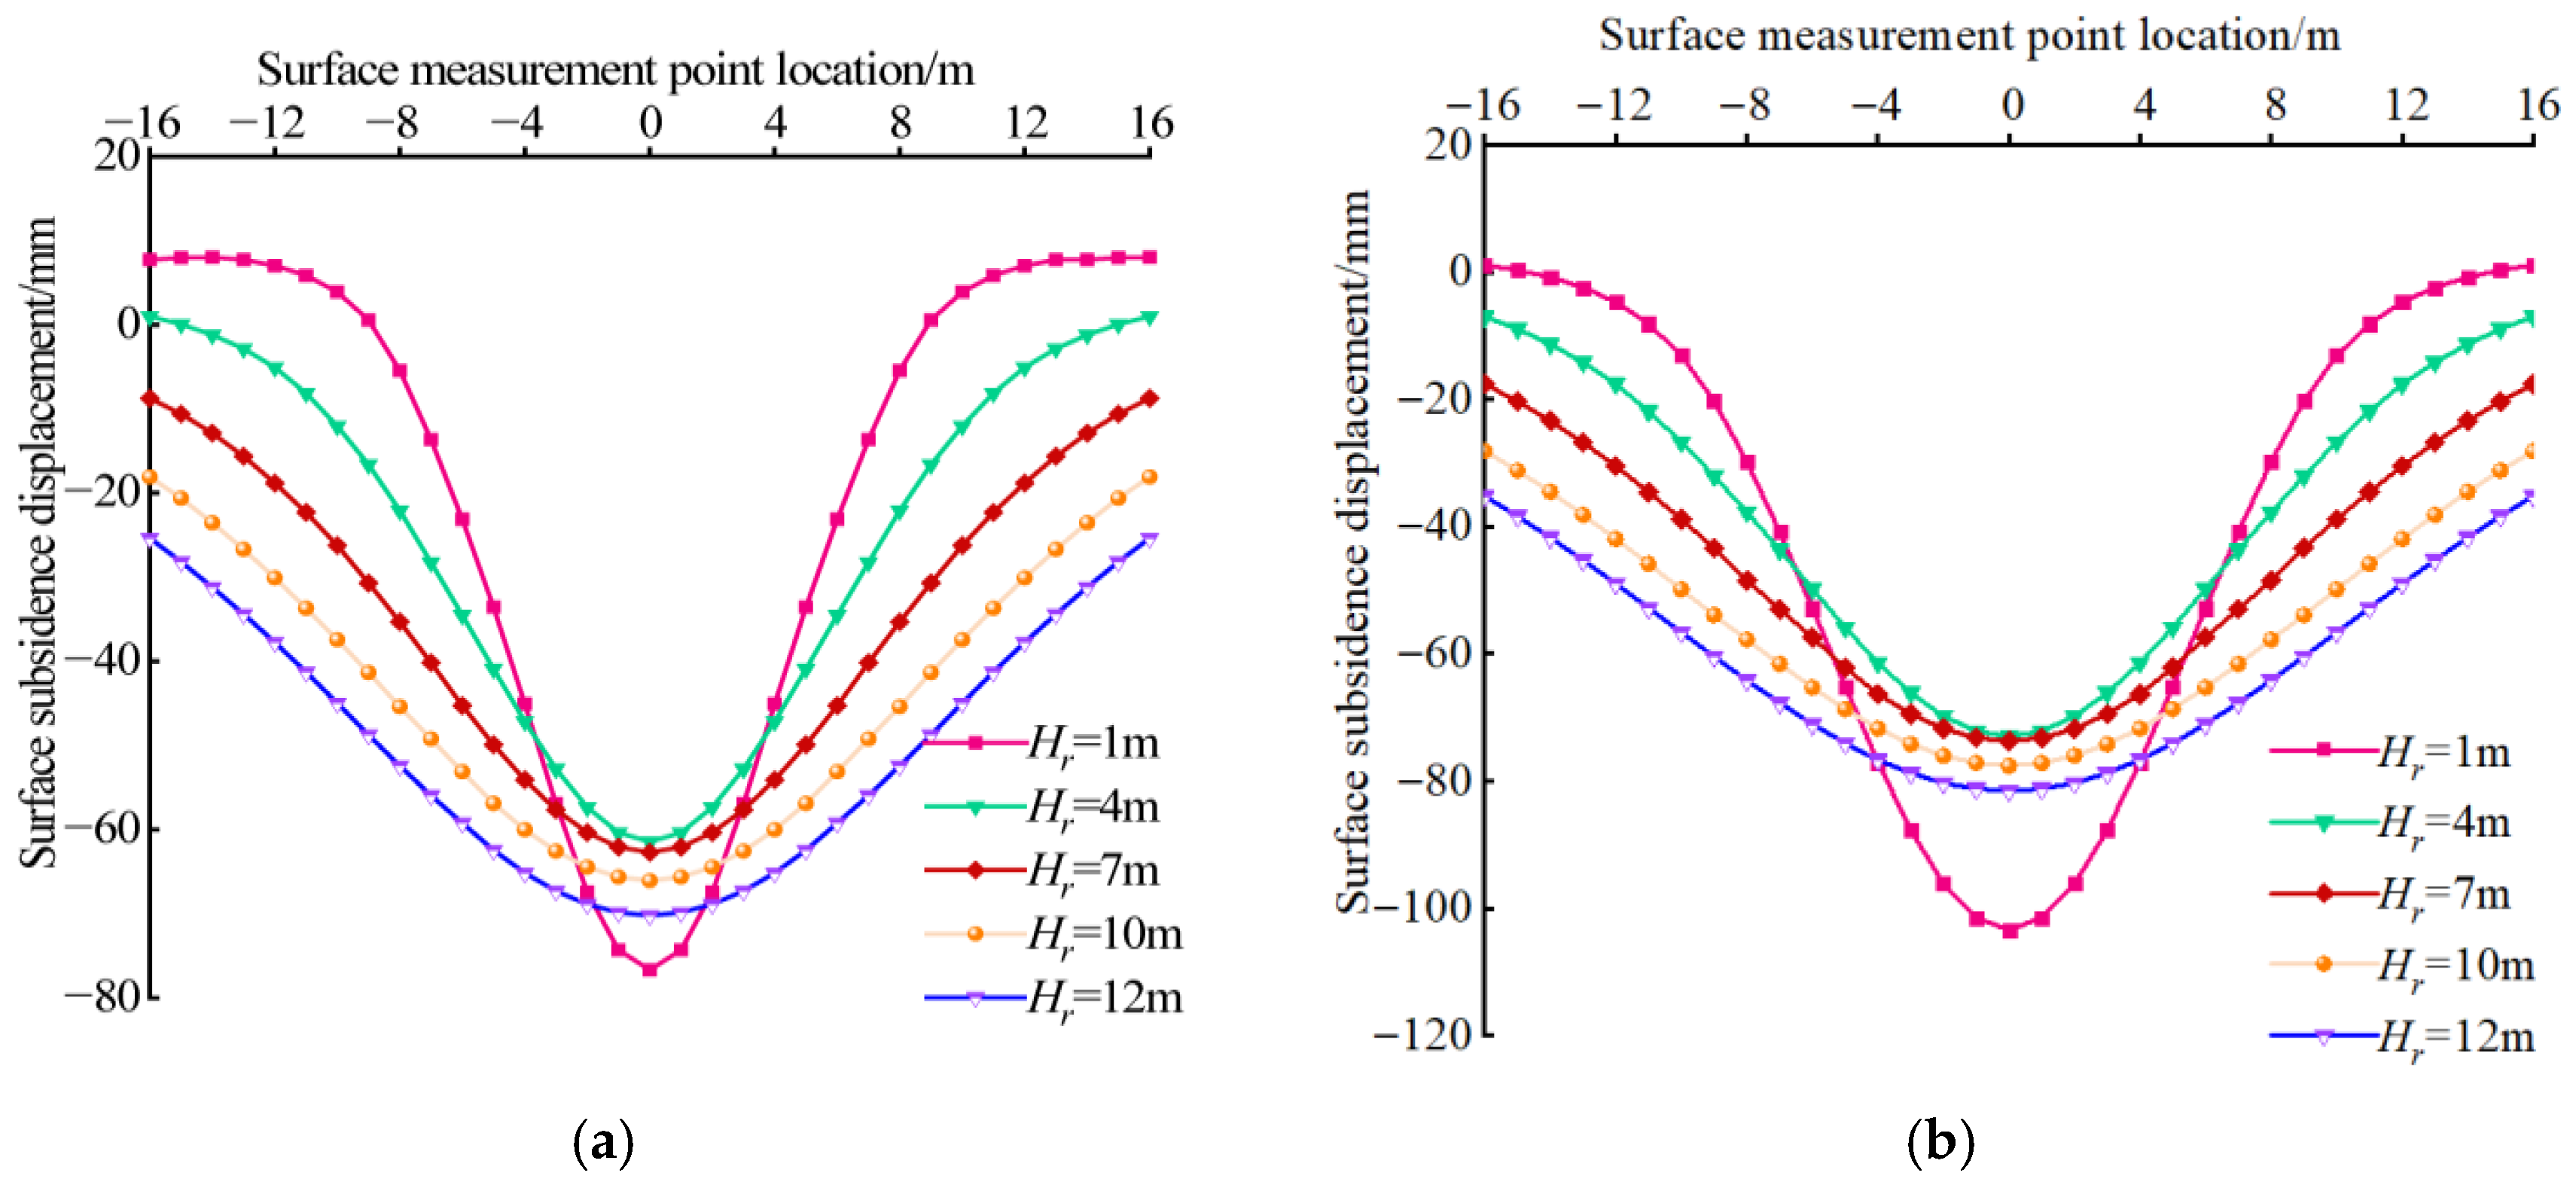
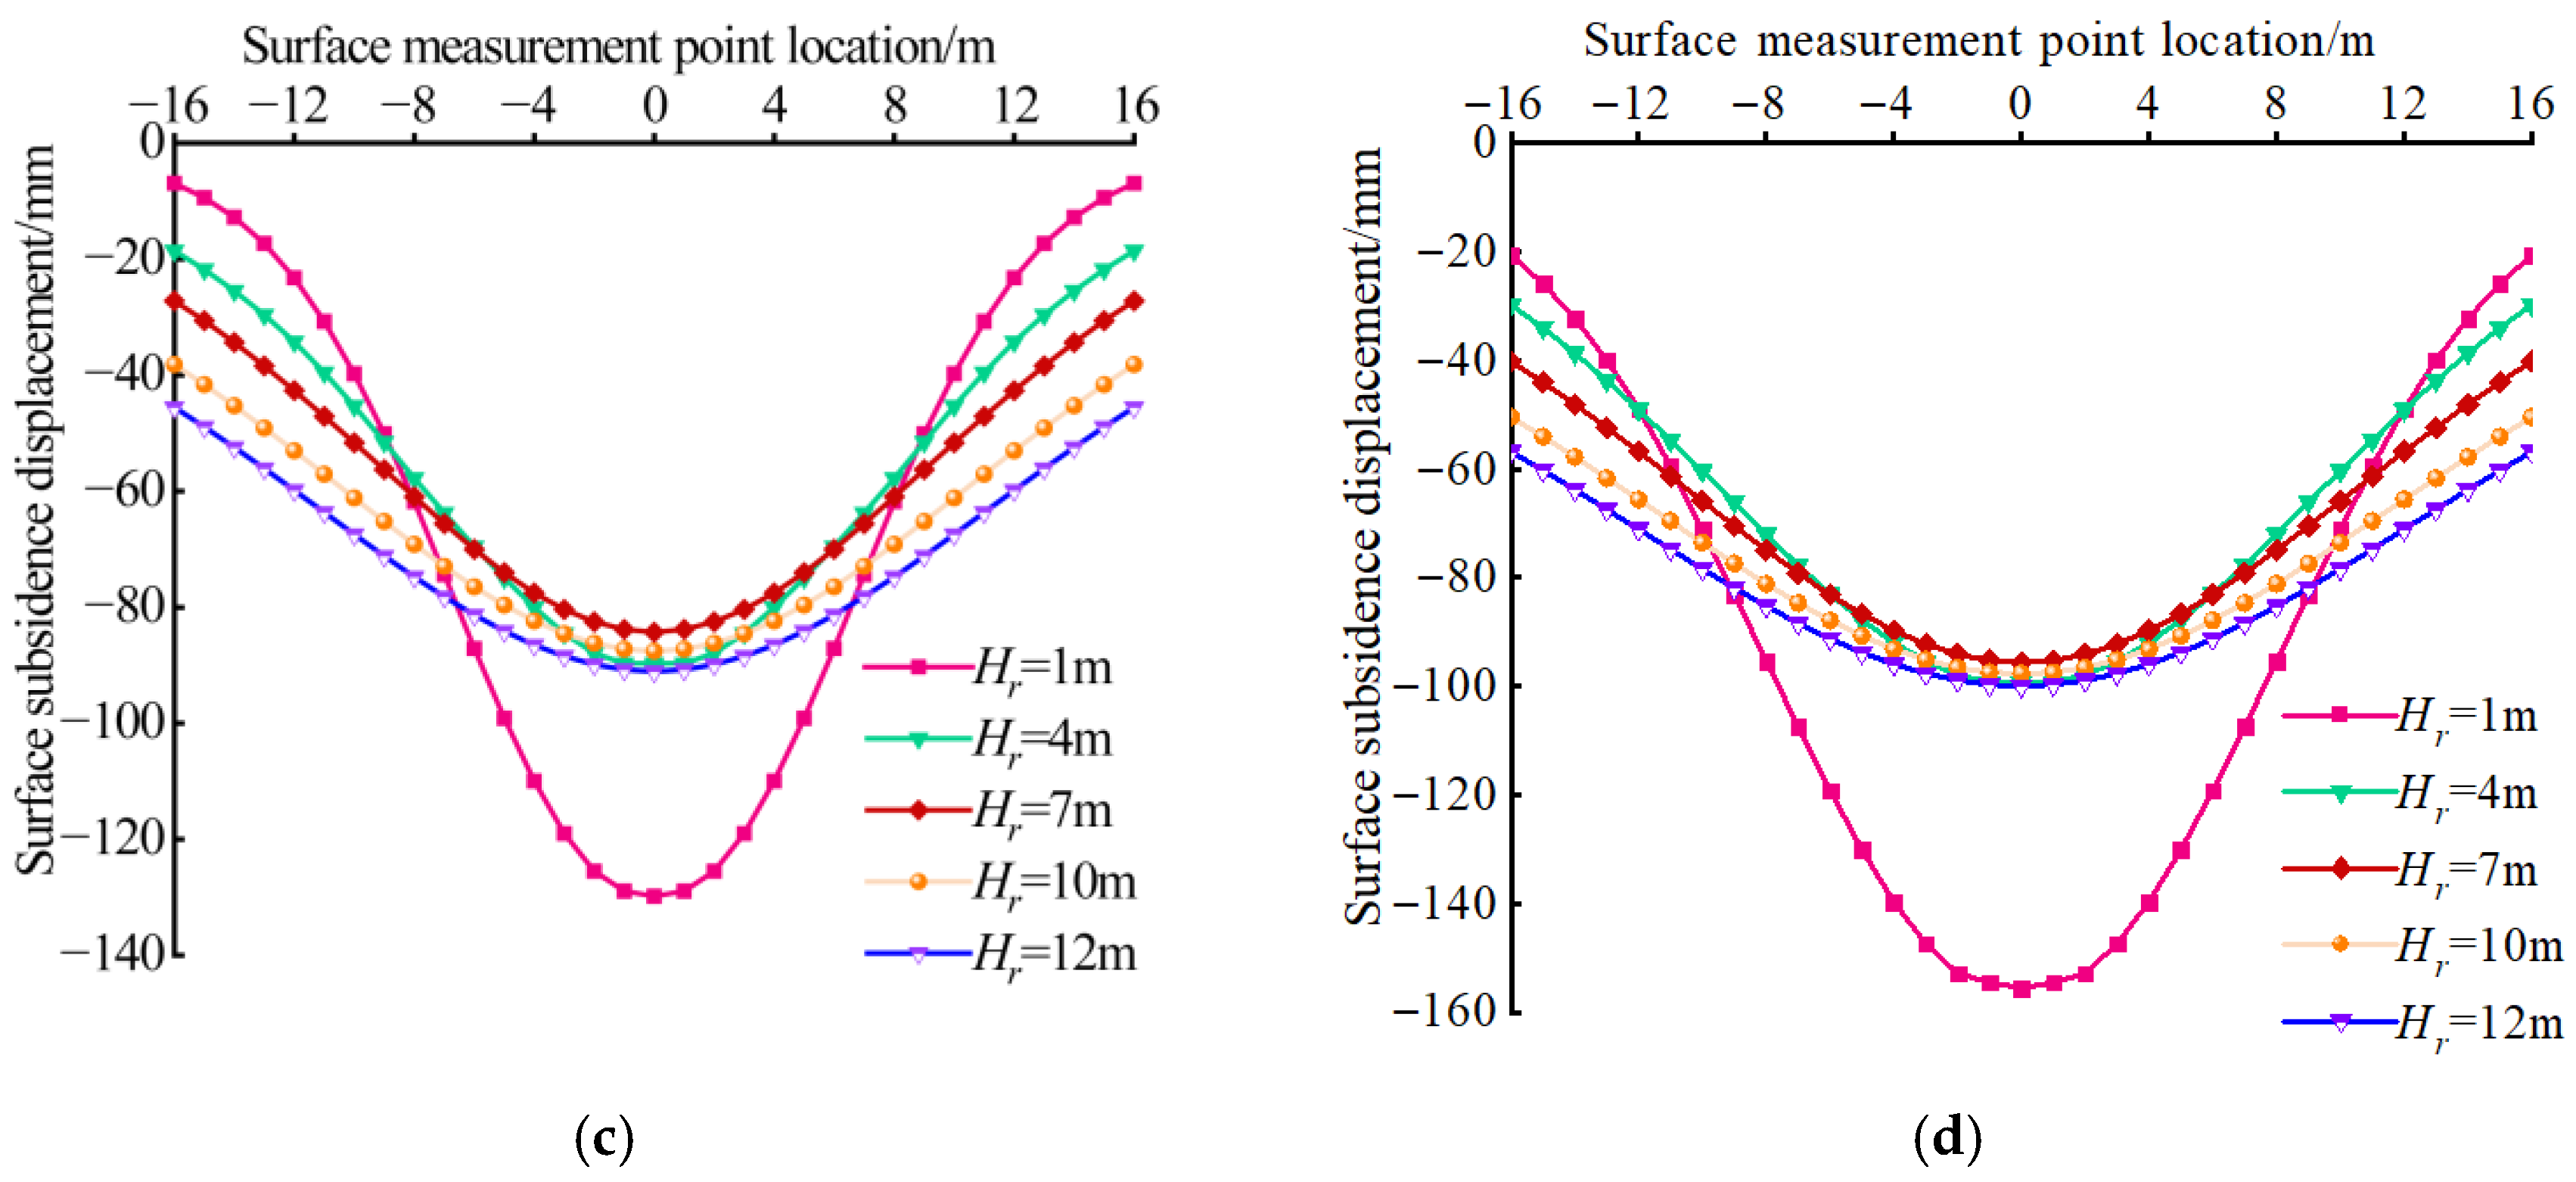
As shown in Figure 12, due to the excavation of the lower tunnel, the vertical settlement curve on the surface exhibits a U-shape. Specifically, the settlement is largest at the center and gradually decreases toward both sides. When the roof overlying rock thickness is small, such as 1 m, the settlement displacement and the settlement range near the center of the surface are the largest. As the overburden thickness increases, the settlement displacement at the center of the surface decreases, and the settlement curve gradually flattens. When the overburden thickness exceeds a certain value, with an increase in tunnel depth, the settlement displacement at the center of the surface starts to gradually increase again. For locations far from the tunnel on both horizontal sides of the surface, the corresponding surface settlement values show a gradual increase with the increase in overburden thickness. The variation in settlement displacement at the center of the surface indicates that the overburden thickness has a significant impact on the stability of the surrounding rock. In all four soil thickness conditions, there is an optimal overburden thickness at which the vertical settlement at the surface center is minimized.
(2)
Convergence Displacement of Tunnel Surrounding Surface
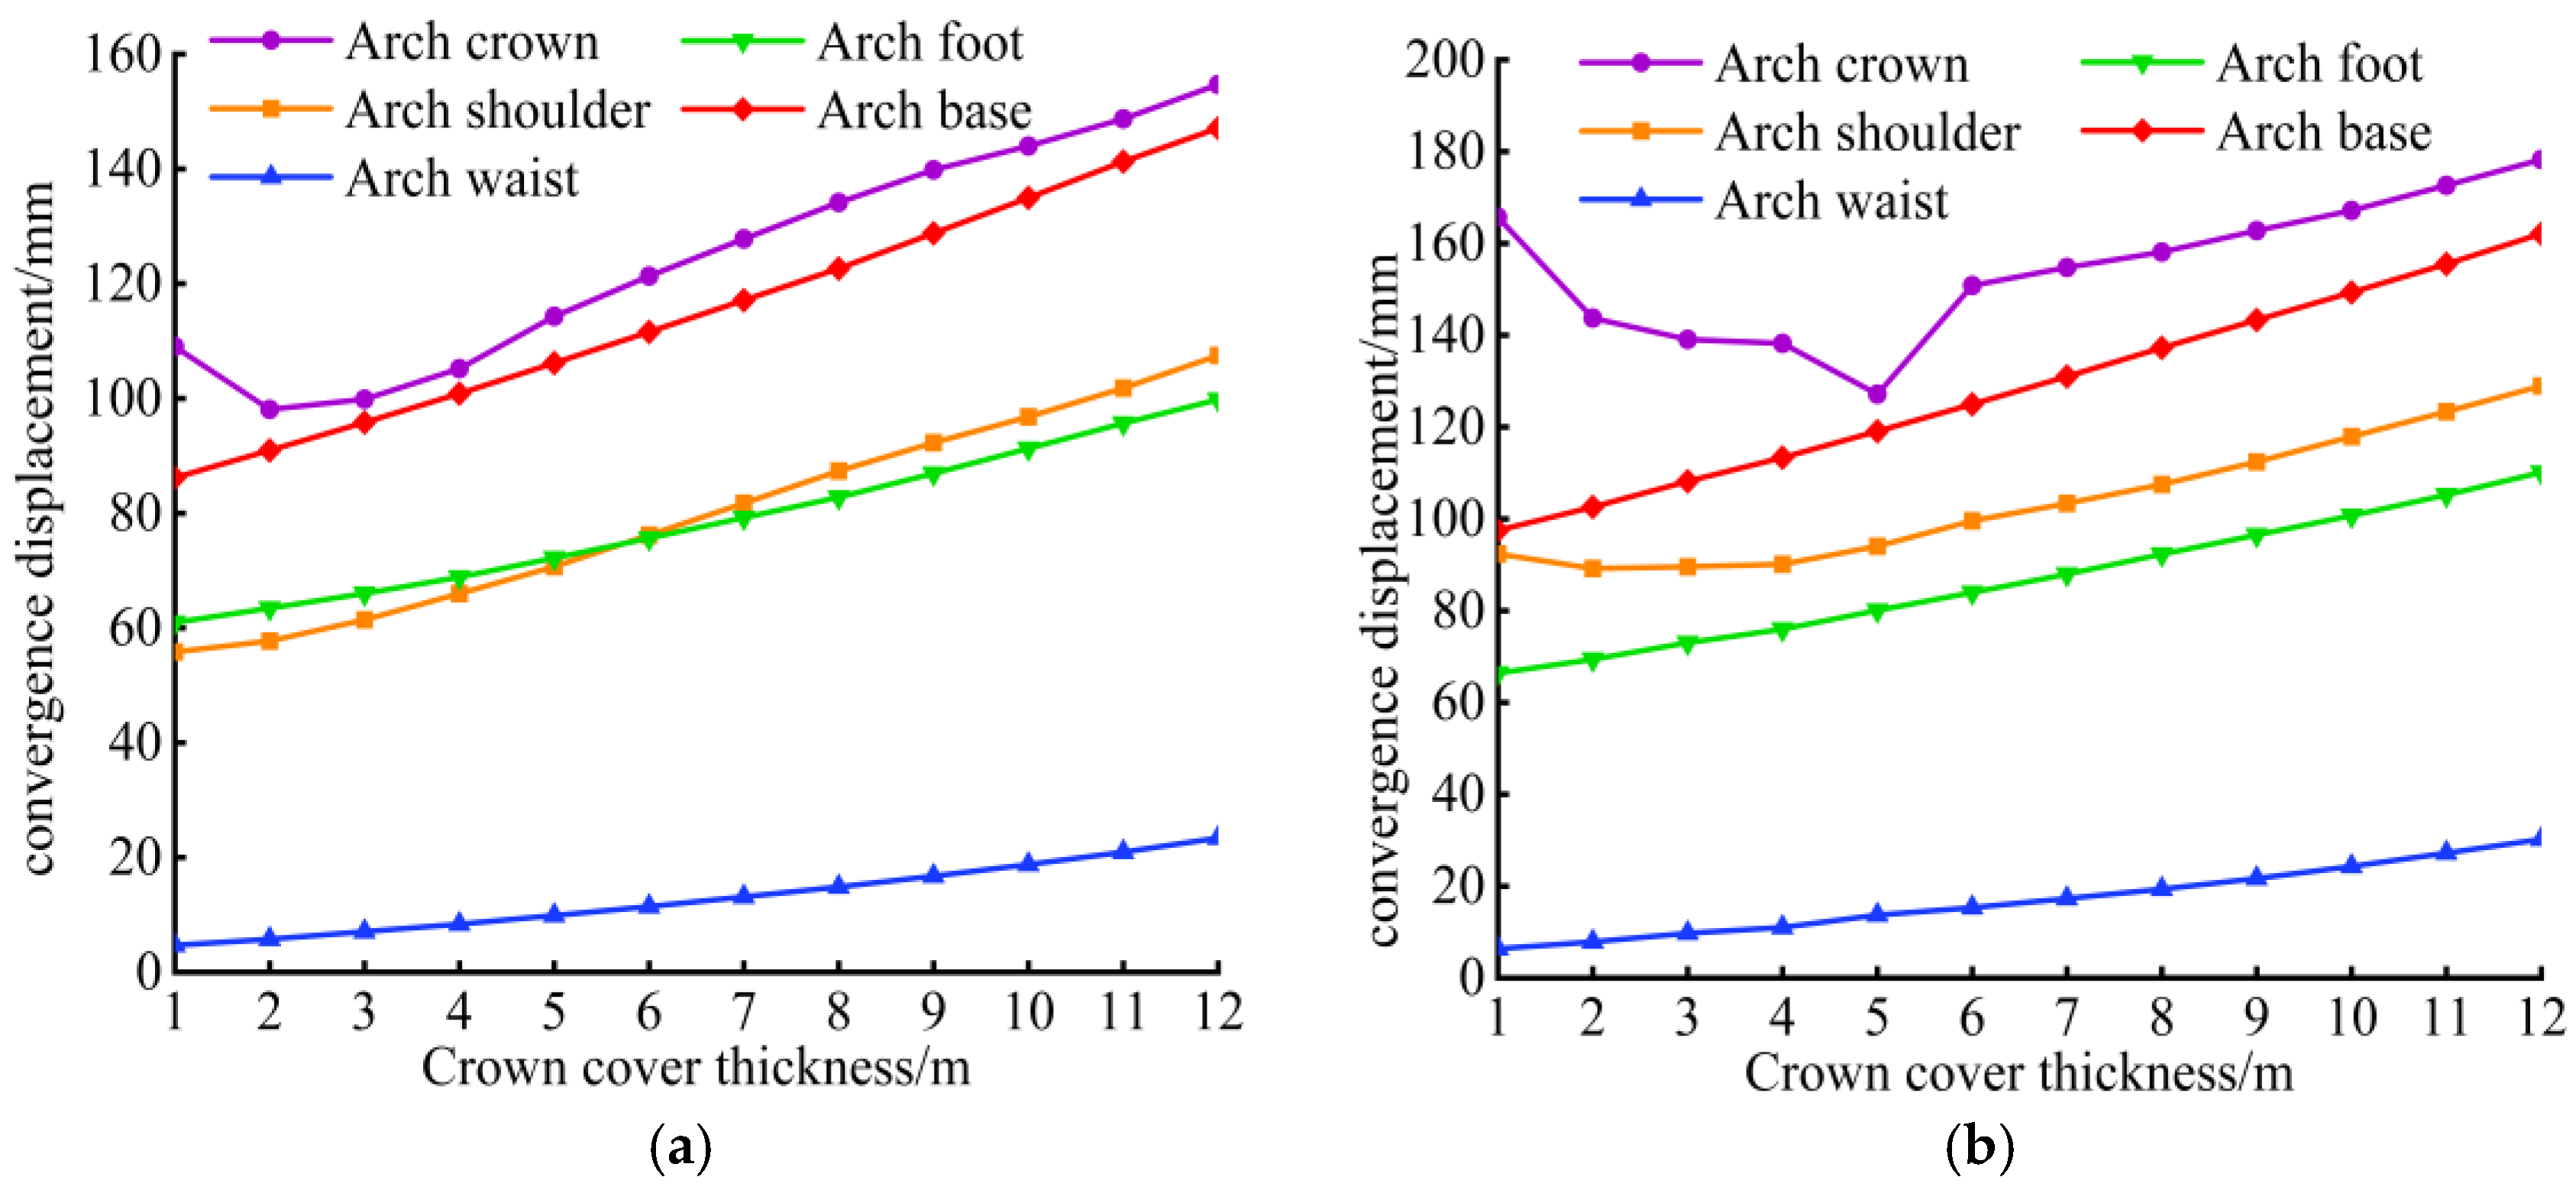
The convergence displacements of the tunnel surface at measurement points D1 to D8 along the tunnel surface were extracted. Figure 14 shows the variation curve of tunnel surface convergence with overburden thickness. From Figure 14, it can be observed that for tunnels in soil–rock composite strata, the convergence displacement at the tunnel crown is significantly larger than at other locations. The displacement at the tunnel bottom is the second largest, while the crown waist shows the smallest convergence deformation. This indicates that the tunnel crown is the key location for tunnel surrounding rock deformation and failure in soil–rock strata tunnels. Moreover, as the overlying soil layer thickness increases, the overall convergence deformation of the tunnel surrounding surface increases. When the upper soil layer thickness remains constant, the convergence displacement at the tunnel crown first decreases and then increases as the thickness of the roof overlying rock increases. The convergence displacements at the crown waist, crown foot, and tunnel bottom continuously increase. For the convergence deformation at the tunnel shoulder, when the upper soil layer thickness is small, the deformation tends to increase with the increase of overburden thickness. However, when the upper soil layer thickness is large, the deformation first decreases and then increases. The trend of convergence displacement at the tunnel crown indirectly confirms the existence of an optimal overburden thickness range.
(3)
Vertical Displacement of the Roof Surrounding Rock
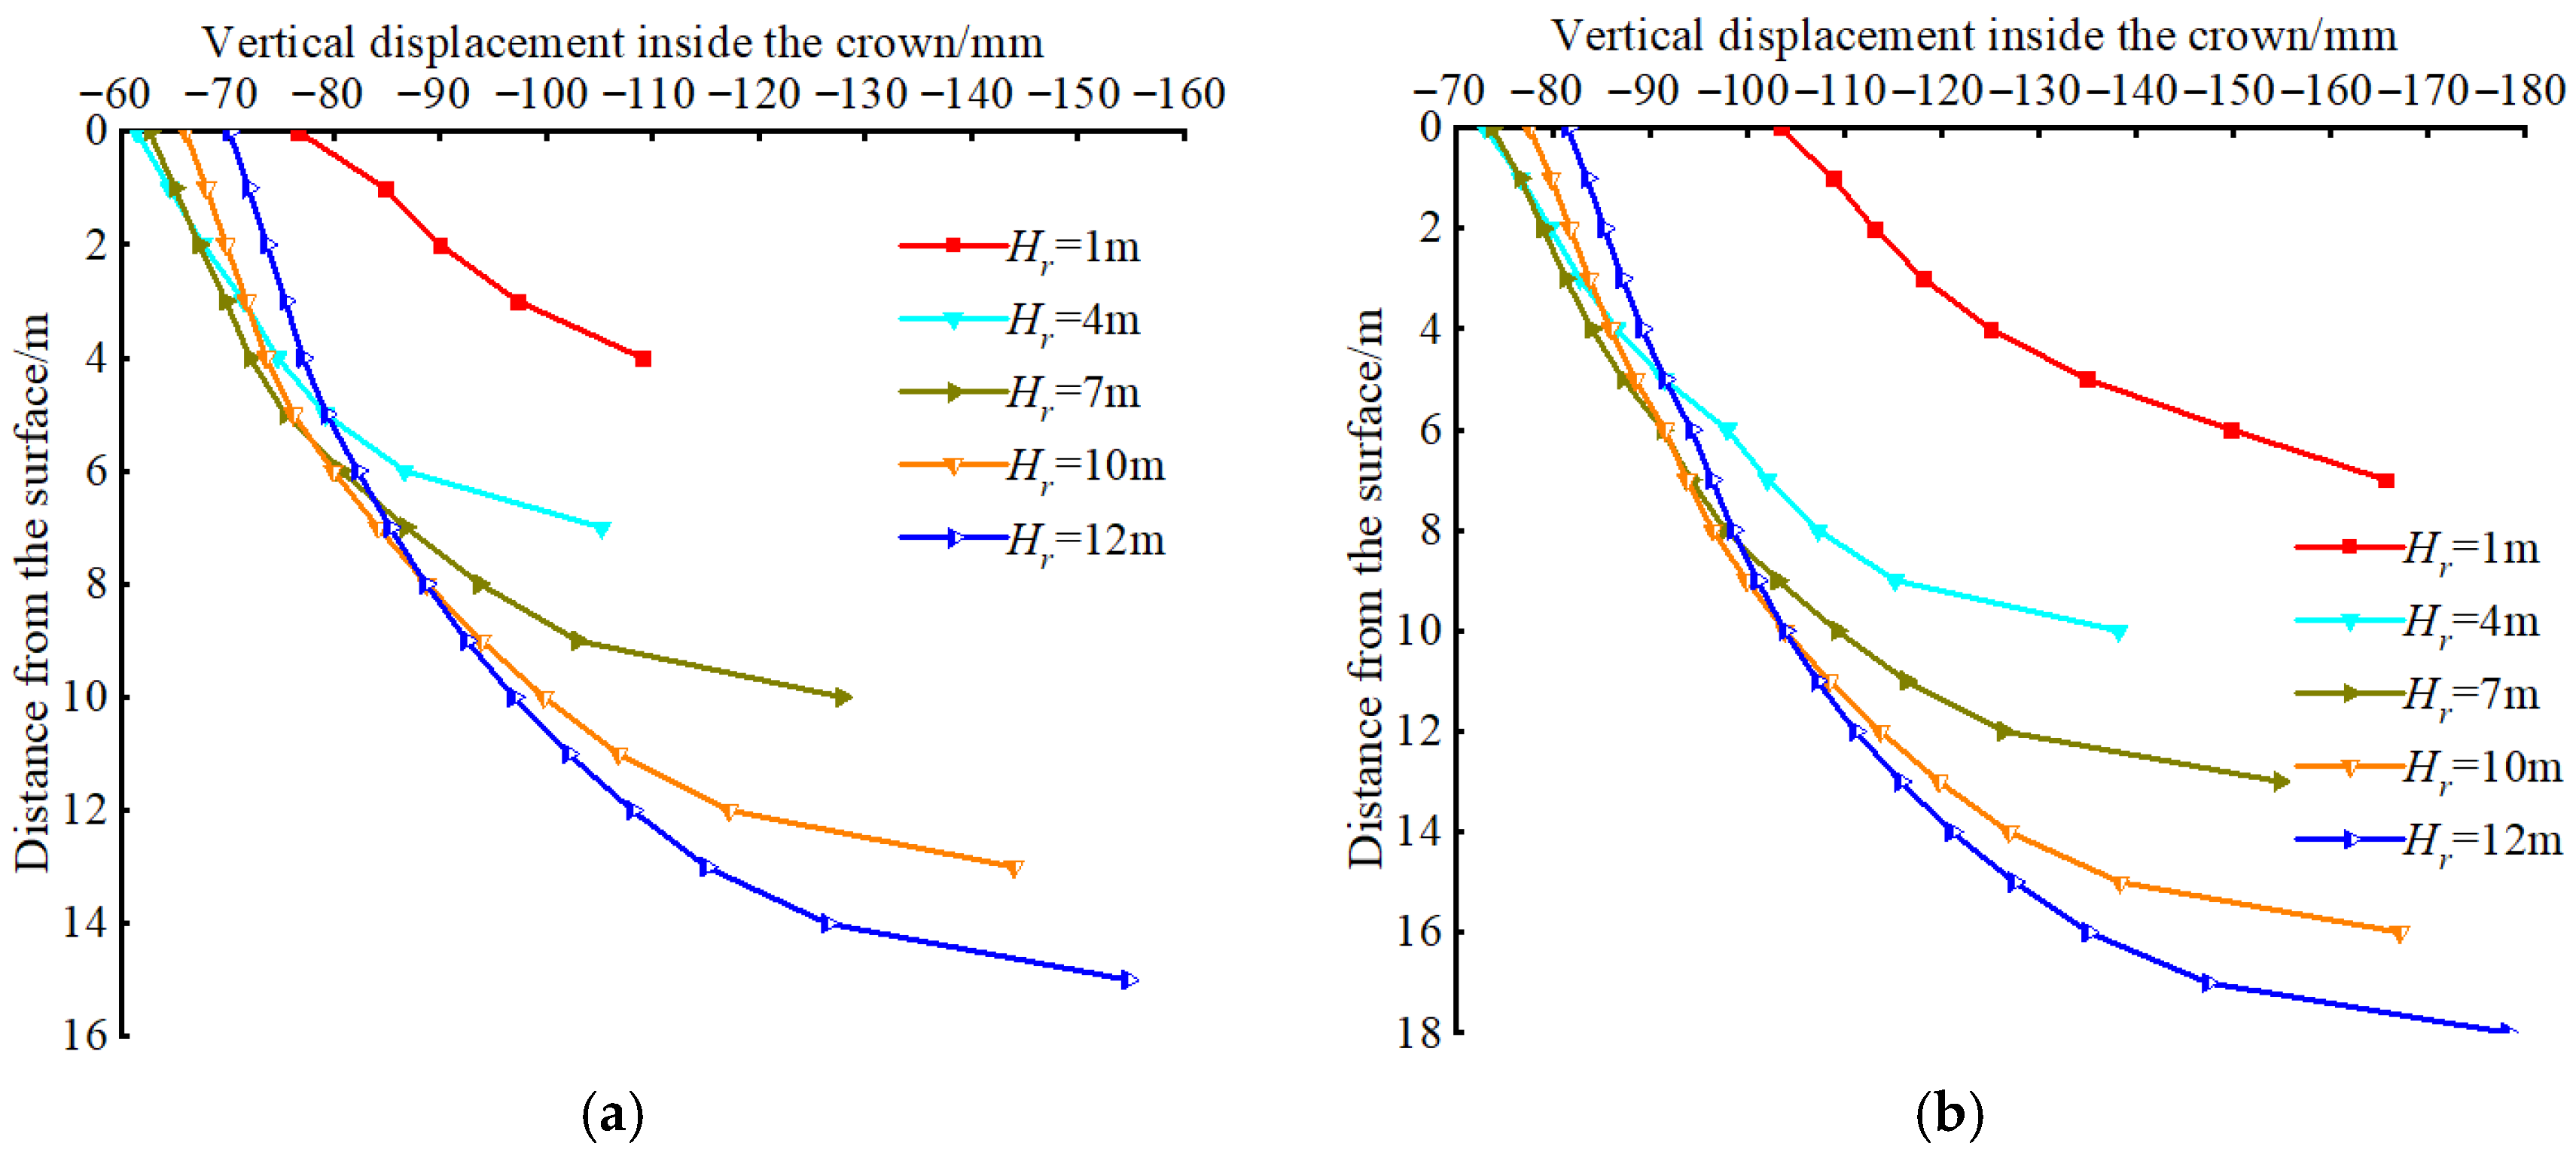
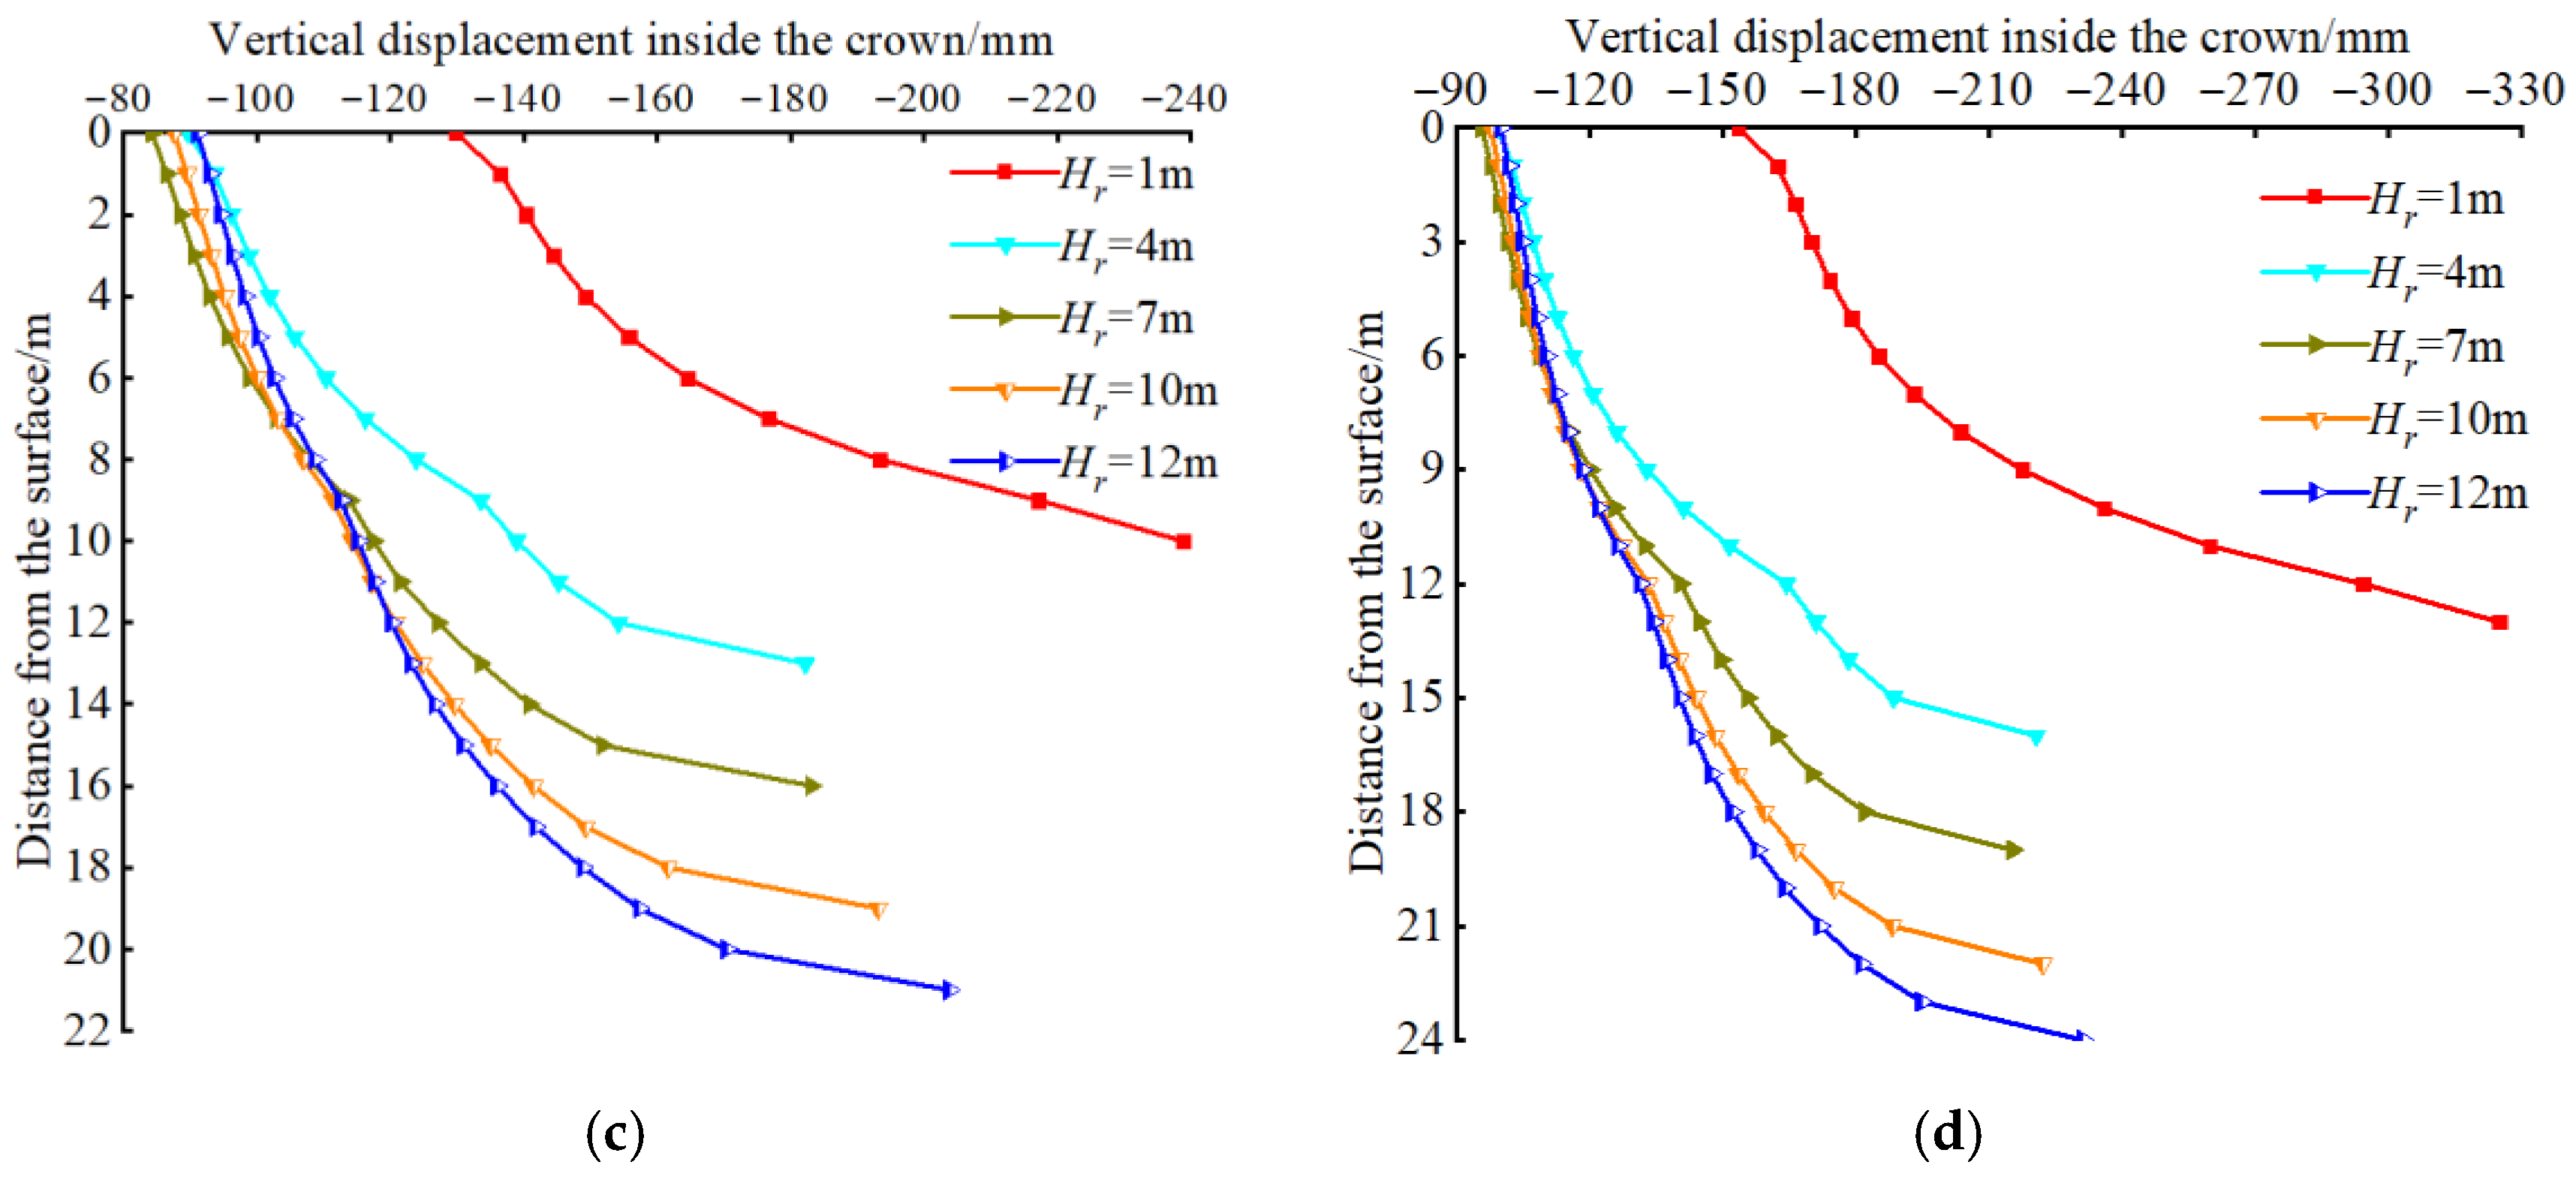
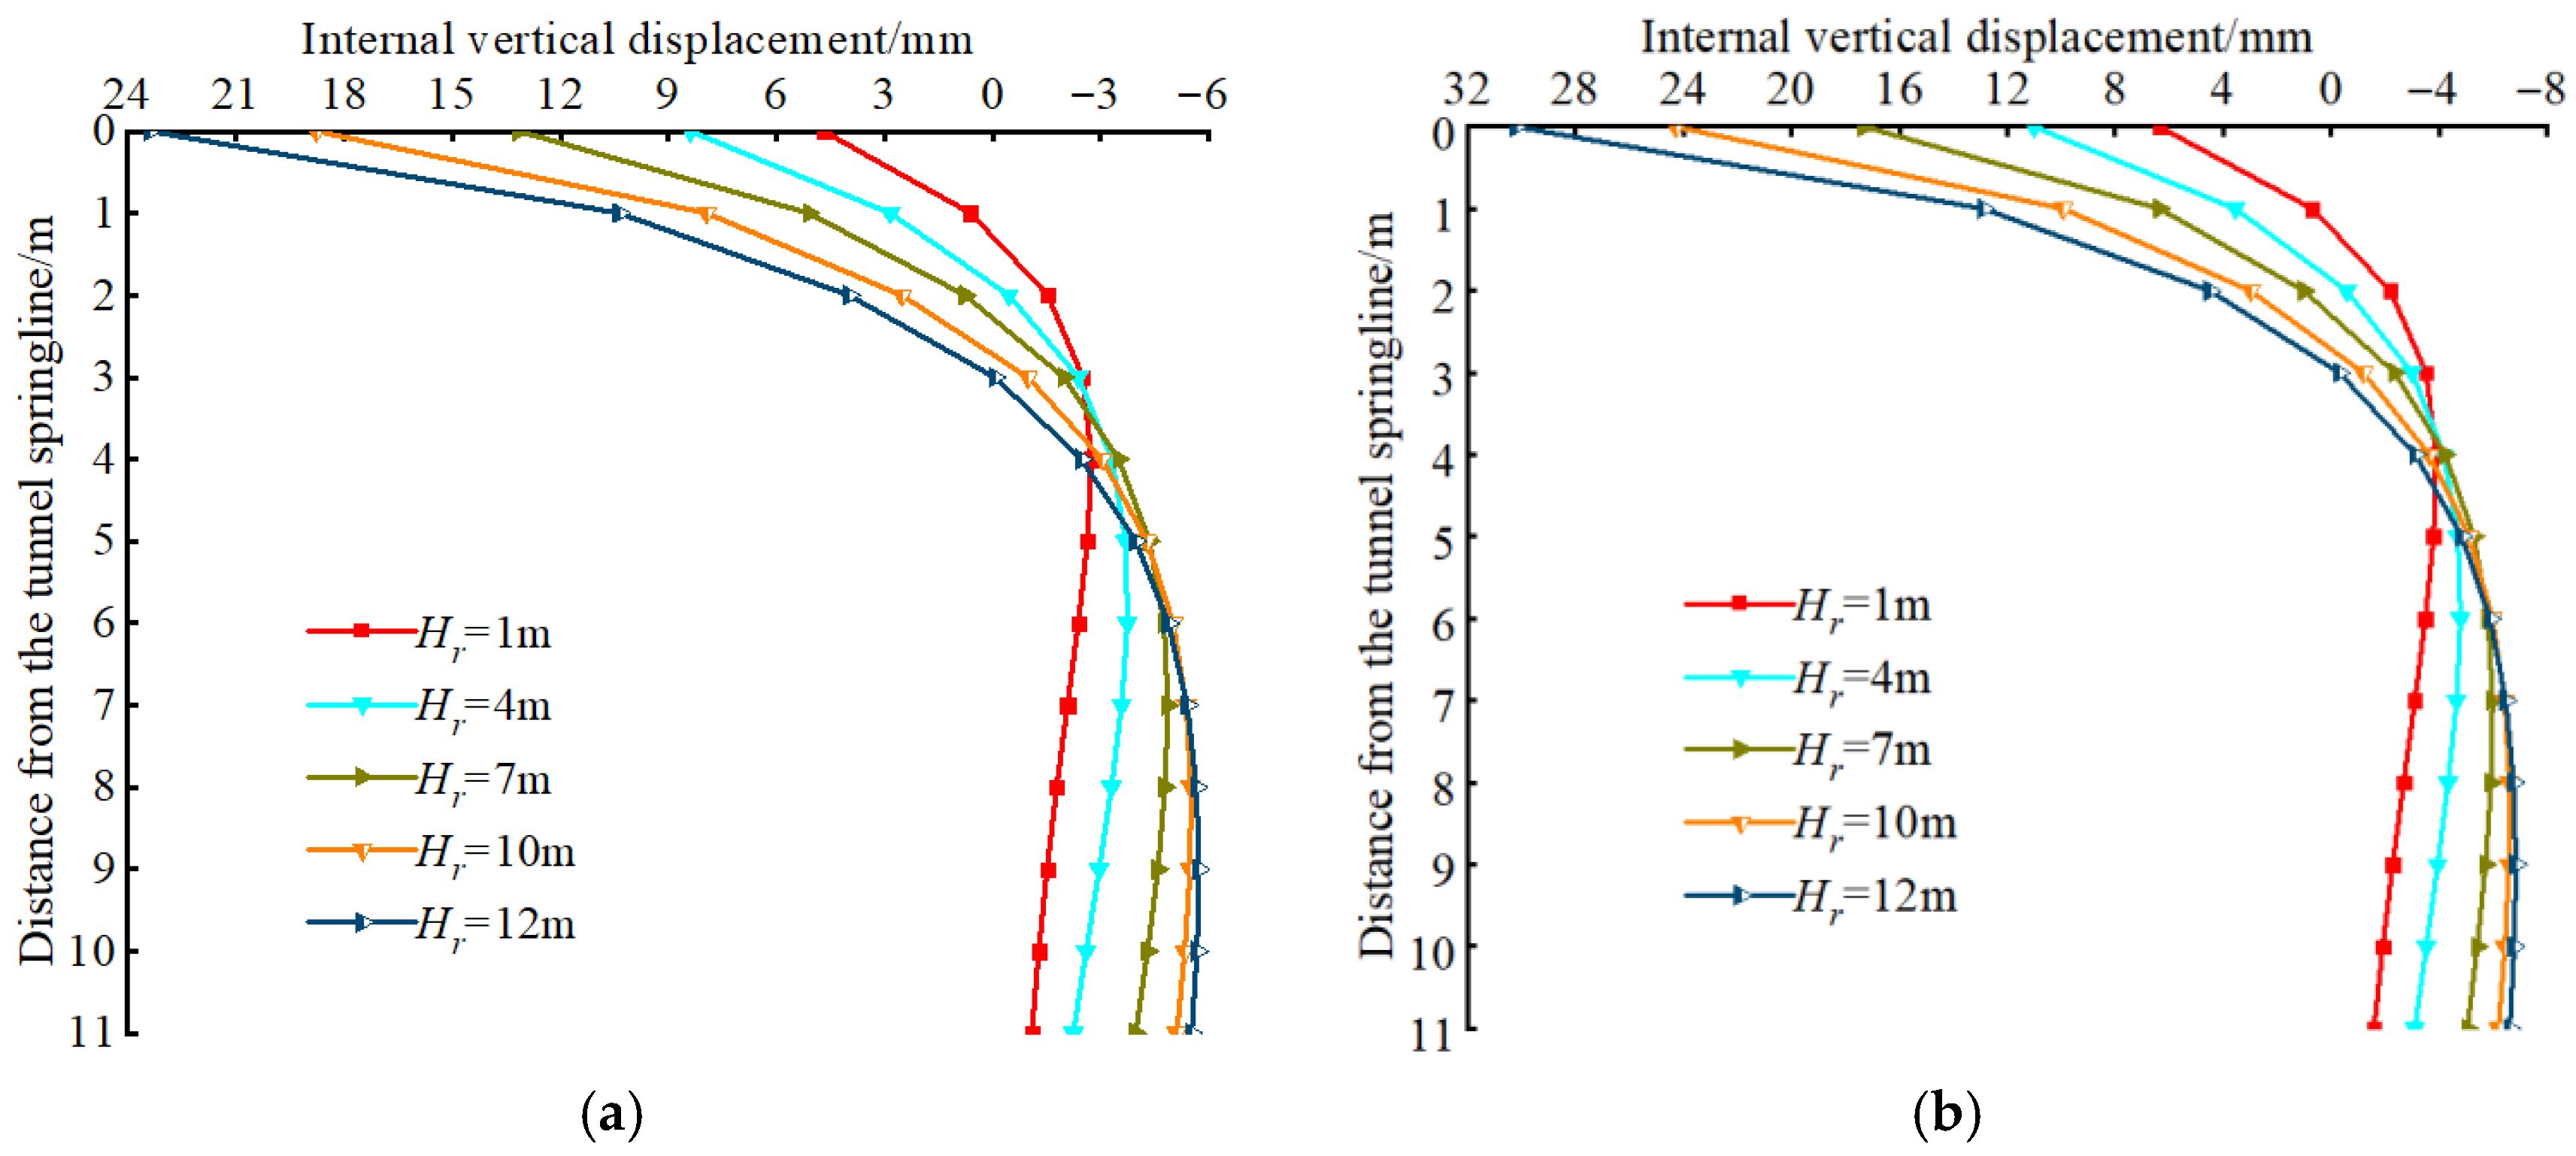
Figure 15 shows the vertical displacement curves of the surrounding rock measurement points from the tunnel crown to the ground surface. It can be observed from Figure 15 that, as the thickness of the overlying soil layer increases, the vertical displacement inside the tunnel crown generally increases. When the thickness of the overlying soil layer remains constant, the vertical displacement inside the crown first decreases and then increases with the increase in the thickness of the overburden. Furthermore, at the boundary between soil and rock, a significant sharp increase in the vertical displacement of the surrounding rock is observed, specifically manifested as an increase in the rate of settlement deformation. Therefore, the boundary between soil and rock is a critical location for surrounding rock deformation.
(4)
Vertical Displacement of the Surrounding Rock at the Tunnel Bottom
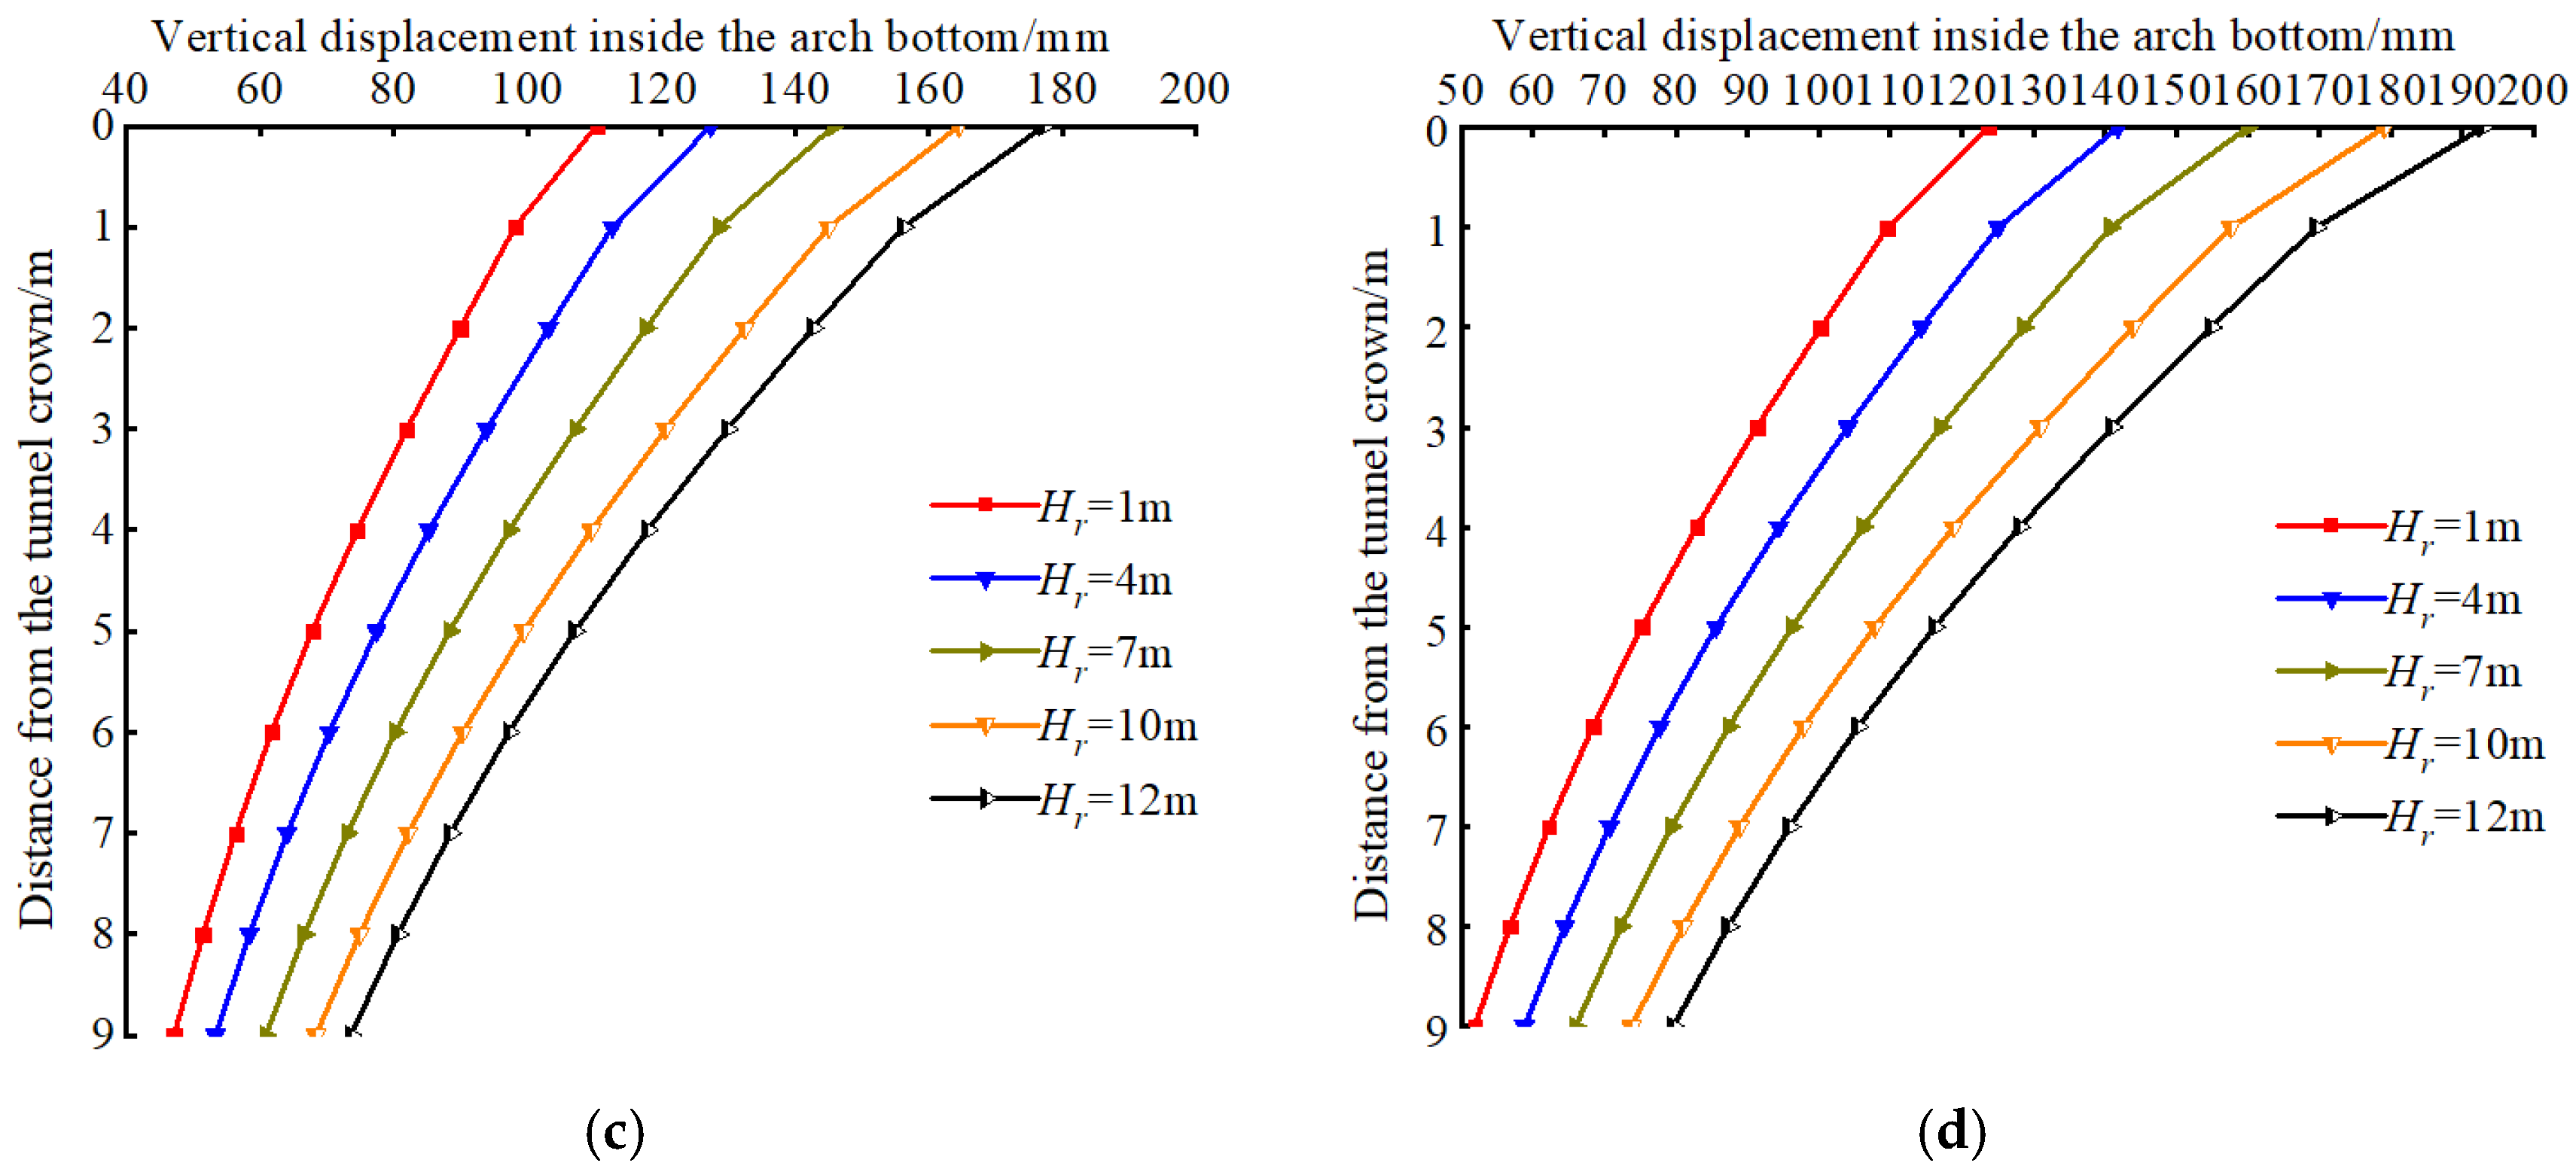
Figure 16 presents the vertical displacement curves of the surrounding rock at the tunnel bottom. It can be observed from Figure 16 that as the overburden thickness increases, the tunnel burial depth gradually increases, resulting in higher corresponding ground stress levels. The vertical displacement inside the tunnel arch bottom shows a gradual increase. The maximum vertical displacement is located near the tunnel surface at the arch bottom. As the distance from the tunnel bottom surface increases, the displacement values of the corresponding internal measurement points gradually decrease. With the increase in soil layer thickness, the vertical displacement of the surrounding rock at the tunnel bottom gradually increases.
(5)
Horizontal Displacement of the Arch Waist Surrounding Rock
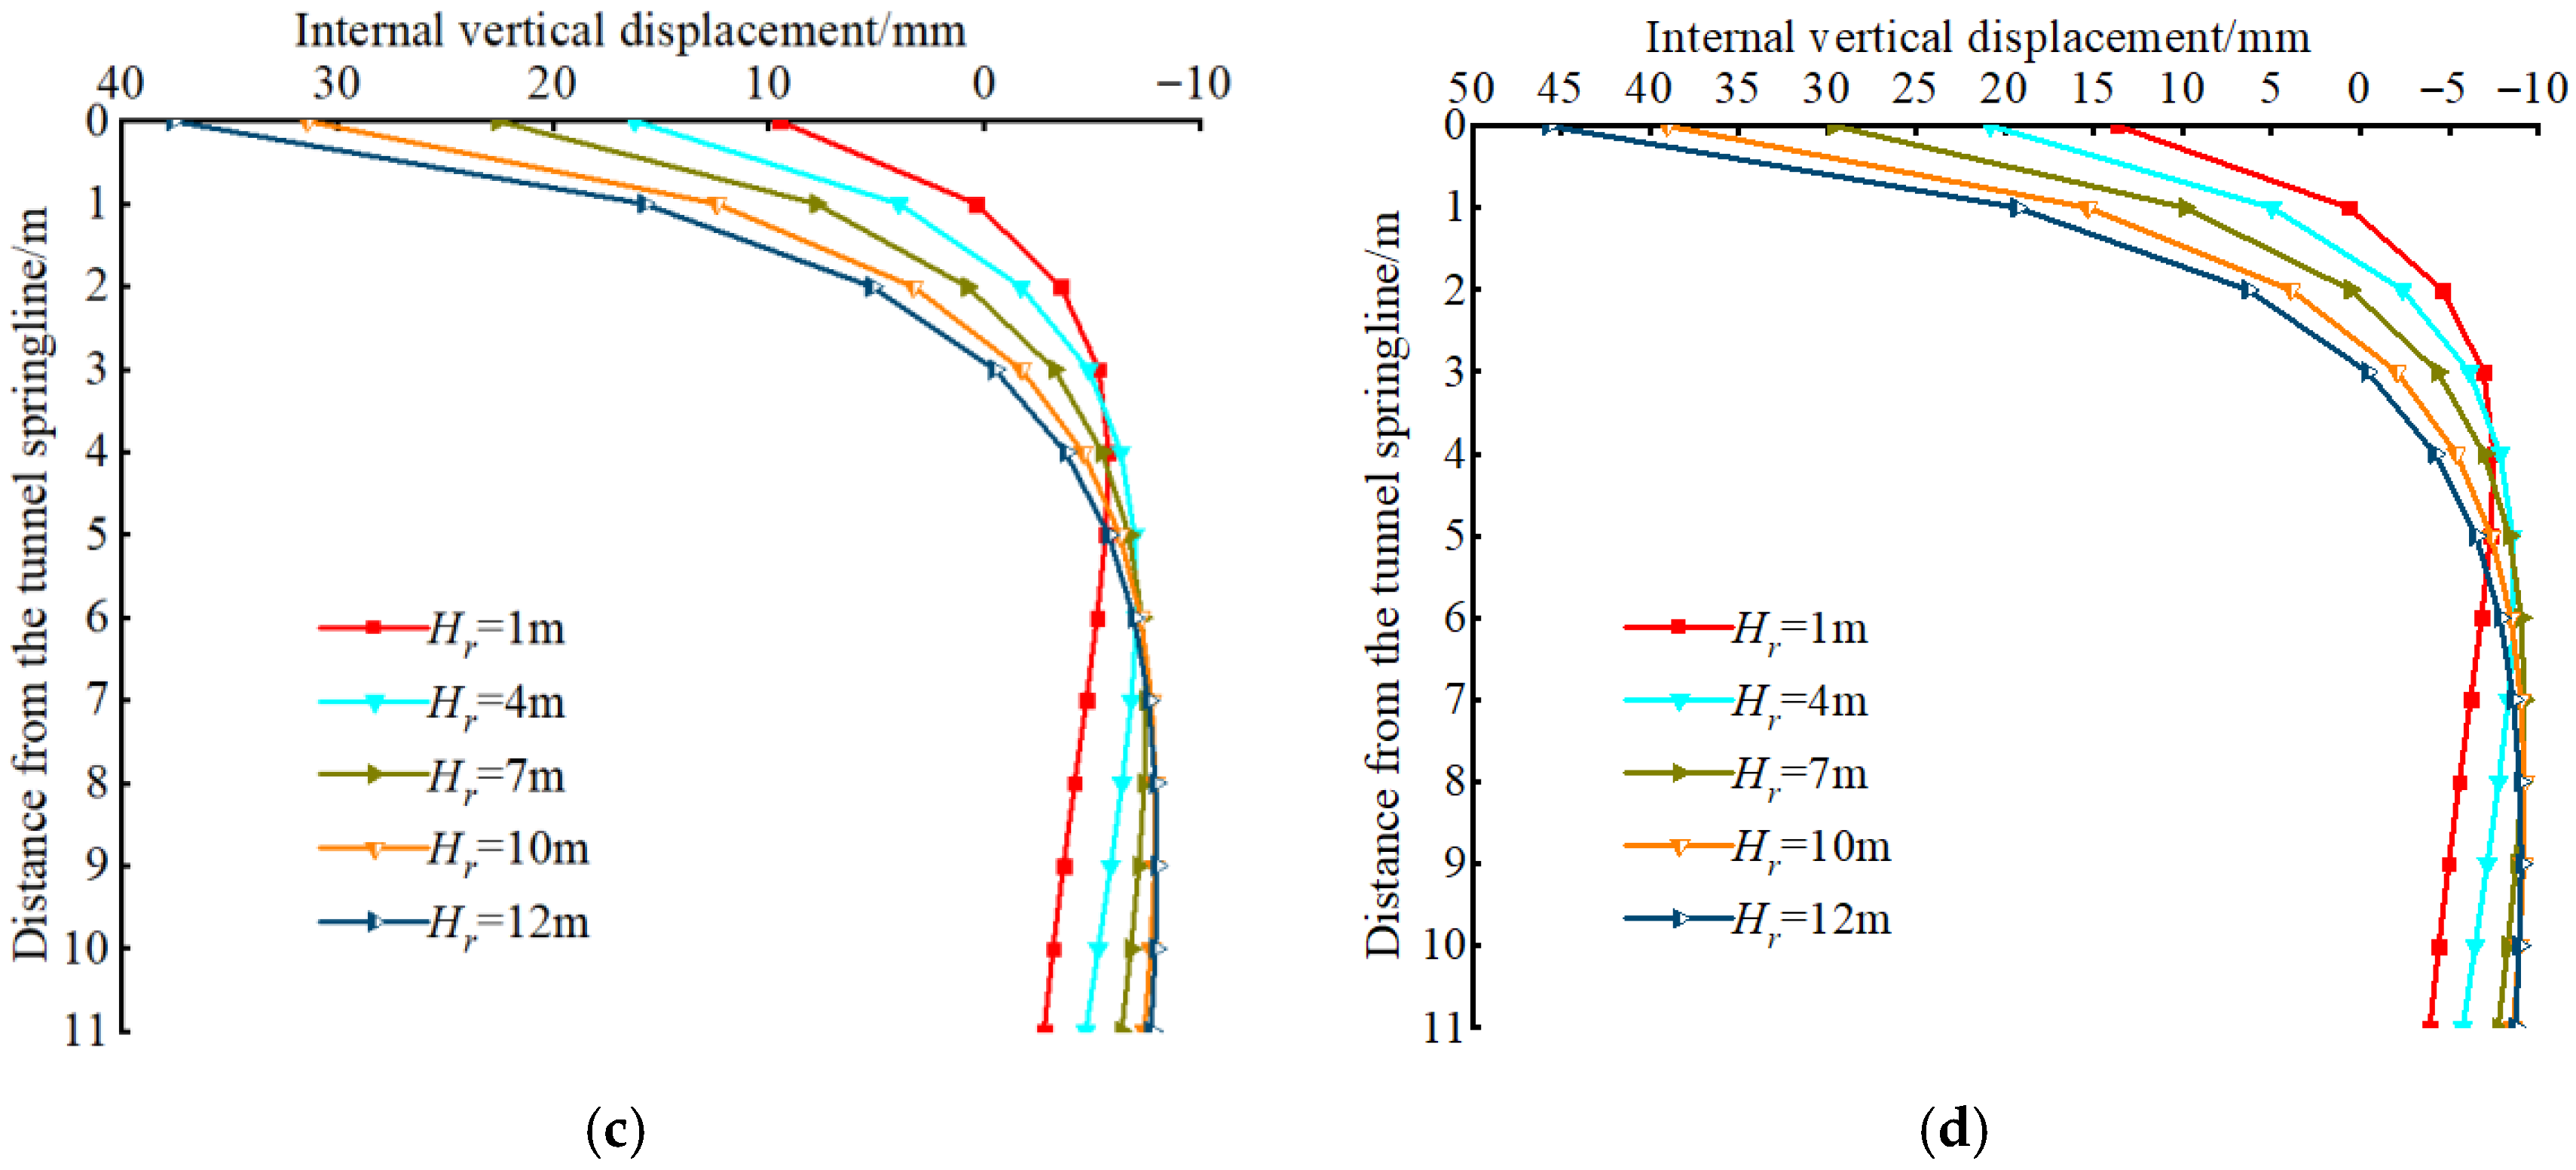
As shown in Figure 17, with the increase in the thickness of the overlying soil layers, the horizontal displacement inside the tunnel arch waist surrounding rock gradually increases. The horizontal displacement inside the surrounding rock is largest near the surface of the tunnel arch waist and decreases as the distance from the arch waist surface increases. When the thickness of the soil layer is constant, with the increase in the overburden thickness, the tunnel burial depth increases accordingly, and the horizontal displacement inside the arch waist surrounding rock shows a continuous increase. For example, when the roof overlying rock thickness at the arch crown is 1 m, the corresponding horizontal displacement inside the surrounding rock is minimal.

4. Upper Limit Analysis of Critical Overburden Thickness of the Crown in Soil–Rock Strata

4.1. Tunnel Crown Failure Mechanism in Soil–Rock Strata

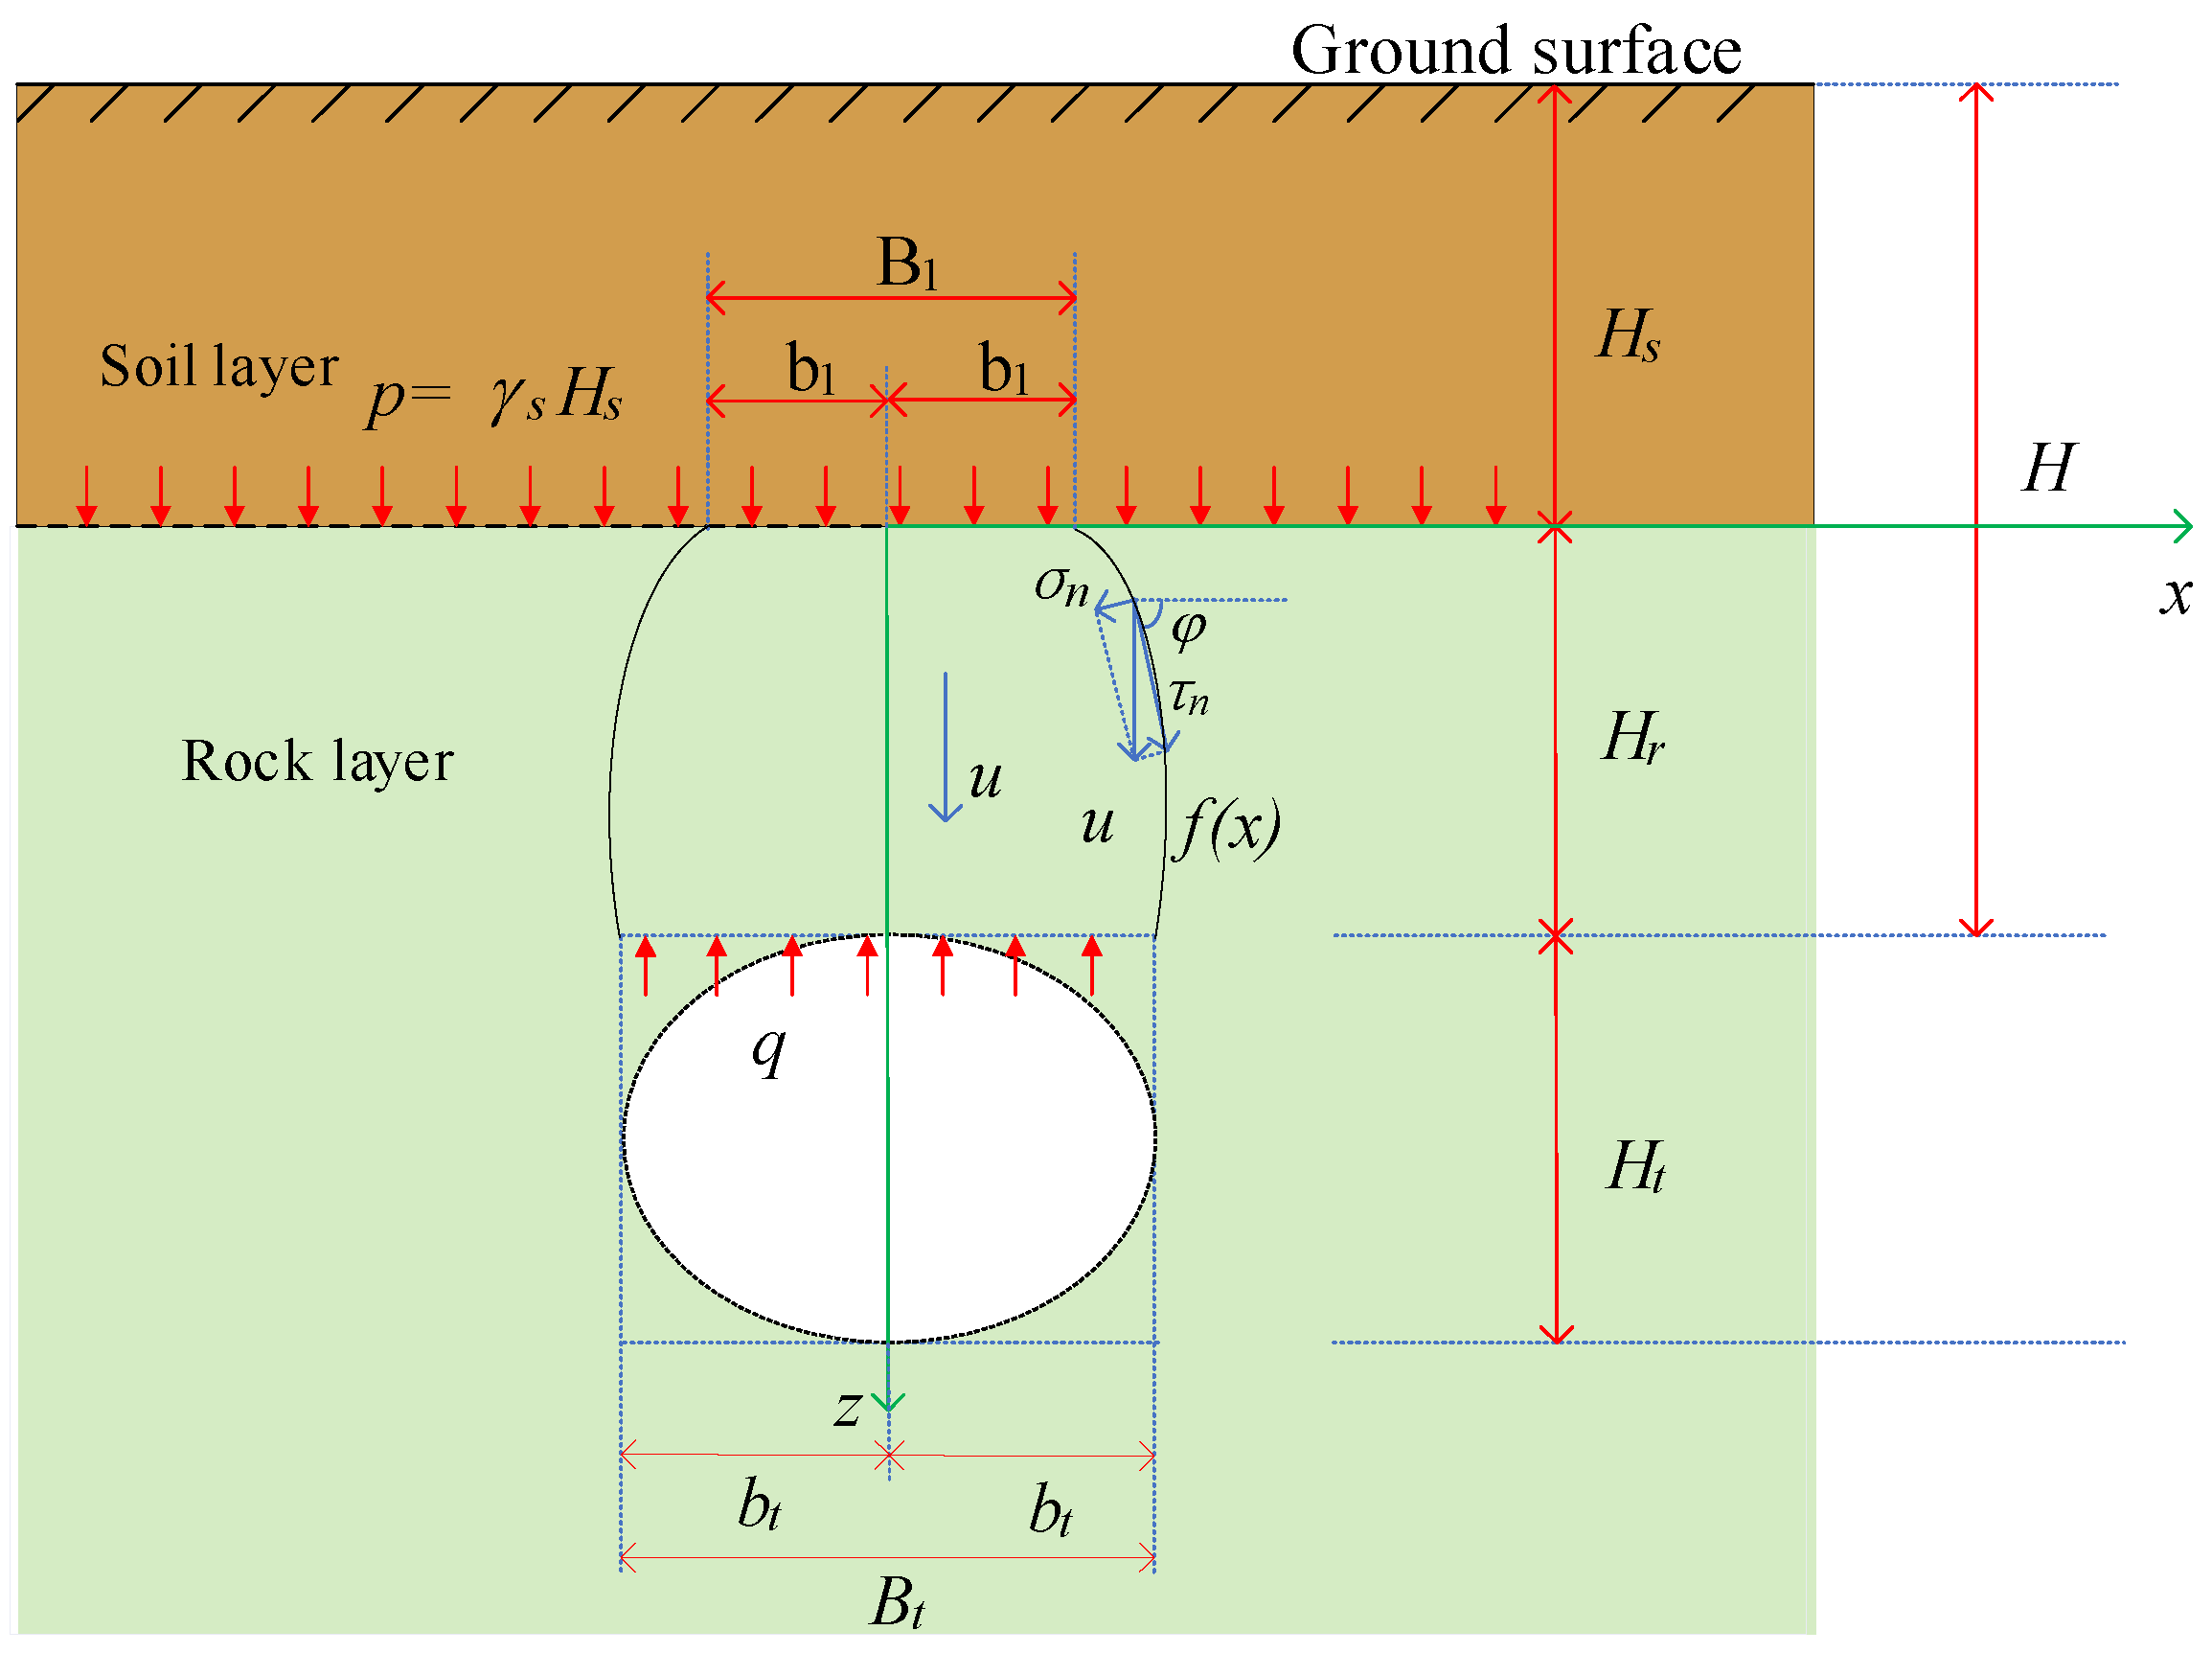
In soil–rock composite strata, the upper soil layer has relatively lower strength compared to the lower rock layer and weaker self-stability. When the tunnel is located in the lower rock layer, a certain level of self-stability can be provided to the tunnel. Therefore, positioning the tunnel in the rock layer is considered more ideal. However, attention should be given to the fact that the thickness of the overlying rock between the tunnel crown and the soil–rock strata should not be too small. When the overburden thickness is small, the safety and stability of the tunnel surrounding rock cannot be guaranteed. Conversely, when the overburden thickness is large, the tunnel depth increases, leading to a higher corresponding level of earth pressure, which adversely affects the stability of the surrounding rock. Therefore, there should be a critical value for the overburden thickness between the tunnel crown and the soil layer in the rock strata. Based on the deformation and failure characteristics of the tunnel surrounding rock in the soil–rock composite strata, a collapse failure mechanism for the tunnel crown surrounding rock is proposed in this paper, as shown in Figure 18. Specifically, in Figure 18, the tunnel depth is denoted as H, the excavation width as B t , and the excavation height as H t . The thickness of the upper soil layer is represented as H s , and the overburden thickness between the tunnel crown and the soil–rock interface is denoted as H r . In the failure mechanism of the tunnel crown shown in Figure 18, the upper soil layer is simplified as a uniformly distributed load acting on the top of the tunnel crown rock layer, with a magnitude p = γ s H s . Additionally, it is assumed that the surrounding rock of the tunnel crown collapses downward with velocity u ˙ . The corresponding fracture surface curve function is assumed to be f ( x ) , the width of the failure at the soil–rock interface is B 1 , and the lower failure width is equal to the tunnel width. Furthermore, the effect of tunnel internal support force, denoted as q, is also considered in this analysis.

4.2. Internal Energy Dissipation Rate

Based on the proposed collapse mechanism of the tunnel vault surrounding rock, this section utilizes the upper-bound theorem from plastic mechanics to determine the critical overburden thickness at tunnel roof failure and the corresponding curve equation of the soil rupture surface. In the failure mechanism shown in Figure 18, it is assumed that the tunnel crown rock mass behaves as an ideal rigid plastic material, and its failure follows the Mohr-Coulomb strength criterion. The corresponding yield function expression F is:
F = τ n σ n tan φ C
In the equation, τ n represents the shear stress, σ n represents the normal stress on the failure plane. φ represents the angle of internal friction, and C represents the cohesion. Meanwhile, according to the soil uplift failure velocity and geometric relationship shown in Figure 18, the plastic normal strain rate ε ˙ n and plastic shear strain rate γ ˙ n can be expressed as:
ε ˙ n = u ˙ w 1 + f ( x ) 2 1 / 2 γ ˙ n = u ˙ w f ( x ) 1 + f ( x ) 2 1 / 2
In the equation, u ˙ represents the falling speed of the rock mass, f ( x ) represents the first derivative of the function f ( x ) , and w represents the thickness of the rock mass fracture surface. According to the Mohr–Coulomb strength criterion and the associated flow rule, the plastic potential function corresponding to the rock mass failure is set equal to the yield function. By utilizing the potential theory in plasticity mechanics, substituting Equation (2) into Equation (1), the plastic strain rate generated at the failure surface of the tunnel crown surrounding rock can be expressed as:
ε ˙ n = λ ˙ F σ n = λ ˙ tan φ γ ˙ n = λ ˙ F τ n = λ ˙
In the equation, λ ˙ represents the plasticity coefficient, ε ˙ n represents the plastic normal strain rate, and γ ˙ n represents the plastic shear strain rate. By equating the plastic strain rates in Equations (2) and (3), the derivative of the rock mass fracture surface function f ( x ) can be obtained as:
f x = cot φ
Integrating with respect to f x yields the expression for the failure surface function of the rock mass as:
f x = x cot φ + C
In the equation, C represents an undetermined constant of integration. It can be seen that when the rock mass failure satisfies the Mohr–Coulomb strength criterion, the failure surface of the rock mass corresponds to a straight line. At this point, the internal energy dissipation rate D ˙ per unit volume generated at the failure surface can be expressed as:
D ˙ = σ n ε ˙ n + τ n γ ˙ n = c cos φ u ˙ / w
Based on the geometric relationship in Figure 18, the length of the rock mass fracture surface can be determined as:
L 1 = H r 2 + b t b 1 2 1 2
Thus, the internal energy dissipation rate generated at the failure surface of the surrounding rock at the crown can be expressed as:
W ˙ i = 2 D ˙ w L 1 = 2 c cos φ u ˙ H r 2 + b t b 1 2 1 2

4.3. External Power

When the arch crown surrounding rock undergoes collapse damage, the external forces acting on the rock mass within the damaged area include the self-weight of the overlying soil, the support force q within the tunnel, and the self-weight of the arch crown surrounding rock. Accordingly, the self-weight G of the surrounding rock within the arch crown collapse range is given by:
G = γ r b t + b 1 H r
The work power W ˙ γ of the self-weight of the arch crown surrounding rock is given by:
W ˙ γ = G u ˙
The work power W ˙ p of the self-weight of the overlying soil is given by:
W ˙ P = 2 γ s H s b 1 u ˙
In the equation, γ s represents the unit weight of the overlying soil.
The work power W ˙ q of the support force inside the tunnel is:
W ˙ q = 2 q b t u ˙

4.4. Determination of Critical Overburden Thickness

According to the geometric relationship in the failure mechanism shown in Figure 18, the fracture surface function should satisfy the following boundary conditions:
f x = b 1 = 0
f x = b t = H r
By substituting Equation (5) into Equations (13) and (14), the undetermined constant (C) can be obtained as:
C = b 1 cot φ
At the same time, the corresponding critical overburden thickness value when the tunnel arch crown fails can also be determined as:
H r = cot φ b t b 1
It should be noted that in Equation (16), the width of the top failure is unknown. Based on the arch crown surrounding rock failure mechanism, by using the principle of virtual work, we can derive:
W ˙ γ + W ˙ P + W ˙ q = W ˙ i
By substituting the internal energy dissipation rate and the external force power obtained from Equations (8)–(12) into (17), and after simplifying, the implicit equation for the critical overburden thickness H r of the tunnel crown failure can also be derived as:
H r 2 = 0.5 b t + b 1 H r + γ s H s b 1 q b t 2 c 2 cos 2 φ b t b 1 2
At this point, by solving the system of equations formed by Equations (16) and (18), the failure range of the tunnel arch crown and the required critical overburden thickness of the crown can be determined.

5. Comparison and Verification with Example Analysis

5.1. Comparison with Numerical Simulation Results

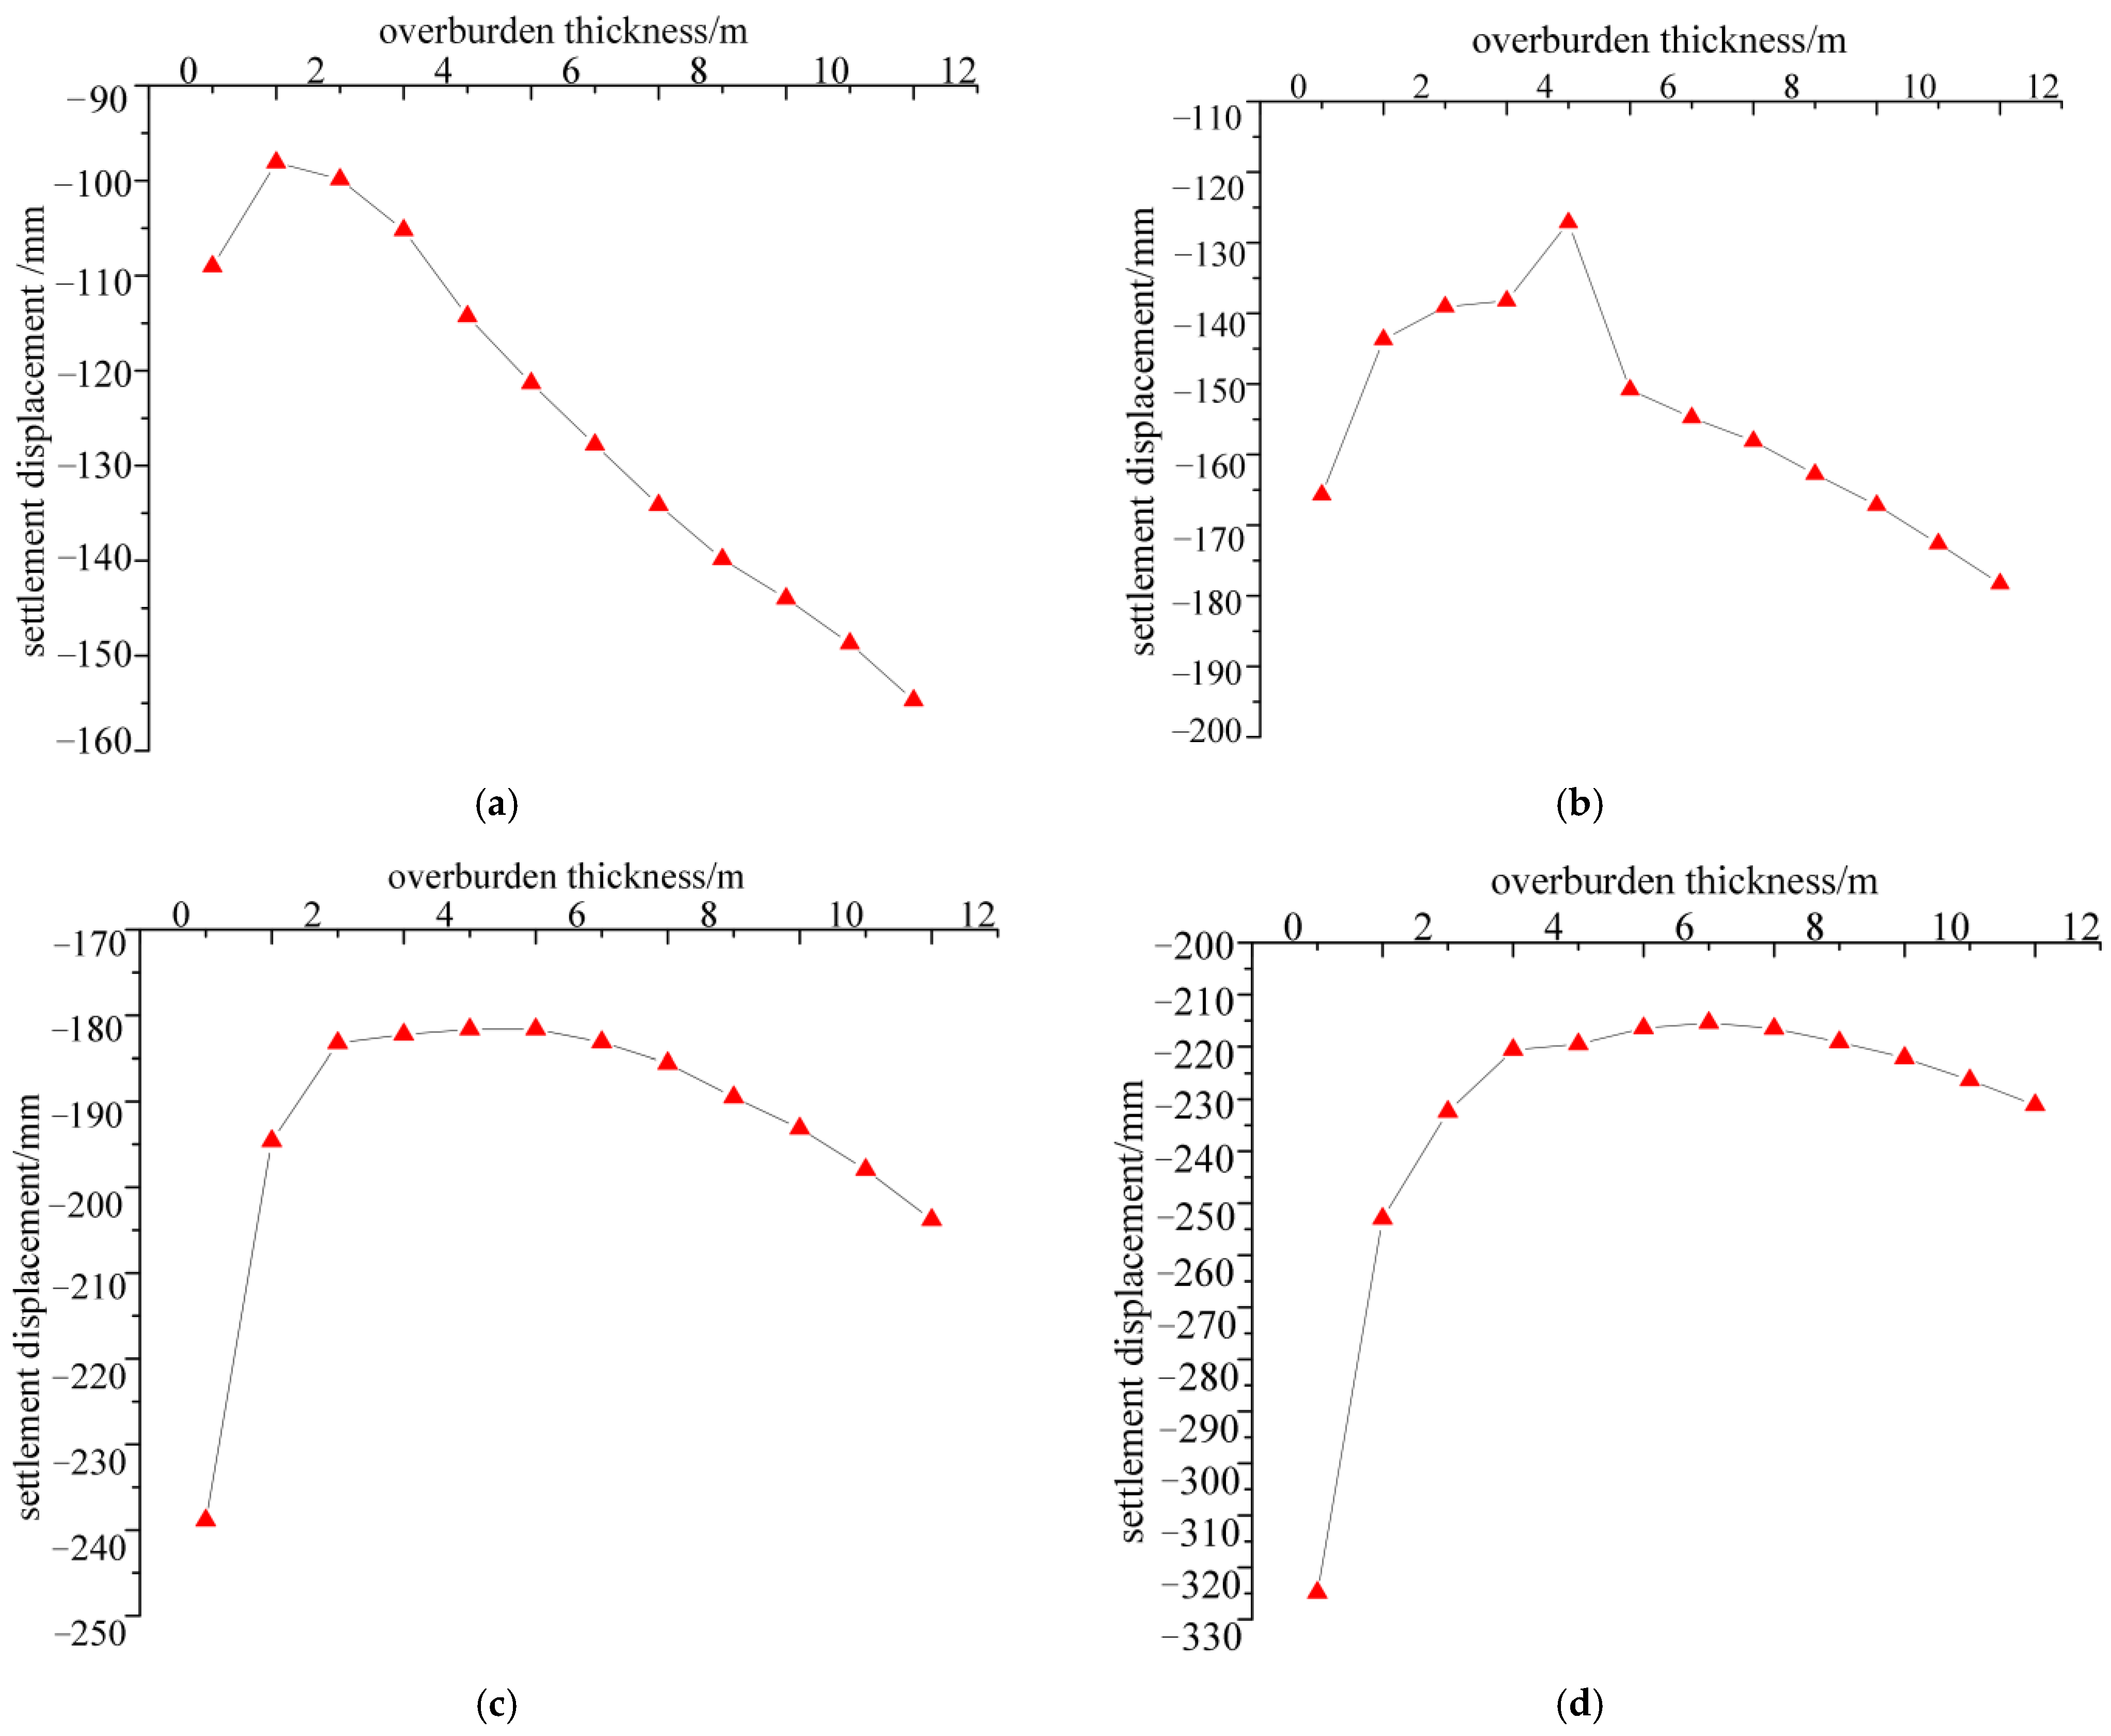
Based on the calculation results of different roof overlying rock thickness schemes in the numerical simulation, Figure 19 further presents the curve of settlement displacement at the tunnel crown location with varying overburden thickness. As shown in Figure 19, when the upper soil layer thickness is 3 m or 6 m, the vertical displacement of the crown reaches its maximum when the overburden thickness is 12 m. Conversely, when the soil layer thickness is 9 m or 12 m, the vertical displacement of the crown is maximized when the overburden thickness is 1 m. For all four upper soil layer thicknesses, the tunnel crown settlement displacement generally shows a trend of first decreasing and then increasing with the increase in overburden thickness. When the overburden thickness is small, the self-supporting capacity of the surrounding rock is weak, and the corresponding deformation of the surrounding rock is large. As the overburden thickness increases to a certain value, the tunnel’s safety is ensured, and the corresponding deformation is smaller. However, as the overburden thickness continues to increase, the tunnel burial depth increases, the formation pressure increases, and the crown displacement also gradually increases. Therefore, for tunnels in soil–rock composite strata, there exists an optimal overburden thickness range. Within this range, the tunnel’s safety and stability can be assured. Based on Figure 19, it can be roughly determined that the optimal overburden thickness ranges for the four soil layer thicknesses of 3 m, 6 m, 9 m, and 12 m are 1~3 m, 4~6 m, 5~7 m, and 6~8 m, respectively. Furthermore, using the parameters from the numerical simulation calculation, the critical overburden thickness value for the tunnel crown was calculated using the upper-limit theoretical method. The results are listed in Table 2. From Table 2, it can be seen that the critical overburden thickness values calculated in this paper are all within the optimal overburden thickness range obtained from numerical simulations. The two sets of results are quite similar, further verifying the effectiveness of the theoretical method used in this paper.

5.2. Influence of Different Parameters on the Critical Overburden Thickness

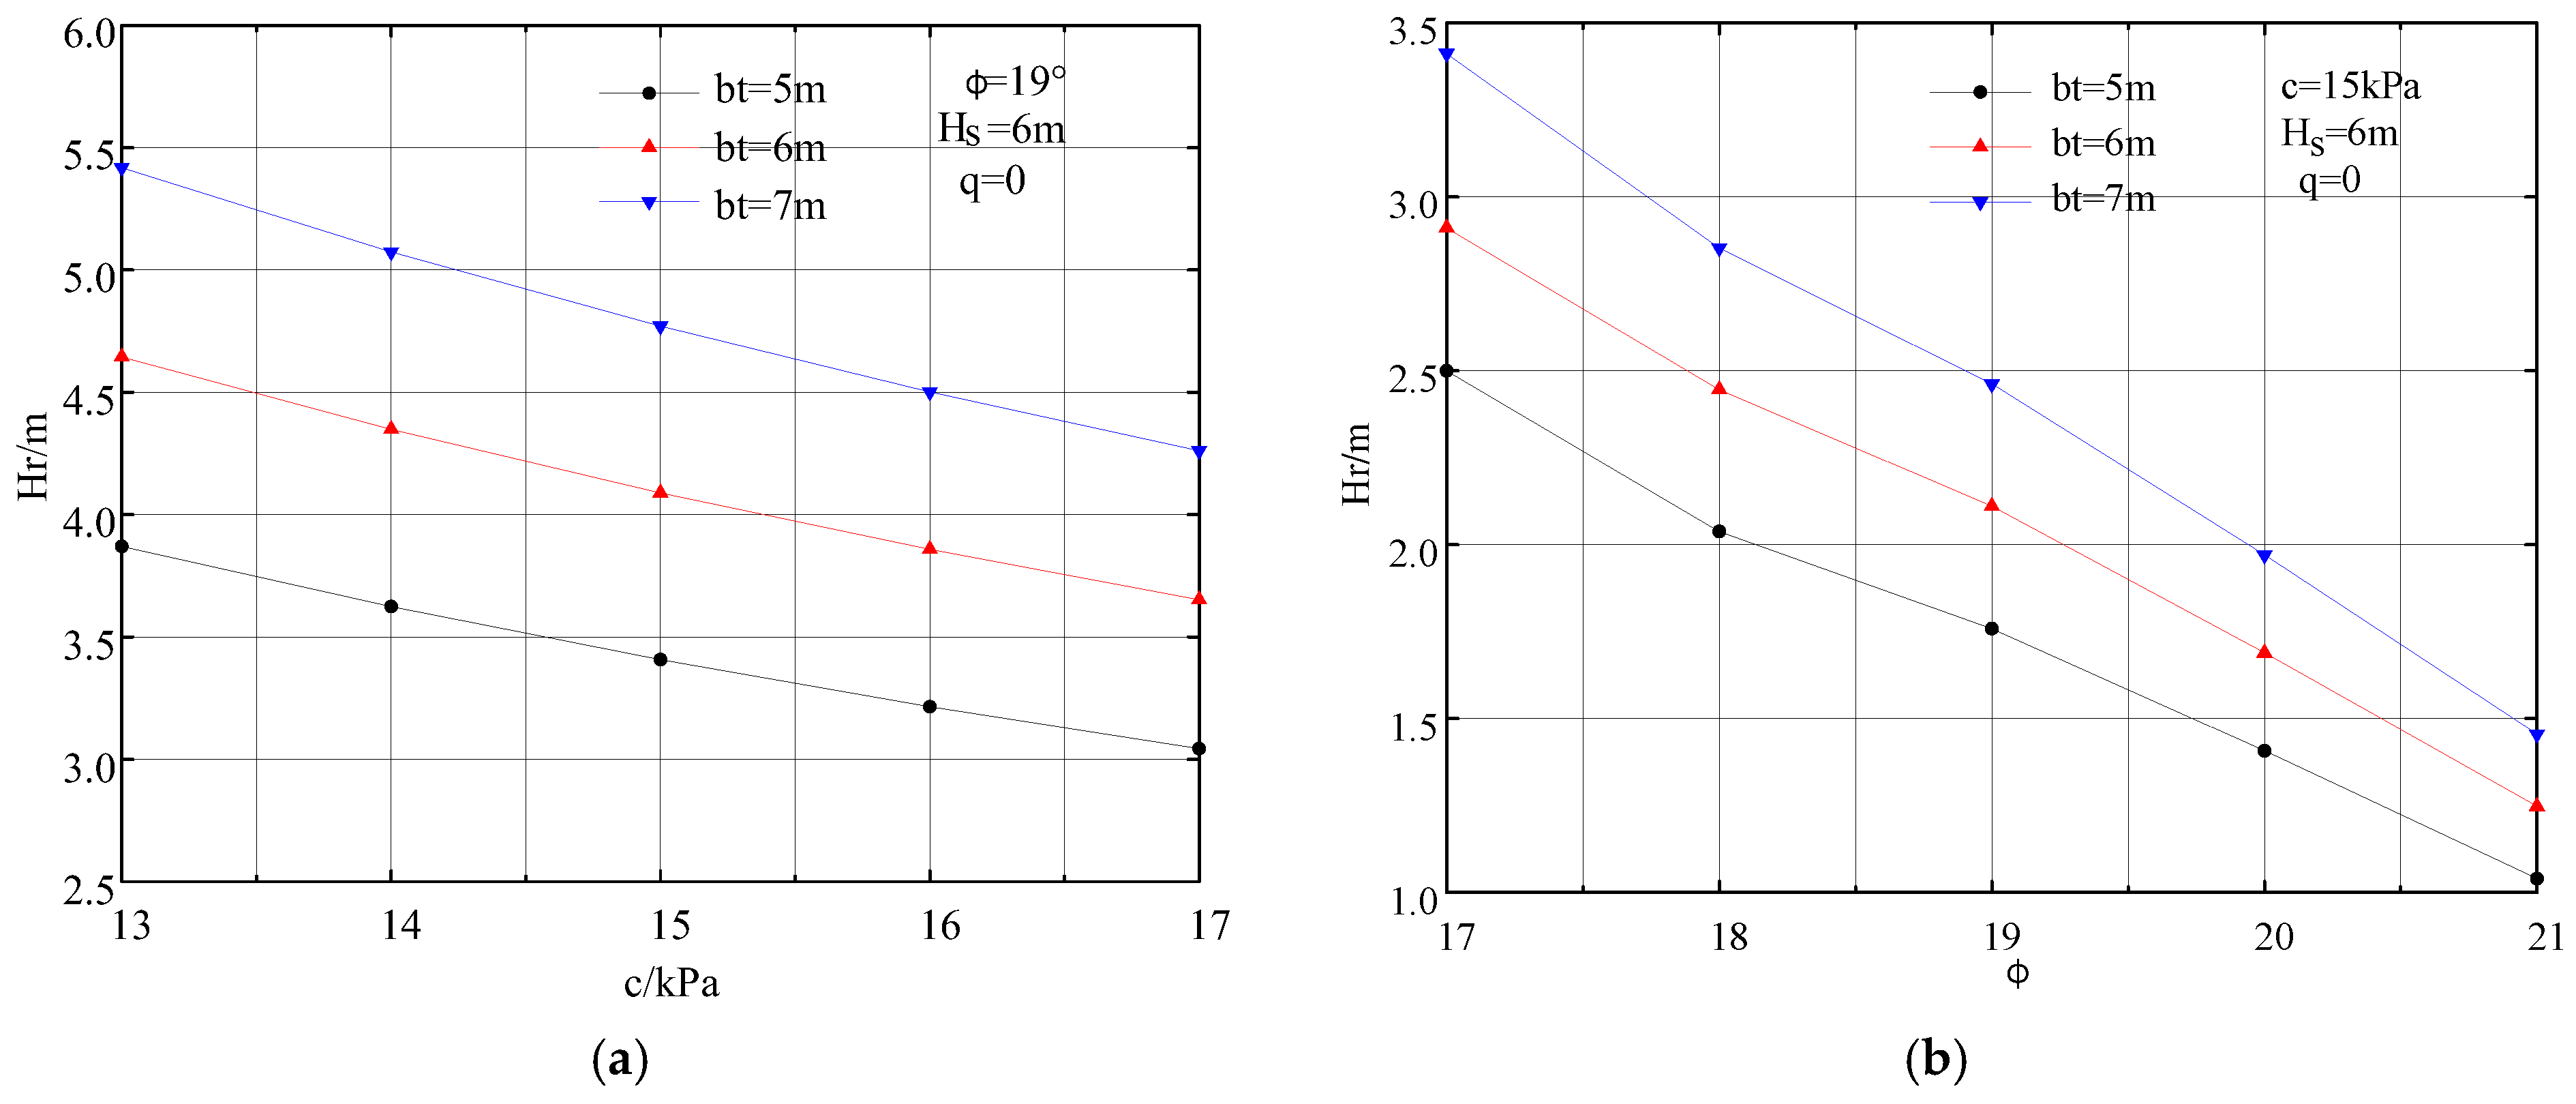
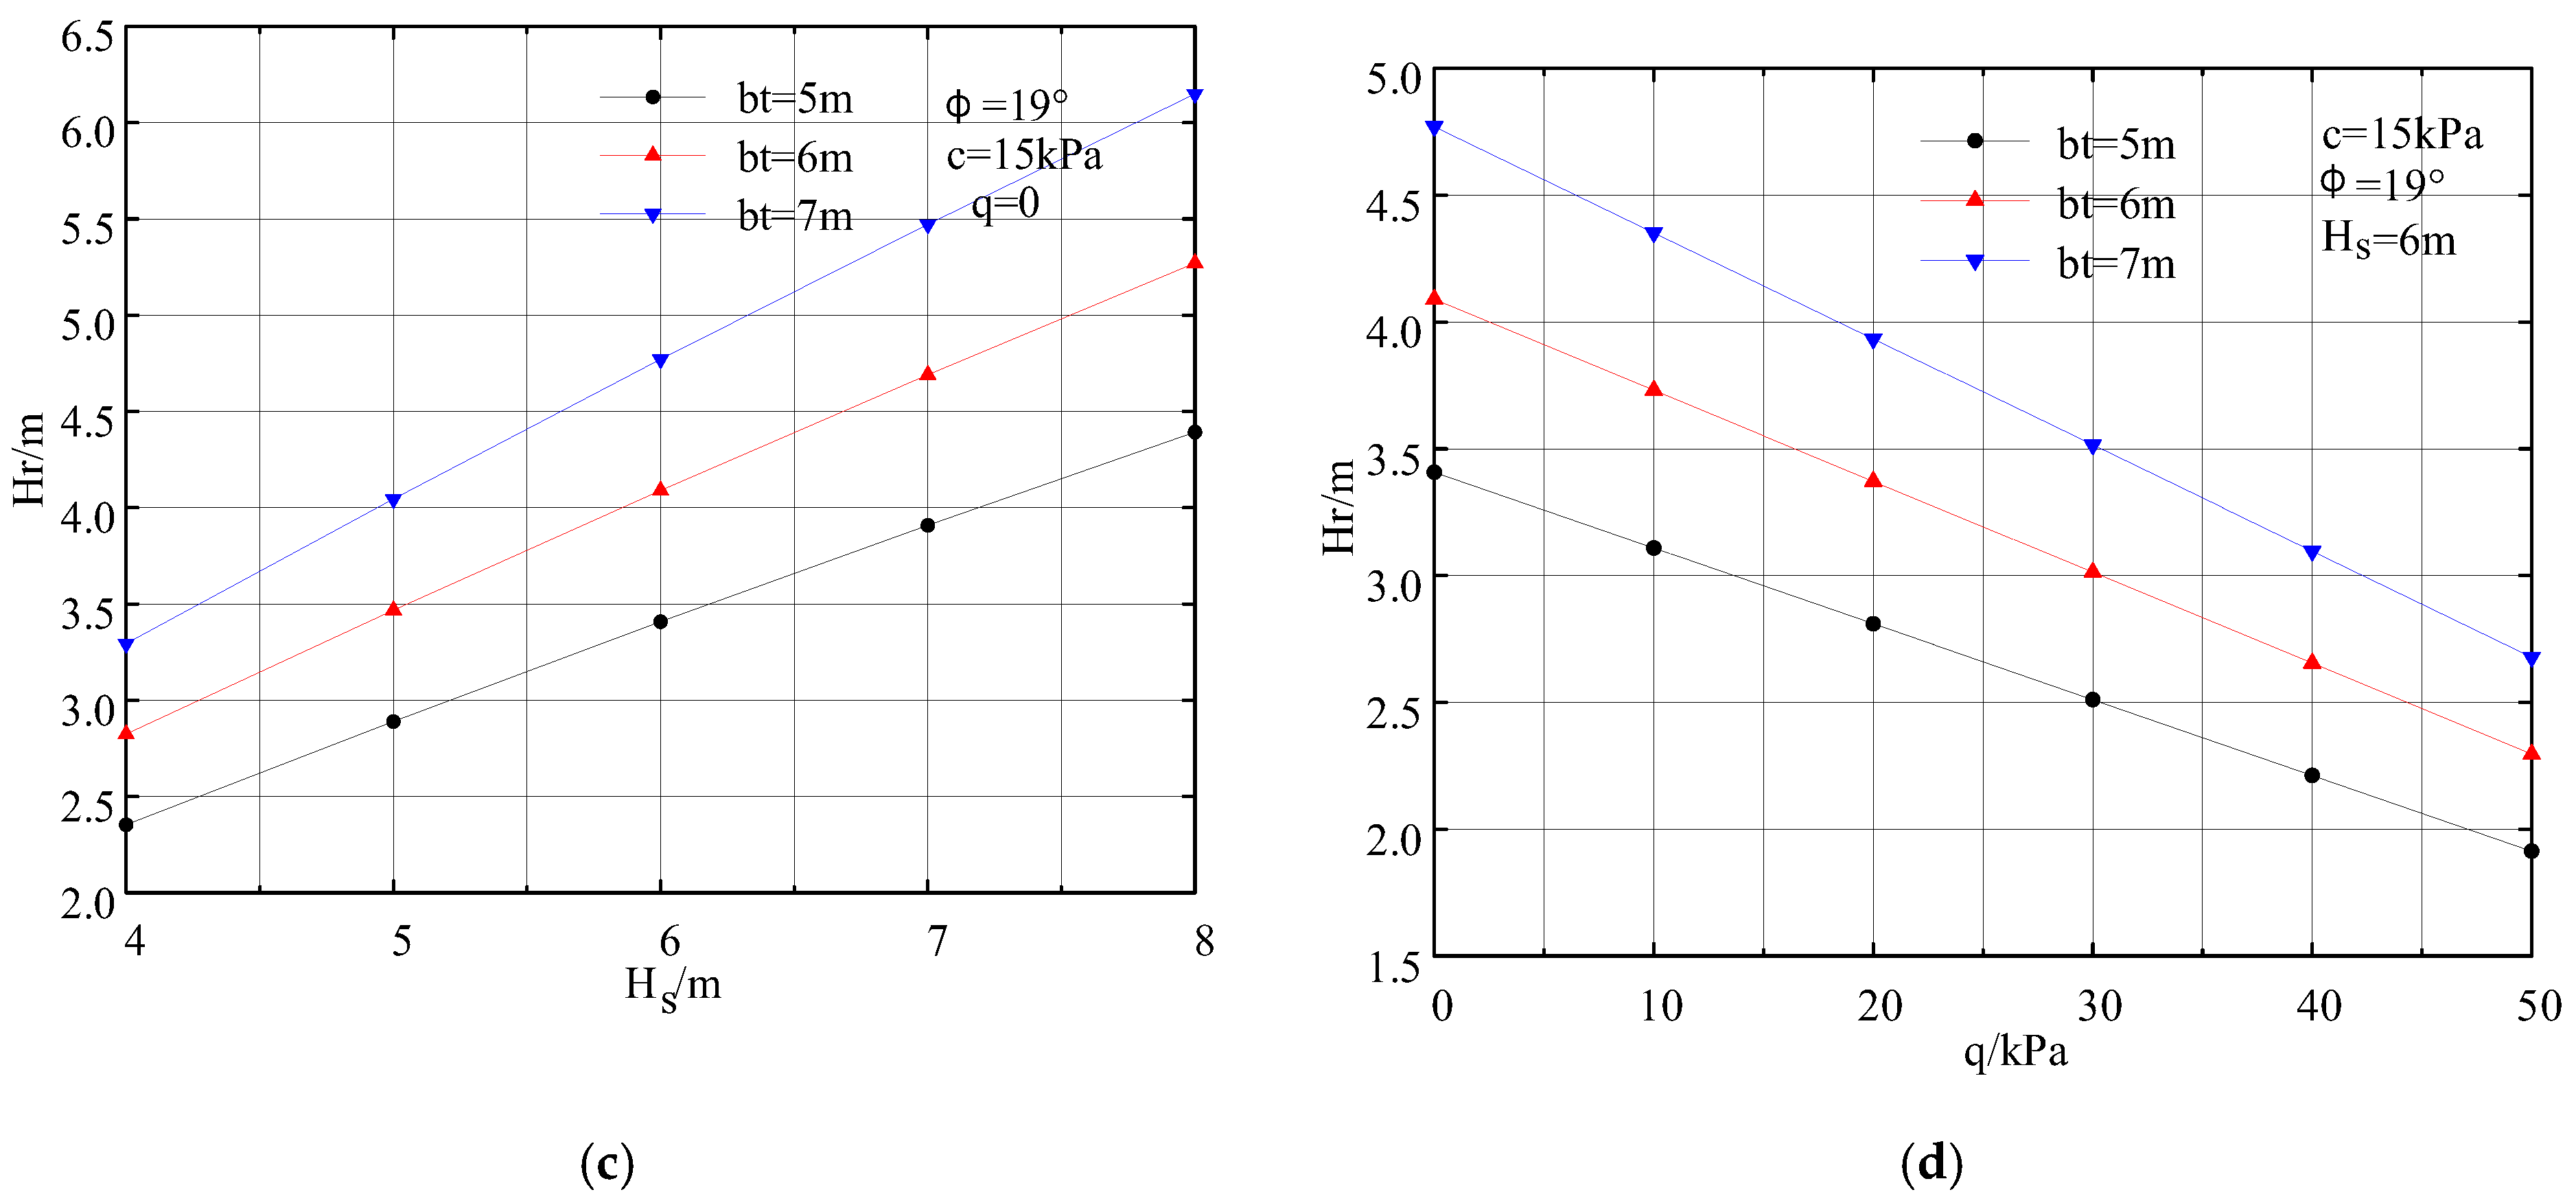
To further reveal the influence of different rock mass parameters and tunnel design parameters on the roof overlying rock thickness in the tunnel, this section takes the case of a 6 m-thick soil layer as an example. It considers the effects of various factors such as tunnel span, rock mass strength parameters, overlying soil layer thickness, and internal support force, and plots the variation curves of the critical overburden thickness of the crown under different parameters, as shown in Figure 20. From Figure 20, it can be observed that as the tunnel span increases, the required critical overburden thickness for the tunnel crown gradually increases. For instance, when the tunnel half-span is 7 m, the critical overburden thickness is significantly larger than that for 5 m or 6 m spans. At the same time, the strength parameters of the surrounding rock also significantly affect the required roof overlying rock thickness. As the cohesion (c) and internal friction angle of the rock mass increase, the surrounding rock quality improves, and the corresponding critical overburden thickness gradually decreases. Conversely, as the overlying soil layer thickness increases, the critical overburden thickness increases. Moreover, as the internal support force of the tunnel increases, the required safe overburden thickness for the tunnel crown gradually decreases. Overall, changes in different calculation parameters have a nearly linear effect on the critical overburden thickness. These factors should be carefully considered when selecting tunnel sites and designing support systems for tunnels in soil–rock composite strata. When the tunnel location is fixed, the internal support force can be appropriately increased to ensure the tunnel’s safety and stability.

6. Conclusions

The following conclusion can be drawn:
(1)
A comparative study of tunnel excavation numerical simulations with different overlying soil layer thickness was conducted, based on a typical urban subway tunnel project in soil–rock strata. A total of 4 soil layer thickness conditions were considered, and 48 design schemes were developed. The study revealed the deformation and failure characteristics of tunnel excavation surrounding rock and surface settlement patterns under different roof overlying rock thicknesses. The tunnel arch crown area was identified as the key region for deformation and failure. As the overburden thickness increased, the corresponding surface settlement showed a trend of decreasing first and then increasing. An optimal overburden thickness range was identified for subway tunnels in soil–rock strata.
(2)
A mechanical analysis model for the failure of the tunnel arch rock layer in soil–rock composite strata was constructed based on the upper bound approach of plastic limit analysis. The internal energy dissipation rate and external work of the tunnel arch crown surrounding rock collapse were calculated. The theoretical prediction formula for the critical overburden thickness of the crown and the rock mass failure surface was derived. The influence of different soil layer thicknesses, rock mass strength parameters, and tunnel design parameters on the critical overburden thickness was analyzed. As the rock mass cohesion (c), internal friction angle ( φ ), and support force (q) increased, the critical overburden thickness gradually decreased. However, as the soil layer thickness H s increased, the corresponding critical overburden thickness of the crown gradually increased.
(3)
A comparison and validation were conducted between the numerical simulation results and the theoretical method results in this study. The optimal overburden thickness ranges for the four upper soil layer thicknesses obtained from the numerical simulation were 1–3 m, 4–6 m, 5–7 m, and 6–8 m, while the theoretical critical overburden thicknesses were 2.26 m, 4.29 m, 6.12 m, and 7.71 m. These values were within the range of the numerical simulation results and were quite close to each other, thereby confirming the validity of the theoretical method presented in this study.

Author Contributions

F.J.: investigation, data curation, software, writing—original draft. Q.W.: investigation, validation, writing—review and editing. H.W.: conceptualization, methodology, funding acquisition. Y.Y.: visualization, formal analysis. Z.H.: visualization. P.L.: validation. R.L.: validation. All authors have read and agreed to the published version of the manuscript.

Funding

This research was funded by the National Natural Science Foundation of China (No. 52374093), a project funded by the China Postdoctoral Science Foundation (No. 2022M711314), the Shandong Provincial Natural Science Foundation (No. ZR2022ME088), and the Shandong Jianzhu University Doctoral Research Foundation (No. X25106).

Data Availability Statement

The data, models, or code presented in this study are available upon request from the corresponding author, as the data were provided by Jinan Rail Transit Group Construction Investment Co., Ltd., and are subject to a data licensing agreement. While they are permitted for use in this research analysis, they are prohibited from being publicly archived.

Conflicts of Interest

Authors Qinshan Wang and Fang Ji were employed by the Jinan Rail Transit Group Construction Investment Co., Ltd. The remaining authors declare that the research was conducted in the absence of any commercial or financial relationships that could be construed as a potential conflict of interest.

References

  1. Qi, H.; Zhou, Z.-P.; Yuan, J.-F.; Li, N.; Zhou, J.-J. Accident pattern recognition in subway construction for the provision of customized safety measures. Tunn. Undergr. Space Technol. 2023, 137, 105157. [Google Scholar] [CrossRef]
  2. Lin, D.; Nelson, J.D.; Cui, J.-Q. Exploring influencing factors on metro development in China from urban and economic perspectives. Tunn. Undergr. Space Technol. 2021, 112, 103877. [Google Scholar] [CrossRef]
  3. Li, Q.-M.; Song, L.-L.; List, G.F.; Deng, Y.-L.; Zhou, Z.-P.; Liu, P. A new approach to understand metro operation safety by exploring metro operation hazard network (MOHN). Saf. Sci. 2017, 93, 50–61. [Google Scholar] [CrossRef]
  4. Liu, H.; Zhu, P.-P.; Liu, Q.-S.; Sun, C.-Y.; Yang, Y.-T.; He, G.-C.; He, C.-C. Equivalent Nodal Intensity-Based Contact Model for 3D Finite–Discrete Element Method in Rock Fracturing Analysis. Rock Mech. Rock Eng. 2025, 58, 6059–6086. [Google Scholar] [CrossRef]
  5. Liu, P.; Wang, H.-T.; Liu, Q.-S.; Li, X.-J.; Dong, Y.-X.; Xie, X.-Q. FDEM numerical study on the large deformation mechanism of layered rock mass tunnel under excavation-unloading disturbance. Tunn. Undergr. Space Technol. 2025, 159, 106497. [Google Scholar] [CrossRef]
  6. Niu, H.-T.; Shao, S.-J.; Zou, X. Study on failure characteristics of surrounding rock of benching excavation in loess overburden soil-rock contact zone. Earth Sci. Inform. 2022, 15, 1879–1887. [Google Scholar]
  7. Luo, W.-P.; Yuan, D.-J.; Jin, D.-L.; Lu, P. Prediction and analysis of slurry pressure at the shield cut in composite strata based on random forest. Tumu Gongcheng Xuebao/China Civ. Eng. J. 2020, 53, 43–49. [Google Scholar]
  8. Zhang, S.-L.; Gao, J.-L.; Liu, C.; Li, P.-F.; Yang, Z.-F.; Lu, X. Model test on the collapse mechanism of subway tunnels in the soil-sand-rock composite strata. Eng. Fail. Anal. 2024, 162, 108356. [Google Scholar] [CrossRef]
  9. Yang, S.-Q.; Tao, Y.; Xu, P.; Chen, M. Large-scale model experiment and numerical simulation on convergence deformation of tunnel excavating in composite strata. Tunn. Undergr. Space Technol. 2019, 94, 103133. [Google Scholar] [CrossRef]
  10. Huang, F.; Zhu, H.-H.; Xu, Q.-W.; Cai, Y.-C.; Zhuang, X.-Y. The effect of weak interlayer on the failure pattern of rock mass around tunnel–Scaled model tests and numerical analysis. Tunn. Undergr. Space Technol. 2013, 35, 207–218. [Google Scholar] [CrossRef]
  11. Xu, S.-S.; Lei, H.; Li, C.; Liu, H.-Q.; Lai, J.-X.; Liu, T. Model test on mechanical characteristics of shallow tunnel excavation failure in gully topography. Eng. Fail. Anal. 2021, 119, 104978. [Google Scholar] [CrossRef]
  12. Shi, L.; Zhou, H.; Song, M.; Lu, J.-J.; Liu, Z.-J. Geomechanical model test for analysis of surrounding rock behaviours in composite strata. J. Rock Mech. Geotech. Eng. 2021, 13, 774–786. [Google Scholar] [CrossRef]
  13. Chakeri, H.; Hasanpour, R.; Hindistan, M.A.; Ünver, B. Analysis of interaction between tunnels in soft ground by 3D numerical modeling. Bull. Eng. Geol. Environ. 2011, 70, 439–448. [Google Scholar] [CrossRef]
  14. Huang, F.; Wu, C.-Z.; Jang, B.-A.; Hong, Y.; Guo, N.; Guo, W. Instability mechanism of shallow tunnel in soft rock subjected to surcharge loads. Tunn. Undergr. Space Technol. 2020, 99, 103350. [Google Scholar] [CrossRef]
  15. Zhang, C.; Gao, J.-L.; Wang, Z.-Z.; Liu, C. Model Test on the Collapse Evolution Law of Tunnel Excavation in Composite Strata with a Cavity. Buildings 2024, 14, 932. [Google Scholar] [CrossRef]
  16. Zhang, X.; Fu, D.; Zhou, X.-S.; Han, Y.-Y. Characterization of Mechanical Behavior of Ultra-Small Clearance Tunnel Construction in Upper Soil and Lower Rock Composite Strata. Buildings 2023, 13, 559. [Google Scholar] [CrossRef]
  17. Hu, Z.; Zhang, J.; Wang, Y.-G.; Wang, Y.-F. Mechanical behaviors of surrounding rock and supporting structure of shallow-buried unsymmetrical pressure tunnel crossing soil–rock interface. Front. Earth Sci. 2023, 10, 1113430. [Google Scholar] [CrossRef]
  18. Li, J.; Liu, A.-Y.; Xing, H. Study on Ground Settlement Patterns and Prediction Methods in Super-Large-Diameter Shield Tunnels Constructed in Composite Strata. Appl. Sci. 2023, 13, 10820. [Google Scholar] [CrossRef]
  19. Liang, J.-Y.; Cui, J.; Lu, Y.; Li, Y.-D.; Shan, Y. Limit analysis of shallow tunnels collapse problem with optimized solution. Appl. Mathmat. Model. 2022, 109, 98–116. [Google Scholar] [CrossRef]
  20. Yang, X.-L.; Yin, J.-H. Linear Mohr–Coulomb strength parameters from the non-linear Hoek–Brown rock masses. Int. J. Non-Linear Mech. 2006, 41, 1000–1005. [Google Scholar] [CrossRef]
  21. Sheorey, P.R.; Biswas, A.K.; Choubey, V.D. An empirical failure criterion for rocks and jointed rock masses. Eng. Geol. 1989, 26, 141–159. [Google Scholar] [CrossRef]
  22. Balmer, G. A general analysis solution for Mohr’s envelope. Proc. ASTM 1952, 52, 1260–1271. [Google Scholar]
  23. Lee, Y.-K.; Pietruszczak, S. Analytical representation of Mohr failure envelope approximating the generalized Hoek-Brown failure criterion. Int. J. Rock Mech. Min. Sci. 2017, 100, 90–99. [Google Scholar] [CrossRef]
Figure 1. Longitudinal profile of a single tunnel with a single track between Li and Ao sections.
Mathematics 13 03293 g001
Figure 2. Cross-sectional diagram of a single tunnel with single track between Li and Ao sections.
Mathematics 13 03293 g002
Figure 3. Boundary conditions and mesh for the numerical model.
Mathematics 13 03293 g003
Figure 4. Contour map of vertical settlement displacement when the thickness of the upper soil layer is 3 m: (a) overburden thickness of 2 m; (b) overburden thickness of 4 m; (c) overburden thickness of 6 m; (d) overburden thickness of 8 m; (e) overburden thickness of 10 m; (f) overburden thickness of 12 m.
Mathematics 13 03293 g004
Figure 5. Contour map of vertical settlement displacement with an upper soil layer thickness of 6 m: (a) overburden thickness of 2 m; (b) overburden thickness of 4 m; (c) overburden thickness of 6 m; (d) overburden thickness of 8 m; (e) overburden thickness of 10 m; (f) overburden thickness of 12 m.
Mathematics 13 03293 g005
Figure 6. Contour map of vertical settlement displacement with an upper soil layer thickness of 9 m: (a) overburden thickness of 2 m; (b) overburden thickness of 4 m; (c) overburden thickness of 6 m; (d) overburden thickness of 8 m; (e) overburden thickness of 10 m; (f) overburden thickness of 12 m.
Mathematics 13 03293 g006
Figure 7. Contour map of vertical settlement displacement with an upper soil layer thickness of 12 m: (a) overburden thickness of 2 m; (b) overburden thickness of 4 m; (c) overburden thickness of 6 m; (d) overburden thickness of 8 m; (e) overburden thickness of 10 m; (f) overburden thickness of 12 m.
Mathematics 13 03293 g007
Figure 8. Contour map of plastic zone with an upper soil layer thickness of 3 m: (a) overburden thickness of 2 m; (b) overburden thickness of 4 m; (c) overburden thickness of 6 m; (d) overburden thickness of 8 m; (e) overburden thickness of 10 m; (f) overburden thickness of 12 m.
Mathematics 13 03293 g008
Figure 9. Contour map of plastic zone with an upper soil layer thickness of 6 m: (a) overburden thickness of 2 m; (b) Overburden thickness of 4 m; (c) overburden thickness of 6 m; (d) overburden thickness of 8 m; (e) overburden thickness of 10 m; (f) overburden thickness of 12 m.
Mathematics 13 03293 g009
Figure 10. Contour map of plastic zone with an upper soil layer thickness of 9 m: (a) overburden thickness of 2 m; (b) overburden thickness of 4 m; (c) overburden thickness of 6 m; (d) overburden thickness of 8 m; (e) overburden thickness of 10 m; (f) overburden thickness of 12 m.
Mathematics 13 03293 g010
Figure 11. Contour map of plastic zone with an upper soil layer thickness of 12 m: (a) overburden thickness of 2 m; (b) overburden thickness of 4 m; (c) overburden thickness of 6 m; (d) overburden thickness of 8 m; (e) overburden thickness of 10 m; (f) overburden thickness of 12 m.
Mathematics 13 03293 g011
Figure 12. Deformation measurement points of the surrounding rock strata.
Mathematics 13 03293 g012
Figure 13. Vertical surface settlement displacement: (a) soil layer thickness of 3 m; (b) Soil layer thickness of 6 m; (c) soil layer thickness of 9 m; (d) soil layer thickness of 12 m.
Mathematics 13 03293 g013aMathematics 13 03293 g013b
Figure 14. Convergence displacement on the tunnel surface: (a) soil layer thickness of 3 m; (b) Soil layer thickness of 6 m; (c) soil layer thickness of 9 m; (d) soil layer thickness of 12 m.
Mathematics 13 03293 g014aMathematics 13 03293 g014b
Figure 15. Vertical displacement of surrounding rock inside the vault: (a) soil layer thickness of 3 m; (b) soil layer thickness of 6 m; (c) soil layer thickness of 9 m; (d) soil layer thickness of 12 m.
Mathematics 13 03293 g015aMathematics 13 03293 g015b
Figure 16. Internal vertical displacement of surrounding rock at arch bottom: (a) soil layer thickness of 3 m; (b) soil layer thickness of 6 m; (c) soil layer thickness of 9 m; (d) soil layer thickness of 12 m.
Mathematics 13 03293 g016aMathematics 13 03293 g016b
Figure 17. Horizontal displacement of surrounding rock inside the arch: (a) soil layer thickness of 3 m; (b) soil layer thickness of 6 m; (c) soil layer thickness of 9 m; (d) soil layer thickness of 12 m.
Mathematics 13 03293 g017aMathematics 13 03293 g017b
Figure 18. Soil–rock strata underground tunnel surrounding rock failure model.
Mathematics 13 03293 g018
Figure 19. The variation diagram of settlement displacement with overburden thickness: (a) settlement displacement variation with overburden thickness when the soil layer thickness is 3 m; (b) settlement displacement variation with overburden thickness when the soil layer thickness is 6 m; (c) settlement displacement variation with overburden thickness when the soil layer thickness is 9 m; (d) settlement displacement variation with overburden thickness when the soil layer thickness is 12 m.
Mathematics 13 03293 g019
Figure 20. The influence curve of different parameters on the critical overburden thickness Hr: (a) rock mass cohesion; (b) internal friction angle of rock mass; (c) thickness of the upper soil layer; (d) support force.
Mathematics 13 03293 g020aMathematics 13 03293 g020b
Table 1. The selected physical and mechanical parameters for the numerical simulation.
Layer NamesDensity
(g/cm3)
Young’s Modulus
(MPa)
Poisson’s RatioFriction
(°)
Cohesion
(kPa)
Silty Clay1.96.80.451921
Weathered Limestone2.3400.3335150
Table 2. Comparison of calculation results for tunnel crown overburden thickness.
Overburden ThicknessOptimal Overburden Thickness Range in Numerical SimulationsCritical Overburden Thickness Calculated by Theoretical Methods
3 m1–3 m2.26 m
6 m4–6 m4.29 m
9 m5–7 m6.12 m
12 m6–8 m7.71 m
Disclaimer/Publisher’s Note: The statements, opinions and data contained in all publications are solely those of the individual author(s) and contributor(s) and not of MDPI and/or the editor(s). MDPI and/or the editor(s) disclaim responsibility for any injury to people or property resulting from any ideas, methods, instructions or products referred to in the content.