Article

Product Design Decision-Making for Uncertain Environments: An Integrated Framework

by
Weifeng Xu
,
Xiaomin Cui
* and
Haitao Peng
Architecture and Design College, Nanchang University, Nanchang 330031, China
*
Author to whom correspondence should be addressed.
Mathematics 2025, 13(20), 3257; https://doi.org/10.3390/math13203257
Submission received: 24 August 2025 / Revised: 30 September 2025 / Accepted: 2 October 2025 / Published: 11 October 2025

Abstract

High uncertainty in new product development is primarily driven by multidimensional risks arising from dynamic interactions among factors including customer requirements (CRs), design characteristics (DCs), and solution decisions. To effectively address decision-making risks in uncertain environments, an integrative framework is proposed incorporating the Best–Worst Method (BWM), Interval-Valued Intuitionistic Fuzzy Quality Function Deployment (IVIF-QFD), and the IVIF-VlseKriterijumska Optimizacija I Kompromisno Resenje (IVIF-VIKOR) approach. Initially, CRs are identified through market research and focus group interviews, with weights determined by the BWM to enhance consensus and efficiency in judgment. Subsequently, an IVIF-QFD model is constructed. This model effectively addresses the fuzziness in expert judgments during the translation of CRs into DCs, strengthening its expressive capability in uncertain environments. Finally, candidate solutions are generated for critical DCs, and the IVIF-VIKOR method is employed to rank these solutions, identifying the Pareto-optimal solution. The framework’s effectiveness is validated by a steering wheel design, in addition, sensitivity analysis and comparative experiments are employed to quantify the robustness of the framework against parameter variations. This paper not only theoretically establishes a collaborative decision-making paradigm for uncertain environments but also provides an operational end-to-end decision support toolchain.

1. Introduction

With intensifying global competition and increasing market dynamics, scientifically driven product design serves as a strategic fulcrum for enterprises to balance demand responsiveness and sustainable innovation [1]. Especially, for product design in uncertainty environments, decision-making must dynamically adapt to evolving risks. Nevertheless, existing decision-making frameworks lack the capability to sustain uncertainty management across the product lifecycle, constrained by fragmented stages, static modeling, and systemic vulnerabilities [2]. Therefore, developing an integrated decision-making framework under uncertainty constitutes a critical pathway to achieving risk control, scientific decision-making, and resource efficiency [3].
In design-driven new product development, decision-making methods usually align with the sequential phase of “customer requirements (CRs) weighting—design characteristics (DCs) translation—design evaluation” [4]. However, existing approaches exhibit limitations across these phases, failing to satisfy the dual demands for decision accuracy and robustness in uncertainty environments.
In the CRs weighting phase, traditional methods exhibit heavy reliance on subjective expert judgments, such as the Delphi technique, making them vulnerable to authority bias and group conformity effects, ultimately resulting in distorted weighting outcomes [5]. While introducing pairwise comparisons to enhance objectivity, the Analytic Hierarchy Process (AHP) faces exponentially growing complexity in judgment matrices as criteria increase [6]. In addition, cognitive fuzziness in expert judgments frequently causes consistency check failures [7,8]. Compared to the aforementioned methods, the Best–Worst Method (BWM) employs a best-to-worst comparison strategy. This approach requires only limited critical pair-wise comparisons to generate highly consistent weights, significantly enhancing the efficiency and reliability of weighting [9].
In DCs translation, through structured House of Quality matrices, Quality Function Deployment (QFD) is a method that converts vague Voice of the Customer into quantifiable technical parameters [10,11]. Its industry-wide adoption stems from proven advantages in enhancing product development efficiency and market alignment. However, traditional QFD inherently struggles to characterize the subjective and fuzzy nature of human preferences constrained by its dependence on precise numerical scales or binary judgments [12,13]. To enhance its capacity for characterizing uncertainty in user preferences, Interval Valued Intuitionistic Fuzzy (IVIF) sets are integrated into QFD’s framework, forming the IVIF-QFD model.
In the design evaluation stage, the VlseKriterijumska Optimizacija I Kompromisno Resenje (VIKOR) method has garnered extensive attention for its capability to seek Pareto-optimal solutions that maximize group utility while minimizing individual regret [14]. The method demonstrates robust stability and interpretability in handling conflicting criteria through its compromise ranking mechanism, and has been widely applied in fields such as product selection and supply chain management [15,16]. Traditional VIKOR is inherently limited by precise inputs, restricting its ability to address pervasive linguistic fuzziness and information gaps in design evaluation [17]. To overcome this limitation, IVIF-VIKOR is proposed to enable resilient solution ranking and decision support under uncertainty.
Although the BWM, IVIF-QFD, and IVIF-VIKOR enhance decision-making scientific rigor and robustness at distinct stages of product design, they are predominantly applied in isolation, lacking systematic integration across the development cycle. Current research rarely develops collaborative decision-making frameworks for uncertainty conditions. Consequently, establishing a full-process collaborative framework spanning requirement analysis, design translation, and solution evaluation has emerged as a critical challenge for enhancing holistic decision efficacy.
To address these challenges, this paper proposes an integrated decision-making framework that combines the BWM, IVIF-QFD, and IVIF-VIKOR approaches. This unified system establishes a comprehensive decision-support tool for product design in uncertain environments. The framework leverages the BWM to efficiently determine weights for CRs through a best–worst pairwise comparison process, enhancing both consistency and reliability in weight derivation. Crucially, it employs IVIF as a consistent modeling language to capture evaluation uncertainty—overcoming traditional QFD and VIKOR limitations that depend on exact numerical inputs. This enables robust representation and propagation of ambiguous expert judgments throughout the decision process. By structurally integrating these three methodologies, our approach creates a logically coherent, operationally practical decision-making paradigm. This integration significantly strengthens the scientific rigor of new product development decisions while improving their likelihood of success.
The remainder of this paper is structured as follows: Section 2 reviews relevant research progress. Building on this foundation, in Section 3, the integrated BWM-IVIF-QFD-VIKOR framework is elaborated. A case of automotive steering wheel design is presented in Section 4. Comparative experiments and sensitivity analyses are performed to evaluate the performance of the integrated framework in Section 5. Finally, Section 6 concludes conclusions and future research.

2. Literature Review

2.1. Advances in QFD for Product Design

The concept of QFD was first introduced by Yoji Akao in Japan in 1966 [18]. This structured approach is employed to address CRs [19]. Furthermore, it functions as a conduit for translating CRs into engineering specifications, thereby establishing the foundation for product enhancement and optimization. Among the key components of QFD, the House of Quality stands as the central framework. It organizes the “voice of the customer” and “voice of technology”, translating CRs into clear DCs. Research by Hauser and Clausing suggested that QFD can reduce product development time by 50% and lower costs by 30% [20]. Now QFD becomes a pervasive tool in the realm of product design [21]. For instance, Lai et al. [22] combined the Kano model with QFD to address CRs, thus guiding new product development. Tu et al. [23] integrated AHP with QFD to refine customer requirements and developed a sports headset. Furthermore, Karasa et al. [24] proposed a QFD method based on the Decision-Making Trial and Evaluation Laboratory (DEMATEL) approach to identify causal relationships among technical characteristics in product design. Porto de Lima et al. [25] proposed a novel hybrid decision-making method that integrates AHP, QFD, and the Preference Ranking Organization Method for Enrichment Evaluations II to select the optimal product packaging design. However, the above studies focused on improving indicator weights and did not comprehensively expand on QFD.
Recent developments in information technology and decision analysis methods have led to the integration of QFD with tools like Multi-Criteria Decision-Making (MCDM) methods and Fuzzy Set theory. This integration has formed a more comprehensive framework for design optimization. Yazdani et al. [26] proposed a fuzzy multi-attribute decision framework that combines QFD and Grey Relational Analysis (GRA). This innovative approach aims to enhance the accuracy and flexibility of the decision-making process by leveraging the principles of fuzzy theory. This approach has been demonstrated to optimize complex decision-making issues in the product design process. Ocampo et al. [27] proposed a multi-stage QFD-MCDM framework, integrating decision support tools such as fuzzy AHP, DEMATEL, and Analytic Network Process (ANP). This framework facilitates decision optimization across various stages of product development.
Despite considerable progress in the implementation of QFD in product design, a major challenge remains in practice: the integration of QFD across product planning, design practice, and alternative evaluation to establish an efficacious closed-loop product design process. This constitutes a critical direction for future research.

2.2. Fuzzy and Fuzzy Extensions

The introduction and development of fuzzy set theory can be traced back to the necessity for more effective descriptions and handling of uncertainty and vagueness. In 1965, Zadeh introduced the concept of fuzzy sets, which, by incorporating membership functions, broke free from the binary “either-or” logic of traditional set theory. This breakthrough provided an effective tool for addressing the fuzziness and uncertainty in decision-making problems [28,29]. However, traditional fuzzy set theory has shown limitations when applied to scenarios with high uncertainty, imprecise information, or divergent expert opinions.
In recent years, researchers extended fuzzy set theory in various ways, thereby enriching its theoretical framework and providing more effective solutions to practical problems. For instance, complex fuzzy sets extend their range to the unit circle on the complex plane, providing a mathematical framework for describing set membership using complex numbers [30]. The function value of the Q[ε]-fuzzy set can be infinitesimal or infinitely close to a rational number in the interval [0, 1]. Its rank is not the unit interval of the real number field, but the unit interval of the hyperrational number field Q[ε] [31]. In addition, Singh et al. [32] explored the application of Triangular Fuzzy sets in decision-making, demonstrating its effectiveness in optimizing transportation networks and supply chains. Sen et al. [33] integrated decision support methods, including Intuitionistic Fuzzy (IF)-Technique for Order Preference by Similarity to Ideal Solution (TOPSIS), IF-Multi-Objective Optimization by Ratio Analysis, and IF-GRA, to assist in selecting sustainable suppliers. Similarly, Chen et al. [34] utilized a combination of interval type-2 fuzzy sets, the DEMATEL method, and the 2-tuple linguistic VIKOR method to effectively address issues such as standardization, causal relationships, and fuzzy uncertainty. However, such fuzzy extensions primarily consider membership and non-membership in scoring, making it difficult to handle uncertainty issues in complex environments. To simulate the hesitation in human decision-making, Peng et al. [35] proposed two multi-criteria decision-making methods based on Hesitant Fuzzy sets (HFS) and Prospect Theory, which effectively combine hesitant fuzzy information with the irrational preference modeling capabilities of Prospect Theory. Kahraman et al. [36] applied HFS and type-2 fuzzy sets to QFD, thereby providing substantial support for decision evaluation. These methods are particularly well-suited for scenarios where the preferences of relevant decision-makers are unclear or affected by cognitive biases.
In order to combine the advantages of the above fuzzy methods, in subsequent research, Khan et al. [37] proposed the Intuitionistic Hesitant Fuzzy Rough Set (IHFRS) model, which combined with the IHF-TOPSIS method, successfully addressed multi-criteria decision challenges in the evaluation of intuitionistic hesitant fuzzy data. Ali et al. [38] pioneered a novel integration of IHFS with Set Pair Analysis theory, introducing a hybrid model, the Intuitionistic Hesitant Fuzzy Connection Number Set. This innovative development provides an advanced algorithm for resolving multi-criteria fuzzy decision-making problems.
The above fuzzy method combines intuitive fuzzy and hesitant fuzzy to more accurately simulate and handle fuzziness and uncertainty, opening new directions for research. However, in scenarios involving high uncertainty and a large volume of fuzzy information, there is a need for more flexible and precise fuzzy models. In response, the IVIF method, which considers both membership, non-membership and hesitation degrees in interval form, has been shown to enhance flexibility and accuracy in decision-making processes [39,40]. IVIF has demonstrated unique advantages in group decision-making, data analysis, and MCDM. As the theory continues to evolve, it is expected to play an increasingly significant role in addressing complex decision-making challenges across various fields.

2.3. MCDM in Design Decision-Making

The diversity of design goals and the complexity of practical problems introduce various uncertainties, making the product decision-making process more challenging [40]. In order to address these challenges, experts have employed a variety of MCDM methods to optimize design evaluations. For instance, Yang et al. [41] employed AHP to calculate the optimal design objectives, ensuring that the product possesses the required characteristics. Ayağ et al. [42] proposed an approach based on the ANP, which considers both customer and company needs during concept selection. Meanwhile, Sharma et al. [43] conducted a comparative analysis of the strengths and weaknesses of AHP and TOPSIS, highlighting the strengths of AHP in managing complex hierarchical structures, while underscoring the advantages of TOPSIS in terms of computational efficiency and the handling of data outliers. In further research, Yu et al. [44] proposed a multi-criteria decision model based on TOPSIS and the Multi-Objective Genetic Algorithm, combining fuzzy linguistic terms and entropy weighting to effectively address multi-criteria issues in design evaluation. Seyed et al. [45] presented a decision model that integrates TOPSIS, Data Envelopment Analysis and Complex Proportional Assessment. This combination of methods can enhance decision accuracy and reliability.
Furthermore, several evaluation models have been employed in design concept assessment, including PROMETHEE [46], Evaluation Based on Distance from Average Solution [47], and VIKOR [48]. Among them, VIKOR has garnered significant attention for its ability to strike a balance between group satisfaction and individual regret [49]. As a tool in MCDM, VIKOR has proven particularly effective when decision-makers encounter difficulties in articulating their preferences during the preliminary stages of system design.
In order to enhance VIKOR’s adaptability in fuzzy and uncertain environments, Jin et al. [50] extended VIKOR by introducing the IVIF, enabling it to more precisely handle decision-makers’ fuzzy preferences. The IVIF-VIKOR method incorporates the interval-valued characteristics of expert evaluations, demonstrating a clear advantage in addressing potential uncertainty in decision-making. Thus, this study employs IVIF-VIKOR for the optimal selection of design alternatives.

3. Proposed Framework

In this paper, we propose a hybrid decision-making method that integrates the BWM, IVIF, QFD, and VIKOR, as shown in Figure 1. Firstly, assemble a cross-disciplinary team of experts combined with market research and the Focus Group method to identify key CRs, and use the Delphi method to refine and confirm corresponding product DCs. Next, the BWM is employed to calculate the relative weights of CRs. Then, a relationship matrix between CRs and DCs is constructed. This is achieved by employing IVIF and linguistic scales, with the importance of each DC calculated and ranked. Finally, based on the importance of DCs, multiple product alternatives are designed, and the IVIF-VIKOR method is used to select the optimal design alternative. This method provides systematic decision support for automotive manufacturers and designers.

3.1. Application of BWM for Customer Requirement Weighting

The BWM process begins with identifying the set of customer requirements R = R 1 , R 2 , , R n through surveys or expert consultations. For steering wheel design, typical Rs include “Interaction” and “aesthetic appeal”. The best ( R B ) and worst ( R W ) criteria are selected based on their perceived importance. Experts then provide two vectors:
  • Best-to-Others (BO): Ratings comparing R B to each R j using a 1–9 scale, where 1 indicates equal importance and 9 extreme superiorities.
  • Others-to-Worst (OW): Ratings comparing each R j to R W on the same scale.
These vectors form the basis for deriving optimal weights w j by solving the linear programming problem:
m i n ξ  
s . t .   w B w j a B j ξ , j
w j w W a j W ξ , j
j w j = 1 , w j 0
Here, a B j and a j W are elements from the BO and OW vectors, respectively, and ξ measures consistency. A smaller ξ indicates higher reliability in the derived weights.

3.2. Interval-Valued Intuitionistic Fuzzy

3.2.1. Preliminaries of Fuzzy Set Theory

Fuzzy set theory extends classical set theory by introducing membership degrees between 0 and 1 to represent partial truth [29]. A fuzzy set A in universe X is defined as:
A = x , μ A ( x ) x X
where μ A ( x ) [ 0 , 1 ] denotes the membership degree of x in A . While useful for modeling gradations, fuzzy sets cannot capture the hesitation present when experts assess design parameters. IFS, which are defined as in Equation (6), address this limitation by incorporating both membership μ A ( x ) and non-membership v A ( x ) degrees [51]:
A ˜ = { ( x , ( μ A ( x ) , v A ( x ) ) x U }
where μ A : U [ 0 , 1 ] , v p : U [ 0 , 1 ] and 0 μ A ( x ) + v A ( x ) 1 .
The hesitation margin π A ( x ) = 1 μ A ( x ) v A ( x ) quantifies the uncertainty in assigning membership values, making IFS particularly suitable for design evaluations where experts might express concurrent positive and negative judgments about a characteristic’s importance.
The addition, multiplication of two SVIF numbers, multiplication by a scalar, and power operations on SVIF numbers are presented as in Equations (7)–(10), respectively:
A ˜ B ˜ = ( μ A + μ B μ A μ B , v A v B )
A ˜ B ˜ = ( μ A μ B , v A + v B v A v B ) ,
α A ¯ = ( 1 ( 1 μ A ) α , v A α )
A ˜ α = ( μ A α , 1 ( 1 v A ) α )
where α is a real value and α > 0.
The score function of SVIF numbers is presented in Equation (11):
S A ( x ) = 1 v A ( x ) 2 μ A ( x ) v A ( x )

3.2.2. Interval-Valued Intuitionistic Fuzzy Sets (IVIFS)

Building upon IFS, IVIFS further generalize the membership and non-membership degrees to intervals rather than precise values [51].
An IVIFS A ˜ over X is defined as [52]:
A ˜ = { x , μ A ˜ ( x ) , v A ˜ ( x ) | x X }
where
μ A ˜ D [ 0 , 1 ] , v A ˜ ( x ) D [ 0 , 1 ]
with the condition 0 sup ( μ A ˜ ( x ) ) + sup ( v A ˜ ( x ) ) 1 , x X .
The lower and upper end points are represented by the symbols μ A ˜ L ( x ) ,   μ A ˜ U ( x ) , v A ˜ L ( x ) , and v A ˜ U ( x ) , respectively. Then, an IVIFS A ˜ is given by Equation (14) [52]:
A ˜ = { x , [ μ A ˜ L ( x ) , μ A ˜ U ( x ) ] , [ v A ˜ L ( x ) , v A ˜ U ( x ) ] | x X }
where 0 μ A ˜ U ( x ) + v A ˜ U ( x ) 1 ,   μ A ˜ L ( x ) 0 ,   v A ˜ L ( x ) 0 .
For any x , the hesitancy degree can be computed by Equation (15):
π A ˜ ( x ) = 1 μ A ˜ ( x ) v A ˜ ( x ) = ( [ 1 μ A ˜ U ( x ) v A ˜ U ( x ) ] , [ 1 μ A ˜ L ( x ) v A ˜ L ( x ) ] )
For convenience, let μ A ˜ ( x ) = [ μ L , μ U ] ,   v A ˜ ( x ) = [ v L , v U ] , so A ˜ = ( [ μ L , μ U ] , [ v L , v U ] ) .
Let A ˜ = ( [ μ L , μ U ] , [ v L , v U ] ) be an IVIF number. The following score function is proposed for defuzzifying A ˜ [53]:
I ( A ˜ ) = μ L + μ U + ( 1 v L ) + ( 1 v U ) + μ L × μ U ( 1 v L ) × ( 1 v U ) 4

3.3. Ranking the Importance of DCs Using IVIF-QFD

QFD translates CRs into measurable DCs through a structured matrix known as the House of Quality. The conventional QFD relationship can be expressed as:
R = W × Q F D
where W represents the weight vector of CRs, and QFD denotes the relationship matrix between CRs and DRs. In crisp QFD, both W and Q F D contain precise numerical values, which often fail to capture the fuzziness in customer preferences and technical correlations.
The integration of IVIFS with QFD further enhances its capability to handle uncertainty. By representing both weights and relationships as interval-valued intuitionistic fuzzy numbers, we lay the foundation for our proposed IVIF-QFD integration, which will be detailed in Section 4.

3.4. Evaluating and Ranking Design Alternatives Using IVIF-VIKOR

Similarly to IVIF-QFD, IVIF-VIKOR can be viewed as first applying Interval-Valued Intuitionistic Fuzzy sets (IVIFS) to evaluate each design alternative against corresponding criteria through fuzzy scoring, and then defuzzifying these values into crisp scores before applying the VIKOR method for ranking. Therefore, in this section, we focus only on the VIKOR method.
VIKOR identifies compromise solutions by balancing group utility (majority benefit) and individual regret (minimum opposition) [15]. Given m alternatives evaluated on n criteria with weights w j , the method proceeds as:
  • Determine the best f j * and worst f j values for each criterion:
f j * = max i x i j , f j = min i x i j for   benefit   criteria
2.
Compute the group utility S i and individual regret R i for each alternative:
S i = j = 1 n w j f j * x i j f j * f j
R i = max j ( w j f j * x i j f j * f j )
3.
Calculate the compromise index Q i :
Q i = v S i S * S S * + ( 1 v ) R i R * R R *
where S * = min i S i , S = max i S i , R * = min i R i , R = max i R i , and v 0 , 1 balances utility/regret v = 0.5 (typically).
The alternatives are ranked by Q i values, with the smallest Q i representing the best compromise solution that satisfies both majority acceptance and minimum individual opposition.
These three components form the backbone of our integrated framework, addressing, respectively, the challenges of efficient weighting, uncertainty propagation, and balanced alternative selection in engineering design optimization.

4. Case Study

The steering wheel design is a crucial component of a vehicle, directly impacting on the driving experience. It plays an essential role in ensuring safety, comfort, and operational convenience. In automotive design, addressing diverse CRs and meeting complex, multi-dimensional design standards present a significant challenge for design teams. As a result, developing a scientific decision-making process based on real customer experiences and selecting the optimal design solution through a systematic, data-driven evaluation mechanism have become critical priorities. To demonstrate the robustness and effectiveness of the proposed method, we use automotive steering wheel design decision-making as a case study. The process begins with gathering CRs through expert interviews and market research. Next, the Delphi method is used to derive the corresponding DCs. The Best–Worst Method (BWM) is then applied to calculate the weights of CRs. Following this, a fuzzy relationship matrix between CRs and DCs is developed using IVIF-QFD. The linear weighting method is then used to rank the importance of DCs. Based on the identified DCs, six steering wheel alternatives are designed. Finally, the IVIF-VIKOR method is applied to prioritize the available alternatives.

4.1. Determine Customer Requirements and Design Characteristics

4.1.1. Assembling an Expert Team

The steering wheel design decision was informed by a series of surveys and evaluations. To ensure the reliability of the decision, an expert team of 38 participants with a range of ages and driving experience was assembled. The team comprised 24 male and 14 female participants, with ages ranging from 22 to 52 years. The gender distribution was 63.16% male and 36.84% female. In terms of driving experience, 8 participants had less than two years of experience, 10 had between 2 and 5 years, and 20 had more than 5 years of experience. The participants came from diverse professional backgrounds, including 14 product design instructors, 14 taxi drivers, and 10 automotive designers (Table 1).

4.1.2. Identify CRs and DCs

To obtain customer requirements and design characteristics for steering wheel products, a three-step experimental process was established, as follows:
Step 1. To this end, we conducted one-on-one interviews, combining direct and indirect questioning methods. Through these interviews, we engaged in in-depth discussions with participants to explore their requirements and opinions on steering wheel design. This approach enabled us to obtain initial requirements.
Step 2. In accordance with the findings of preliminary market research, the valid CRs were filtered, and invalid requirements were eliminated. The Focus Group method was then applied for the purpose of analysis. The results of the study identified six primary requirements: The following factors must be considered: appearance, touching, humanized interaction, extended functions, safety, and sustainability.
Step 3. The research team utilized the Delphi Method to analyze and discuss the six CRs, with the objective of identifying DCs that are aligned with CRs. Following a series of iterations, six characteristics were obtained for the first-level requirement layer and 13 for the second-level design characteristics layer. These DCs were used to assess the design of the steering wheel (Table 2).

4.2. Calculating Customer Requirement Weights by BWM

The BWM is a technique used to calculate subjective weights by comparing multiple criteria with the best and worst standards. This structured comparison method simplifies data processing and calculation, reducing errors and enhancing the reliability of the results. In this study, a nine-point paired comparison scale was designed, and 20 participants were randomly selected from the 38 interviewees to participate in the survey. Given the technical nature of the questionnaire, all respondents were required to have both expertise in automotive design and extensive driving experience. We successfully collected feedback from 20 experts, of which 4 questionnaires were discarded due to failure to meet the BWM consistency requirements. Therefore, the final set of valid questionnaires used for analysis was 16.
The consistency of the comparison matrix obtained from the questionnaire was tested using Equations (1)–(4) in Section 3.1. The results showed that the matrix had good consistency (Table 3).
By constructing an aggregated comparison matrix, establishing a system of linear equations, and calculating the solution, followed by the normalization of the results, we derived the relative weights of six customer requirements in Figure 2.

4.3. Calculation of Design Characteristics Importance by IVIF-QFD

4.3.1. Constructing the CRs-DCs Relationship Matrix by IVIF

To minimize information uncertainty and improve the objectivity and accuracy of the evaluation results, this study employs linguistic scoring to represent the impact of DCs on CRs. A team of 10 experts from the expert group was invited to use the linguistic scoring scale in Table 4 for customer evaluation [54]. It was assumed that each expert carried the same weight. The linguistic scores were then converted into IVIF scores and aggregated into a relationship matrix based on the average expert ratings (Table 5).

4.3.2. Defuzzified Relationship Matrix

Following the acquisition of the Aggregation matrix of IVIF expert scores (Table 5), defuzzification was conducted utilizing Equation (16) to derive the defuzzified relationship matrix. To visualize the strength of relationships, a relationship heatmap was generated in Figure 3.

4.3.3. Calculating the Importance of Steering Wheel Design Characteristics

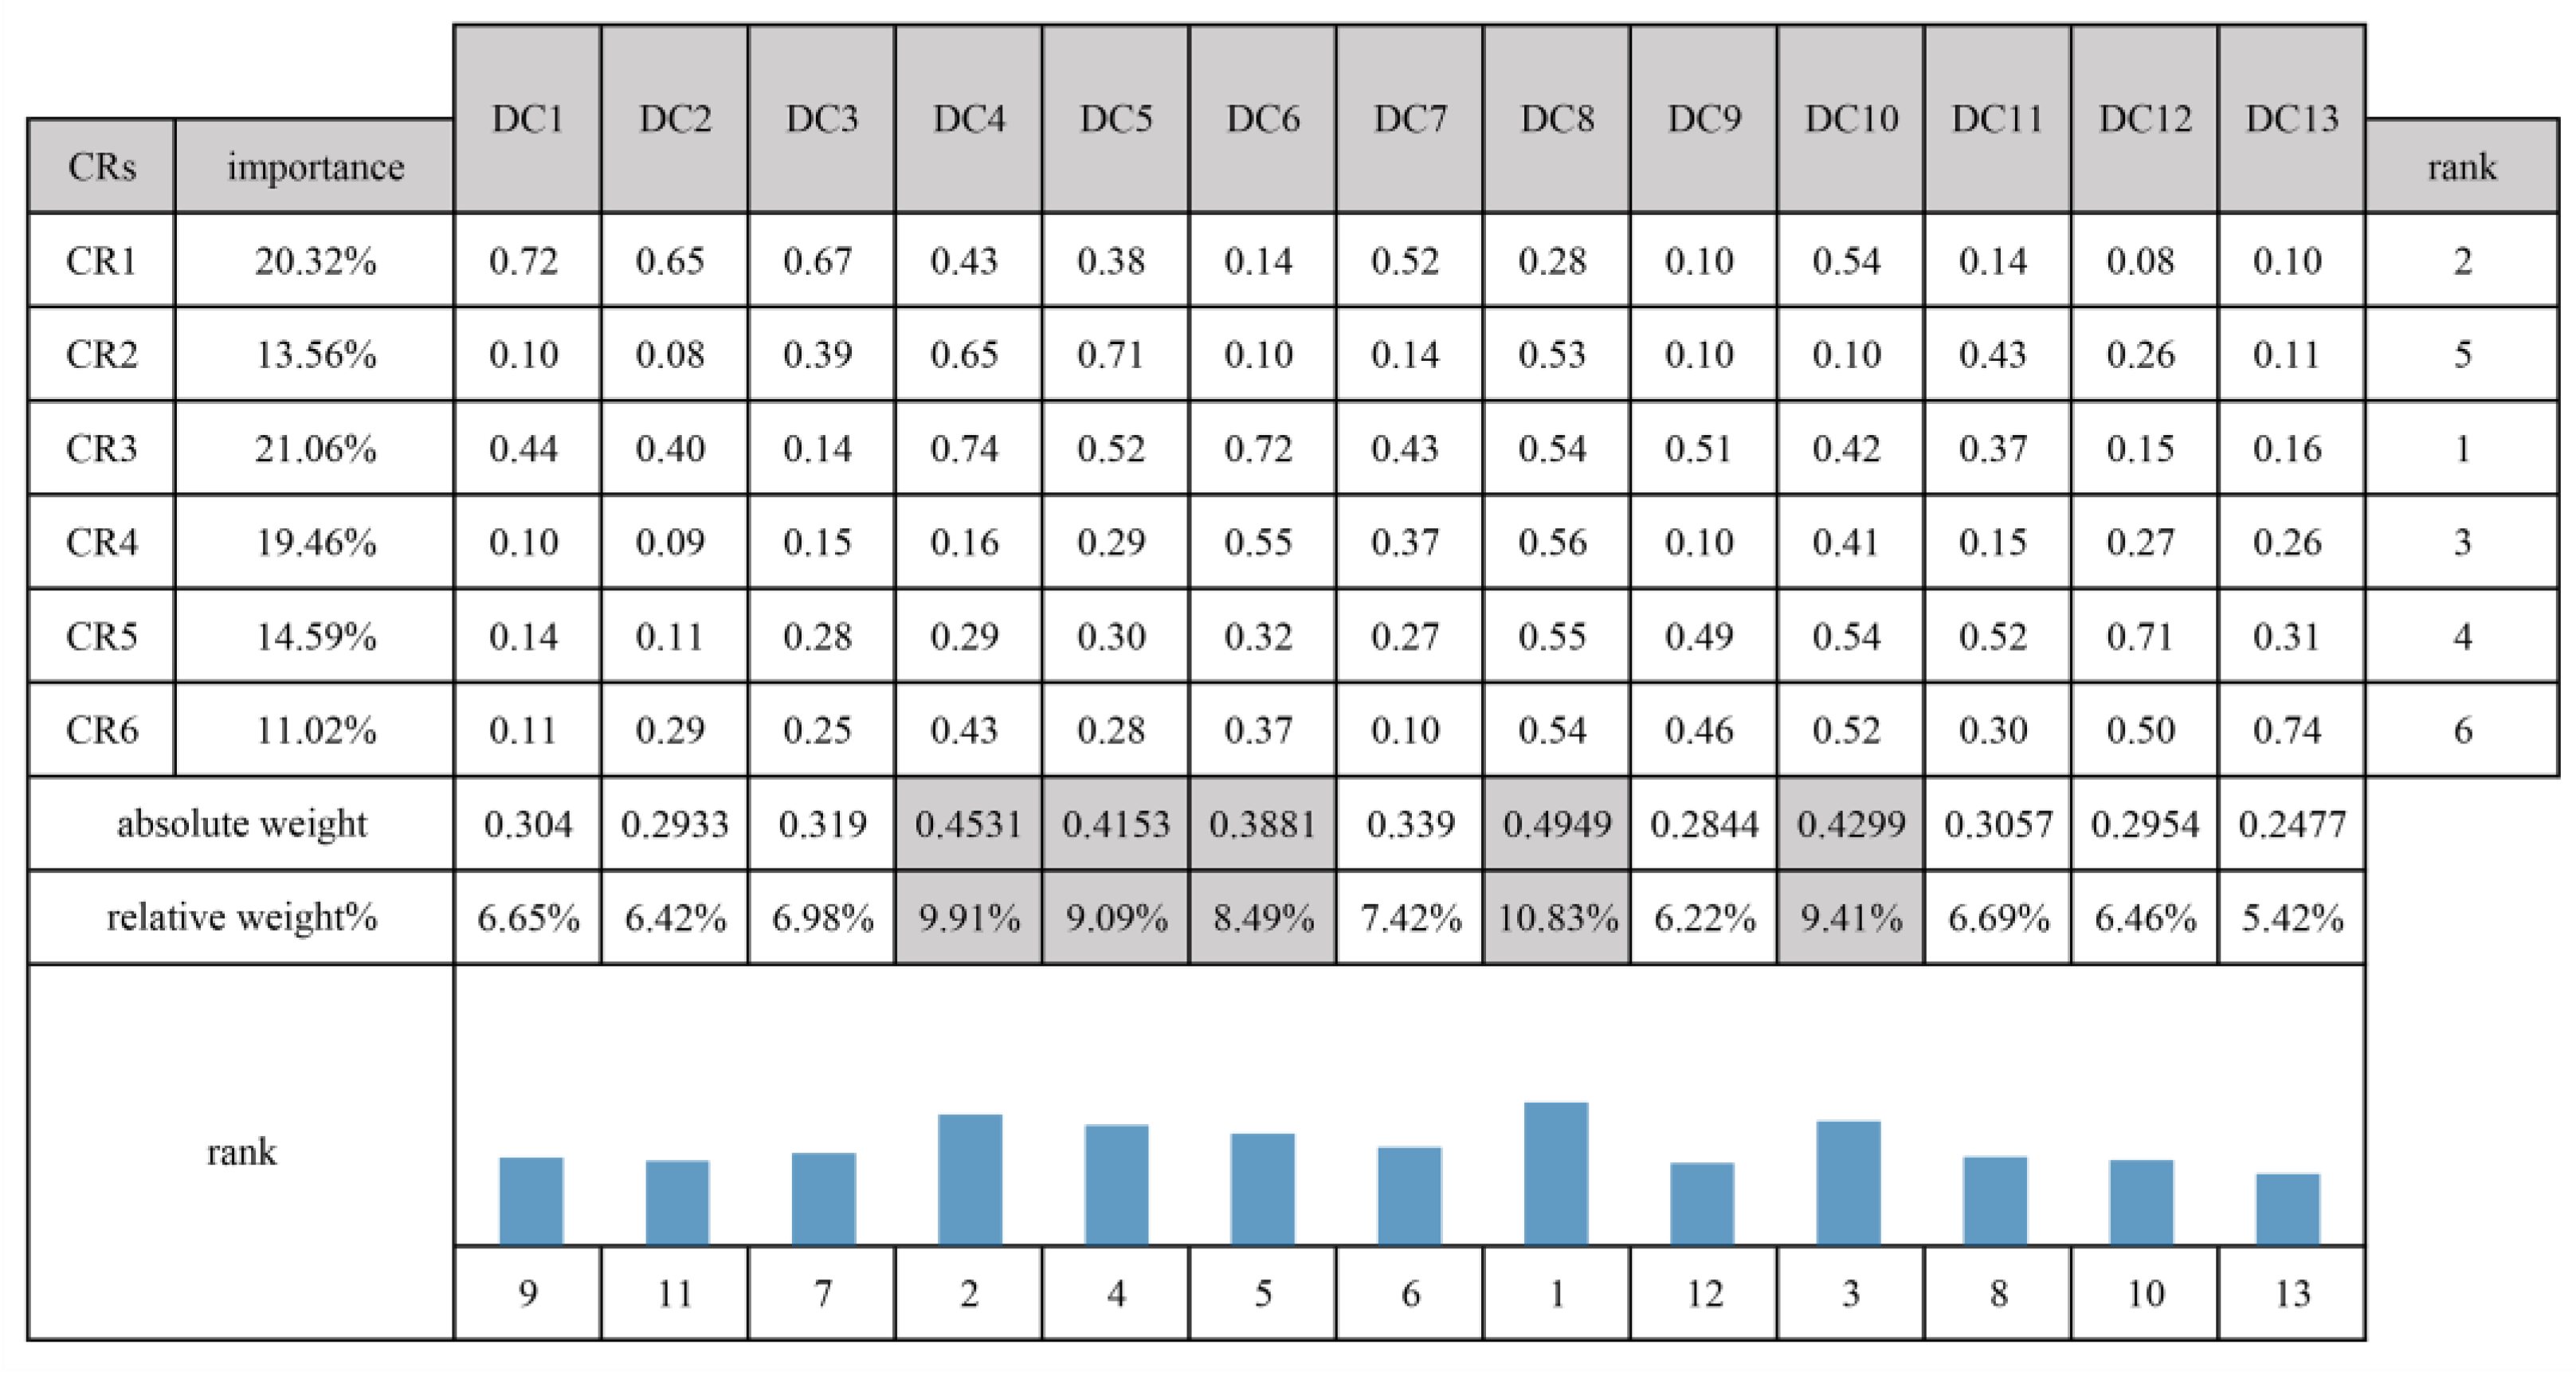
The weights of the CRs derived from the above process were incorporated into the CRs section of the QFD model. In a similar manner, DCs were placed in the DCs section of the QFD model. A relationship matrix was then constructed, and the importance ranking of DCs was calculated (Figure 4). The top five ranked DCs were DC8, DC4, DC10, DC5, and DC6, with weights of 10.83%, 9.91%, 9.41%, 9.09%, and 8.49%, respectively. These top five design characteristics were: Reasonable layout, Skin-friendly materials, Customizable buttons, Ergonomic design and Real-time feedback.

4.4. Design and Sequencing of Steering Wheel Conceptual Schemes

4.4.1. Six Steering Wheel Conceptual Design Schemes

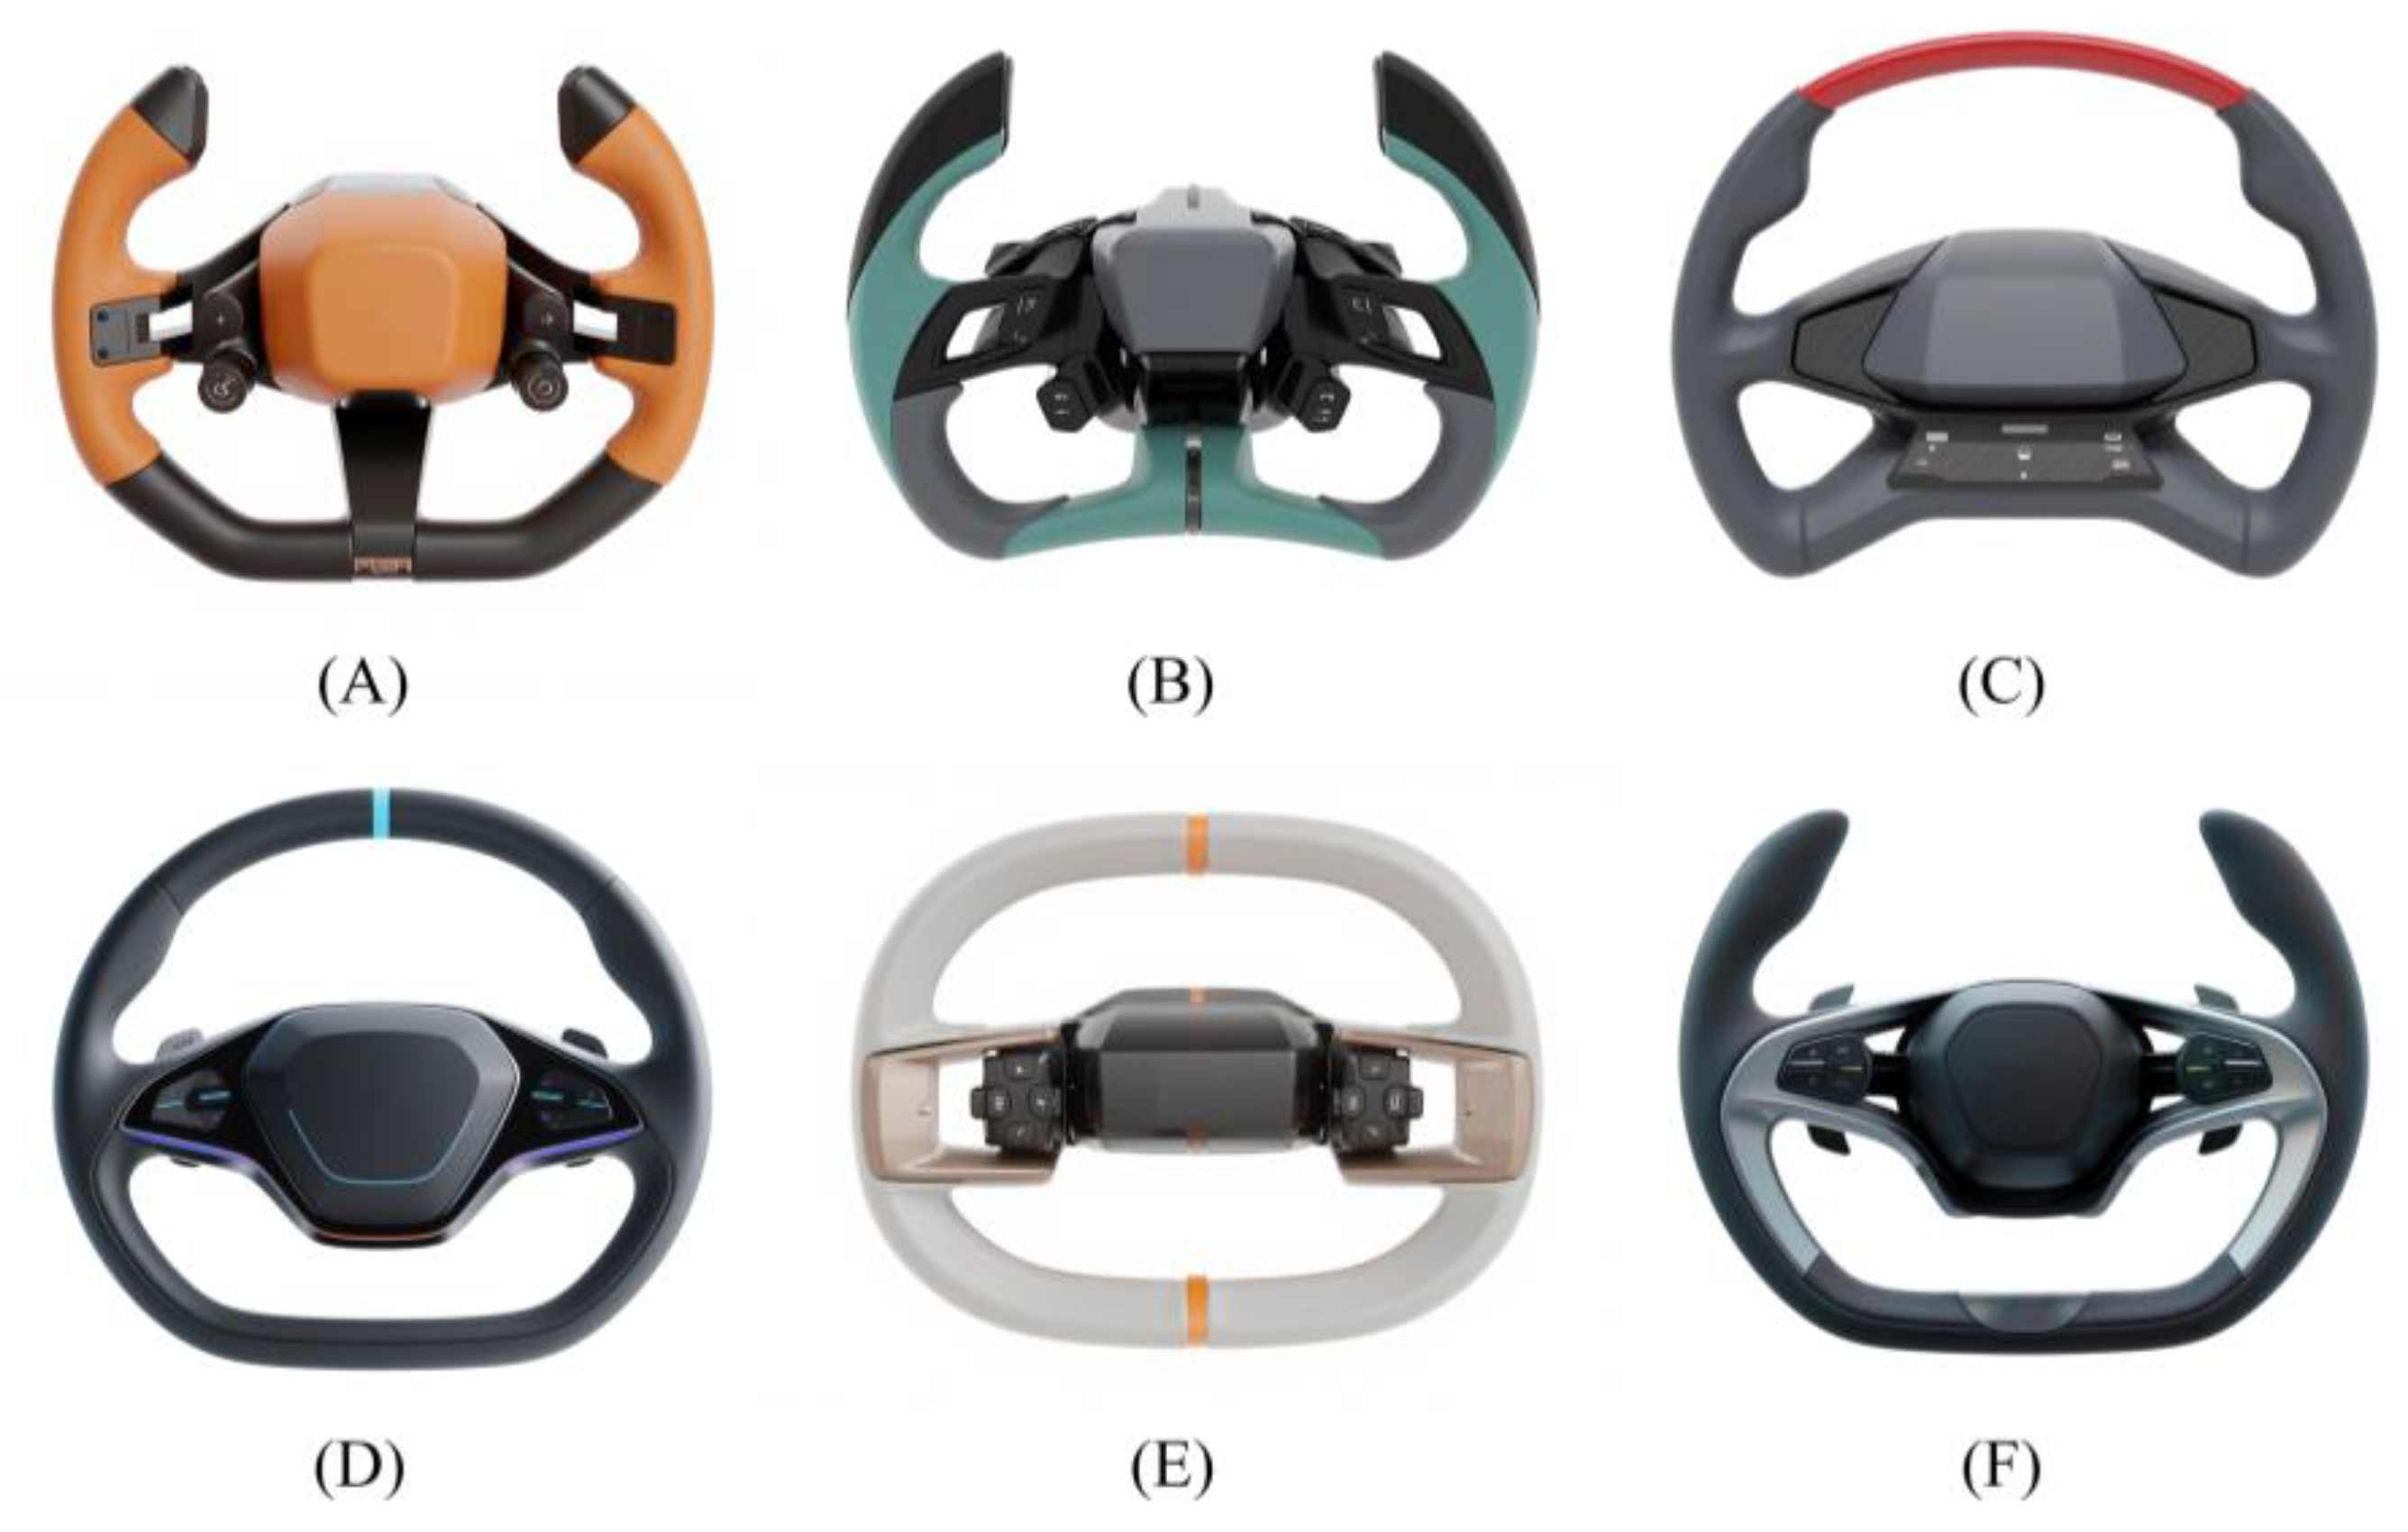
Based on the ranking of DCs in Table 4, the steering wheel design should prioritize factors such as “Reasonable layout”, “Skin-friendly materials”, “Customizable buttons”, “Ergonomic design” and “Real-time feedback”. To address these factors, we designed six smart automotive steering wheels (Figure 5). Each design aims to provide a convenient and intelligent driving solution, meeting diverse customer requirements and enhancing the overall driving experience. To ensure the feasibility of these six designs, we also referenced several existing steering wheels available on the market. These products, sourced from renowned automotive manufacturers, provide substantial reference value.
Figure 5A,B,F: These semi-spoke steering wheel designs are ergonomically shaped to fit the contours of the hand, providing a comfortable grip and reducing fatigue. The simple adjustment buttons facilitate precise operation, while the combination of leather and plastic materials enhances the tactile experience. The color scheme, featuring orange-gray and green-gray, creates a dynamic and fashionable appearance, while darker tones convey a sense of luxury, showcasing the fusion of modernity and aesthetics.
Figure 5C: This minimalist, semi-circular steering wheel features functional buttons and an information display on the lower section, with customizable touch panels on both sides for ease of use. Constructed from lightweight composite plastic, it reduces overall weight. The primary color is gray, with a red decorative stripe at the top to improve visibility and help the driver determine whether the steering wheel is centered.
Figure 5D,E: These two modern, minimalist steering wheel designs are shaped to fit the hand’s contours and are equipped with multiple physical buttons, along with one customizable blank button, enhancing their functionality. Made from a combination of leather and plastic, these designs improve the grip. The primary colors are deep gray and off-white, with color-changing light strips to enhance depth perception and improve the recognition of the steering wheel’s rotation angle.

4.4.2. Ranking of Design Schemes Using IVIF-VIKOR

For the six proposed design schemes, the design characteristics DC1 to DC13 were evaluated linguistically, as presented in Table 4. A total of 12 individuals were invited to participate in this study: four experts in interaction design, six experts in automotive design, and eight drivers with extensive driving experience. The outcome of this process was a total of 18 completed score sheets. The mean values of these scores were aggregated to construct the evaluation matrix shown in Table 6.
To facilitate a comprehensive evaluation of the specific characteristics for each scheme, defuzzification was applied. The resultant score matrix is displayed in Table 7.
Utilizing the score matrix delineated in Table 7 and the weights assigned to the 13 DCs, the group benefit value (S) and individual regret value (R) of the six design schemes were determined through the implementation of the VIKOR method, underpinned by Equations (18)–(21), with a decision coefficient of v set at 0.5. The final benefit-ratio value (Q) was derived from these calculations. The results of the study are summarized in Table 8, in which the schemes are arranged in ascending order of Q values. A lower Q value is indicative of a design that is closer to the ideal solution and thus receives a higher ranking. The ranking results indicate that the overall performance of the six design schemes is as follows: B > A > F > E > D. Notably, the Q values for schemes B and A are significantly lower than those of the other four schemes. This finding is consistent with the design score matrix and the distribution of indicator weights. Specifically, schemes B and A scored higher on key criteria such as “Reasonable layout”, “Skin-friendly materials” and “Customizable buttons” giving them a distinct advantage in the overall evaluation.

5. Discussion

5.1. Comparative Analysis of IVIF-QFD, IF-QFD, QFD

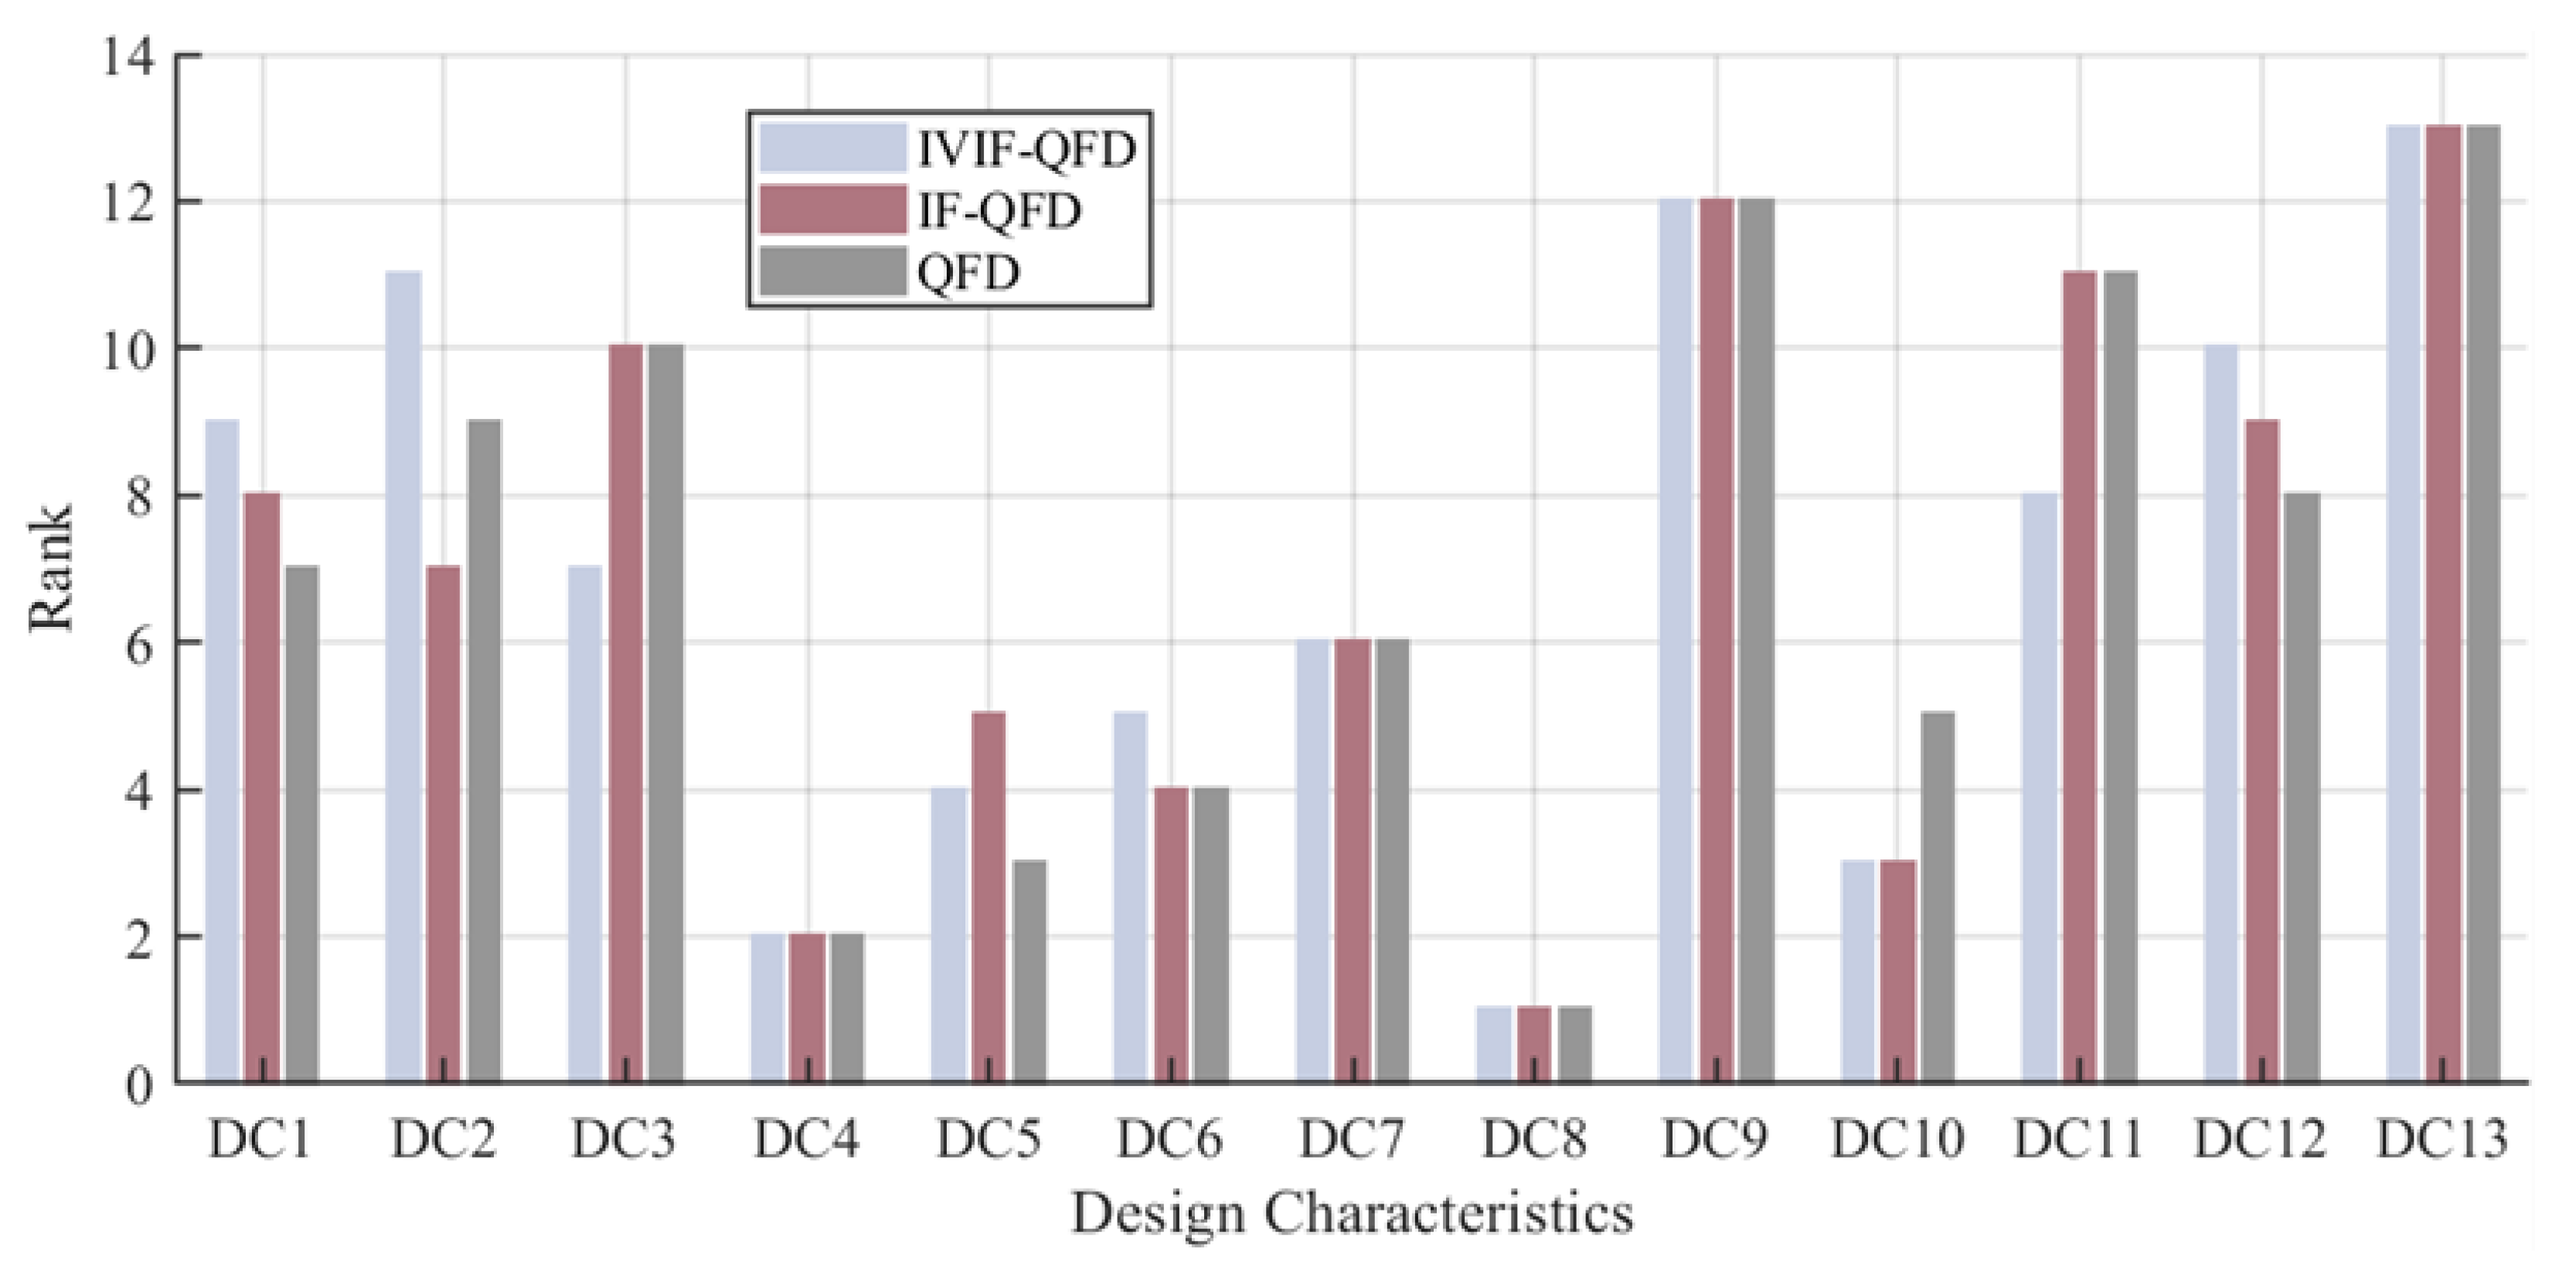
To verify the effectiveness of the proposed approach, we calculated the ranking results of the QFD and IF-QFD and compared them with the IVIF-QFD rankings (Figure 6). The comparative analysis reveals that the weight rankings of DC1 (Stylish and attractive shape) and DC2 (Reasonable color coordination) exhibit significant fluctuations across different models, while the rankings of DC3 through DC13 remain relatively stable. This phenomenon stems from the fundamental differences in subjectivity and objectivity among DCs.
Specifically, DC1 and DC2 represent typical affective DCs whose evaluation heavily depends on individual aesthetic preferences, cultural backgrounds, and emotional experiences, lacking standardized objective criteria. When assessing the importance or correlation strength of these characteristics with CRs, experts often demonstrate considerable divergence or inherent hesitation in their judgments, leading to substantially different evaluations of the same feature. This high degree of fuzziness and hesitation is oversimplified into single numerical values in traditional QFD, masking cognitive uncertainties. In contrast, both IF-QFD and IVIF-QFD authentically capture the inconsistency in expert judgments by incorporating non-membership degrees, hesitation indices, and interval-valued expressions, resulting in significant shifts in weight calculations across different fuzzy models.
Conversely, DC3 through DC13 predominantly consist of functional or quantifiable technical characteristics with relatively clear performance metrics and validation standards. Experts demonstrate higher consensus and more consistent judgments regarding these features, exhibiting lower levels of fuzziness and hesitation. Consequently, even when intuitionistic fuzzy or interval-valued fuzzy mechanisms are introduced, their weight calculation results maintain high stability, with minimal ranking variations across the three models.
Furthermore, we employed Spearman’s Rank Correlation Coefficient (ρ) to examine the correlations among the three models (Table 9), thus validating the effectiveness of the IVIF-QFD. The ρ values between QFD and IVIF-QFD, and between IF-QFD and IVIF-QFD, were 0.901 and 0.896, respectively. Both values were significantly greater than 0.8, with significance at the 0.01 level. This finding suggests a robust positive correlation between the rankings produced by the IVIF-QFD method and the proposed method. The product design characteristics importance ranking obtained based on the method proposed in this study demonstrate a general trend that is consistent with the results of the other two methods, further confirming the stability of the proposed method.

5.2. Comparative Analysis of Different Decision-Making Frameworks

In addition to comparing the impact of different QFD methods on the importance of design characteristics, we further validated the stability of the product scheme ranking framework introduced in this study by incorporating two widely used multi-criteria decision analysis methods to build two new decision-making frameworks, COPRAS and TOPSIS, respectively, to assess the effectiveness of our framework. To ensure a fair comparison, we used the characteristic weights determined in this study for the derivation of these two analysis methods. The ranking results are presented in Table 10.
As shown in Table 10, the IVIF-TOPSIS method ranks the steering wheel design schemes as follows: B > A > C > D > E, while the IVIF-COPRAS method ranks them as B > A > F > E > C > D. Our proposed framework produces the following rankings: B > A > F > C > E > D. A comparison of the ranking results from the three methods reveals that our proposed framework aligns with IVIF-COPRAS in the rankings of the top three and last-place options and is nearly identical to IVIF-TOPSIS in terms of scheme ranking, with only a minor swap in the positions of D and E, which is negligible. It is worth noting that all three methods consistently rank B, A, and F as the top three design schemes among all candidate schemes, validating the robustness of the ranking results.

5.3. Sensitivity Analysis

To examine the impact of variations in the decision coefficient v (which represents the trade-off between “maximum group satisfaction” and “minimum individual regret”) on the ranking results of the VIKOR method, a sensitivity analysis was conducted. The analysis covered values of v ranging from 0 to 1, with intervals of 0.1. Figure 7 illustrates the ranking trends for candidate schemes A to F at different values of v. As shown in the figure, schemes B and A consistently ranked first and second, respectively, across the entire analysis range, highlighting their superior overall performance. Schemes F and C only exhibited a crossover in rankings between v = 0.1 and v = 0.2, after which their rankings stabilized, indicating that their sensitivity is relatively low. Additionally, the rankings of schemes D and E experienced significant crossover between v = 0.8 and v = 0.9, revealing the instability of their rankings in scenarios that prioritize minimizing individual regret. This suggests that decision-makers should make careful choices based on their specific preferences. The results of the sensitivity analysis validate the effectiveness of the VIKOR method under varying decision preferences, thereby enhancing the robustness and credibility of the decision-making outcomes.

6. Conclusions

6.1. The Benefits of This Research

This paper proposes an integrated decision-making framework that combines the Best–Worst Method (BWM), Interval-Valued Intuitionistic Fuzzy Quality Function Deployment (IVIF-QFD), and IVIF-VIKOR, offering a systematic approach to product design decision-making in uncertain environments. By constructing a continuous decision path from initial requirements analysis to final design solution selection, the framework effectively addresses the “fragmentation” problem caused by information incoherence in multi-stage decision-making processes, facilitating the establishment of a logical loop between the conversion of customer requirements into design characteristics and the evaluation of solutions.
The core advantage of this framework lies in its systematic integration of three complementary methods, each addressing key challenges in uncertain decision environments. The BWM employs a “best-worst” comparison mechanism, efficiently determining weights with fewer judgments, balancing decision-making efficiency and consistency, while significantly reducing expert cognitive load. IVIF-QFD utilizes interval-valued intuitionistic fuzzy sets to capture the fuzziness and uncertainty in expert judgments during the conversion from customer requirements to design characteristics, enhancing the model’s expressiveness and robustness in incomplete information contexts [55]. Subsequently, IVIF-VIKOR evaluates candidate solutions based on weighted design criteria, identifying compromise solutions that strike a good balance between maximizing group utility and minimizing individual regret, thereby supporting rational decision-making under multi-objective conflicts.
For practitioners, this framework offers a structured approach that clearly delineates trade-offs at each stage of decision-making process and quantifies the impact of uncertainty on decisions. This not only improves communication among stakeholders but also fosters a more transparent and rational decision-making process. In highly competitive and fast-evolving markets, the framework is undoubtedly a valuable tool for modern product development teams. Furthermore, due to its strong adaptability to fuzzy and incomplete information, this framework has the potential for expansion into other complex decision-making scenarios, such as service design, public policy evaluation, and infrastructure planning. It provides a methodological framework that can be applied to various multi-criteria decision-making problems.

6.2. Limitations of the Study and Future Work

Although the proposed integrated framework demonstrates strong robustness in handling uncertainty, there are still several limitations that warrant further exploration: (1) The pairwise comparisons in the BWM and QFD are highly dependent on judgments from domain experts. Although consistency checks are introduced to improve logical rationality, results may still be influenced by expert preferences and cognitive biases. This reliance necessitates access to a stable pool of high-level experts, thereby increasing the human resource and time costs associated with implementation. (2) The current model assumes that design characteristics are independent of one another, overlooking the characteristic coupling and interaction effects that are commonly present in complex engineering systems. This assumption may lead to distorted weight allocations, thereby affecting the accuracy of the decision-making process. (3) The framework is based on static customer preferences and expert evaluations, while the actual product development process often involves dynamically changing demands and technological environments. The lack of an adaptive mechanism for evolving preferences may limit its continued applicability in real-world scenarios.
To address these limitations, future research could expand in the following directions: (1) Exploring the integration of machine learning techniques (such as neural networks) with the BWM and QFD, leveraging data-driven approaches to determine the relationships among criteria, thereby significantly reducing time and labor costs [56]. (2) Introduce methods such as DEMATEL or ANP that can capture the interdependencies among criteria, explicitly modeling the interactions between design characteristics to enable more precise weight calculations and priority ranking within the IVIF-QFD framework [57]. (3) Develop interactive visualization modules, such as decision support interfaces based on dynamic dashboards, allowing decision-makers to adjust key parameters (e.g., preference weights, fuzzy intervals) in real time and observe their immediate impact on solution rankings and design priorities, thus enhancing the model’s transparency, interpretability, and user engagement [58].

Author Contributions

Conceptualization, X.C.; methodology, W.X.; software, W.X.; validation, X.C. and W.X.; Investigation, W.X. and H.P.; resources, X.C.; writing—original draft preparation, W.X. and X.C.; writing—review and editing, H.P.; visualization, H.P.; supervision, W.X.; funding acquisition, X.C. All authors have read and agreed to the published version of the manuscript.

Funding

This research is supported by Social Sciences 14th Five-Year Plan Fund of Jiangxi Province (Grant No. 22YS29D) and the 2025 Jiangxi Provincial Planning Project of Education Science (Grant No. 2025GYB082).

Data Availability Statement

The original contributions presented in this study are included in the article. Further inquiries can be directed at the corresponding author.

Conflicts of Interest

The authors declare no conflicts of interest.

References

  1. Al-Ahwal, G.A.-S.; Salam, A.S.M.A.; Waheed, S.A. Design Research as competitive advantage in product design. Int. Des. J. 2021, 11, 207–221. [Google Scholar] [CrossRef]
  2. Ramasesh, R.; Tirupati, D.; Vaitsos, C.A. Modeling process-switching decisions under product life cycle uncertainty. Int. J. Prod. Econ. 2010, 126, 236–246. [Google Scholar] [CrossRef]
  3. Han, X.; Li, R.; Wang, J.; Ding, G.; Qin, S. A systematic literature review of product platform design under uncertainty. J. Eng. Des. 2020, 31, 266–296. [Google Scholar] [CrossRef]
  4. Shi, Y. Definition of Customer Requirements, Function Requirements, and Product Structures Based on Big Data and Data Mining Methods. Ph.D. Thesis, University of Manitoba, Winnipeg, MB, Canada, 2022. [Google Scholar]
  5. Ismail, G.; Taliep, N. The Delphi Method. In Handbook of Social Sciences and Global Public Health; Liamputtong, P., Ed.; Springer International Publishing: Cham, Switzerland, 2023; pp. 985–1003. [Google Scholar]
  6. Hamka, M. Application of fuzzy preference relations method in AHP to improve judgment matrix consistency. IOP Conf. Ser. Mater. Sci. Eng. 2020, 821, 012035. [Google Scholar] [CrossRef]
  7. Vaidya, O.S.; Kumar, S. Analytic hierarchy process: An overview of applications. Eur. J. Oper. Res. 2006, 169, 1–29. [Google Scholar] [CrossRef]
  8. Munier, N.; Hontoria, E. Uses and Limitations of the AHP Method; Springer: Berlin/Heidelberg, Germany, 2021. [Google Scholar]
  9. Mi, X.; Tang, M.; Liao, H.; Shen, W.; Lev, B. The state-of-the-art survey on integrations and applications of the best worst method in decision making: Why, what, what for and what’s next? Omega 2019, 87, 205–225. [Google Scholar] [CrossRef]
  10. Chan, L.-K.; Wu, M.-L. Quality function deployment: A literature review. Eur. J. Oper. Res. 2002, 143, 463–497. [Google Scholar] [CrossRef]
  11. Ginting, R.; Ishak, A.; Malik, A.F.; Satrio, M.R. Product development with quality function deployment (QFD): A literature review. IOP Conf. Ser. Mater. Sci. Eng. 2020, 1003, 012022. [Google Scholar] [CrossRef]
  12. Beg, I.; Rashid, T. Group decision making using intuitionistic hesitant fuzzy sets. Int. J. Fuzzy Log. Intell. Syst. 2014, 14, 181–187. [Google Scholar] [CrossRef]
  13. Lu, S.; Zhou, J.; Ren, J. Alleviating Energy Poverty through Renewable Energy Technology: An Investigation Using a Best-Worst Method-Based Quality Function Deployment Approach with Interval-Valued Intuitionistic Fuzzy Numbers. Int. J. Energy Res. 2023, 2023, 8358799. [Google Scholar] [CrossRef]
  14. Yu, D.; Ye, T. Uncovering the academic evolution of VIKOR method: A comprehensive main path analysis. J. Oper. Res. Soc. 2025, 76, 393–409. [Google Scholar] [CrossRef]
  15. Jahan, A.; Mustapha, F.; Ismail, Y.; Sapuan, S.; Bahraminasab, M. A comprehensive VIKOR method for material selection. Mater. Des. 2011, 32, 1215–1221. [Google Scholar]
  16. Kim, J.H.; Ahn, B.S. The hierarchical VIKOR method with incomplete information: Supplier selection problem. Sustainability 2020, 12, 9602. [Google Scholar] [CrossRef]
  17. Chang, C.-L. A modified VIKOR method for multiple criteria analysis. Environ. Monit. Assess. 2010, 168, 339–344. [Google Scholar] [CrossRef] [PubMed]
  18. Akao, Y.; Mazur, G.H. The leading edge in QFD: Past, present and future. Int. J. Qual. Reliab. Manag. 2003, 20, 20–35. [Google Scholar] [CrossRef]
  19. Kang, X.; Yang, M.; Wu, Y.; Ni, B. Integrating Evaluation Grid Method and Fuzzy Quality Function Deployment to New Product Development. Math. Probl. Eng. 2018, 2018, 1–15. [Google Scholar] [CrossRef]
  20. Hauser, J.R. +e house of quality. Harv. Bus. Rev. 1988, 66, 63–73. [Google Scholar]
  21. English, J.R. Quality Function Deployment: Integrating Customer Requirements into Product Design. J. Qual. Technol. 2018, 25, 63–64. [Google Scholar] [CrossRef]
  22. Lai, X.; Xie, M.; Tan, T. Optimizing product design using the Kano model and QFD. In Proceedings of the 2004 IEEE International Engineering Management Conference, Singapore, 18–21 October 2004. [Google Scholar]
  23. Tu, N.; Zhang, T.; He, Q.; Zhang, H.; Li, Y. Applying combined AHP-QFD method in new product development: A case study in developing new sports earphone. In Proceedings of the MSIE 2011, Harbin, China, 8–11 January 2011. [Google Scholar]
  24. Karasan, A.; Ilbahar, E.; Cebi, S.; Kahraman, C. Customer-oriented product design using an integrated neutrosophic AHP & DEMATEL & QFD methodology. Appl. Soft Comput. 2022, 118, 108445. [Google Scholar] [CrossRef]
  25. Porto de Lima, B.; Da Silva, A.F.; Marins, F.A.S. New hybrid AHP-QFD-PROMETHEE decision-making support method in the hesitant fuzzy environment: An application in packaging design selection. J. Intell. Fuzzy Syst. 2022, 42, 2881–2894. [Google Scholar] [CrossRef]
  26. Yazdani, M.; Kahraman, C.; Zarate, P.; Onar, S.C. A fuzzy multi attribute decision framework with integration of QFD and grey relational analysis. Expert. Syst. Appl. 2019, 115, 474–485. [Google Scholar] [CrossRef]
  27. Ocampo, L.A.; Labrador, J.J.T.; Jumao-As, A.M.B.; Rama, A.M.O. Integrated multiphase sustainable product design with a hybrid quality function deployment—Multi-attribute decision-making (QFD-MADM) framework. Sustain. Prod. Consum. 2020, 24, 62–78. [Google Scholar] [CrossRef]
  28. Oglu, S.V.H. Decision Making Under Linguistic Uncertainty Conditions on Base of Generalized Fuzzy Numbers. World Sci. 2021, 8, 25–29. [Google Scholar]
  29. Zadeh, L. Fuzzy sets. Inf. Control 1965, 8, 338–353. [Google Scholar] [CrossRef]
  30. Ramot, D.; Milo, R.; Friedman, M.; Kandel, A. Complex fuzzy sets. IEEE Trans. Fuzzy Syst. 2002, 10, 171–186. [Google Scholar] [CrossRef]
  31. Stojanović, N.; Laković, M. Q [ε]-FUZZY SETS. J. Korean Soc. Ind. Appl. Math. 2024, 28, 303–318. [Google Scholar]
  32. Singh, M.K. Application of Triangular Fuzzy Numbers in Taking Optimal Decision. In Decision Making in Inventory Management; Shah, N.H., Mittal, M., Cárdenas-Barrón, L.E., Eds.; Springer: Singapore, 2021; pp. 219–230. [Google Scholar]
  33. Sen, D.K.; Datta, S.; Mahapatra, S. Sustainable supplier selection in intuitionistic fuzzy environment: A decision-making perspective. Benchmarking Int. J. 2018, 25, 545–574. [Google Scholar] [CrossRef]
  34. Chen, L.; Liu, W.; Zhang, J. An interval type-2 fuzzy multi-criteria decision-making approach for patient bed allocation. Sci. Rep. 2025, 15, 21019. [Google Scholar] [CrossRef]
  35. Peng, J.-J.; Wang, J.-Q.; Wu, X.-H. Novel Multi-criteria Decision-making Approaches Based on Hesitant Fuzzy Sets and Prospect Theory. Int. J. Inf. Technol. Decis. Mak. 2016, 15, 621–643. [Google Scholar] [CrossRef]
  36. Kahraman, C.; Gündoğdu, F.K.; Karaşan, A.; Boltürk, E. Advanced fuzzy sets and multicriteria decision making on product development. In Customer Oriented Product Design: Intelligent and Fuzzy Techniques; Springer International Publishing: Cham, Switzerland, 2020; pp. 283–302. [Google Scholar]
  37. Khan, M.K.; Kamran Sajjad Ali Khan, M.; Aloqaily, A.; Mlaiki, N. Covering-Based Intuitionistic Hesitant Fuzzy Rough Set Models and Their Application to Decision-Making Problems. Symmetry 2024, 16, 693. [Google Scholar] [CrossRef]
  38. Ali, W.; Shaheen, T.; Haq, I.U.; Toor, H.G.; Akram, F.; Jafari, S.; Uddin, Z.; Hassan, M.M. Multiple-attribute decision making based on intuitionistic hesitant fuzzy connection set environment. Symmetry 2023, 15, 778. [Google Scholar] [CrossRef]
  39. Kahraman, C.; Onar, S.Ç.; Öztayşi, B. Interval valued intuitionistic fuzzy investment analysis: Application to CNC lathe selection. IFAC-Pap. 2016, 49, 1323–1328. [Google Scholar] [CrossRef]
  40. Caisucar, M.; Gaonkar, R.S.P. Uncertainty Identification in New Product Development. Ind. Eng. J. 2018, 10, 41–45. [Google Scholar] [CrossRef]
  41. Yang, Y.Z.; Yen, C.H. An AHP Method with Cosmetic Design Application. In Proceedings of the 2019 International Conference on Virtual Reality and Intelligent Systems (ICVRIS), Jishou, China, 14–15 September 2019; pp. 346–349. [Google Scholar] [CrossRef]
  42. Ayağ, Z.; özdem r, R. An analytic network process-based approach to concept evaluation in a new product development environment. J. Eng. Des. 2007, 18, 209–226. [Google Scholar] [CrossRef]
  43. Sharma, D.; Sridhar, S.; Claudio, D. Comparison of AHP-TOPSIS and AHP-AHP methods in multi-criteria decision-making problems. Int. J. Ind. Syst. Eng. 2020, 34, 203–223. [Google Scholar] [CrossRef]
  44. Yu, Z.; Zhao, W.; Guo, X.; Hu, H.; Fu, C.; Liu, Y. Multi-indicators decision for product design solutions: A TOPSIS-MOGA integrated model. Processes 2022, 10, 303. [Google Scholar] [CrossRef]
  45. Mousavi-Nasab, S.H.; Sotoudeh-Anvari, A. A comprehensive MCDM-based approach using TOPSIS, COPRAS and DEA as an auxiliary tool for material selection problems. Mater. Des. 2017, 121, 237–253. [Google Scholar] [CrossRef]
  46. Vinodh, S.; Girubha, R.J. PROMETHEE based sustainable concept selection. Appl. Math. Model. 2012, 36, 5301–5308. [Google Scholar] [CrossRef]
  47. Zhang, S.; Gao, H.; Wei, G.; Wei, Y.; Wei, C. Evaluation based on distance from average solution method for multiple criteria group decision making under picture 2-tuple linguistic environment. Mathematics 2019, 7, 243. [Google Scholar] [CrossRef]
  48. Zhu, G.-N.; Hu, J.; Qi, J.; Gu, C.-C.; Peng, Y.-H. An integrated AHP and VIKOR for design concept evaluation based on rough number. Adv. Eng. Inform. 2015, 29, 408–418. [Google Scholar] [CrossRef]
  49. Kirişci, M.; Demir, I.; Şimşek, N.; Topaç, N.; Bardak, M. The novel VIKOR methods for generalized Pythagorean fuzzy soft sets and its application to children of early childhood in COVID-19 quarantine. Neural Comput. Appl. 2022, 34, 1877–1903. [Google Scholar] [CrossRef]
  50. Park, J.H.; Cho, H.J.; Kwun, Y.C. Extension of the VIKOR method for group decision making with interval-valued intuitionistic fuzzy information. Fuzzy Optim. Decis. Mak. 2011, 10, 233–253. [Google Scholar] [CrossRef]
  51. Atanassov, K.T. Interval Valued Intuitionistic Fuzzy Sets. In Intuitionistic Fuzzy Sets: Theory and Applications; Atanassov, K.T., Ed.; Physica-Verlag HD: Heidelberg, Germany, 1999; pp. 139–177. [Google Scholar]
  52. Büyüközkan, G.; Uztürk, D. Smart Fridge Design with Interval-Valued Intuitionistic Fuzzy QFD. In Intelligent and Fuzzy Techniques in Big Data Analytics and Decision Making; Advances in Intelligent Systems and Computing; Springer International Publishing: Cham, Switzerland, 2020; Chapter 138; pp. 1170–1179. [Google Scholar]
  53. Karaşan, A.; Kahraman, C. A novel intuitionistic fuzzy DEMATEL—ANP—TOPSIS integrated methodology for freight village location selection. J. Intell. Fuzzy Syst. 2017, 36, 1335–1352. [Google Scholar] [CrossRef]
  54. Haktanir, E.; Kahraman, C. New product design using chebyshev’s inequality based interval-valued intuitionistic z-fuzzy qfd method. Informatica 2022, 33, 1–33. [Google Scholar] [CrossRef]
  55. Fu, S.; Xiao, Y.-Z.; Zhou, H.-J. Interval-valued intuitionistic fuzzy multi-attribute group decision-making method considering risk preference of decision-makers and its application. Sci. Rep. 2022, 12, 11597. [Google Scholar] [CrossRef] [PubMed]
  56. Park, H.; Megahed, A.; Yin, P.; Ong, Y.; Mahajan, P.; Guo, P. Incorporating experts’ judgment into machine learning models. Expert. Syst. Appl. 2023, 228, 120118. [Google Scholar] [CrossRef]
  57. Hariri, A.; Domingues, P.; Sampaio, P. Integration of multi-criteria decision-making approaches adapted for quality function deployment: An analytical literature review and future research agenda. Int. J. Qual. Reliab. Manag. 2023, 40, 2326–2350. [Google Scholar] [CrossRef]
  58. Schryen, G. Parallel computational optimization in operations research: A new integrative framework, literature review and research directions. Eur. J. Oper. Res. 2020, 287, 1–18. [Google Scholar] [CrossRef]
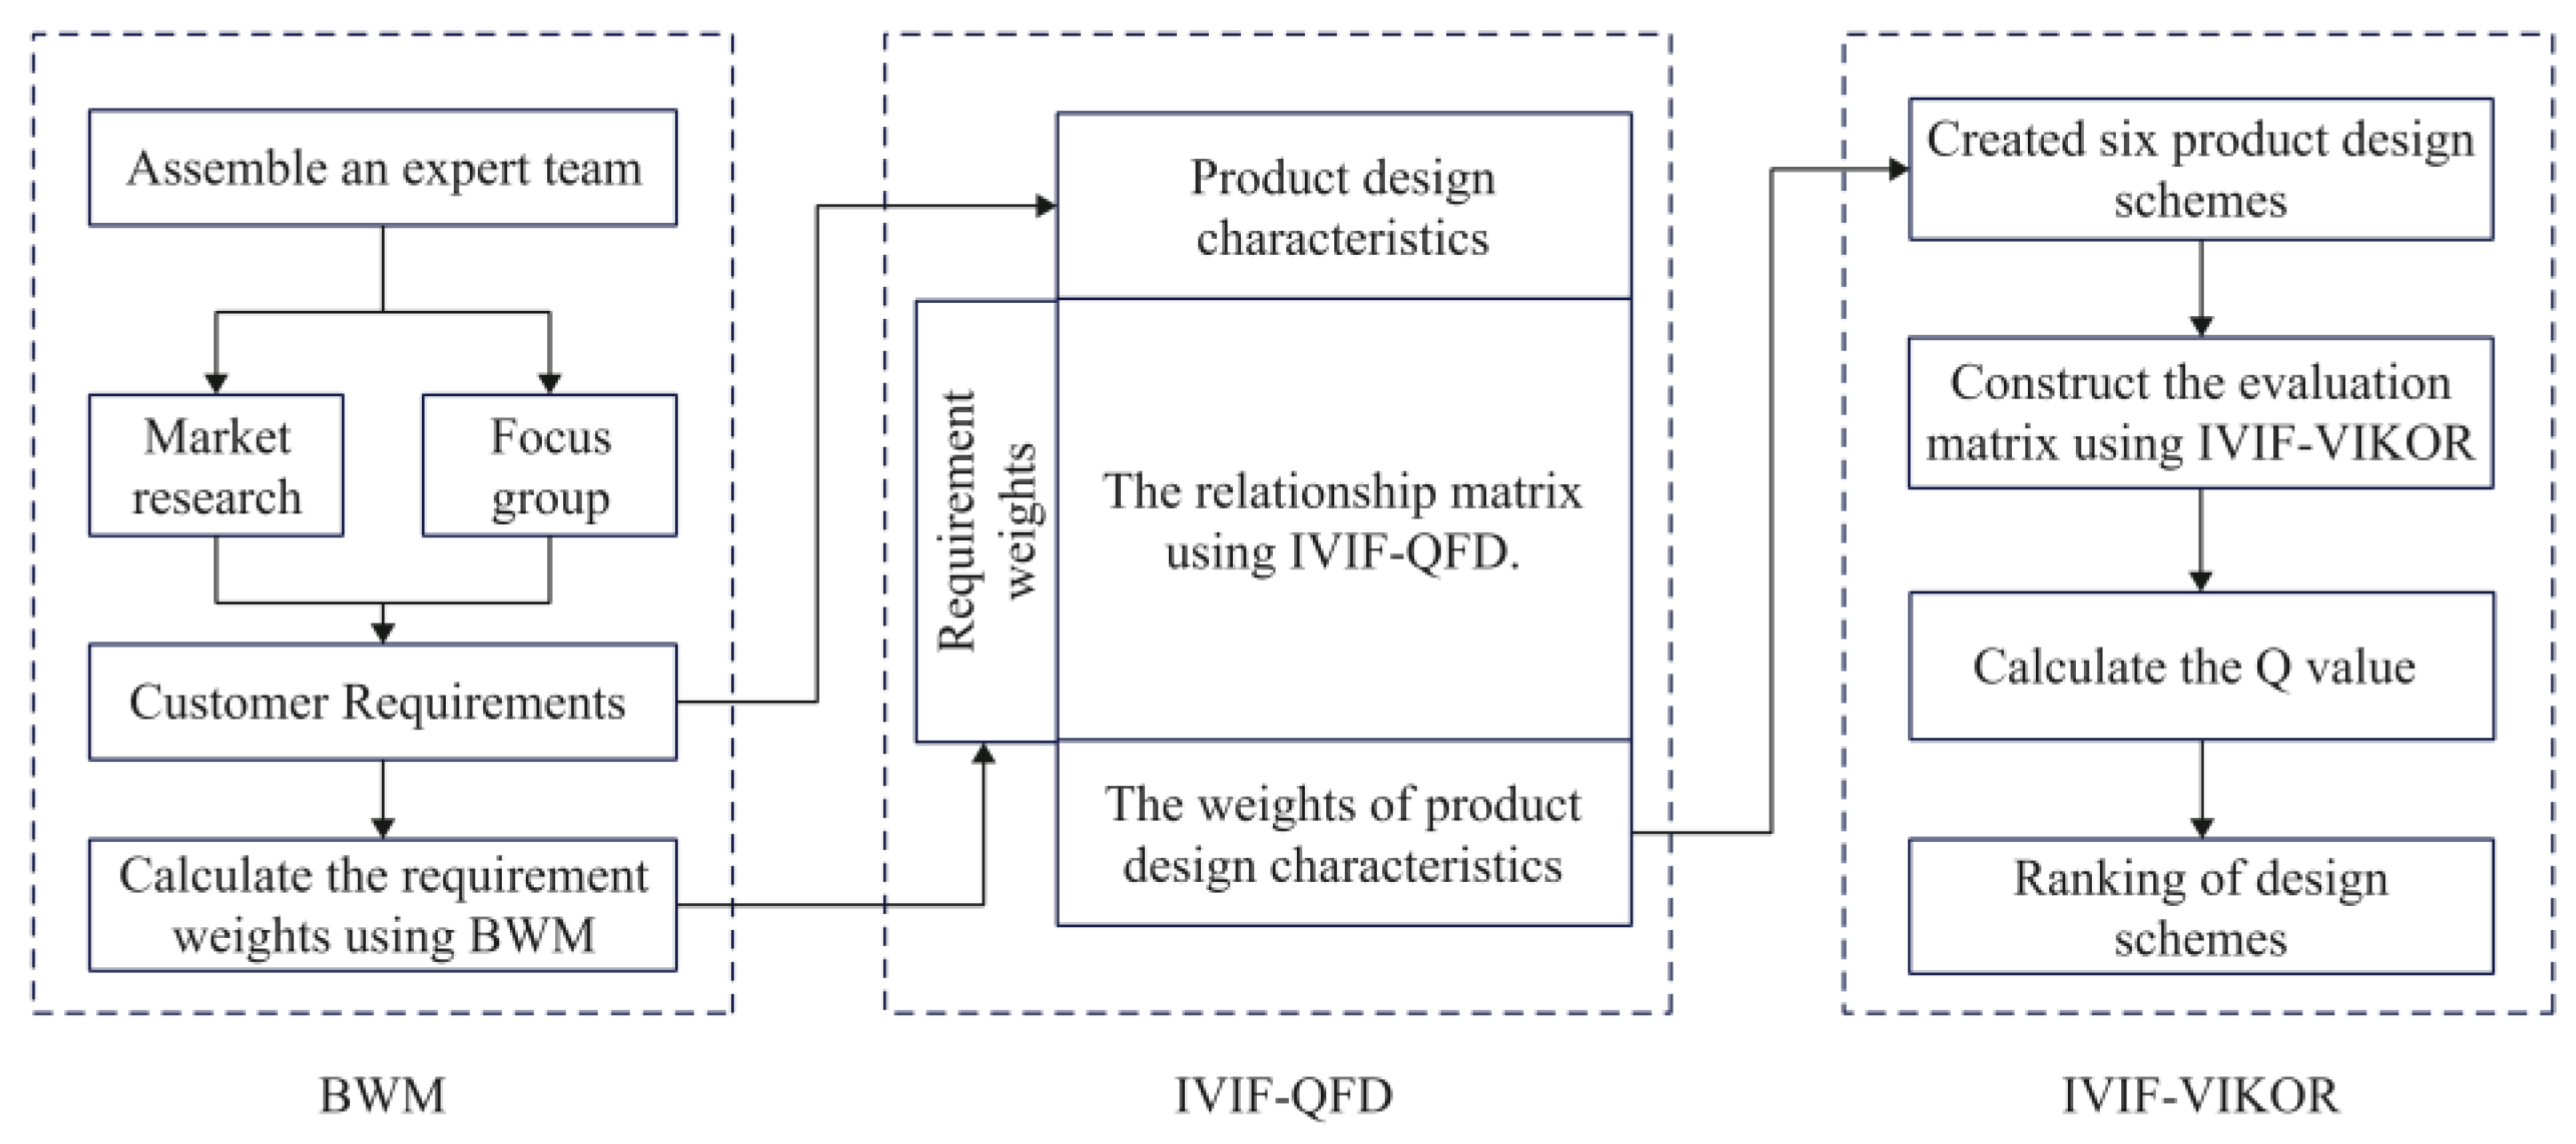
Figure 1. Proposed framework.
Mathematics 13 03257 g001
Figure 2. Weights of Customer Requirements.
Mathematics 13 03257 g002
Figure 3. Heatmap of the relationship between CRs and DCs.
Mathematics 13 03257 g003
Figure 4. Importance ranking of DCs.
Mathematics 13 03257 g004
Figure 5. Steering Wheel Design Schemes (AF).
Mathematics 13 03257 g005
Figure 6. Comparison of Ranking Results of Different QFD Models.
Mathematics 13 03257 g006
Figure 7. Changes in Scheme Rankings with Different VIKOR Decision Coefficient.
Mathematics 13 03257 g007
Table 1. Composition of experts.
ItemContentNumber of PeoplePercentage
GenderMale2463.16%
Female1436.84%
Driving Experience<2 years821.05%
2–5 years1026.32%
<5 years2052.63%
OccupationProduct design teacher1436.84%
Taxi Driver1436.84%
Automotive Designer1026.32%
Table 2. Customer Requirements and Design Characteristics.
Customer RequirementsNo.Design Characteristics
AppearanceDC1Stylish and attractive shape
DC2Reasonable color coordination
DC3Premium materials and texture
TouchingDC4Skin-friendly materials
DC5Ergonomic design
Humanized InteractionDC6Real-time feedback
DC7Touch buttons
DC8Reasonable layout
Extended FunctionsDC9Adaptive adjustment
DC10Customizable buttons
SafetyDC11Anti-slip design
DC12Fatigue-resistant design
SustainabilityDC13Technological compatibility
Table 3. Consistency of Comparison Matrix.
E1E2E3E4E5E6E7E8E9E10E11E12E13E14E15E16
EPS0.0850.0930.0750.0940.0890.0940.0890.0940.0830.0860.0830.0830.0750.0890.0750.090
Cr0.0280.0310.0250.0310.030.0310.030.0310.0280.0290.0280.0280.0250.030.0250.03
EPS: Evaluation Performance Scores; Cr: Consistency ratio; E1–E16: Expert 1 to 16.
Table 4. Verbal Scale of IVIF.
Linguistic TermIVIF Number
Absolutely Low Importance (ALI)/Absolutely Low Relation (ALR)(0.0,0.1),(0.8,0.9)
Very Low Importance (VLI)/Very Low Relation (VLR)(0.1,0.2),(0.7,0.8)
Low importance (LI) /Low Relation (LR)(0.2,0.3),(0.6,0.7)
Medium Low Importance (MLI) Medium Low Relation (MLR)(0.3,0.4),(0.5,0.6)
Approximately Equal Importance (AEI)/Approximately Equal Relation (AER)(0.4,0.5),(0.4,0.5)
Medium High Importance (MHI)/Medium High Relation (MHR)(0.5,0.6),(0.3,0.4)
High Importance (HI)/High Relation (HR)(0.6,0.7),(0.2,0.3)
Very High Importance (VHI)/Very High Relation (VHR)(0.7,0.8),(0.1,0.2)
Absolutely High Importance (AHI)/Absolutely High Relation (AHR)(0.8,0.9),(0.0,0.1)
Table 5. Aggregation matrix of IVIF expert scores.
CRsDC1DC2DC3DC4DC5DC6DC7DC8DC9DC10DC11DC12DC13
CR1(0.69,0.79),
(0.11,0.21)
(0.63,0.73),
(0.17,0.27)
(0.65,0.75),
(0.15,0.25)
(0.42,0.52),
(0.38,0.48)
(0.37,0.47),
(0.43,0.53)
(0.09,0.19),
(0.71,0.81)
(0.51,0.61),
(0.29,0.39)
(0.26,0.36),
(0.54,0.64)
(0.04,0.14),
(0.76,0.86)
(0.53,0.63),
(0.27,0.37)
(0.10,0.20),
(0.70,0.80)
(0.02,0.12),
(0.78,0.88)
(0.05,0.15),
(0.75,0.85)
CR2(0.04,0.14),
(0.76,0.86)
(0.02,0.12),
(0.78,0.88)
(0.38,0.48),
(0.42,0.52)
(0.63,0.73),
(0.17,0.27)
(0.68,0.78),
(0.12,0.22)
(0.05,0.15),
(0.75,0.85)
(0.09,0.19),
(0.71,0.81)
(0.52,0.62),
(0.28,0.38)
(0.05,0.15),
(0.75,0.85)
(0.04,0.14),
(0.76,0.86)
(0.42,0.52),
(0.38,0.48)
(0.24,0.34),
(0.56,0.66)
(0.06,0.16),
(0.74,0.84)
CR3(0.43,0.53),
(0.37,0.47)
(0.39,0.49),
(0.41,0.51)
(0.10,0.20),
(0.70,0.80)
(0.71,0.81),
(0.09,0.19)
(0.51,0.61),
(0.29,0.39)
(0.69,0.79),
(0.11,0.21)
(0.42,0.52),
(0.38,0.48)
(0.53,0.63),
(0.27,0.37)
(0.50,0.60),
(0.30,0.40)
(0.41,0.51),
(0.39,0.49)
(0.36,0.46),
(0.44,0.54)
(0.11,0.21),
(0.69,0.79)
(0.12,0.22),
(0.68,0.78)
CR4(0.05,0.15),
(0.75,0.85)
(0.03,0.13),
(0.77,0.87)
(0.11,0.21),
(0.69,0.79)
(0.12,0.22),
(0.68,0.78)
(0.27,0.37),
(0.53,0.63)
(0.54,0.64),
(0.26,0.36)
(0.36,0.46),
(0.44,0.54)
(0.55,0.65),
(0.25,0.35)
(0.05,0.15),
(0.75,0.85)
(0.40,0.50),
(0.40,0.50)
(0.11,0.21),
(0.69,0.79)
(0.25,0.35),
(0.55,0.65)
(0.24,0.34),
(0.56,0.66)
CR5(0.09,0.19),
(0.71,0.81)
(0.06,0.16),
(0.74,0.84)
(0.26,0.36),
(0.54,0.64)
(0.27,0.37),
(0.53,0.63)
(0.28,0.38),
(0.52,0.62)
(0.30,0.40),
(0.50,0.60)
(0.25,0.35),
(0.55,0.65)
(0.54,0.64),
(0.26,0.36)
(0.48,0.58),
(0.32,0.42)
(0.53,0.63),
(0.27,0.37)
(0.51,0.61),
(0.29,0.39)
(0.68,0.78),
(0.12,0.22)
(0.29,0.39),
(0.51,0.61)
CR6(0.06,0.16),
(0.74,0.84)
(0.27,0.37),
(0.53,0.63)
(0.23,0.33),
(0.57,0.67)
(0.42,0.52),
(0.38,0.48)
(0.26,0.36),
(0.54,0.64)
(0.36,0.46),
(0.44,0.54)
(0.04,0.14),
(0.76,0.86)
(0.53,0.63),
(0.27,0.37)
(0.45,0.55),
(0.35,0.45)
(0.51,0.61),
(0.29,0.39)
(0.28,0.38),
(0.52,0.62)
(0.49,0.59),
(0.31,0.41)
(0.71,0.81),
(0.09,0.19)
Table 6. Aggregation Matrix of IVIF Scheme Scores.
SchemeDC1DC2DC3DC4DC5DC6DC7DC8DC9DC10DC11DC12DC13
A(0.64,0.74)
(0.16,0.26)
(0.61,0.71)
(0.19,0.29)
(0.63,0.73)
(0.17,0.27)
(0.53,0.63)
(0.27,0.37)
(0.63,0.73)
(0.17,0.27)
(0.58,0.68)
(0.22,0.32)
(0.29,0.39)
(0.51,0.61)
(0.47,0.57)
(0.33,0.43)
(0.38,0.48)
(0.42,0.52)
(0.53,0.63)
(0.27,0.37)
(0.64,0.74)
(0.16,0.26)
(0.53,0.63)
(0.27,0.37)
(0.28,0.38)
(0.52,0.62)
B(0.59,0.69)
(0.21,0.31)
(0.53,0.63)
(0.27,0.37)
(0.53,0.63)
(0.27,0.37)
(0.61,0.71)
(0.19,0.29)
(0.62,0.72)
(0.18,0.28)
(0.54,0.64)
(0.26,0.36)
(0.54,0.64)
(0.26,0.36)
(0.62,0.72)
(0.18,0.28)
(0.42,0.52)
(0.38,0.48)
(0.53,0.63)
(0.27,0.37)
(0.64,0.74)
(0.16,0.26)
(0.54,0.64)
(0.26,0.36)
(0.62,0.72)
(0.18,0.28)
C(0.47,0.57)
(0.33,0.43)
(0.49,0.59)
(0.31,0.41)
(0.51,0.61)
(0.29,0.39)
(0.53,0.63)
(0.27,0.37)
(0.55,0.65)
(0.25,0.35)
(0.54,0.64)
(0.26,0.36)
(0.61,0.71)
(0.19,0.29)
(0.55,0.65)
(0.25,0.35)
(0.14,0.24)
(0.66,0.76)
(0.33,0.43)
(0.47,0.57)
(0.14,0.24)
(0.66,0.76)
(0.15,0.25)
(0.65,0.75)
(0.21,0.31)
(0.59,0.69)
D(0.47,0.57)
(0.33,0.43)
(0.51,0.61)
(0.29,0.39)
(0.52,0.62)
(0.28,0.38)
(0.18,0.28)
(0.62,0.72)
(0.57,0.67)
(0.23,0.33)
(0.54,0.64)
(0.26,0.36)
(0.54,0.64)
(0.26,0.36)
(0.18,0.28)
(0.62,0.72)
(0.19,0.29)
(0.61,0.71)
(0.53,0.63)
(0.27,0.37)
(0.49,0.59)
(0.31,0.41)
(0.14,0.24)
(0.66,0.76)
(0.18,0.28)
(0.62,0.72)
E(0.58,0.68)
(0.22,0.32)
(0.29,0.39)
(0.51,0.61)
(0.59,0.69)
(0.21,0.31)
(0.33,0.43)
(0.47,0.57)
(0.54,0.64)
(0.26,0.36)
(0.53,0.63)
(0.27,0.37)
(0.25,0.35)
(0.55,0.65)
(0.42,0.52)
(0.38,0.48)
(0.29,0.39)
(0.51,0.61)
(0.14,0.24)
(0.66,0.76)
(0.53,0.63)
(0.27,0.37)
(0.22,0.32)
(0.58,0.68)
(0.47,0.57)
(0.33,0.43)
F(0.54,0.64)
(0.26,0.36)
(0.52,0.62)
(0.28,0.38)
(0.31,0.41)
(0.49,0.59)
(0.49,0.59)
(0.31,0.41)
(0.58,0.68)
(0.22,0.32)
(0.52,0.62)
(0.28,0.38)
(0.50,0.59)
(0.30,0.41)
(0.64,0.74)
(0.16,0.26)
(0.37,0.47)
(0.43,0.53)
(0.54,0.64)
(0.26,0.36)
(0.62,0.72)
(0.18,0.28)
(0.47,0.57)
(0.33,0.43)
(0.33,0.43)
(0.47,0.57)
Table 7. Aggregation Matrix of Scheme Scores.
SchemeDC1DC2DC3DC4DC5DC6DC7DC8DC9DC10DC11DC12DC13
A0.660.630.650.540.650.600.310.480.390.540.660.540.30
B0.610.540.540.630.640.550.550.640.430.540.660.550.64
C0.480.500.520.540.560.550.630.560.180.350.180.190.24
D0.480.520.530.210.590.550.550.210.220.540.500.180.21
E0.600.310.610.350.550.540.280.430.310.180.540.250.48
F0.550.530.330.500.600.530.510.660.380.550.640.480.35
Table 8. Ranking of Schemes.
SchemeGroup Utility Value (S)Individual Regret Value (R)Compromise Ranking Index (Q)Rank
A0.1894960.0678240.1091942
B0.1545880.06066201
C0.6020210.0817910.6578254
D0.6503220.1082980.9831196
E0.6676440.0940740.8507025
F0.3810270.0849270.4753693
Table 9. Spearman’s Rank Correlation Coefficient (ρ).
ModelAverage ValueStandard
Deviation
IVIF-QFDIF-QFDQFD
IVIF-QFD7.0003.8941
IF-QFD7.0003.8940.896 **1
QFD7.0003.8940.901 **0.962 **1
** p < 0.01.
Table 10. Comparison of Different Methods of Ranking.
SchemeIVIF-COPRASRankIVIF-TOPSISRankProposed FrameworkRank
A0.81617520.71341920.1091932
B0.84763210.7709815101
C0.64488150.431283340.6578244
D0.56321460.40010950.9831186
E0.74663840.379286760.8507025
F0.80247230.581343130.4753683
The COPRAS method ranks options by maximizing and minimizing the benefits of attributes. The higher the benefit value, the better the option. The TOPSIS method ranks options based on their proximity to positive and negative ideal solutions. The higher the comprehensive score, the better the option. The VIKOR method ranks options by balancing group benefits and individual regrets. The lower the ratio value, the better the option.
Disclaimer/Publisher’s Note: The statements, opinions and data contained in all publications are solely those of the individual author(s) and contributor(s) and not of MDPI and/or the editor(s). MDPI and/or the editor(s) disclaim responsibility for any injury to people or property resulting from any ideas, methods, instructions or products referred to in the content.