Article

Complex Variable Approach for Thermoelastic Boundary Value Problem Using Rational Mapping Techniques

1
Department of Mathematics, Faculty of Education, Alexandria University, Alexandria 21256, Egypt
2
Department of Mathematics, Faculty of Science, Jazan University, Jazan 21944, Saudi Arabia
3
Department of Mathematics, Faculty of Science, Jouf University, Sakaka 2014, Saudi Arabia
*
Author to whom correspondence should be addressed.
Mathematics 2025, 13(19), 3218; https://doi.org/10.3390/math13193218
Submission received: 6 August 2025 / Revised: 30 September 2025 / Accepted: 2 October 2025 / Published: 7 October 2025
(This article belongs to the Section C4: Complex Analysis)

Abstract

This article presents a novel approach to looking at steady-state thermoelastic boundary value problems in isotropic elastic plates with curvilinear holes using a complex variable approach and rational conformal mappings. The physical domain with a non-circular opening is mapped conformally to the unit disk. A thermoelastic potential combines the temperature distribution, which is determined by the Laplace equation with Neumann boundary conditions. Gaursat functions, which are shown as truncated power series, show the complicated stress and displacement fields. They are found by putting boundary constraints at certain collocation points. This procedure presents us with a linear system that can be solved using the least squares method. The method is applied in an annular shape that is exposed to a radial temperature gradient. This experiment shows how changes at the boundary affect the distribution of stress. According to numerical simulations, stress distributions are more uniform when boundaries are smoother, but stress concentrations increase with the size of geometric disturbances. The suggested approach remarkably captures the way geometry and thermal effects interact in two-dimensional thermoelasticity. It is a reliable tool for researching intricate, heated elastic domains.

1. Introduction

Thermoelectricity problems arise from interactions between temperature changes and mechanical deformations in solids. Solving these challenges requires contributions from diverse engineering disciplines, including aerospace, electronics, and energy systems. Changes in temperature lead to stress points forming in materials, with holes, cracks, or uneven edges making them less responsive mechanically [1,2]. Accurately modeling these events is very crucial for checking the strength of a structure and stopping materials from falling apart.
The complex variable method offers a compact and powerful formulation for representing stress and displacement fields, making it ideal for solving elasticity and thermoelectricity problems, facilitating elegant and precise solutions to boundary value problems [3,4]. When combined with conformal mapping, especially rational transformations, it becomes possible to simplify geometrically complex domains [5]. Ref. [6] established a mixed Volterra integral equation of the second kind (F-VIE) in time and position, based on the plane strain problem for three different materials. Ref. [7] proved the existence of a unique solution of the singular quadratic integral equation (SQIE). Ref. [8] studied a quadratic integral equation with a singular kernel in two dimensions and solved it numerically. Ref. [9] deduced the first and second Gaursat functions for an infinite plate that has a pair of curvilinear holes using the complex variable technique. Ref. [10] used an improved mapping function, ω ( ζ ) = A + B ζ + C ζ 1 n 1 ζ + D ζ 1 n 2 ζ , ω ( ζ ) 0 , ζ < 1 , in the fundamental problems of an unbounded plate with two different random holes; this equation has a generalized potential function multiplied by a continuous function with a continuous kernel over time.
In this paper, we will identify a two-dimensional problem with an infinite elastic sheet of material with a curvilinear hole C inside the unit circle γ in the ζ plane ( ζ = ρ e i θ , 0 θ 2 π ) . The proposed semi-analytical method rapidly deals with thermoelastic problems with curvilinear holes, lowers the cost of calculations, and makes stress placement more accurate. This helps engineers design systems that work well in both heat and cold [5,11,12]. The method also extends naturally to geological and industrial contexts such as tunnel lining, subsurface cavities, and petroleum well casings.
The structure of the article is as follows: In Section 2, we introduce the physical and mathematical formulation, including the governing equations of thermoelasticity, boundary conditions, and the construction of a new function of the conformal mapping with real and complex coefficients to obtain the Gaursat functions. Section 3 analyzes the geometric implications of the rational mapping function, emphasizing various parameter selections and the corresponding boundary configurations. Various mapping cases demonstrate the method’s agility. Section 4 introduces the complex variable method, which addresses the boundary value problem by applying Gaursat functions and power series expansions. This work uses a collocation method to set boundary conditions, leading to a numerically solved linear system. Section 5 presents an application involving a circular annulus subjected to a radial thermal gradient. We calculate and evaluate the stress fields in various cases of boundary perturbation to show that the model can represent stress localization and thermal effects.

2. Formulation of the Problem

We consider an unbounded, isotropic elastic plate situated in the x y -plane. Within this plate lies a curvilinear hole C , which is mapped to the boundary of a unit circle γ in the complex z -plane, where z = r e i θ , with   0 r 1 , 0 θ < 2 π .
To facilitate the mathematical treatment, we introduce the following conformal rational mapping function:
w ( z ) = A + B z + m = 1 l a z m ,
where A , B and z lie inside the unit disk | z | < 1 . This mapping transforms the interior of the unit circle to the geometry of the elastic plate containing the curvilinear hole and satisfies the condition w ( z ) 0 to ensure analyticity and conformality.
The plate is subjected to a steady-state, symmetrically distributed heat source Q , applied along the negative y-axis [13,14]. The temperature distribution complies with the Laplace equation in cylindrical coordinates:
2 Q = 2 Q r 2 + 1 r Q r + 1 r 2 2 Q θ 2 = 0
subject to the Neumann boundary condition as follows:
Q r r = r 0 = 0 ,   on   the   boundary   of   the   region   r = r 0 .
The thermoelastic potential function Φ ( z ) associated with the plate satisfies the following relation:
2 Φ + α 1 ν Q = 0 ,
where α is the coefficient of thermal expansion and ν is Poisson’s ratio. The heat distribution in the plate is linked to the conformal mapping w ( z ) and an auxiliary function q ( z ) as follows:
Q ( z ) = 2 Im ( q ( z ) ) + Im ( w ( z ) ) .
Substituting into the potential relation yields the following:
Φ ( z ) = α 2 ( 1 ν ) Im ( q ( z ) ) ln | z r 0 | .
In the theory of plane thermoelasticity [15,16,17,18,19,20], the general solution is represented by two analytic functions in the complex plane ϕ ( z ) and ψ ( z ) , corresponding to the complex stress and displacement potentials. These functions satisfy the following boundary value problem (BVP) on the contour of the hole C :
K ϕ ( t ) t ¯ ϕ ( t ) ψ ( t ) ¯ = f ( t ) , t C
where f ( t ) is a prescribed boundary function and K characterizes the type of BVP:
  • If K = 1 and f ( t ) is a particular stress function, the problem indicates the displacement of the first boundary condition (first BVP) [21].
  • If K = k 1 and f ( t ) denotes prescribed stress, the problem indicates a second boundary condition (second BVP) [22].
    Using the Cauchy integral formula, the solution is given by the following:
    ϕ ( z ) = 1 2 π i γ F ( s ) s z d s , where F ( s ) includes the known boundary data and thermal terms derived from the boundary condition.
In general, once ϕ ( z ) and ψ ( z ) are determined, stress components in the x and y directions are obtained as follows:
σ x x = 2 Re [ ϕ ( z ) + ϕ ( z ) ¯ ] 2 Φ y 2 ,
σ y y = 2 Re [ ϕ ( z ) + ϕ ( z ) ¯ ] 2 Φ y 2 ,
σ x y = Im [ ψ ( z ) + z ϕ ( z ) + ϕ ( z ) ] + 2 Φ x y .
These formulations will serve as the foundation for constructing and solving the boundary value problems in the subsequent sections [23,24]. The influence of the thermal field is incorporated analytically through the potential function Φ ( z ) , and all solutions are confined within the transformed unit disk via the mapping w ( z ) .

3. Conformal Rational Mapping

In this section, we apply the rational mapping function defined in Section 2 to generate various geometric configurations by selecting different values for the parameters A ,   B ,   a , and l in Equation (1). Each component of this mapping function carries a distinct geometric and physical interpretation:
  • A : A translation constant shifts the entire mapped domain in the complex plane and does not introduce any deformation. It is important in relative positioning for multi-body interactions, e.g., tunnels or layered structures.
  • B z : Represents a scaling and rotation. A larger | B | increases the boundary area, potentially diluting stress over a wider zone. Rotation via arg ( B ) reorients stress fields relative to thermal gradients.
  • m = 1 l a z m : A series of inverse power terms that introduce localized perturbations near the origin z = 0 , and a controls the strength and direction of the deformations such as lobes, bulges, or necking zones. Also, high l values create more fine-grained geometric perturbations, useful for modeling engineered surfaces in heat-sensitive components.
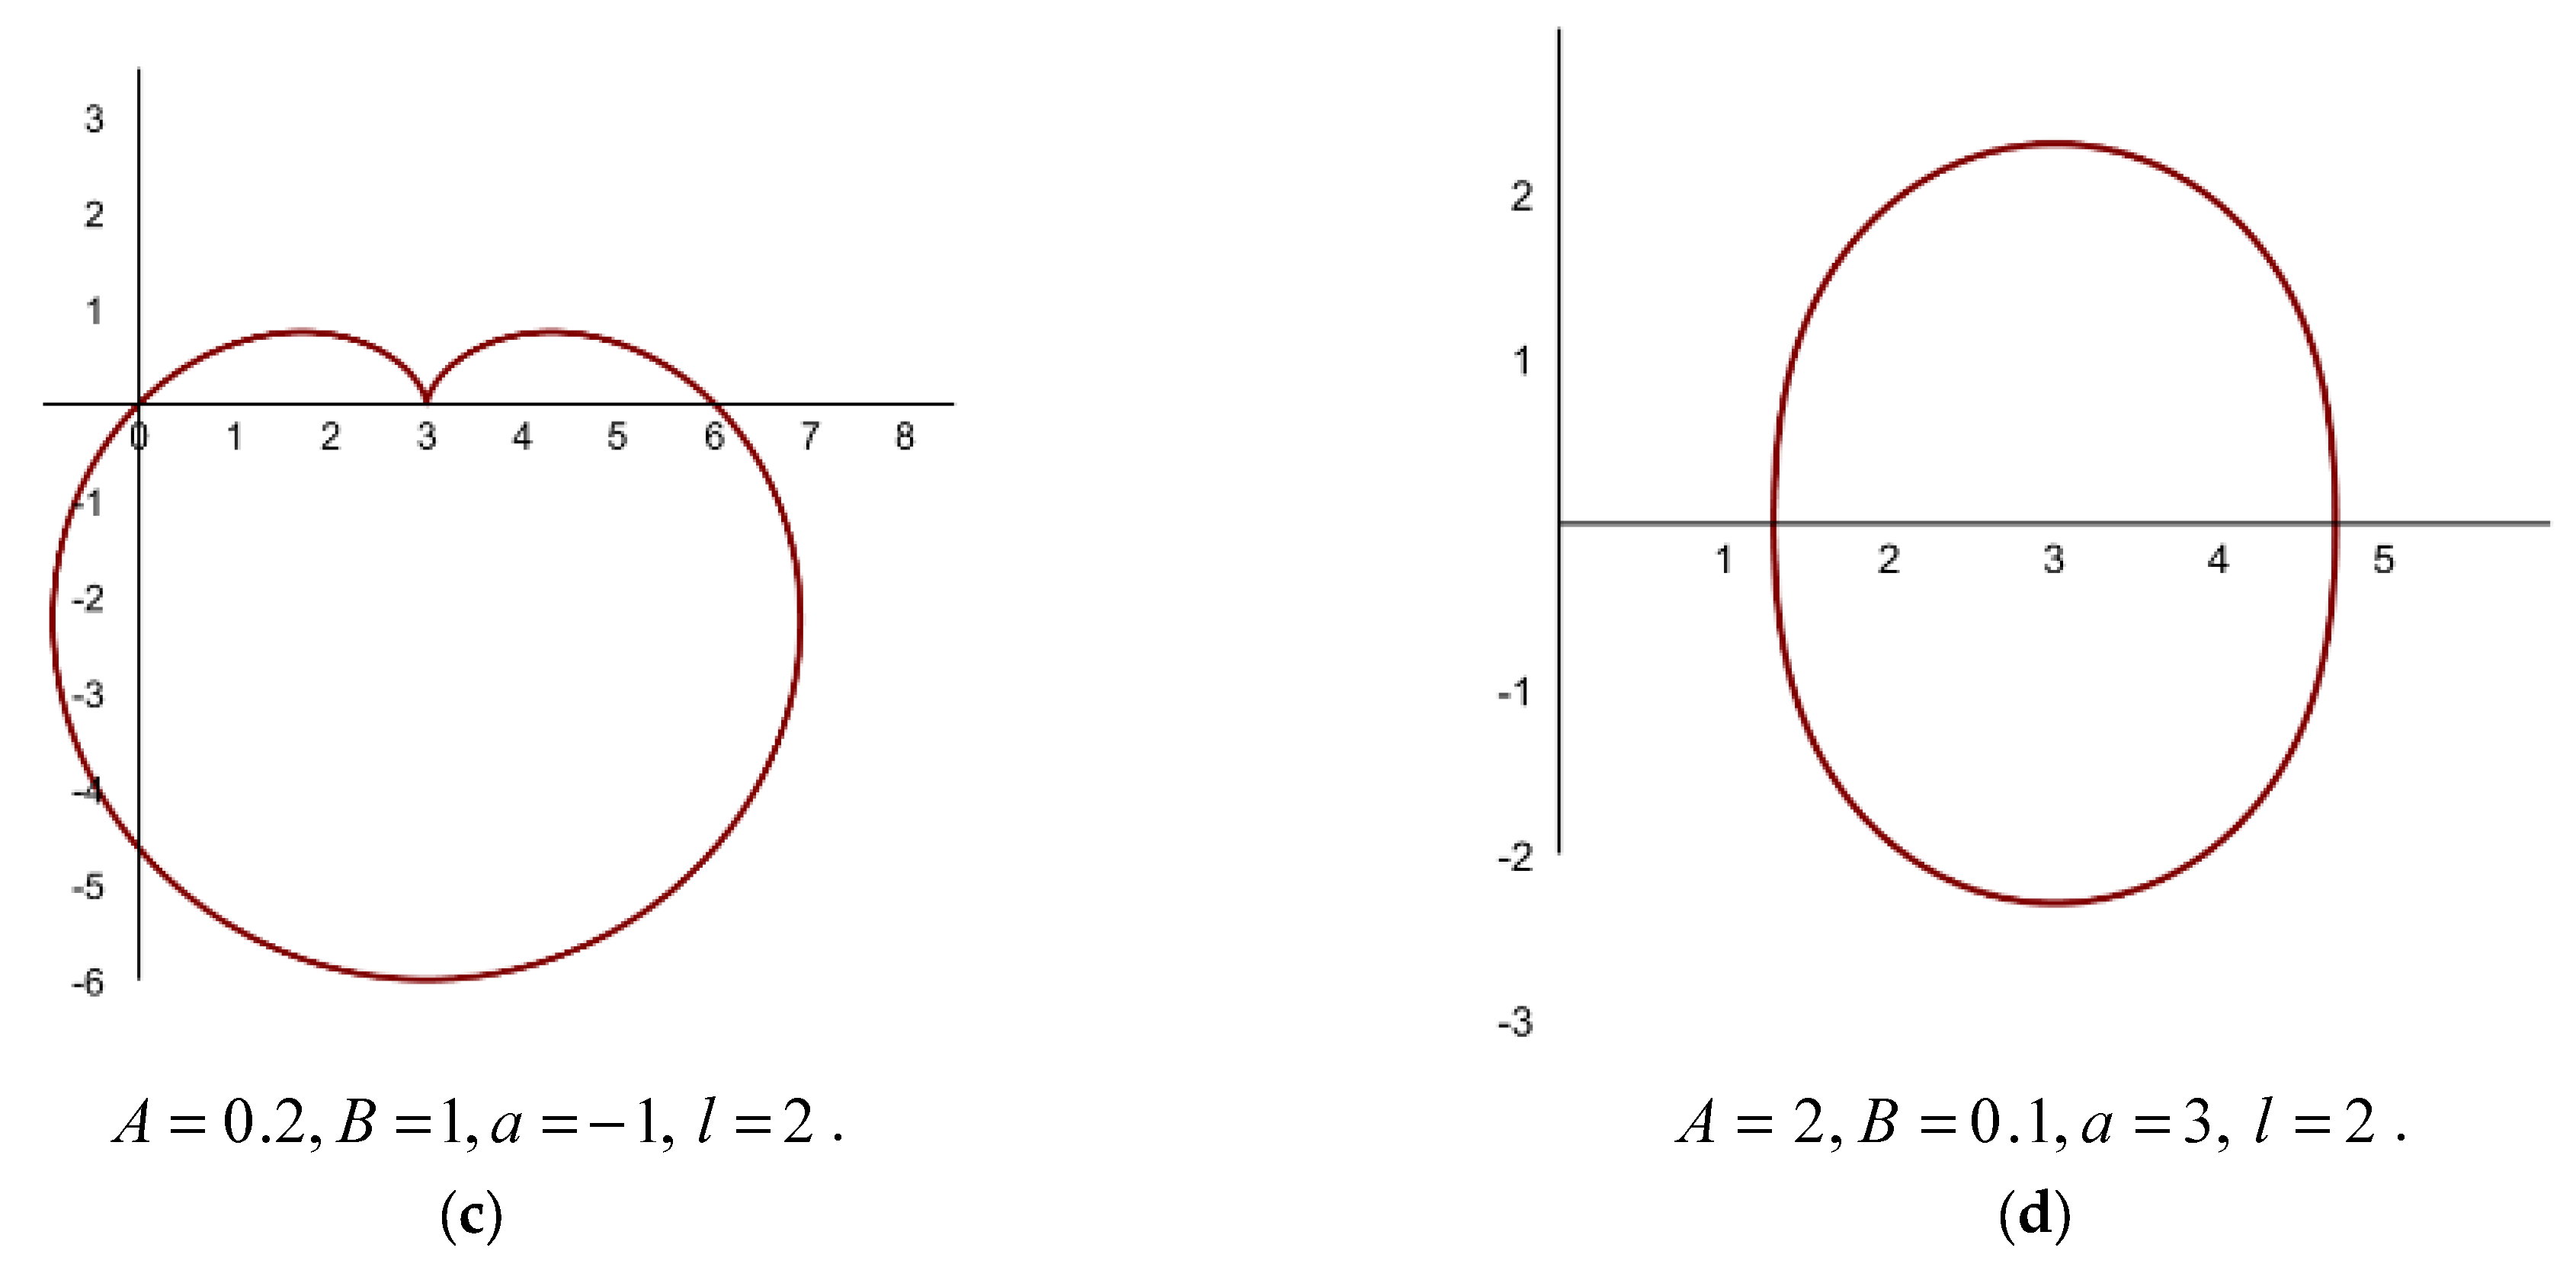
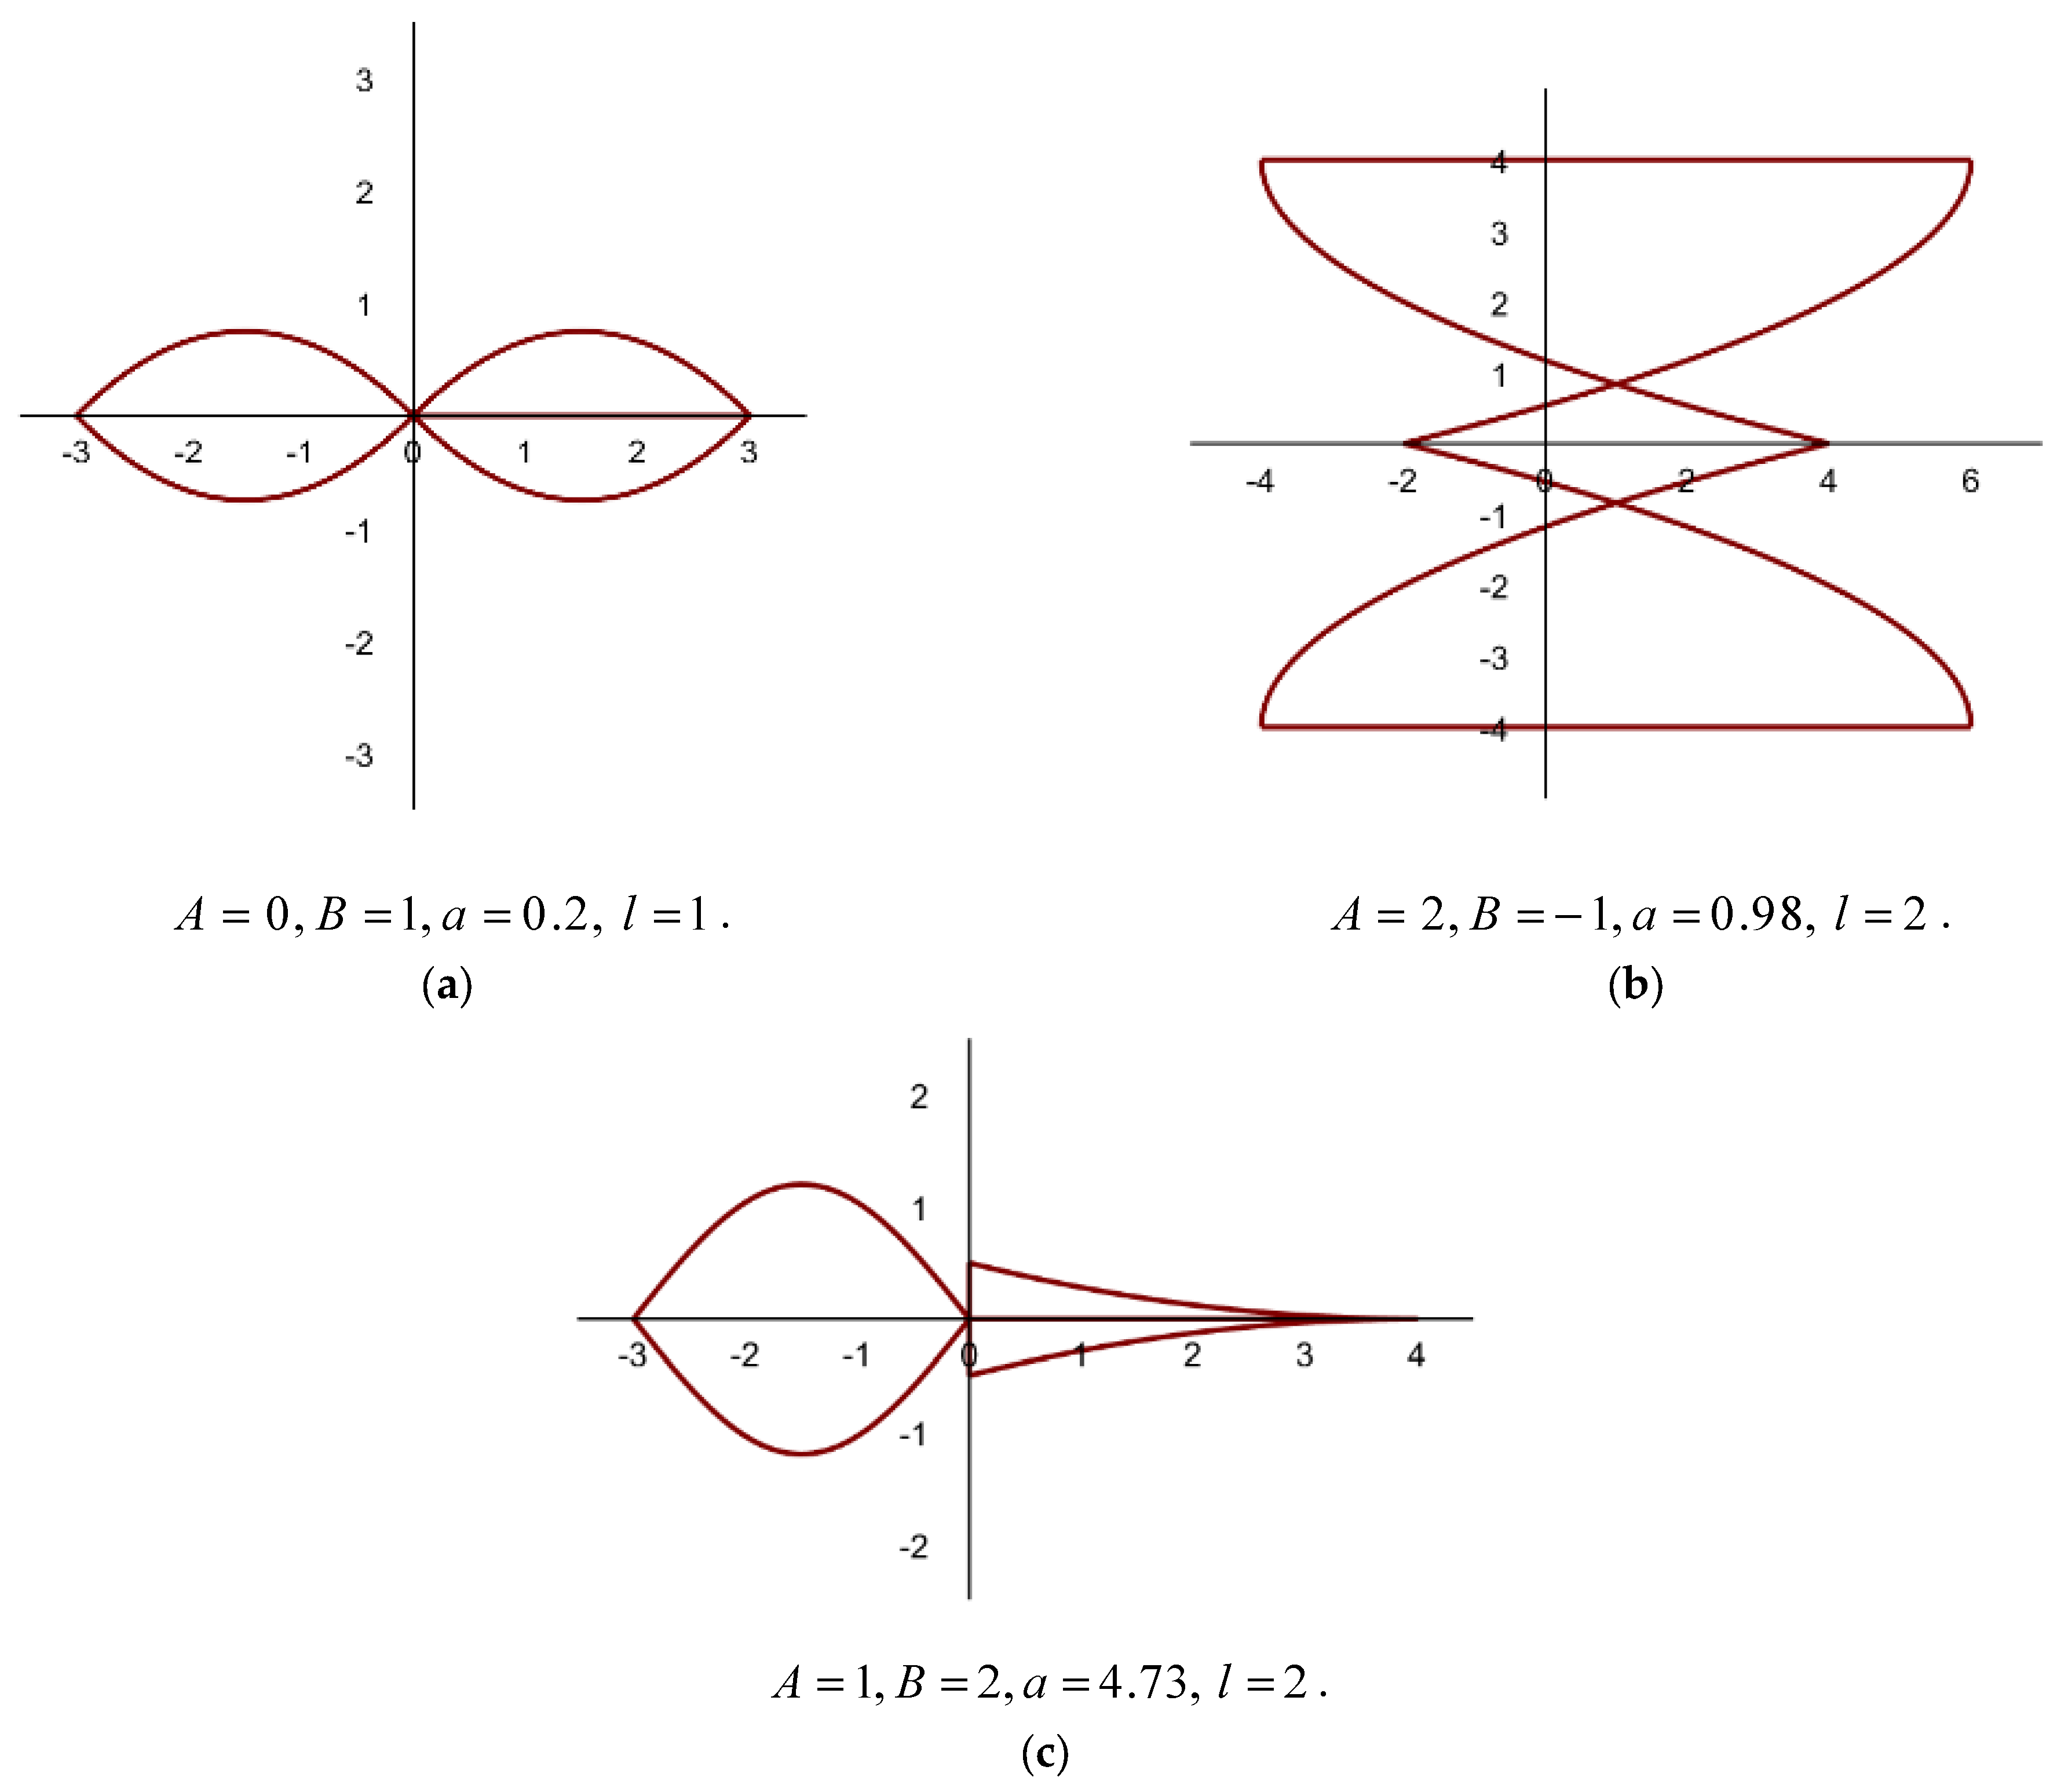
Each selection of parameter values leads to a different curvilinear transformation of the unit disk [10,20]. Figure 1, Figure 2 and Figure 3 illustrate various cases resulting from specific values of the parameters A ,   B ,   a , and l .
Special cases:
  • Case (1): If A , B are fractions and a is an integer.
  • Case (2): If A , B are integers and a is a fraction.
  • Case (3): If A , B are integers and a is a complex number.
From the previous figure, we can assert the following points:
  • These figures have smooth, closed, non-circular limits at different levels of symmetry and curvature. As a result of harmonic distortion, they usually show localized bulges, indentations, or lobes. Despite their diversity, each form of Figure 1 has a continuous border without a sharp corner, in particular (c), indicating that they are controlled by complex but fluid boundary transformations.
  • The shapes in Figure 2 are curves that feature acute, symmetric, and piecewise-smooth edges that are distinctly non-circular and possess angular points. All shapes have a central axis, usually the horizontal axis, which suggests that they are mirror images of each other along one or both coordinate axes.
  • The shapes in Figure 3 represent open curves that are smooth and symmetric and are spread out along the horizontal x-axis. These curves oscillate with decreasing amplitudes and commonly form lobes on both sides of the origin, especially Figure 3d, while others have smooth curves and gradual changes.
This mapping transforms the curvilinear boundary of the physical domain into the unit circle in the complex z -plane. Once this transformation is established, the analytic functions ϕ ( z ) and ψ ( z ) are constructed within the unit disk to represent the complex stress and displacement potential.

4. Complex Variable Approach

In Section 3, conformality guarantees that analytic functions in the transformed domain preserve their structure, hence rendering solution techniques like the Cauchy integral formula applicable. The initial BVP in Equation (7) includes displacement or stress at the hole’s boundary. These are expressed in terms of the Gaursat functions ϕ ( z ) and ψ ( z ) .
After applying the conformal mapping, the boundary C becomes the unit circle γ , and the boundary data f ( t ) is transformed accordingly.
We define a new boundary function, F ( s ) , that spans all known quantities as follows:
F ( s ) = K ϕ ( s ) s ¯ ϕ ( s ) ψ ( s ) ¯ f ( s ) .
This function, F ( s ) , combines the boundary condition into a form suitable for integration over γ [11,12]. Also, F ( s ) is known on the boundary and includes the Gaursat functions ϕ ( z ) and ψ ( z ) , their derivatives, the conjugate of boundary points s , and the known boundary data f ( s ) .
When ϕ ( z ) is analytic inside and on the boundary of the unit circle γ , this is valid because the conformal mapping used in Section 3 preserves analyticity in the transformed domain. So, applying now the Cauchy integral formula to F ( s ) gives the expression for ϕ ( z ) as follows:
ϕ ( z ) = 1 2 π i γ F ( s ) s z d s .
This expresses ϕ ( z ) entirely in terms of the known boundary function F ( s ) , integrated over the boundary γ and valid for z int ( γ ) . This is appropriate for the thermoelastic formulation, as the interior region contains the mapped hole and is the focus for analyzing the elastic field.

4.1. Series Representation of Gaursat Functions

To begin the formulation, we represent the Gaursat functions ϕ ( z ) and ψ ( z ) , which are analytic in the domain as power series:
ϕ ( z ) = n = 0 a n z n ,   ψ ( z ) = n = 0 b n z n .
Here, the coefficients a n and b n are complex constants to be determined.
Using the complex potential formulation [11], the displacements u and v are given by the following:
u + i v = κ 4 μ ϕ ( z ) z ϕ ( z ) ¯ 2 μ ψ ( z ) ¯ 2 μ .
The stress components are obtained as follows:
σ x x + σ y y = 4 [ ϕ ( z ) ] ,
σ y y σ x x + 2 i σ x y = 2 z ϕ ( z ) + 2 ψ ( z ) .
Now, we will truncate the power series expansions up to order N as follows:
ϕ ( z ) n = 0 N a n z n , ψ ( z ) n = 0 N b n z n .
Then, we substitute the truncated series into the boundary condition:
K n = 0 N a n z n z ¯ n = 1 N n a n z n 1 n = 0 N b n ¯ z n ¯ = f ( z ) .

4.2. Projection Method

To solve for the coefficients a n and b n , we will solve Equation (18) at M discrete points along the boundary γ using projection method [25,26], yielding a linear system of equations:
A x = F .
where A is the matrix formed by the evaluated terms of the series at boundary points, x is the vector of unknown coefficients a n and b n , and F is the vector of known boundary values of f ( z ) .
Consider z k to be the k t h collocation point on boundary γ and M be the number of collocation points where M 2 N + 1 [27].
Define the unknown vector X as follows:
X = a 0 a 1 a N b 0 ¯ b 1 ¯ b N ¯ 2 N + 2 .
Compute a row of matrix A as follows:
A k = K z k 0 z k ¯ 0 ,   K z k 1 z k ¯ 1 ,   ,   K z k N z k ¯ N z k N 1   |   z k 0 ¯ , z k 1 ¯ ,   ,   z k N ¯ ,   k   =   1 ,   2 ,   ,   M .
Each row corresponds to one point z k , forming M × ( 2 N + 2 ) matrix A . At each collocation point z k , evaluate f ( z k ) ,   k   =   1 ,   2 ,   ,   M .
F = f ( z 1 ) f ( z 2 ) f ( z M ) M .
Thus, the solution of the overdetermined system in Equation (19) will be X = ( A H A ) 1 A H F , and it is available using least squares [28,29].
To assess the impact of truncation order N by using Equations (19)–(22), we examined the residual norm A x F for increasing truncation orders of N , as shown in Table 1. The residual decreases rapidly with increasing N from 6 to 18.
The residual norm A x     F drops quickly as the truncation order N goes up. It stays below 10−14 for N 14 , which means that the numerical error is quite small. We looked at how the convergence behavior changed with different N values to explain why we chose the truncation order. The observed degradation verifies that the Gaursat function approximations converge swiftly within the domain. So, we find that the best range for N is 14–18, which strikes a good compromise between speed and precision. Increasing N does not considerably enhance precision and may add unnecessary complexity to the solution of the linear system.
After we obtain Gaursat coefficients a n and b n , the stress components at any interior point z can be computed via the computations of ϕ ( z ) ,   ϕ ( z ) ,   and   ψ ( z ) .
To obtain σ x x ,   σ y y , and σ x y , we recall the Gaursat function representations truncated to degree N as follows:
ϕ ( z ) = n = 0 N a n z n , ψ ( z ) = n = 0 N b n z n .
Hence, we compute the required derivatives:
ϕ ( z ) = n = 1 N n a n z n 1 , ϕ ( z ) = n = 1 N 1 n ( n 1 ) a n z n 2 ,   and ψ ( z ) = n = 1 N n b n z n 1 .
Then, we substitute into the following the fundamental relations for stresses:
σ x x + σ y y = 4 ϕ ( z ) = 4 n = 1 N n a n z n 1 ,
σ y y σ x x + 2 i σ x y = 2 z ϕ ( z ) + 2 ψ ( z ) , = 2 z n = 2 N n ( n 1 ) a n z n 2 + 2 n = 1 N n b n z n 1 , = 2 n = 2 N n ( n 1 ) a n z n 1 + 2 n = 1 N n b n z n 1 .
These expressions allow a reconstruction of the stress components σ x x ,   σ y y , and σ x y using the Gaursat coefficients a n and b n . Also, this method yields an analytical approximation to the solution in the mapped domain, suitable for numerical computations.
To assess the robustness of the collocation method and validate the sufficiency of the standard choice M 2 N + 1 , we performed a sensitivity analysis by varying the number of collocation points M for a fixed truncation order N = 12 . In Table 2, we summarize the variation in the maximum values of the stress components σ x x and σ y y for increasing M values.
The results show that the changes in stress magnitudes diminish rapidly as M increases. Beyond M = 40 , the differences between successive stress values fall below 0.05%, indicating convergence.

5. Application: Thermoelastic Stress in a Circular Annulus Under Radial Thermal Gradient

Consider a circular hole of radius R 1 = 1 embedded concentrically within a larger circular plate of radius R 2 = 5 . The annulus is heated such that the temperature drops linearly from a value T 0 = 100   ° C at the inner boundary to 0   ° C at the outer boundary. The radial temperature field T ( r ) is given by the following:
T ( r ) = T 0 1 r R 1 R 2 R 1 , R 1 r R 2 .
The annular geometry is mapped conformally using the following transformation:
z = w ( ζ ) = 1 2 R 1 + R 2 2 ζ ,
where the unit circle | ζ | = 1 maps to the inner boundary and | ζ | = ρ = R 2 / R 1 = 5 maps to the outer boundary; see Figure 4.
The annular plate is assumed to behave as a linear isotropic elastic material under plane strain [30]. The governing material constants are Young’s modulus E = 210 GPa, Poisson’s ratio ν = 0.3 , the thermal expansion coefficient α = 1.2 × 10 5 K 1 , and Kolosov constant K = 2 10 ν .
Observe that this application is a special case of our model in Section 2. Choosing A = 0 , B = 0.5 , a = 5 2 in Equation (1) gives the conformal transformation in Equation (28); the radial temperature field T ( r ) in Equation (27) satisfies Equations (2) and the Neumann condition in Equation (3). The stress field is computed using Equation (18), where the stresses are expressed in terms of two holomorphic functions ϕ ( z ) and ψ ( z ) ; these potentials are approximated by the truncated power series in Equations (23) at N = 10 . See Figure 5.
Under the above assumptions, we have a first BVP at ν = 0.3 , where K = 1 . The BVP in Equation (18) is enforced at M = 2 N + 1 = 21 collocation points along both the inner and outer contours, with the thermal contribution to stress represented as follows:
f ( z ) = α E T ( z ) .
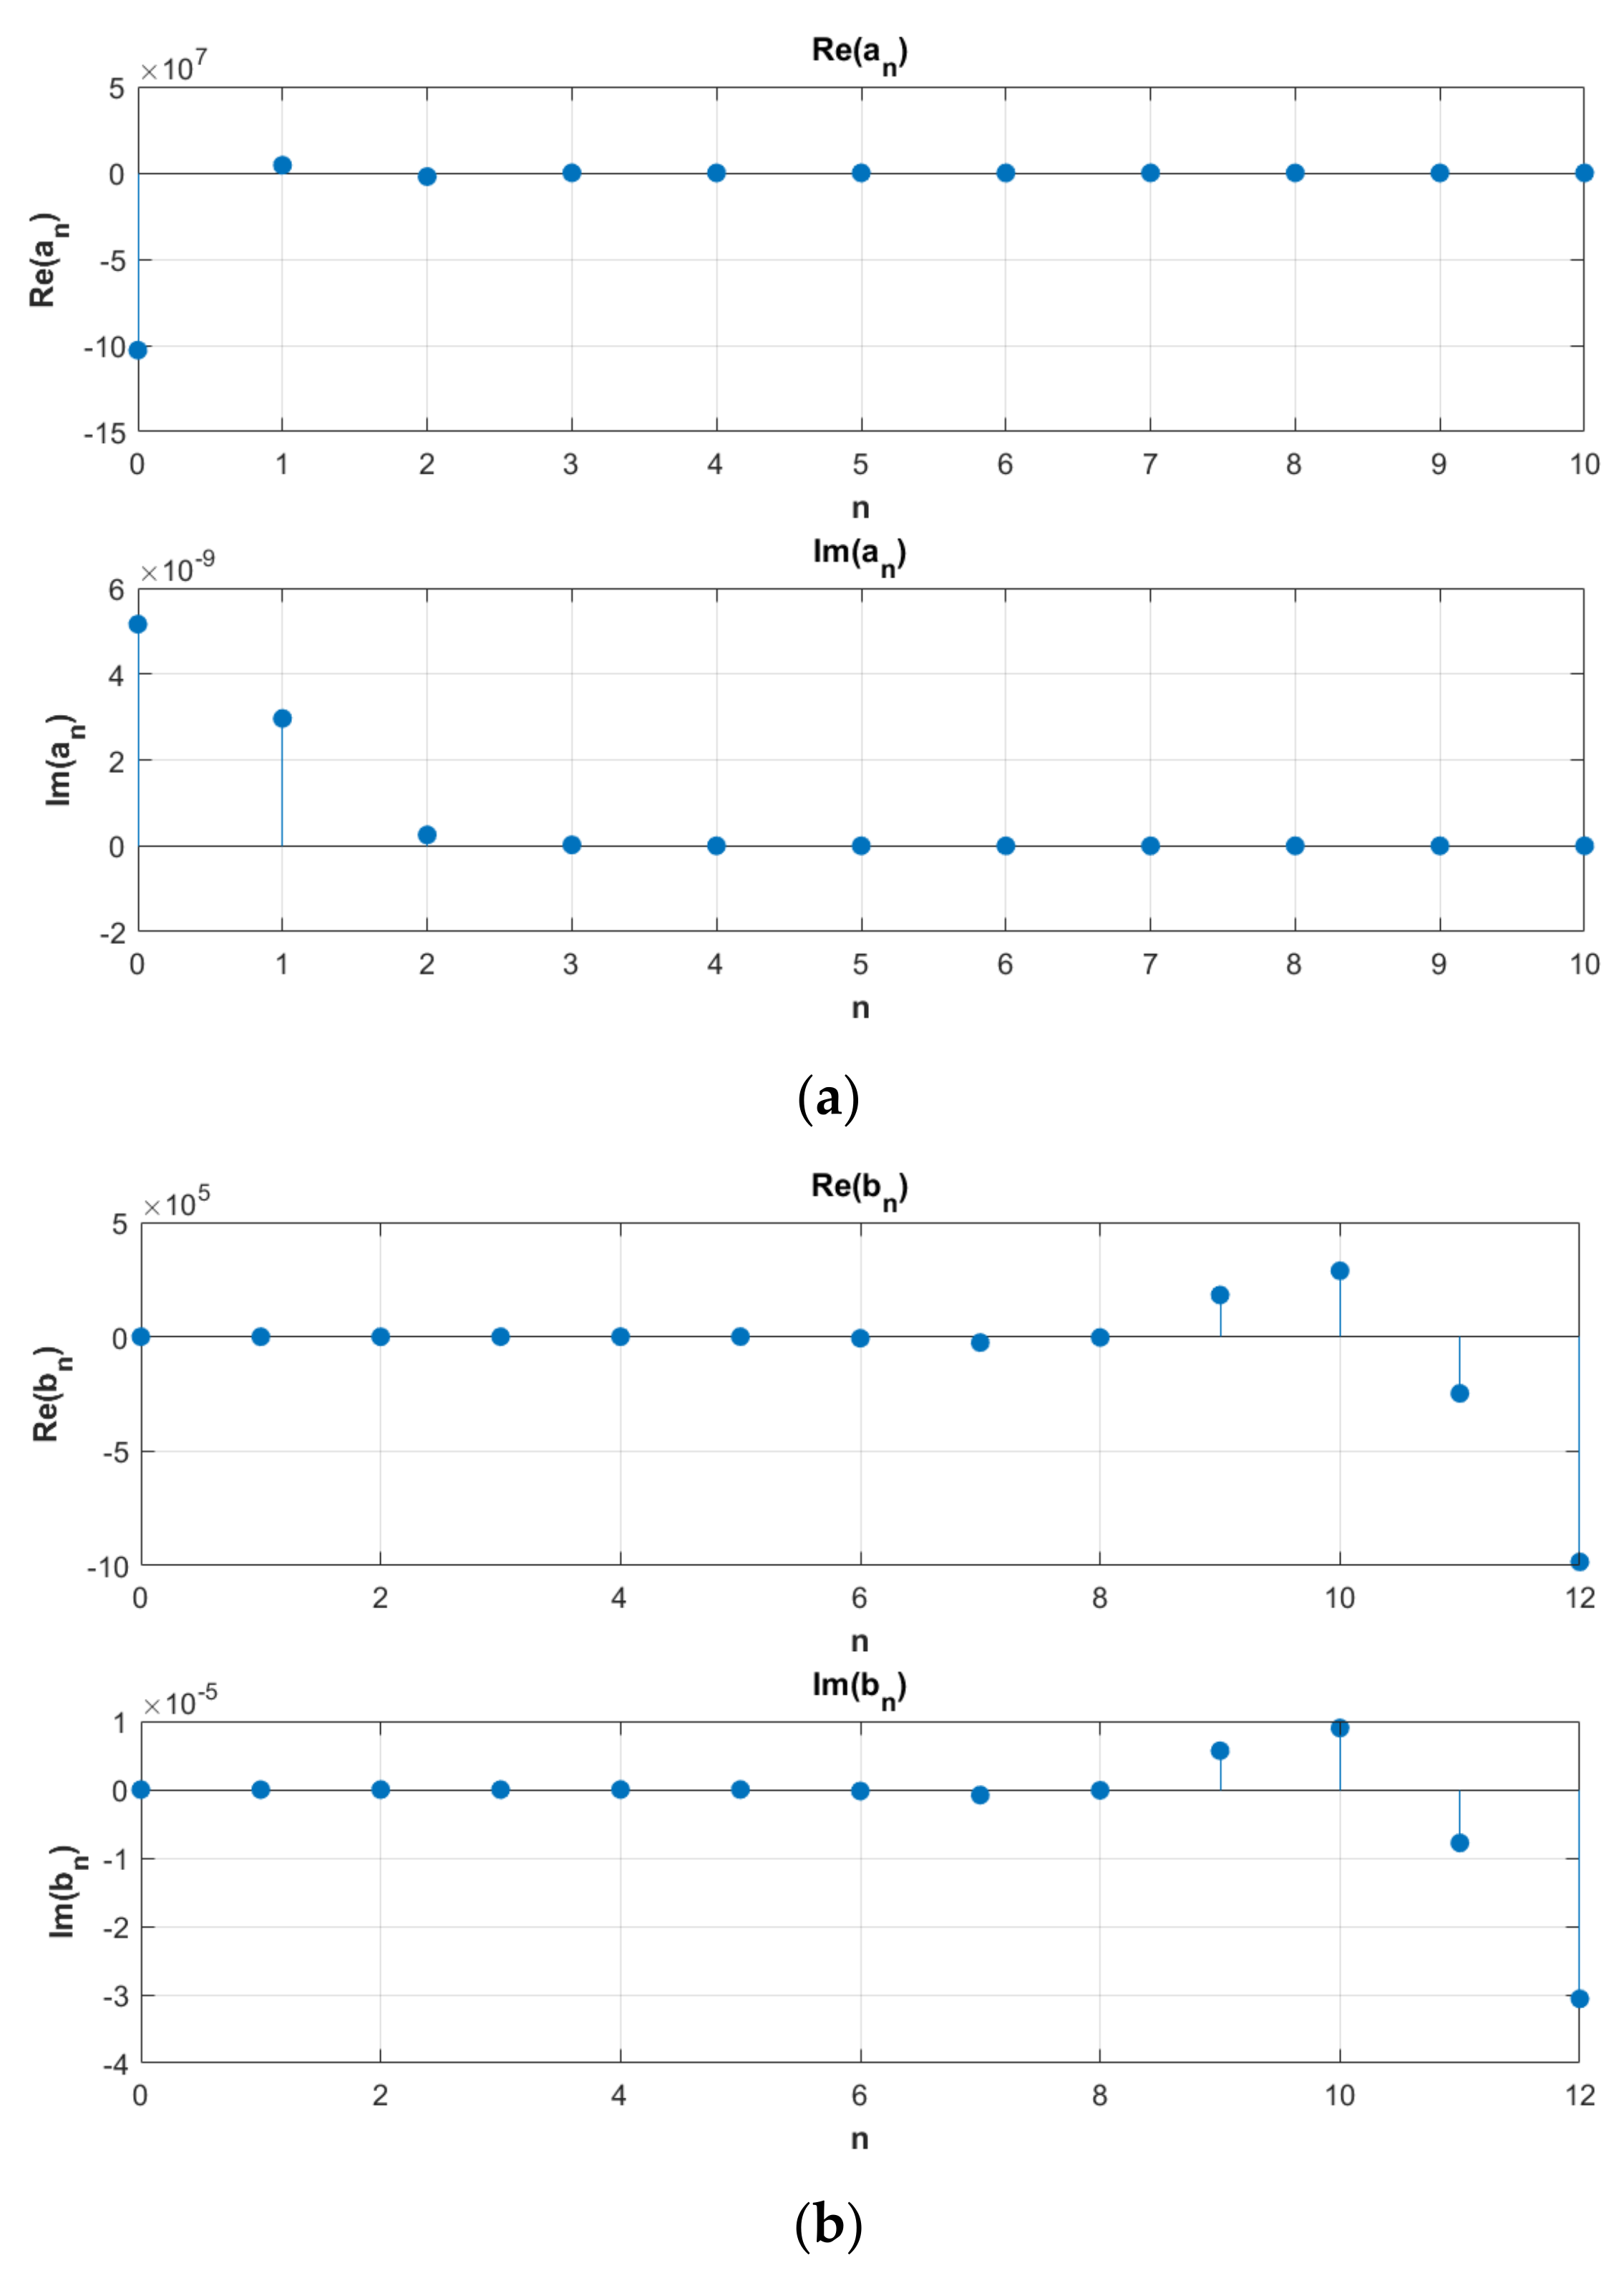
By the aid of Equations (20) and (21), the resulting system A X = f is solved by least squares to determine the Gaursat coefficients a n and b n . The real and imaginary parts of these coefficients are shown in Figure 6a and Figure 6b, respectively, and it helps to distinguish between symmetric and antisymmetric components of the stress field.
Using Equations (25) and (26), we obtain the stress components σ x x ,   σ y y , and σ x y . In Figure 6, we show a full field view of stress distributions across the domain 5 , 5 ; orange regions reflect a positive tensile stress material being pulled in the x-direction. Blue regions reflect a negative compressive stress material being pushed or squeezed in the x-direction. Positive and negative values alternate around the ring, indicating shear symmetry.
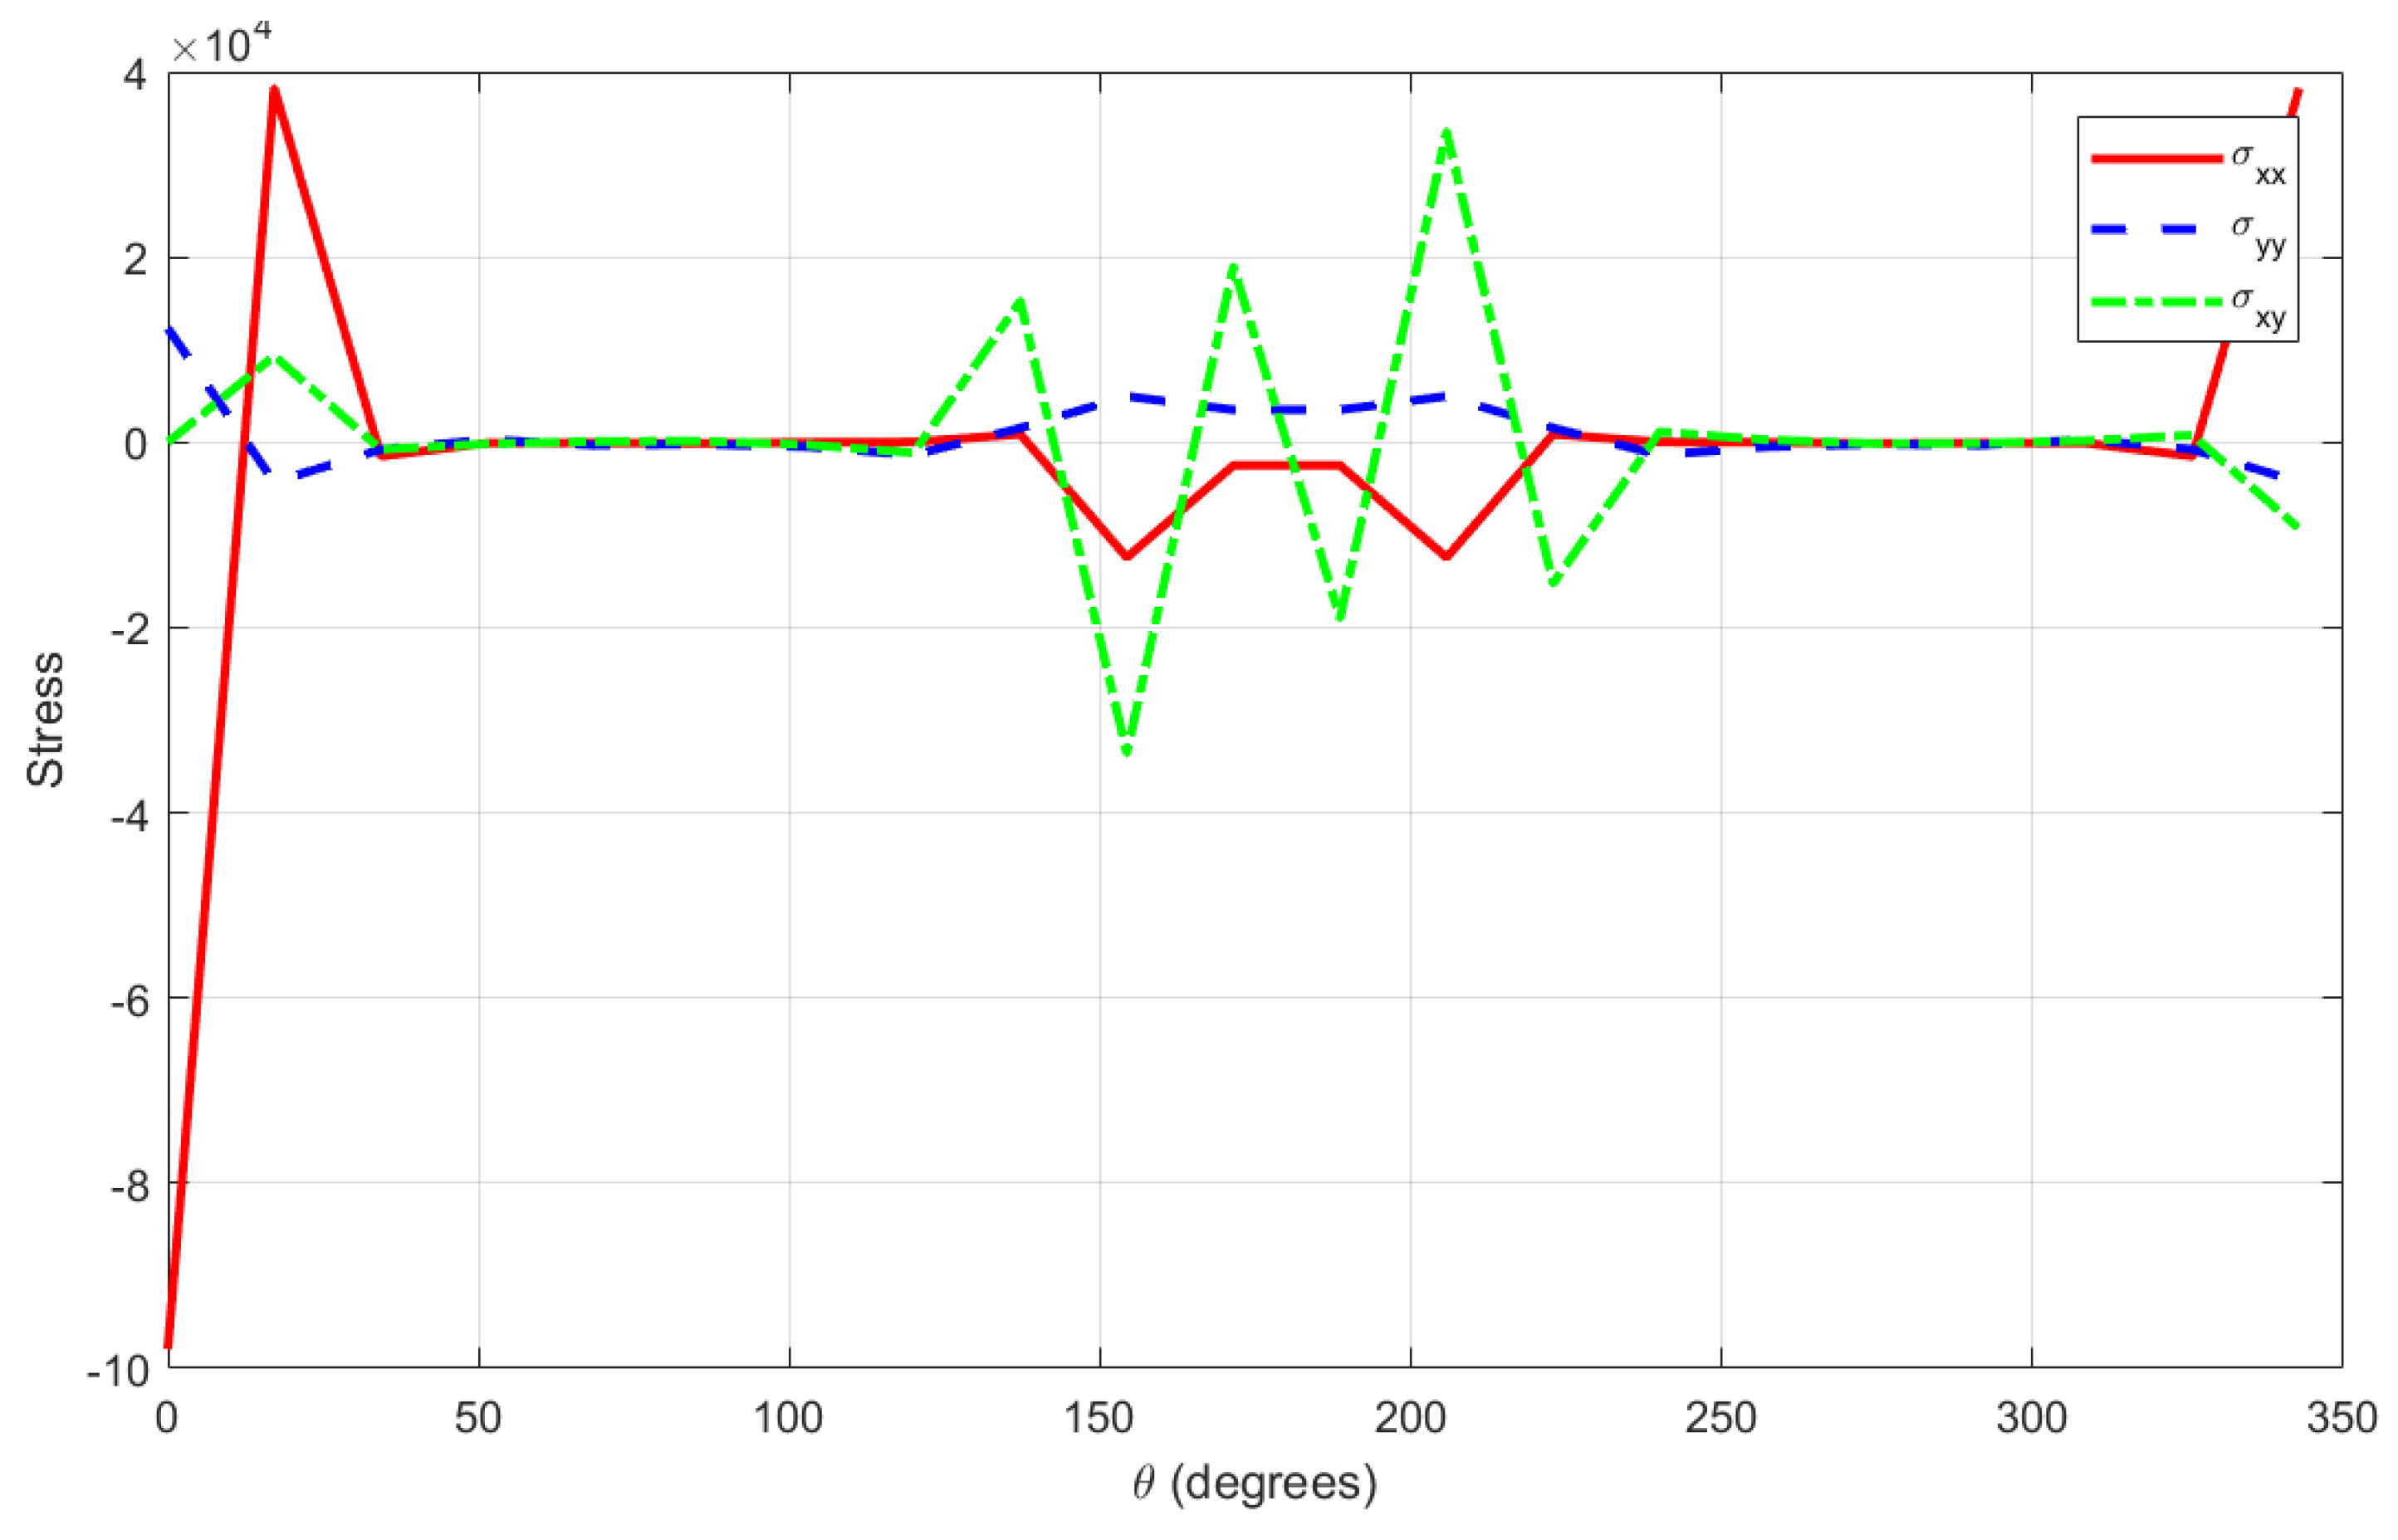
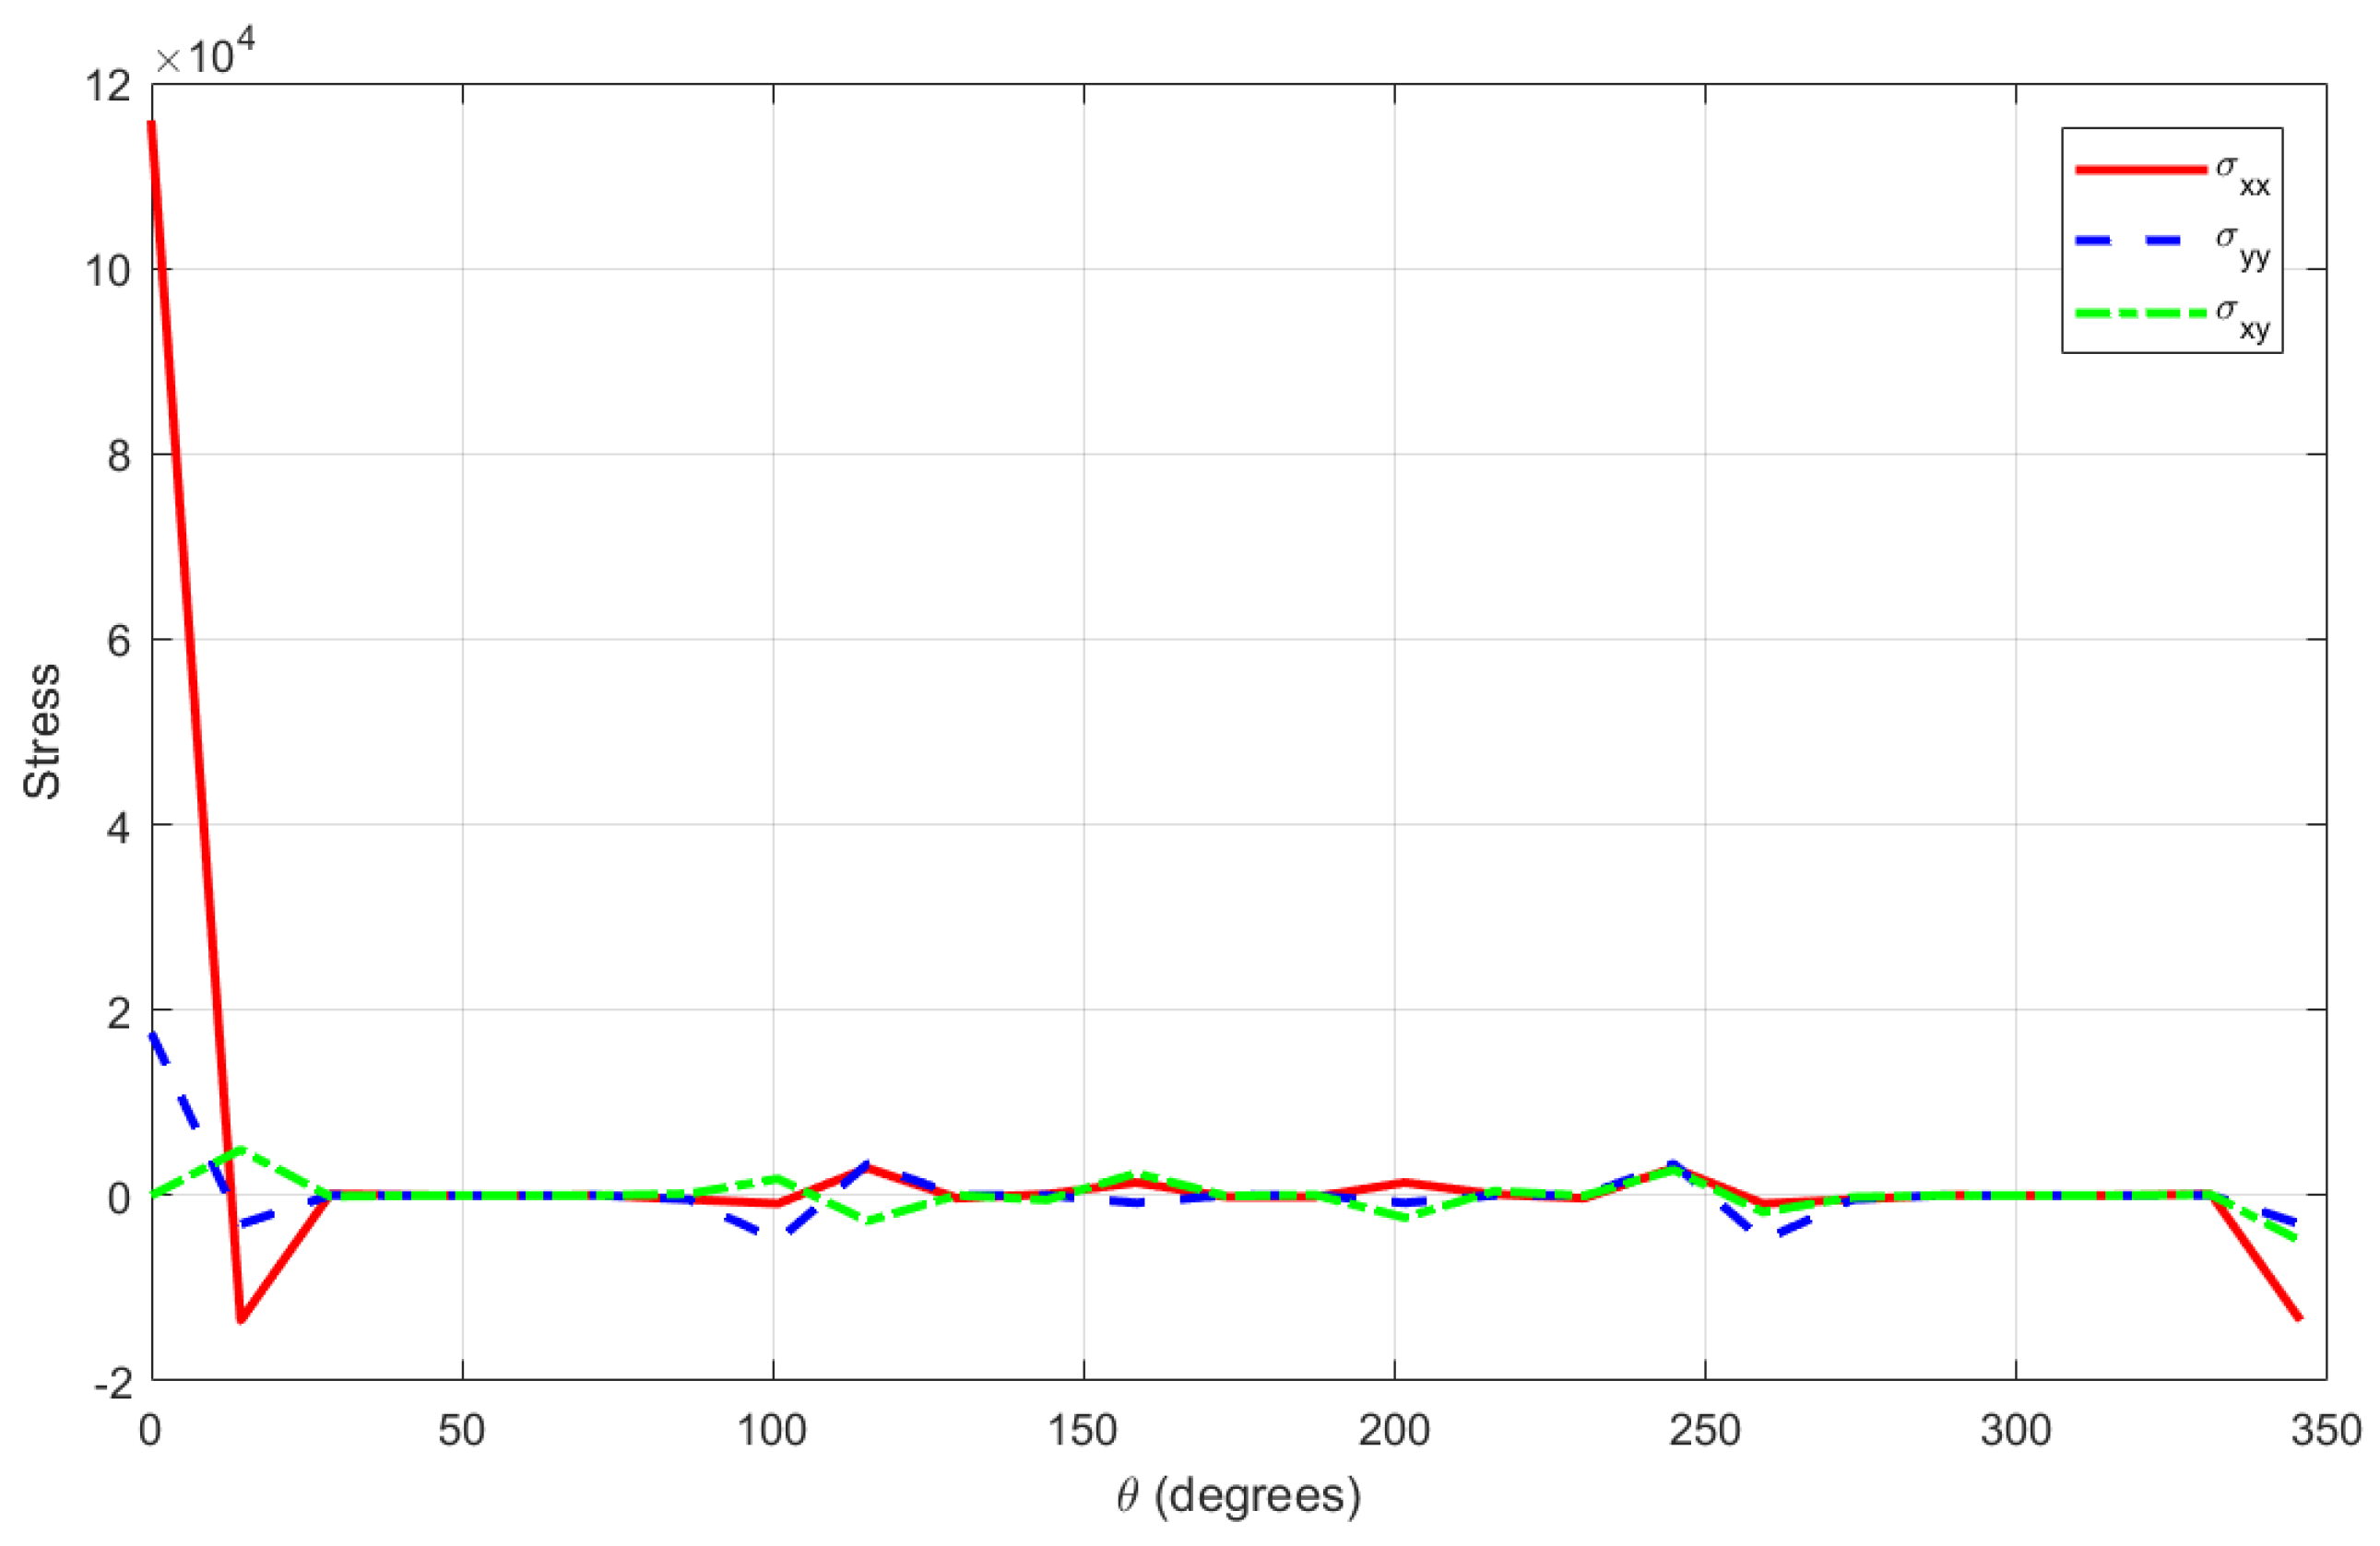
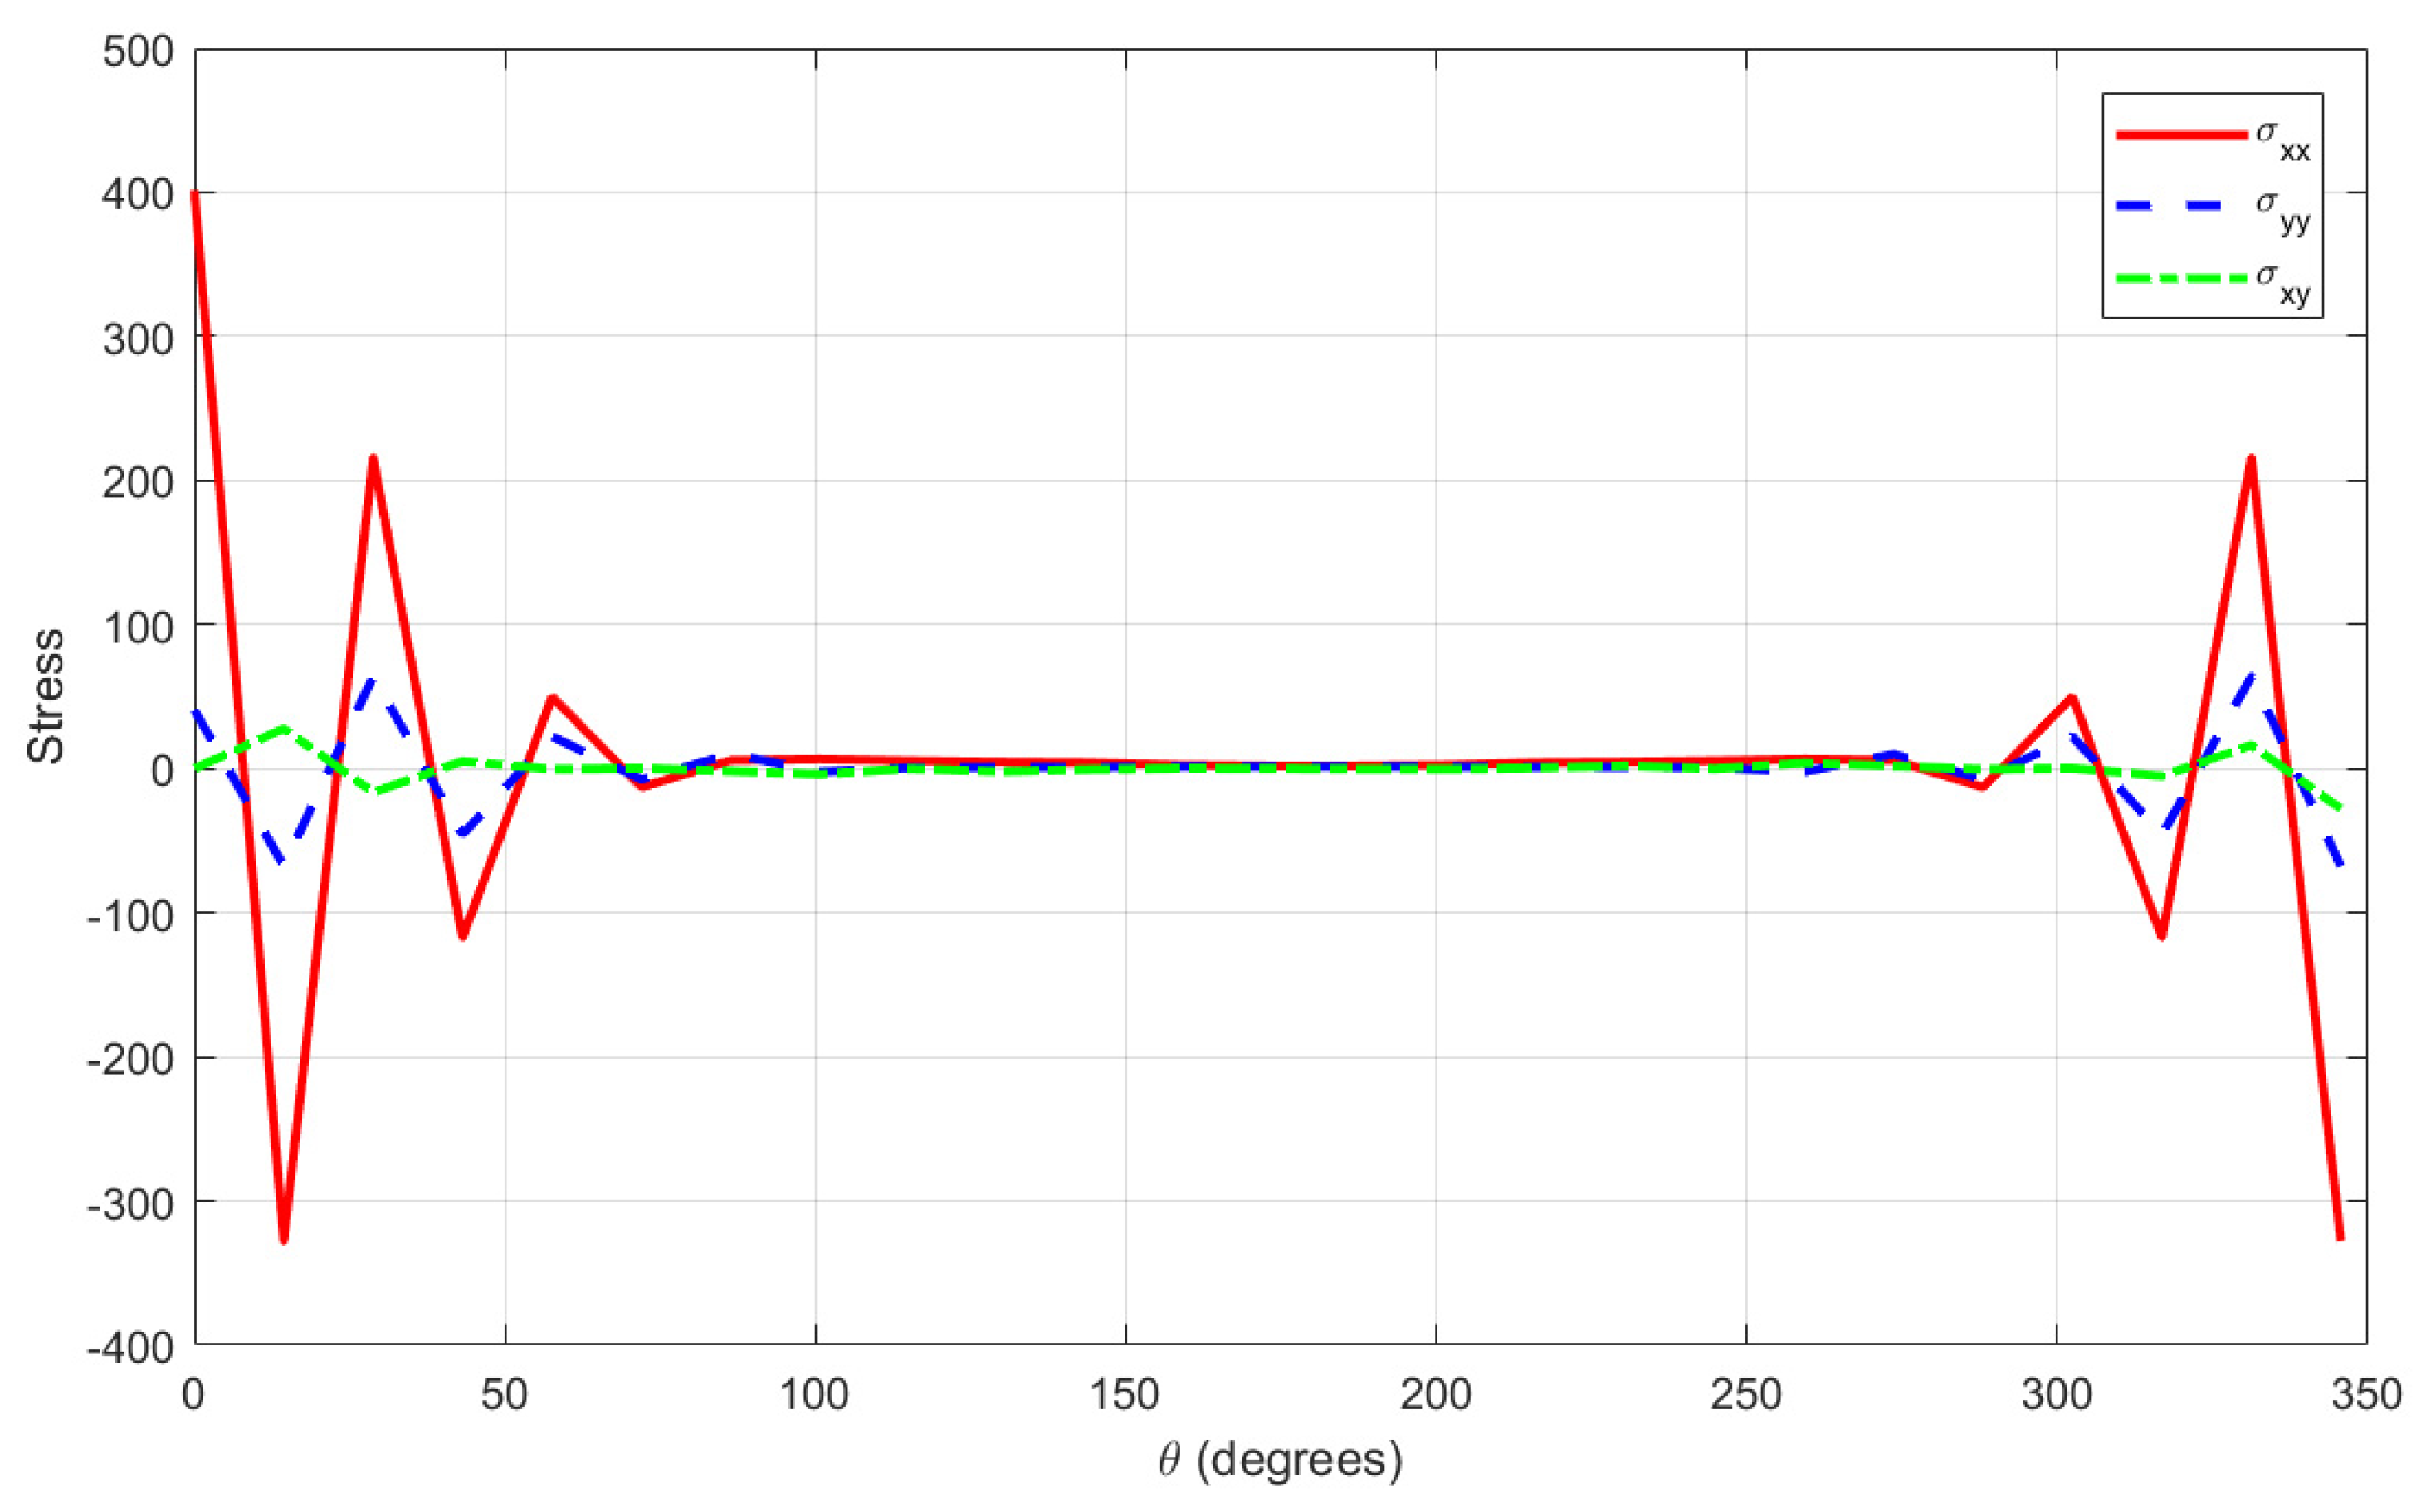
Figure 7 shows the variation in the stress components around the boundary of a circular annular region according to the angle position θ   , measured from 0° to 360°. These figures, which represent high, low, and medium-sized cases of disturbance, highlight distinct characteristics of stress behavior.
In Figure 7, which represents high perturbation, the peak of normal stress σ x x is very high, accompanied by a low stress uniformity. The shear stress activity σ x y is moderate, while boundary sensitivity is strongly shape dependent. This scenario shows a high risk of failure, particularly near sharp geometric zones.
Figure 8, which corresponds to a low disturbance, shows moderate peak values with high uniformity in the stress distribution. Shear stress activity is very low, boundary sensitivity is low, and failure risk is generally low, indicating a more stable structural response.
In Figure 9, associated with medium perturbation, the σ x x peak is medium-high, and the uniformity is moderate. Shear stress activity σ x y is also at a low level. Boundary sensitivity in this case is balanced, and the risk of failure is observed in localized zones rather than widespread areas.
In addition to analyzing geometric effects, we studied the influence of thermoelastic material constants on stress behavior. For a fixed curvilinear geometry, we systematically varied the parameters E , ν , and α . The results, shown in Table 3, confirm that E scales stress amplitudes without changing their spatial pattern; ν modulates the stress redistribution, especially in curved zones, but α linearly amplifies thermal stress due to a stronger mismatch. This analysis highlights how material selection significantly affects stress outcomes, which is essential in design optimization and thermal stress management in composite or engineered materials. While this analysis was conducted for isotropic materials, the framework can be further extended to orthotropic or functionally graded materials by adapting the constitutive relations accordingly, which we plan to explore in future work.
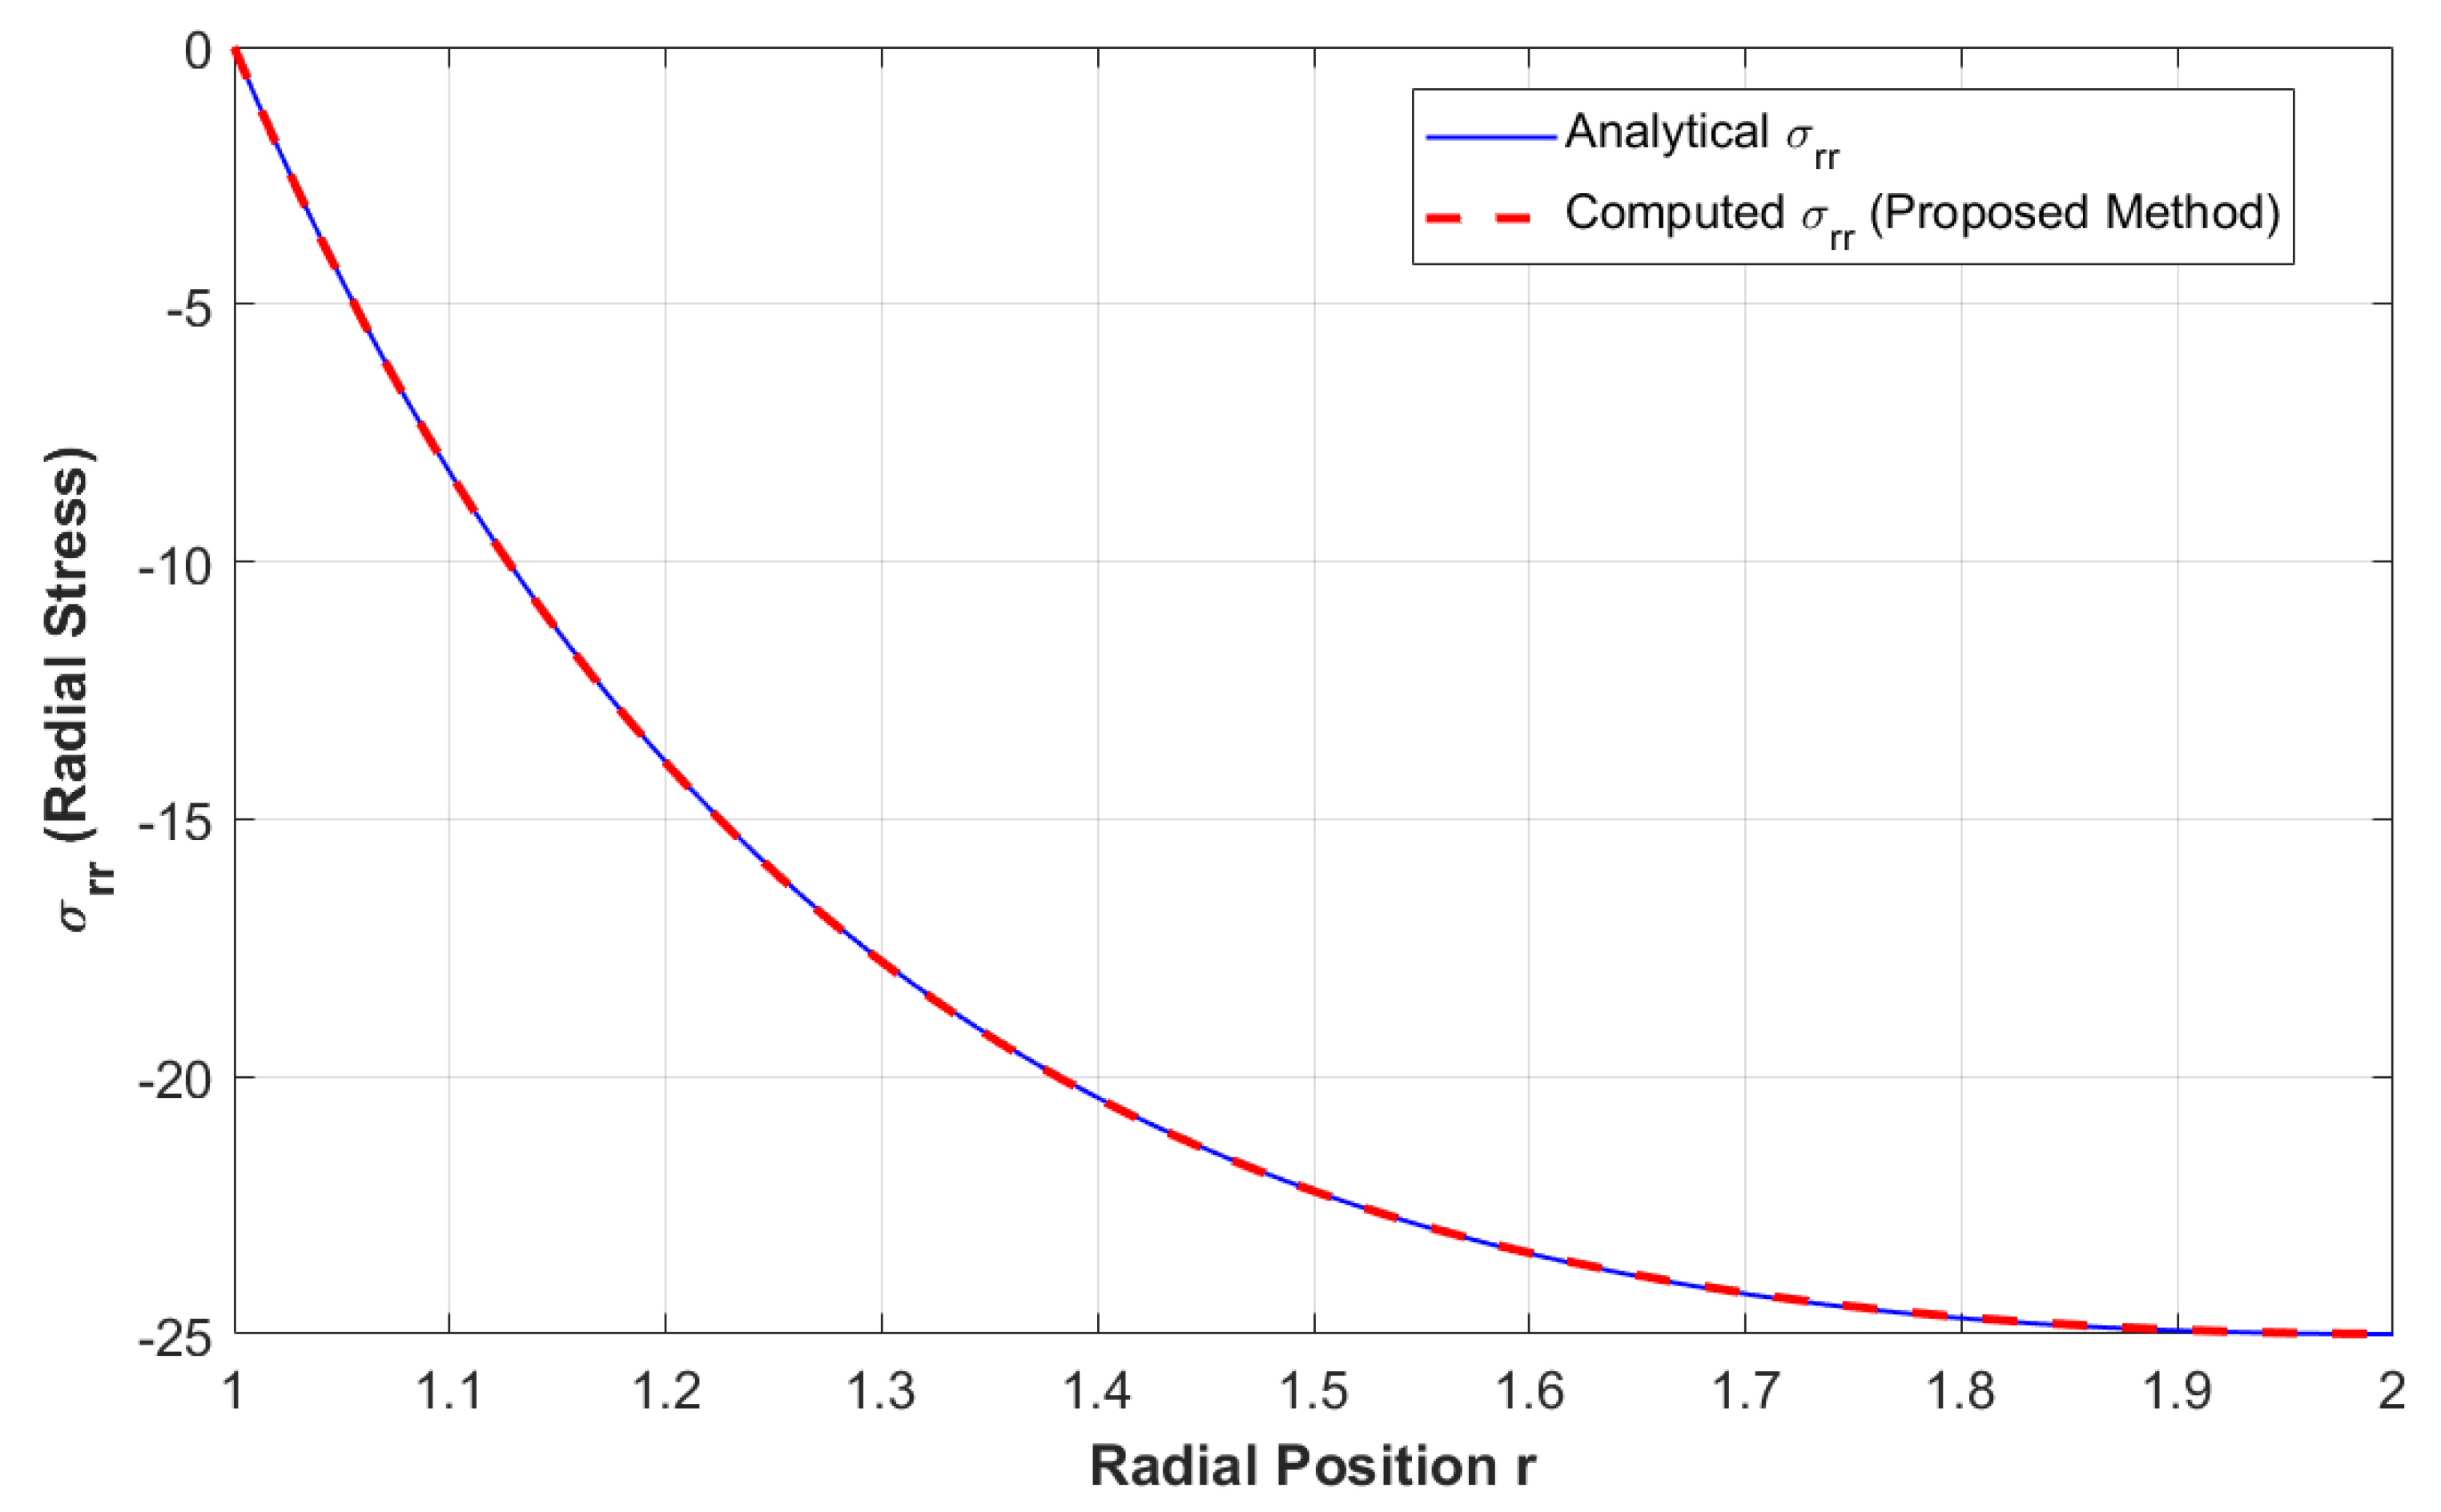
To verify the proposed method, we benchmarked it against the classical analytical solution for a circular hole in an infinite elastic plate subjected to a radial temperature gradient. This case allows for a direct comparison because the exact stress field is known. Firstly, we set the conformal mapping to reproduce a perfect annulus a = 0 , thus enforcing circular symmetry. Then, the computed stress components of σ r r were evaluated at multiple radial points. Figure 10 shows how well the proposed complex variable strategy works with the benchmark solution. This confirms that the approach can recover known examples and that it is accurate in more generic curvilinear domains. The results closely match the analytical expressions from thermoelastic theory, with relative differences below 0.2% across all evaluated points.
Overall, the analysis indicates that increased perturbations intensify stress concentrations and boundary effects, while lower perturbations contribute to more uniform and stable mechanical behavior. Furthermore, the Gaursat-based complex formulation effectively resolves stress singularities near boundaries.

Discussion

  • In Figure 5, showing the distribution behavior of σ x x , the inner boundary wants to expand radially, creating radial tension near the x-axis and compressive regions further out. The distribution behavior of σ y y is similar in structure to σ x x but rotated by 90°; σ y y tends to mirror σ x x but with slight differences due to the directionality of stress paths. The distribution behavior of σ x y components, representing the maximum shear, often appears near the “diagonal” directions (45°, 135°). Due to temperature gradients, different ring sectors want to move in different directions, producing internal shearing.
  • In Figure 6a, real parts of a n typically peak at low n values ( n = 1 , 2 ), indicating the dominance of lower-order harmonics; imaginary parts are generally small or decay rapidly unless torsional or asymmetric loading is present. Figure 6b shows the real parts of b n that are usually smaller than those of a n , but are still meaningful in thermoelastic analyses. Imaginary components of b n become prominent in asymmetric geometries for n 8 .
  • The variation in each stress component around the annular boundary is shown in Figure 7, Figure 8 and Figure 9. Figure 7 shows a high perturbation and strong thermal gradient, and σ x x exhibits extremely high positive and negative peaks, particularly near θ = 0 and θ = 2 π , indicating strong stress concentrations due to boundary lobes or sharp geometry. σ y y is smoother and oscillates slightly around a small positive value. σ x y has periodic fluctuations of moderate magnitude. Figure 8 shows mild perturbation and a weak thermal gradient; σ x x displays a notable initial spike but remains significantly lower overall, while σ y y and σ x y are very smooth, showing a low magnitude and being nearly flat across the boundary. Figure 9 shows an intermediate case, with σ x x having medium peaks and alternating, but not extreme, positive and negative values and σ y y and σ x y being bounded, smooth, and consistent.
  • Table 2 refers to when we fixed N = 12 and varied M in the range between 25 and 60 for each value of M . We computed the resulting stress fields σ x x and σ y y over the same physical geometry; the maximum relative difference in stress magnitudes between successive values of M was found to decrease significantly, reaching less than 0.5% for M 40 , indicating a stable convergence.
  • Acccording to Table 3, an elevation in Young’s modulus E from 50 GPa to 200 GPa results in an approximate quadrupling of both σ x x and σ y y , in accordance with the linear elasticity principle that stress is directly proportional to stiffness. Fluctuations in Poisson’s ratio ν ranging from 0.2 to 0.4 result in minor alterations in σ x x while causing a significant redistribution of σ y y , indicating the increased impact of transverse coupling effects on thermal strain transfer in curved geometries. Conversely, increasing the thermal expansion coefficient α from 1 × 10 5 to 3 × 10 5 K 1 leads to an approximate threefold escalation in both σ x x and σ y y , thereby confirming the direct proportionality between thermal stress and α under constrained boundary conditions.

6. Conclusions

  • Each parameter value used in the rational conformal mapping leads to a different curvilinear transformation of the unit disk. Figure 1, Figure 2 and Figure 3 illustrate various cases resulting from specific values of A ,   B ,   a , and l . The rational mapping simplifies the boundary geometry.
  • Stress concentrations near the inner radius may be critical; the design must consider material yield strength (Figure 6).
  • The stem plots of a n and b n in Figure 5 indicate a harmonic contribution to the stress field that arises from the first few harmonic terms, especially for a n . Thermal effects embedded in b n are more subtle but still influence the stress field meaningfully.
  • Figure 7, Figure 8 and Figure 9 provide a clear comparison of stress magnitudes between three special cases that identify zones of maximum tension or compression, especially near the inner boundary.
  • We examined the residual norm A x F for increasing truncation orders for N as shown in Table 1. These results confirm the reliability of our method and endorse the application of mild truncation rules for precise practical computations.
  • Table 3 shows how stress distributions evolve with varying material constants; these data generally indicate that E and α govern the overall stress magnitude, but ν exerts a secondary, although substantial, influence on the stress distribution.

Future Work

We will investigate adaptive or non-uniform collocation methods, and the suggested strategy will be further validated by additional benchmarking against semi-analytical techniques and finite element simulations. Furthermore, a more thorough grasp of internal accuracy than border verification can be obtained by viewing error distributions throughout the entire domain.

Author Contributions

Conceptualization, M.T.; methodology, E.M.Y. and M.T.; software, M.T.; formal analysis, A.E.S. and A.A.A.-D.; investigation, M.A.A. and M.T.; resources, A.E.S. and M.T.; data curation, E.M.Y. and M.T.; writing—original draft preparation, M.A.A. and M.T.; writing—review and editing, M.T.; visualization, A.A.A.-D. and A.E.S.; supervision, M.A.A.; project administration, M.A.A. and E.M.Y.; funding acquisition, A.E.S. and E.M.Y. All authors have read and agreed to the published version of the manuscript.

Funding

This research received no external funding.

Data Availability Statement

The original contributions presented in this study are included in the article. Further inquiries can be directed to the corresponding author.

Conflicts of Interest

The authors declare no conflict of interest.

References

  1. Muskhelishvili, N. Basic equations of the plane theory of elasticity. In Some Basic Problems of the Mathematical Theory of Elasticity: Fundamental Equations Plane Theory of Elasticity Torsion and Bending; Springer: Berlin/Heidelberg, Germany, 1977; pp. 89–104. [Google Scholar]
  2. Rubenfeld, L.A. A First Course in Applied Complex Variables; Dover Publications: New York, NY, USA, 1985. [Google Scholar]
  3. Erfanian, M.; Zeidabadi, H.; Mehri, R. Solving two-dimensional nonlinear volterra integral equations using rationalized haar functions in the complex plane. Adv. Sci. Eng. Med. 2020, 12, 409–415. [Google Scholar] [CrossRef]
  4. Carloni, C.; Piva, A.; Viola, E. An alternative complex variable formulation for an inclined crack in an orthotropic medium. Eng. Fract. Mech. 2003, 70, 2033–2058. [Google Scholar] [CrossRef]
  5. Schinzinger, R.; Laura, P.A. Conformal Mapping: Methods and Applications; Courier Corporation: North Chelmsford, MA, USA, 2012. [Google Scholar]
  6. Al-Bugami, A. Numerical Treating of Mixed Integral Equation Two--Dimensional in Surface Cracks in Finite Layers of Materials. Adv. Math. Phys. 2022, 2022, 3398175. [Google Scholar] [CrossRef]
  7. Abdou, M. Fredholm–Volterra integral equation with singular kernel. Appl. Math. Comput. 2003, 137, 231–243. [Google Scholar] [CrossRef]
  8. Abdel-Aty, M.; Abdou, M.; Soliman, A. Solvability of quadratic integral equations with singular kernel. J. Contemp. Math. Anal. (Armen. Acad. Sci.) 2022, 57, 12–25. [Google Scholar]
  9. Abdou, M.A.; Jan, A.R. An infinite elastic plate weakened by a generalized curvilinear hole and Goursat functions. Appl. Math. 2014, 5, 728–743. [Google Scholar] [CrossRef]
  10. Alhazmi, S.E.; Abdou, M.; Basseem, M. The stresses components in position and time of weakened plate with two holes conformally mapped into a unit circle by a conformal mapping with complex constant coefficients. AIMS Math 2023, 8, 11095–11112. [Google Scholar] [CrossRef]
  11. Jafari, M. Thermal stress analysis of orthotropic plate containing a rectangular hole using complex variable method. Eur. J. Mech. -A/Solids 2019, 73, 212–223. [Google Scholar] [CrossRef]
  12. Grigorenko, A.Y.; Pankrat’ev, S. Stress–strain state of complex-shaped orthotropic plates under variable load. Int. Appl. Mech. 2018, 54, 411–417. [Google Scholar] [CrossRef]
  13. Khechai, A.; Layachi, M.; Belarbi, M.-O.; Gohery, S.; Layachi, S.; Ruocco, E.; Gemi, L.; Liang, Q.Q. An extended Greszczuk’s analytical method for stress analysis of unsymmetrical laminated composite plates with a circular hole under axial, biaxial, and shear loads. Structures 2025, 71, 108169. [Google Scholar] [CrossRef]
  14. Gonenli, C.; Das, O. Free vibration analysis of circular and annular thin plates based on crack characteristics. Rep. Mech. Eng. 2022, 3, 158–167. [Google Scholar] [CrossRef]
  15. Șeremet, V.; Crețu, I. New Green’s functions for a thermoelastic unbounded parallelepiped under a point heat source and their application. Acta Mech. 2023, 234, 6515–6528. [Google Scholar] [CrossRef]
  16. Hetnarski, R.B.; Ignaczak, J. Mathematical theory of elasticity. J. Therm. Stress. 2006, 29, 505–506. [Google Scholar] [CrossRef]
  17. Alharbi, F.M.; Alhendi, N.G. Influence of Heat Transfer on Stress Components in Metallic Plates Weakened by Multi-Curved Holes. Axioms 2025, 14, 369. [Google Scholar] [CrossRef]
  18. Mao, S.; Liu, W.; Zhou, T.; Xue, C.; Wei, D. Steady-state and transient thermal–hydraulic analysis for high temperature heat pipe cooled reactors. Nucl. Eng. Des. 2023, 412, 112479. [Google Scholar] [CrossRef]
  19. Wang, C.; Xiao, J.; Liu, W.; Ma, Z. Unloading and reloading stress-strain relationship of recycled aggregate concrete reinforced with steel/polypropylene fibers under uniaxial low-cycle loadings. Cem. Concr. Compos. 2022, 131, 104597. [Google Scholar] [CrossRef]
  20. Abouelregal, A.E. Generalized thermoelastic MGT model for a functionally graded heterogeneous unbounded medium containing a spherical hole. Eur. Phys. J. Plus 2022, 137, 953. [Google Scholar] [CrossRef]
  21. Abdullaev, V.; Aida-Zade, K. Numerical method of solution to loaded nonlocal boundary value problems for ordinary differential equations. Comput. Math. Math. Phys. 2014, 54, 1096–1109. [Google Scholar] [CrossRef]
  22. Lamichhane, B.P.; Lindstrom, S.B.; Sims, B. Application of projection algorithms to differential equations: Boundary value problems. ANZIAM J. 2019, 61, 23–46. [Google Scholar]
  23. El-sirafy, I.H. Goursat Functions of Thermoelastic Problem of an Infinite Plate with Hypitrochoidal Hole. In Encyclopedia of Thermal Stresses; Springer: Berlin/Heidelberg, Germany, 2014; pp. 2006–2012. [Google Scholar]
  24. Bhullar, S.; Wegner, J. Thermal stresses in a plate with hyperelliptical hole. J. Eng. Technol. Res. 2009, 1, 152–170. [Google Scholar]
  25. Gavrilov, S.N.; Krivtsov, A.M. Steady-state kinetic temperature distribution in a two-dimensional square harmonic scalar lattice lying in a viscous environment and subjected to a point heat source. Contin. Mech. Thermodyn. 2020, 32, 41–61. [Google Scholar] [CrossRef]
  26. Filipov, S.M.; Gospodinov, I.D.; Faragó, I. Shooting-projection method for two-point boundary value problems. Appl. Math. Lett. 2017, 72, 10–15. [Google Scholar] [CrossRef]
  27. Alsulaiman, R.E.; Abdou, M.A.; ElBorai, M.M.; El-Sayed, W.G.; Youssef, E.M.; Taha, M. Qualitative Analysis for Solving a Fractional Integro-Differential Equation of Hyperbolic Type with Numerical Treatment Using the Lerch Matrix Collocation Method. Fractal Fract. 2023, 7, 599. [Google Scholar] [CrossRef]
  28. Mortari, D. Least-squares solution of linear differential equations. Mathematics 2017, 5, 48. [Google Scholar] [CrossRef]
  29. Solhi, E.; Mirzaee, F.; Naserifar, S. Enhanced moving least squares method for solving the stochastic fractional Volterra integro-differential equations of Hammerstein type. Numer. Algorithms 2024, 95, 1921–1951. [Google Scholar] [CrossRef]
  30. Awrejcewicz, J.; Krysko, V.A. Elastic and Thermoelastic Problems in Nonlinear Dynamics of Structural Members; Springer: Berlin/Heidelberg, Germany, 2020. [Google Scholar]
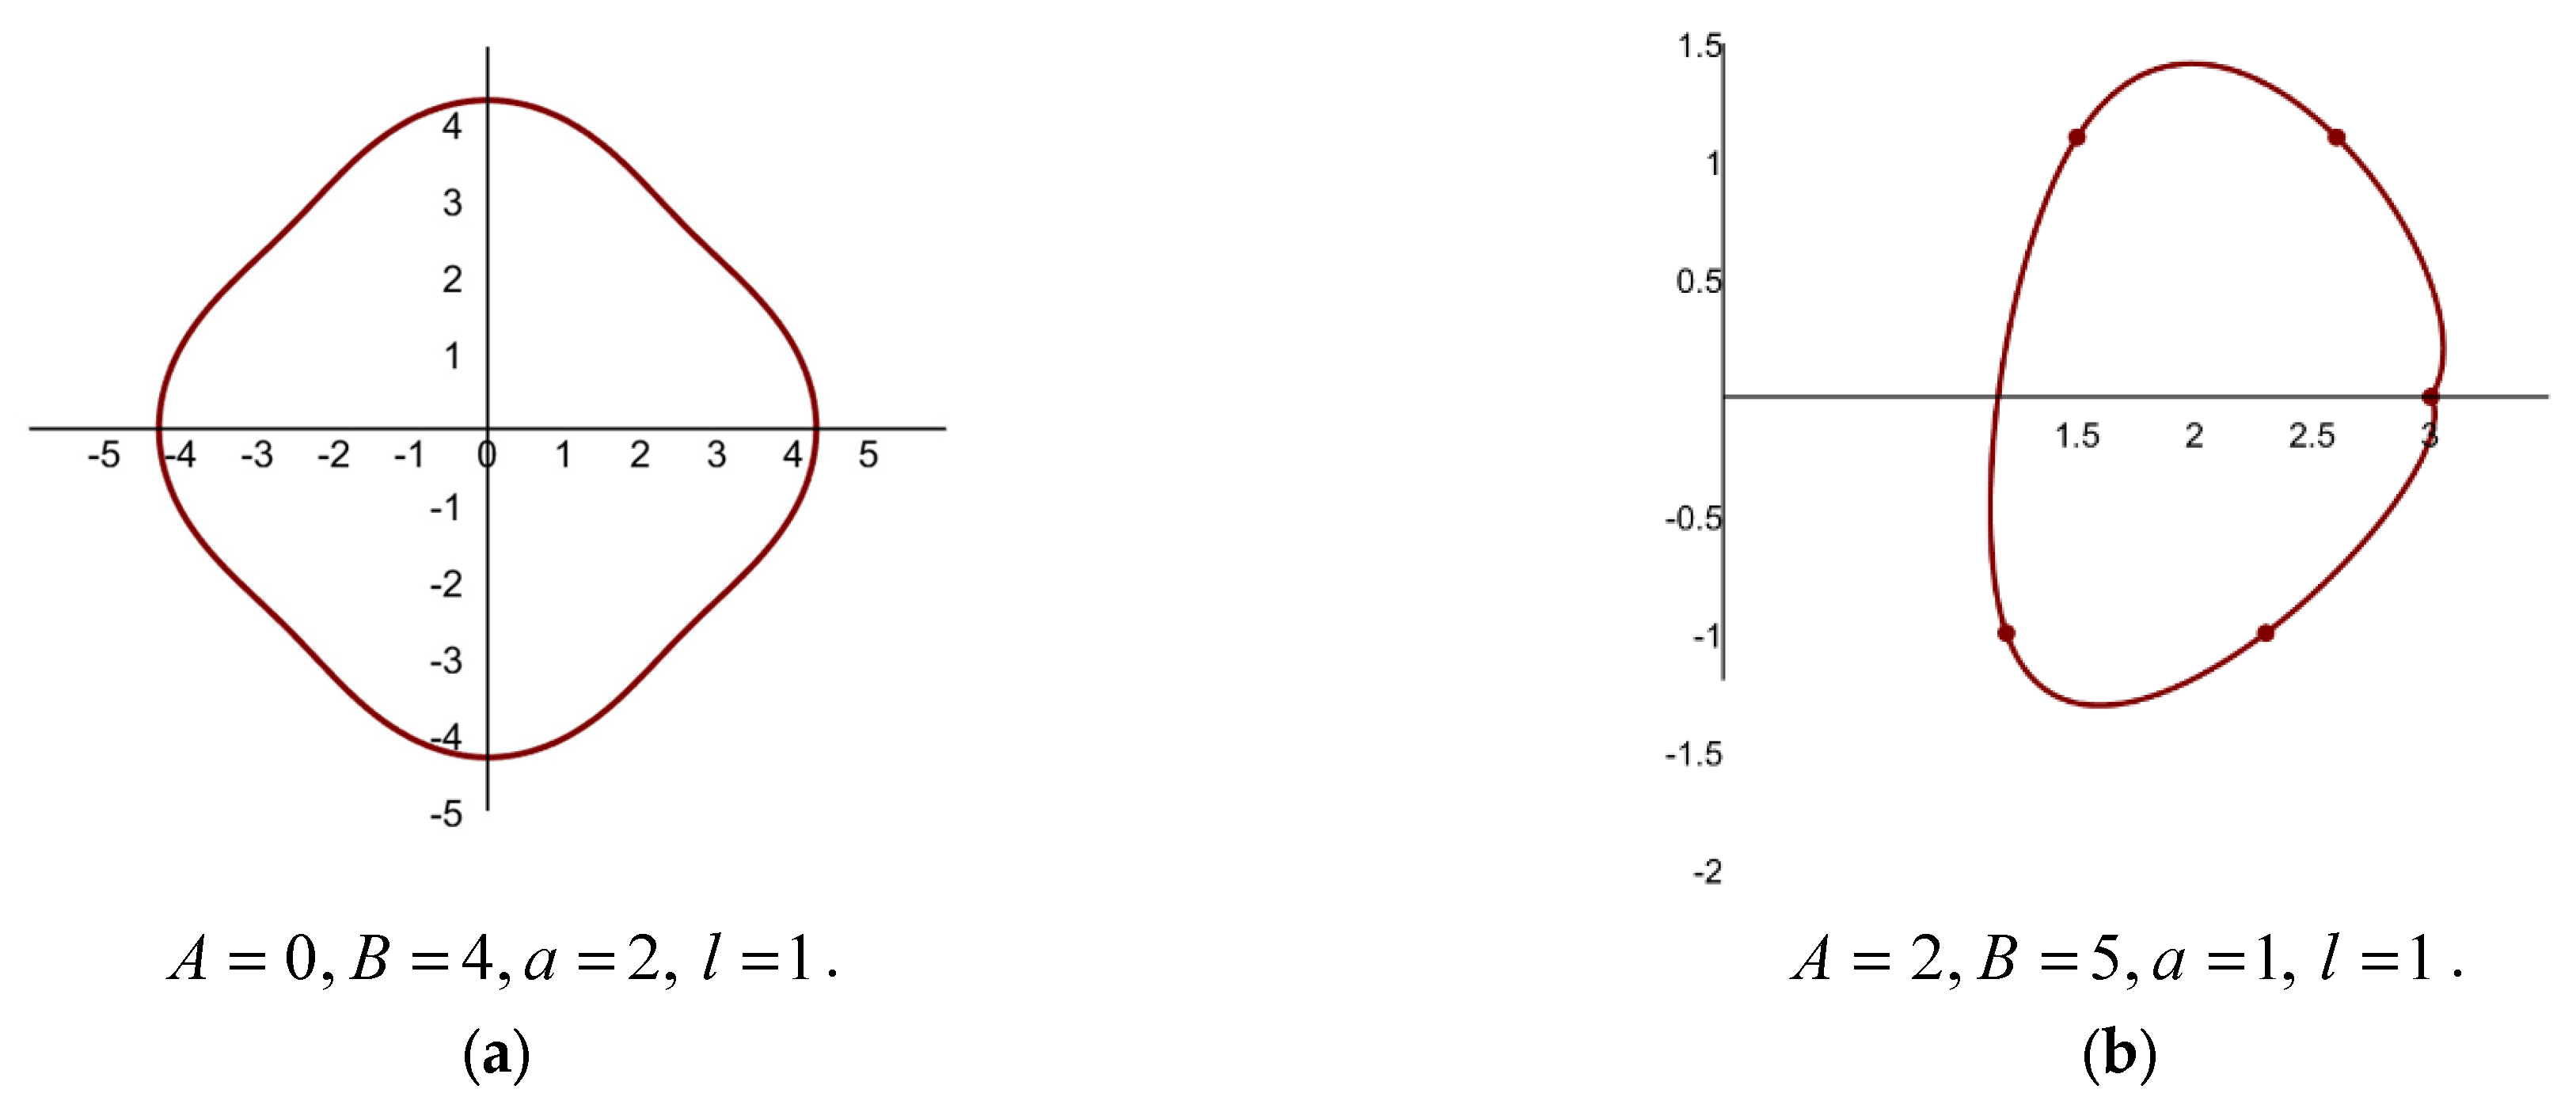
Figure 1. Choosing A , B as fractions and a as an integer with four different values produces shapes that have closed and non-circular boundaries with different levels of symmetry and curvature; (a) resembles a superellipse; (b) shows a lopsided closed loop with five marked critical points; (c) shows a classic cardioid shape; and (d) shows a vertically elongated closed curve.
Mathematics 13 03218 g001aMathematics 13 03218 g001b
Figure 2. Choosing A , B as integers and a as a fraction with three different values produces shapes that have features with acute, piecewise-smooth edges that are distinctly non-circular and possess angular points; (a) resembles a symmetric lemniscate; (b) shows a double bow-tie of opposing lobes intersecting at the origin; and (c) shows a symmetric curve that has a loop on the left and an open tapering form on the right.
Mathematics 13 03218 g002
Figure 3. Choosing A , B as integers and a as a complex number with four different values produces shapes that are one-dimensional and symmetric and are spread out along the horizontal x-axis; (a) resembles a semi-circular waveform showing two symmetrical arcs above the x-axis; (b) shows a small-scale curve centered around the origin with a low-amplitude sine wave; (c) shows a dipole with two lobes on either side of the origin; and (d) shows a double dipole with two lobes on either side of the origin.
Mathematics 13 03218 g003
Figure 4. Schematic of thermoelastic stress in circular annulus.
Mathematics 13 03218 g004
Figure 5. Representing Gaursat coefficients a n and b n ; Blue circles denote the numerically evaluated values of a n and b n for each corresponding n , (a) the top subplot shows the Re ( a n ) remaining nearly constant across all n, with values on the order of 107. The bottom subplot shows the Im ( a n ) , which is extremely small (near-zero); (b) the top subplot depicts Re ( b n ) , which fluctuates with increasing n, reaching both positive and negative values on the order of 10−5. The bottom subplot shows the Im ( b n ) , which exhibits a slight asymmetry and small variations.
Mathematics 13 03218 g005
Figure 6. Descriptions for the three stress component plots. (a) Description of a contour plot of the normal stress component σ x x in the X-direction over a circular domain with a central hole. (b) Description of a contour plot of the normal stress σ y y in the Y-direction; the distribution is similar in shape to (a), but with higher magnitude. (c) Description of a contour plot of the shear stress component σ x y ; the antisymmetric pattern about the Y-axis indicates torsional effects or stress rotation due to asymmetric loading.
Mathematics 13 03218 g006
Figure 7. Stresses components according to the angle position θ and parameters A = 0.1 , B = 0.5 , l = 0.2 , m = 2 , n = 3 , q = 0.3 , P = 0.25 , K = 1 , N = 10 , M = 2 N + 1 = 21 .
Mathematics 13 03218 g007
Figure 8. Stresses components according to the angle position θ and parameters A = 0.2 , B = 0.6 , l = 0.3 , m = 3 , n = 4 , q = 0.4 , P = 0.5 , K = 1 , N = 12 , M = 2 N + 1 = 25 .
Mathematics 13 03218 g008
Figure 9. Stresses components according to the angle position θ and parameters A = 0.05 , B = 0.3 , l = 0.1 , m = 2 , n = 2 , q = 0.1 , P = 0.1 , K = 1 , N = 12 , M = 2 N + 1 = 25 .
Mathematics 13 03218 g009
Figure 10. Comparison of analytical and computed radial stress σ r r in an infinite elastic plate with a circular hole under radial thermal loading.
Mathematics 13 03218 g010
Table 1. The convergence of Gaursat series approximation.
Truncation Order N 681012141618
Residual norm A x F 4.63 × 10 13 3.90 × 10 14 7.29 × 10 14 9.25 × 10 14 7.58 × 10 14 3.12 × 10 15 1.56 × 10 15
Table 2. Impact of collocation points on maximum stress components.
M Max .   σ x x Max .   σ y y Max. Difference vs. Prev. M
251.8222.115
301.8232.1140.07%
401.8242.1140.05%
501.8242.1140.01%
601.8242.114<0.01%
Table 3. Evolution of maximum stress components with changes in material constants.
Material ParameterValue RangeMax σ_xxMax σ_yy
E (GPa)50–200↑ Linear (×4)↑ Linear (×4)
ν0.2–0.4Moderate variationNoticeable redistribution
α (1/K)1 × 10−5–3 × 10⁻⁵↑ ×3↑ ×3
Disclaimer/Publisher’s Note: The statements, opinions and data contained in all publications are solely those of the individual author(s) and contributor(s) and not of MDPI and/or the editor(s). MDPI and/or the editor(s) disclaim responsibility for any injury to people or property resulting from any ideas, methods, instructions or products referred to in the content.