Article

Study of Soliton Solutions, Bifurcation, Quasi-Periodic, and Chaotic Behaviour in the Fractional Coupled Schrödinger Equation

Department of Mathematics and Statistics, College of Science, King Faisal University, P.O. Box 400, Al-Ahsa 31982, Saudi Arabia
*
Author to whom correspondence should be addressed.
Mathematics 2025, 13(19), 3174; https://doi.org/10.3390/math13193174
Submission received: 3 September 2025 / Revised: 21 September 2025 / Accepted: 24 September 2025 / Published: 3 October 2025

Abstract

This study presents a qualitative analysis of the fractional coupled nonlinear Schrödinger equation (FCNSE) to obtain its complete set of solutions. An appropriate wave transformation is applied to reduce the FCNSE to a fourth-order dynamical system. Due to its non-Hamiltonian nature, this system poses significant analytical challenges. To overcome this complexity, the dynamical behavior is examined within a specific phase–space subspace, where the system simplifies to a two-dimensional, single-degree-of-freedom Hamiltonian system. The qualitative theory of planar dynamical systems is then employed to characterize the corresponding phase portraits. Bifurcation analysis identifies the physical parameter conditions that give rise to super-periodic, periodic, and solitary wave solutions. These solutions are derived analytically and illustrated graphically to highlight the influence of the fractional derivative order on their spatial and temporal evolution. Furthermore, when an external generalized periodic force is introduced, the model exhibits quasi-periodic behavior followed by chaotic dynamics. Both configurations are depicted through 3D and 2D phase portraits in addition to the time-series graphs. The presence of chaos is quantitatively verified by calculating the Lyapunov exponents. Numerical simulations demonstrate that the system’s behavior is highly sensitive to variations in the frequency and amplitude of the external force.

1. Introduction

Soliton theory has garnered considerable attention owing to its pivotal role across diverse fields such as telecommunications, mathematical physics, engineering, and other nonlinear scientific disciplines [1]. In recent years, optical solitons have emerged as a particularly prominent topic of investigation. Within fiber transmission systems, solitons function as robust carriers of optical information, exhibiting minimal sensitivity to polarization effects and chromatic dispersion over extended distances. Their ability to retain localized, particle-like behavior even under substantial perturbations makes them highly suitable for deployment in all-optical switching technologies [2]. The existence of optical solitons in fibers was theoretically predicted by Akira Hasegawa and Fred Tappert in 1973 [3], and later experimentally confirmed by L.F. Mollenauer, R.H. Stolen, and J. P. Gordon in 1980 [4]. Since then, the topic has captivated both experimentalists and theorists due to its wide-ranging applications. Optical solitons have been observed in various media, including optical waveguides, photonic crystal fibers, and bulk materials such as photorefractive compounds and photopolymers.
Over the past few decades, significant interest has been directed toward nonlinear physical phenomena described by nonlinear partial differential equations (NLPDEs). These equations form a fundamental mathematical basis for analyzing the time evolution of physical quantities and fields in systems characterized by inherent nonlinearity. NLPDEs play a critical role across numerous disciplines, offering valuable insights for understanding and modeling complex behaviors in a wide range of scientific and technological contexts. They are widely applied across disciplines, including astronomy, chemical diagnostics, biological systems, fiber optics research, and fluid mechanics; see, e.g., [5,6]. A persistent and significant challenge in mathematical physics is the development of closed-form analytical solutions. Their value is twofold: they offer rigorous mathematical understanding and enable accurate predictions of sophisticated physical behavior. The past several decades have witnessed a significant proliferation of analytical methods specifically designed to derive soliton and other classes of exact solutions for NLPDEs, such as the Hirota’s bilinear method [7], the Darboux transformation [8], the Bäcklund transformation [9,10], the Lie group methods [11,12,13], the first integral method [14], the generalizing Riccati equation mapping method [15], the Kudryashov’s method [16], and the bifurcation method [17,18].
Furthermore, nonlinear partial differential equations (NLPDEs) have been extended to fractional forms (FNLPDEs) by incorporating fractional derivatives into their spatial, temporal, or mixed terms. This generalization has attracted considerable research interest due to its powerful utility in modeling complex systems across science and industry. Fractional calculus provides a robust framework for representing phenomena in electrochemistry, fluid dynamics, solid mechanics, and physiological processes. In response to the analytical complexity of these models, the development of sophisticated computational methods for solving FNLPDEs remains a primary research objective [19,20,21,22]. Unlike integer-order derivatives, fractional derivatives possess a non-local character, enabling them to model complex systems with memory and hereditary properties more accurately.
We analyze the fractional coupled nonlinear Schrödinger equation (NLSE) featuring quadratic–cubic nonlinearity in its given form [23]
i T t α U 1 + a 1 T x 2 ε U 1 + ( b 1 | U 1 | + c 1 | U 1 | 2 + d 1 | U 2 | + e 1 | U 2 | 2 ) U 1 = f 1 U 2 + i [ σ 1 T x ε U 1 + λ 1 T x ε ( | U 1 | 2 U 1 ) + γ 1 U 1 T x ε | U 1 | 2 + δ 1 | U 1 | 2 T x ε U 1 ] ,
i T t α U 2 + a 2 T x 2 ε U 2 + ( b 2 | U 2 | + c 2 | U 2 | 2 + d 2 | U 1 | + e 2 | U 1 | 2 ) U 2 = f 2 U 1 + i [ σ 2 T x ε U 2 + λ 2 T x ε ( | U 2 | 2 U 2 ) + γ 2 U 2 T x ε | U 2 | 2 + δ 2 | U 2 | 2 T x ε U 2 ] ,
where T r represents the conformable fractional derivative of order r with r ( 0 , 1 ] . The complex-valued soliton pulse profiles are denoted by U j for j = 1 , 2 , while the variables x and t correspond to spatial and temporal coordinates, respectively. The parameters a j , b j , c j , d j , e j , f j , σ j , λ j , γ j , δ j are free real constants associated with j = 1 , 2 . Among these, a j relates to chromatic dispersion, while f j and σ j account for the magneto-optic parameter and inter-modal dispersion, respectively. Additionally, γ j and δ j are coefficients arising due to nonlinear dispersion. At present, several approaches have been investigated for deriving new exact solutions to Equation (1). In [24], the authors obtained a diverse set of solutions by employing the modified Sardar subequation and enhanced modified extended tanh-expansion approaches. The new extended auxiliary equation method and the extended Kudryashov method are applied in [25]. A special case of Equation (1)—specifically, when a i = 1 , c i = δ , e i = γ δ , and f i = σ i = λ i = γ i = δ i = 0 for i = 1 , 2 —was studied in [26]. In that work, solutions were constructed within the subspace φ 2 = A φ 1 using bifurcation analysis and the extended sinh-Gordon equation expansion method [27]. These studies were later extended in [28] to a more general setting by removing the assumption φ 2 = A φ 1 and employing Hamiltonian methods to derive new exact solutions. Furthermore, when a i = 1 , c i = δ , e i = γ δ , σ 1 = σ 2 = 1 , and f i = λ i = γ i = δ i = 0 for i = 1 , 2 , Equation (1) was also considered in [29], where the fractional He–Laplace approach was employed to construct series-form solutions.
The structure of this work is organized in the following manner: Section 2 presents the definition and fundamental properties of the conformable fractional derivative. The mathematical analysis in Section 3 reduces the FCNSE to a one-dimensional Hamiltonian system. Subsequent bifurcation analysis and phase portrait interpretation are contained in Section 4. Building on this, Section 5 constructs exact solutions by integrating the conserved quantity across relevant wave propagation intervals and discusses their physical significance. The graphical interpretation in Section 5.3 visualizes these solutions, highlighting the effect of the fractional derivative order. Section 6 then examines the induced quasi-periodic and chaotic dynamics under periodic external forcing. The paper concludes with a summary of findings in Section 7.

2. Preliminaries

For completeness, we first outline the fundamental concepts of conformable fractional derivative.
Multiple definitions of fractional derivatives exist, such as the conformable and Caputo–Fabrizio operators [30]. Each variant possesses distinct characteristics that make it suitable for specific applications. Notably, fractional derivatives often violate several fundamental rules of integer-order calculus, including the product, quotient, and chain rules.
We present the definition of conformable fractional derivative
Definition 1 
([31]). For P : R + R , the conformable fractional derivative of order ε is defined, for any 0 < ε 1 and t > 0 , by
D ε ( P ) ( t ) = lim ρ 0 P ( t + ρ t 1 ε ) P ( t ) ρ .
Let P 1 and P 2 be ε -conformable differentiable for t > 0 , and let r 1 , r 2 R . The following basic rules are used throughout this work:
  • D ε ( r 1 P 1 + r 2 P 2 ) = r 1 D ε ( P 1 ) + r 2 D ε ( P 2 ) ;
  • D ε ( t r 1 ) = r 1 t r 1 ε ;
  • D ε ( P 1 P 2 ) = P 1 D ε ( P 2 ) + P 2 D ε ( P 1 ) ;
  • D ε P 1 P 2 = P 2 D ε ( P 1 ) P 1 D ε ( P 2 ) P 2 2 ;
  • D ε ( P ) ( t ) = t 1 ϵ d P d t ( t ) ;
  • D ε ( P 1 P 2 ) ( t ) = t 1 ε P 2 ( t ) P 1 ( P 2 ( t ) ) , where P 2 ( t ) is included in the range of P 1 .

3. Mathematical Analysis

In this section, we analyze model (1) by reformulating it as a dynamical system using the next wave transformation.
U 1 ( t , x ) = φ 1 ( ρ ) e i ζ , U 2 ( t , x ) = φ 2 ( ρ ) e i ζ , ρ = k ( x ε ε c t α α ) , ζ = μ x ε ε + ω t α α ,
where k , c , μ , and ω are free constants, while φ i for i = 1 , 2 denotes real-valued functions that need to be determined. Or equivalently, a solution to Equation (1) is postulated in the form (3). Applying the properties of the conformable fractional derivative as shown in Section 2, direct calculations lead to
T t α U 1 = T t α φ 1 ( ρ ) e i ζ = e i ζ T t α φ 1 ( ρ ) + φ 1 ( ρ ) T t α e i ζ = e i ζ t 1 α φ 1 ( ρ ) ( c k t α 1 ) + φ 1 ( ρ ) t 1 α ( i ω t α 1 ) = ( i ω φ 1 k c φ 1 ) e i ζ ,
where ′ denotes differentiation with respect to ρ . Using similar computations, we obtain:
T x α U 1 = ( i μ φ 1 + k φ 1 ) e i ζ , T x 2 α U 1 = ( μ 2 φ 1 2 i μ k φ 1 + k 2 φ 1 ) e i ζ , T x ε ( | U 1 | 2 ) = 2 k φ 1 φ 1 T x ε ( | U 1 | 2 U 1 ) = ( i μ φ 1 3 + 3 k φ 1 φ 1 2 ) e i ζ ,
Inserting the derivatives (4) and (5) into (1) and isolating the real and imaginary components, we arrive at
  • Real parts:
    a 1 k 2 φ 1 ( μ λ 1 + μ δ 1 c 1 ) φ 1 3 + b 1 φ 1 2 ( ω + a 1 μ 2 + μ σ 1 ) φ 1 + d 1 φ 1 φ 2 + e 1 φ 1 φ 2 2 f 1 φ 2 = 0 ,
    a 2 k 2 φ 2 ( μ λ 2 + μ δ 2 c 2 ) φ 2 3 + b 2 φ 2 2 ( ω + a 2 μ 2 + μ σ 2 ) φ 2 + d 2 φ 2 φ 1 + e 2 φ 2 φ 1 2 f 2 φ 1 = 0 .
  • Imaginary Parts:
    ( c + σ 1 + 2 a 1 μ ) φ 1 + ( 3 λ 1 + 2 γ 1 + δ 1 ) φ 1 2 φ 1 = 0 ,
    ( c + σ 2 + 2 a 2 μ ) φ 2 + ( 3 λ 2 + 2 γ 2 + δ 2 ) φ 2 2 φ 2 = 0 .
    Integrating Equations (7a) and (7b), with assuming the integration constants to be zeros, yields
    ( c + σ 1 + 2 a 1 μ ) φ 1 + 1 3 ( 3 λ 1 + 2 γ 1 + δ 1 ) φ 1 3 = 0 ,
    ( c + σ 2 + 2 a 2 μ ) φ 2 + 1 3 ( 3 λ 2 + 2 γ 2 + δ 2 ) φ 2 3 = 0 .
    The last two equations are met identically if
    c = a 1 σ 2 σ 1 a 2 a 1 a 2 , μ = σ 1 σ 2 2 ( a 1 a 2 ) , δ 1 = 2 γ 1 3 λ 1 , δ 2 = 2 γ 2 3 λ 2 .
    Inserting (9) into Equation (6), we obtain
    φ 1 f 1 a 1 k 2 φ 2 1 a 2 k 2 ω ( σ 1 σ 2 ) σ 1 2 ( a 1 a 2 ) + a 2 ( σ 1 σ 2 ) 2 4 ( a 1 a 2 ) 2 φ 1 + d 1 a 1 k 2 φ 2 φ 1 + e 1 a 1 k 2 φ 1 φ 2 2 + b 1 a 1 k 2 φ 1 2
    + c 1 ( a 1 a 2 ) + ( λ 1 + γ 1 ) ( σ 2 σ 1 ) a 1 k 2 ( a 1 a 2 ) φ 1 3 = 0 , φ 2 1 a 2 k 2 ω ( σ 1 σ 2 ) σ 2 2 ( a 1 a 2 ) a 2 ( σ 1 σ 2 ) 2 4 ( a 1 a 2 ) 2 φ 2 ( σ 1 σ 2 ) ( γ 2 + λ 2 ) ( a 1 a 2 ) a 2 k 2 φ 2 3 f 2 a 2 k 2 φ 1 + b 2 a 2 k 2 φ 1 φ 2
    + c 2 a 2 k 2 φ 1 φ 2 2 + d 2 a 2 k 2 φ 1 2 + e 2 a 2 k 2 φ 1 3 = 0 .
  • The fourth order differential Equations (10) can be expressed as a system of first order differential equations in the form
    φ 1 = y , y = f 1 a 1 k 2 φ 2 + 1 a 2 k 2 ω ( σ 1 σ 2 ) σ 1 2 ( a 1 a 2 ) + a 2 ( σ 1 σ 2 ) 2 4 ( a 1 a 2 ) 2 φ 1 d 1 a 1 k 2 φ 2 φ 1 e 1 a 1 k 2 φ 1 φ 2 2 b 1 a 1 k 2 φ 1 2
    + c 1 ( a 1 a 2 ) + ( λ 1 + γ 1 ) ( σ 2 σ 1 ) a 1 k 2 ( a 1 a 2 ) φ 1 3 ,
    φ 2 = z , z = 1 a 2 k 2 ω ( σ 1 σ 2 ) σ 2 2 ( a 1 a 2 ) a 2 ( σ 1 σ 2 ) 2 4 ( a 1 a 2 ) 2 φ 2 + ( σ 1 σ 2 ) ( γ 2 + λ 2 ) ( a 1 a 2 ) a 2 k 2 φ 2 3 + f 2 a 2 k 2 φ 1 b 2 a 2 k 2 φ 1 φ 2
    c 2 a 2 k 2 φ 1 φ 2 2 d 2 a 2 k 2 φ 1 2 e 2 a 2 k 2 φ 1 3 .
    Although system (11) is conservative because div ( φ 1 , y , φ 2 , z ) = φ 1 φ 1 + y y + φ 2 φ 2 + z z = 0 , it is not Hamiltonian due to the non-existence of a Hamiltonian function producing system (11) using Hamilton canonical Equations [32]. It is obvious that system (11) is a complicated four-dimensional phase portrait. Therefore, we investigate the dynamical behaviour of system (10) in the sub-manifold φ 2 = A φ 1 with constant A 0 , 1 of the four-dimensional phase space ( φ 1 , y , φ 2 , z ) . Inserting φ 2 = A φ 1 into system (11), it reduces to a two-dimensional dynamical system if the included parameters admit the restrictions
    b 1 = A 2 a 2 d 1 A a 1 b 2 d 2 a 1 a 2 A , c 1 = ( σ 2 σ 1 ) [ a 1 A 2 ( λ 2 + γ 2 ) a 2 ( λ 1 γ 1 ) ] a 2 ( a 1 a 2 ) + A 2 ( a 1 c 2 a 2 e 1 A ) + a 1 e 2 a 2 A f 1 = ( σ 1 σ 2 ) ( σ 2 a 1 σ 1 a 2 ) 2 A a 2 ( a 1 a 2 ) + ω ( a 1 a 2 ) A + a 1 f 2 A 2 a 2 .
    Hence, the two-dimensional dynamical system has the form
    φ 1 = y ,
    y = m φ 1 3 p φ 1 2 r φ 1 ,
    where m , p and r are new parameters introduced for simplicity, and they are given by
    m = c 2 A 2 + e 2 a 2 k 2 A + ( λ 2 + γ 2 ) ( σ 2 σ 1 ) A 2 a 2 k 2 ( a 1 a 2 ) , p = b 2 A + d 2 a 2 k 2 A q = f 2 a 2 k 2 A ω + ( σ 1 σ 2 ) σ 2 2 ( a 1 a 2 ) a 2 ( σ 1 σ 2 ) 2 4 ( a 1 a 2 ) 2
    System (13) is conservative and Hamiltonian since div ( φ 1 , y ) = 0 and it can be derived from the Hamiltonian
    H = 1 2 y 2 + m 4 φ 1 4 + p 3 φ 1 3 + r 2 φ 1 2 ,
    by employing Hamilton canonical Equations [32,33]. The Hamiltonian (15) is a constant of motion, i.e., it takes a constant value along all phase orbits due to it does not rely explicitly on the independent variable ρ , which plays the role of time in Hamiltonian mechanics. Hence, we have
    1 2 y 2 + m 4 φ 1 4 + p 3 φ 1 3 + r 2 φ 1 2 = ν ,
    where ν is an arbitrary parameter which plays a significant role, as we will see later. The problem of constructing exact solutions to Equation (1) is equivalent to finding the solutions of the particle’s one-dimensional motion described by the Hamiltonian system (13) under the influence of a three-parameter potential function given by
    V ( ϕ 1 ) = m 4 φ 1 4 + p 3 φ 1 3 + r 2 φ 1 2 .
    Hence, we substitute (13a) into the conserved quantity (16) and separate the variables. Consequently, we have the next one-dimensional form
    d φ 1 G 4 ( φ 1 ) = ± 2 d ρ ,
    where the quartic polynomial G 4 ( φ 1 ) is given by
    G 4 ( φ 1 ) = ν m 4 φ 1 4 p 3 φ 1 3 r 2 φ 1 2 .
  • To integrate both sides of Equation (18), it is important to ensure the precise determination of the ranges of the parameters ν , m , p , and r. This range can be identified using two approaches: the complete discriminant system for the polynomial G 4 ( φ 1 ) [34] and the bifurcation method [35]. The latter method is particularly valuable as it classifies solution types before their construction by linking them to phase orbits. Moreover, it enables the study of solution dependence on initial conditions through the degeneracy property.

4. Bifurcation Analysis

This section aims to explore the dynamical behavior of Equation (1). By performing a bifurcation analysis, we identify the conditions of the physical parameters that lead to different kinds of solutions, such as periodic, super-periodic, and solitary solutions, which correspond to periodic orbits, super-periodic orbits, heteroclinic orbits, and homoclinic orbits, respectively. Furthermore, it allows us to identify and exclude physically undesirable unbounded solutions. As highlighted in [33,36], the qualitative structure of the phase portrait is dictated by the number of equilibrium points and the topology of the associated separatrix manifolds. We use the notation in Table 1 to classify the phase orbits of system (13).
Additionally, the subsequent theorem is presented to facilitate the forthcoming analytical framework.
Theorem 1 
(Lagrange Theorem [37]). Stable equilibrium points in conservative systems occur precisely at locations where the potential energy attains strict minima.
To examine the phase portrait of the dynamical system (13), we begin by identifying the equilibria of system (13) by calculating the critical points of the potential function (17). Specifically, these equilibria take the form ( φ 1 , 0 ) , where φ 1 is a solution to
d V d φ 1 = φ 1 ( m φ 1 2 + p φ 1 + r ) = 0 .
The number of equilibria of system (13) depends on the discriminant Δ , defined by Δ = p 2 4 m r . Thus, let us consider the following cases:
  • Case A: When Δ < 0 , which is equivalent to the condition | p | < 2 m r with m r > 0 , system (13) admits one equilibrium point at O = ( 0 , 0 ) . To characterize O, we invoke Lagrange’s Theorem 1. A direct computation yields d 2 V d φ 1 2 φ 1 = 0 = r . Consequently, point O serves as a local maximum of the potential function (17) when r < 0 , corresponding to a saddle point in the Hamiltonian system (13). Conversely, if r > 0 , O becomes a local minimum of the potential, signifying a center point in the phase portrait of the Hamiltonian system. The phase portrait related to this case is illustrated in Figure 1. At the equilibrium point O, the bifurcation parameter takes the value ν 0 = H ( O ) = 0 . When | p | < 2 m r with m > 0 and r > 0 , system (13) exhibits a bounded family of periodic orbits encircling the center equilibrium O, denoted by P O 0 , 1 , as shown in Figure 1a, and occurring for all positive values of ν . In contrast, when | p | < 2 m r with m < 0 and r < 0 , the phase portrait comprises two distinct families of unbounded orbits: red orbits for ν > 0 and cyan for ν < 0 , separated by a single unbounded orbit highlighted in purple at ν = 0 .
  • Case B: If Δ = 0 , which corresponds to the condition p 2 = 4 m r with m r > 0 , then system (13) admits two equilibrium points: O = ( 0 , 0 ) and G 1 = p 2 m , 0 . In order to classify these points, we invoke the Lagrange Theorem 1. A direct computation yields
    d 2 V d φ 1 2 φ 1 = 0 = r , d 2 V d φ 1 2 φ 1 = p 2 m = 0
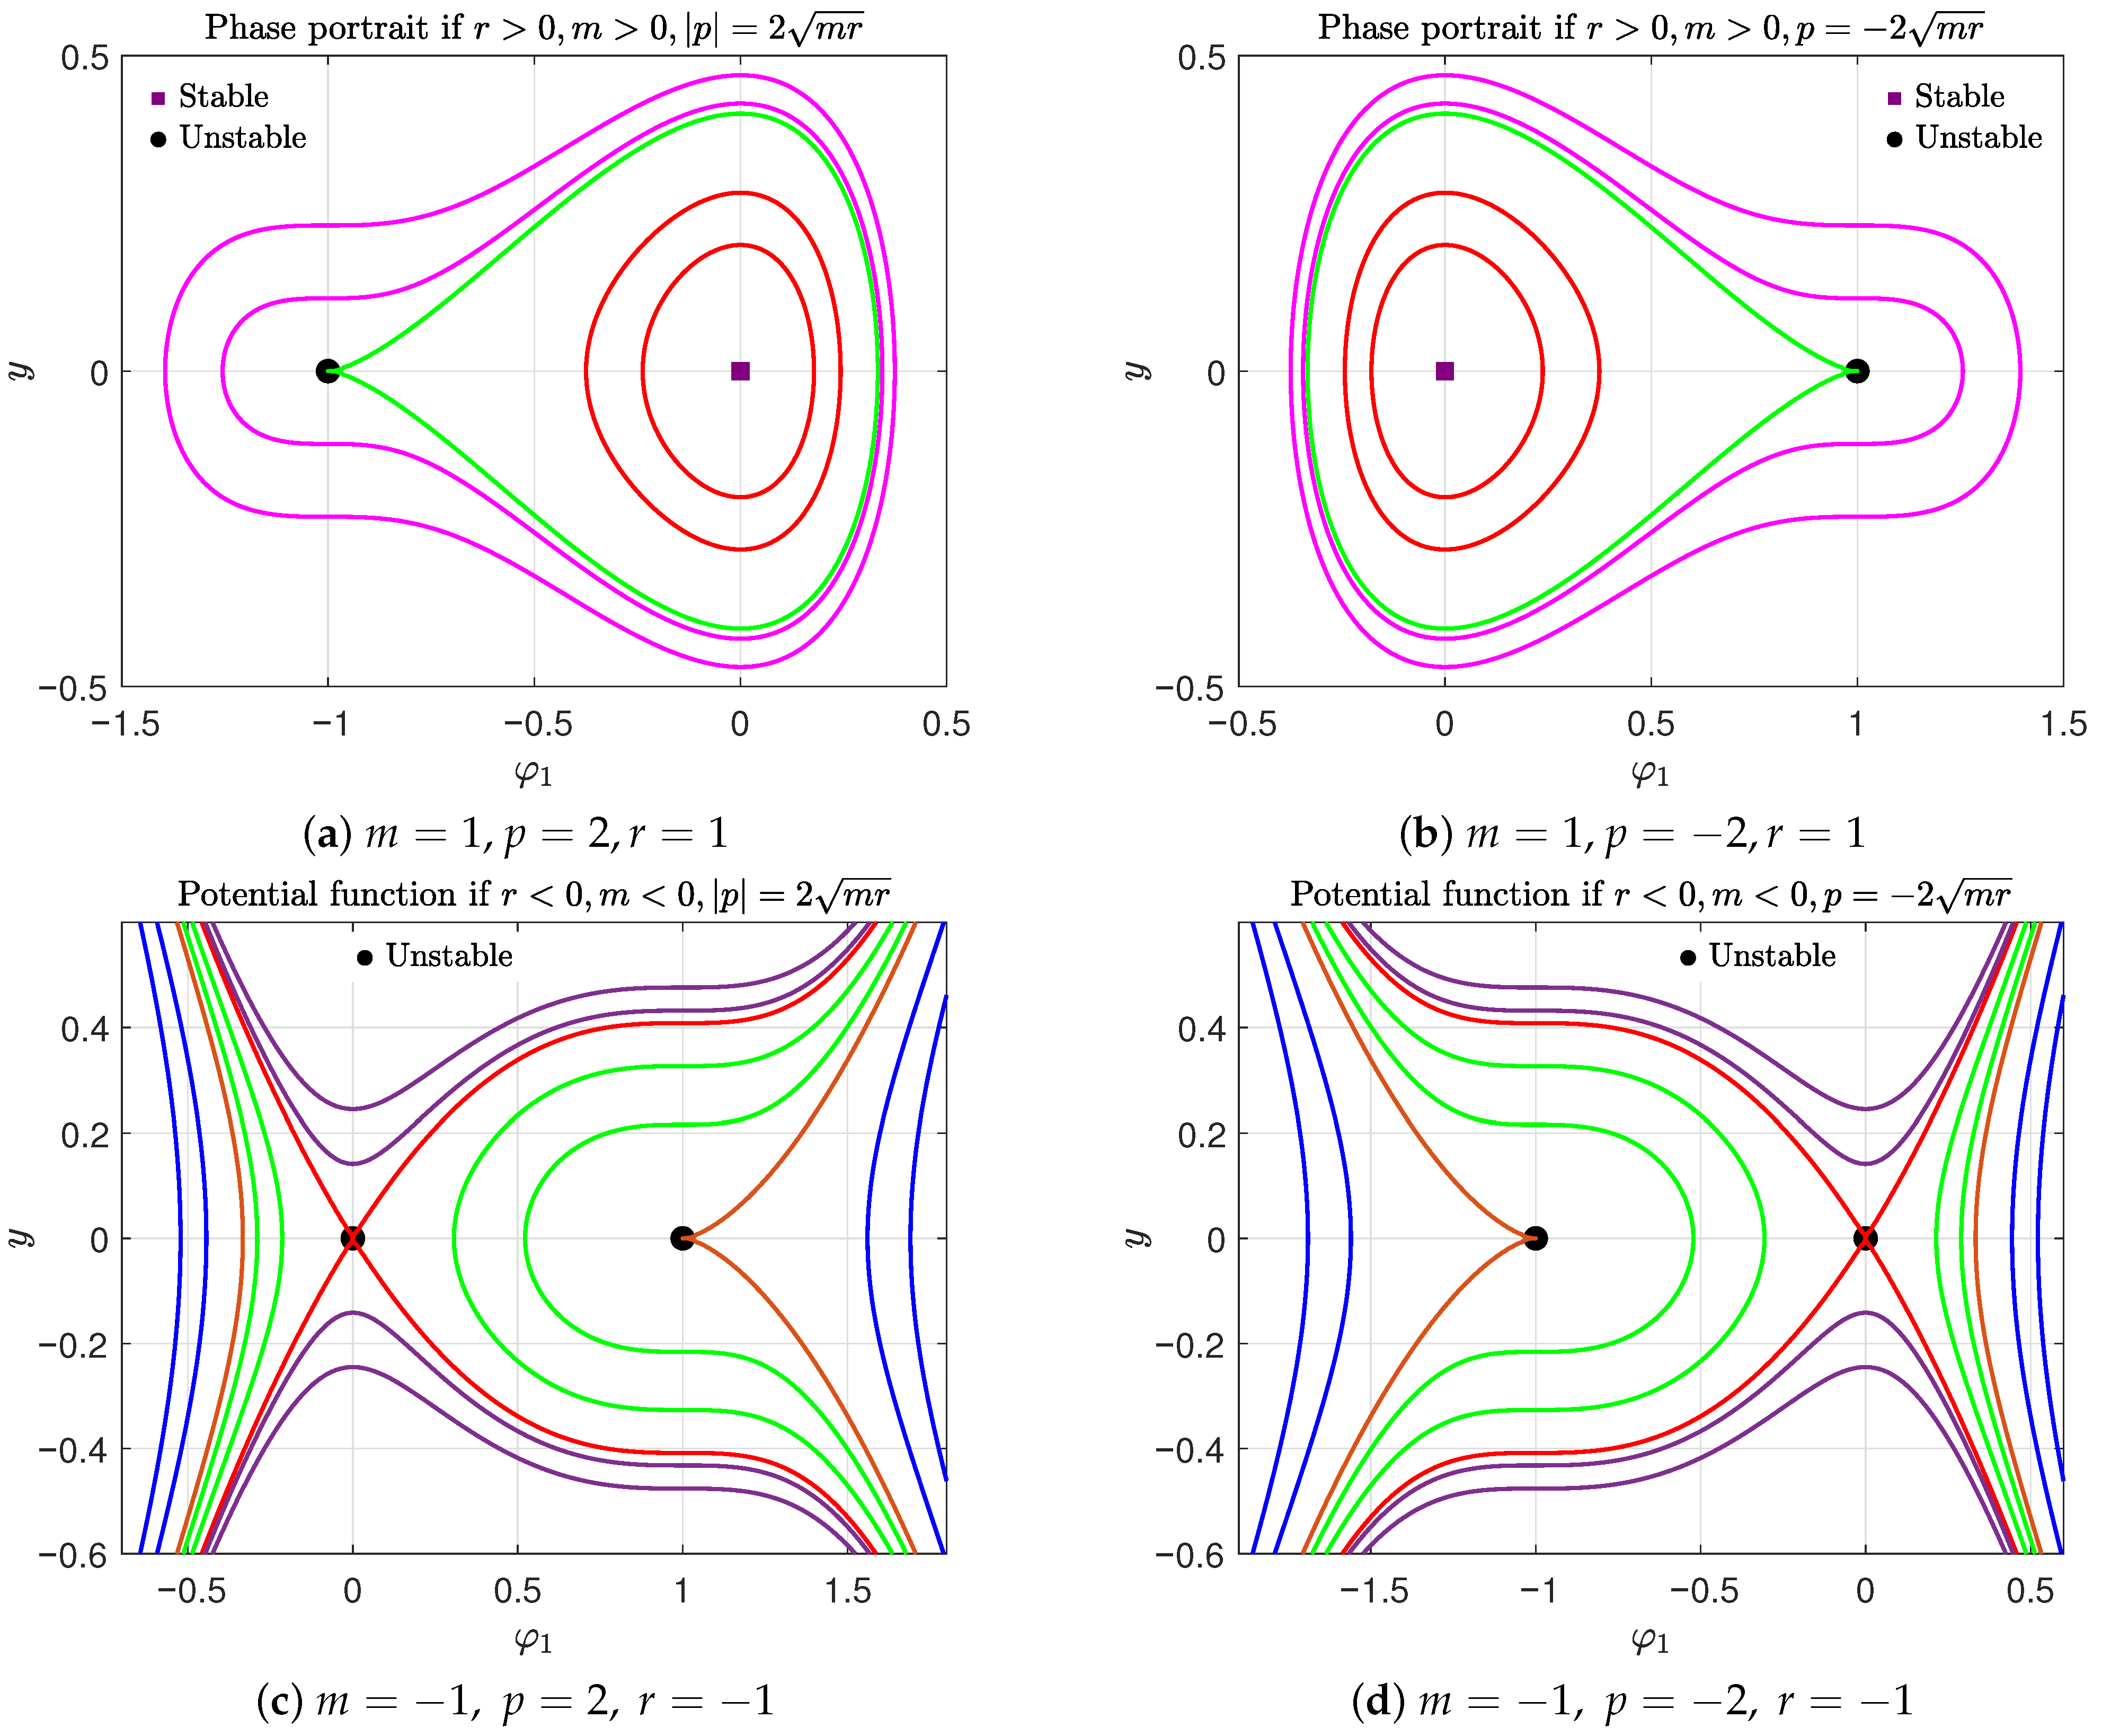
    Consequently, the equilibrium point G 1 corresponds to a cusp. Point O behaves either as a center when r > 0 ( m > 0 ) , or as a saddle when r < 0 ( m < 0 ) . The corresponding phase portraits of system (13) are illustrated in Figure 2. Let us postulate the bifurcation parameter ν at O and G 1 as ν 0 = H ( O ) = 0 and ν 1 = H ( G 1 ) = r 2 12 m . The phase portrait in this configuration is characterized as follows:
When ( r , p , m ) R + × { ± 2 m r } × R + , all orbits are periodic and bounded, depending on the value of ν (see Figure 2a). Two distinct families of periodic orbits emerge:
i. The family P O 1 , 1 (shown in pink) corresponds to ν ( ν 1 , ) ;
ii. The family P O 1 , 0 (shown in red) corresponds to ν ( 0 , ν 1 ) .
  • Moreover, there is a trajectory in green separating these two families.
Conversely, if ( r , p , m ) R × { ± 2 m r } × R , then all orbits become unbounded, as depicted in Figure 2b.
  • Case C: When Δ > 0 , i.e., when p 2 > 4 m r , the Hamiltonian system (13) possesses the three equilibrium points:
    O = ( 0 , 0 ) , G 2 , 3 = ( g 2 , 3 , 0 ) = 1 2 m p ± p 2 4 r m , 0 .
    To classify these equilibrium points, we apply Lagrange’s Theorem 1 and evaluate the second derivatives of the potential V :
    d 2 V d φ 1 2 φ 1 = 0 = r , d 2 V d φ 1 2 φ 1 = g 2 , 3 = p 2 4 m r 2 m p 2 4 m r p .
    Additionally, we determine the bifurcation parameter ν at these points:
    ν 0 = H ( O ) = 0 , ν 2 , 3 = H ( G 2 , 3 ) = ± p p 2 4 m r 2 96 m 3 p p 2 4 m r 6 r m p 2 ,
    which plays a key role in characterizing the phase portrait. According to the sign of the product m r , we now consider the following two cases:
  • I. First, we assume m r > 0 and consequently, the condition Δ > 0 yields p > 2 m r or p < 2 m r . Therefore, we consider the subsequent cases:
  • (a) If r > 0 , m > 0 , and p > 2 m r , the equilibria O and G 3 are center points, while G 2 is a saddle point. The phase portrait is depicted in Figure 3a, which consists of different kinds of bounded orbits, relying on the parameter ν value. There is a family of super-periodic orbits in red, characterized by S N P O 2 , 1 for ν ( ν 2 , ) , two brown families of periodic orbits around the center points O and G 3 , characterized by P O 1 , 0 for ν ( 0 , ν 2 ) , a family of green periodic orbits around the center point G 3 , characterized by P O 1 , 0 for ν ( ν 3 , 0 ) , and a single cyan periodic orbit for ν = 0 also around G 3 . In addition, there are two opposite homoclinic trajectories in purple for ν = ν 2 , characterized by H O 1 , 0 .
  • (b) On the other hand, when r > 0 , m > 0 , and p < 2 r m , the equilibrium points O and G 2 are centers, whereas G 3 is a saddle. Figure 3b illustrates the corresponding phase portrait, where the orbits are all bounded and classified into distinct types according to their ν value. A similar phase characterization to that in (a) can be provided.
  • (c) When r < 0 , m < 0 , and p > 2 r m , the equilibrium points O and G 3 behave as saddles, while G 2 behaves as the center. The corresponding phase plane is presented in Figure 3c, where, obviously, there is one family of periodic red trajectories for ν ( ν 3 , 0 ) , denoted by P O 1 , 0 , while all the other orbits are unbounded.
  • (d) When r < 0 , m < 0 , and p < 2 r m , point O becomes a saddle, whereas G 2 is also a saddle and G 3 acts as a center. Figure 3d illustrates the corresponding phase portrait. The dynamics in this scenario resemble those described in case (c).
  • II. If r m < 0 , the inequality p 2 > 4 r m holds automatically. We therefore analyze the following cases:
  • (a) If r < 0 , m > 0 , and p > 0 , point O is a saddle, while G 2 and G 3 are centers. The phase portrait of system (13) for this case is depicted in Figure 4a, where the orbits are all bounded. Specifically, we have
  • For ν ( ν 3 , ν 2 ) , there exists a family of red periodic orbits encircling the center G 3 .
  • For ν , ( ν 2 , 0 ) , two families, in brown, of closed periodic orbits emerge around the two central equilibria G 2 and G 3 , confined inside the two blue homoclinic orbits at ν = 0 .
  • A single cyan periodic trajectory occurs at ν = ν 2 .
  • All periodic trajectories mentioned above are of type P O 1 , 0 . Additionally, for ν , ( 0 , ) , a family of green super-periodic trajectories, governed by, associated with S N P O 2 , 1 , appears. An analogous explanation can be provided for Figure 4b.
  • (b) When r > 0 , m < 0 , and p < 0 , the equilibrium point O becomes the center, while G 2 and G 3 are both saddles. The related phase plane is shown in Figure 4b, which contains a single family of closed periodic orbits, confined within the blue homoclinic orbit that occurs at ν = ν 2 , whereas the other trajectories are unbounded. Figure 4d can be interpreted in a similar manner.

5. Exact Solutions

This section endeavors to explore the bifurcation analysis of the main finding in Section 4 to analyze the conditions under which periodic (or super-periodic) and soliton solutions exist.
Referring to separated differential equation Equation (18), and performing integration on both sides, one gets
φ 1 ( 0 ) φ 1 ( ρ ) d φ 1 G 4 ( φ 1 ) = ± 2 ρ ,
To ensure a real propagation, we have taken the appropriate range according to the bifurcation analysis mentioned in the previous section. Let the roots of the polynomial G 4 ( φ 1 ) be q 1 , q 2 , q 3 , and q 4 , i.e., G 4 ( φ 1 ) = m 4 ( φ 1 q 1 ) ( q 2 φ 1 ) ( φ 1 q 3 ) ( φ 1 q 4 ) . The types of roots, whether real or complex, are determined according to the values of the parameters involved.

5.1. Periodic Solutions

In this subsection, we will discuss the conditions for the existence of bounded periodic solutions, which depend on the existence of closed orbits in the phase portrait.
  • If ( Δ , m , r , ν ) R × R + × R + × [ ν 0 , ] { 0 } × R + × R + × [ ν 0 , ν 1 ] { 0 } × R + × R + × [ ν 1 , ] R + × R + × R + × [ ν 3 , ν 0 ] R + × R + × R + × [ ν 2 , ] R + × R + × R × [ ν 3 , ν 2 ] R + × R + × R × [ ν 0 , ] , there is a closed orbit family defined by H ( φ 1 , y ) = ν and for one orbit, G 4 ( φ 1 ) has two real roots, say q 1 < q 2 and two conjugate complex roots q 3 and q 4 = q 3 * . The interval of real propagation in this case is [ q 1 , q 2 ] , through which the integration leads to
    φ 1 ( ρ ) = L q 1 M q 2 L M 2 L M ( q 1 q 2 ) ( L M ) 2 cn ( m L M 2 ρ , k 1 ) + L 2 M 2 ,
    where cn ( . , k ) is the elliptic Jacobian function of modulus k [38], L 2 = ( q 2 Im q 3 ) 2 + ( Re q 3 ) 2 , M 2 = ( q 1 Im q 3 ) 2 + ( Re q 3 ) 2 and k 1 = 1 2 ( q 2 q 1 ) 2 ( L M ) 2 L M . Therefore, we obtain the first solution of Equation (1) as
    U 1 ( t , x ) = L q 1 M q 2 L M 2 L M ( q 1 q 2 ) ( L M ) 2 cn ( k m L M 2 ( x ε ε c t α α ) , k 1 ) + L 2 M 2 e i ( μ x ε ε + ω t α α ) , U 2 ( t , x ) = A L q 1 M q 2 L M 2 L M ( q 1 q 2 ) ( L M ) 2 cn ( k m L M 2 ( x ε ε c t α α ) , k 1 ) + L 2 M 2 e i ( μ x ε ε + ω t α α ) .
  • If ( Δ , m , r , ν ) R + × R + × R + × { ν 0 } , there is a unique closed orbit in cyan, as in Figure 3a, defined by H ( φ 1 , y ) = ν 0 and in this case, the roots of G 4 ( φ 1 ) are q 1 < 0 , q 2 < 0 , q 3 = q 4 = 0 . The interval of real propagation in this case is [ q 1 , q 2 ] through which the integration leads to
    φ 1 ( ρ ) = q 2 q 2 ( q 2 q 1 ) q 1 tan 2 ( 1 2 m q 1 q 2 2 ρ ) + q 2 .
    Then,
    U 1 ( t , x ) = q 2 q 2 ( q 2 q 1 ) q 1 tan 2 ( k 2 m q 1 q 2 2 ( x ε ε c t α α ) ) + q 2 e i ( μ x ε ε + ω t α α ) , U 2 ( t , x ) = A q 2 q 2 ( q 2 q 1 ) q 1 tan 2 ( k 2 m q 1 q 2 2 ( x ε ε c t α α ) ) + q 2 e i ( μ x ε ε + ω t α α ) .
    is a solution of Equation (1).
  • If ( Δ , m , r , ν ) R + × R + × R × { ν 2 } , there is a unique closed orbit in cyan as in Figure 4a defined by H ( φ 1 , y ) = ν 2 and the roots of G 4 ( φ 1 ) , in this case, are q 1 < 0 , q 2 < 0 , q 3 = q 4 = g 2 . The interval of real propagation in this case is [ q 1 , q 2 ] through which the integration leads to
    φ 1 ( ρ ) = q 2 ( g 2 q 2 ) ( q 2 q 1 ) ( g 2 q 1 ) tan 2 ( 1 2 m ( g 2 q 2 ) ( g 2 q 1 ) 2 ρ ) + g 2 q 2 .
    Then, a solution of Equation (1) can be derived as
    U 1 ( t , x ) = q 2 ( g 2 q 2 ) ( q 2 q 1 ) ( g 2 q 1 ) tan 2 ( k 2 m ( g 2 q 2 ) ( g 2 q 1 ) 2 ( x ε ε c t α α ) ) + g 2 q 2 e i ( μ x ε ε + ω t α α ) , U 2 ( t , x ) = A q 2 ( g 2 q 2 ) ( q 2 q 1 ) ( g 2 q 1 ) tan 2 ( k 2 m ( g 2 q 2 ) ( g 2 q 1 ) 2 ( x ε ε c t α α ) ) + g 2 q 2 e i ( μ x ε ε + ω t α α ) .
  • If ( Δ , m , r , ν ) R + × R + × R + × [ ν 0 , ν 2 ] R + × R + × R × [ ν 2 , ν 0 ] , the two families of closed orbits in brown, as in Figure 3a and Figure 4a, are defined by H ( φ 1 , y ) = ν . The roots of the related G 4 ( φ 1 ) of one orbit are all real and the intervals of real propagation in this case are [ q 1 , q 2 ] and [ q 3 , q 4 ] . For φ 1 [ q 1 , q 2 ] , we have
    φ 1 ( ρ ) = q 4 ( q 4 q 1 ) ( q 4 q 2 ) ( q 2 q 1 ) sn 2 ( 1 2 m ( q 4 q 2 ) ( q 7 q 1 ) 2 ρ , k 2 ) + q 4 q 2 ,
    where sn ( . , k ) is to the elliptic Jacobian function with modulus k [38] and k 2 = ( q 4 q 3 ) ( q 2 q 1 ) ( q 4 q 2 ) ( q 3 q 1 ) . For φ 1 [ q 3 , q 4 ] , we have
    φ 1 ( ρ ) = q 2 + ( q 4 q 2 ) ( q 3 q 2 ) ( q 3 q 4 ) sn 2 ( 1 2 m ( q 4 q 2 ) ( q 3 q 1 ) 2 ρ , k 2 ) + q 4 q 2 .
    Hence,
    U 1 ( t , x ) = q 4 ( q 4 q 1 ) ( q 4 q 2 ) ( q 2 q 1 ) sn 2 ( k 2 m ( q 4 q 2 ) ( q 7 q 1 ) 2 ( x ε ε c t α α ) , k 2 ) + q 4 q 2 e i ( μ x ε ε + ω t α α ) , U 2 ( t , x ) = A q 4 ( q 4 q 1 ) ( q 4 q 2 ) ( q 2 q 1 ) sn 2 ( k 2 m ( q 4 q 2 ) ( q 7 q 1 ) 2 ( x ε ε c t α α ) , k 2 ) + q 4 q 2 e i ( μ x ε ε + ω t α α ) ,
    and
    U 1 ( t , x ) = q 2 + ( q 4 q 2 ) ( q 3 q 2 ) ( q 3 q 4 ) sn 2 ( k 2 m ( q 4 q 2 ) ( q 3 q 1 ) 2 ( x ε ε c t α α ) , k 2 ) + q 4 q 2 e i ( μ x ε ε + ω t α α ) , U 2 ( t , x ) = A q 2 + ( q 4 q 2 ) ( q 3 q 2 ) ( q 3 q 4 ) sn 2 ( k 2 m ( q 4 q 2 ) ( q 3 q 1 ) 2 ( x ε ε c t α α ) , k 2 ) + q 4 q 2 e i ( μ x ε ε + ω t α α ) .
    are solutions of Equation (1).
  • If ( Δ , m , r , ν ) R + × R × R × [ ν 3 , ν 0 ] R + × R × R + × [ ν 0 , ν 2 ] , there is an orbit in red, as shown in Figure 3c and Figure 4c, whose corresponding polynomial G 4 ( φ 1 ) has four real roots but with three real propagation intervals; two are unbounded [ , q 1 ] , [ q 4 , ] and one is bounded [ q 2 , q 3 ] . For φ 1 [ q 2 , q 3 ] , we obtain
    φ 1 ( ρ ) = q 1 ( q 3 q 1 ) ( q 2 q 1 ) ( q 3 q 2 ) sn 2 ( 1 2 m ( q 4 q 2 ) ( q 3 q 1 ) 2 ρ , k 3 ) + q 1 q 3 ,
    where k 3 = ( r 13 r 2 ) ( r 4 r 1 ) ( r 4 r 2 ) ( r 3 r 1 ) . Then,
    U 1 ( t , x ) = q 1 ( q 3 q 1 ) ( q 2 q 1 ) ( q 3 q 2 ) sn 2 ( k 2 m ( q 4 q 2 ) ( q 3 q 1 ) 2 ( x ε ε c t α α ) , k 3 ) + q 1 q 3 e i ( μ x ε ε + ω t α α ) , U 2 ( t , x ) = A q 1 ( q 3 q 1 ) ( q 2 q 1 ) ( q 3 q 2 ) sn 2 ( k 2 m ( q 4 q 2 ) ( q 3 q 1 ) 2 ( x ε ε c t α α ) , k 3 ) + q 1 q 3 e i ( μ x ε ε + ω t α α ) .
    is a solution of Equation (1).
  • To help the reader review the results of this section, we can summarize these cases in Table 2.
Remark 1. 
It is noteworthy that one of the most significant advantages of this approach lies in the existence of multiple solutions corresponding to a single energy level. These solutions differ in both type and structure: the solution expressed in Equation (36), throughout the interval [ q 2 , q 3 ] , represents a regular periodic solution, whereas the solutions through the intervals [ , q 1 ] and [ q 4 , ] correspond to singular ones. Namely, for φ 1 [ q 4 , ] and φ 1 [ , q 1 ] , we have the singular solutions
φ 1 ( ρ ) = q 3 ( q 4 q 3 ) ( q 3 q 1 ) ( q 4 q 1 ) sn 2 ( 1 2 m ( q 4 q 2 ) ( q 3 q 1 ) 2 ρ , k 3 ) + q 1 q 3 ,
and
φ 1 ( ρ ) = q 2 + ( q 4 q 2 ) ( q 2 q 1 ) ( q 4 q 1 ) sn 2 ( 1 2 m ( q 4 q 2 ) ( q 3 q 1 ) 2 ρ , k 3 ) + q 2 q 4 ,
respectively.

5.2. Soliton Solutions

A soliton solution describes a spatially localized wave that propagates while maintaining an invariant shape. The existence conditions of soliton solutions, which depend on the existence of homoclinic orbits in the phase portrait, are studied as follows.
  • If ( Δ , m , r , ν ) R + × R + × R + × { ν 2 } , there is an shape corresponding to two homoclinic orbits in purple, as in Figure 3a, characterized by H ( φ 1 , y ) = ν 2 and the roots of the related G 4 ( φ 1 ) are all real with q 1 < 0 , q 2 = q 3 = g 2 , q 4 > 0 and the intervals of real propagation in this case are [ q 1 , g 2 ] and [ g 2 , q 4 ] . The solutions over them are
    φ 1 ( ρ ) = q 4 ( q 4 g 2 ) ( q 4 q 1 ) ( g 2 q 1 ) tanh 2 ( 1 2 m ( g 2 q 1 ) ( q 4 g 2 ) 2 ρ ) + q 4 g 2 ,
    and
    φ 1 ( ρ ) = q 1 + ( g 2 q 1 ) ( q 4 q 1 ) ( q 4 g 2 ) tanh 2 ( 1 2 m ( g 2 q 1 ) ( q 4 g 2 ) 2 ρ ) + g 2 q 1 .
    respectively. So, we get the following solutions of Equation (1):
    U 1 ( t , x ) = q 4 ( q 4 g 2 ) ( q 4 q 1 ) ( g 2 q 1 ) tanh 2 ( k 2 m ( g 2 q 1 ) ( q 4 g 2 ) 2 ( x ε ε c t α α ) ) + q 4 g 2 e i ( μ x ε ε + ω t α α ) , U 2 ( t , x ) = A q 4 ( q 4 g 2 ) ( q 4 q 1 ) ( g 2 q 1 ) tanh 2 ( k 2 m ( g 2 q 1 ) ( q 4 g 2 ) 2 ( x ε ε c t α α ) ) + q 4 g 2 e i ( μ x ε ε + ω t α α ) ,
    and
    U 1 ( t , x ) = q 1 + ( g 2 q 1 ) ( q 4 q 1 ) ( q 4 g 2 ) tanh 2 ( k 2 m ( g 2 q 1 ) ( q 4 g 2 ) 2 ( x ε ε c t α α ) ) + g 2 q 1 e i ( μ x ε ε + ω t α α ) , U 2 ( t , x ) = A q 1 + ( g 2 q 1 ) ( q 4 q 1 ) ( q 4 g 2 ) tanh 2 ( k 2 m ( g 2 q 1 ) ( q 4 g 2 ) 2 ( x ε ε c t α α ) ) + g 2 q 1 e i ( μ x ε ε + ω t α α ) .
  • If ( Δ , m , r , ν ) R + × R + × R × { ν 0 } , there is another shape corresponding to two additional homoclinic orbits in blue as in Figure 4a, defined by H ( φ 1 , y ) = ν 0 and the roots of the related G 4 ( φ 1 ) are all real with q 1 < 0 , q 2 = q 3 = 0 , q 4 > 0 . The solutions through the intervals of real propagation [ q 1 , 0 ] and [ 0 , q 4 ] are derived as
    φ 1 ( ρ ) = q 4 + q 4 ( q 4 q 1 ) q 1 tanh 2 ( 1 2 m q 1 q 4 2 ρ ) q 4 ,
    and
    φ 1 ( ρ ) = q 1 q 1 ( q 4 q 1 ) q 4 tanh 2 ( 1 2 m q 1 q 4 2 ρ ) q 1 .
    respectively. Consequently, we obtain the solutions
    U 1 ( t , x ) = q 4 + q 4 ( q 4 q 1 ) q 1 tanh 2 ( k 2 m q 1 q 4 2 ( x ε ε c t α α ) ) q 4 e i ( μ x ε ε + ω t α α ) , U 2 ( t , x ) = A q 4 + q 4 ( q 4 q 1 ) q 1 tanh 2 ( k 2 m q 1 q 4 2 ( x ε ε c t α α ) ) q 4 e i ( μ x ε ε + ω t α α ) ,
    and
    U 1 ( t , x ) = q 1 q 1 ( q 4 q 1 ) q 4 tanh 2 ( k 2 m q 1 q 4 2 ( x ε ε c t α α ) ) q 1 e i ( μ x ε ε + ω t α α ) , U 2 ( t , x ) = A q 1 q 1 ( q 4 q 1 ) q 4 tanh 2 ( k 2 m q 1 q 4 2 ( x ε ε c t α α ) ) q 1 e i ( μ x ε ε + ω t α α ) .
  • If ( Δ , m , r , ν ) R + × R × R × { ν 0 } , there is a reversed α shape trajectory in blue, as shown in Figure 3c, characterized by H ( φ 1 , y ) = ν 0 and the related G 4 ( φ 1 ) possess the roots q 1 = q 2 = 0 , 0 < q 3 < q 4 . There is one bounded interval [ 0 , q 2 ] in which the homoclinic orbit lies, and two unbounded [ , 0 ] and [ q 4 , ] of real propagation. The solution over the bonded one assigns the following soliton solution
    φ 1 ( ρ ) = q 3 q 4 ( q 4 q 3 ) cosh 2 ( 1 2 m q 3 q 4 2 ρ ) + q 3 .
    Then,
    U 1 ( t , x ) = q 3 q 4 ( q 4 q 3 ) cosh 2 ( k 2 m q 3 q 4 2 ( x ε ε c t α α ) ) + q 3 e i ( μ x ε ε + ω t α α ) , U 2 ( t , x ) = A q 3 q 4 ( q 4 q 3 ) cosh 2 ( k 2 m q 3 q 4 2 ( x ε ε c t α α ) ) + q 3 e i ( μ x ε ε + ω t α α ) ,
    is a solution of Equation (1).
  • If ( Δ , m , r , ν ) R + × R × R + × { ν 2 } , there is another reversed α shape trajectory in blue, as shown in Figure 4c, described by H ( φ 1 , y ) = ν 2 . The roots of the related G 4 ( φ 1 ) satisfy q 1 = q 2 = g 2 < 0 , 0 < q 3 < q 4 . In this case, [ , g 2 ] , [ g 2 , q 3 ] and [ q 4 , ] are the real propagation intervals. The solutions through the bonded one of the homoclinic trajectory is
    φ 1 ( ρ ) = ( q 3 g 2 ) ( q 4 g 2 ) ( q 4 q 3 ) cosh 2 ( 1 2 m ( q 3 g 2 ) ( q 4 g 2 ) 2 ρ ) + q 3 g 2 .
    It follows that,
    U 1 ( t , x ) = ( q 3 g 2 ) ( q 4 g 2 ) ( q 4 q 3 ) cosh 2 ( k 2 m ( q 3 g 2 ) ( q 4 g 2 ) 2 ( x ε ε c t α α ) ) + q 3 g 2 e i ( μ x ε ε + ω t α α ) , U 2 ( t , x ) = A ( q 3 g 2 ) ( q 4 g 2 ) ( q 4 q 3 ) cosh 2 ( k 2 m ( q 3 g 2 ) ( q 4 g 2 ) 2 ( x ε ε c t α α ) ) + q 3 g 2 e i ( μ x ε ε + ω t α α ) .
    is a solution of Equation (1).
The results of this subsection have been summarized in Table 3.

5.3. Graphical Interpretation

We discuss in this section the graphical representation of the solution profiles and the effect of the fractional derivatives on the waveform of the solutions. To achieve this goal, let us assume specific values of the parameters such that they yield various types of solutions.
  • First, if m = 2 , p = 2 and r = 1 , then Δ < 0 and so the only equilibrium O is the center. For any ν > ν 0 , say ν = 0.4 , the root of G 4 are q 1 = 1.060812691 , q 2 = 0.6063288666 , q 3 = 0.4394247543 + 1.025028954 i and q 4 = q 3 = 0.4394247543 1.025028954 i . At this point, solution (27) can be rewritten in the numerical form
    U 1 ( t , x ) = 1.270011815 4.313954720 2.324597837 cn ( 1.137461104 k ( x ε ε c t α α ) , 0.2964326774 ) 4.175425607 e i ( μ x ε ε + ω t α α ) .
Figure 5 provides an approximation of the form of solution (52). Figure 5a shows the 3 D representation with ordinary orders ε = 1 and α = 1 , taking k = c = 1 for simplicity, while Figure 5b,c provide the 2 D graphs in the x U 1 plane at fixed t = 1 . It is observed that as the order deviates from 1, the wave gradually broadens and its period increases, resembling the behavior of a stretched spring.
Next, if m = 2 , p = 5 and r = 4 , then Δ > 0 and we have three equilibria O , ( g 2 , 0 ) = ( 1 , 0 ) and ( g 3 , 0 ) = ( 4 , 0 ) at which ν 0 = 0 , ν 2 = 7 / 12 and ν 3 = 32 / 3 , respectively. For ν = ν 2 , the root of G 4 are q 1 = ( 7 + 70 ) / 3 , q 2 = q 3 = g 2 = 1 and q 4 = ( 7 + 70 ) / 3 . Therefore, the soliton solution (42) can be expressed in the numerical form
U 1 ( t , x ) = 0.455533422 8.118577540 4.122200088 tanh 2 ( 0.8660254038 k ( x ε ε c t α α ) ) + 1.455533422 e i ( μ x ε ε + ω t α α ) .
Figure 6 depicts the waveform of solution (53) for various values of the fractional order ε and α . In Figure 6a, where both ε and α were set to 1, the standard soliton profile is observed. Figure 6b represents the surface projection onto the plane x U 1 , assuming t = 5 . In Figure 6c, as ε deviates from 1, the pulse width broadens and the waveform gradually loses its symmetric shape.

6. Perturbed System Dynamics

In this section, we investigate the autoresonance dynamics within the corresponding non-autonomous dynamical system, in which the oscillator synchronizes with a time-varying periodic excitation. The perturbed dynamical system, obtained from Equation (1), originates from the action of external forces. Such influences are incorporated through specific forcing terms, given by:
F 1 = a 1 g F ( ρ ) e i ζ , F 2 = a 2 F ( ρ ) e i ζ ,
where g is a constant, and F j ( ρ ) (for j = 1 , 2 ) are periodic functions chosen appropriately. The system takes the following form:
i T t α U 1 + a 1 T x 2 ε U 1 + ( b 1 | U 1 | + c 1 | U 1 | 2 + d 1 | U 2 | + e 1 | U 2 | 2 ) U 1 = f 1 U 2 + i [ σ 1 T x ε U 1 + λ 1 T x ε ( | U 1 | 2 U 1 ) + γ 1 U 1 T x ε | U 1 | 2 + δ 1 | U 1 | 2 T x ε U 1 ] + F 1 ,
i T t α U 2 + a 2 T x 2 ε U 2 + ( b 2 | U 2 | + c 2 | U 2 | 2 + d 2 | U 1 | + e 2 | U 1 | 2 ) U 2 = f 2 U 1 + i [ σ 2 T x ε U 2 + λ 2 T x ε ( | U 2 | 2 U 2 ) + γ 2 U 2 T x ε | U 2 | 2 + δ 2 | U 2 | 2 T x ε U 2 ] + F 2 .
By substituting (3) into Equation (54) and applying the methodology outlined in Section 3, we obtain the perturbed system corresponding to the unperturbed system (13). The derived system of equations is expressed as:
φ 1 = y ,
y = m φ 1 3 p φ 1 2 r φ 1 + s 0 cn ( z , κ ) ,
z = s 1 ,
where the constants m , p , and r are determined by Equation (14), g is assigned the value 1 / A , and κ denotes the modulus of the Jacobi elliptic function, constrained to | κ | < 1 . The periodic external forces F 1 and F 2 are specifically chosen as:
F 1 = F 2 = k 2 A s 0 cn ( s 1 ρ , κ ) ,
where s 0 refers to the amplitude of the new force with frequency s 1 . This selection is particularly meaningful where, depending on the value of κ , the Jacobi elliptic function cn can reduce to trigonometric functions (when κ 0 ) or hyperbolic functions (when κ 1 ); see, e.g., [39,40].
We numerically analyze both dynamics of the unperturbed system (13) (where s 0 = 0 ) and the perturbed system (55), focusing on how periodic perturbations influence the system’s behavior.
The physical parameters are assigned the following values:
A = 0.7 , a 1 = 0.6 , a 2 = 0.2 , b 2 = 0.03928571428 , c 2 = 0.4469387756 , d 2 = 0.01 , e 2 = 0.1 , f 2 = 1 , γ 2 = 0.1 , k = 1 , λ 2 = 0.3 , ω = 2.256696429 , σ 1 = 0.3 , σ 2 = 0.8 .
Consequently, Equation (14) gives m = 0.375 , p = 0.125 , and r = 1.25 . We examine two scenarios depending on the presence or absence of periodic external forces.
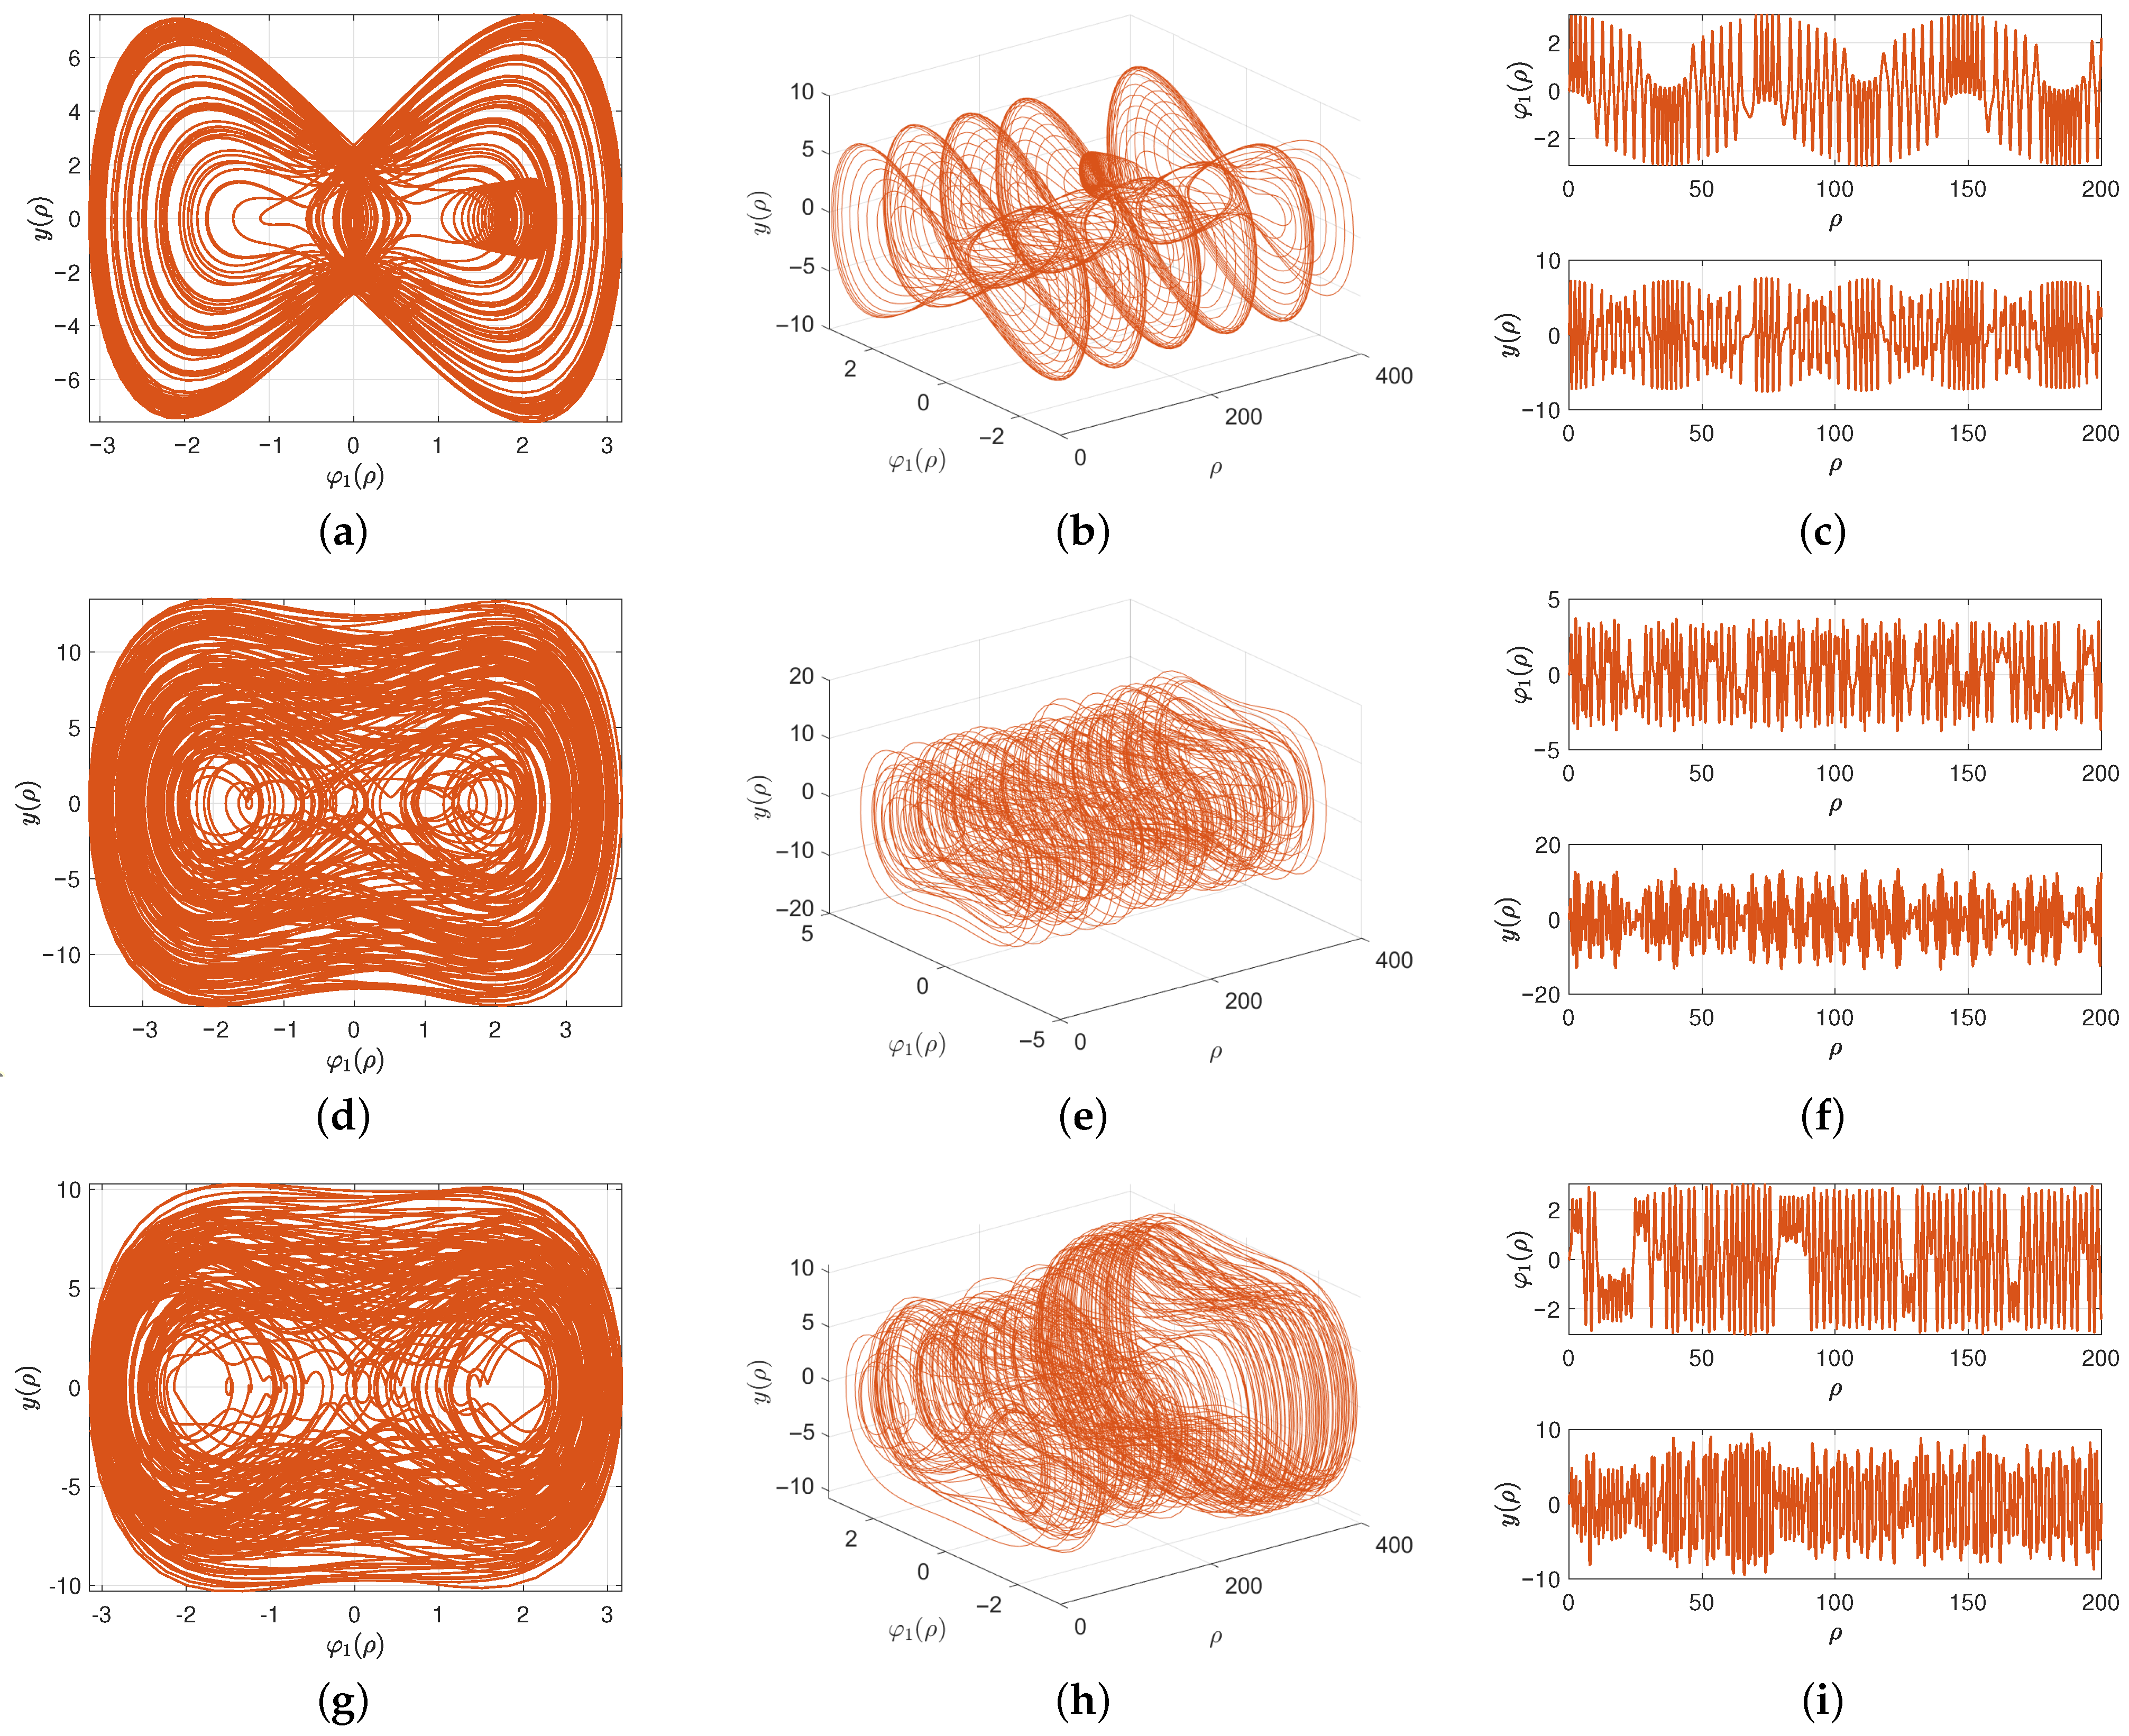
Given that | p | < 2 m r , the bifurcation analysis in Section 4 reveals that the unperturbed system (13) possesses a single equilibrium point, O. Under initial conditions that keep the constant ν positive, this point functions as a center, producing periodic phase orbits around it. For the specific initial conditions ( φ 1 ( 0 ) , y ( 0 ) ) = ( 0.01 , 1.03 ) , the calculated value ν = 0.853 > 0 verifies this periodic motion. The 3D and 2D phase planes, shown in Figure 7a,b, illustrate the bounded periodic behavior. Additionally, the time-dependent evolution of φ 1 ( ρ ) and y ( ρ ) , plotted against ρ in Figure 7c, further supports this observation. This behavior persists due to the incommensurate relationship between the frequencies.
The dynamical behavior of the unperturbed system (55) exhibits increased complexity, featuring both periodic and chaotic regimes, as influenced by the free parameters m , p , and r, perturbation parameters s 0 , s 1 , and κ . To examine these dynamics, we adopt a comprehensive analytical framework that includes 3D and 2D phase portraits with time-series evaluations, and sensitivity assessments of key parameters. Our investigation focuses on two distinct cases, where we methodically adjust either the frequency or amplitude of the additional force, keeping the other parameters invariant.
In the first case study, we fix the parameters m, p, and r at constant values and set the periodic forcing amplitude to s 0 = 4 . The external force frequency s 1 is varied systematically as the primary control parameter. All simulations use the same initial conditions: φ 1 ( 0 ) = 0.1 and y ( 0 ) = 0 . Figure 8 presents the dynamics of the perturbed system (55) under an external force amplitude of s 0 for frequencies s 1 = 0.01 , 0.1 , and 3.1 . For s 0 = 0.01 , the 3D and 2D phase planes, shown in Figure 8a,b, display quasi-periodic wave patterns, further supported by the time evolution of φ 1 and y in Figure 8c. When we increase the frequency up to s 1 = 0.1 , the behavior of quasi-periodic persists, as illustrated in Figure 8d–f. Notably, even at the higher frequency s 1 = 3.1 , the system remains non-chaotic. The phase portraits, together with time series graphs, are presented in Figure 8g–i.
For the second case study, we assume convenient parameter values, keeping one of the parameters—either m , p , or r—constant. By fixing the strength of the periodic force at s 0 = 9 with the initial condition ( φ 1 ( 0 ) , y ( 0 ) ) = ( 0.02 , 0 ) , we analyze how variations in frequency affect the system’s behavior.
A = 0.7 , a 1 = 0.6 , a 2 = 0.2 , b 2 = 0.03928571428 , c 2 = 0.4102040813 , d 2 = 0.01 , e 2 = 0.1 , f 2 = 1 , γ 2 = 0.1 , k = 1 , λ 2 = 0.3 , ω = 0.09330356996 , σ 1 = 0.3 , σ 2 = 0.8 .
The physical parameter selected in (57) fixes p as before, with m = 3.375 and r = 10.5 . When s 1 = 0.1 , the perturbed system (55) maintains quasi-periodic dynamics, as demonstrated by the phase planes and time series graphs in Figure 9a–c. Raising the force frequency to s 1 = 3.1 induces a shift toward chaotic dynamics, as seen in Figure 9d–f. The chaotic effects intensify at s 1 = 9.1 , as depicted in Figure 9g–i.
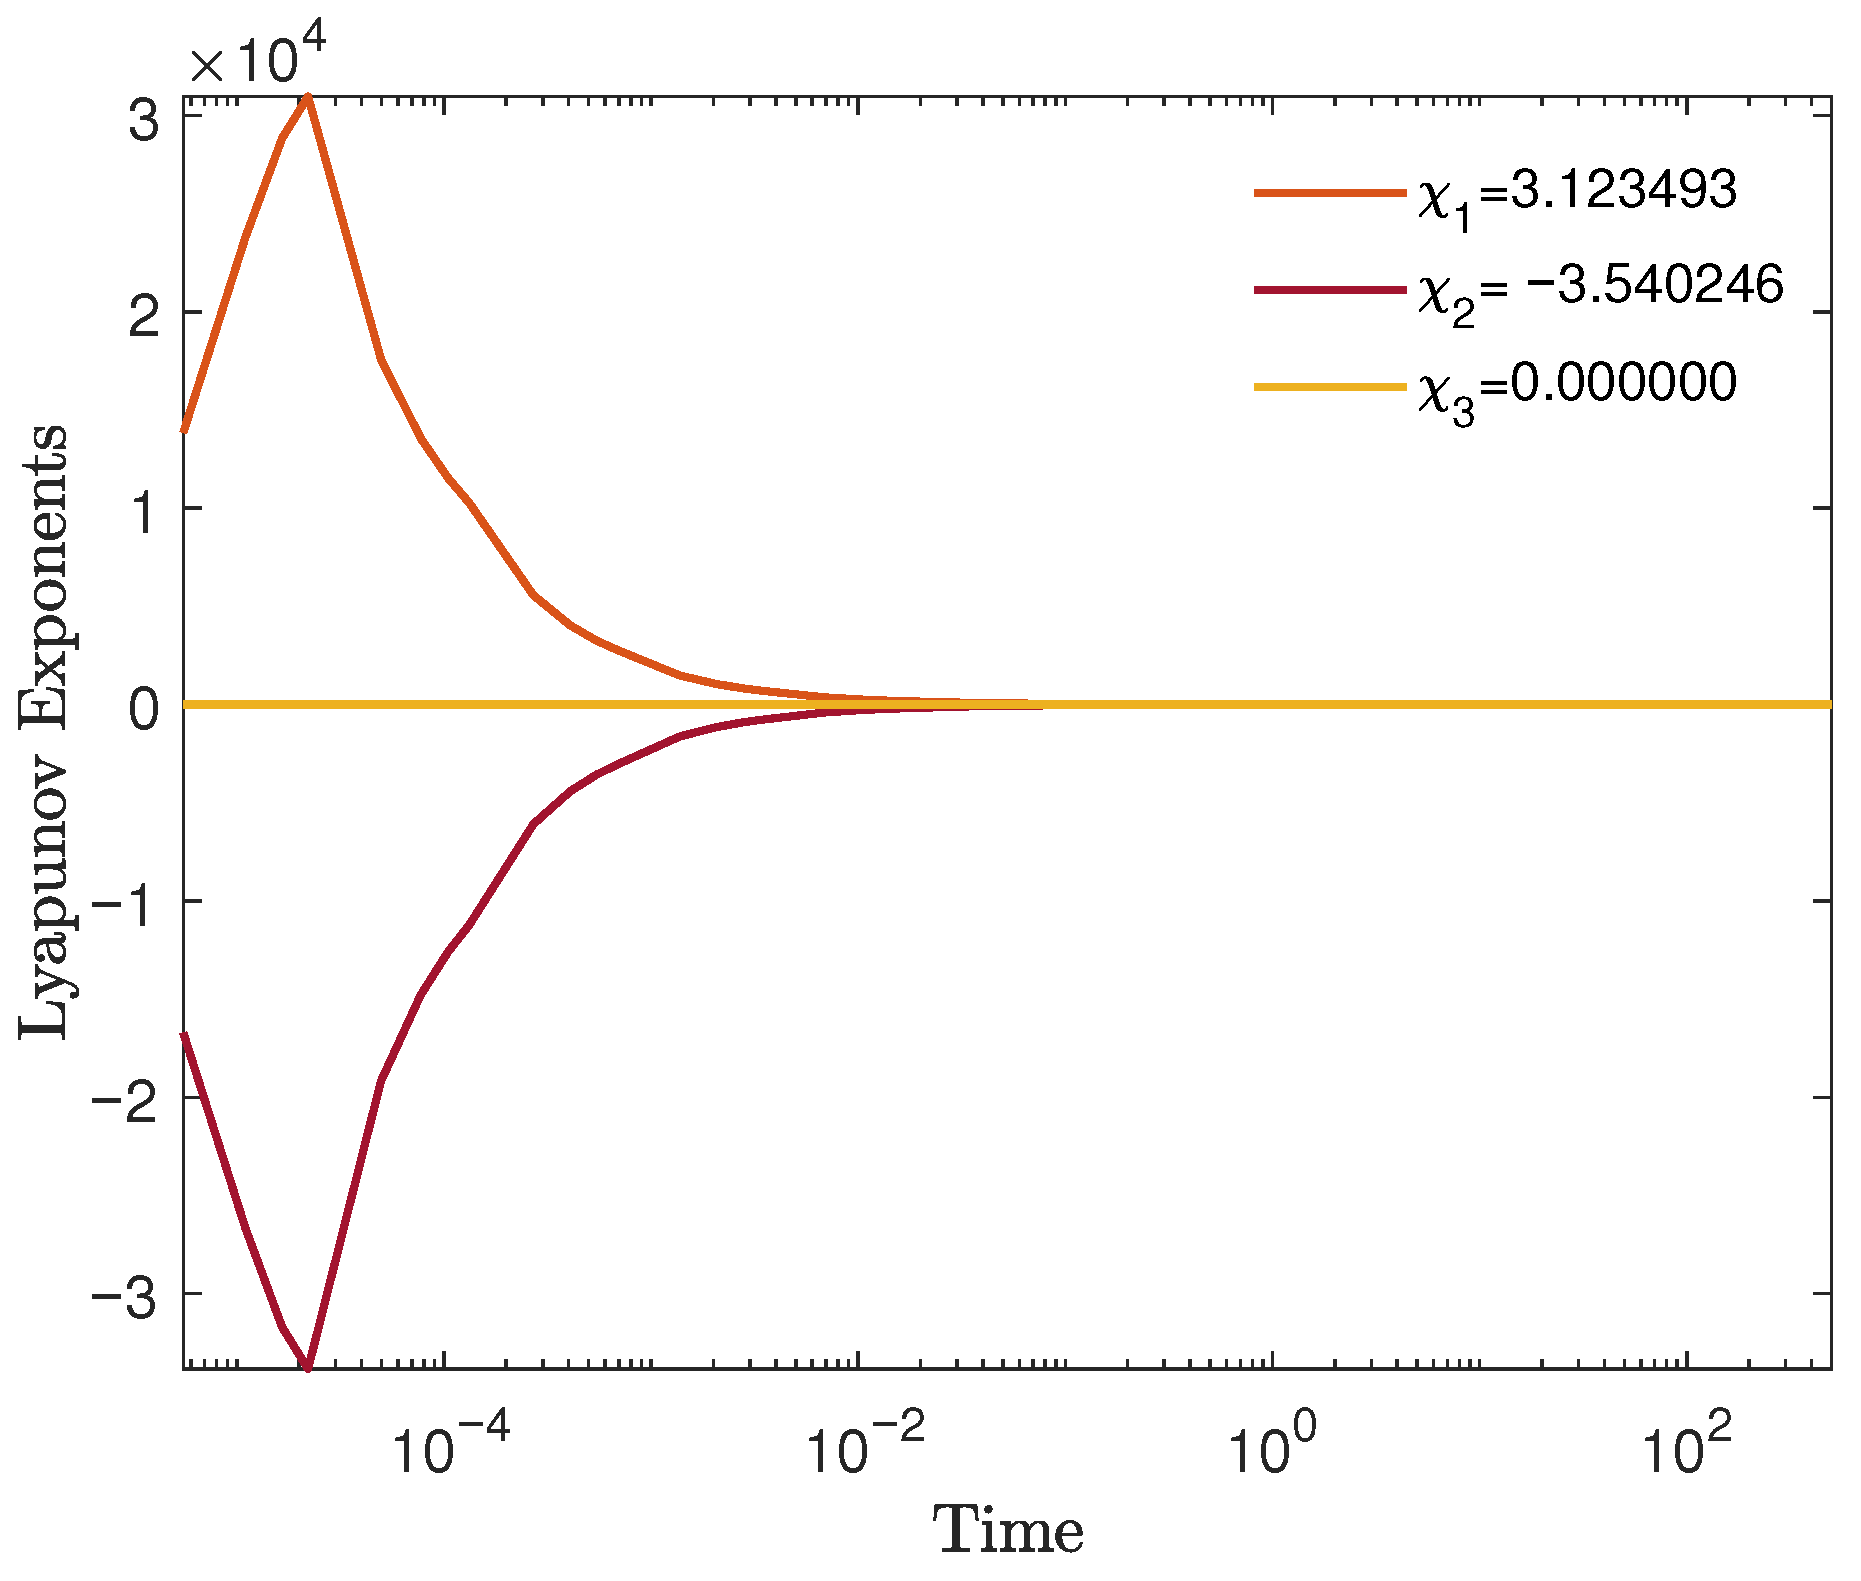
We proceed to evaluate the Lyapunov exponents of the perturbed system (55), applying the same values as in Figure 9g–i. These exponents, obtained through numerical simulation, are a powerful tool for investigating the stability and chaotic nature of complex dynamical systems. However, interpreting the results accurately requires a deep understanding of the internal dynamics of the system, since Lyapunov exponents are highly sensitive to specific characteristics of the system [41]. A positive exponent indicates chaotic behavior, whereas a negative one reflects convergence or stability. Thus, the computation of these values is crucial. The Lyapunov exponents of the perturbed system are given by:
χ 1 = 3.123493 , χ 2 = 3.540246 , χ 3 = 0 .
To illustrate the system’s intricate dynamics (55), the Lyapunov exponent is analyzed in the time domain as shown in Figure 10, where the presence of a positive exponent curve verifies the chaotic nature of the system. Additionally, Table 4 provides a summary of the Lyapunov exponents’ convergence.

7. Conclusions

The present study was devoted to the qualitative analysis and the construction of some possible exact solutions for the FCNSE in the sub-manifold φ 2 = A φ 1 . Solutions to Equation (1) were sought using the ansatz given in (3). This assumed solution structure transformed Equation (1) into a conservative, fourth-order dynamical system, which was not a Hamiltonian system because it could not be derived from a Hamiltonian function using the canonical Hamilton equations. Since the system was non-Hamiltonian, its dynamical analysis was more complicated. Consequently, the system’s dynamical behavior was examined within the sum-manifold φ 2 = A φ 1 . This reduction simplified the fourth-order system into a two-dimensional, Hamiltonian system with one degree of freedom. Thus, the problem of solving Equation (1) was reduced to solving for the one-dimensional motion of a particle within a three-parameter potential function (17). The qualitative theory of planar integrable systems was utilized to investigate and characterize the phase portraits. Furthermore, the existence conditions for periodic, super-periodic wave solutions, and solitary wave solutions were tabulated, while the non-existence of kink (or anti-kink) solutions was also proven. By integrating the conserved quantity over the intervals of real wave propagation, distinct classes of wave solutions were constructed, categorized as periodic, super-periodic, and solitary solutions. Intervals permitting real wave propagation were essential to the analysis. Even when the physical parameters remained constant, varying these intervals led to solutions that differed fundamentally in both mathematical structure and physical interpretation (see Remark 1). Therefore, this aspect was essential and was not overlooked. Finally, the model was extended to include the effect of a generalized external periodic force. The perturbed system underwent a dynamical shift from quasi-periodic motion to chaos. These complex behaviors were illustrated through 3D and 2D phase portraits, as well as time series plots. The presence of chaos was quantitatively confirmed by calculating Lyapunov exponents. Numerical simulations demonstrated that the system’s behavior was highly sensitive to variations in the frequency and amplitude of the external force.

Author Contributions

Conceptualization, A.E. and M.E.; Methodology, M.A., A.E. and M.E.; Software, A.E.; Formal analysis, M.A., A.E. and M.E.; Writing- Original Draft, M.A., A.E. and M.E.; Writing—Review and Editing, M.A. and A.E.; Visualization, M.A.; Supervision, A.E. and M.E. All authors have read and agreed to the published version of the manuscript.

Funding

This work was supported by the Deanship of Scientific Research, Vice Presidency for Graduate Studies and Scientific Research, King Faisal University, Saudi Arabia [Grant No. KFU253115].

Data Availability Statement

The original contributions presented in this study are included in the article. Further inquiries can be directed to the corresponding author.

Acknowledgments

The author acknowledge the Deanship of Scientific Research at King Faisal University for the financial support.

Conflicts of Interest

The authors declare no conflicts of interest.

References

  1. Akinyemi, L.; Şenol, M.; Tasbozan, O.; Kurt, A. Multiple-solitons for generalized (2+1)-dimensional conformable Korteweg-de Vries-Kadomtsev-Petviashvili equation. J. Ocean Eng. Sci. 2022, 7, 536–542. [Google Scholar] [CrossRef]
  2. Zhao, Y.H.; Mathanaranjan, T.; Rezazadeh, H.; Akinyemi, L.; Inc, M. New solitary wave solutions and stability analysis for the generalized (3+1)-dimensional nonlinear wave equation in liquid with gas bubbles. Results Phys. 2022, 43, 106083. [Google Scholar] [CrossRef]
  3. Hasegawa, A.; Tappert, F. Transmission of stationary nonlinear optical pulses in dispersive dielectric fibers. I. Anomalous dispersion. Appl. Phys. Lett. 1973, 23, 142–144. [Google Scholar] [CrossRef]
  4. Mollenauer, L.F.; Stolen, R.H.; Gordon, J.P. Experimental observation of picosecond pulse narrowing and solitons in optical fibers. Phys. Rev. Lett. 1980, 45, 1095–1098. [Google Scholar] [CrossRef]
  5. Altawallbeh, Z.; Az-Zo’bi, E.; Alleddawi, A.O.; Şenol, M.; Akinyemi, L. Novel liquid crystals model and its nematicons. Opt. Quantum Electron. 2022, 54, 861. [Google Scholar] [CrossRef]
  6. Nasreen, N.; Younas, U.; Lu, D.; Zhang, Z.; Rezazadeh, H.; Hosseinzadeh, M. Propagation of solitary and periodic waves to conformable ion sound and Langmuir waves dynamical system. Opt. Quantum Electron. 2023, 55, 868. [Google Scholar] [CrossRef]
  7. Wazwaz, A.M. Two new integrable fourth-order nonlinear equations: Multiple soliton solutions and multiple complex soliton solutions. Nonlinear Dyn. 2018, 94, 2655–2663. [Google Scholar] [CrossRef]
  8. Guan, X.; Liu, W.; Zhou, Q.; Biswas, A. Darboux transformation and analytic solutions for a generalized super-NLS-mKdV equation. Nonlinear Dyn. 2019, 98, 1491–1500. [Google Scholar] [CrossRef]
  9. Chen, Y.; Lü, X.; Wang, X.L. Bäcklund transformation, Wronskian solutions and interaction solutions to the (3+ 1)-dimensional generalized breaking soliton equation. Eur. Phys. J. Plus 2023, 138, 492. [Google Scholar] [CrossRef]
  10. Gao, X.; Guo, Y.; Shan, W.; Yuan, Y.; Zhang, C.; Chen, S. Magneto-optical/ferromagnetic-material computation: Bäcklund transformations, bilinear forms and N solitons for a generalized (3+1)-dimensional variable-coefficient modified Kadomtsev–Petviashvili system. Appl. Math. Lett. 2020, 111, 106627. [Google Scholar] [CrossRef]
  11. Elbrolosy, M.; Elmandouh, A. Painlevé analysis, Lie symmetry and bifurcation for the dynamical model of radial dislocations in microtubules. Nonlinear Dyn. 2025, 113, 13699–13714. [Google Scholar] [CrossRef]
  12. Khalique, C.M.; Biswas, A. Optical solitons with power law nonlinearity using Lie group analysis. Phys. Lett. A 2009, 373, 2047–2049. [Google Scholar] [CrossRef]
  13. Khalique, C.M.; Biswas, A. A Lie symmetry approach to nonlinear Schrödinger’s equation with non-Kerr law nonlinearity. Commun. Nonlinear Sci. Numer. Simul. 2009, 14, 4033–4040. [Google Scholar] [CrossRef]
  14. Lu, B. The first integral method for some time fractional differential equations. J. Math. Anal. Appl. 2012, 395, 684–693. [Google Scholar] [CrossRef]
  15. Al-Askar, F.M.; Mohammed, W.W. Abundant optical solutions for the Sasa-Satsuma equation with M-truncated derivative. Front. Phys. 2023, 11, 1216451. [Google Scholar] [CrossRef]
  16. Rehman, H.U.; Iqbal, I.; Hashemi, M.S.; Mirzazadeh, M.; Eslami, M. Analysis of cubic-quartic-nonlinear Schrödinger’s equation with cubic-quintic-septic-nonic form of self-phase modulation through different techniques. Optik 2023, 287, 171028. [Google Scholar] [CrossRef]
  17. Islam, M.A.; Rimu, N.N.; Sarker, S.; Dey, P.; Akbar, M.A. Dynamics of soliton solutions, bifurcation, chaotic behavior, stability, and sensitivity analysis of the time-fractional Gardner equation. AIP Adv. 2025, 15, 095203. [Google Scholar] [CrossRef]
  18. Khadim, M.; Abbas, M.; Nazir, T.; Lupas, A.A.; Anwar, M.N.; Alharthi, M. Bifurcation analysis and optical soliton solutions of the ion sound and Langmuir wave equation using the modified Khater method. AIMS Math. 2025, 10, 19617–19641. [Google Scholar] [CrossRef]
  19. Alshammari, S.; Al-Sawalha, M.M.; Shah, R. Approximate Analytical Methods for a Fractional-Order Nonlinear System of Jaulent–Miodek Equation with Energy-Dependent Schrödinger Potential. Fractal Fract. 2023, 7, 140. [Google Scholar] [CrossRef]
  20. Han, T.; Li, Z.; Li, C. Bifurcation analysis, stationary optical solitons and exact solutions for generalized nonlinear Schrödinger equation with nonlinear chromatic dispersion and quintuple power-law of refractive index in optical fibers. Phys. A Stat. Mech. Its Appl. 2023, 615, 128599. [Google Scholar] [CrossRef]
  21. Jamal, A.; Ullah, A.; Ahmad, S.; Sarwar, S.; Shokri, A. A Survey of (2+1)-Dimensional KdV–mKdV Equation Using Nonlocal Caputo Fractal–Fractional Operator. Results Phys. 2023, 46, 106294. [Google Scholar] [CrossRef]
  22. Mirzazadeh, M.; Sharif, A.; Hashemi, M.S.; Akgül, A.; Din, S.M.E. Optical solitons with an extended (3+1)-dimensional nonlinear conformable Schrödinger equation including cubic–quintic nonlinearity. Results Phys. 2023, 49, 106521. [Google Scholar] [CrossRef]
  23. Asma, M.; Biswas, A.; Kara, A.H.; Zayed, E.M.; Guggilla, P.; Khan, S.; Ekici, M.; Alzahrani, A.K.; Belic, M.R. A pen-picture of solitons and conservation laws in magneto-optic waveguides having quadratic-cubic law of nonlinear refractive index. Optik 2020, 223, 165330. [Google Scholar] [CrossRef]
  24. Muhammad, J.; Riaz, M.B.; Younas, U.; Nasreen, N.; Jhangeer, A.; Lu, D. Extraction of optical wave structures to the coupled fractional system in magneto-optic waveguides. Arab J. Basic Appl. Sci. 2024, 31, 242–254. [Google Scholar] [CrossRef]
  25. Ali, A.; Ahmad, J.; Javed, S. Investigating the dynamics of soliton solutions to the fractional coupled nonlinear Schrödinger model with their bifurcation and stability analysis. Opt. Quantum Electron. 2023, 55, 829. [Google Scholar] [CrossRef]
  26. Han, T.; Li, Z.; Zhang, X. Bifurcation and new exact traveling wave solutions to time-space coupled fractional nonlinear Schrödinger equation. Phys. Lett. A 2021, 395, 127217. [Google Scholar] [CrossRef]
  27. Esen, A.; Sulaiman, T.A.; Bulut, H.; Baskonus, H.M. Optical solitons to the space-time fractional (1+1)-dimensional coupled nonlinear Schrödinger equation. Optik 2018, 167, 150–156. [Google Scholar] [CrossRef]
  28. Alharbi, M.; Elmandouh, A.; Elbrolosy, M. New soliton, kink and periodic solutions for fractional space–time coupled Schrödinger equation. Alex. Eng. J. 2025, 114, 123–135. [Google Scholar] [CrossRef]
  29. Qayyum, M.; Ahmad, E.; Ahmad, H.; Almohsen, B. New solutions of time-space fractional coupled Schrödinger systems. AIMS Math. 2023, 8, 27033–27051. [Google Scholar] [CrossRef]
  30. Atanackovic, T.M.; Pilipovic, S.; Stankovic, B.; Zorica, D. Fractional Calculus with Applications in Mechanics: Wave Propagation, Impact and Variational Principles; John Wiley & Sons: Hoboken, NJ, USA, 2014. [Google Scholar]
  31. Khalil, R.; Al Horani, M.; Yousef, A.; Sababheh, M. A new definition of fractional derivative. J. Comput. Appl. Math. 2014, 264, 65–70. [Google Scholar] [CrossRef]
  32. Goldstein, H. Classical Mechanics Addison-Wesley Series in Physics; Addison-Wesley: Boston, MA, USA, 1980. [Google Scholar]
  33. Saha, A.; Banerjee, S. Dynamical Systems and Nonlinear Waves in Plasmas; CRC Press: Boca Raton, FL, USA, 2021; p. x+207. [Google Scholar]
  34. Yang, L.; Hou, X.; Zeng, Z. A complete discrimination system for polynomials. Sci. China Ser. E 1996, 39, 628–646. [Google Scholar]
  35. Nemytskii, V.V. Qualitative Theory of Differential Equations; Princeton University Press: Princeton, NJ, USA, 2015; Volume 2083. [Google Scholar]
  36. Dubinov, A.; Kolotkov, D.Y.; Sazonkin, M. Supernonlinear waves in plasma. Plasma Phys. Rep. 2012, 38, 833–844. [Google Scholar] [CrossRef]
  37. Gantmacher, F. Lectures in Analytical Mechanics; Mir Publishers: Moscow, Russia, 1970. [Google Scholar]
  38. Byrd, P.F.; Friedman, M.D. Handbook of Elliptic Integrals for Engineers and Scientists, 2nd ed.; Die Grundlehren der Mathematischen Wissenschaften, Band 67; Springer: New York, NY, USA; Heidelberg, Germany, 1971; p. xvi+358. [Google Scholar]
  39. Younas, U.; Hussain, E.; Muhammad, J.; Garayev, M.; El-Meligy, M. Bifurcation analysis, chaotic behavior, sensitivity demonstration and dynamics of fractional solitary waves to nonlinear dynamical system. Ain Shams Eng. J. 2025, 16, 103242. [Google Scholar] [CrossRef]
  40. Jhangeer, A.; Beenish. Dynamics and wave analysis in longitudinal motion of elastic bars or fluids. Ain Shams Eng. J. 2024, 15, 102907. [Google Scholar] [CrossRef]
  41. Layek, G.C. An Introduction to Dynamical Systems and Chaos; Springer: Berlin/Heidelberg, Germany, 2015; Volume 1. [Google Scholar]
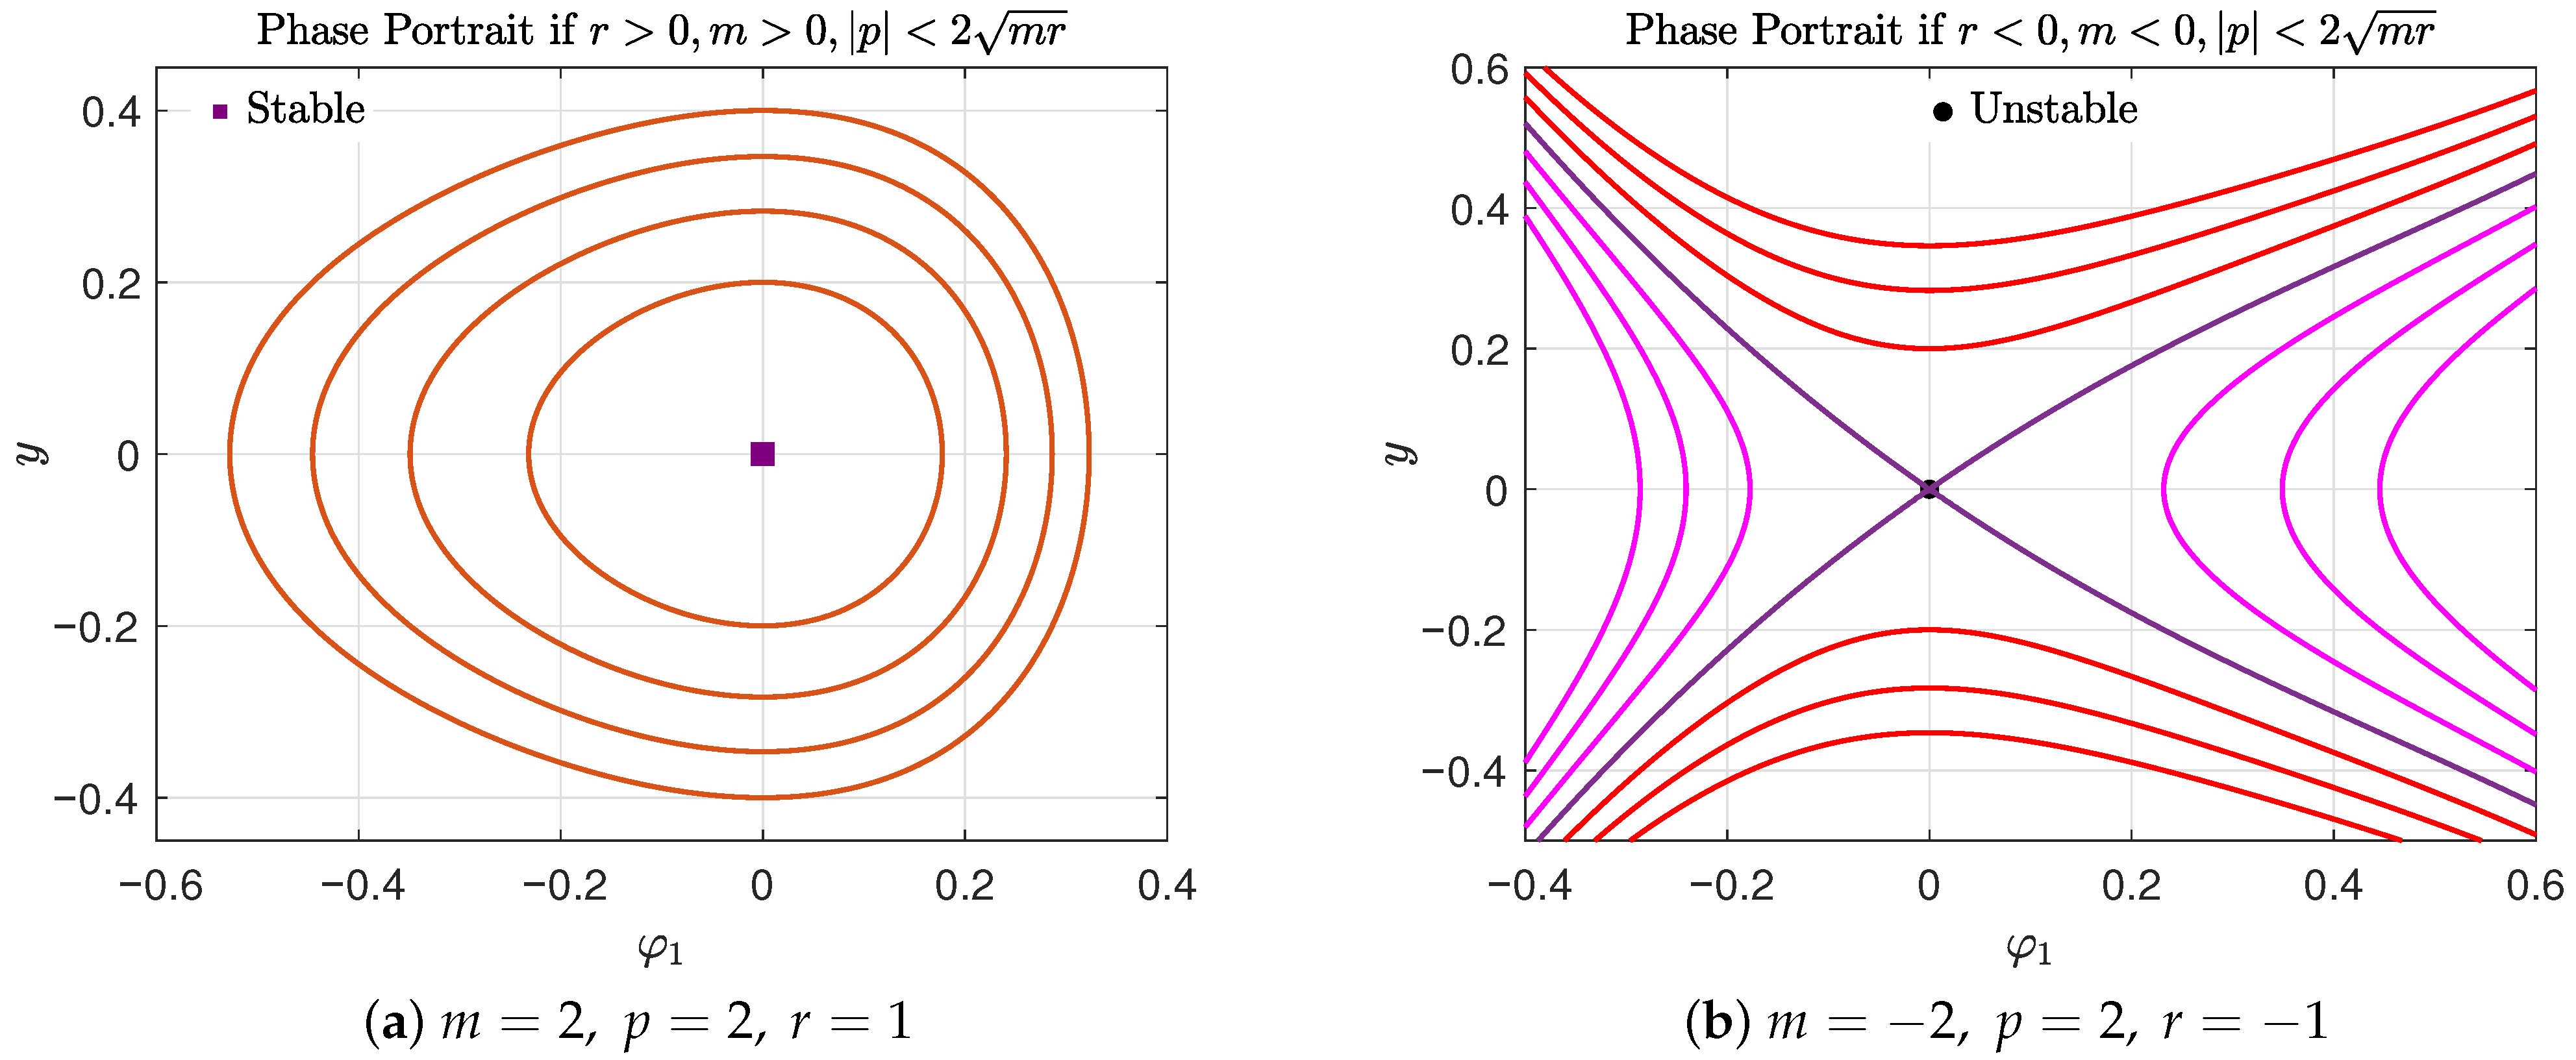
Figure 1. Phase portrait of system (13) corresponding to the regime | p | < 2 m r .
Mathematics 13 03174 g001
Figure 2. Phase portrait of system (13) corresponding to the regime | p | = 2 m r .
Mathematics 13 03174 g002
Figure 3. Phase portrait of system (13) corresponding to the zone | p | > 2 m r with m r > 0 .
Mathematics 13 03174 g003
Figure 4. Phase portrait of system (13) corresponding to the zone p 2 > 4 m r with m r < 0 .
Mathematics 13 03174 g004
Figure 5. Graph of | U 1 | of solution (52). (a) 3 D graph with ε = 1 and α = 1 ; (b) 2 D graph with ε = 1 ; (c) 2 D graph with ε = 0.8 and ε = 0.5 .
Mathematics 13 03174 g005
Figure 6. Graph of | U 1 | of solution (53). (a) Three-dimensional graph with ε = α = 1 ; (b) Two-dimensional graph with ε = α = 1 ; (c) Two-dimensional graph with various ε and α = 1 .
Mathematics 13 03174 g006
Figure 7. Two-dimensional and three-dimensional phase portraits with the time series graphs for system (13) with the condition ( φ 1 ( 0 ) , y ( 0 ) ) = ( 0.01 , 1.03 ) and parameters from (56).
Mathematics 13 03174 g007
Figure 8. Two-dimensional and three-dimensional phase portraits with the time series graphs for system (13) with the condition ( φ 1 ( 0 ) , y ( 0 ) ) = ( 0.01 , 1.03 ) , periodic force amplitude s 0 = 4 , and parameters from (56).
Mathematics 13 03174 g008
Figure 9. Two-dimensional and three-dimensional phase portraits with the time series graphs for system (13) with the condition ( φ 1 ( 0 ) , y ( 0 ) ) = ( 0.02 , 0 ) , periodic force amplitude s 0 = 9 , and parameters from (57).
Mathematics 13 03174 g009
Figure 10. Lyapunov exponents for system (55) with the same parameters as in (57) and s 0 = 9.1 .
Mathematics 13 03174 g010
Table 1. Phase orbits classifications.
No.AbbreviationExplanation
1. P O c , f Periodic orbit
2. H O c , f Homoclinic orbit
3. H E O c , f Heteroclinic orbit
4. S N P O c , f Super-nonlinear periodic orbit
where c and f denote the number of stable equilibrium points and separatrix layers traversed by the orbit, respectively.
Table 2. Conditions of existence of all periodic solutions.
No.Signs ofRange ofPhase PortraitReal Prop.Solution
Δ m r ν Figure Color Interval
1.++ [ ν 0 , ] Figure 1aorange [ q 1 , q 2 ] ( 26 )
2.0++ [ ν 0 , ν 1 ] Figure 2ared [ q 1 , q 2 ] ( 26 )
3.0++ [ ν 1 , ] Figure 2apink [ q 1 , q 2 ] ( 26 )
4.+++ [ ν 3 , ν 0 ] Figure 3agreen [ q 1 , q 2 ] ( 26 )
5.+++ [ ν 2 , ] Figure 3ared [ q 1 , q 2 ] ( 26 )
6.++ [ ν 3 , ν 2 ] Figure 4ared [ q 1 , q 2 ] ( 26 )
7.++ [ ν 0 , ] Figure 4agreen [ q 1 , q 2 ] ( 26 )
8.+++ ν 0 Figure 3acyan [ q 1 , q 2 ] ( 28 )
9.++ ν 2 Figure 4acyan [ q 1 , q 2 ] ( 30 )
10.+++ [ ν 0 , ν 2 ] Figure 3abrown [ q 1 , q 2 ] ( 32 )
[ q 3 , q 4 ] ( 33 )
11.++ [ ν 2 , ν 0 ] Figure 4abrown [ q 1 , q 2 ] ( 33 )
[ q 3 , q 4 ] ( 36 )
12.+ [ ν 3 , ν 0 ] Figure 3cred [ q 2 , q 3 ] ( 36 )
13.++ [ ν 0 , ν 2 ] Figure 4cred [ q 2 , q 3 ] ( 36 )
Table 3. Conditions of existence of all soliton solutions.
No.Signs ofRange ofPhase PortraitReal Prop.Solution
Δ m r ν Figure Color Interval
1.+++ ν 2 Figure 3aperple [ q 1 , g 2 ] ( 40 )
[ g 2 , q 4 ] ( 41 )
2.++ ν 0 Figure 4ablue [ q 1 , 0 ] ( 44 )
[ 0 , q 4 ] ( 45 )
3.+ ν 0 Figure 3cblue [ 0 , q 2 ] ( 48 )
4.++ ν 2 Figure 4cblue [ g 2 , q 3 ] ( 50 )
Table 4. Lyapunov exponent iterations.
Time χ 1 χ 2 χ 3 Time χ 1 χ 2 χ 3
5 3.278574 3.648897 0.00 35 3.179922 3.618314 0.00
10 3.224724 3.630211 0.00 40 3.177595 3.615081 0.00
15 3.204862 3.628083 0.00 45 3.176125 3.614669 0.00
20 3.192130 3.620639 0.00 50 3.174561 3.615395 0.00
25 3.188402 3.620766 0.00 55 3.172702 3.615310 0.00
30 3.185012 3.619985 0.00 60 3.171399 3.614227 0.00
Disclaimer/Publisher’s Note: The statements, opinions and data contained in all publications are solely those of the individual author(s) and contributor(s) and not of MDPI and/or the editor(s). MDPI and/or the editor(s) disclaim responsibility for any injury to people or property resulting from any ideas, methods, instructions or products referred to in the content.