Article

Investigating the Performance of Longitudinal Groove on Noise Reduction in a NACA0015 Hydrofoil Using Computational Fluid Dynamics

by
S. Suresh Kumar Raju
1,
Nasser Firouzi
2,*,
Fatemeh H. H. Al Mukahal
1 and
Przemysław Podulka
3
1
Department of Mathematics and Statistics, College of Science, King Faisal University, Al-Ahsa 31982, Saudi Arabia
2
Institute of Structural Mechanics, Bauhaus-University Weimar, 99423 Weimar, Germany
3
Department of Manufacturing Processes and Production Engineering, Rzeszow University of Technology, 35-959 Rzeszow, Poland
*
Author to whom correspondence should be addressed.
Mathematics 2025, 13(19), 3125; https://doi.org/10.3390/math13193125
Submission received: 20 August 2025 / Revised: 17 September 2025 / Accepted: 25 September 2025 / Published: 30 September 2025
(This article belongs to the Special Issue Advances and Applications in Computational Fluid Dynamics)

Abstract

Nowadays, hydrodynamic noise reduction in hydrofoils is of great importance due to their wide applications in marine industries, submarines and water systems. One of the modern methods for reducing this noise is the use of longitudinal grooves on the surface of the hydrofoil. In this study, the effect of longitudinal grooves on the reduction in noise generated around a NACA0015 hydrofoil was investigated. For this purpose, numerical methods based on computational fluid dynamics (CFD) and acoustic analysis using ANSYS Fluent 2024 R1 software were used. The Fuchs–Williams and Hawkings (FW-H) acoustic model was used for acoustic analysis. The results obtained from the hydrofoil without grooves and the hydrofoil equipped with longitudinal grooves were compared. In total, 11 numerical noise reading stations were installed around the hydrofoil to calculate the noise in two modes with and without grooves. The results show that the use of longitudinal grooves reduces the flow turbulence in the area near the hydrofoil surface and, as a result, prevents the formation of large and unstable vortices. This leads to a significant reduction in hydrodynamic noise, especially at low and medium frequencies. This study shows that the appropriate design of longitudinal grooves on the NACA0015 hydrofoil can be used as an effective solution to reduce hydrodynamic noise. The findings of this research can be the basis for the development of quieter hydrofoils in industrial and military applications. The results show that at low frequencies (up to approximately 10 Hz), the noise intensity of the ungrooved hydrofoil is higher than that of the grooved hydrofoil, but in the frequency range of 10 to 20 Hz, the noise intensity of the grooved hydrofoil increases significantly and exceeds that of the ungrooved hydrofoil.

1. Introduction

Hydraulic tip-slotted machines are vital equipment across multiple industries, playing a crucial role in the advancement of modern infrastructure. These high-performance systems are employed in various sectors, such as renewable energy generation in hydropower facilities [1,2], efficient irrigation and water distribution systems for farming [3], flood control and drainage operations, as well as municipal and industrial wastewater management [4]. Additionally, they find specialized uses in petroleum industries, climate control systems, and food manufacturing processes [5].
Comprehensive investigation into developing control methodologies for this phenomenon holds strategic significance in this field. Such research should encompass several fundamental phases: initially, performing thorough experimental analyses employing sophisticated measurement techniques like Particle Image Velocimetry (PIV) and Laser Doppler Velocimetry (LDV) to gain deeper insights into vortex generation mechanisms. Subsequently, creating precise simulation models through advanced Computational Fluid Dynamics (CFD) approaches, followed by proposing effective mitigation strategies. Potential solutions may involve blade profile optimization, implementation of advanced materials with enhanced mechanical characteristics, or creation of dynamic control mechanisms.
Various numerical studies have been conducted in this field. The research team led by Wang [6] performed comprehensive three-dimensional numerical simulations to analyze the thermal performance of a squealer-tip GE-E3 turbine blade incorporating eight vertically stacked cooling channels. The research conducted by Danlos and colleagues [7] built upon numerous prior investigations of flow instabilities in partial cavitation occurring across three configurations: hydrofoil surfaces, converging-diverging steps, and blade passage channels. Qian et al. [8] utilized an Euler–Lagrange multiphase modeling approach to simulate the coupled water flow and sediment transport phenomena in a double-suction centrifugal pump prototype. A study by Lidtke and colleagues [9] identified two key factors motivating hydroacoustic modeling development: increasing ecological concerns about ship-related ocean noise pollution and the previous scarcity of reliable numerical simulation methods. Kim et al. [10] conducted numerical investigations of flow-induced noise generation from cavitating flows around a NACA66 MOD hydrofoil profile. The study by Liu and Tan [11] presented an innovative C-groove configuration aimed at both suppressing tip leakage vortices and optimizing the hydrodynamic performance of a NACA0009 hydrofoil in tidal energy converters. Huang et al. [12] examined how a novel T-shaped tip design influences energy efficiency, flow characteristics, and broadband noise generation in a NACA0009 hydrofoil configuration with tip clearance. Dang et al. [13] proposed a novel approach for flow noise reduction using microgrooved surfaces aligned in the streamwise direction, drawing inspiration from the morphological characteristics of shark skin. Kundu et al. [14] analyzed an S1210 hydrofoil, testing vortex generators and trailing edge modifications for tidal energy. Hu et al. [15] introduced a bending shrinkage groove (BSG) to suppress TLV and improve hydrofoil performance, then optimized its geometry. The team developed a C-groove design that enhances NACA0009 hydrofoil performance by reducing tip leakage vortices and cavitation in tidal energy systems [16]. Zhi et al. [17] used CFD to study how internal groove designs affect the hydrodynamic performance of a NACA0012 hydrofoil. Huang et al. [18] used k-ω SST turbulence modeling and broadband noise source analysis to study how C-grooves affect energy performance and noise generation (dipole/quadrupole sources) in NACA0009 hydrofoils. Tirandazi and Hidrovo [19] investigated how periodic and infinitely extended streamwise-aligned grooves affect laminar boundary layer development on flat plates across Reynolds numbers (Re1) ranging from 1000 to 25,000. Huang et al. [20] utilized doubly curved holes (DC holes) at 10–25% chord positions to generate passive jets for TLV suppression. Bi et al. [21] performed numerical simulations of gap flow with groove configurations to investigate the underlying mechanisms of cover groove effects on TLV. Wang et al. [22] proposed a novel water injection technique to control flow fields around NACA66 (MOD) hydrofoils during cloud cavitation. Chen et al. [23] developed parallel grooves on NACA0009 hydrofoils to enhance marine hydraulic machinery efficiency. Li et al. [24] applied humpback whale-inspired leading-edge protrusions to reduce hydrofoil cavitation. Kouser et al. [25] performed DNS of the flow around a superhydrophobic NACA0012 hydrofoil. Jiang et al. [26] reported that grooves in standard cavitation tests can induce undesirable additional cavitation effects. Chada et al. [27] introduced parallel grooves on hydrofoils to enhance marine hydraulic machinery efficiency. Han et al. [28] developed variable-depth (VD) grooves to control both TLV and TLVC in NACA0009 hydrofoils, proposing different depth-variation strategies for enhanced suppression. Jia et al. [29] examined a V-shaped groove on the suction surface to study cavitation flow and noise generation in NACA66 hydrofoils. Wang et al. [30] employed a NACA0009 hydrofoil to investigate shark-inspired riblets for TLV suppression, analyzing the underlying mechanisms through numerical simulations. Wang et al. [31] investigated how varying tip spacing dimensions affect both energy efficiency and acoustic emissions in NACA0009 hydrofoils. Zhang et al. [32] applied orthogonal empirical methods to develop a biomimetic wavy leading-edge design for hydrofoil optimization. Wang et al. [33] examined four asymmetric tip clearance configurations and their impacts on hydrofoil energy performance and cavitation behavior. Gu et al. [34] employed vortex identification techniques to determine the optimal chordwise position for effective large-scale vortex suppression on hydrofoil surfaces. Huang et al. [35] employed the flexural contraction groove and tip bulk method to boost energy efficiency and reduce tip leakage vortex (TLV) in a NACA0009 hydrofoil, optimizing its performance for tidal energy applications. Dong and Chenhao [36] analyzed a 3D hydrofoil model with varying slot widths using numerical simulations and experimental comparisons, examining how different slot depths and widths affect leakage flow dynamics and energy performance. Wang et al. [37] studied the impact of various bionic groove shapes—semicircular, rectangular, triangular, and trapezoidal—on tip leakage vortex behavior. Gu et al. [38] examined a hole-pit (HP) structure placed at the hydrofoil’s leading edge (2–25% chord position) to generate passive jets and flow separation, effectively reducing TLV structures. Wang et al. [39] proposed an innovative bionic wave-shaped tip design to enhance energy efficiency and control the tip leakage vortex (TLV). Gang et al. [40] conducted numerical simulations of the hydrofoil using ANSYS CFX software, analyzing its performance across various flow velocities.
In addition, some researchers have conducted experimental research in this field. Timoshevskiy et al. experimentally analyzed cavitation flow patterns around a 2D grooved hydrofoil, comparing its performance with the original hydrofoil design [41]. Maung et al. examined the structural behavior of a flexible composite hydrofoil manufactured through automated fiber placement (AFP) technology [42]. Kadivar et al. introduced a passive approach to stabilize transient cavitation dynamics at moderate Reynolds numbers [43]. Zaresharif et al. explored passive flow control methods to minimize cavitation effects in incompressible flows [44]. Xu et al. employed high-speed imaging and endoscopic PIV to analyze how hanging groove tab orientations affect TLV cavitation suppression on a NACA0012 hydrofoil [45]. Nichik et al. experimentally examined cavitation formation in the tip gap region, analyzing vortex dynamics and main cavity behavior on a rotating 2D symmetric hydrofoil [46]. Skripkin et al. experimentally investigated cavitation patterns around a NACA 0012 hydrofoil with varying surface morphologies [47]. Cao et al. employed high-speed imaging and paint coating analysis to study cavitation effects in hydrofoil tip clearance. Their findings revealed two distinct cavity types—tip separation and leakage vortex cavities—with the separation cavity being primarily responsible for impact behavior [48]. Qiu et al. examined the connection between cavitation structures and erosion, focusing on gap effects on cloud cavitation periodicity [49]. Tsoy et al. investigated periodic surface grooves as a passive control method for managing cavitation dynamics on hydrofoils [50].
Also, in some studies, both numerical and experimental methods have been used simultaneously. Li et al. experimentally and numerically analyzed how rotating body grooves influence cavitation behavior [51]. Kang et al. explored circumferential grooves for cavitation suppression [52]. Mita et al. examined the hydraulic performance of copper micro-pin-fin arrays in single-phase water flow [53]. Danlos et al. highlighted how unstable cavity dynamics on hydrofoils, nozzles, and turbine blades contribute to erosion, noise, and vibration issues [54]. A study by Komárek et al. investigated numerically and experimentally the unsteady cavitation flow around a NACA 2412 prismatic hydrofoil [55]. Cheng et al. proposed a novel control approach for tip leakage vortex (TLV) cavitation [56].
Previous research has investigated various grooves for flow control and related phenomena, but their focus has been mainly on grooves with different geometric shapes, such as T-shaped grooves. In this type of research, the main goal is to improve hydrodynamic performance, such as reducing drag or increasing lift, but the direct effect on hydrodynamic noise has been less specifically and purposefully investigated. In addition, these grooves themselves may be new sources of noise generation due to the creation of secondary flows and vortices.
In this study, the effect of designing parallel-axis grooves on reducing the hydrodynamic noise of the NACA0015 hydrofoil is numerically investigated using ANSYS Fluent software. Hydrofoils, as one of the key components in the marine and aerospace industries, always face the challenge of generating hydrodynamic noise, which can have adverse effects on the performance of systems and the environment.
Studies show that the phenomenon of noise generation in hydrofoils is mainly caused by three main factors: flow separation, unstable vortex formations, and surface pressure fluctuations. In this study, designing parallel-axis grooves as a passive solution to control this phenomenon is investigated. These grooves can have a significant effect on noise reduction by changing the flow pattern and reducing the intensity of vortices.
To carry out this study, first, a 3D modeling of a NACA0015 hydrofoil with a groove parallel to the hydrofoil axis is performed. Then, a comprehensive analysis of the flow field and pressure field around the hydrofoil is performed. In the next step, using computational acoustic methods, the noise spectrum produced is calculated, and the results are compared with the case of the hydrofoil without grooves. This comparison will include an investigation of various parameters such as sound pressure level, frequency distribution and noise directionality.
This study can have a significant impact on the design of low-noise hydrofoils for various applications including submarines, fast ships and water turbines. The results of this research can be used as a basis for future designs to reduce noise pollution in aquatic environments.

2. Formulation

The Navier–Stokes (N-S) equations are a set of nonlinear partial differential equations that mathematically describe the motion of viscous fluid materials. They represent Newton’s second law of motion F   =   m a as applied to fluid dynamics and account for forces such as pressure, viscous stresses, and external body forces (such as gravity) acting on a fluid element. These equations govern the conservation of momentum in fluid flow and are coupled with the continuity equation (conservation of mass) to form the fundamental basis of classical fluid mechanics. This law is based on the conservation of momentum, expressed in the Eulerian (field) reference frame as the balance between inertial forces and the sum of pressure, viscous, and external forces acting on a fluid element as:
Σ F = D ( m v ) D t = ( m v ) t + ( m v ) x x t + ( m v ) y y t + ( m v ) z z t
where F is the force, m is the mass and t is the time. The spatial derivative terms in the governing equations emerge from adopting the Eulerian perspective, which analyzes momentum changes by observing fluid properties at fixed points in space rather than following individual fluid particles.

2.1. Momentum Change by Convection

The total momentum change in a fluid element consists of both temporal and spatial components: the local acceleration term ( / t ) accounts for unsteady effects, while the convective derivative ( u · ) represents momentum transport due to fluid motion through spatial gradients in the flow field.
M c o n v = m v t d t + m v x d x 𝚤 + m v y d y 𝚥 + ( m v ) z k
And momentum change by convection per time will be calculated as:
M c o n v , t = t m v t d t + m v x d x 𝚤 + m v y d y 𝚥 + ( m v ) z k
Rewritten convection terms of the momentum change per time:
M c o n v , t = m v t   + m v x d x d t   𝚤 + m v y d y d t 𝚥 + m v z d z d t k
In fluid dynamics, analyzing a microscopically small control volume (dxdydz) with spatially invariant density allows simplification of the governing equations. Under these conditions, the convective terms—representing the transport of momentum or mass due to bulk fluid motion—take the following form in the mathematical formulation:
M c o n v , t = ρ v t   + v x d x d t   𝚤 + v y d y d t 𝚥 + v z d z d t k d x d y d z
In this context, the terms dx/dt, dy/dt, and dz/dt denote the velocity components along the x, y, and z axes, respectively. The rate of momentum changes with respect to time, calculated per unit volume, is expressed as:
M c o n v , t = ρ v t   + v x v x   𝚤 + v y v y 𝚥 + v z v z k
Physical significance: The terms quantify convective momentum flux caused by organized fluid flow. Formally, they represent the inertial acceleration term equivalent to “ma” in the fundamental equation of motion “ F   =   m a ”.
The Navier–Stokes equations describe fluid motion by accounting for both acceleration and the forces acting on the fluid. Similarly to solid mechanics, various forces can influence a fluid, depending on the problem’s specific conditions. While some forces, such as gravity, are universally present and must always be explicitly included, others may only appear in certain scenarios. The equations essentially balance these forces (∑F) against the fluid’s inertial response, mirroring Newton’s second law of motion.

2.2. Derivation of Forcing Terms

In fluid mechanics, three fundamental forces perpetually influence every fluid system regardless of boundary conditions or flow regime. These omnipresent forces are gravitational force (acting throughout the fluid’s mass due to Earth’s pull), pressure force (resulting from spatial pressure variations within the fluid), and viscous force (arising from internal friction between fluid layers). Beyond these essential components, supplementary context-dependent forces like surface tension, electromagnetic effects, or Coriolis forces may become relevant in specific applications, particularly when analyzing complex or specialized fluid behavior under non-standard conditions.

2.2.1. Gravity

The gravitational force in fluid mechanics operates identically to solid mechanics, following Newton’s universal law of gravitation where F   =   m g . However, unlike discrete solids, fluids require distributed analysis since gravity acts continuously throughout the entire mass of the fluid.
F g r v + F p r s + F v i s c + F m i s c = ρ v t + v x v x 𝚤 + v y v y 𝚥 + v z v z k d x d y d z
The force of gravity is the same as it is in mechanics: m g or ρ g d x d y d z , therefore:
ρ g d x d y d z + F p r s + F v i s c + F m i s c = ρ v t + v x v x 𝚤 + v y v y 𝚥 + v z v z k d x d y d z
As a body force, gravity acts uniformly toward the mass center. Similarly to solid mechanics, we can apply “ΣF = ma” separately in each spatial direction for analysis thus:
ρ v t + v · v = ρ g + F
Based on how the x-y-z coordinate system is aligned, certain components may become negligible or cancel out.

2.2.2. Pressure

Pressure represents a normal surface stress that invariably acts perpendicular and inward on fluid control volume boundaries. This behavior mirrors the normal force encountered in mechanics. The resulting pressure force can be mathematically expressed as a function of pressure P:
F p r s = P d V = P d x d y d z
The gradient operation is performed along the same axis as the force components being analyzed. Specifically, when evaluating forces in the x-direction, the pressure gradient corresponds to the partial derivative P / x , so:
ρ v t + v · v = ρ g P + F
Pressure variations can originate from external influences (such as mechanical pumps) or emerge as secondary effects of fundamental forces (like gravitational acceleration generating hydrostatic pressure distributions).

2.2.3. Viscosity

The last fundamental force affecting fluid motion is viscous force, which manifests as shear stress acting parallel to fluid surfaces. This frictional resistance between fluid layers directly parallels the concept of sliding friction in solid mechanics. Similarly to pressure (which acts as a normal stress perpendicular to surfaces), viscous forces are mathematically described through spatial gradients:
F v i s c = τ d V = τ d x d y d z
while pressure involves a single force component acting normal to each coordinate direction, shear stress exhibits three distinct force components in every spatial direction so:
ρ v t + v · v = ρ g P + · τ + F
In Newtonian fluids, viscous shear stress exhibits a direct linear relationship with the rate of shear deformation, analogous to how Hooke’s law describes elastic behavior in solids. However, unlike solid materials, fluids fundamentally lack the ability to sustain static shear stresses—a property reflected by their zero Young’s modulus. This characteristic leads to an important distinction: while applied shear stresses produce unbounded strains over time in fluids, they generate well-defined, finite strain rates that govern viscous flow behavior. The viscous shear stress tensors are defined as follows:
τ x y = τ y x = μ ϵ ˙ x y + ϵ ˙ y x = μ t y x + t x y + μ v y x + v x y τ y z = τ z y = μ ϵ ˙ y z + ϵ ˙ z y = μ t z y + t y z + μ v z y + v y z τ x z = τ z x = μ ϵ ˙ x z + ϵ ˙ z x = μ t z x + t x z + μ v z x + v x z τ x x = 2 3 μ ( v ) + 2 μ v x x τ y y = 2 3 μ ( v ) + 2 μ v y y τ z z = 2 3 μ ( v ) + 2 μ v z z
By inserting the constitutive stress–strain rate relationships into the momentum conservation equations, we derive the fundamental Navier–Stokes equations governing Newtonian fluid dynamics:
ρ v t + v . v = ρ g P + μ · v
To conclude, the Navier–Stokes equations represent a balance where the combined effects of gravitational, pressure, and viscous forces equal the product of mass and acceleration:
F g r v + F p r s + F v i s c = m a

2.3. Ffowcs Williams-Hawkings (FW-H) Equation

The direct noise prediction method computationally solves appropriate fluid dynamics equations to simultaneously model both hydrodynamic sound generation and wave propagation. This approach is inherently expensive and challenging, requiring ultra-fine computational grids, high-precision numerical schemes, and acoustically non-reflective boundary conditions [14]. In contrast, acoustic analogy methods like the FW-H equation decouple sound propagation from its sources, enabling separate treatment of flow simulation and acoustic analysis. The FW-H solution derives both sound pressure spectra and overall sound pressure levels at observer points from oscillating surface pressures on hydrofoils.
The Lighthill equation serves as the fundamental basis for hydrodynamic noise prediction, derived from RANS and continuity equations, expressed as:
ρ t + x i ρ u i = Q
t ρ u i + x i ρ u i u j + p δ i j τ i j = F
Here, Q represents the volumetric source radiation rate per unit time, while F denotes the generalized force per unit volume. By subtracting the time derivative ( / t ) of Equation (16) from its spatial derivative ( / x i ), we obtain the following result:
2 ρ t 2 c 0 2 2 ρ = Q t F x i + 2 T i j x i x j
where the Lighthill stress tensor, denoted by T i j , is mathematically defined by the following expression [14]:
T i j = ρ u i u j + τ i j c 0 2 ρ δ i j
For solid wall turbulence, the general solution to Equation (18) can be written as:
ρ ( x ~ , t ) ρ 0 = 1 4 π c 2 2 x i x j V   T i j y ~ , t r c r   d V ( y ~ ) 1 4 π c 2 x i V   P i y ~ , t r c r   d V ( y ~ )
P i = l j p i j
Here, l j represents the direction cosines normal to the source surface S. For a flat plate boundary layer flow, these components are oriented outward with l 1 = l 3 = 0 and l 2 = 1 . Consequently, the surface pressures become P 1 = σ 12 (wall shear stress p 12 ), P 2 = p (static pressure), and P 3 = σ 32 (wall shear stress p 32 ). Substituting these P i terms into Equation (20) yields the following acoustic pressure equation:
ρ ( x ~ , t ) = 1 4 π 2 x i x j 2 V T i j r d V ( y ~ ) 1 2 π x 1 S σ 12 r d S ( y ~ ) 1 2 π x 3 S σ 32 r d S ( y ~ )
Subsequently, further transformation is performed to obtain a formulation suitable for engineering calculations of hydrodynamic sound pressure:
ρ x ~ , t = 1 4 π c 2 x i x j r 3 2 V 2 T i j t 2 d V y ~ + 1 2 π c x r 2 S σ 12 t d S ( y ~ ) + 1 2 π c z r 2 S σ 32 t d S ( y ~ )

3. Numerical Model

The geometry studied in this study is a NACA0015 hydrofoil, whose two-dimensional shape is shown in Figure 1. For this study, a hydrofoil with a length of 100 mm is considered.
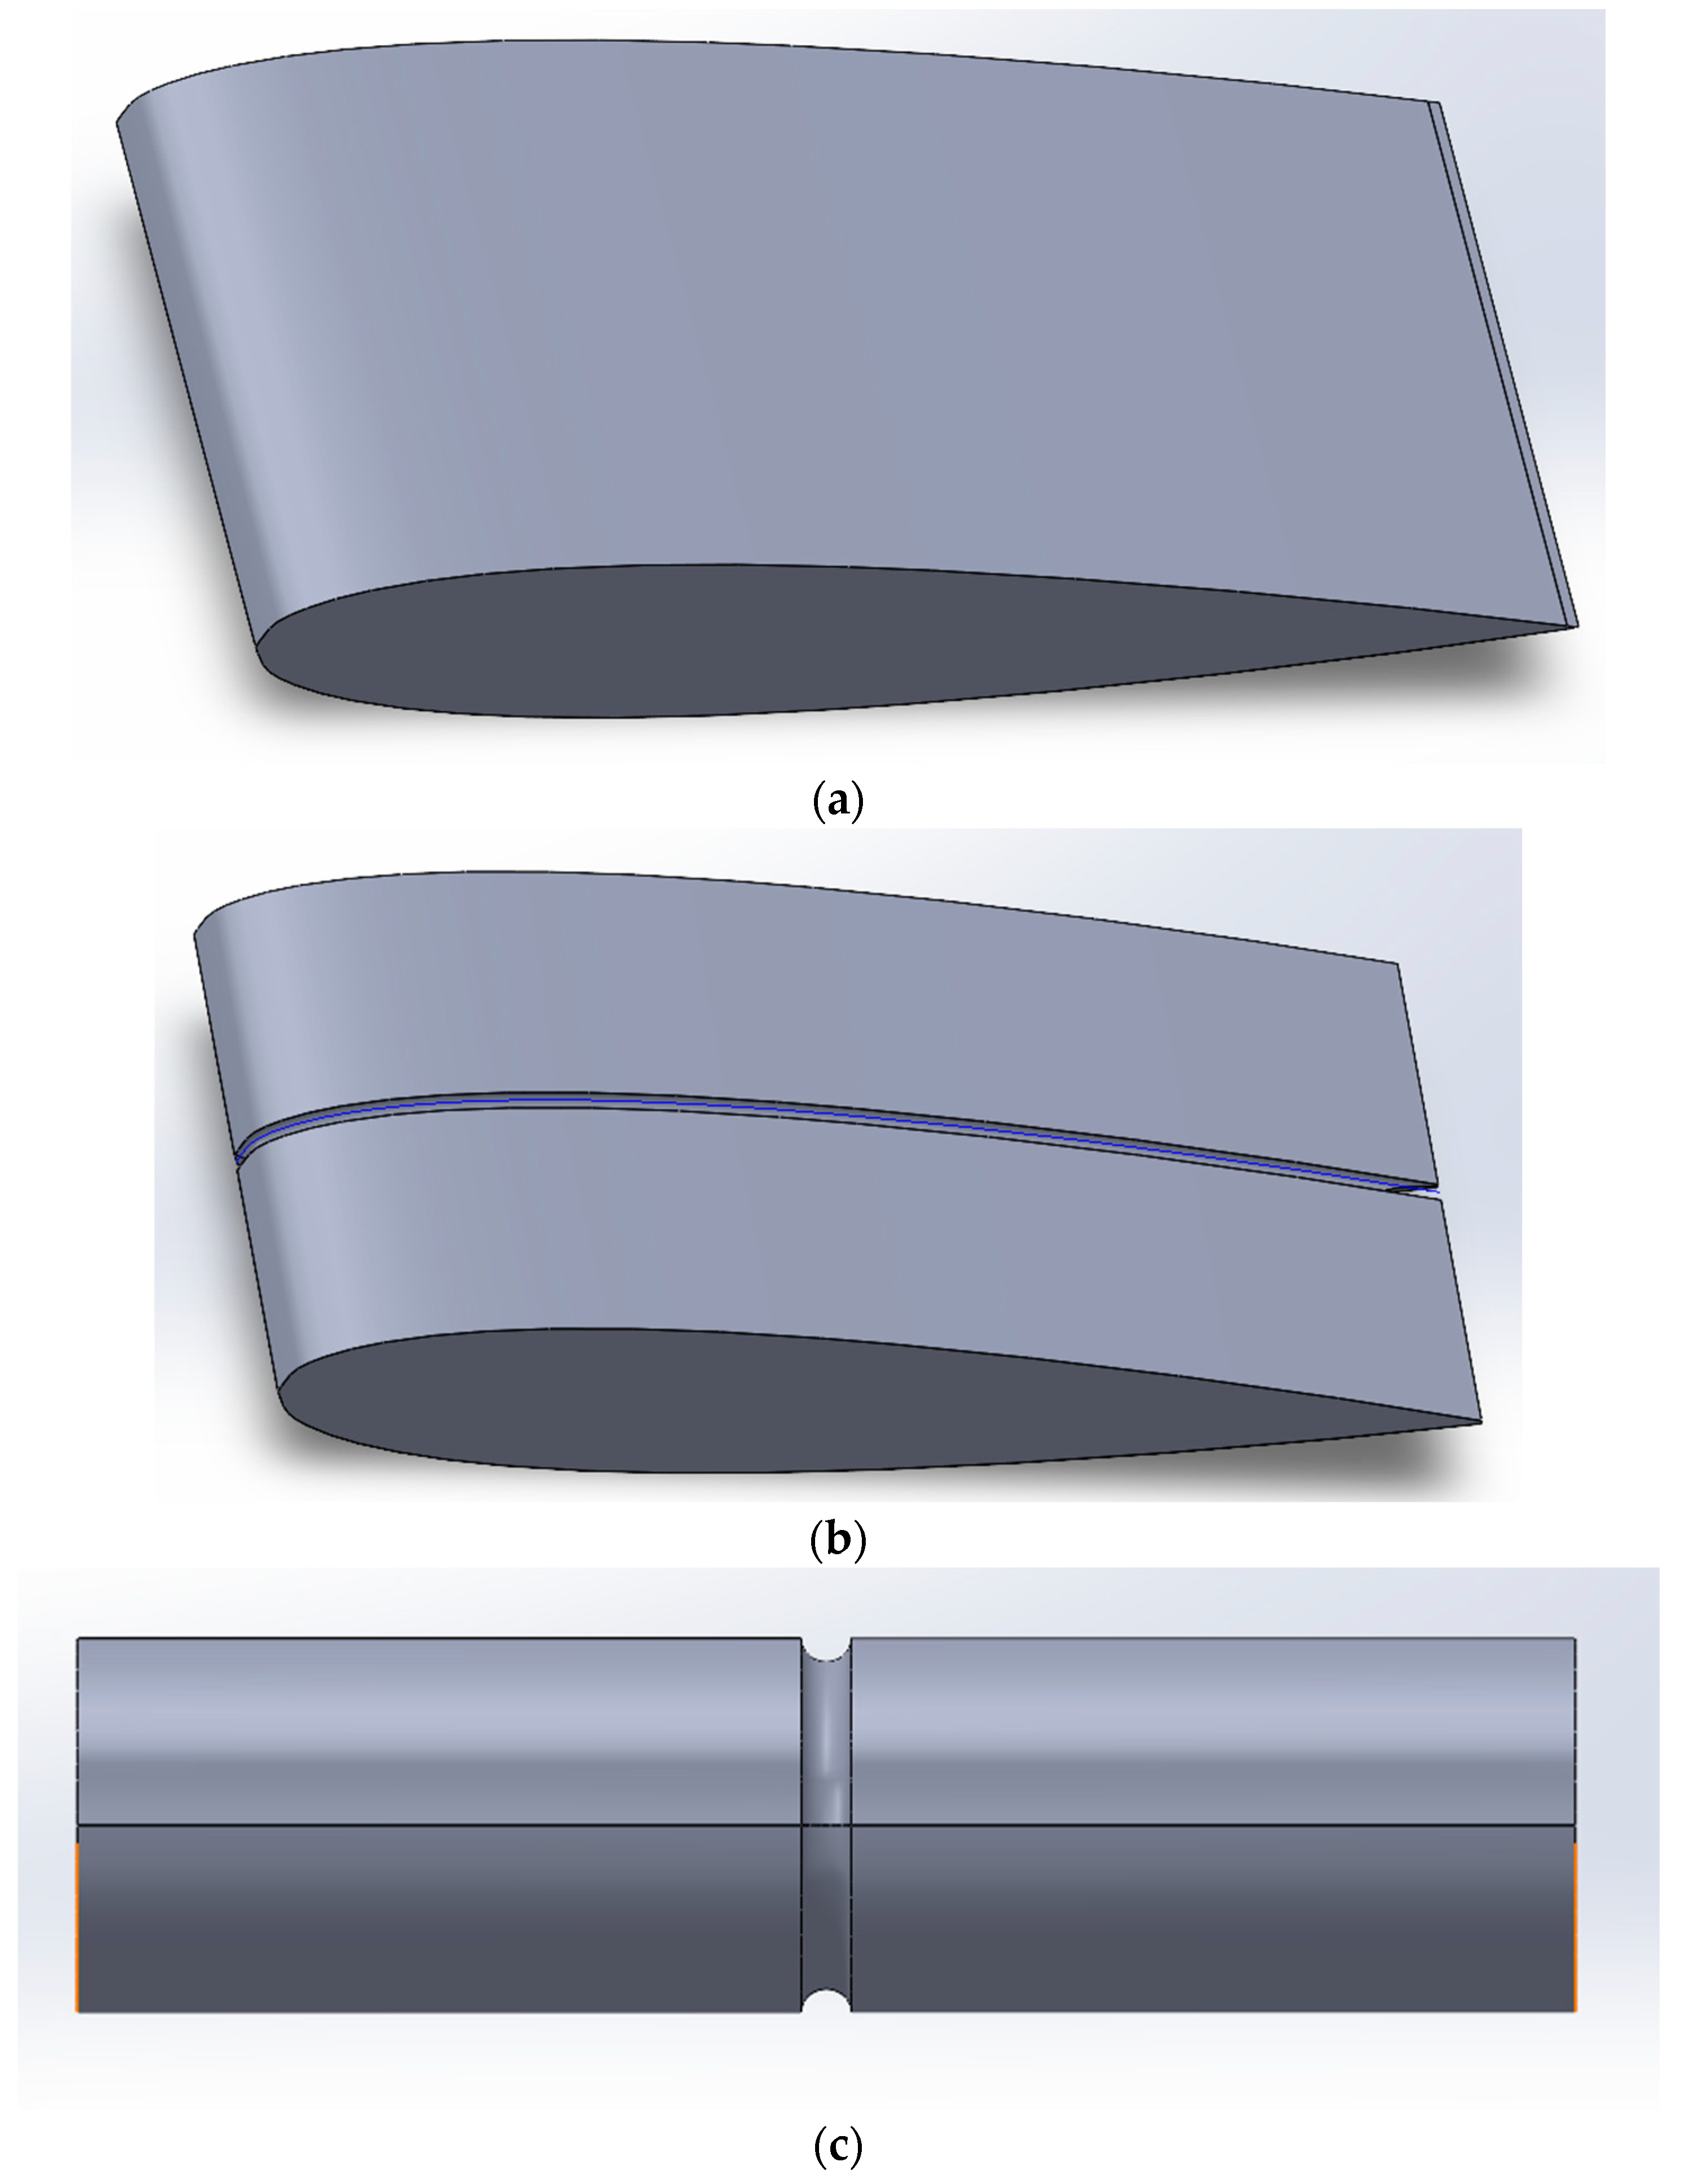
After drawing this hydrofoil in two dimensions, by giving volume to this two-dimensional drawing in SolidWorks 2024 software, a three-dimensional hydrofoil with a width of 300 mm will be obtained as shown in Figure 2. Since the aim of this study is to investigate the effect of the longitudinal groove on the noise signal generated by the hydrofoil, it is necessary to create a groove along the length of the hydrofoil. The image of the hydrofoil with a groove with a circular cross-section of 10 mm in diameter is shown in Figure 2.
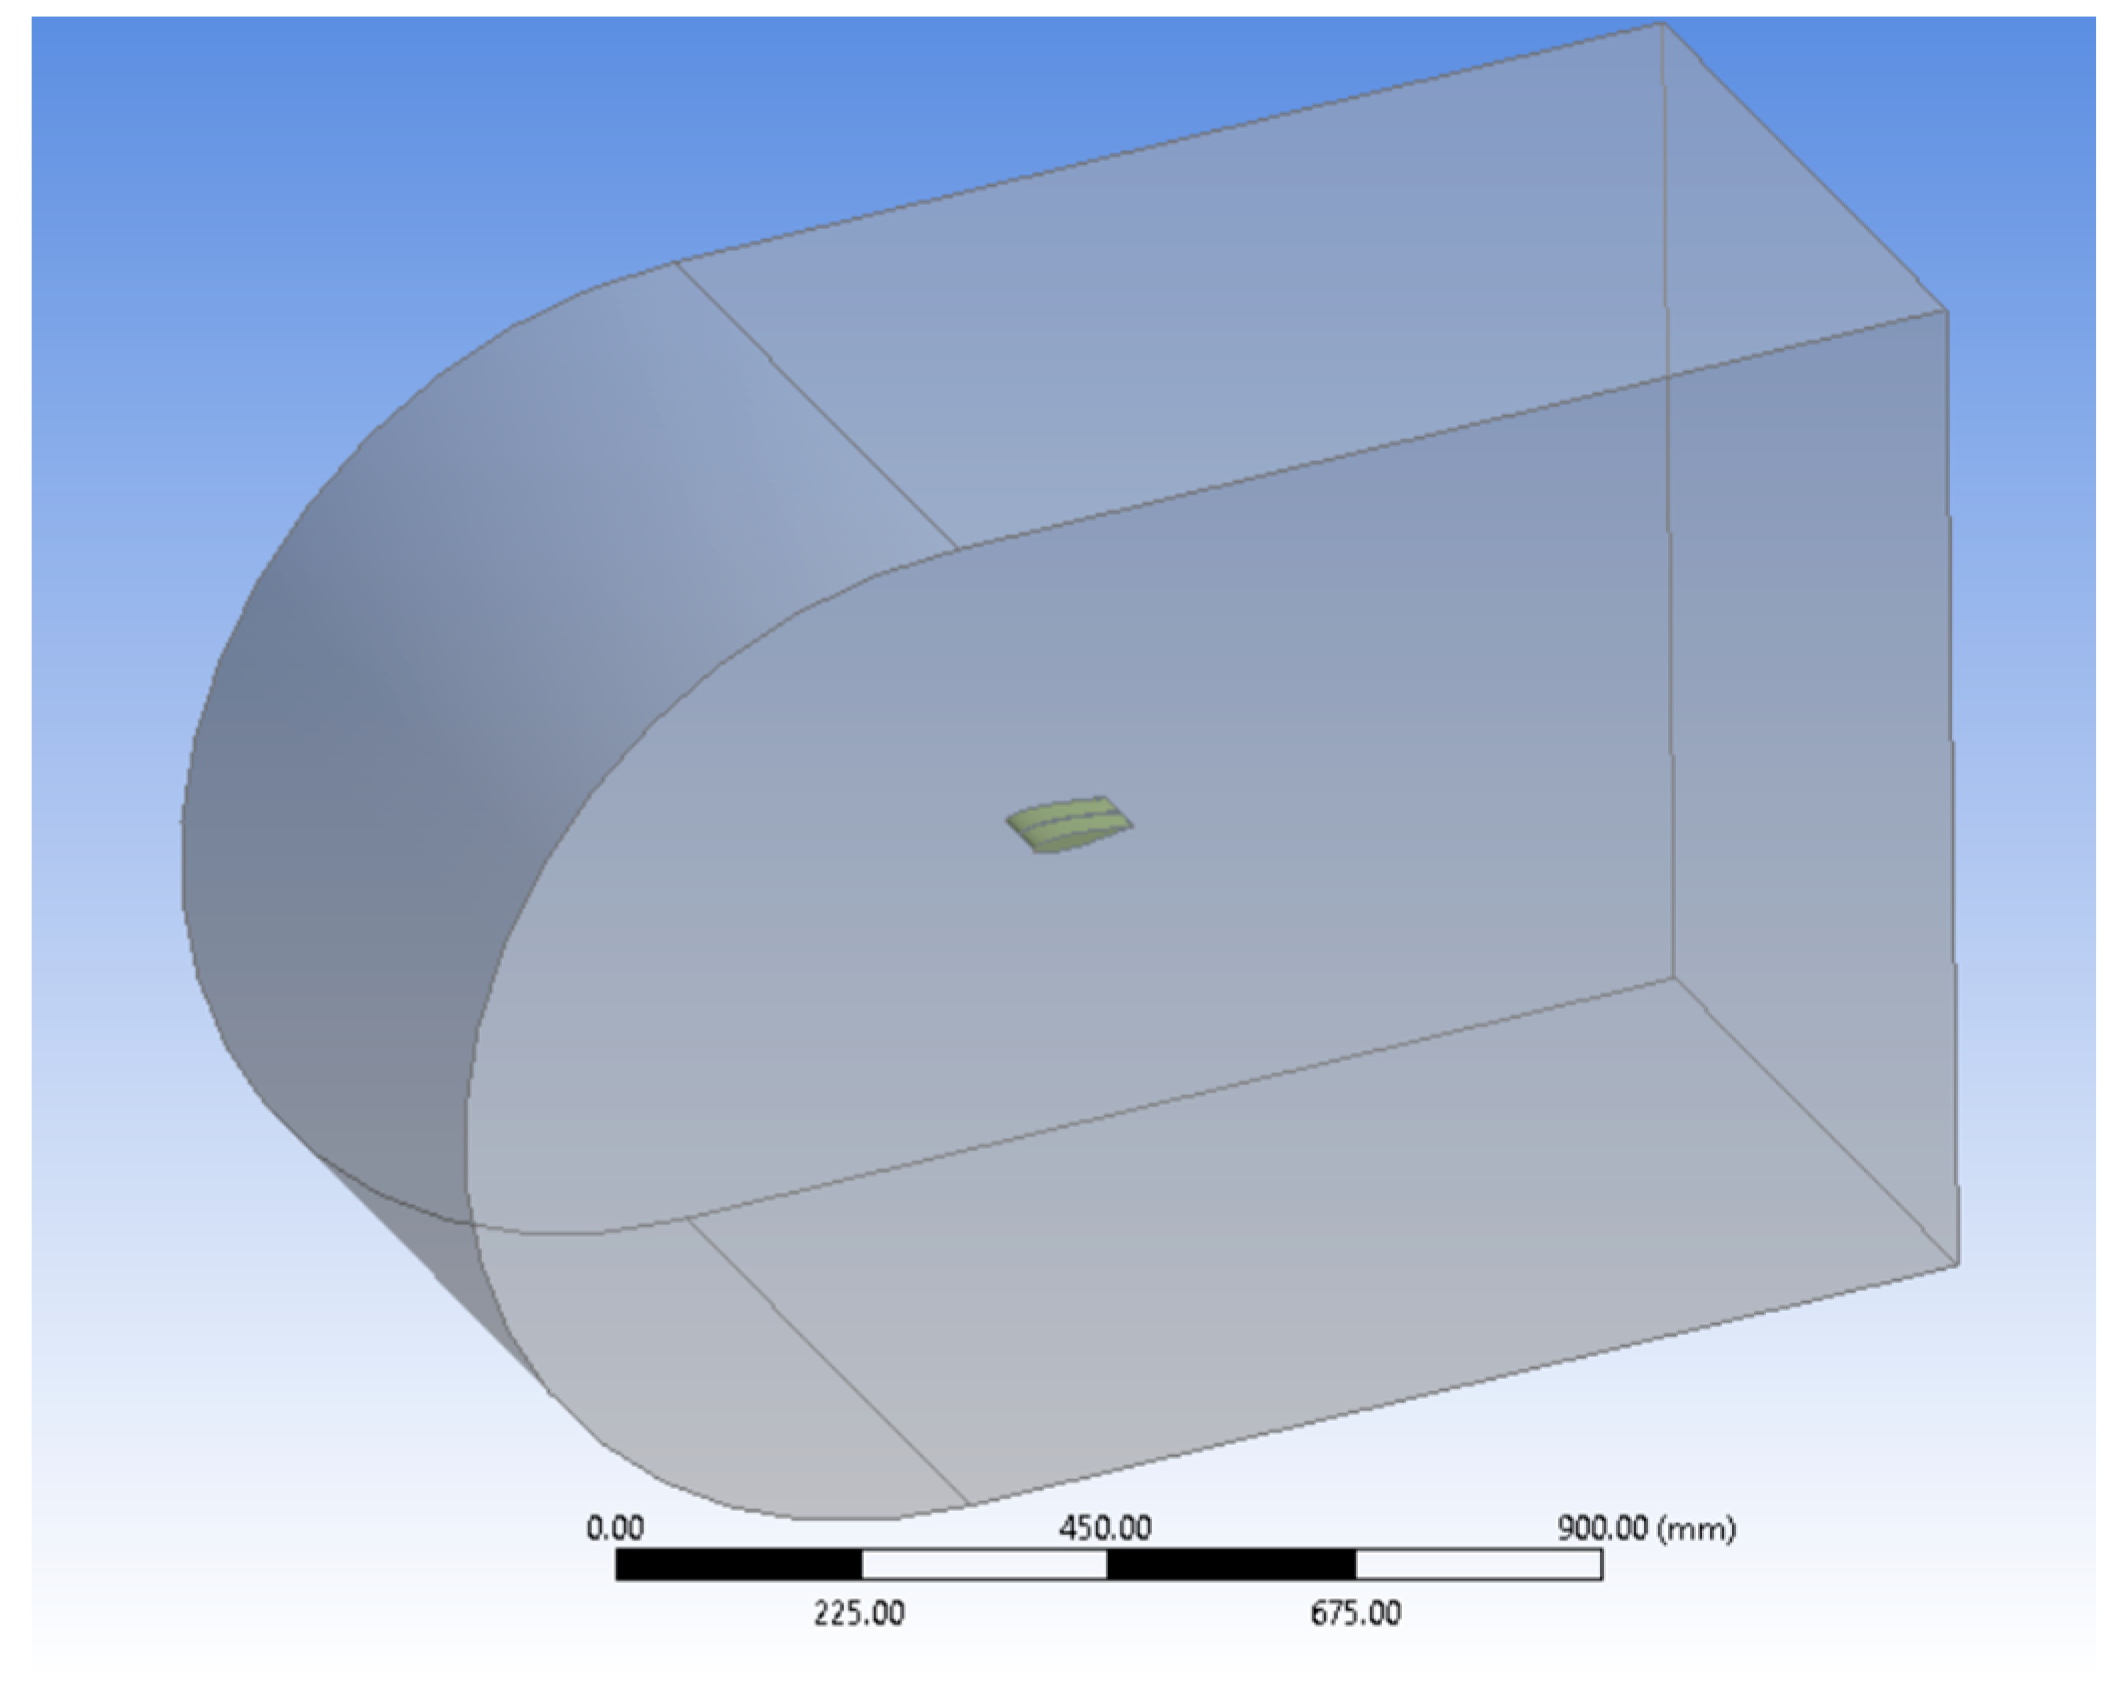
After the desired hydrofoil geometry is modeled, it is necessary to design the analysis environment (control volume) around this hydrofoil. According to reference [57], the ratio of the width and height of the inlet cross-section of the control volume to the chord length of the hydrofoil should be at least equal to one and the ratio of the length of this space to the chord length should be at least 7.5. For this purpose, a control volume with a length and height of 1000 mm, and a width of 600 mm, is created around this hydrofoil, as shown in Figure 3.
For this analysis, the LES model is chosen. According to what is mentioned in reference [58], the use of the LES model gives very good accuracy to the results of the hydrofoil analysis. It is also mentioned in reference [59] that this model is the best method for simulating the hydrofoil. The Smagorinsky–Lilly subscale model with a factor of 0.1 was used. A structured mesh with 18.7 million elements was used, and a mesh independence study confirmed the adequacy of the network. The value of y+ was always kept less than 1. To generate turbulence at the inlet, the Vortex Method with a turbulence intensity of 0.5% was used.
To perform acoustic analysis, it is necessary to determine the location of the noise receivers. Table 1 presents the coordinates of the location of the noise receivers.
It should be noted that the initial point of the hydrofoil is in contact with the origin of coordinates, its length is 100 mm, and its width is 30 mm on each side.

4. Mesh Independence

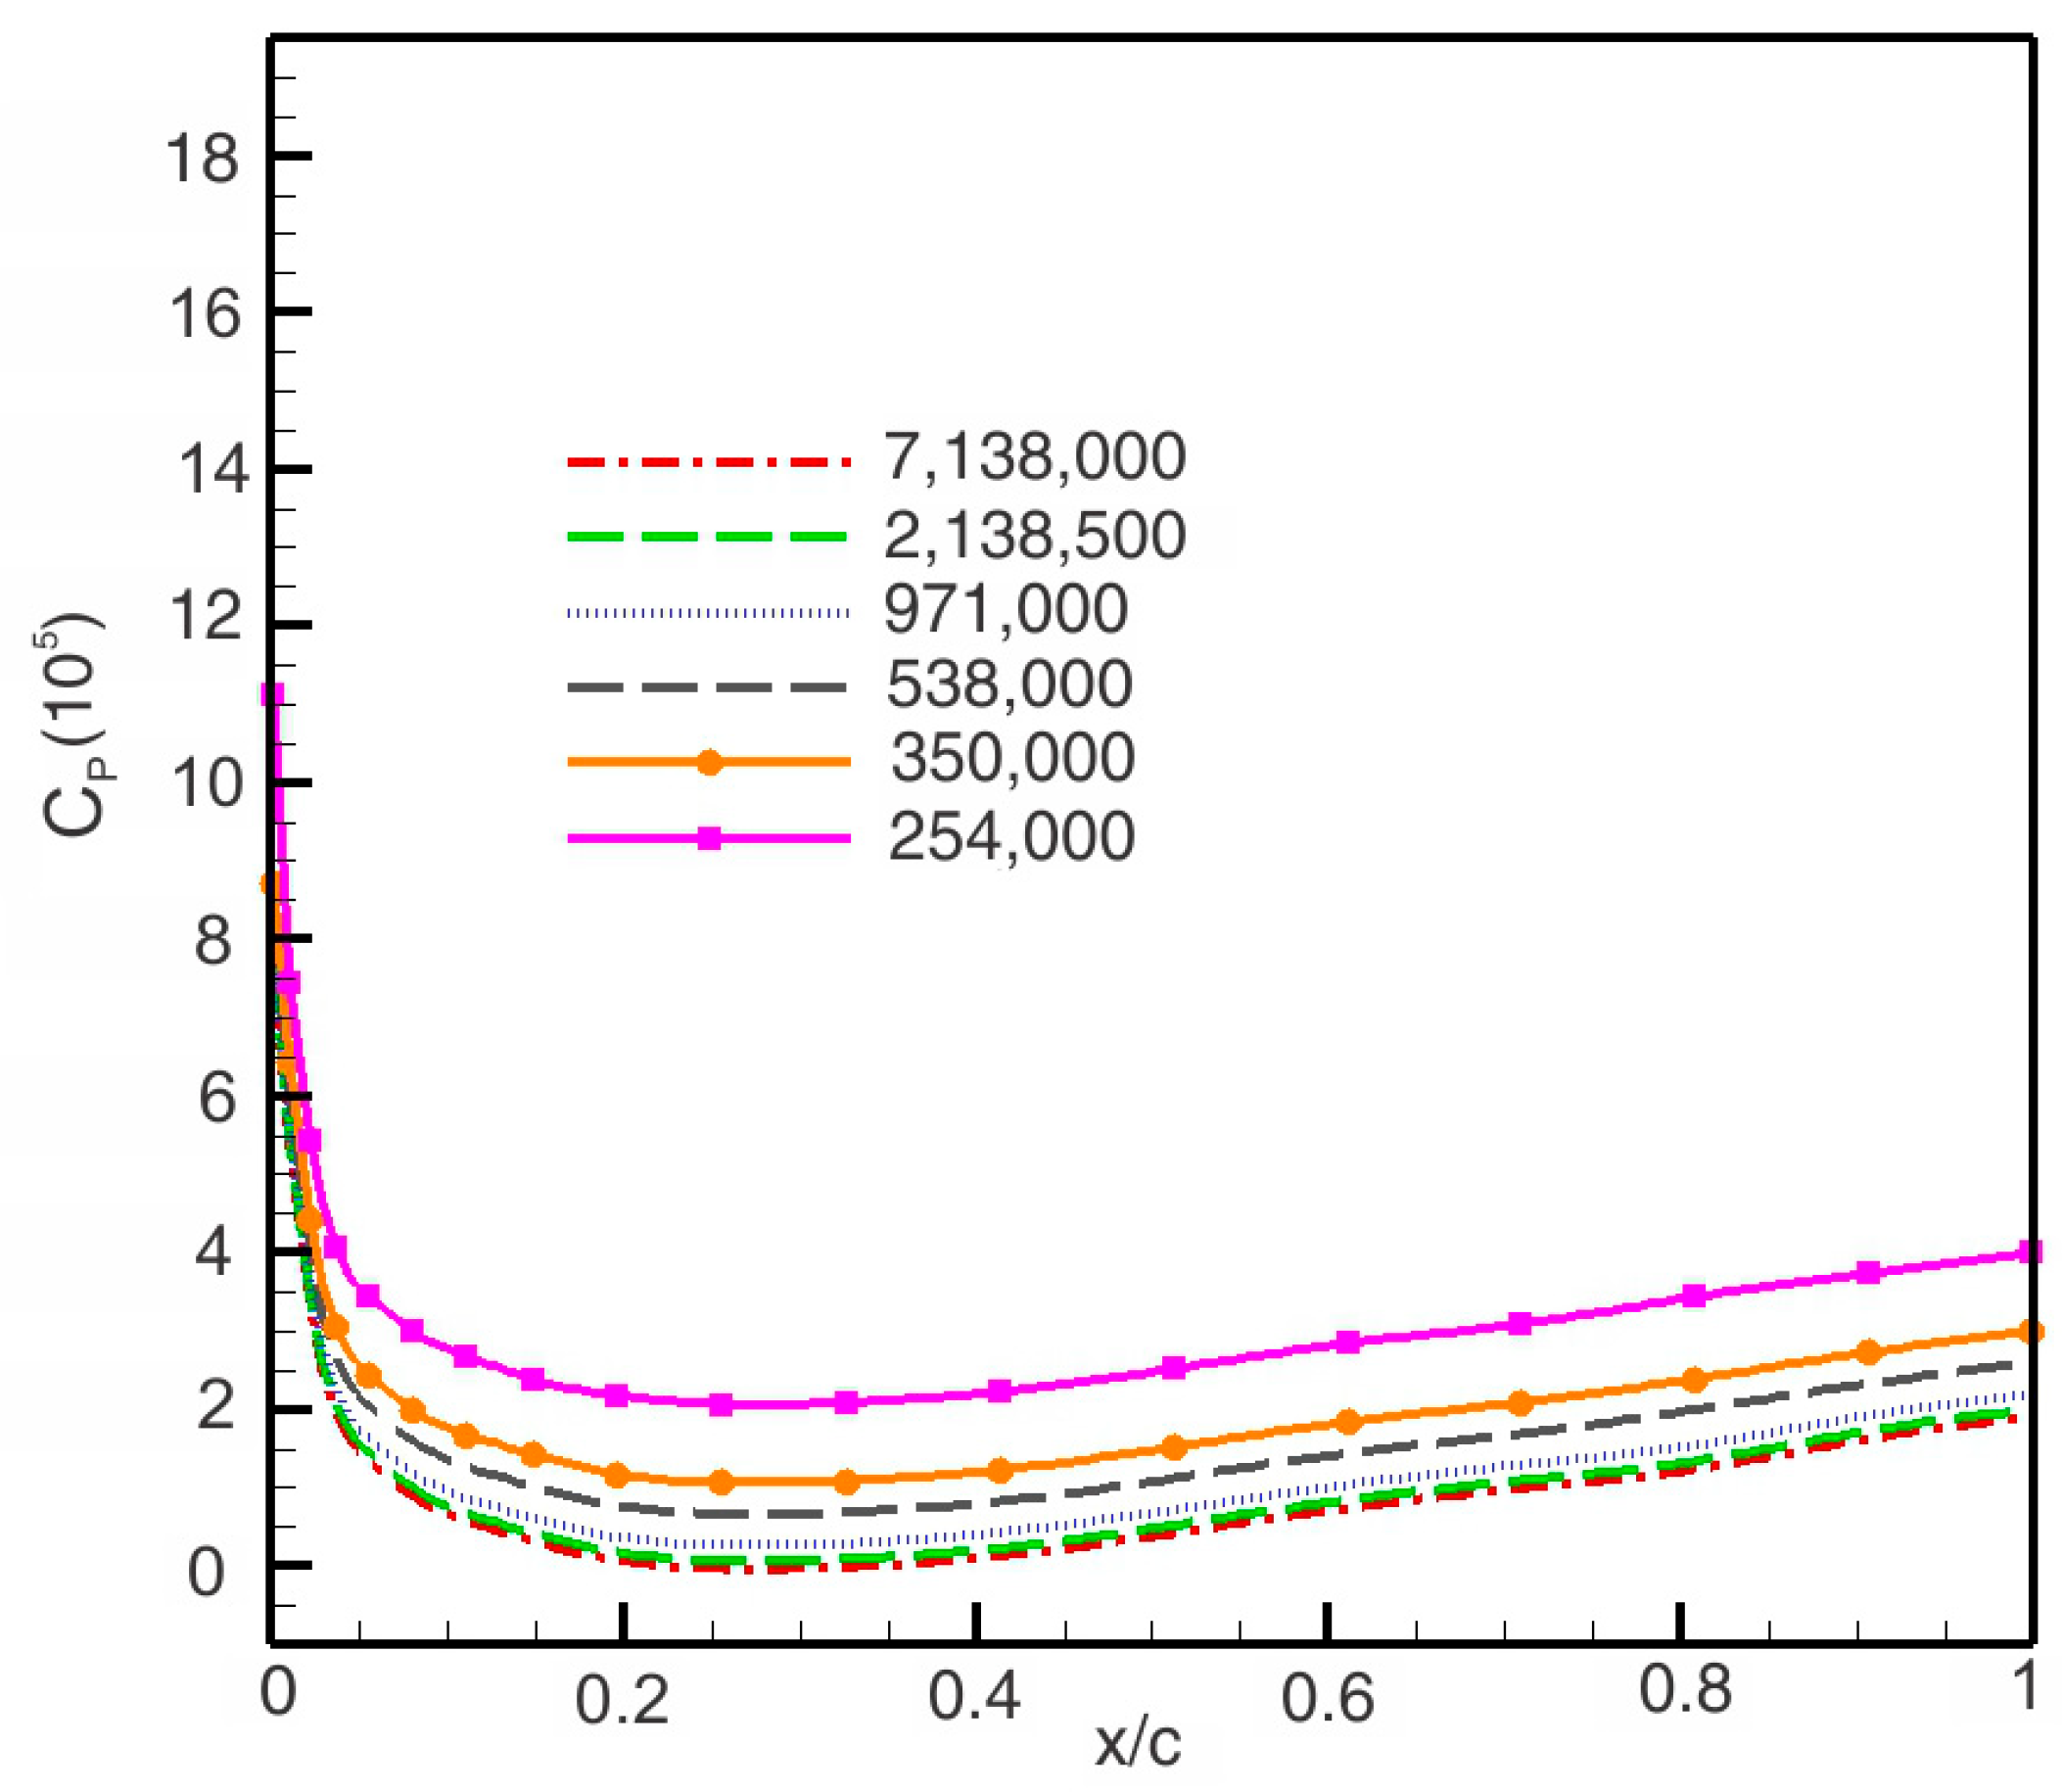
Assuming a speed of 27 knots (50 km/h) for the water flow, the effect of the number of tetrahedral elements used to discretize the control volume was investigated, and the pressure coefficient profile obtained at different points on the hydrofoil surface is shown in Figure 4. At the outlet of the control volume, the relative pressure is assumed to be zero, and a no-slip condition is assumed on the hydrofoil walls. These conditions are also maintained for the remainder of the analysis.
The horizontal axis in the above figure represents the value of the x component relative to the hydrofoil chord length (dimensionless space) and the vertical axis represents the pressure coefficient. As can be seen in this figure, with the increase in the number of elements used, the pressure coefficient profile graphs become closer to each other. So that the largest difference obtained between the pressure coefficient values for the number of elements 1,783,000 and 218,500 is less than 1 percent, which indicates the independence of finding a numerical solution from the solution grid. Therefore, it is possible to use 218,500 elements or more to continue the analysis.

5. Validation

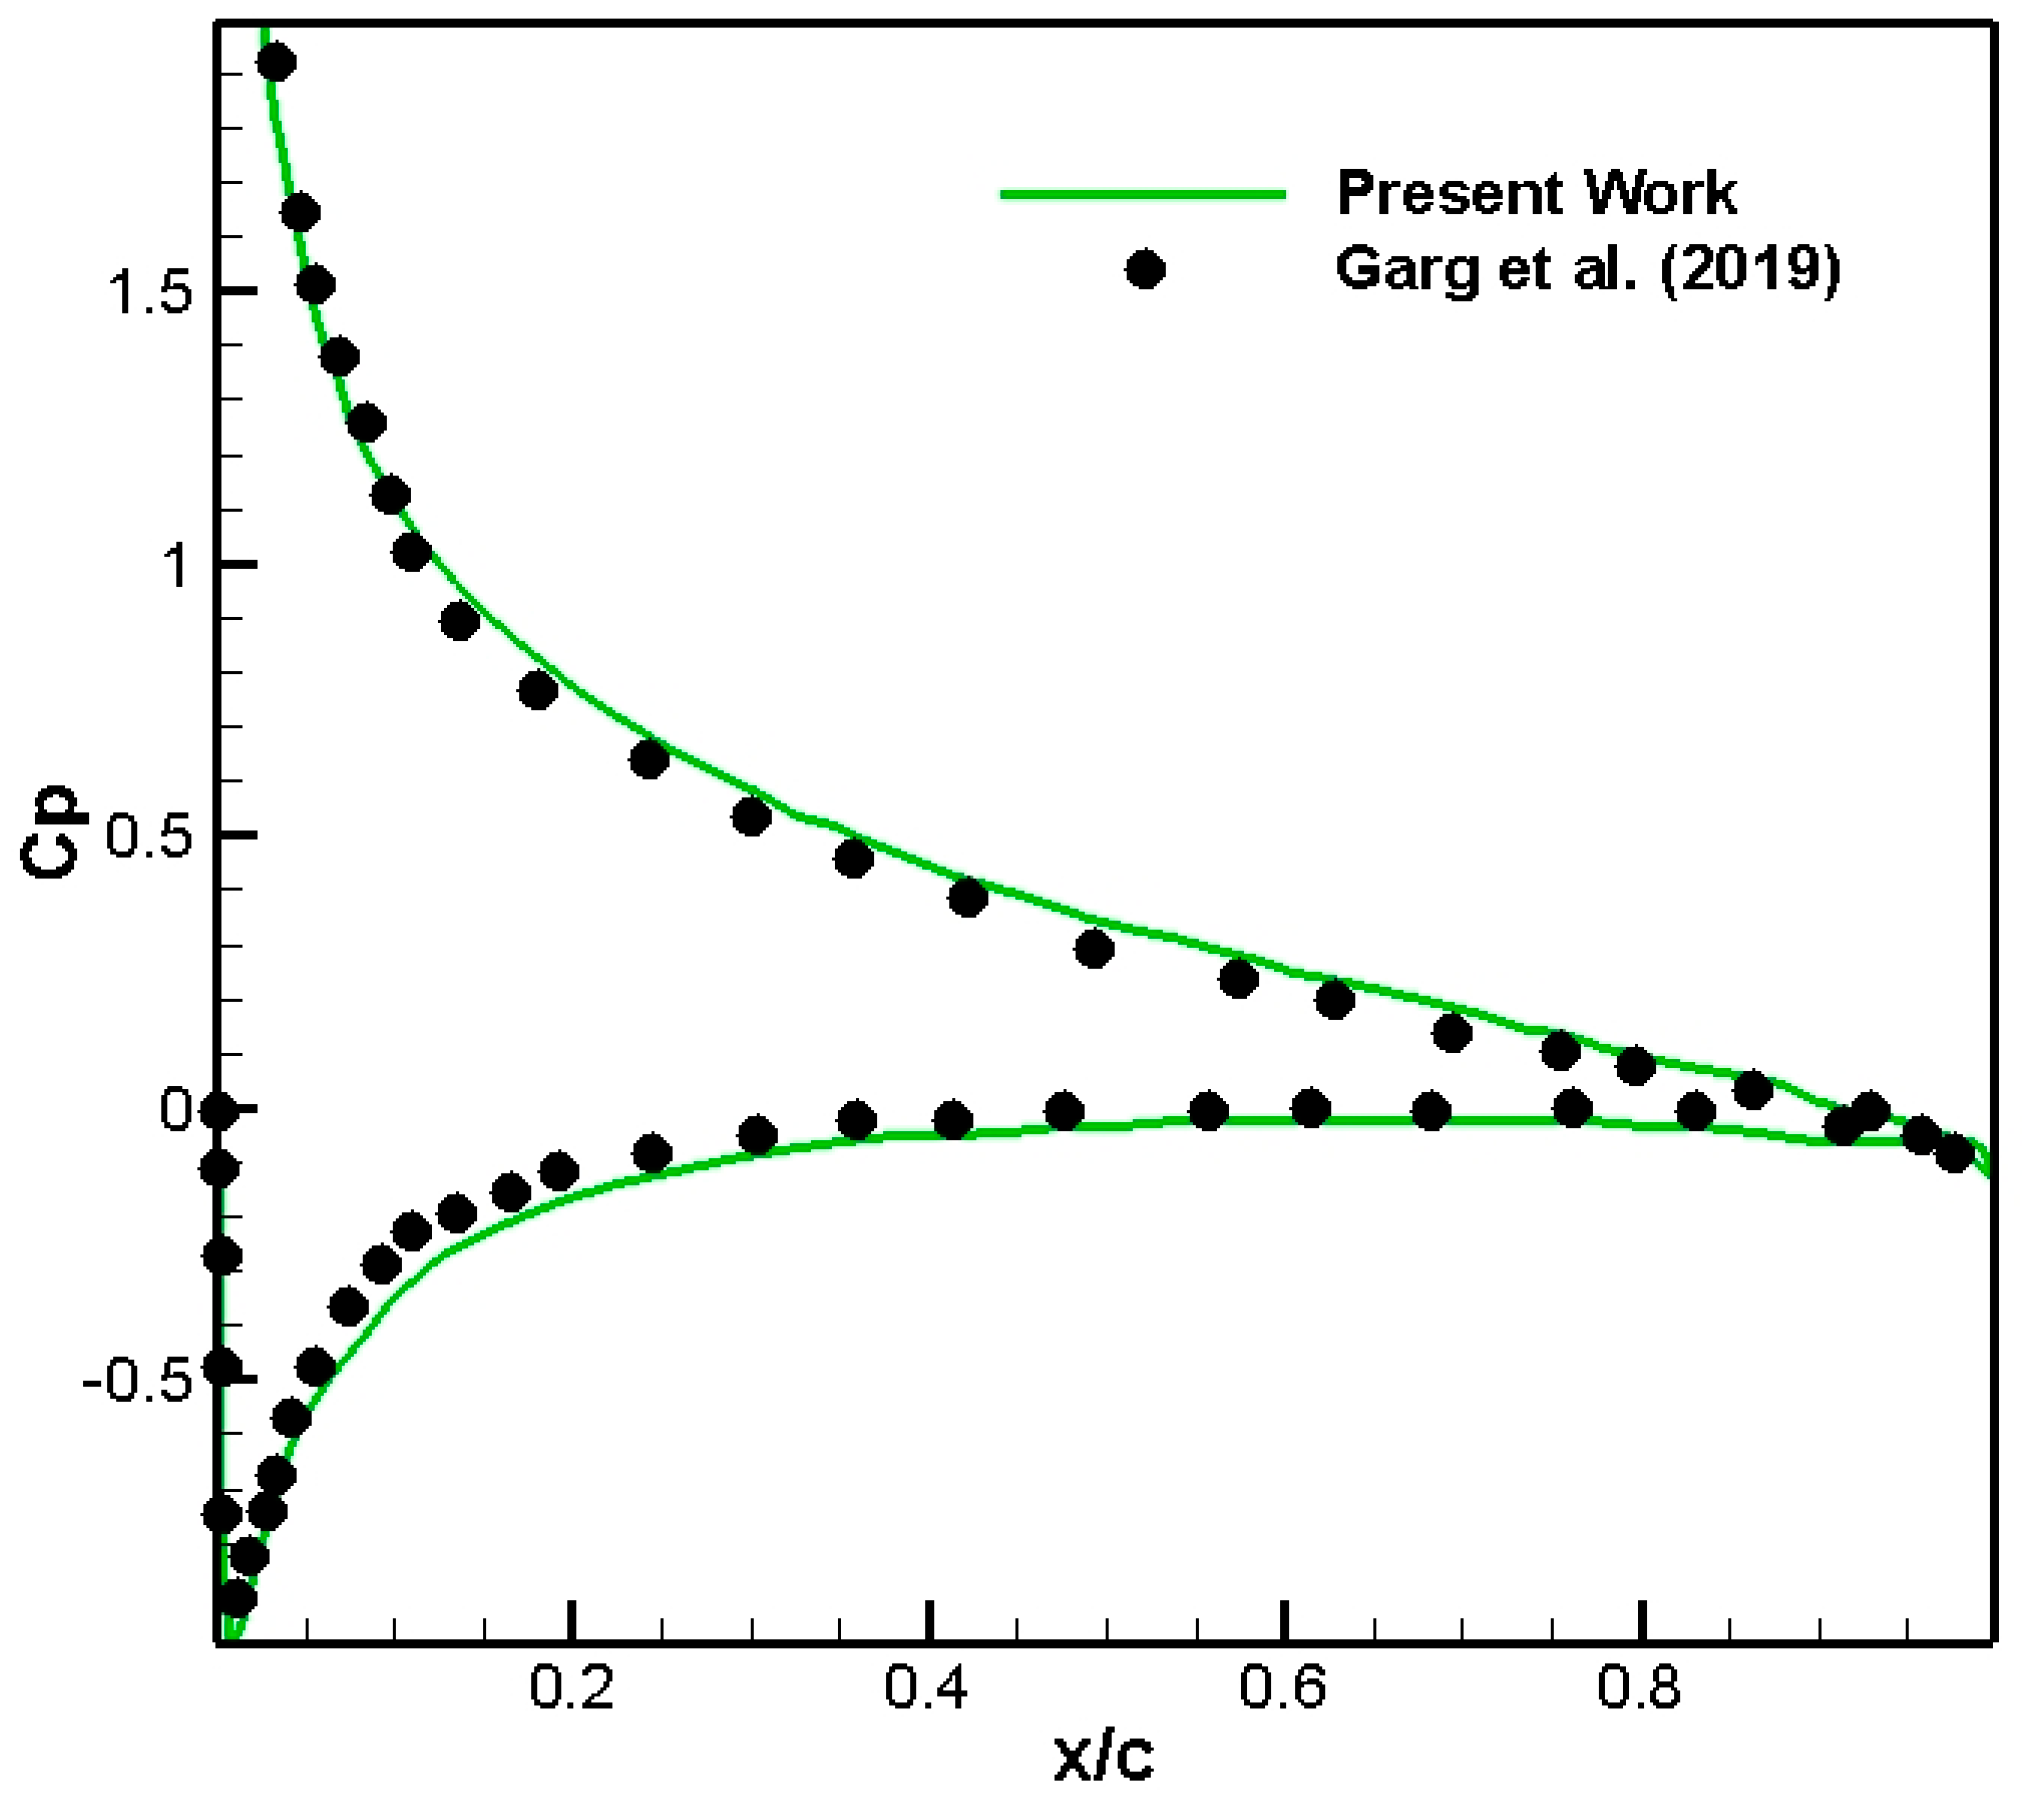
In order to verify the accuracy of the results obtained in this study, the environment of this study was analyzed and compared under the conditions mentioned in reference [60]. For this purpose, the pressure coefficient at different points of the hydrofoil cross-section in the aforementioned study and what was obtained in the present analysis were examined and compared and are shown in Figure 5.
As shown in the above figure, the results calculated under the settings made in this study and under the reference conditions [60], which is an experimental and laboratory study, have a good agreement and the maximum difference calculated for the graphs presented in the above figure is equal to 2.17%, which theoretically shows the desired accuracy of the results of the present analysis. Therefore, it can be said that the results obtained in this study have a suitable and acceptable accuracy and we can continue the analysis with confidence in their accuracy.

6. Results

6.1. Contours

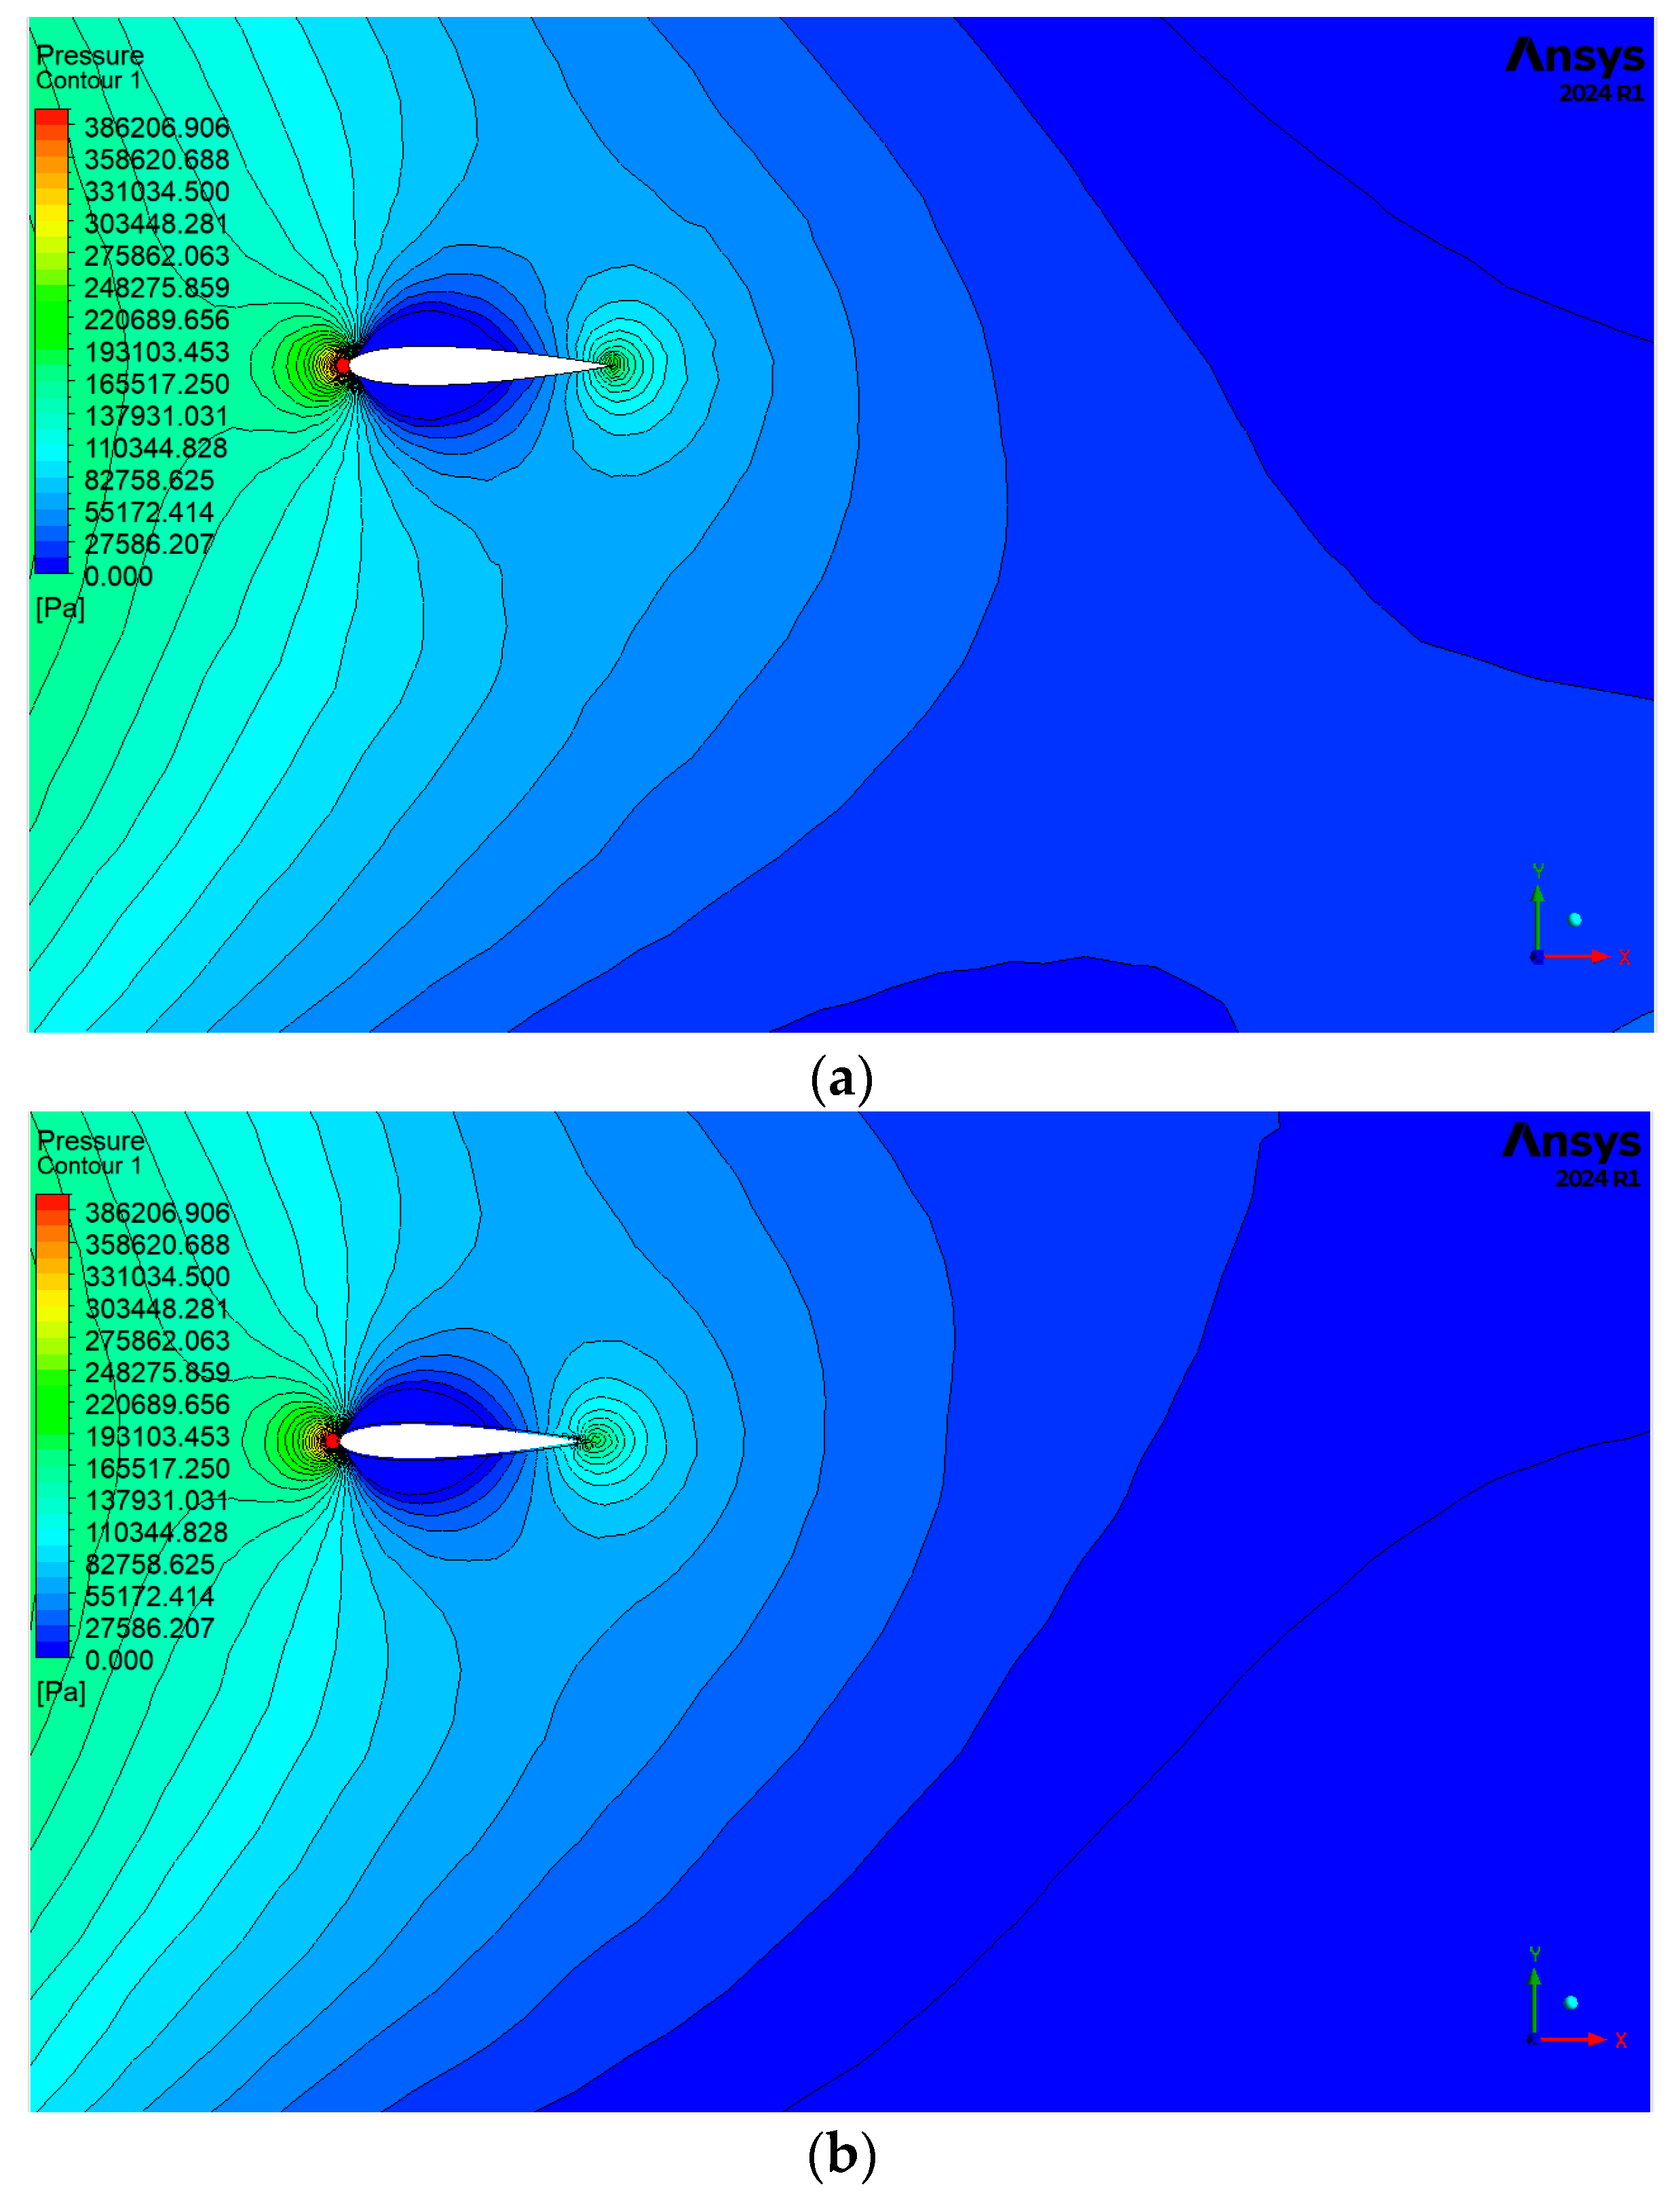
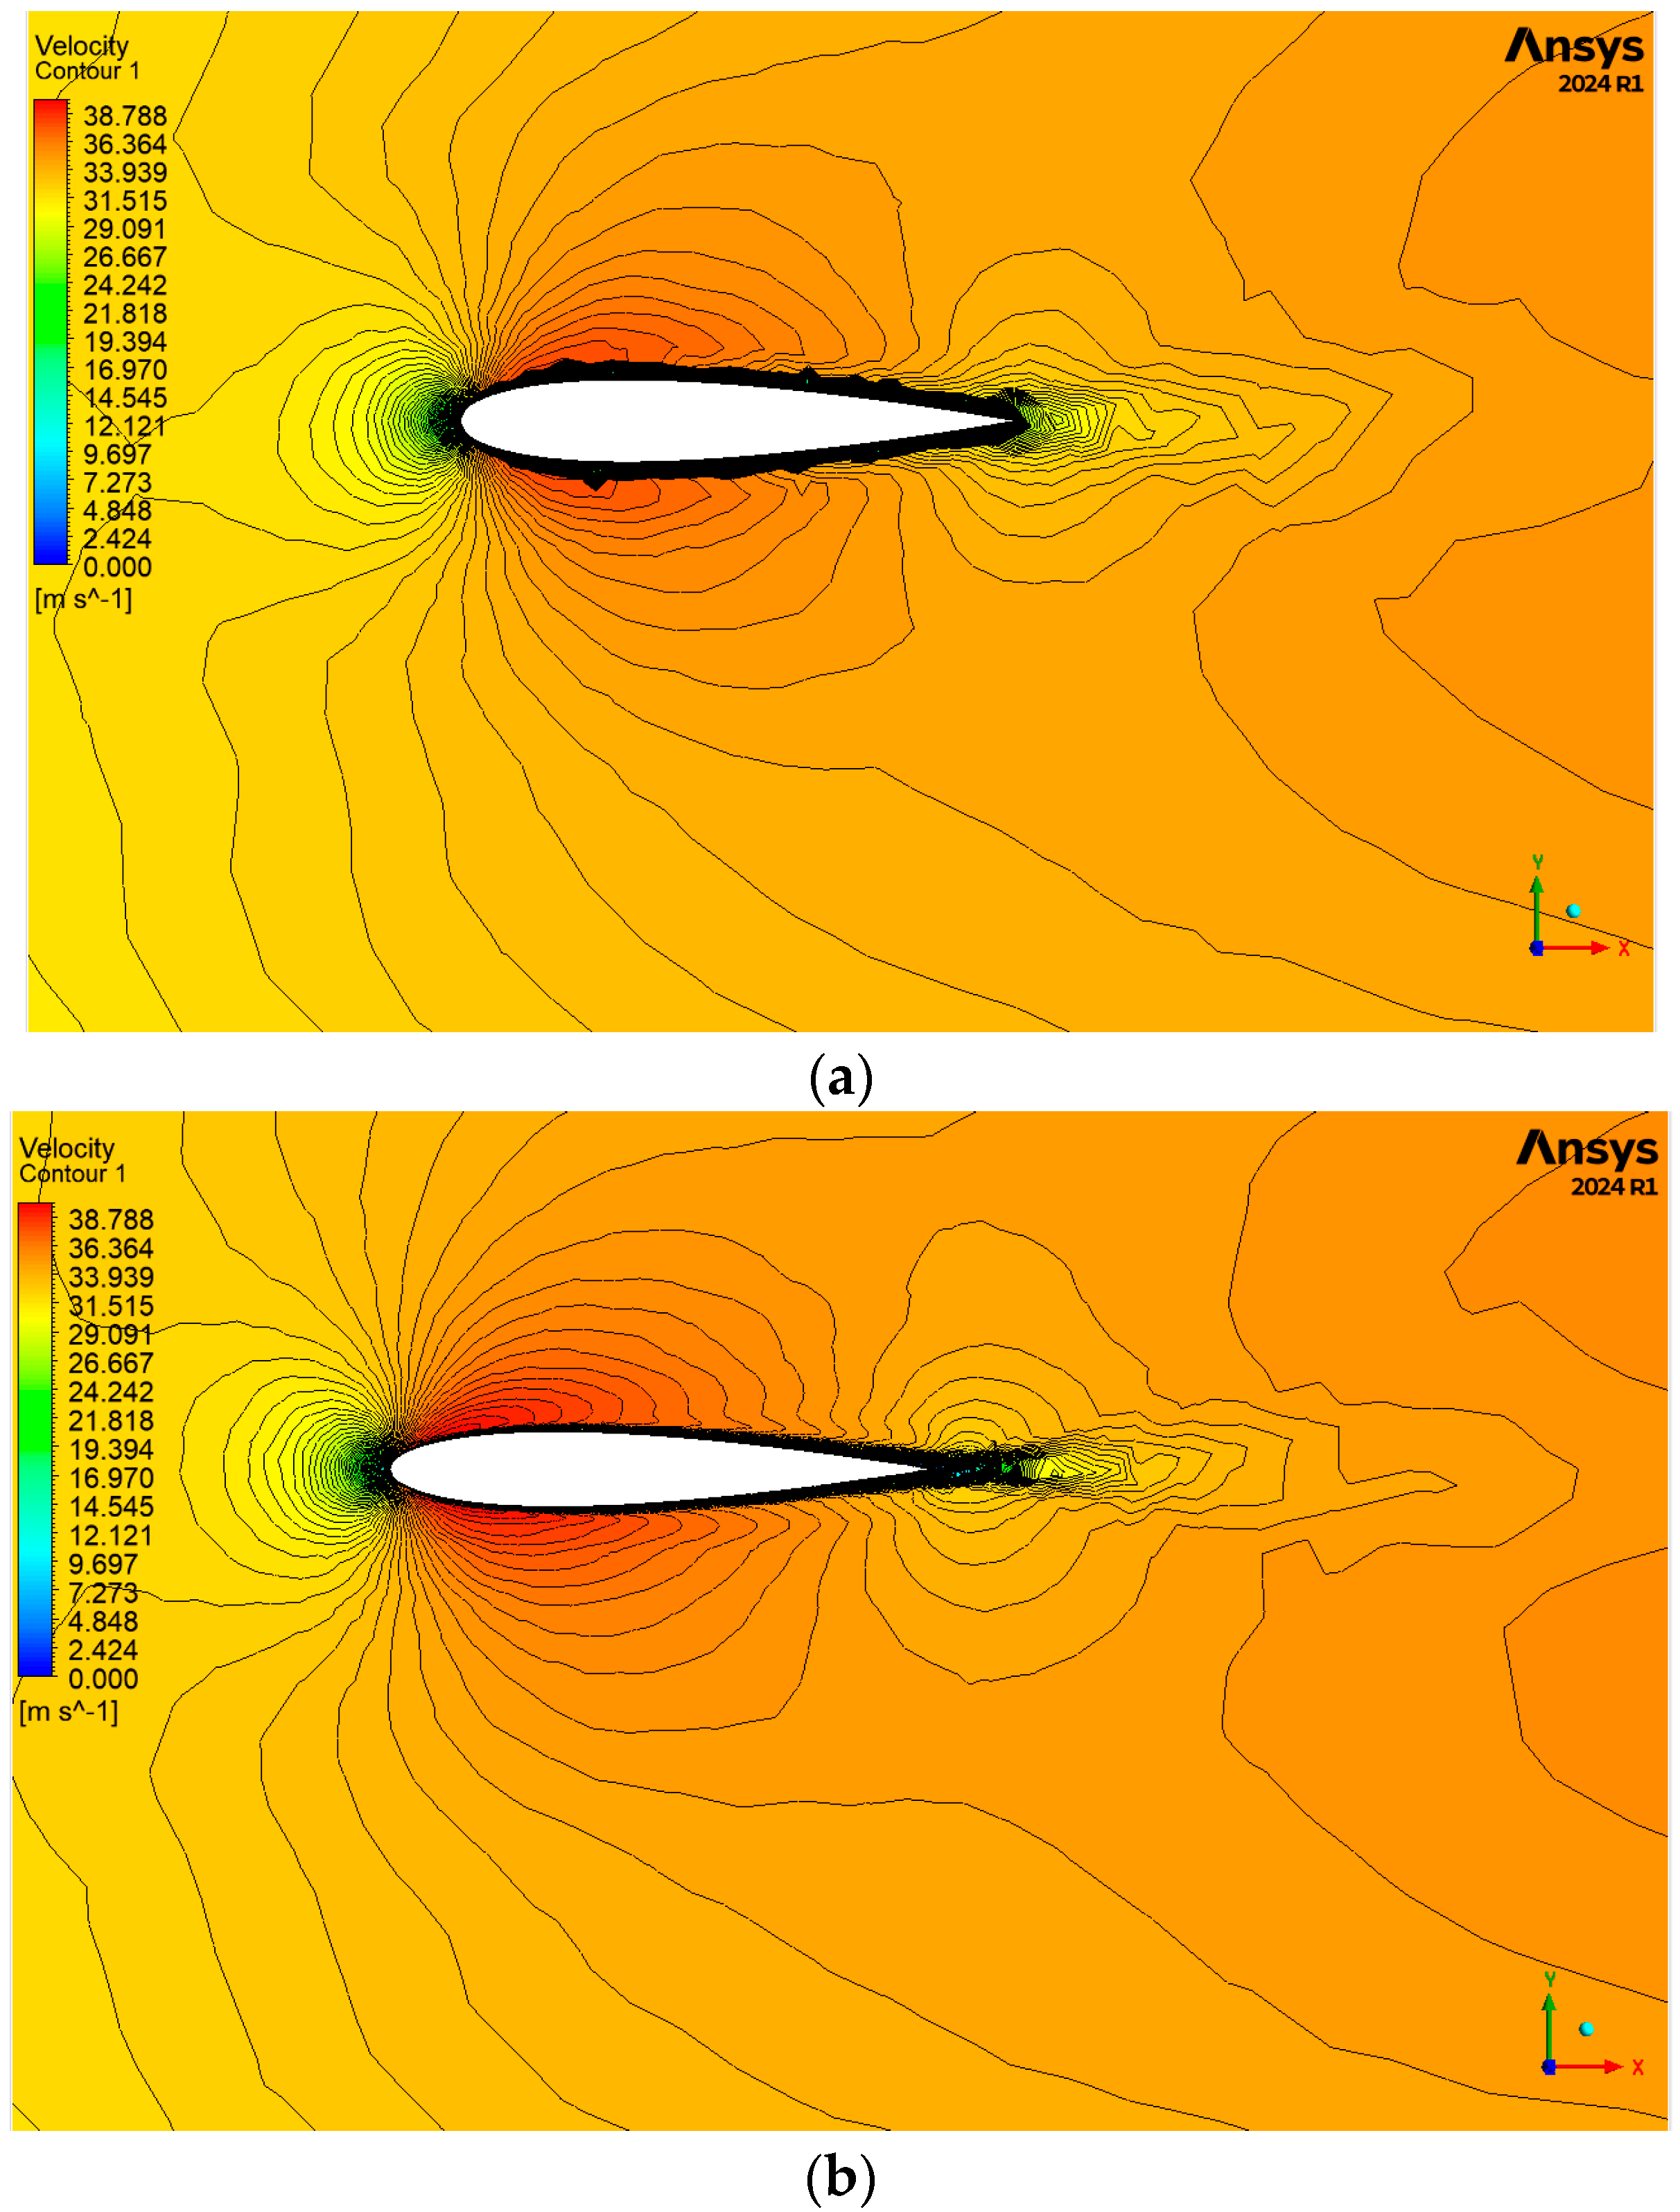
Figure 6 and Figure 7 show the velocity and pressure contours for the two cases of a grooved hydrofoil and a non-grooved hydrofoil.
As can be seen in the figure above, the area of the low-pressure zone formed behind the hydrofoil in the grooved state is significantly reduced compared to the base state without grooves. This significant reduction in the area of the low-pressure zone, which is generally associated with undesirable phenomena such as increased drag and severe flow turbulence, clearly indicates an improvement in the hydrodynamic performance of the hydrofoil. This improvement in performance can be attributed to the role of the groove in controlling the boundary layer. It seems that the groove energizes the boundary layer by injecting high-energy flow from the hydrofoil surface into the separating boundary layer, making it more stable. This action delays the separation of the flow from the hydrofoil surface. As a result, a smaller low-pressure zone and weaker vortices are formed behind the foil, which ultimately leads to a significant reduction in drag and increased acoustic performance. Specifically, the reduction in this area indicates a decrease in the separation intensity, which leads to a significant reduction in the drag force. On the other hand, the improved pressure distribution around the hydrofoil often leads to greater flow stability and ultimately to an increase in its overall acoustic performance. Also, this phenomenon shows that the application of the groove has successfully reduced the energy losses due to turbulence and the creation of drag vortices. The reduction in these energy losses will directly lead to the optimization of energy consumption and higher acoustic performance of the hydrofoil in practical applications. As a result, it can be claimed that the use of this groove is an effective solution to improve the acoustic performance in the design of hydrofoils.
According to the observations made in the above figure, it can be seen that in the rear region of the grooved hydrofoil, the distribution of velocity streamlines is much more regular and uniform compared to the base sample without grooves. This consistent and regular pattern of streamlines indicates a significant reduction in turbulence and vortices resulting from boundary layer separation in this region. This significant improvement in the flow pattern is due to the function of the grooves in the momentum transfer between different flow layers. By creating controlled vortices, the grooves transfer kinetic energy from higher velocity layers to the boundary layers near the surface. This energy transfer strengthens the boundary layer and makes it resistant to separation caused by the reverse pressure gradient. As a result, the fluid flow remains attached for a longer distance and separation occurs later. This significant improvement in the flow pattern indicates the positive and efficient effect of the designed grooves on the performance of the hydrofoil. Better organization of the fluid flow downstream of the hydrofoil directly leads to a reduction in the extensive low-pressure zone at the rear of the foil. This phenomenon improves the system performance through two main mechanisms: first, a significant reduction in the size of the separation zone, and second, a significant reduction in the intensity and size of the vortices formed. Such an improvement in the dynamic behavior of the flow can be considered an indication of reduced turbulence, lower energy losses, and ultimately an increase in the acoustic performance of the system. The reduction in the cross-sectional area of the turbulent and low-pressure zone directly leads to a reduction in drag force and an improvement in the lift-to-drag ratio, which are key indicators for evaluating the performance of hydrofoils. These results indicate that the design and implementation of grooves on the hydrofoil surface can be used as an effective and practical solution to optimize aerodynamic performance and improve the acoustic performance of the system.

6.2. Noise Intensity by Frequency in Different Receivers

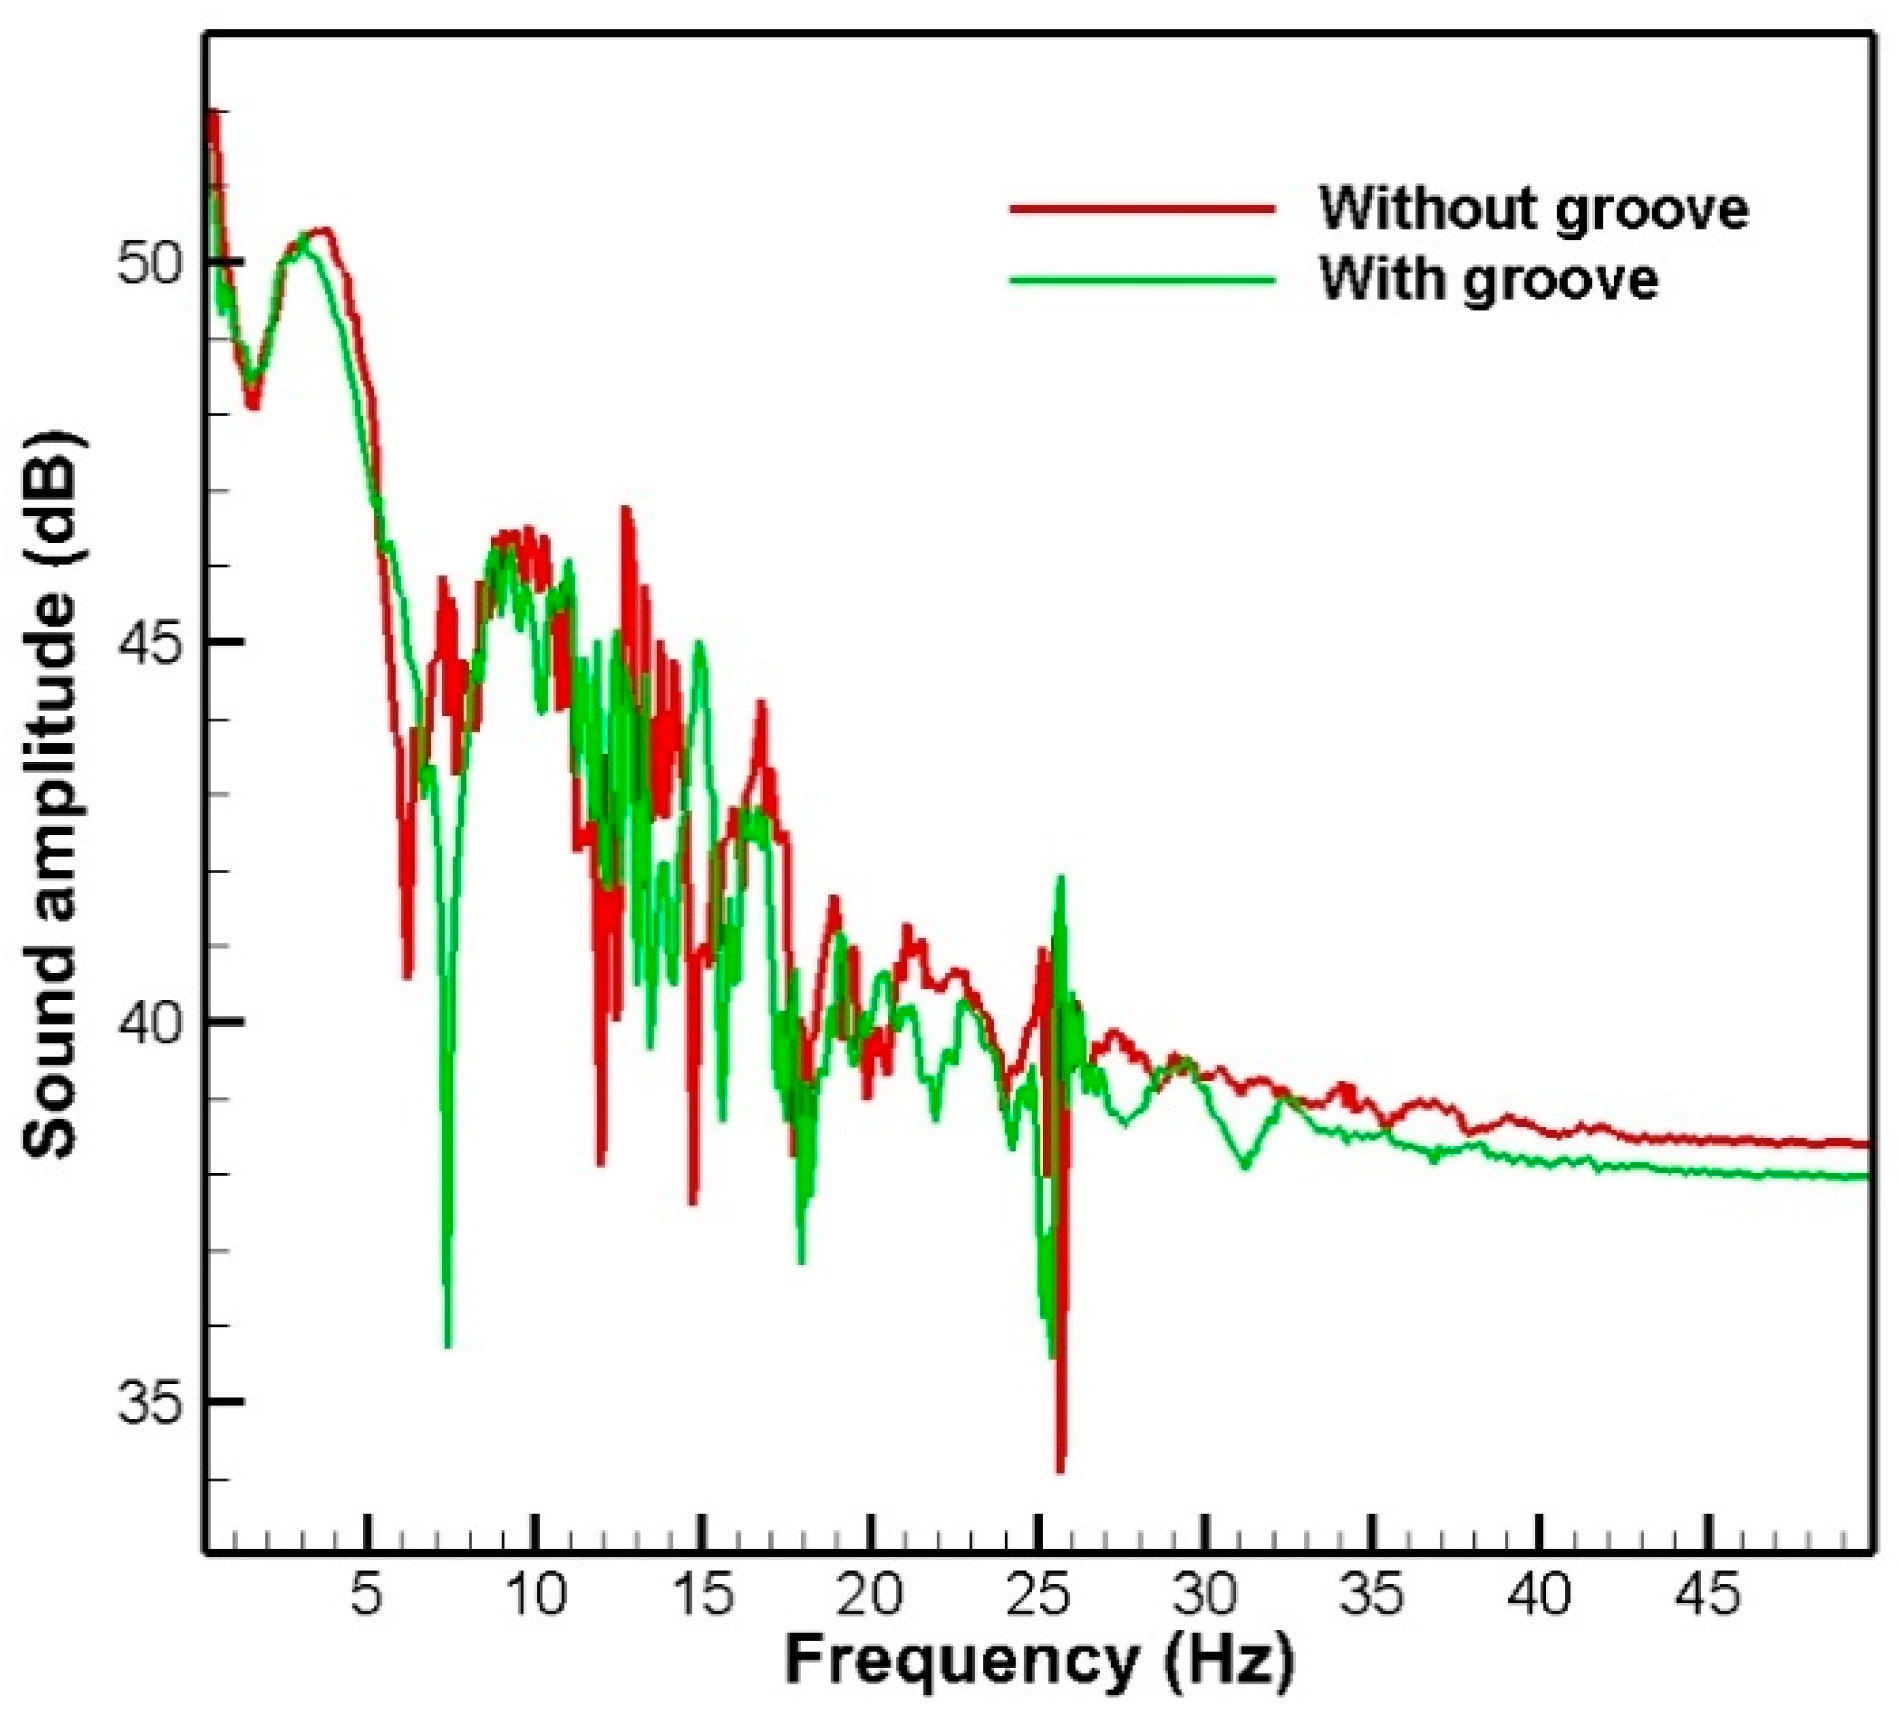
The noise intensity graph in terms of frequency at the first and second receivers, which are located along the symmetry line of the hydrofoil profile and before the flow reaches it (according to the coordinates mentioned in Table 1), is shown in Figure 8 and Figure 9.
As can be seen in the figure above. At low frequencies (up to approximately 10 Hz), the noise intensity of the hydrofoil without grooves is higher than that of the hydrofoil with grooves. In the frequency range of 10 to 20 Hz, the noise intensity of the hydrofoil with grooves increases significantly and exceeds that of the hydrofoil without grooves. At frequencies above 20 Hz, the noise intensity of both hydrofoils is approximately equal and does not change much. In general, it can be said that the use of grooves in the hydrofoil can increase the noise intensity in some frequency ranges (especially in the range of 10 to 20 Hz). However, at lower and higher frequencies, it has a good effect on noise reduction. The presence of grooves on the surface of the hydrofoil can change the flow pattern around it. This change can lead to a reduction in eddies and turbulence in the flow, which in turn affects the amount of noise produced. On the other hand, by comparing these two graphs, it can be seen that as the noise receiver approaches the hydrofoil, the amount of noise received increases noticeably. It is also observed in both waveforms that at low frequencies, the received noise has very strong oscillations, which are greatly reduced by increasing the frequency.
Although the presence of the longitudinal groove has led to a reduction in noise at low frequencies due to the attenuation of large-scale vortices, the observation of an increase in noise in the range of 10 to 20 Hz indicates the occurrence of a secondary physical mechanism. This phenomenon is due to the instability of the flow induced by the groove itself. The sharp edges of the groove can create a new source of noise in this particular frequency band by creating secondary vortices and changing the vortex shedding frequency. This effect is actually a trade-off between different scales of turbulence, so that the energy of large-scale vortices that were emitted at lower frequencies is now converted into medium-scale vortices belonging to this frequency range.
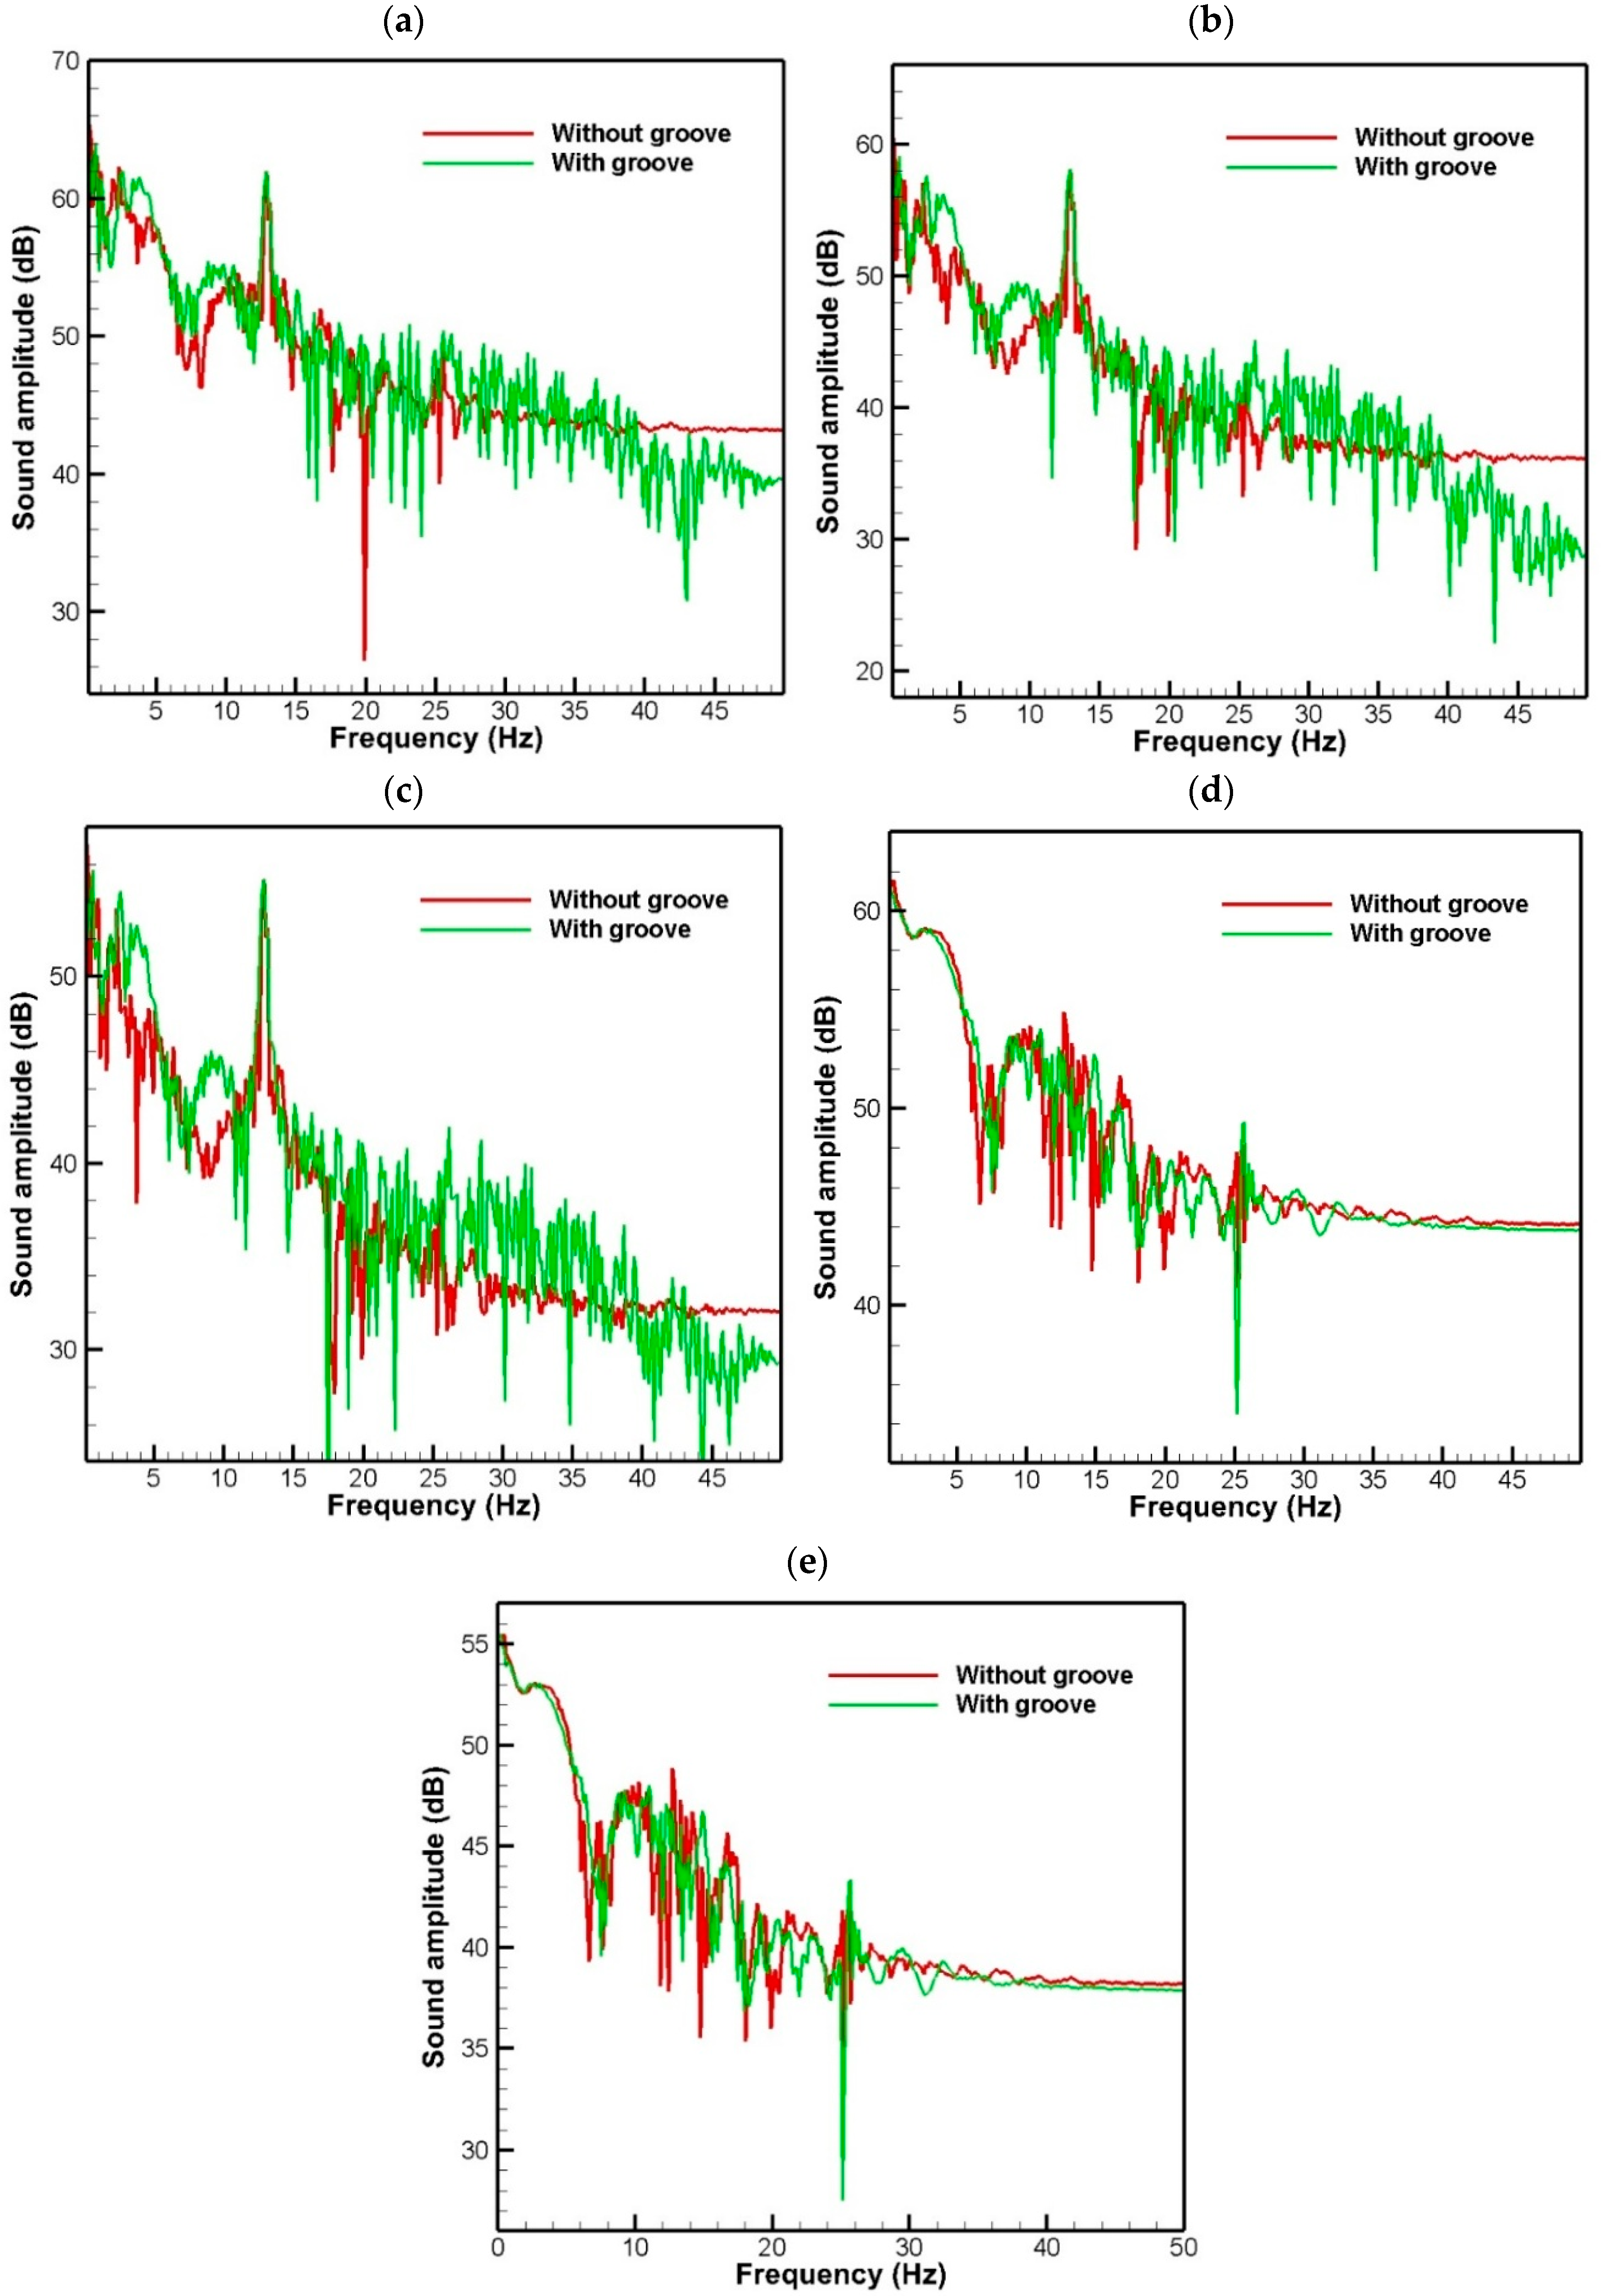
In Figure 10a–d, the graphs of noise intensity change according to frequency are shown for the receivers located behind the hydrofoil and on the axis of symmetry of its profile. It should be noted that receivers numbered 3 to 6 are located at distances of 1, 2, 3 and 5 times the length of the airfoil behind it.
In Figure 10a, it can be seen that the received sound intensity graphs in terms of frequency are almost the same for both the slotted and unslotted hydrofoils. This is because the flow turbulence is high in the area behind and near the airfoil, and the presence of the slot cannot control or greatly affect the noise generated in this area.
By comparing Figure 10b,c, it can be seen that as the distance between the noise receivers and the hydrofoil increases, the intensity of the received noise decreases at all frequencies. It can also be seen that as the distance between the noise receivers and the hydrofoil increases, the intensity of the received noise decreases at all frequencies. This can be seen from the increase in the distance between the received noise graphs at high frequencies. In Figure 10d, it is seen that the intensity of noise received from the hydrofoil at receiver number 6 has decreased compared to the previous two numerical reading stations. However, the behavior of the noise diagram in the case where a grooved hydrofoil is used is more severe than in the case where a grooveless hydrofoil is used, even at high frequencies. However, its average value is lower than in the case of a grooveless hydrofoil, and it maintains its downward trend at higher frequencies.
Figure 11a shows the noise intensity graph by frequency for numerical reading station number 7. In this figure, it can be seen that the oscillation of the received noise graph is extremely high and the graph fluctuates strongly, but the peaks created by the ungrooved hydrofoil are more intense than the grooved hydrofoil. Also, in Figure 11b,c, the behavior of each wavelet related to the grooved and ungrooved hydrofoil is similar to Figure 11a with the difference that the graphs show a lower sound intensity. In Figure 11d,e, the noise intensity variations with frequency are shown for receivers 10 and 11, which are considered on the side of the hydrofoil. In these figures, it can be seen that the received noise fluctuations are much reduced compared to the case where the receivers are considered on top of the hydrofoil.
Table 2 presents the minimum and average Sound Amplitude for all receivers in both with and without groove modes.
According to the data presented in this table, the minimum Sound Amplitude value for the grooved hydrofoil in all receivers (except receivers 1, 2, and 7) is lower than the minimum value for the non-grooved hydrofoil. Also, the average Sound Amplitude value in all receivers (except receivers 3 and 9) is lower in the grooved hydrofoil than in the non-grooved hydrofoil. These results indicate the better overall performance of the grooved hydrofoil in noise reduction.
The observations from CFD simulations that turbulence is reduced and noise is reduced in the presence of grooves can be explained by the basic principles of fluid mechanics. It was observed that the main function of the groove is to weaken large-scale vortex structures by producing a secondary and controlled boundary layer within it. This secondary boundary layer accelerates the process of vortex energy dissipation and, by suppressing shear instabilities, prevents the formation and growth of large-scale vortices. This mechanism is conceptually similar to the function of winglets in the aerospace industry, which reduce turbulence and induced drag by breaking wingtip vortices. Also, grooves dissipate the kinetic energy of the vortices in a more organized manner by creating a directed path for the secondary flow, which ultimately leads to a reduction in the overall level of hydrodynamic noise.

7. Conclusions

The purpose of this research was to numerically investigate the effect of designing parallel grooves on reducing the hydrodynamic noise of the NACA0015 hydrofoil using ANSYS Fluent software. The key innovation of the present study lay in the use of a longitudinal groove on the NACA0015 hydrofoil with the explicit aim of reducing hydrodynamic noise. This choice fundamentally provides a different control mechanism for flow management. The main goal of designing the longitudinal groove was not only to modify the boundary layer but also to create a smoother and more stable flow along the hydrofoil. By directing the flow along the length of the hydrofoil, this groove prevented the formation of vortices and flow separation, which are the main sources of acoustic noise.
Compared to T-shaped grooves, the present research has achieved the following in the field of noise control:
The longitudinal groove more efficiently damps the vibrations and flow disturbances that cause noise. Our results show that this geometry leads to a significant reduction in the overall level of hydrodynamic noise.
By creating a smoother flow pattern, the longitudinal groove prevents flow instabilities that manifest as humming or noise with their own frequency.
The findings show that the longitudinal groove maintains its noise reduction performance in a wide range of areas around the hydrofoil (11 receivers were considered in different areas around the hydrofoil).
The most important results obtained from this research are:
  • At low frequencies (up to approximately 10 Hz), the noise intensity of the ungrooved hydrofoil is higher than that of the grooved hydrofoil, but in the frequency range of 10 to 20 Hz, the noise intensity of the grooved hydrofoil increases significantly and exceeds that of the ungrooved hydrofoil.
  • At frequencies above 20 Hz, the noise intensity of both hydrofoils is approximately equal and does not change much.
  • In general, it can be said that the use of grooves in the hydrofoil can increase the noise intensity in some frequency ranges (especially in the range of 10 to 20 Hz). However, at lower and higher frequencies, it has a good effect on noise reduction.
  • The presence of grooves on the surface of the hydrofoil can change the flow pattern around it. This change can lead to a reduction in vortices and turbulence in the flow, which in turn affects the amount of noise generated.
  • In the area behind the airfoil and close to it, the flow turbulence is high and the presence of grooves cannot control or greatly affect the noise generated in this area.
  • As the distance of the noise receivers from the hydrofoil increases, the intensity of the received noise decreases at all frequencies.
  • The area of the low-pressure region behind the hydrofoil decreases in the grooved state compared to the low-pressure state, which indicates an improvement in the performance of the hydrofoil in this regard.
  • In the area behind the grooved hydrofoil, the lines of velocity alignment are more regular than in the ungrooved hydrofoil. This indicates the positive effect of the groove created on the hydrofoil on the downstream flows passing through it.
In conclusion, although this study achieved valuable observations on the effect of the groove on the acoustic characteristics of the hydrofoil, it was limited to certain conditions. The most important limitation was the investigation of a specific groove geometry at a fixed Reynolds number and angle of attack. Also, due to the complex nature of the flow in the groove, a detailed analysis of the physical mechanism of noise increase in the frequency band of 10–20 Hz requires further and more detailed investigation. Accordingly, future studies can focus on optimizing the groove geometry, the number of grooves, investigating the effect of different Reynolds numbers, and using full-field measurement methods such as PIV to more accurately understand the flow instability mechanisms. Extending this research to more complex hydrofoil geometries can also lead to the provision of operational solutions.

Author Contributions

Conceptualization, S.S.K.R. and N.F.; methodology, S.S.K.R. and N.F.; software, N.F.; validation, N.F. and F.H.H.A.M.; formal analysis, F.H.H.A.M.; investigation, S.S.K.R., N.F. and F.H.H.A.M.; resources, N.F. and P.P.; data curation, N.F.; writing—original draft preparation, N.F.; writing—review and editing, P.P.; visualization, S.S.K.R., N.F. and F.H.H.A.M.; supervision, P.P.; project administration, S.S.K.R. and F.H.H.A.M.; funding acquisition, S.S.K.R. and F.H.H.A.M. All authors have read and agreed to the published version of the manuscript.

Funding

This work was supported by the Deanship of Scientific Research, Vice Presidency for Graduate Studies and Scientific Research, King Faisal University, Saudi Arabia [Grant No. KFU 253428].

Data Availability Statement

The data presented in this study are available on request from the corresponding author due to privacy concerns. We plan to create a library on the university website for each dataset and upload the simulation files and codes there in the future.

Conflicts of Interest

The authors declare no conflicts of interest.

References

  1. Taha, Z.; Ya, T.T.; Sawada, T. Numerical investigation on the performance of Wells turbine with non-uniform tip clearance for wave energy conversion. Appl. Ocean Res. 2011, 33, 321–331. [Google Scholar] [CrossRef]
  2. Luo, Y.; Wang, Z.; Liu, X.; Xiao, Y.; Chen, C.; Wang, H.; Yan, J. Numerical prediction of pressure pulsation for a low head bidirectional tidal bulb turbine. Energy 2015, 89, 730–738. [Google Scholar] [CrossRef]
  3. Heo, M.-W.; Kim, K.-Y.; Kim, J.-H.; Choi, Y.S. High-efficiency design of a mixed-flow pump using a surrogate model. J. Mech. Sci. Technol. 2016, 30, 541–547. [Google Scholar] [CrossRef]
  4. Zhang, W.; Yu, Z.; Zhu, B. Characteristic analysis on the pressure fluctuation in the impeller of a low specific speed mixed flow pump. In IOP Conference Series: Materials Science and Engineering; IOP Publishing: Bristol, UK, 2016; p. 012035. [Google Scholar]
  5. Zhang, W.; Yu, Z.; Zhu, B. Influence of tip clearance on pressure fluctuation in low specific speed mixed-flow pump passage. Energies 2017, 10, 148. [Google Scholar] [CrossRef]
  6. Wang, J.; Sundén, B.; Zeng, M.; Wang, Q.-W. Influence of different rim widths and blowing ratios on film cooling characteristics for a blade tip. J. Heat Transf. 2012, 134, 061701. [Google Scholar] [CrossRef]
  7. Danlos, A.; Méhal, J.-E.; Ravelet, F.; Coutier-Delgosha, O.; Bakir, F. Study of the cavitating instability on a grooved Venturi profile. J. Fluids Eng. 2014, 136, 101302. [Google Scholar] [CrossRef]
  8. Qian, Z.; Wang, Z.; Guo, Z.; Dong, J.; Lu, J. Analysis of silt abrasion of the impeller ring in a centrifugal pump with J-grooves. In IOP Conference Series: Materials Science and Engineering; IOP Publishing: Bristol, UK, 2016; p. 012021. [Google Scholar]
  9. Lidtke, A.K.; Turnock, S.R.; Humphrey, V.F. Characterisation of sheet cavity noise of a hydrofoil using the Ffowcs Williams–Hawkings acoustic analogy. Comput. Fluids 2016, 130, 8–23. [Google Scholar] [CrossRef]
  10. Kim, S.; Cheong, C.; Park, W.-G.; Seol, H. Numerical investigation of cavitation flow around hydrofoil and its flow noise. Trans. Korean Soc. Noise Vib. Eng. 2016, 26, 141–147. [Google Scholar] [CrossRef]
  11. Liu, Y.; Tan, L. Method of C groove on vortex suppression and energy performance improvement for a NACA0009 hydrofoil with tip clearance in tidal energy. Energy 2018, 155, 448–461. [Google Scholar] [CrossRef]
  12. Huang, Z.; Han, Y.; Tan, L.; Huang, C. Influence of T-shape tip clearance on energy performance and broadband noise for a NACA0009 hydrofoil. Energies 2019, 12, 4066. [Google Scholar] [CrossRef]
  13. Dang, Z.; Mao, Z.; Tian, W. Reduction of hydrodynamic noise of 3d hydrofoil with spanwise microgrooved surfaces inspired by sharkskin. J. Mar. Sci. Eng. 2019, 7, 136. [Google Scholar] [CrossRef]
  14. Kundu, P.; Sarkar, A.; Nagarajan, V. Improvement of performance of S1210 hydrofoil with vortex generators and modified trailing edge. Renew. Energy 2019, 142, 643–657. [Google Scholar] [CrossRef]
  15. Hu, Z.; Huang, C.; Huang, Z.; Zhang, J. A method of bending shrinkage groove on vortex suppression and energy improvement for a hydrofoil with tip gap. Processes 2020, 8, 1299. [Google Scholar] [CrossRef]
  16. Liu, Y.; Tan, L. Influence of C groove on suppressing vortex and cavitation for a NACA0009 hydrofoil with tip clearance in tidal energy. Renew. Energy 2020, 148, 907–922. [Google Scholar] [CrossRef]
  17. Xie, X.; Chang, S.; Wang, C.; Guo, C. Numerical simulation of hydrodynamic performance of hydrofoil with inner groove. Chin. J. Ship Res. 2020, 15, 127–134. [Google Scholar]
  18. Huang, Z.; Huang, Z.; Fan, H. Influence of C groove on energy performance and noise source of a NACA0009 hydrofoil with tip clearance. Renew. Energy 2020, 159, 726–735. [Google Scholar] [CrossRef]
  19. Tirandazi, P.; Hidrovo, C.H. Study of drag reduction using periodic spanwise grooves on incompressible viscous laminar flows. Phys. Rev. Fluids 2020, 5, 064102. [Google Scholar] [CrossRef]
  20. Huang, Y.; Zhang, D.; Wang, F.; Zhang, G.; van Esch, B.B. Vortex suppression of the tip leakage flow over a NACA0009 hydrofoil via a passive jet induced by the double-control-hole. Ocean. Eng. 2021, 237, 109647. [Google Scholar] [CrossRef]
  21. Bi, Z.; Zhang, L.; Shao, X. Numerical study of suppression mechanism of two types of grooves on the TLV. Ocean Eng. 2021, 224, 108637. [Google Scholar] [CrossRef]
  22. Wang, W.; Li, Z.; Liu, M.; Ji, X. Influence of water injection on broadband noise and hydrodynamic performance for a NACA66 (MOD) hydrofoil under cloud cavitation condition. Appl. Ocean Res. 2021, 115, 102858. [Google Scholar] [CrossRef]
  23. Chen, Y.; Zhang, W.; Fang, D.; Sun, M.; Liu, J.; Song, D.; Zhang, X. Vortex suppression and flow pattern analysis of a hydrofoil with parallel grooves. Processes 2021, 9, 816. [Google Scholar] [CrossRef]
  24. Li, D.; Yang, Q.; Yang, W.; Chang, H.; Wang, H. Bionic leading-edge protuberances and hydrofoil cavitation. Phys. Fluids 2021, 33, 093317. [Google Scholar] [CrossRef]
  25. Kouser, T.; Xiong, Y.; Yang, D.; Peng, S. Numerical study on drag reduction and wake modification for the flows over a hydrofoil in presence of surface heterogeneity. Adv. Mech. Eng. 2022, 14, 16878140221075306. [Google Scholar] [CrossRef]
  26. Jiang, J.-W.; Xie, C.-M.; Xu, L.-H.; Li, L.; Huang, W.-X. The groove at blade tip designed for suppression of tip-leakage vortex may bring the risk of inducing new cavitation. Phys. Fluids 2022, 34, 121701. [Google Scholar] [CrossRef]
  27. Chada, J.S.R.; Rao, B.R. Study of flow pattern on a hydrofoil with structural and profile modification. J. Mech. Energy Eng. 2022, 6, 27–32. [Google Scholar] [CrossRef]
  28. Han, Y.; Liu, Y.; Tan, L. Method of variable-depth groove on vortex and cavitation suppression for a NACA0009 hydrofoil with tip clearance in tidal energy. Renew. Energy 2022, 199, 546–559. [Google Scholar] [CrossRef]
  29. Jia, J.; Zhang, J.; Huang, Z. Cavitation flow and broadband noise source characteristics of NACA66 hydrofoil with a V groove on the suction surface. Ocean Eng. 2022, 266, 112889. [Google Scholar] [CrossRef]
  30. Wang, L.; Luo, X.; Feng, J.; Lu, J.; Zhu, G.; Li, C. Numerical evaluation of suppression mechanism of shark-inspired riblet on tip leakage vortex of a NACA0009 hydrofoil with tip clearance. Ocean Eng. 2022, 244, 110288. [Google Scholar] [CrossRef]
  31. Wang, X.; Zhang, J.; Huang, Z.; Wang, L.; Li, W.; Lan, G. Large eddy simulation on the cavitation flow and noise characteristics of a NACA0009 hydrofoil with different tip clearance sizes. J. Fluids Eng. 2023, 145, 011204. [Google Scholar] [CrossRef]
  32. Zhang, J.; Wang, X.; Yang, C.; Tang, J.; Huang, Z. Cavitation flow and noise reduction design of bionic hydrofoil based on orthogonal optimization. Phys. Fluids 2023, 35, 115132. [Google Scholar] [CrossRef]
  33. Wang, L.; Luo, X.; Lu, J.; Feng, J.; Zhu, G.; Wang, W.; Wang, K. Effect of asymmetrical tip clearances on energy performance and cavitation characteristics of NACA0009 hydrofoil in tidal energy. J. Mech. Sci. Technol. 2023, 37, 4717–4728. [Google Scholar] [CrossRef]
  34. Gu, Y.; Ma, L.; Yu, S.; Yan, M.; Wu, D.; Mou, J. Surface cavitation flow characterization of jet hydrofoils based on vortex identification method. Phys. Fluids 2023, 35, 012112. [Google Scholar] [CrossRef]
  35. Huang, C.; Sun, M.; Lv, X.; Wu, X.; Yang, Q. Energy performance and flow characteristics of a NACA0009 hydrofoil with bending shrinkage groove and tip winglet. Ocean Eng. 2023, 279, 114588. [Google Scholar] [CrossRef]
  36. Dong, L.; Chenhao, L. Investigation on the effect of different groove depth and width on the tip clearance leakage flow of hydrofoil. J. Phys. Conf. Ser. 2024, 2752, 012195. [Google Scholar] [CrossRef]
  37. Wang, L.; Mi, J.; Luo, X.; Yao, L.; Feng, J.; Zhu, G.; Li, C. Numerical investigation the shape of groove on tip leakage vortex suppression of a NACA0009 hydrofoil. J. Phys. Conf. Ser. 2024, 2707, 012063. [Google Scholar] [CrossRef]
  38. Gu, F.; Shi, L.; Shen, X.; Zhang, G.; Geng, L.; Zhang, D.; van Esch, B.B. A novel flow control method suppressing tip leakage vortex of a hydrofoil applied for ducted devices. Ocean Eng. 2024, 311, 118920. [Google Scholar] [CrossRef]
  39. Wang, L.; Feng, J.; Lu, J.; Zhu, G.; Wang, W. Novel bionic wave-shaped tip clearance toward improving hydrofoil energy performance and suppressing tip leakage vortex. Energy 2024, 290, 130261. [Google Scholar] [CrossRef]
  40. Gang, Y.; Zhou, Z.; Li, J.; Peng, L.; Liu, D.; Liu, X.; Pang, J. Analysis of hydrofoil tip leakage vortex dynamic characteristics. Adv. Mech. Eng. 2024, 16, 16878132241293622. [Google Scholar] [CrossRef]
  41. Timoshevskiy, M.; Zapryagaev, I.; Pervunin, K.; Markovich, D. Longitudinal grooves for hampering cavitation development: Experiments on a 2D hydrofoil. In AIP Conference Proceedings; AIP Publishing LLC: Melville, NY, USA, 2018; p. 030003. [Google Scholar]
  42. Maung, P.; Prusty, B.; White, J.; David, M.; Phillips, A.; John, N.S. Structural performance of a shape-adaptive composite hydrofoil using automated fibre placement. Eng. Struct. 2019, 183, 351–365. [Google Scholar] [CrossRef]
  43. Kadivar, E.; Ochiai, T.; Iga, Y.; el Moctar, O. An experimental investigation of transient cavitation control on a hydrofoil using hemispherical vortex generators. J. Hydrodyn. 2021, 33, 1139–1147. [Google Scholar] [CrossRef]
  44. Zaresharif, M.; Ravelet, F.; Kinahan, D.J.; Delaure, Y. Cavitation control using passive flow control techniques. Phys. Fluids 2021, 33, 121301. [Google Scholar] [CrossRef]
  45. Xu, L.; Liu, Y.; Cheng, H.; Ji, B.; Peng, X. Suppression effect on TLV cavitation of overhanging grooves with different tab orientations: An experimental investigation. Ocean Eng. 2022, 266, 113125. [Google Scholar] [CrossRef]
  46. Nichik, M.Y.; Timoshevskiy, M.V.; Pervunin, K.S. Effect of an end-clearance width on the gap cavitation structure: Experiments on a wall-bounded axis-equipped hydrofoil. Ocean Eng. 2022, 254, 111387. [Google Scholar] [CrossRef]
  47. Skripkin, S.G.; Starinskiy, S.V.; Tsoy, M.A.; Vasiliev, M.M.; Kravtsova, A.Y. Effect of a textured surface on the occurrence and development of cavitation on the hydrofoil. Phys. Fluids 2023, 35, 025109. [Google Scholar] [CrossRef]
  48. Cao, Y.-T.; Xu, L.-H.; Peng, X.-X. An experimental study on the impact behavior of cavitation inside tip clearance of a hydrofoil. J. Hydrodyn. 2023, 35, 1208–1214. [Google Scholar] [CrossRef]
  49. Qiu, N.; Xu, P.; Zhu, H.; Zhou, W.; Xun, D.; Li, M.; Che, B. Cavitation morphology and erosion on hydrofoil with slits. Int. J. Mech. Sci. 2024, 275, 109345. [Google Scholar] [CrossRef]
  50. Tsoy, M.; Skripkin, S.; Kravtsova, A. Cavitating flow around a low aspect ratio NACA0012 hydrofoil with regular grooves. J. Phys. Conf. Ser. 2024, 2752, 012189. [Google Scholar] [CrossRef]
  51. Li, Y.; Chen, H.; Wang, J.; Chen, D. Effect of grooves on cavitation around the body of revolution. J. Fluids Eng. 2010, 132, 011301. [Google Scholar] [CrossRef]
  52. Kang, D.; Arimoto, Y.; Yonezawa, K.; Horiguchi, H.; Kawata, Y.; Hah, C.; Tsujimoto, Y. Suppression of cavitation instabilities in an inducer by circumferential groove and explanation of higher frequency components. Int. J. Fluid Mach. Syst. 2010, 3, 137–149. [Google Scholar] [CrossRef]
  53. Mita, J.R.; Qu, W.; Kobayashi, M.H.; Pfefferkorn, F.E. Experimental study and numerical analysis of water single-phase pressure drop across an array of circular micro-pin-fins. In Proceedings of the ASME/JSME Thermal Engineering Joint Conference, Washington, DC, USA, 8–13 August 2011; p. T10131. [Google Scholar]
  54. Danlos, A.; Ravelet, F.; Coutier-Delgosha, O.; Bakir, F. Cavitation regime detection through Proper Orthogonal Decomposition: Dynamics analysis of the sheet cavity on a grooved convergent–divergent nozzle. Int. J. Heat Fluid Flow 2014, 47, 9–20. [Google Scholar] [CrossRef]
  55. Komárek, M.; Sedlář, M.; Vyroubal, M.; Zima, P.; Müller, M.; Pálka, T. Preparation of experimental and numerical research on unsteady cavitating flow around hydrofoil. EPJ Web Conf. EDP Sci. 2015, 92, 02036. [Google Scholar] [CrossRef]
  56. Cheng, H.; Long, X.; Ji, B.; Peng, X.; Farhat, M. Suppressing tip-leakage vortex cavitation by overhanging grooves. Exp. Fluids 2020, 61, 159. [Google Scholar] [CrossRef]
  57. Fei, Z.; Zhang, R.; Xu, H.; Mu, T. Investigation of the groove effect on the tip leakage vortex flow. In IOP Conference Series: Earth and Environmental Science; IOP Publishing: Bristol, UK, 2021; p. 012004. [Google Scholar]
  58. Roohi, E.; Zahiri, A.P.; Passandideh-Fard, M. Numerical simulation of cavitation around a two-dimensional hydrofoil using VOF method and LES turbulence model. Appl. Math. Model. 2013, 37, 6469–6488. [Google Scholar] [CrossRef]
  59. Ye, C.; Wang, F.; Wang, C.; van Esch, B.P. Assessment of turbulence models for the boundary layer transition flow simulation around a hydrofoil. Ocean Eng. 2020, 217, 108124. [Google Scholar] [CrossRef]
  60. Garg, N.; Pearce, B.W.; Brandner, P.A.; Phillips, A.W.; Martins, J.R.; Young, Y.L. Experimental investigation of a hydrofoil designed via hydrostructural optimization. J. Fluids Struct. 2019, 84, 243–262. [Google Scholar] [CrossRef]
Figure 1. Two-dimensional view of the NACA0015 hydrofoil.
Mathematics 13 03125 g001
Figure 2. Three-dimensional airfoil (a) Without groove, (b) 3D view of a hydrofoil with a longitudinal groove, (c) Front view of a hydrofoil with a longitudinal groove.
Mathematics 13 03125 g002
Figure 3. Designed hydrofoil within the control volume.
Mathematics 13 03125 g003
Figure 4. Curves for pressure coefficient of the hydrofoil.
Mathematics 13 03125 g004
Figure 5. Verification of the obtained results with the results presented in reference [60].
Mathematics 13 03125 g005
Figure 6. Pressure contour around the hydrofoil in two states: (a) ungrooved, and (b) grooved.
Mathematics 13 03125 g006
Figure 7. Velocity contour around the hydrofoil in two states: (a) ungrooved, and (b) grooved.
Mathematics 13 03125 g007
Figure 8. Noise intensity graph versus frequency for receiver number 1.
Mathematics 13 03125 g008
Figure 9. Noise intensity versus frequency diagram for receiver 2.
Mathematics 13 03125 g009
Figure 10. Noise intensity graph by frequency for receiver, (a) number 3, (b) number 4, (c) number 5, (d) number 6.
Mathematics 13 03125 g010
Figure 11. Noise intensity versus frequency graph for receiver, (a) number 7, (b) number 8, (c) number 9, (d) number 10, (e) number 11.
Mathematics 13 03125 g011
Table 1. Noise receiver coordinates.
Number of Noise ReceiversX (mm)Y (mm)Z (mm)
1−20000
2−10000
320000
430000
540000
660000
71001000
81002000
91003000
101000130
111000230
Table 2. Minimum and average Sound Amplitude for all receivers.
Number of ReceiverMinimum of Sound AmplitudeAverage of Sound Amplitude
Without GrooveWith GrooveWithout GrooveWith Groove
134.0603735.5511441.3545440.95443
239.5095840.1155448.0706947.78734
337.3559132.3740844.5623544.9629
425.8168321.9607937.7908936.98377
523.4768822.6842832.8307531.56271
67.0946814.22774625.1958922.42847
726.3898530.7339747.5503347.31445
829.16322.0903541.0333640.93716
927.6123517.2941137.1686638.01303
1040.8871134.4584147.7233747.57785
1134.9062927.4756341.7677141.61544
Disclaimer/Publisher’s Note: The statements, opinions and data contained in all publications are solely those of the individual author(s) and contributor(s) and not of MDPI and/or the editor(s). MDPI and/or the editor(s) disclaim responsibility for any injury to people or property resulting from any ideas, methods, instructions or products referred to in the content.