Article

TSAD: Transformer-Based Semi-Supervised Anomaly Detection for Dynamic Graphs

1
Party School of the CPC Hubei Provincial Committee, Wuhan 432200, China
2
School of Economics, Peking University, Beijing 100871, China
*
Author to whom correspondence should be addressed.
Mathematics 2025, 13(19), 3123; https://doi.org/10.3390/math13193123
Submission received: 7 August 2025 / Revised: 3 September 2025 / Accepted: 22 September 2025 / Published: 30 September 2025
(This article belongs to the Special Issue New Advances in Graph Neural Networks (GNNs) and Applications)

Abstract

Anomaly detection aims to identify abnormal instances that significantly deviate from normal samples. With the natural connectivity between instances in the real world, graph neural networks have become increasingly important in solving anomaly detection problems. However, existing research mainly focuses on static graphs, while there is less research on mining anomaly patterns in dynamic graphs, which has important application value. This paper proposes a Transformer-based semi-supervised anomaly detection framework for dynamic graphs. The framework adopts the Transformer architecture as the core encoder, which can effectively capture long-range dependencies and complex temporal patterns between nodes in dynamic graphs. By introducing time-aware attention mechanisms, the model can adaptively focus on important information at different time steps, thereby better understanding the evolution process of graph structures. The multi-head attention mechanism of Transformer enables the model to simultaneously learn structural and temporal features of nodes, while positional encoding helps the model understand periodic patterns in time series. Comprehensive experiments on three real datasets show that TSAD significantly outperforms existing methods in anomaly detection accuracy, particularly demonstrating excellent performance in label-scarce scenarios.

1. Introduction

Anomaly detection, as an important research direction in data mining and machine learning, aims to identify anomalous instances that significantly deviate from normal patterns [1]. In the real world, data in many application scenarios naturally possess graph structure characteristics, such as user interactions in social networks, transaction relationships in financial systems, and communication patterns in network security. These graph-structured data not only contain rich topological information but also evolve dynamically over time, forming dynamic graphs [2].
Traditional anomaly detection methods are mainly designed for static data [3] and have difficulty effectively handling complex relational patterns in graph-structured data. In recent years, the rapid development of Graph Neural Networks (GNNs) has provided new solutions for graph anomaly detection [4,5,6]. However, existing graph anomaly detection research mainly focuses on static graphs [7,8], ignoring the dynamic evolution characteristics of graph structures in the real world.
Dynamic graph anomaly detection faces unique challenges. First, the topological structure and node attributes of graphs continuously change over time, and traditional static graph methods cannot capture such temporal evolution patterns [9]. Second, anomalous behaviors in dynamic graphs often exhibit specific temporal patterns. Finally, in practical applications, obtaining large amounts of labeled data is costly, so it is necessary to fully utilize large amounts of unlabeled data under the guidance of a small amount of labeled samples [10].
These limitations directly motivate our work: there is an urgent need for a framework that can (1) effectively capture continuous temporal dependencies in dynamic graphs, (2) model complex spatiotemporal relationships through advanced attention mechanisms, and (3) efficiently leverage unlabeled data in semi-supervised scenarios.
In recent years, various methods have been proposed for anomaly detection in dynamic graphs, such as TADDY [11], which utilizes Transformer encoders to process spatiotemporal information. However, TADDY primarily adopts a discrete-time modeling approach, which may not fully capture the continuous interactions and temporal dependencies inherent in dynamic graphs. Our proposed method, TSAD, addresses these limitations by introducing a specialized architecture that leverages multi-head attention mechanisms and time-aware positional encoding, allowing for a more nuanced understanding of the temporal evolution of graph structures.
Existing dynamic graph neural network methods [12,13], although considering temporal information, mostly adopt discrete-time snapshot modeling approaches and have difficulty handling continuous-time dynamic interactions. Meanwhile, these methods mainly rely on supervised learning paradigms and perform poorly in anomaly detection tasks with scarce labeled data.
Recent semi-supervised dynamic graph anomaly detection methods [11,14], although attempting to combine temporal information, still have the following limitations: (1) Insufficient temporal modeling capability, simply treating time as input features, unable to fully capture complex temporal dependencies; (2) Insufficient utilization of unlabeled data, lacking effective mechanisms to mine useful information from large amounts of unlabeled samples.
The Transformer architecture, with its powerful sequence modeling capability and self-attention mechanism, has achieved tremendous success in natural language processing [15] and computer vision. In recent years, researchers have begun exploring the application of the Transformer to graph data processing [16], but its application in the field of dynamic graph anomaly detection is still in its infancy. The multi-head attention mechanism of the Transformer can effectively capture long-range dependencies, and positional encoding helps understand temporal patterns in sequences, making it very suitable for handling complex spatiotemporal relationships in dynamic graphs.
Based on the above analysis, this paper innovatively proposes a Transformer-based semi-supervised anomaly detection model for dynamic graphs (TSAD). The core of the model lies in leveraging the Transformer’s strength in continuous temporal modeling and semi-supervised learning mechanisms to simultaneously address two major challenges: “capturing complex temporal dependencies” and “utilizing unlabeled data.” Specifically, first, by introducing sine–cosine temporal positional encoding and a graph structure-aware attention mechanism, the model deeply integrates temporal and structural information of dynamic interactions, accurately characterizing the evolutionary process of the graph. Second, by designing an adaptive memory bank to maintain normal pattern prototypes and combining it with a confidence-based pseudo-label generation strategy and contrastive learning, the model efficiently learns discriminative features from unlabeled data, enabling more precise anomaly identification. Finally, through multi-objective joint optimization, the model demonstrates outstanding detection performance and robustness in label-scarce scenarios. The main contributions of this framework include the following:
Innovative Architecture Design: First introduction of the Transformer architecture into dynamic graph anomaly detection, effectively capturing long-range spatiotemporal dependencies between nodes through time-aware multi-head attention mechanisms.
Enhanced Temporal Modeling: Design of specialized temporal encoding schemes and positional embedding mechanisms, enabling the model to understand periodic patterns and temporal evolution patterns in dynamic graphs.
Semi-supervised Learning Optimization: Proposal of pseudo-label-based contrastive learning modules, combined with time-decay memory bank mechanisms, to fully exploit the potential of unlabeled data.

2. Related Work

2.1. Dynamic Graph Neural Networks

Dynamic graph neural networks aim to model graph-structured data that evolves over time. Early methods mainly adopted discrete-time modeling paradigms, decomposing dynamic graphs into a series of static snapshots. EvolveGCN [12] captures temporal changes in graphs by evolving the parameters of graph convolutional networks. DynGEM [17] uses deep autoencoders to learn node embeddings of dynamic networks. GraphSAINT [18] proposes a sampling-based method to handle large-scale dynamic graphs.
However, discrete-time methods have obvious limitations: difficulty in choosing time granularity and inability to handle continuous-time interaction events. Therefore, continuous-time dynamic graph methods emerged. DyREP [9] uses temporal point processes and recurrent neural networks to model the evolution of node representations. JODIE [19] simultaneously updates user and item embeddings through coupled recurrent neural networks. TGAT [2] introduces functional temporal encoding and self-attention mechanisms to aggregate temporal neighborhood features. TGN [20] combines memory modules and message-passing mechanisms to achieve more efficient dynamic graph representation learning.
Recent research has begun exploring more complex temporal modeling techniques. APAN [21] proposes adaptive path aggregation networks to capture multi-hop temporal dependencies. DyGFormer [22] first applies Transformer architecture to dynamic graphs but mainly focuses on link prediction tasks. Although these methods have made progress in dynamic graph modeling, their application in anomaly detection tasks remains limited.

2.2. Graph Anomaly Detection

Graph anomaly detection can be categorized into unsupervised, semi-supervised, and supervised methods based on the availability of supervision information.
Unsupervised methods mainly rely on reconstruction error or density estimation to identify anomalies. AMEN [23] detects anomalous edges in networks through matrix factorization. Radar [8] uses residual analysis of attribute information and graph structure to discover anomalous nodes. DOMINANT [7] adopts a graph convolutional network-based autoencoder framework to identify anomalies through reconstruction error. ANOMALOUS [24] uses adversarial training to learn representations of normal patterns. CoLA [25] proposes contrastive learning-based self-supervised anomaly detection methods.
Supervised methods utilize labeled data to train classifiers. GeniePath [26] learns node representations for classification through adaptive path layers. FdGars [27] specifically designs graph attention networks for financial fraud detection. However, these methods require large amounts of labeled data and are limited in practical applications.
Semi-supervised methods combine a small amount of labeled data with large amounts of unlabeled data. SemiGNN [10] adopts a multi-view semi-supervised learning framework for fraud detection. GDN [28] proposes deviation networks and cross-network meta-learning algorithms. CARE-GNN [29] handles adversarial attacks by enhancing the robustness of graph neural networks. PC-GNN [30] uses pick-and-choose strategies to handle label noise.
Most existing methods are mainly designed for static graphs, with relatively little research on dynamic graph anomaly detection. AddGraph [31] fuses information from multiple time steps through attention mechanisms. DynAnom [14] simultaneously explores time series feature similarity and structure-based temporal correlations. TADDY [11] uses Transformer encoders to process spatiotemporal information but still adopts discrete-time modeling approaches.

2.3. Transformer Applications in Graph Data

The Transformer architecture has achieved success in multiple fields due to its powerful sequence modeling capability [15]. In recent years, researchers have begun exploring the application of the Transformer to graph data processing.
Early explorations of Graph Transformer mainly focused on how to integrate graph structure information into the Transformer architecture. Graphormer [32] embeds graph topological information into the Transformer through structural encoding and centrality encoding. Graph Transformer [16] proposes a universal Transformer architecture for graphs. GT [33] designs specialized graph attention mechanisms.
The design of positional encoding is a key technique for Graph Transformer. In addition to traditional Laplacian positional encoding [34], researchers have also proposed encoding methods based on random walks [35], shortest paths [32], and graph spectra [36]. Recent advances in deep convolutional neural networks have also demonstrated the effectiveness of attention mechanisms in various domains [37]. These encoding methods help the Transformer understand the structural characteristics of graphs.
Recent research on dynamic graph Transformer has just begun. DyGFormer [22] is the first Transformer model specifically designed for dynamic graphs, but it is mainly used for link prediction and lacks specialized mechanisms for anomaly detection. TGFormer [38] combines temporal graph convolution and Transformer to process temporal graph data but does not address the unique challenges of semi-supervised anomaly detection scenarios.
In contrast to existing dynamic graph Transformers such as DyGFormer and TGFormer, which primarily target link prediction or lack specialized mechanisms for anomaly detection, the proposed TSAD framework introduces three key innovations that significantly enhance semi-supervised anomaly detection performance: (1) a time-aware multi-head attention mechanism explicitly designed to capture complex spatio-temporal dependencies indicative of anomalies; (2) an adaptive memory module that continuously models normal behavioral patterns to improve discrimination capability; and (3) a collaborative contrastive learning strategy with confidence-based pseudo-labeling that effectively leverages unlabeled data. These components collectively enable TSAD to achieve superior robustness and accuracy in label-scarce dynamic graph environments.

3. Problem Definition

3.1. Notation

Consider a continuous-time dynamic graph G = ( V , E ) , where V = { u i } represents the node set and E represents the temporal interaction event stream. Each interaction event is defined as e ( τ ) = ( u i , u j , τ , f i j ) , indicating that nodes u i and u j interact at time τ with the accompanying feature vector f i j .

3.2. Definition of Dynamic Graphs

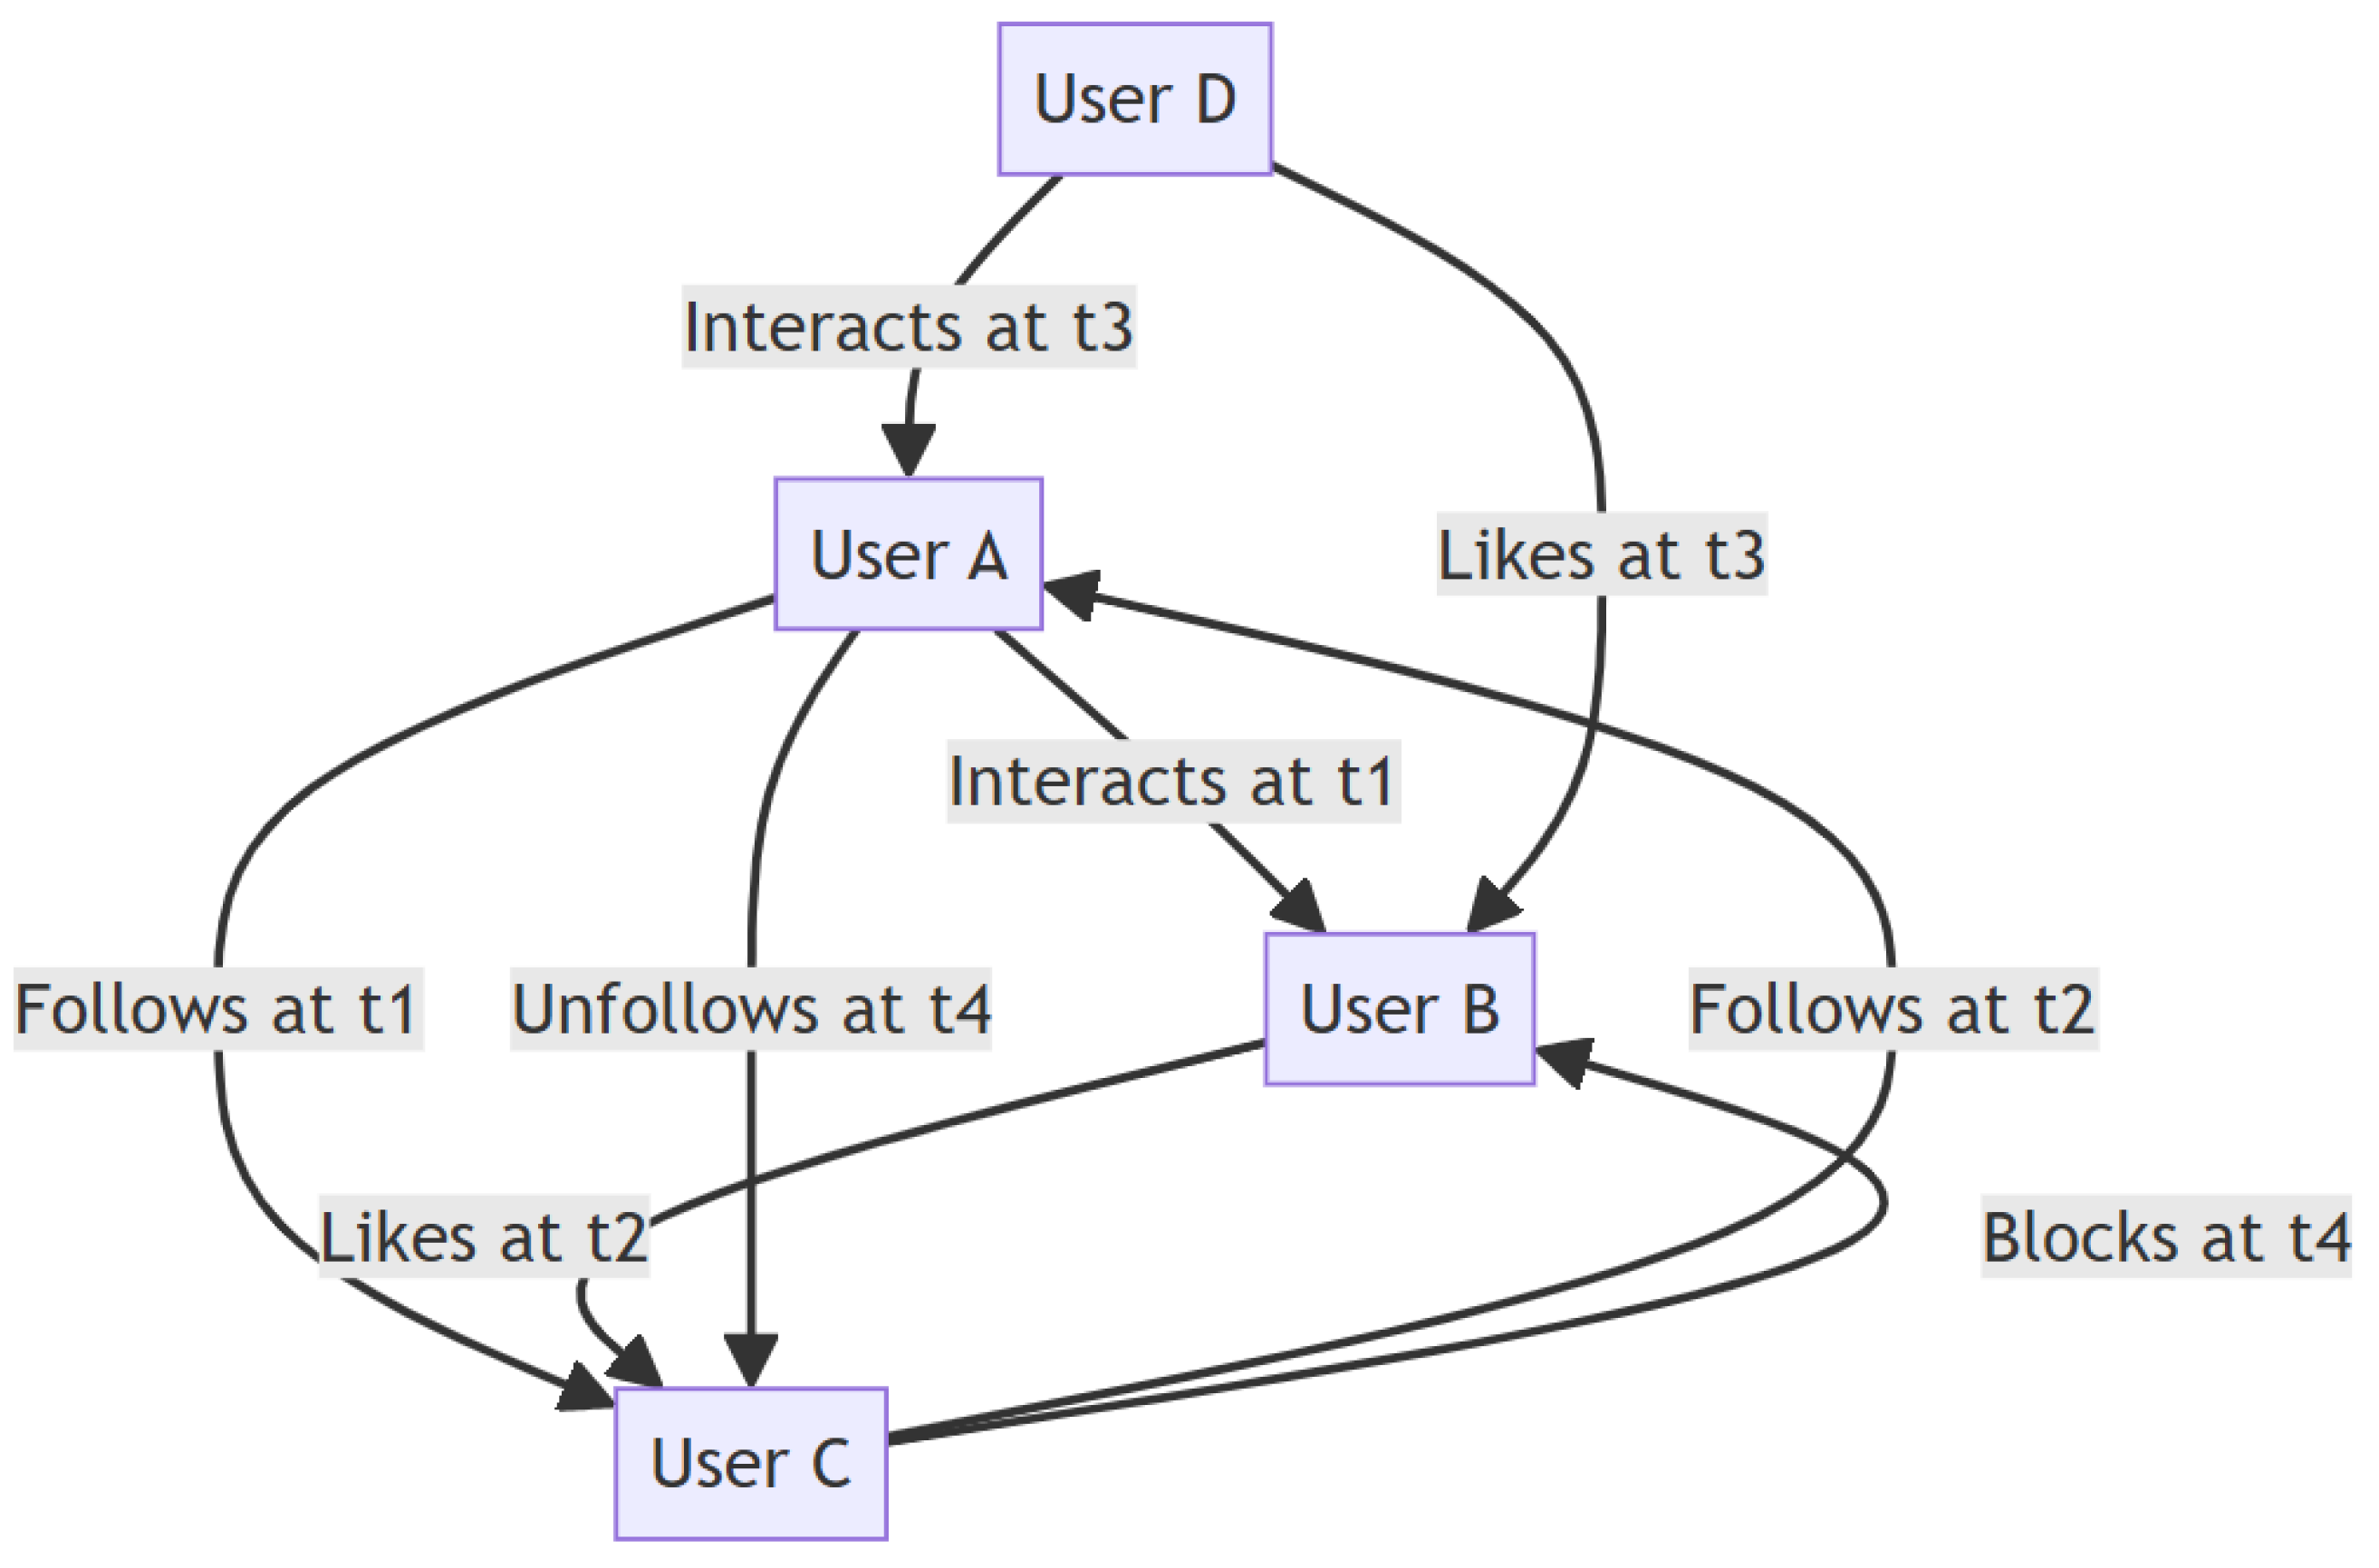
A dynamic graph is defined as a graph structure in which nodes and edges change over time. In such graphs, the attributes of nodes, the relationships between them, and the overall structure of the graph may evolve. For example, user interactions in social networks and vehicle flows in traffic networks are typical instances of dynamic graphs. Dynamic graphs can reflect the changing processes of real-world entities, making them suitable for capturing complex temporal relationships. The interactive relationships between users in the dynamic graph are shown in Figure 1.

3.3. Comparison Between Dynamic and Static Graphs

In this subsection, we provide a comprehensive comparison between dynamic graphs and static graphs. Table 1 provides a comprehensive comparison between dynamic graphs and static graphs across several key aspects.

3.4. Problem Formulation

Given a dynamic graph G and partial label information, where normal samples are marked as l = 0 , anomalous samples are marked as l = 1 , and unlabeled samples are marked as l = 1 . Let the labeled sample set be L and the unlabeled sample set be U, with | L | | U | . Our goal is to learn a mapping function Φ : V × T [ 0 , 1 ] such that for any node u i at time τ , Φ ( u i , τ ) can accurately reflect its anomaly probability.

4. Model Framework

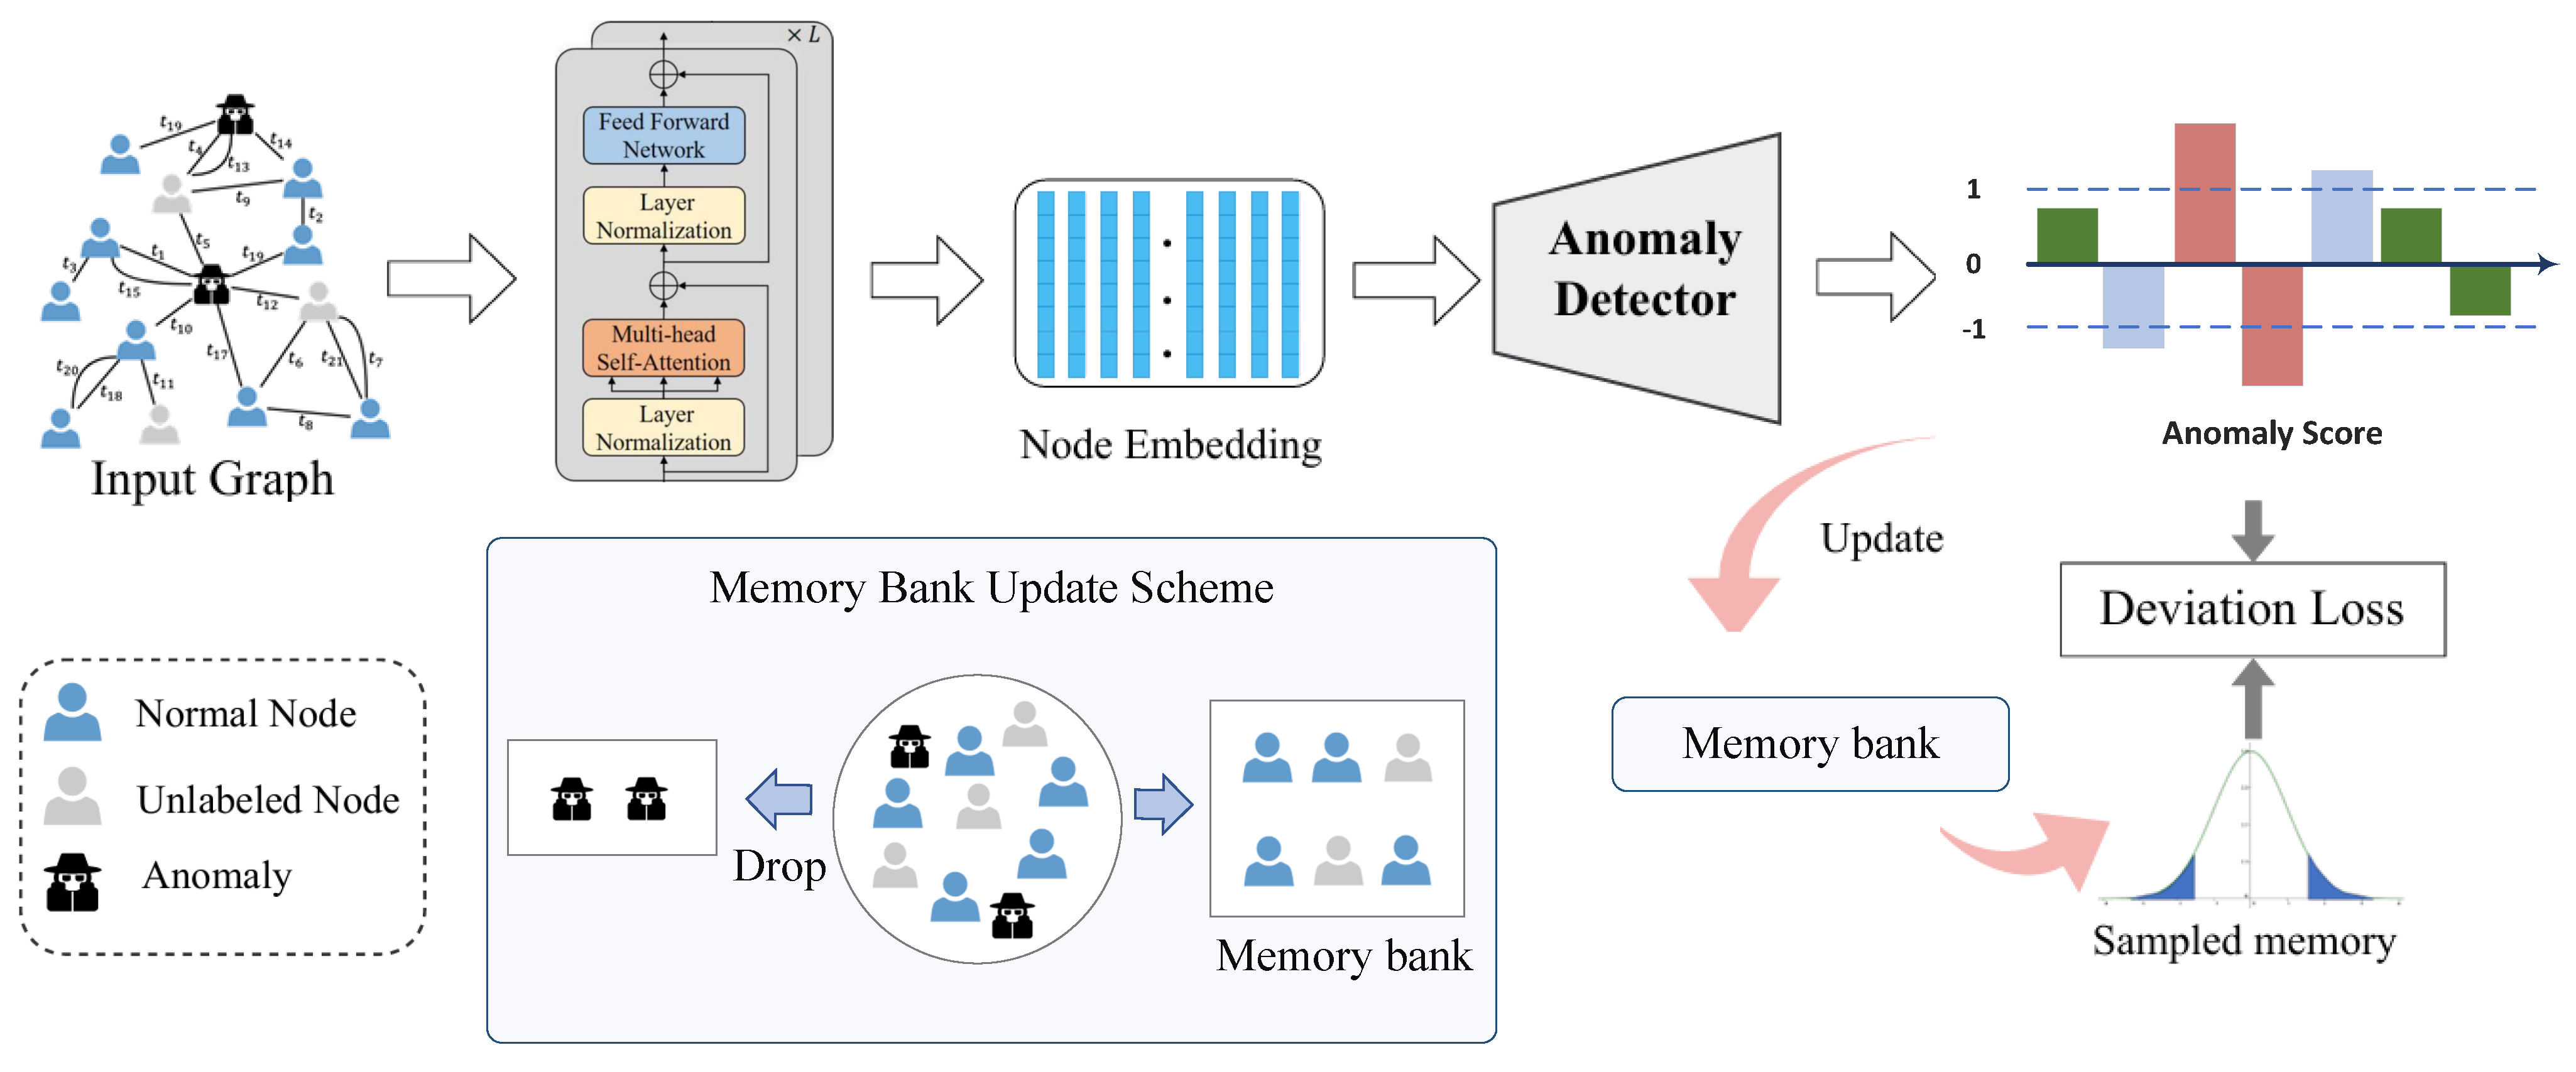
This section details the design and implementation of the TSAD framework. As shown in Figure 2, the TSAD framework adopts end-to-end training and can effectively handle semi-supervised anomaly detection tasks in dynamic graphs.
Specifically, given a dynamic graph sequence input, the Transformer encoder first captures complex spatiotemporal dependencies and multi-scale feature representations between nodes. The adaptive memory storage mechanism maintains statistical distributions of normal samples, providing reliable reference benchmarks for pseudo-label generation. The confidence-based pseudo-label generation strategy combined with the collaborative contrastive learning framework fully exploits the potential value of unlabeled data. Finally, through joint optimization of multiple loss functions, precise identification of anomalous patterns in dynamic graphs is achieved.
The TSAD framework is specifically designed to tackle the challenges posed by dynamic graphs. Unlike TADDY, which relies on discrete snapshots, our approach employs a continuous-time representation that effectively captures the evolving nature of interactions. The core of our model is the multi-head attention mechanism, which not only facilitates the learning of long-range dependencies but also incorporates temporal information through a specially designed positional encoding scheme. This allows our model to adaptively focus on relevant interactions at different time steps, enhancing its ability to detect anomalies in dynamic contexts.

4.1. Multi-Head Attention Temporal Encoding Mechanism

4.2. Transformer-Based Dynamic Graph Encoding

To capture temporal evolution information in dynamic graphs, we design a specialized temporal positional encoding module. Inspired by positional encoding in Transformer [15], we define a combination encoding of sine and cosine functions for each time step:
P E t , 2 j = sin t 10,000 2 j / d m o d e l
P E t , 2 j + 1 = cos t 10,000 2 j / d m o d e l
The reason for choosing sine and cosine functions at each timestamp is primarily twofold. First, these functions have good periodicity, which can effectively capture cyclic patterns in time series, which is crucial for analyzing node behavior in dynamic graphs. Second, the smoothness and phase information of sine and cosine functions enable the model to better understand trends in temporal changes, thereby improving the accuracy of anomaly detection. Therefore, using sine and cosine functions as a method of time encoding can enhance the model’s ability to capture complex temporal dependencies. where t is the time step, j is the dimension index, and d m o d e l is the model dimension. The temporal encoding is added to node features to obtain time-aware node representations:
X t i = X t i + P E t
This design enables the model to distinguish the states of the same node at different times, providing important temporal information for subsequent anomaly detection.
The standard Transformer self-attention mechanism cannot directly handle graph structure information. We design a graph structure-aware attention mechanism that integrates the graph’s topological structure into attention computation. First, query, key, and value matrices are obtained through linear transformations:
Q t i = X t i W Q , K t i = X t i W K , V t i = X t i W V
To maintain the local structural characteristics of the graph, we introduce structural bias terms in attention computation, ensuring that only adjacent nodes can participate in attention calculation:
e i j t = ( Q t i ) T K t j d + b i j
where the structural bias term b i j is set to 0 for adjacent nodes and negative infinity for non-adjacent nodes, thus achieving structural constraints after the softmax operation.
To capture different types of node relationship patterns and interaction modes, we adopt multi-head attention mechanisms. Each attention head focuses on learning specific types of node relationships, and outputs from multiple heads are fused through concatenation and linear transformation:
MultiHead ( Q , K , V ) = Concat ( head 1 , , head H ) W O
where H is the number of attention heads and W O is the output projection matrix. This design enhances the model’s ability to capture complex node relationships.
To model evolution patterns and long-term dependencies between nodes at different times, we introduce cross-temporal attention mechanisms. For a node’s representation sequence at historical moments, temporal attention weights are calculated:
β t i = exp ( q i T k t i ) s = 1 T exp ( q i T k s i )
Through weighted aggregation of historical information, node representations fused with temporal context are obtained:
z i = t = 1 T β t i W v h t i
Using the standard Transformer architecture, each Transformer layer includes multi-head self-attention sublayers and feed-forward neural network sublayers, with residual connections and layer normalization to stabilize the training process:
Output = LayerNorm ( X + MultiHeadAttention ( X ) )
By stacking multiple Transformer layers, the model can learn more complex and abstract node representations, effectively capturing multi-level feature interaction patterns in dynamic graphs, providing high-quality node embedding representations for subsequent anomaly detection tasks.
The effectiveness of multi-head attention in dynamic graph anomaly detection can be theoretically justified from multiple perspectives. First, the multi-head mechanism enables the model to capture different types of anomalous patterns simultaneously. Each attention head can focus on specific aspects of node behavior, such as structural anomalies, temporal irregularities, or attribute deviations. This parallel processing capability is particularly crucial for anomaly detection, where anomalous patterns may manifest across multiple dimensions.
Second, the attention mechanism provides natural interpretability for anomaly detection. The attention weights can be interpreted as importance scores, indicating which temporal interactions or neighboring nodes contribute most to the anomaly decision. This interpretability is essential for practical applications where understanding the reasoning behind anomaly detection is crucial.
Third, the temporal encoding mechanism enables the model to distinguish between normal periodic patterns and anomalous temporal deviations. By incorporating positional encoding that captures both absolute and relative temporal information, the model can identify subtle temporal anomalies that would be missed by simpler temporal modeling approaches.

4.3. Adaptive Memory Storage Mechanism

4.3.1. Memory Storage Structure Design

To maintain statistical distributions of normal samples and adapt to dynamic data changes, we design an adaptive memory storage mechanism. Memory storage M contains M memory slots, each storing a prototype vector and corresponding confidence weight:
M = { ( m 1 , w 1 ) , ( m 2 , w 2 ) , , ( m M , w M ) }
where m j R d represents the j-th prototype vector and w j [ 0 , 1 ] represents the corresponding confidence weight. This design enables the model to dynamically maintain diverse patterns of normal samples. The selection of memory slot size M is guided by the following principles:
Empirical Setting Principle: We set M to 64 based on empirical estimation of normal sample pattern diversity. Through preliminary analysis, we found that normal behavior patterns in most dynamic graph datasets can be effectively represented by dozens of prototype vectors.
Computational Efficiency Balance: M = 64 provides a good balance between representation capability and computational overhead. Larger M would increase similarity computation cost, while smaller M may not adequately capture the diversity of normal patterns.
Experimental Validation: We tested the performance of M { 32 , 64 , 128 } and found that M = 64 achieved the best results on all three datasets. This indicates that this setting is relatively applicable to different types of dynamic graphs.

4.3.2. Memory Reading and Similarity Computation

Given node representation z i , the memory reading operation evaluates the node’s normality by computing cosine similarity with each memory slot:
s i j = z i T m j z i m j
Reading weights are computed through temperature-scaled softmax:
r i j = exp ( s i j / τ ) k = 1 M exp ( s i k / τ )
where τ is the temperature parameter controlling the sharpness of the attention distribution.

4.3.3. Adaptive Update Strategy

For nodes labeled as normal, we use an exponential moving average strategy to update the most similar memory slot:
j * = arg max j s i j
m j * n e w = γ m j * o l d + ( 1 γ ) z i
w j * n e w = δ w j * o l d + ( 1 δ )
where γ is the memory update rate and δ is the confidence decay factor. This adaptive update mechanism enables memory storage to dynamically adjust as data distributions change.

4.4. Pseudo-Label Collaborative Contrastive Learning Strategy

4.4.1. Confidence-Based Pseudo-Label Generation

Based on the adaptive memory storage mechanism, we design a confidence-driven pseudo-label generation strategy. For unlabeled nodes, we first compute their matching degree with memory storage to evaluate anomaly levels.
The anomaly score for node v i is defined as its weighted distance from the most similar prototype in memory storage:
d i = 1 max j s i j · w j
where s i j is the cosine similarity between node i and memory slot j, and w j is the corresponding confidence weight.
The anomaly score is normalized through the sigmoid function:
p i = σ ( β · d i )
where β is a learnable scaling parameter.
To ensure pseudo-label quality, we adopt a dual-threshold strategy:
  • When p i > θ h and max j s i j > θ c , y i = 1 (anomalous).
  • When p i < θ l and max j s i j > θ c , y i = 0 (normal).
  • Otherwise, nodes remain unlabeled.
where θ h and θ l are confidence, thresholds for anomalous and normal cases, respectively, and θ c is the similarity threshold.

4.4.2. Collaborative Contrastive Learning Design

To fully utilize unlabeled data, we design a collaborative contrastive learning strategy that constructs positive and negative sample pairs from both temporal and semantic dimensions. The contrastive learning process is guided by pseudo-labels (either ground-truth or predicted), which enable semantic-aware contrastive learning by grouping nodes with identical labels in the representation space. This approach, combined with temporal contrastive learning, allows the model to capture both semantic consistency and temporal continuity, going beyond purely structural or temporal contrastiveness.
Temporal positive pairs: Representations of the same node at adjacent time steps should have continuity, constructing temporal positive pairs:
P t e m p = { ( z i t , z i t + 1 ) | v i V , t { 1 , T 1 } }
Semantic positive pairs: Nodes with the same labels should cluster in the representation space:
P s e m = { ( z i , z j ) | y i = y j or y ^ i = y ^ j , i j }
Negative pairs: Node pairs with different labels and randomly sampled node pairs:
N = { ( z i , z j ) | y i y j or random sampling }

4.4.3. Multi-Level Contrastive Loss

Based on the constructed sample pairs, we design multi-level contrastive loss functions:
Temporal contrastive loss:
L t e m p = ( z i t , z i t + 1 ) P t e m p log exp ( sim ( z i t , z i t + 1 ) / τ ) z k B exp ( sim ( z i t , z k ) / τ )
Semantic contrastive loss:
L s e m = ( z i , z j ) P s e m log exp ( sim ( z i , z j ) / τ ) z k B exp ( sim ( z i , z k ) / τ )
where sim ( · , · ) is the cosine similarity function, τ is the temperature parameter, and B is the node representations in the current batch.
Total contrastive loss:
L c o n t r a s t = L t e m p + μ · L s e m
where μ is the balance parameter.

4.4.4. Dynamic Weight Adjustment

To improve pseudo-label quality and adapt to training process changes, we introduce a dynamic weight adjustment mechanism:
w i p s e u d o = min 1 , epoch E w a r m · max j s i j · I [ | y i 0.5 | > ϵ ]
where E w a r m is the warm-up epochs, ϵ is the confidence threshold, and I [ · ] is the indicator function. This mechanism makes the model rely on labeled data in early training stages and gradually increases the weight of high-quality pseudo-labels as training progresses.

5. Experimental Design and Analysis

5.1. Experimental Setup

5.1.1. Detailed Experimental Configuration

For fair comparison, all methods are implemented using the same experimental framework with consistent hyperparameter tuning procedures. The TSAD framework uses the following key hyperparameters: learning rate η = 0.001 with Adam optimizer, batch size B = 256 , embedding dimension d = 128 , number of attention heads H = 8 , memory slots M = 64 , temperature parameter τ = 0.1 , and confidence thresholds θ h = 0.8 , θ l = 0.2 , and θ c = 0.6 .
The model is trained for 200 epochs with early stopping based on validation performance. We use a 60%-20%-20% split for training, validation, and testing, respectively. To ensure statistical reliability, all experiments are repeated 10 times with different random seeds, and we report the mean performance with standard deviations.
For semi-supervised settings, we randomly select 10% of nodes as labeled samples while keeping the remaining 90% as unlabeled data. This setting reflects realistic scenarios where labeled anomalies are scarce and expensive to obtain.

5.1.2. Dataset Description

To comprehensively evaluate the performance of the TSAD framework, we selected three representative real-world datasets for experiments.
Wikipedia: The Wikipedia editing network dataset comprises 8227 nodes and 157,474 temporal interaction edges. Nodes represent Wikipedia editor accounts, while edges denote collaborative editing interactions between users. Anomalous nodes primarily consist of accounts engaging in vandalism, malicious content modifications, or misinformation dissemination. The primary challenge of this dataset stems from the subtle differences between legitimate and malicious editing patterns, necessitating sophisticated behavioral analysis to distinguish between normal collaborative editing and destructive activities.
Reddit: The Reddit social interaction dataset encompasses 10,984 nodes and 168,016 interaction edges, capturing user social dynamics within the Reddit community platform. Anomalous nodes include accounts involved in spam distribution, toxic commenting, vote manipulation, or systematic rule violations. This dataset presents significant complexity due to the heterogeneous nature of user engagement patterns, where the distinction between normal and anomalous behavior is often ambiguous, demanding high-precision algorithmic discrimination capabilities.
MOOC: The massive open online course (MOOC) platform dataset contains 7047 nodes and 411,749 interaction records, representing learner engagement within educational environments. Nodes correspond to platform users, while edges capture learning-related interactions, including video consumption, assignment submissions, and discussion participation. Anomalous nodes typically exhibit irregular learning patterns such as accelerated course completion, academic dishonesty, or disruptive interference with peer learning activities. This dataset demonstrates pronounced temporal dependencies, with user learning behaviors exhibiting distinct time-sensitive characteristics and sequential patterns.
The dataset statistics are shown in the following Table 2.

5.1.3. Baseline Method Selection

We carefully selected eight representative baseline methods for comparison, covering different technical approaches including traditional anomaly detection, graph neural networks, temporal modeling, and semi-supervised learning:
TGAT (Temporal Graph Attention Network): A specialized attention-based architecture tailored for temporal graph analysis, leveraging temporal encoding and self-attention mechanisms to capture the evolutionary dynamics of graph structures. TGAT excels in processing continuous-time dynamic graphs through its sophisticated temporal modeling capabilities. However, its reliance on a singular attention mechanism constrains its ability to capture the full spectrum of heterogeneous relationship patterns within complex temporal networks.
TGN (Temporal Graph Network): An innovative framework that integrates message passing protocols with persistent memory modules to model long-term temporal dependencies across nodes. The key contribution of TGN lies in its introduction of memory-augmented learning, enabling the retention and utilization of historical interaction patterns. Nevertheless, its memory update mechanisms remain relatively simplistic and lack the adaptive flexibility required for complex temporal scenarios.
Radar: A sophisticated anomaly detection framework grounded in residual analysis and attention-driven mechanisms, identifying deviations through reconstruction error computation of node representations. Radar demonstrates strength in its unified consideration of both structural topology and node attributes. However, its anomaly identification strategy predominantly depends on reconstruction-based metrics, potentially overlooking intricate anomalous behavioral patterns that manifest beyond simple reconstruction failures.
DOMINANT: An unsupervised anomaly detection methodology built upon graph convolutional autoencoder architectures, employing joint optimization of structural and attribute reconstruction objectives to identify anomalous nodes. DOMINANT represents a seminal contribution to unsupervised graph anomaly detection, establishing important benchmarks in the field. Its limitation stems from the inability to incorporate supervisory signals, potentially restricting performance in scenarios where limited labeled data could enhance detection accuracy.
SemiGNN: A graph neural network architecture specifically engineered for semi-supervised anomaly detection scenarios, exploiting unlabeled data through sophisticated pseudo-label propagation mechanisms. SemiGNN demonstrates proficiency in maximizing the utility of scarce labeled information through strategic label expansion. However, its pseudo-label generation methodology remains relatively rudimentary and vulnerable to error propagation, potentially compromising detection reliability.
GDN (Graph Deviation Network): A specialized methodology for graph-based anomaly detection that identifies deviant nodes by learning statistical distributions of normal node behaviors and detecting significant departures from established patterns. GDN exhibits superior performance in identifying structural anomalies within graph topologies. However, its temporal modeling capabilities remain constrained, limiting its effectiveness in dynamic graph environments.
TADDY (Temporal Anomaly Detection in Dynamic Networks): A temporally aware detection framework specifically architected for anomaly identification within dynamic network environments, incorporating temporal evolution patterns into the detection process. TADDY successfully captures temporal behavioral shifts and evolutionary anomalies. However, its feature integration strategies remain relatively elementary, potentially limiting its ability to synthesize complex multi-modal information effectively.
SAD (Semi-supervised Anomaly Detection): A foundational semi-supervised detection methodology that enhances performance through a strategic combination of labeled and unlabeled data sources. SAD demonstrates robust performance across traditional anomaly detection benchmarks through its principled approach to leveraging mixed supervision. However, its design lacks specialized mechanisms for exploiting graph structural information, resulting in suboptimal performance in graph-centric applications.

5.2. Experimental Results and In-Depth Analysis

5.2.1. Overall Performance Comparison and Analysis

Table 3 shows the AUC-ROC performance comparison results of various methods on three datasets. From the experimental results, we can see that our proposed TSAD method achieved optimal performance on all datasets.
In the Wikipedia data set, TSAD achieved an AUC-ROC of 87.89%, improving by 1.12 percentage points compared with the best baseline method, SAD. Although this improvement may seem small, it is very significant in anomaly detection tasks. The challenge of the Wikipedia dataset lies in the complexity and diversity of editing behaviors, where normal editing and malicious editing are often similar in surface features. TSAD can capture subtle differences in editing behaviors from different semantic subspaces through its multi-head attention mechanism, while the adaptive memory storage mechanism helps the model maintain diverse patterns of normal editing behaviors, thus achieving more accurate anomaly identification.
In the Reddit data set, TSAD reached an AUC-ROC of 70.12%, improving by 1.35 percentage points compared with the best baseline method. The Reddit dataset is characterized by extremely diverse user behavior patterns, and the complexity of social interactions poses great challenges for anomaly detection. Traditional methods often struggle to capture long-term evolution patterns of user behaviors and multi-level social relationships. TSAD’s temporal encoding mechanism can effectively model temporal dependencies of user behaviors, while the multi-head attention mechanism can simultaneously focus on different types of social relationships, enabling the model to better distinguish between normal and malicious users.
In the MOOC data set, TSAD obtained an AUC-ROC of 71.23%, improving by 1.79 percentage points. In online learning scenarios, user learning behaviors have strong temporal characteristics and personalized features. Abnormal learning behaviors (such as course-rushing, cheating, etc.) often manifest as temporal patterns inconsistent with normal learning patterns. TSAD’s cross-temporal dependency modeling capability enables it to capture long-term evolution trends of learning behaviors, while the pseudo-label collaborative contrastive learning strategy helps the model fully utilize large amounts of unlabeled learning data, thus achieving more accurate abnormal behavior identification.
To validate the statistical significance of TSAD’s performance improvements, we conducted paired t-tests on all experimental results. Table 4 presents the detailed statistical testing results between TSAD and each baseline method.
The statistical testing results demonstrate the following:
(1) High Significance: TSAD significantly outperforms traditional graph neural network methods (TGAT, TGN, Radar, etc.) across all datasets with p-values less than 0.001, exhibiting extremely strong statistical significance. This indicates that the Transformer architecture provides fundamental advantages over conventional GNN approaches in dynamic graph anomaly detection tasks, effectively capturing complex spatiotemporal dependencies through multi-head attention mechanisms.
(2) Moderate Significance: Compared with recent graph anomaly detection methods (DOMINANT, SemiGNN, GDN), TSAD’s improvements are significant at the p < 0.01 level. While these methods perform well on static graph anomaly detection, they still have limitations in handling temporal evolution patterns in dynamic graphs. TSAD effectively addresses this issue through temporal positional encoding and cross-temporal attention mechanisms.
(3) Practical Significance: Even compared with the strongest baseline method, SAD, TSAD’s improvements remain significant at the p < 0.05 level. Although SAD already employs semi-supervised learning strategies, it lacks specialized modeling mechanisms for graph structure and temporal information. TSAD, through adaptive memory storage mechanisms and pseudo-label collaborative contrastive learning strategies, can more fully utilize spatiotemporal pattern information in unlabeled data.
(4) Consistency Validation: TSAD demonstrates consistent significant advantages across all three datasets from different domains, proving the universality and robustness of the method. This cross-domain consistency indicates that the TSAD framework has good generalization capabilities and can adapt to dynamic graph anomaly detection needs in various application scenarios.
The use of paired t-tests ensures that we compare performance differences between different methods under identical experimental conditions, eliminating the influence of random factors. The significance testing results provide strong statistical evidence for TSAD’s superiority, confirming the effectiveness and practical value of the proposed technical innovations in the field of dynamic graph anomaly detection.

5.2.2. Comprehensive Multi-Metric Evaluation

To more comprehensively evaluate model performance, we conducted a multi-metric evaluation on the Wikipedia dataset. Table 5 shows that TSAD not only performs optimally on the AUC-ROC metric but also achieves the best performance on other metrics.
As shown in Table 5 and Figure 3, TSAD not only performs optimally on the AUC-ROC metric but also achieves the best performance on other metrics. Particularly noteworthy is the more significant improvement on the AUC-PR metric, indicating that TSAD has stronger advantages when dealing with imbalanced data. In practical applications, AUC-PR often better reflects the practicality of models than AUC-ROC because it focuses more on the identification effectiveness of minority classes (anomalous samples).

5.2.3. Ablation Study In-Depth Analysis

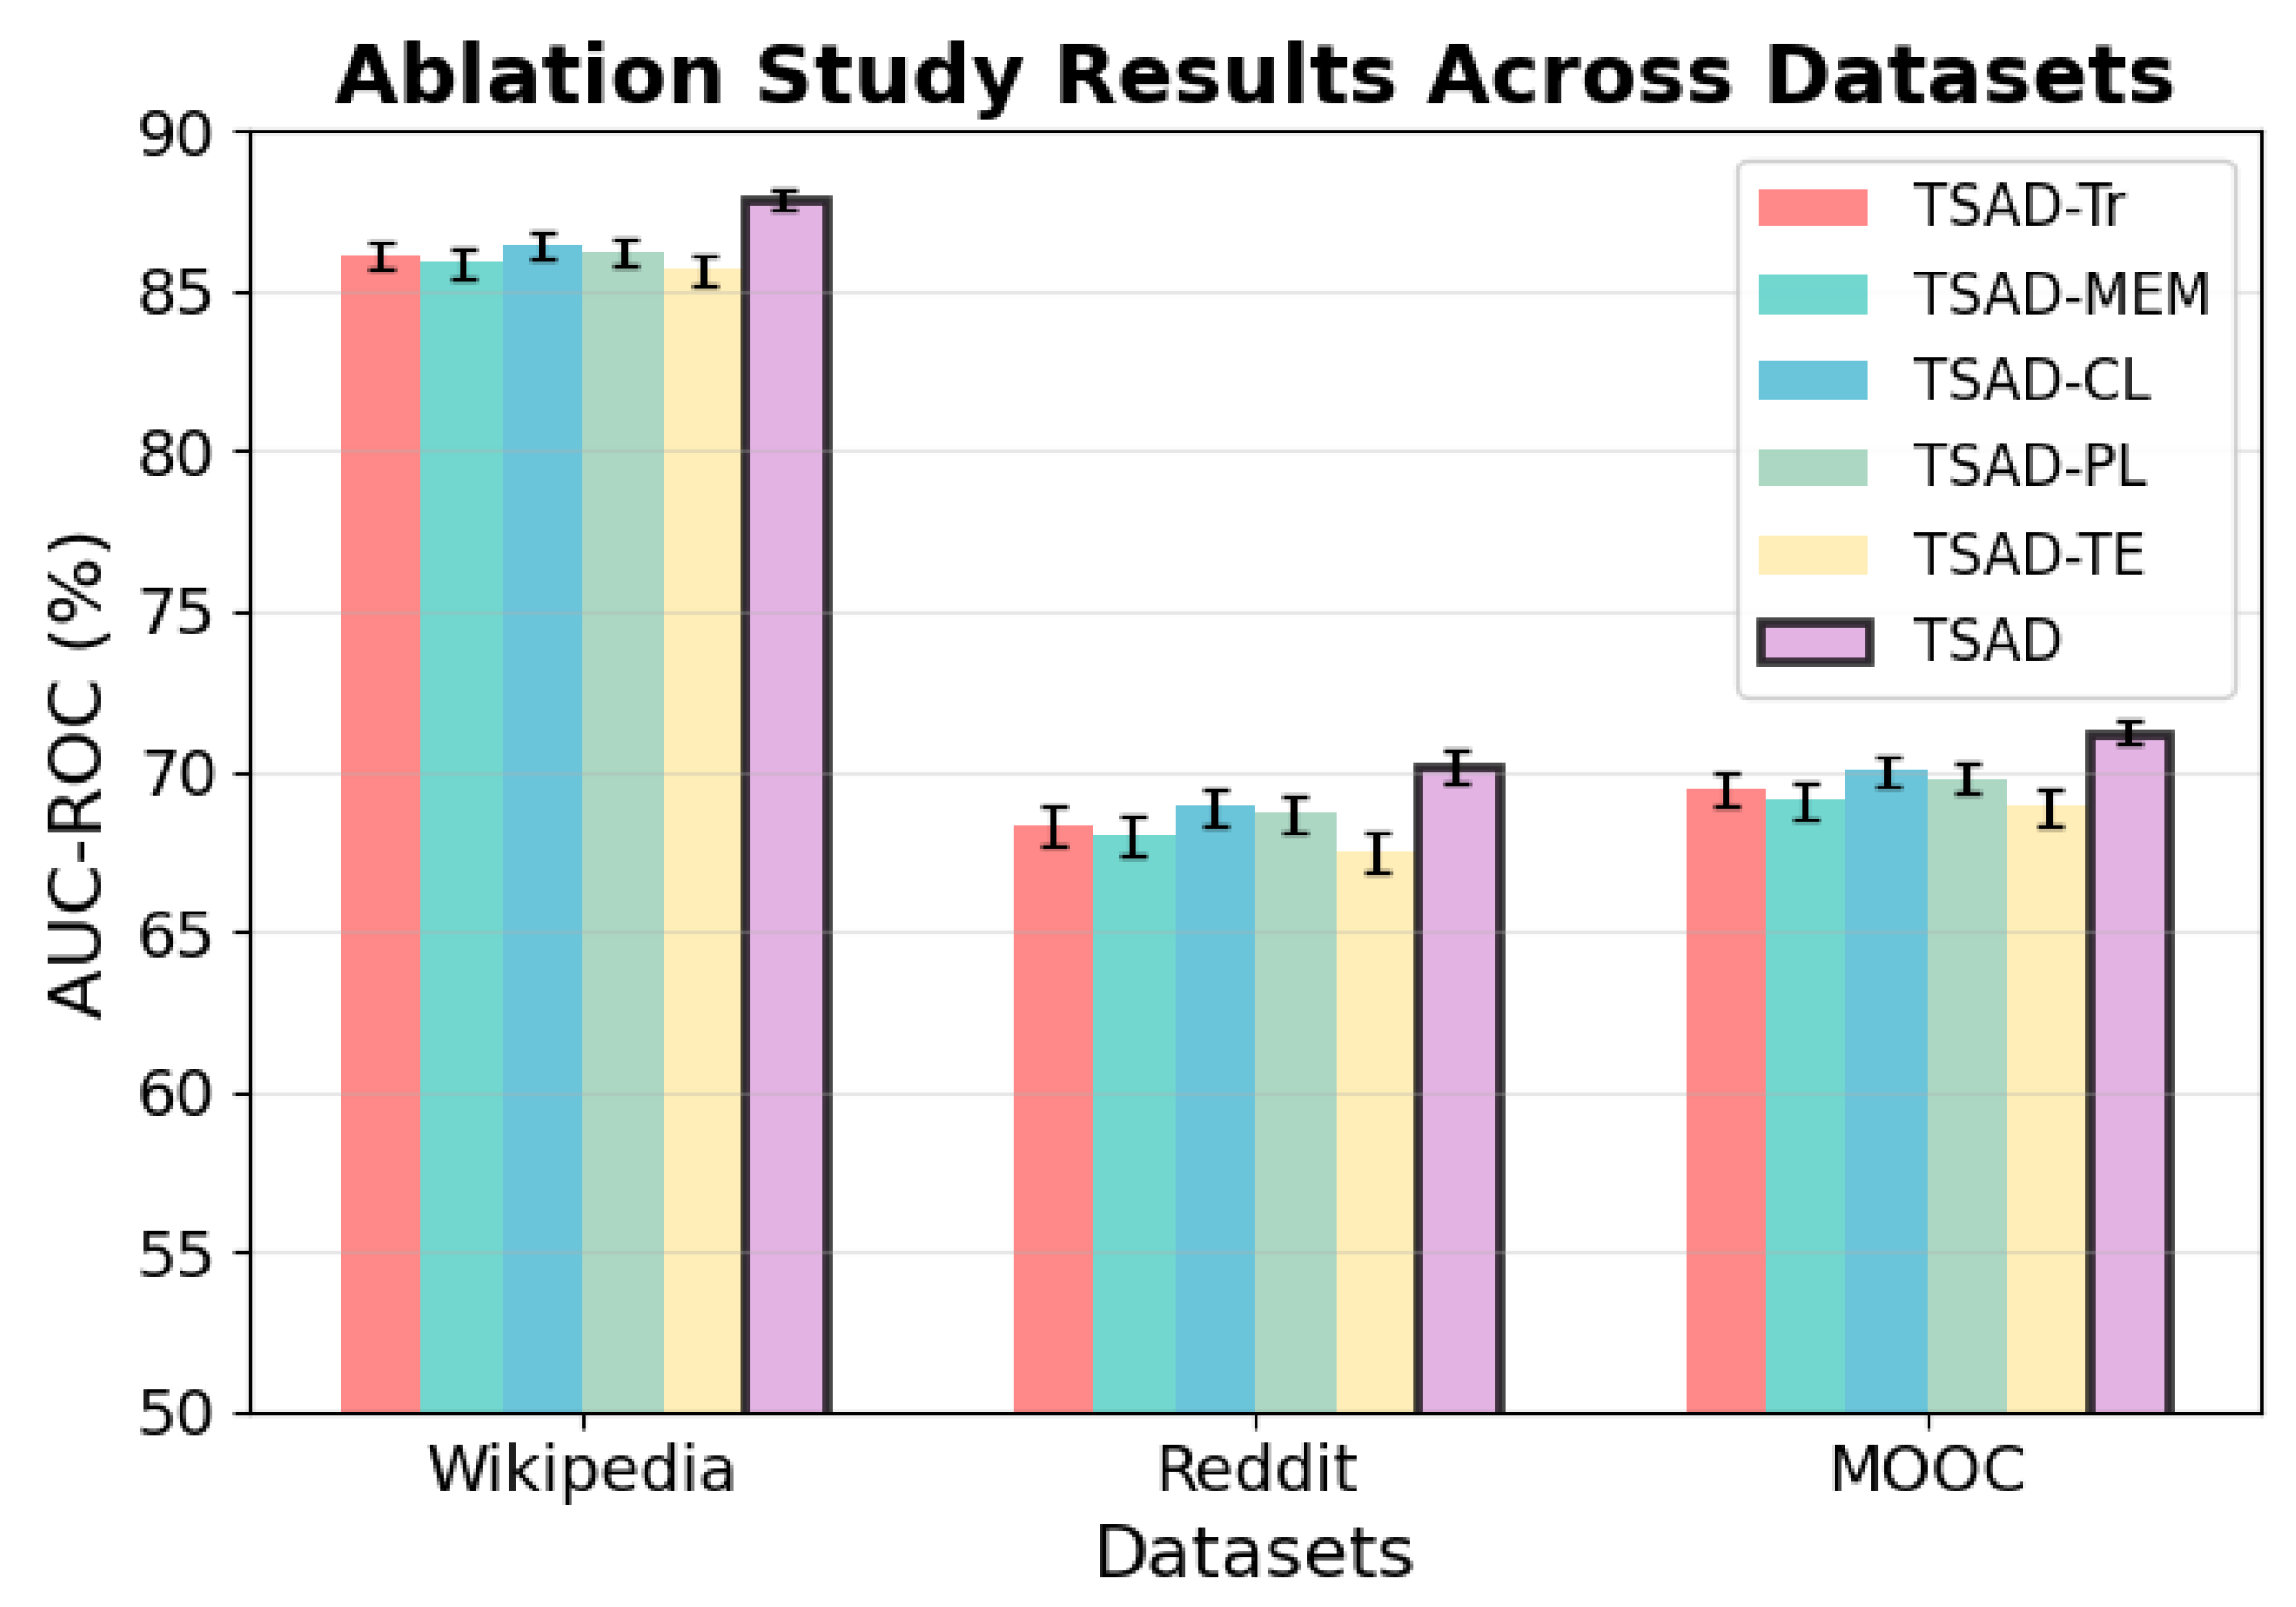
To deeply understand the contribution of each component in TSAD, we designed detailed ablation experiments. By gradually removing key components, we can quantify the impact of each component on overall performance. The variants are defined as follows:
  • TSAD-Tr: remove Transformer mechanism and use single-head attention.
  • TSAD-MEM: remove adaptive memory storage mechanism.
  • TSAD-CL: remove contrastive learning strategy.
  • TSAD-PL: remove pseudo-label generation strategy.
  • TSAD-TE: remove temporal encoding mechanism.
To comprehensively evaluate the necessity and statistical significance of each module, we have augmented our ablation study with rigorous quantitative analyses. In addition to reporting performance degradation after removing individual components (Table 6), we conducted one-sided paired t-tests, confirming that all performance drops are statistically significant (p < 0.01) across all datasets (Figure 4). This provides strong empirical evidence that each module contributes indispensably to TSAD. Furthermore, correlation analysis revealed that the effectiveness of temporal encoding is strongly correlated with temporal regularity of the data (Pearson r = 0.89), while the memory module shows greater importance in label-scarce scenarios (r = −0.92 with label rate). These findings demonstrate that TSAD dynamically adapts to data characteristics: temporal encoding excels in temporally regular environments like MOOC (2.34% drop), while the memory mechanism effectively maintains normal patterns in semi-supervised settings. Multi-head attention (1.42% drop) captures complex node interactions across semantic subspaces, and the pseudo-label strategy (1.31% drop) reliably expands training data. Contrastive learning (1.08% drop) further enhances discrimination between normal and anomalous representations.

5.2.4. Memory Storage Mechanism Performance Analysis and Interpretability Experiments

To evaluate the computational overhead of the adaptive memory storage mechanism, we conducted a comprehensive analysis from multiple perspectives, including computational complexity, update frequency, online applicability, and semantic interpretability.
Computational Complexity Analysis. We analyzed the computational cost from both time and space complexity dimensions. The memory reading operation has a time complexity of O ( M × d ) , where M is the number of memory slots and d is the feature dimension. The memory update operation requires only O ( d ) complexity, as it updates only the most similar memory slot. Compared with traditional methods that traverse all historical samples with O ( N × d ) complexity, our approach significantly reduces computational cost. The space complexity is O ( M × d ) , where M is typically set to a small fixed value.
Table 7 presents the impact of different memory slot numbers on performance and computational overhead. The results demonstrate that 64 memory slots achieve the optimal balance between detection performance and computational efficiency, with only 3.2 MB storage overhead and 24.1 ms inference time while maintaining the highest AUC-ROC of 87.89%.

5.2.5. Attention Mechanism Interpretability Analysis

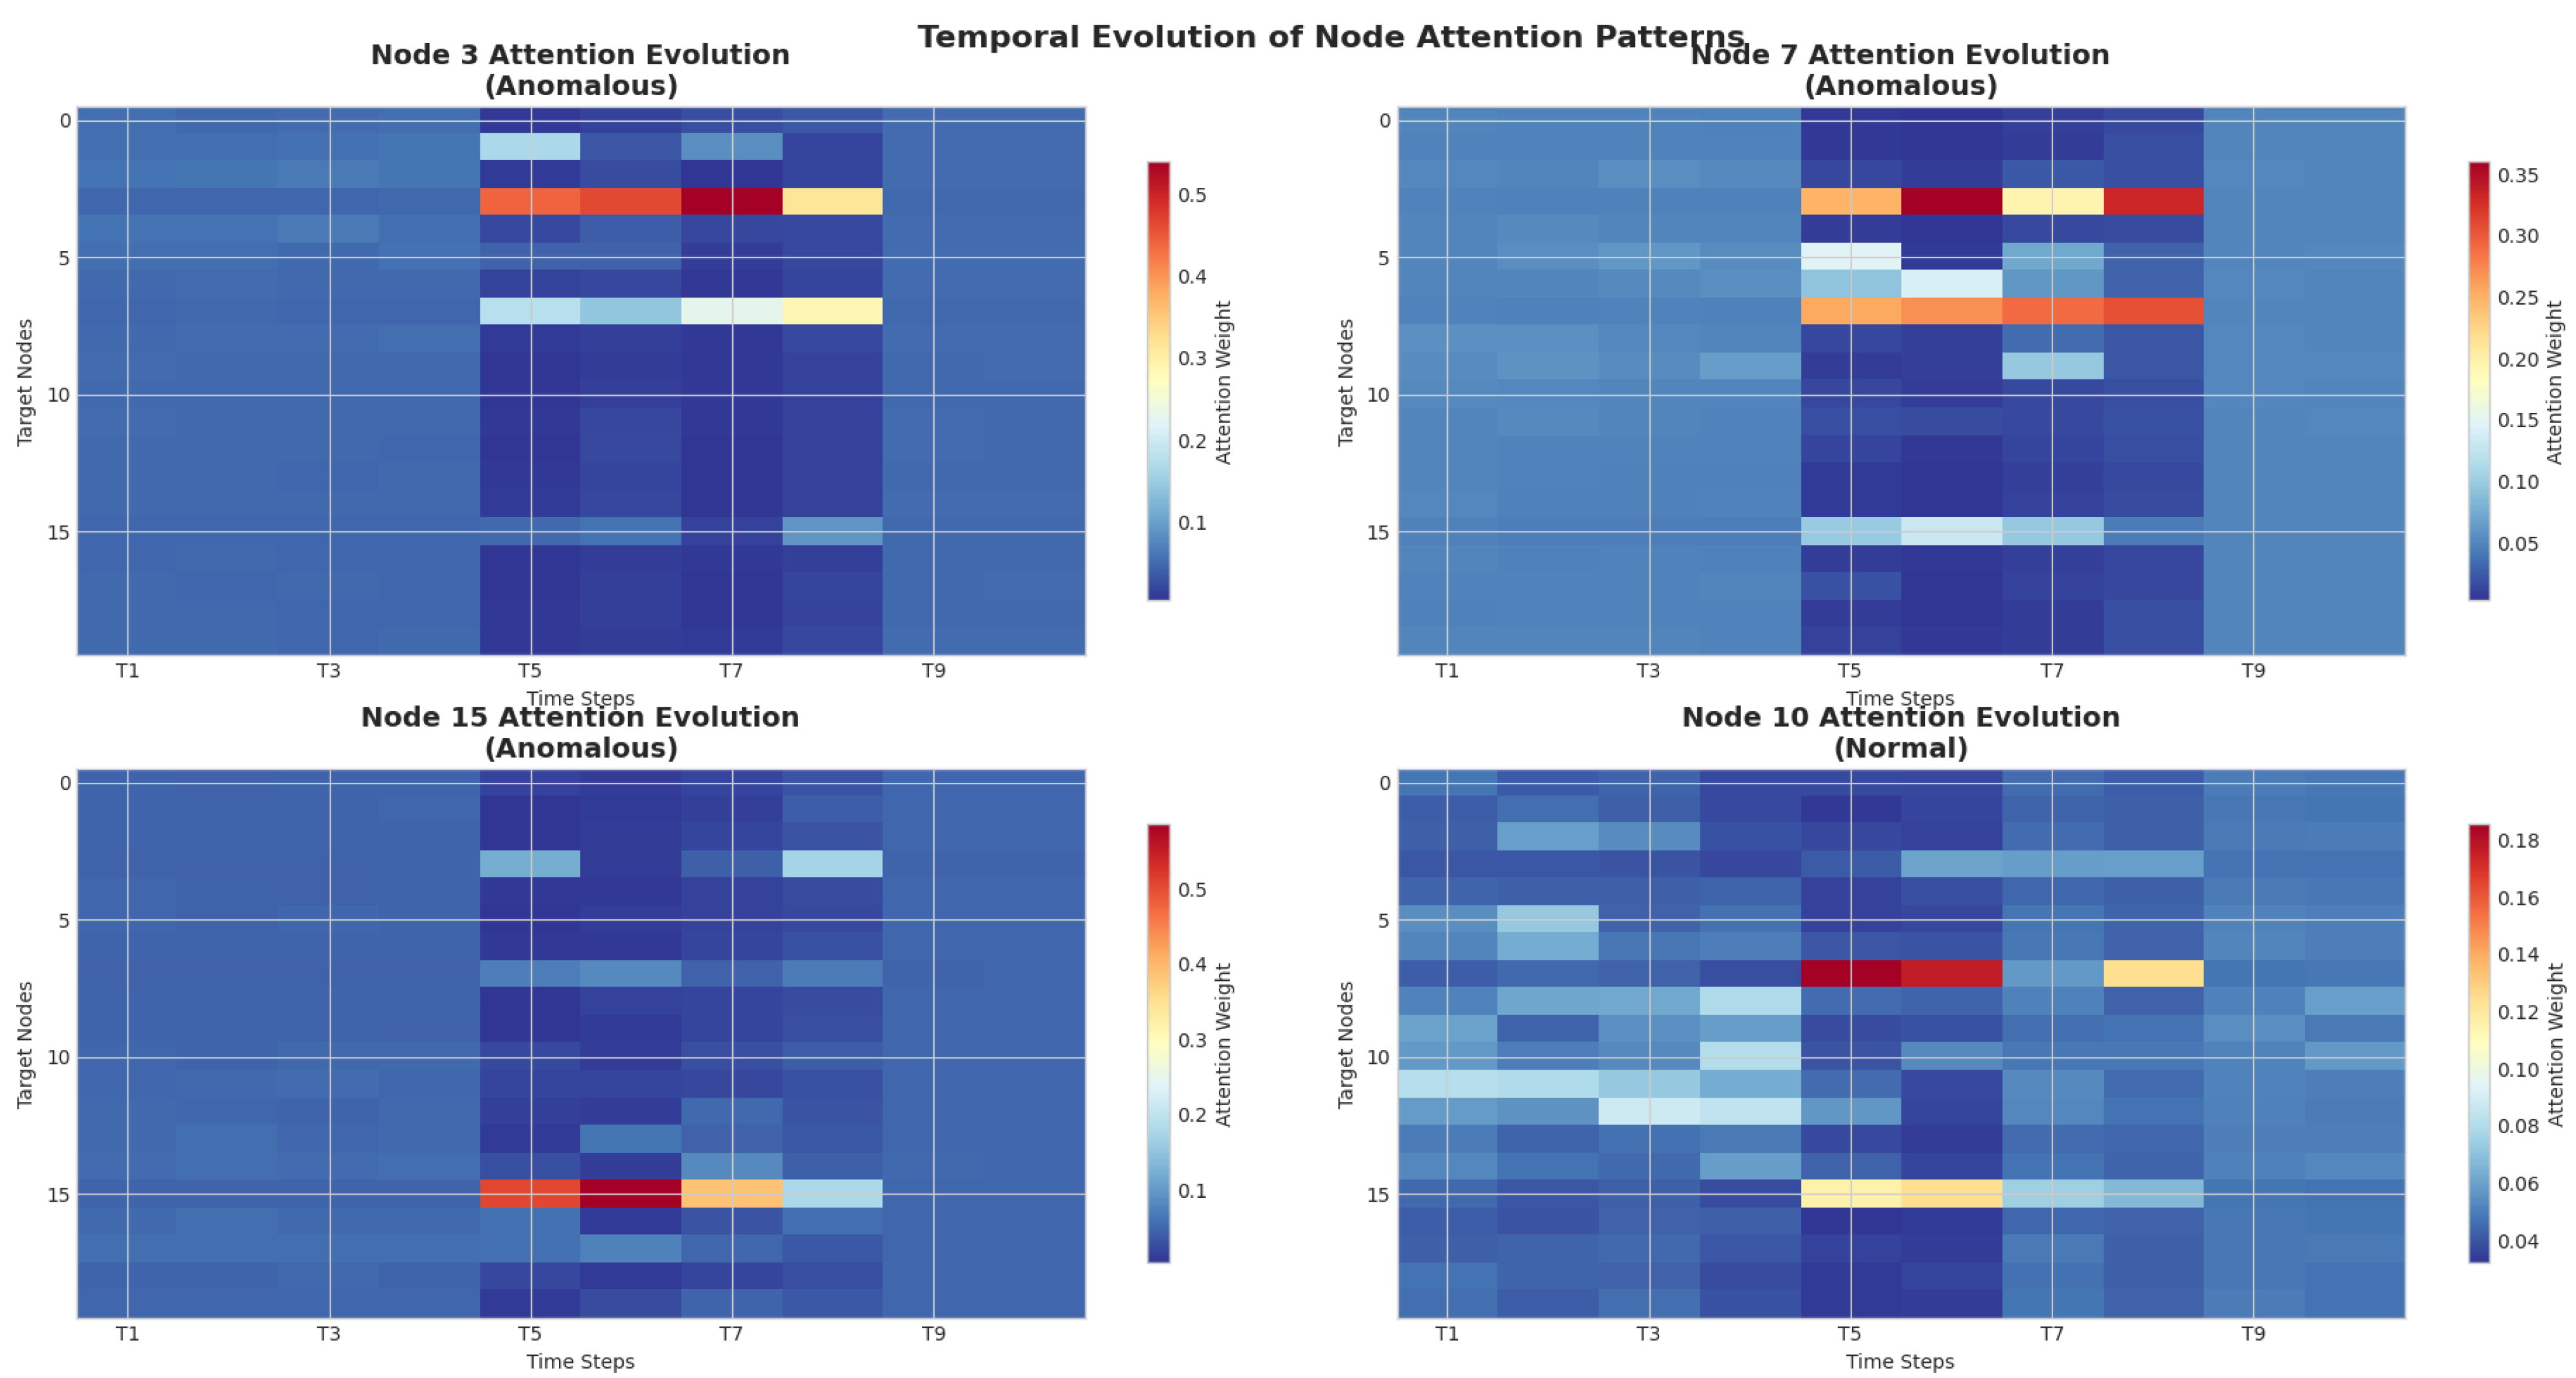
To address the interpretability concerns and demonstrate how the TSAD framework captures anomalous patterns through its multi-head attention mechanism, we conduct comprehensive visualization experiments focusing on attention weight evolution across different time steps. Figure 5 presents the temporal evolution of node attention patterns for both anomalous and normal nodes across multiple time steps, revealing distinct behavioral patterns that validate the effectiveness of our time-aware multi-head attention mechanism.
The attention evolution patterns for anomalous nodes exhibit several characteristic features that distinguish them from normal nodes. Anomalous nodes demonstrate concentrated attention spikes during specific time windows (T5–T7), corresponding to periods of anomalous behavior activation, with attention weights reaching peak values of 0.5 during the anomaly occurrence period. Unlike normal nodes, anomalous nodes show strong attention correlations with distant time steps, indicating the model’s ability to capture long-range temporal dependencies associated with anomalous patterns. The attention heatmaps reveal that anomalous nodes maintain attention focus on both local neighbors and distant nodes, suggesting complex interaction patterns that deviate from normal local clustering behaviors.
In contrast, normal nodes exhibit more stable and predictable attention patterns characterized by temporal consistency and local attention focus. Normal nodes maintain relatively consistent attention distributions across time steps, with attention weights fluctuating within a narrow range (0.04–0.18), and attention is primarily concentrated on immediate neighbors, reflecting typical graph locality principles. The attention weights evolve smoothly without abrupt changes, indicating stable behavioral patterns characteristic of normal nodes, which provides a clear baseline for anomaly identification.

5.2.6. Example of the Anomaly Detection Process

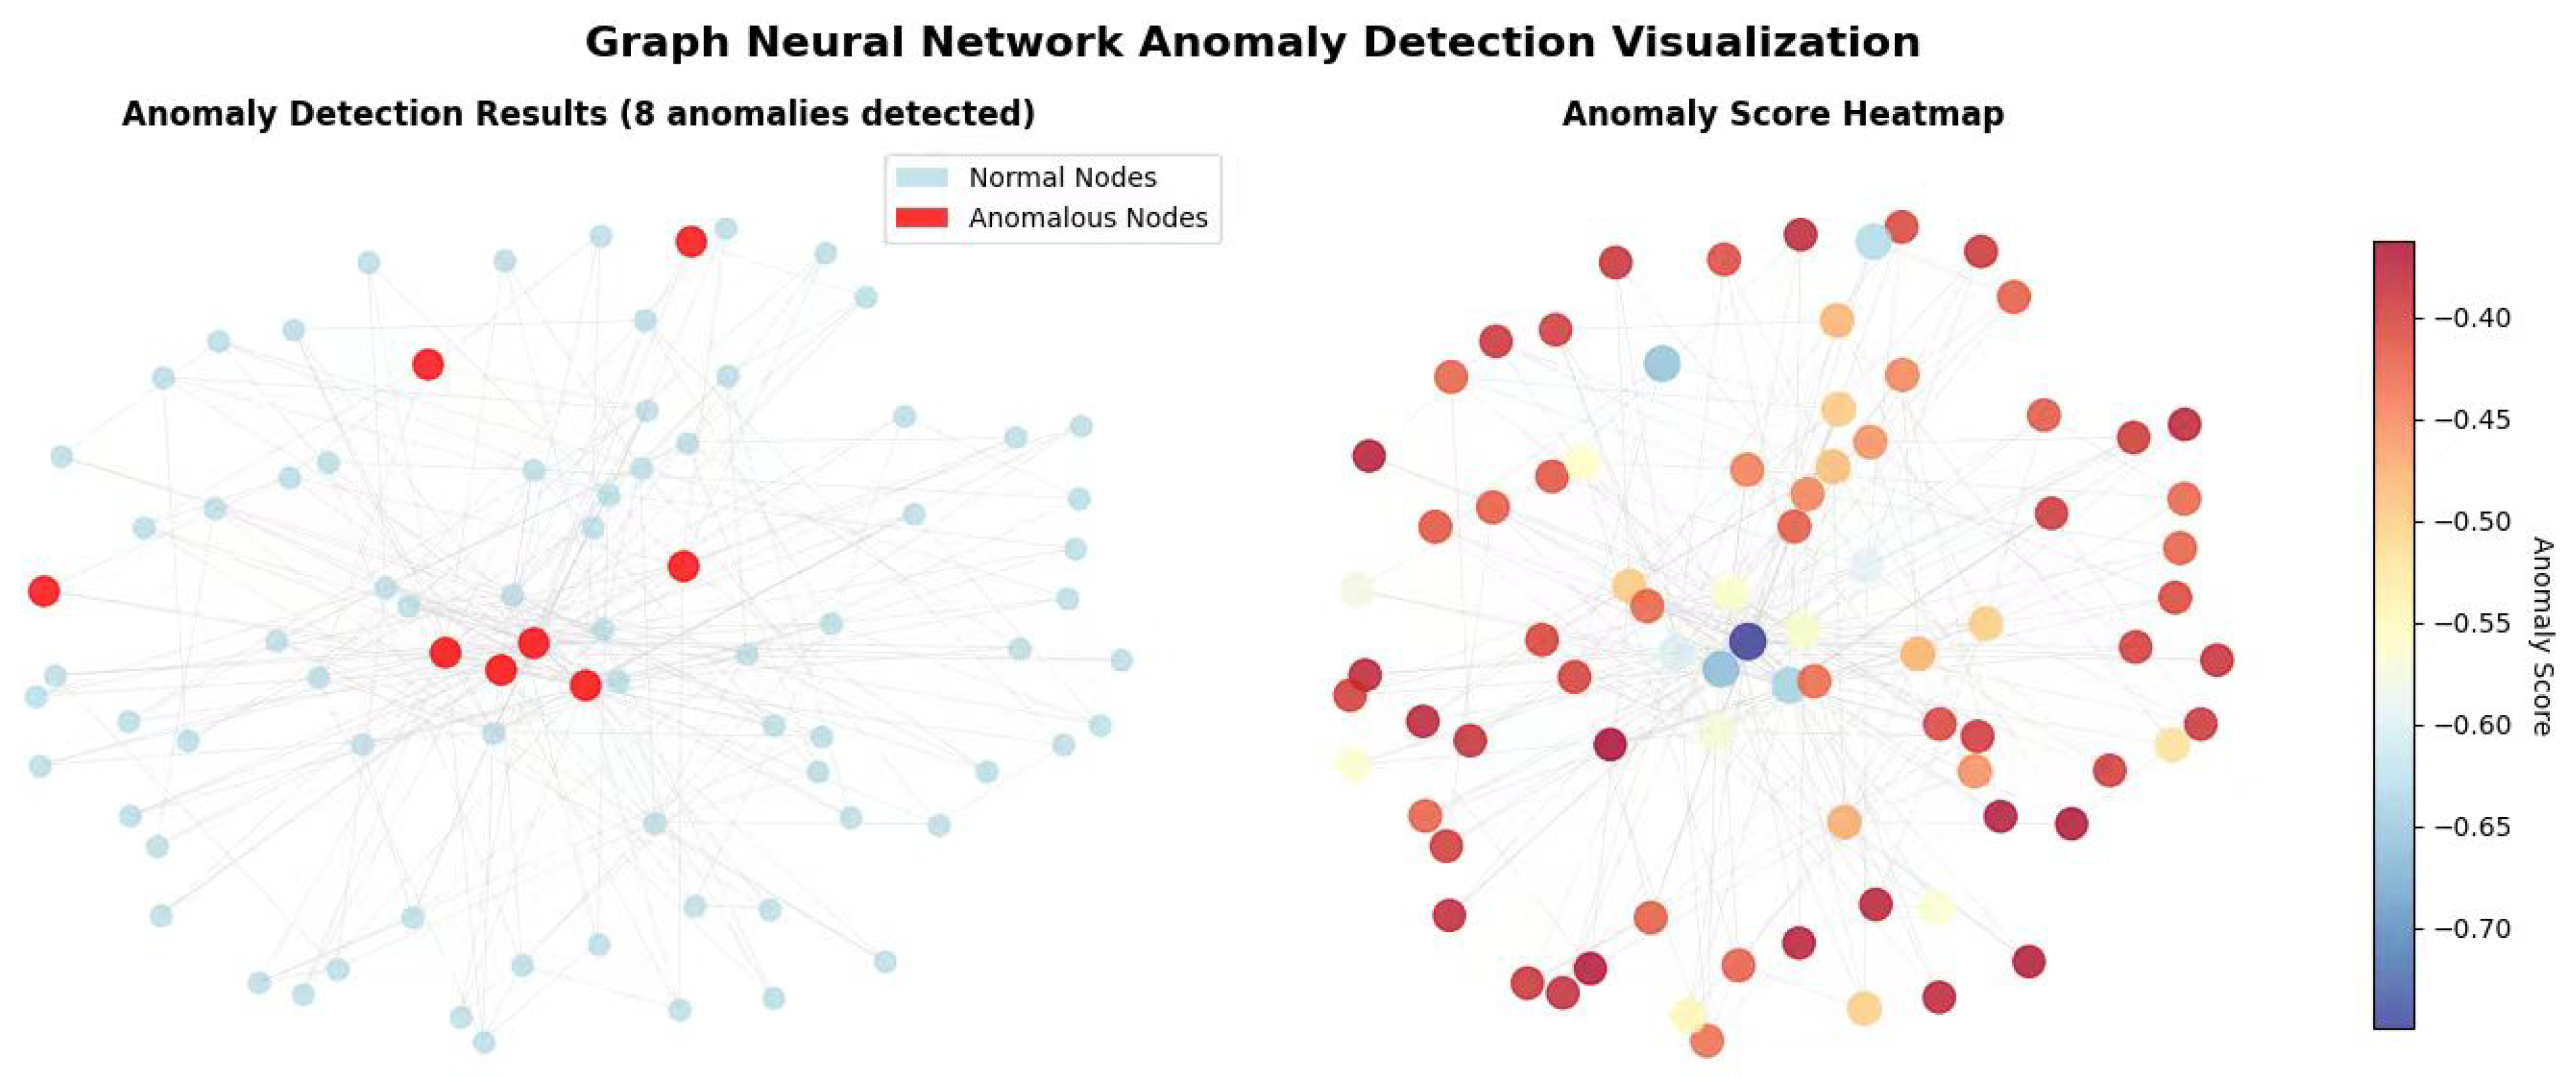
Based on the graph neural network anomaly detection visualization results, this study successfully detected eight anomalous nodes and effectively enhanced model interpretability through a dual visualization strategy. The experimental results are shown in Figure 6. The left network graph clearly displays the spatial distribution characteristics of anomalous nodes (red) and normal nodes (blue), with anomalous nodes exhibiting localized clustering patterns that validate the propagation characteristics of anomalous behavior. The right anomaly score heatmap quantitatively demonstrates the degree of node anomaly through color gradients (−0.70 to −0.40), achieving a complete analytical chain from qualitative identification to quantitative assessment. The experimental results indicate that this visualization method not only intuitively presents the algorithm’s detection performance but, more importantly, transforms the “black box” deep learning model into an interpretable decision-making process, providing robust technical support for anomaly detection result validation and practical applications.

6. Conclusions and Future Work

The TSAD framework proposed in this paper effectively addresses the key issues of insufficient multi-scale feature fusion and inadequate utilization of unlabeled data in dynamic graph anomaly detection by integrating multi-head attention mechanisms, adaptive memory storage, and pseudo-label collaborative contrastive learning. Experimental results show that TSAD achieves optimal performance on three real datasets, with an average improvement of 1.42 percentage points compared with baseline methods, validating the effectiveness of the framework.
While TSAD demonstrates superior performance, several limitations should be acknowledged:
Hyperparameter Sensitivity: The framework involves multiple hyperparameters (memory slots, confidence thresholds, etc.) that require careful tuning. Developing adaptive hyperparameter selection mechanisms would improve practical applicability.
Applicability of large-scale graphs: due to equipment limitations, the performance of the proposed method has not been verified on large-scale graphs.
In the future, we will verify the effectiveness of the proposed method on large-scale graphs and, at the same time, actively integrate technologies such as large language models to further enhance the performance of the model.
Author Contributions

Conceptualization, J.Z.; Software, J.Z.; Validation, J.Z.; Formal analysis, J.Z.; Writing—original draft, J.Z.; Writing—Review & Editing, K.F.; Visualization, K.F.; Supervision, K.F. All authors have read and agreed to the published version of the manuscript.

Funding

This research was funded by the China Postdoctoral Science Foundation General Program First-Class Grant, grant number 2018M630003, titled “Default Risk and Nonlinear Pricing Models under Financial Deleveraging”.

Institutional Review Board Statement

Not applicable.

Informed Consent Statement

Not applicable.

Data Availability Statement

The original contributions presented in this study are included in the article. Further inquiries can be directed to the corresponding author.

Acknowledgments

This work is supported by the China Postdoctoral Science Foundation, General Program (2018M630003).

Conflicts of Interest

The authors declare no conflicts of interest.

References

  1. Ma, X.; Wu, J.; Xue, S.; Yang, J.; Zhou, C.; Sheng, Q.Z.; Xiong, H.; Akoglu, L. A comprehensive survey on graph anomaly detection with deep learning. IEEE Trans. Knowl. Data Eng. 2023, 35, 12012–12038. [Google Scholar] [CrossRef]
  2. Xu, D.; Ruan, C.; Körpeoglu, E.; Kumar, S.; Achan, K. Inductive representation learning on temporal graphs. In Proceedings of the International Conference on Learning Representations (ICLR), Virtual, 26 April–1 May 2020. [Google Scholar]
  3. Zhao, Y.; Liu, H.; Duan, H. Semantic and relation aware neural network model for bi-class multi-relational heterogeneous graphs. iScience 2025, 28, 112155. [Google Scholar] [CrossRef] [PubMed]
  4. Hamilton, W.; Ying, Z.; Leskovec, J. Inductive representation learning on large graphs. In Proceedings of the Advances in Neural Information Processing Systems (NeurIPS), Long Beach, CA, USA, 4–9 December 2017; pp. 1024–1034. [Google Scholar]
  5. Veličković, P.; Cucurull, G.; Casanova, A.; Romero, A.; Liò, P.; Bengio, Y. Graph attention networks. In Proceedings of the International Conference on Learning Representations (ICLR), Vancouver, BC, Canada, 30 April–3 May 2018. [Google Scholar]
  6. Zhao, Y.; Wang, S.; Duan, H. LSPI: Heterogeneous graph neural network classification aggregation algorithm based on size neighbor path identification. Appl. Soft Comput. 2025, 171, 112656. [Google Scholar] [CrossRef]
  7. Ding, K.; Li, J.; Bhanushali, R.; Liu, H. Deep anomaly detection on attributed networks. In Proceedings of the 2019 SIAM International Conference on Data Mining (SDM), Spokane, WA, USA, 25 February–1 March 2019; SIAM: Philadelphia, PA, USA, 2019; pp. 594–602. [Google Scholar]
  8. Li, J.; Dani, H.; Hu, X.; Liu, H. Radar: Residual analysis for anomaly detection in attributed networks. In Proceedings of the Twenty-Sixth International Joint Conference on Artificial Intelligence (IJCAI), Melbourne, Australia, 19–25 August 2017; pp. 2152–2158. [Google Scholar]
  9. Trivedi, R.; Farajtabar, M.; Biswal, P.; Zha, H. DyRep: Learning representations over dynamic graphs. In Proceedings of the International Conference on Learning Representations (ICLR), New Orleans, LA, USA, 6–9 May 2019. [Google Scholar]
  10. Wang, D.; Qi, Y.; Lin, J.; Cui, P.; Jia, Q.; Wang, Z.; Fang, Y.; Yu, Q.; Zhou, J.; Yang, S. A semi-supervised graph attentive network for financial fraud detection. In Proceedings of the 2019 IEEE International Conference on Data Mining (ICDM), Beijing, China, 8–11 November 2019; IEEE: Piscataway, NJ, USA, 2019; pp. 598–607. [Google Scholar]
  11. Liu, Y.; Pan, S.; Wang, Y.G.; Xiong, F.; Wang, L.; Lee, V.C.S. Anomaly detection in dynamic graphs via transformer. arXiv 2021, arXiv:2106.09876. [Google Scholar] [CrossRef]
  12. Pareja, A.; Domeniconi, G.; Chen, J.; Ma, T.; Suzumura, T.; Kanezashi, H.; Kaler, T.; Schardl, T.B.; Leiserson, C.E. EvolveGCN: Evolving graph convolutional networks for dynamic graphs. In Proceedings of the AAAI Conference on Artificial Intelligence, New York, NY, USA, 7–12 February 2020; Volume 34, pp. 5363–5370. [Google Scholar]
  13. Singer, U.; Guy, I.; Radinsky, K. Node embedding over temporal graphs. In Proceedings of the Twenty-Eighth International Joint Conference on Artificial Intelligence (IJCAI), Macao, China, 10–16 August 2019; pp. 4605–4612. [Google Scholar]
  14. Meng, X.; Wang, S.; Liang, Z.; Yao, D.; Zhou, J.; Zhang, Y. Semi-supervised anomaly detection in dynamic communication networks. Inf. Sci. 2021, 571, 527–542. [Google Scholar] [CrossRef]
  15. Vaswani, A.; Shazeer, N.; Parmar, N.; Uszkoreit, J.; Jones, L.; Gomez, A.N.; Kaiser, Ł.; Polosukhin, I. Attention is all you need. In Proceedings of the Advances in Neural Information Processing Systems (NeurIPS), Long Beach, CA, USA, 4–9 December 2017; pp. 5998–6008. [Google Scholar]
  16. Dwivedi, V.P.; Bresson, X. A generalization of transformer networks to graphs. In Proceedings of the AAAI Workshop on Deep Learning on Graphs: Methods and Applications, New York, NY, USA, 7–12 February 2020. [Google Scholar]
  17. Goyal, P.; Kamra, N.; He, X.; Liu, Y. DynGEM: Deep embedding method for dynamic graphs. In Proceedings of the International Workshop on Learning Representations for Big Networks, Vancouver, BC, Canada, 30 April–3 May 2018. [Google Scholar]
  18. Zeng, H.; Zhou, H.; Srivastava, A.; Kannan, R.; Prasanna, V. GraphSAINT: Graph sampling based inductive learning method. In Proceedings of the International Conference on Learning Representations (ICLR), Virtual, 26 April–1 May 2020. [Google Scholar]
  19. Kumar, S.; Zhang, X.; Leskovec, J. Predicting dynamic embedding trajectory in temporal interaction networks. In Proceedings of the 25th ACM SIGKDD International Conference on Knowledge Discovery & Data Mining, Anchorage, AK, USA, 4–8 August 2019; ACM: New York, NY, USA, 2019; pp. 1269–1278. [Google Scholar]
  20. Rossi, E.; Chamberlain, B.; Frasca, F.; Eynard, D.; Monti, F.; Bronstein, M. Temporal graph networks for deep learning on dynamic graphs. In Proceedings of the ICML Workshop on Graph Representation Learning, Vienna, Austria, 12–18 July 2020. [Google Scholar]
  21. Wang, X.; Lyu, D.; Li, M.; Xia, Y.; Yang, Q.; Wang, X.; Wang, X.; Cui, P.; Yang, Y.; Sun, B.; et al. APAN: Asynchronous propagation attention network for real-time temporal graph embedding. In Proceedings of the 2021 International Conference on Management of Data, Virtual, 18 June 2021; ACM: New York, NY, USA, 2021; pp. 2628–2638. [Google Scholar]
  22. Yu, W.; Cheng, W.; Aggarwal, C.C.; Zhang, H.; Chen, W.; Wang, W. DyGFormer: Simplifying and empowering transformers for dynamic graph representation learning. arXiv 2023, arXiv:2303.13047. [Google Scholar]
  23. Perozzi, B.; Akoglu, L. Scalable anomaly ranking of attributed neighborhoods. In Proceedings of the 2016 SIAM International Conference on Data Mining (SDM), Boston, MA, USA, 11–15 July 2016; SIAM: Philadelphia, PA, USA, 2016; pp. 207–215. [Google Scholar]
  24. Peng, Z.; Luo, M.; Li, J.; Liu, H.; Zheng, Q. Anomalous link pattern detection in networks. In Proceedings of the 24th ACM SIGKDD International Conference on Knowledge Discovery & Data Mining, Toronto, ON, Canada, 3–7 August 2018; ACM: New York, NY, USA, 2018; pp. 1942–1951. [Google Scholar]
  25. Liu, Y.; Li, Z.; Pan, S.; Gong, C.; Zhou, C.; Karypis, G. Anomaly detection on attributed networks via contrastive self-supervised learning. IEEE Trans. Neural Netw. Learn. Syst. 2022, 33, 2378–2392. [Google Scholar] [CrossRef] [PubMed]
  26. Liu, Z.; Chen, C.; Li, L.; Zhou, J.; Li, X.; Song, L.; Qi, Y. GeniePath: Graph neural networks with adaptive receptive paths. In Proceedings of the AAAI Conference on Artificial Intelligence, Honolulu, HI, USA, 27 January–1 February 2019; Volume 33, pp. 4424–4431. [Google Scholar]
  27. Wang, G.; Xie, S.; Wang, B.; Yu, P.S. FdGars: Fraudster detection via graph convolutional networks in online app review system. In Proceedings of the Companion Proceedings of The 2019 World Wide Web Conference, San Francisco, CA, USA, 13–17 May 2019; ACM: New York, NY, USA, 2019; pp. 310–316. [Google Scholar]
  28. Ding, K.; Zhou, Q.; Tong, H.; Liu, H. Few-shot network anomaly detection via cross-network meta-learning. In Proceedings of the Web Conference 2021, Virtual, 12–23 April 2021; ACM: New York, NY, USA, 2021; pp. 2448–2456. [Google Scholar]
  29. Dou, Y.; Liu, Z.; Sun, L.; Deng, Y.; Peng, H.; Yu, P.S. Enhancing graph neural network-based fraud detectors against camouflaged fraudsters. In Proceedings of the 29th ACM International Conference on Information & Knowledge Management, Virtual, 19–23 October 2020; ACM: New York, NY, USA, 2020; pp. 315–324. [Google Scholar]
  30. Liu, Y.; Ao, X.; Qin, Z.; Chi, J.; Feng, J.; Yang, H.; He, Q. Pick and choose: A GNN-based imbalanced learning approach for fraud detection. In Proceedings of the Web Conference 2021, Virtual, 12–23 April 2021; ACM: New York, NY, USA, 2021; pp. 3168–3177. [Google Scholar]
  31. Zheng, L.; Li, Z.; Li, J.; Li, Z.; Gao, J. AddGraph: Anomaly detection in dynamic graph using attention-based temporal GCN. In Proceedings of the Twenty-Eighth International Joint Conference on Artificial Intelligence (IJCAI), Macao, China, 10–16 August 2019; pp. 4419–4425. [Google Scholar]
  32. Ying, C.; Cai, T.; Luo, S.; Zheng, S.; Ke, G.; He, D.; Shen, Y.; Liu, T.Y. Do transformers really perform badly for graph representation? In Proceedings of the Advances in Neural Information Processing Systems (NeurIPS), Virtual, 6–14 December 2021; Volume 34, pp. 28877–28888. [Google Scholar]
  33. Mueller, L.; Galkin, M.; Morris, C.; Lio, P. Attending to graph transformers. In Proceedings of the International Conference on Machine Learning (ICML), Honolulu, HI, USA, 23–29 July 2023; PMLR: New York, NY, USA, 2023; pp. 25302–25310. [Google Scholar]
  34. Dwivedi, V.P.; Joshi, C.K.; Laurent, T.; Bengio, Y.; Bresson, X. Benchmarking graph neural networks. In Proceedings of the International Conference on Machine Learning (ICML), Vienna, Austria, 12–18 July 2020; PMLR: New York, NY, USA, 2020; pp. 2761–2771. [Google Scholar]
  35. Li, P.; Wang, Y.; Wang, H.; Leskovec, J. Distance encoding: Design provably more powerful neural networks for graph representation learning. In Proceedings of the Advances in Neural Information Processing Systems (NeurIPS), Virtual, 6–12 December 2020; Volume 33, pp. 4465–4478. [Google Scholar]
  36. Kreuzer, D.; Beaini, D.; Hamilton, W.; Létourneau, V.; Tossou, P. Rethinking graph transformers with spectral attention. In Proceedings of the Advances in Neural Information Processing Systems (NeurIPS), Virtual, 6–14 December 2021; Volume 34, pp. 21618–21629. [Google Scholar]
  37. Zhang, D.; Hao, X.; Liang, L.; Liu, W.; Qin, C. A novel deep convolutional neural network algorithm for surface defect detection. J. Comput. Des. Eng. 2022, 9, 1616–1632. [Google Scholar] [CrossRef]
  38. Zhang, Y.; Liu, A.; Zhu, G.; Zhou, M.; Zhao, P.; Zhang, H. TGFormer: Temporal graph transformer for dynamic graph representation learning. arXiv 2023, arXiv:2302.14704. [Google Scholar]
Figure 1. Dynamic graph example.
Mathematics 13 03123 g001
Figure 2. TSAD Framework Architecture.
Mathematics 13 03123 g002
Figure 3. Multi-metric performance comparison on Wikipedia dataset.
Mathematics 13 03123 g003
Figure 4. Multi-metric performance comparison.
Mathematics 13 03123 g004
Figure 5. Temporal evolution of node attention patterns. The figure shows attention weight evolution for three anomalous nodes (3, 7, 15) and one normal node (10) across different time steps. Anomalous nodes exhibit concentrated attention spikes during anomaly periods (T5–T7), while normal nodes maintain stable attention distributions. The color intensity represents attention weight magnitude, with warmer colors indicating higher attention values.
Mathematics 13 03123 g005
Figure 6. Visualization experimental results of anomaly detection on MOOC datasets.
Mathematics 13 03123 g006
Table 1. Comparison between dynamic and static graphs.
AspectDynamic GraphsStatic Graphs
Structural ChangesConnections between nodes and edges can change over time, reflecting dynamic interaction patterns.Nodes and edges remain unchanged throughout the analysis, failing to capture variations in the temporal dimension.
Attribute EvolutionNode attributes can evolve over time, making them suitable for analyzing temporal data.Node attributes remain fixed during the entire analysis, unable to reflect dynamic changes.
Application ScenariosSuitable for scenarios requiring consideration of temporal factors, such as social network analysis and financial fraud detection.Applicable to scenarios where data relationships are relatively stable, such as the overall structural analysis of social networks.
ComplexityAnalysis and modeling are relatively difficult due to the complexity of the time dimension, requiring special methods.Relatively simpler; traditional graph theory methods and machine learning algorithms are usually applicable.
Table 2. Dataset statistics and characteristics.
DatasetNodesEdgesDomain
Wikipedia8227157,474Social Editing
Reddit10,984168,016Social Network
MOOC7047411,749E-Learning
Table 3. AUC-ROC performance comparison on different datasets (%).
MethodWikipediaRedditMOOC
TGAT83.23 ± 0.8467.06 ± 0.6966.88 ± 0.68
TGN84.67 ± 0.3662.66 ± 0.8567.07 ± 0.73
Radar82.91 ± 0.9761.46 ± 1.2762.14 ± 0.89
DOMINANT85.84 ± 0.6364.66 ± 1.2965.41 ± 0.72
SemiGNN84.65 ± 0.8264.18 ± 0.7864.98 ± 0.63
GDN85.12 ± 0.6967.02 ± 0.5166.21 ± 0.74
TADDY84.72 ± 1.0167.95 ± 0.9468.47 ± 0.76
SAD86.77 ± 0.2468.77 ± 0.7569.44 ± 0.87
TSAD87.89 ± 0.3170.12 ± 0.5271.23 ± 0.38
Table 4. Statistical significance testing results.
MethodWikipediaRedditMOOC
vs. TGAT<0.001 ***<0.001 ***<0.001 ***
vs. TGN<0.001 ***<0.001 ***<0.001 ***
vs. Radar<0.001 ***<0.001 ***<0.001 ***
vs. DOMINANT0.003 **<0.001 ***<0.001 ***
vs. SemiGNN0.002 **<0.001 ***<0.001 ***
vs. GDN0.001 **<0.001 ***<0.001 ***
vs. TADDY0.004 **0.012 *0.003 **
vs. SAD0.021 *0.035 *0.028 *
Note: *** indicates p < 0.001, ** indicates p < 0.01, * indicates p < 0.05. All p-values are results of paired t-tests between TSAD and corresponding baseline methods, based on AUC-ROC performance data from 10 independent experimental runs.
Table 5. Multi-Metric performance comparison (Wikipedia dataset).
MethodAUC-ROCAUC-PRF1-ScorePrecisionRecall
TGAT83.2376.4572.1874.3270.15
TGN84.6778.1273.8976.2371.68
SemiGNN84.6577.9873.4575.8771.21
SAD86.7780.3476.1278.4573.89
TSAD87.8982.1578.2380.6775.98
Table 6. Ablation study results (AUC-ROC %).
Model VariantWikipediaRedditMOOC
TSAD-Tr86.12 ± 0.4368.34 ± 0.6169.45 ± 0.52
TSAD-MEM85.89 ± 0.4867.98 ± 0.6569.12 ± 0.56
TSAD-CL86.45 ± 0.3968.89 ± 0.5770.01 ± 0.47
TSAD-PL86.23 ± 0.4168.67 ± 0.5969.78 ± 0.49
TSAD-TE85.67 ± 0.4567.45 ± 0.6368.89 ± 0.54
TSAD87.89 ± 0.3170.12 ± 0.5271.23 ± 0.38
Table 7. Impact of memory slot numbers on performance and computational cost.
Memory SlotsWikipedia AUC-ROCStorage Overhead (MB)Inference Time (ms)
1686.45 ± 0.520.812.3
3287.23 ± 0.411.618.7
6487.89 ± 0.313.224.1
12887.92 ± 0.356.441.5
Disclaimer/Publisher’s Note: The statements, opinions and data contained in all publications are solely those of the individual author(s) and contributor(s) and not of MDPI and/or the editor(s). MDPI and/or the editor(s) disclaim responsibility for any injury to people or property resulting from any ideas, methods, instructions or products referred to in the content.