Article

Numerical Investigation of Atwood Number Effects on Shock-Driven Single-Mode Stratified Heavy Fluid Layers

by
Salman Saud Alsaeed
1,
Satyvir Singh
2,3,* and
Nouf A. Alrubea
1
1
Department of Mathematics, College of Science, Jouf University, Sakaka P.O. Box 2014, Saudi Arabia
2
Applied and Computational Mathematics, RWTH Aachen University, 52062 Aachen, Germany
3
Department of Mathematics, Graphic Era Deemed to be University, Dehradun 248002, India
*
Author to whom correspondence should be addressed.
Mathematics 2025, 13(18), 3032; https://doi.org/10.3390/math13183032
Submission received: 26 August 2025 / Revised: 14 September 2025 / Accepted: 18 September 2025 / Published: 19 September 2025
(This article belongs to the Special Issue High-Order Numerical Methods and Computational Fluid Dynamics)

Abstract

This work presents a numerical investigation of Richtmyer–Meshkov instability (RMI) in shock-driven single-mode stratified heavy fluid layers, with emphasis on the influence of the Atwood number. High-order modal discontinuous Galerkin simulations are carried out for Atwood numbers ranging from A = 0.30 to 0.72 , allowing a systematic study of interface evolution, vorticity dynamics, and mixing. The analysis considers diagnostic quantities such as interface trajectories, normalized interface length and amplitude, vorticity extrema, circulation, enstrophy, and kinetic energy. The results demonstrate that the Atwood number plays a central role in instability development. At low A, interface deformation remains smooth and coherent, with weaker vorticity deposition and delayed nonlinear roll-up. As A increases, baroclinic torque intensifies, leading to rapid perturbation growth, stronger vortex roll-ups, and earlier onset of secondary instabilities such as Kelvin–Helmholtz vortices. Enstrophy, circulation, and interface measures show systematic amplification with increasing density contrast, while the total kinetic energy exhibits relatively weak sensitivity to A. Overall, the study highlights how the Atwood number governs the transition from linear to nonlinear dynamics, controlling both large-scale interface morphology and the formation of small-scale vortical structures. These findings provide physical insight into shock–interface interactions and contribute to predictive modeling of instability-driven mixing in multicomponent flows.

1. Introduction

Shock-driven instabilities occur when a shock wave interacts with a perturbed material interface that separates fluids of different densities [1]. The impulsive deposition of vorticity at the interface produces rapid deformation, nonlinear evolution, and eventual turbulent mixing [2,3]. These instabilities are of broad relevance in high-energy-density physics, such as inertial confinement fusion (ICF), where shock-induced mixing degrades capsule performance [4,5], and in astrophysics, where they play a central role in supernova explosions and interstellar mixing [6,7]. In engineering contexts, such instabilities affect the design of supersonic combustion chambers, blast-wave interactions with structures, and explosive dispersal of multiphase systems [8,9]. The interplay between compressibility, density stratification, and interface geometry makes shock-driven instabilities both a fundamental problem in fluid dynamics and a key challenge for predictive modeling in real-world systems.
The Richtmyer–Meshkov instability (RMI) provides a canonical framework for understanding shock-driven mixing. First introduced by Richtmyer [10] through linear theory and later confirmed experimentally by Meshkov [11], RMI is triggered when a shock wave impulsively accelerates a perturbed density interface. The initial shock generates a velocity field that amplifies interface perturbations linearly, followed by nonlinear roll-up and secondary instability formation. In later stages, interactions between vortex structures drive turbulent mixing. Unlike the Rayleigh–Taylor instability (RTI) [12,13], which is governed by sustained acceleration due to gravity or body forces, RMI originates from a single impulsive acceleration and subsequently evolves under complex mode interactions and reshock events [14]. This makes RMI an excellent model system to study the mechanisms of impulsively driven flows and their transition to turbulence.
A key parameter governing RMI dynamics is the Atwood number [15],
A = ρ h ρ l ρ h + ρ l ,
where ρ h and ρ l are the densities of the heavy and light fluids, respectively. The Atwood number quantifies the density contrast across the interface and directly determines the baroclinic vorticity deposition. For small Atwood numbers ( A 1 ), interface growth is relatively weak, with perturbations evolving smoothly and with limited nonlinear coupling. At higher Atwood numbers, however, strong vorticity deposition results in vigorous roll-up, Kelvin–Helmholtz (KH) shear-layer formation, and the onset of secondary instabilities [16]. High-A cases are often associated with large-scale bulges, jet formation, and enhanced mixing rates. Consequently, the Atwood number serves not only as a scaling parameter but also as a critical control variable in experiments and simulations, influencing shock attenuation, reshock amplification, and the eventual transition to turbulent mixing.
Studies of RMI have frequently employed the single-mode perturbed interface as a canonical problem because of its relative simplicity and suitability for theoretical analysis. In his pioneering work, Richtmyer [10] introduced an impulsive model to predict the linear growth of such perturbations under incompressible conditions, assuming initially small interface amplitudes. This theoretical prediction was later examined experimentally by Meshkov [11], whose shock-tube experiments confirmed the impulsive model qualitatively, though with discrepancies in the exact growth rates. Since then, a large body of research has explored RMI evolution in the single-mode configuration through theoretical, computational, and experimental approaches [17,18,19]. Theoretical efforts have largely focused on developing growth models—both linear and nonlinear—for sinusoidal interfaces [20,21,22], whereas numerical studies have provided valuable insight into mixing-layer growth and turbulence statistics during instability evolution [23,24,25].
Advanced simulation methods such as large-eddy simulation (LES) have been employed to capture three-dimensional multi-mode perturbations and their impact on instability growth. Thornber et al. [26] examined how different initial perturbation conditions affect mixing-layer development, while Lombardini et al. [27] demonstrated that, at sufficiently high shock Mach numbers, a two-fluid mixing layer exhibits a Kolmogorov-like inertial subrange and eventually transitions to fully developed turbulence. Complementary to numerical efforts, experimental campaigns have also emphasized the role of initial conditions and shock strength in shaping RMI development. For instance, Mohaghar et al. [28] systematically investigated how variations in initial interface geometry and shock strength influence the transition toward turbulence. More recently, Probyn et al. [29] presented detailed simulations of two-dimensional single-mode RMI, providing insight into both early-time interface deformation and late-time nonlinear dynamics.
In many high-energy-density and astrophysical systems, such as ICF capsules and supernovae, shock-driven flows often involve finite-thickness fluid layers separated by multiple interfaces. Perturbation growth at one interface can influence the evolution of neighboring interfaces, a process known as interface coupling [30,31,32]. Such coupling introduces asymmetry and complex mixing since each interface may evolve at a different rate depending on density contrast and initial perturbations. Understanding these mechanisms is vital for predicting instability growth and mixing in shock-driven multiphase systems. Early theoretical efforts on coupled instabilities include Taylor’s linear RTI model for two interfaces [13], Ott’s nonlinear thin-layer solutions [33], and Mikaelian’s RMI growth models for stratified fluids [34,35,36,37]. Experiments by Jacobs [38] demonstrated distinct deformation patterns depending on interface asymmetry, later categorized into upstream mushroom, downstream mushroom, and sinuous modes [31]. More recent studies have advanced this understanding: Liu et al. [39] derived weakly nonlinear solutions for two-layer RMI, Liang and Luo [40,41] analyzed multilayer coupling and reverberations, Li et al. [42] investigated reshock-driven RMI numerically, and Guo et al. [43] studied finger interactions experimentally. Extending to complex geometries, Singh [44] simulated instability growth in a shocked V-shaped N 2 / SF 6 / N 2 layer using a high-order DG method. Recent high-fidelity simulations have provided new insights into the dynamics of single-mode RMI in light fluid layers, particularly helium–nitrogen configurations [45]. Collectively, these works underscore the importance of finite-thickness, multi-interface studies for capturing coupling effects absent in single-interface models.
The influence of the Atwood number on RMI remains only partially understood. Linear theories capture early growth but fail in the nonlinear regime where mode coupling and secondary instabilities dominate. Higher Atwood numbers enhance baroclinic vorticity and Kelvin–Helmholtz roll-up, yet experiments are limited to moderate density contrasts. To address this gap, we employ compressible multicomponent Euler equations, which capture shock–interface interactions through compressibility and density gradients while neglecting viscous and diffusive effects. This framework allows systematic analysis of interface measures (amplitude growth, stretching, trajectories) and flow diagnostics (baroclinic vorticity, dilatation, circulation), thereby linking Atwood number variations to instability dynamics and mixing efficiency.
This work presents a systematic numerical study of Atwood number effects on shock-driven instability in a single-mode stratified heavy fluid layer. Simulations spanning A = 0.30 to 0.72 are performed by solving the compressible multicomponent Euler equations with a high-order modal discontinuous Galerkin solver, enabling accurate resolution of shock–interface interactions. The analysis combines a wide range of diagnostics—interface measures and flow quantities—to clarify how density contrast governs instability growth, secondary instabilities, and mixing efficiency. The remainder of this paper is structured as follows. Section 2 introduces the governing equations, numerical formulation, and initial configuration for the stratified heavy fluid layer simulations. Section 3 presents detailed results, including interface morphology, schlieren structures, and flow diagnostics across the range of Atwood numbers. Section 4 discusses the implications of these findings, emphasizing the role of the Atwood number in controlling instability growth rates, secondary instabilities, and vorticity dynamics. Finally, Section 5 summarizes the main conclusions and identifies directions for future work.

2. Problem Description and Mathematical Formulations

This section presents the physical and mathematical framework employed in the present study. We first describe the shock-driven stratified heavy fluid layer configuration and the choice of gas pairs spanning different Atwood numbers. The governing compressible multicomponent Euler equations are then introduced, followed by the specification of initial and boundary conditions used to initialize the shock and ensure physically consistent inflow–outflow behavior.

2.1. Problem Description

Figure 1 shows the initial configuration adopted for the two-dimensional shock-driven single-mode stratified heavy fluid layer. The computational domain extends 200 mm in the streamwise (x) direction and 100 mm in the transverse (y) direction. A finite-thickness heavy gas layer of base thickness d = 20 mm is embedded in the domain, bounded by two distinct material interfaces: an upstream interface I 1 , which is perturbed sinusoidally with amplitude a 0 = 15 mm and wavelength λ = 100 mm , and a downstream interface I 2 , which is initially planar. This setup results in a local heavy-layer thickness that varies between d a 0 / 2 and d + a 0 / 2 depending on the phase of the sinusoidal wave. A planar shock wave, initially positioned 25 mm from the left boundary, propagates from left to right and interacts first with the perturbed interface I 1 , whose trough is located 5 mm downstream of the shock front. The shock–interface interaction deposits baroclinic vorticity, initiating RMI and subsequent nonlinear interface deformation, followed by the interaction with the downstream interface I 2 . To investigate the effect of density contrast, six gas-pair configurations are considered (Table 1), corresponding to Atwood numbers in the range A = 0.30 0.72 . In all cases, the incident shock Mach number is fixed at M s = 1.21 . This configuration provides a systematic framework for analyzing how the Atwood number influences interface evolution, secondary instability development, and mixing characteristics in shock-driven stratified heavy fluid layers.

2.2. Governing Equations

The governing equations employed here are the two-dimensional compressible multicomponent Euler equations, which represent conservation of mass, momentum, energy, and species concentration in an inviscid framework. Physically, these equations capture the essential mechanisms of shock–interface interaction, including the impulsive deposition of baroclinic vorticity arising from the misalignment of density and pressure gradients. The inviscid formulation is appropriate for RMI, where compressibility and density stratification dominate over viscous and diffusive effects in the early and intermediate stages of instability growth. This Eulerian description has been widely adopted in previous studies of RMI [45,46,47,48] and provides a robust basis for modeling shock-driven flows. In the present work, this framework enables systematic assessment of Atwood number effects on interface dynamics and vorticity generation without additional modeling complexity.
For a system with conserved state vector [45]
U = ρ ρ u ρ v ρ E ρ Y k ,
where ρ is the mixture density, ( u , v ) are the velocity components in the x- and y-directions, E is the specific total energy, and Y k is the mass fraction of species k, the governing equations take the conservative form
U t + F ( U ) x + G ( U ) y = 0 .
The flux vectors in the x- and y-directions are given by
F ( U ) = ρ u ρ u 2 + p ρ u v ( ρ E + p ) u ρ Y k u , G ( U ) = ρ v ρ u v ρ v 2 + p ( ρ E + p ) v ρ Y k v .
The mixture pressure is obtained from the ideal-gas law,
p = ρ R T , R = k Y k R k ,
where R k = R u / M k is the specific gas constant of species k, M k its molar mass, and R u the universal gas constant.
The total energy is expressed as
ρ E = p γ ¯ 1 + 1 2 ρ ( u 2 + v 2 ) ,
with γ ¯ denoting the effective ratio of specific heats of the mixture, defined from the mixture-averaged specific heats
C ¯ p = k z k C p , k , C ¯ v = k z k C v , k , γ ¯ = C ¯ p C ¯ v , z k = Y k M k .
For each species, the ideal-gas relations hold,
C p , k = γ k R u γ k 1 , C v , k = C p , k R u ,
where γ k is the specific heat ratio of species k. The mixture pressure may also be written using Dalton’s law as
p = k p k , p k = ρ k R k T , ρ k = ρ Y k .
This formulation provides a consistent framework to investigate the effect of the Atwood number on shock–interface dynamics in stratified multicomponent flows.

2.3. Initial and Boundary Conditions

The simulations are initialized with a planar incident shock wave placed 25 mm from the left boundary of the computational domain, propagating from left to right into a quiescent multicomponent gas mixture. The domain contains a heavy gas layer of base thickness d = 20 mm , bounded by two interfaces: an upstream sinusoidal interface I 1 with initial amplitude a 0 = 40 mm and wavelength λ = 100 mm , and a downstream planar interface I 2 . The surrounding light gas (Gas a) and heavy gas layer (Gas b) are selected according to the gas-pair combinations listed in Table 1, which correspond to Atwood numbers ranging from A = 0.30 to 0.72 . For the shock-driven single-mode fluid layer, the initial ambient conditions are set to a pressure of P 0 = 101,325 Pa and a temperature of T 0 = 273 K.
For a prescribed incident shock Mach number, M s = 1.21 , the post-shock flow variables are obtained from the one-dimensional Rankine–Hugoniot (RH) jump conditions across a discontinuity [45]:
M 2 2 = 2 + ( γ 1 ) M s 2 1 γ + 2 γ M s 2 , p 2 p 1 = 1 + γ M s 2 1 + γ M 2 2 , ρ 2 ρ 1 = γ 1 + ( γ + 1 ) p 2 p 1 γ + 1 + ( γ 1 ) p 2 p 1 .
Here, M s denotes the ratio of the shock velocity to the ambient speed of sound, M 2 is the post-shock Mach number, p 1 and p 2 are the pre- and post-shock pressures, and ρ 1 and ρ 2 the corresponding densities. The post-shock state, obtained from the RH relations, is imposed at the left inflow boundary to generate and sustain a planar shock of the prescribed strength. Outflow boundary conditions are applied at the top, bottom, and right boundaries of the computational domain. This setup ensures that the shock propagates without distortion and interacts with the stratified heavy fluid layer without introducing spurious reflections from the domain boundaries.

3. Numerical Methodology and Validations

3.1. Numerical Scheme

Accurate numerical modeling of the RMI demands schemes capable of resolving shock–interface interactions, nonlinear perturbation growth, and subsequent mixing dynamics with high fidelity. Experimental studies face inherent challenges such as uncertainties in initial conditions and diagnostic limitations, making high-resolution simulations a vital tool for investigating the detailed physics of RMI. In particular, high-order discretization methods are required to capture perturbation amplification, interface roll-up, and baroclinic vorticity generation without introducing excessive numerical dissipation.
In this work, the governing compressible multicomponent Euler equations are solved using an in-house-developed high-order discontinuous Galerkin (DG) solver [45,48,49], which is well established for hyperbolic conservation laws. The computational domain is partitioned into non-overlapping Cartesian elements, with the solution in each element represented by third-order Legendre polynomial expansions. This formulation ensures strict local conservation, geometric flexibility, and efficient scalability on parallel architectures. Communication between elements is handled via numerical fluxes computed with the Harten–Lax–van Leer-contact (HLLC) approximate Riemann solver [50], while surface and volume integrals are evaluated using Gauss–Legendre quadrature [51]. Time integration is performed using a strong-stability-preserving third-order Runge–Kutta scheme (SSP-RK3), which provides robustness for hyperbolic systems with discontinuities while maintaining third-order temporal accuracy [52]. To suppress nonphysical oscillations near steep gradients, a moment-based limiter following the approach of Krivodonova is employed [53]. The limiter is selectively activated in troubled cells identified through a modified total variation bounded (TVB) criterion, thereby retaining accuracy in smooth regions while enhancing robustness near shocks and contact discontinuities. All simulations are carried out with a fixed Courant–Friedrichs–Lewy (CFL) number of 0.2, ensuring stability of the explicit time-stepping scheme. The combined use of high-order DG discretization, SSP-RK3 integration, and selective limiting enables accurate resolution of interface deformation and vorticity generation, thereby providing reliable data to assess the role of the Atwood number in the growth and nonlinear evolution of shock-driven stratified fluid layers.

3.2. Validation Studies

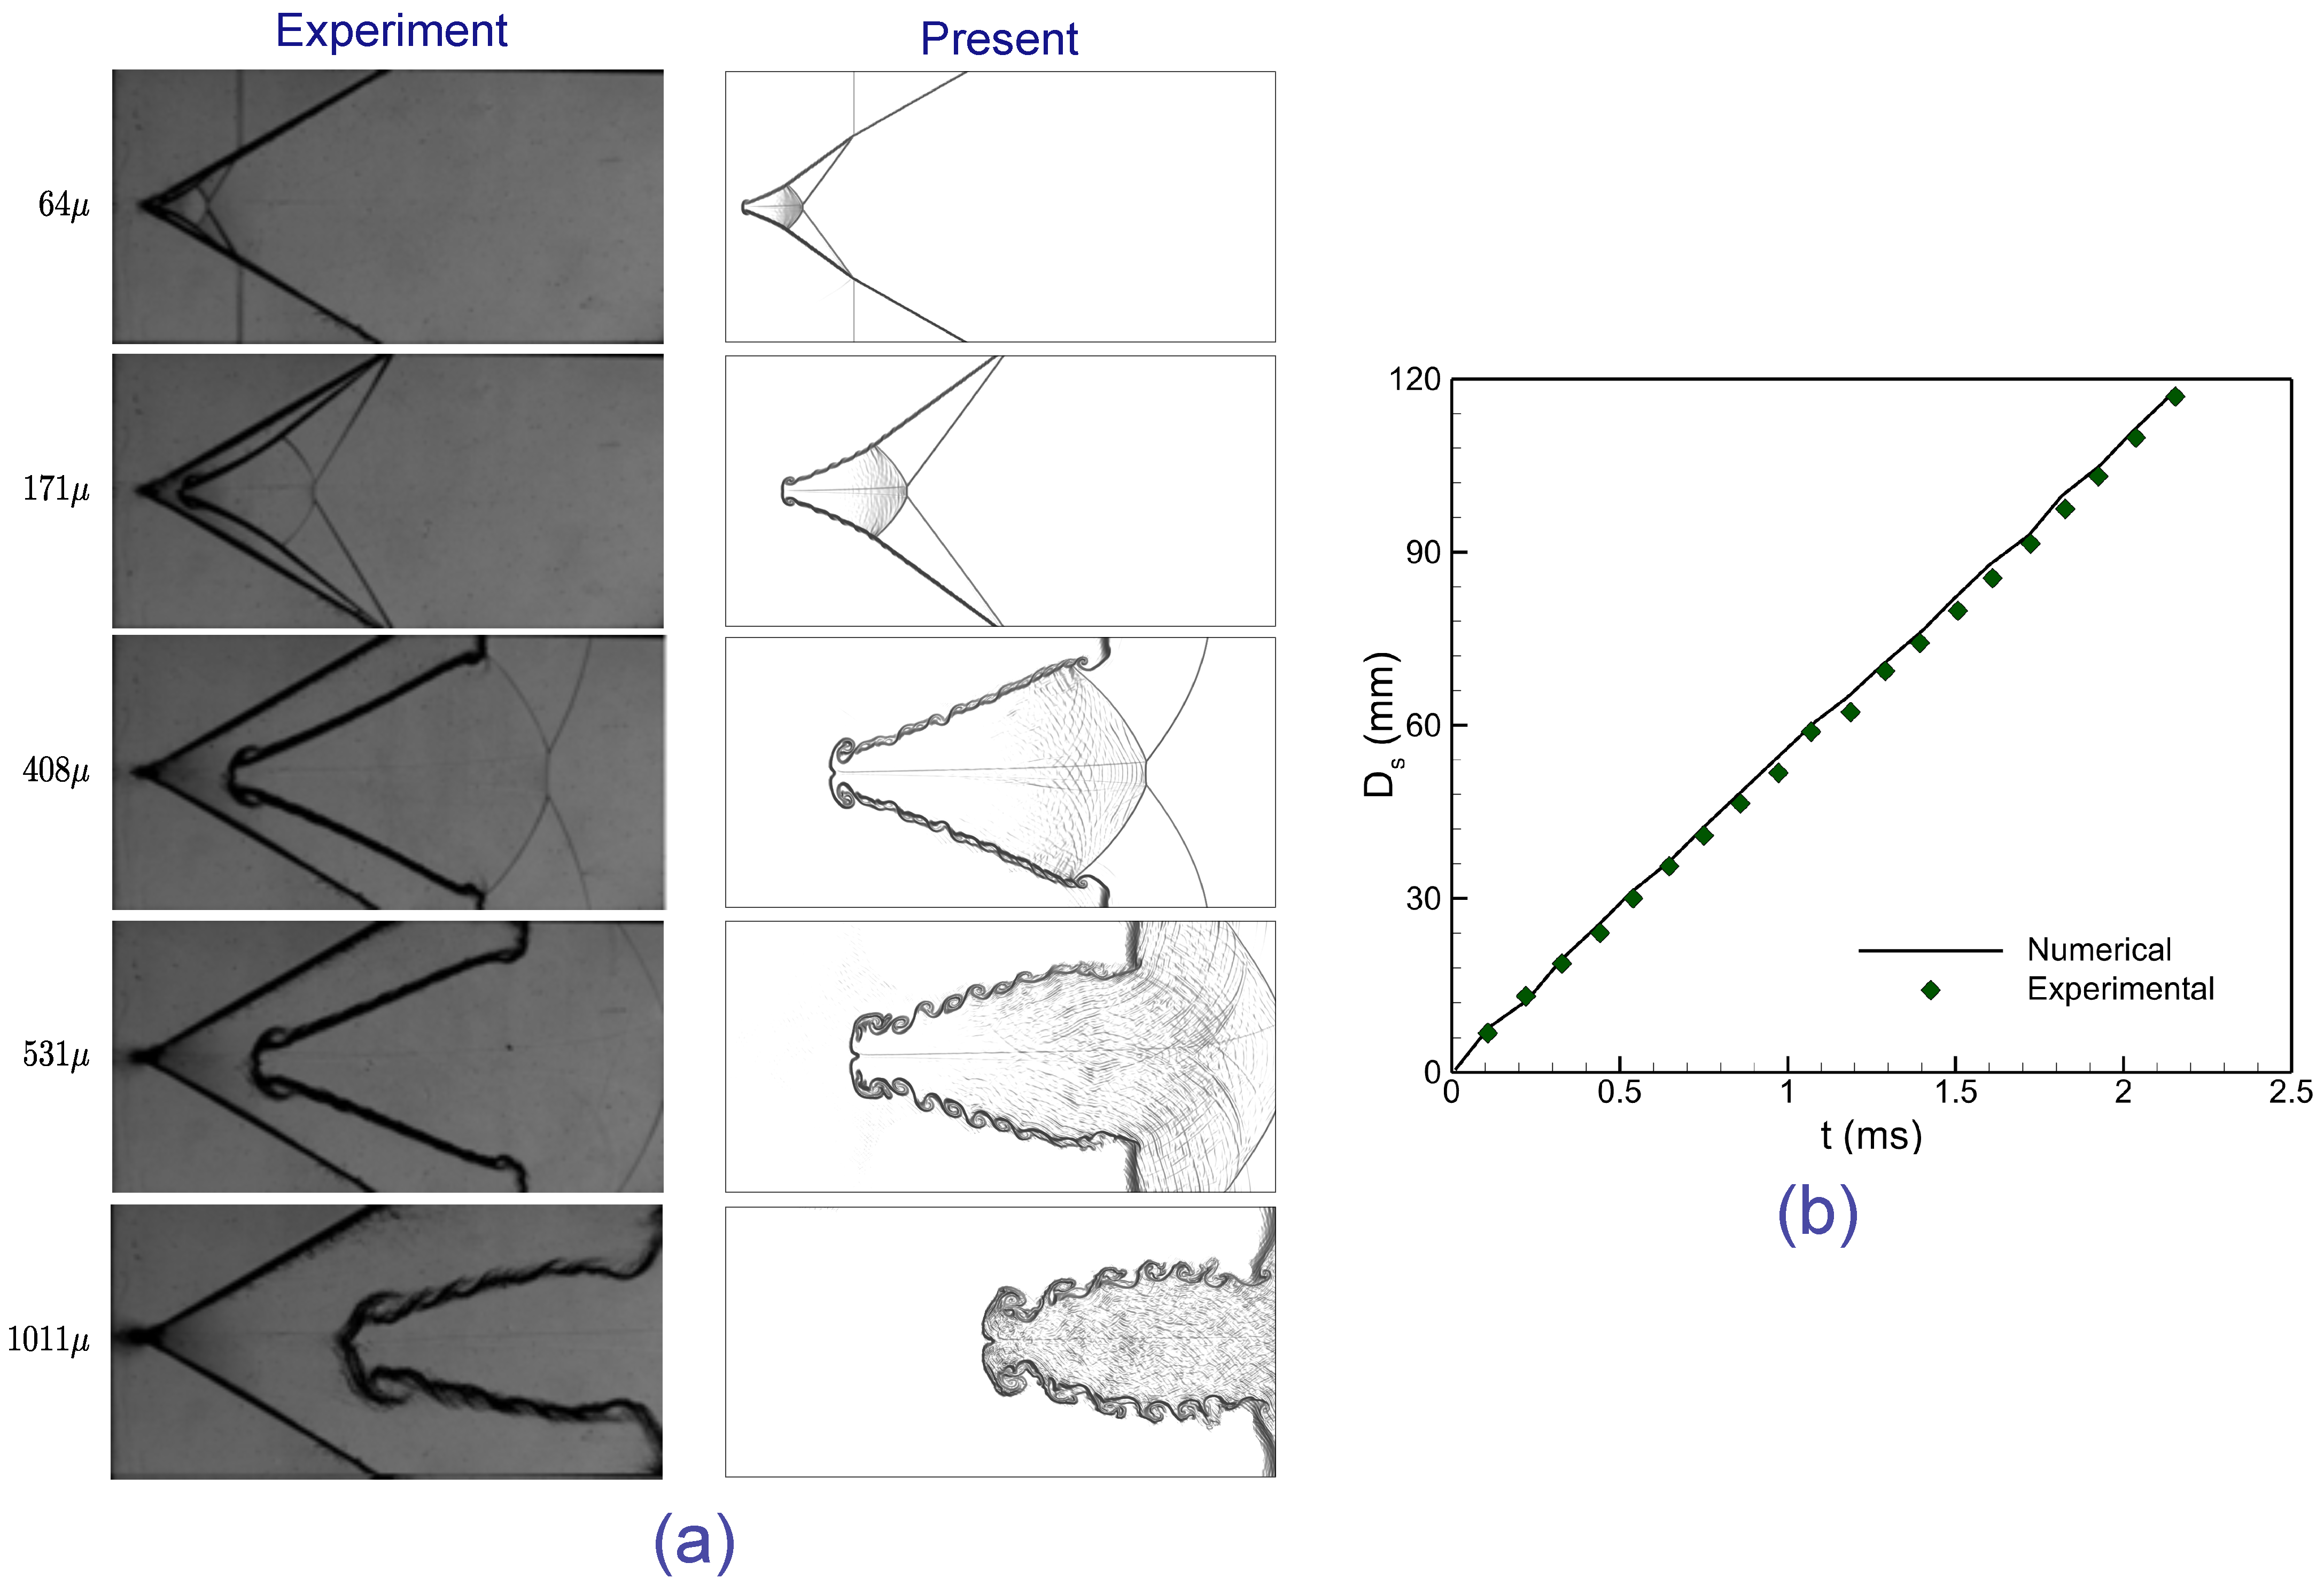
The present numerical framework is validated against the experiments of Luo et al. [54], who studied a two-dimensional shock-driven chevron-shaped air/ SF 6 interface impacted by a planar shock of Mach number M s = 1.2 with a vertex angle θ = 60 . Figure 2a compares schlieren images from simulations and experiments at several time instants ( t = 64 μ s, 171 μ s, 408 μ s, 531 μ s, and 1011 μ s). Shortly after shock impact, the transmitted shock in SF 6 becomes curved while a reflected wave propagates into air, leading to baroclinic vorticity deposition and deformation of the chevron tips. At intermediate times, the perturbations amplify into elongated jets, and later, these jets roll up into vortices and fine-scale structures, accompanied by multiple wave interactions. The schlieren fields predicted by the present DG scheme reproduce the experimental patterns with high fidelity, capturing shock refraction, jet formation, vortex roll-up, and secondary wave generation. Figure 2b shows the upstream interface displacement D s , where symbols denote experiments and lines indicate simulations. The close agreement throughout the evolution demonstrates the accuracy of the DG solver in capturing both global interface motion and small-scale features.
As a further validation, we examine the classical two-dimensional shock–bubble interaction, where a planar shock wave impinges on a heavy cylindrical gas interface. This configuration has been extensively studied experimentally by Haas and Sturtevant [55] and numerically by Quirk and Karni [56]. In these studies, the bubble consists of Refrigerant–22 ( R 22 ) surrounded by quiescent air and is impulsively accelerated by a weak incident shock of Mach number M s = 1.22 . Figure 3 presents a comparison of schlieren images at selected times ( t = 55 , 98, 147, 197, and 247 μ s) obtained from experiments, reference simulations, and the present DG computations. At early time ( t = 55 μ s), the incident shock interacts with the upstream interface, generating reflected and refracted waves. As the transmitted shock propagates into the bubble ( t = 98 μ s), the interface begins to deform under the combined action of transmitted and reflected shocks. At t = 147 μ s, baroclinic vorticity deposition initiates jet formation, which further intensifies into strong shear layers and vortex roll-up by t = 197 μ s. At later stages ( t = 247 μ s), well-developed vortical structures and continued jet penetration are clearly observed. The present DG simulations accurately capture these processes, including shock refraction, interface deformation, jet growth, and vortex roll-up, demonstrating the robustness of the solver in reproducing canonical shock–bubble dynamics.

4. Results and Discussion

This section presents the numerical results for the interaction of a planar shock wave with a sinusoidal single-mode stratified heavy fluid layer. The analysis focuses on the influence of the Atwood number on the evolution of interface morphology, shock–interface interaction, baroclinic vorticity deposition, and global flow diagnostics such as enstrophy, circulation, and kinetic energy. To achieve this, simulations are carried out for a fixed heavy-layer thickness of d = 20 mm , initial perturbation amplitude a 0 = 40 mm , and wavelength λ = 100 mm , with an incident shock Mach number of M s = 1.21 . Different gas-pair configurations, as listed in Table 1, are considered to span Atwood numbers in the range A = 0.30 0.72 , thereby providing a systematic framework to examine the role of density contrast in shock-driven instability growth and nonlinear flow evolution.
For consistency in describing the temporal dynamics, a dimensionless time parameter is introduced. The physical time t is scaled by the characteristic time t 0 = L / V i , where L denotes the interface wavelength and V i represents the velocity of the incident shock wave. Thus, the normalized time is expressed as
τ = t t 0 = t V i L .
All simulations presented in this study are performed with a proprietary high-order DG solver of third-order accuracy, developed in FORTRAN 95 and compiled under Visual Studio 2019. The evolution of the flow field, including the interface deformation, vorticity generation, and instability growth, is analyzed through visualization and data post-processing carried out in Tecplot 360 (2019R1).

4.1. Grid Resolution Study

Figure 4 presents the density contours at τ = 25 for the shock-driven single-mode stratified heavy fluid layer with Atwood number A = 0.72 , obtained using four different grid resolutions. At coarse resolutions, such as N x × N y = 200 × 100 and 400 × 200 , the interface morphology is poorly captured, and small-scale flow structures are noticeably smeared. With an intermediate resolution of 800 × 400 , the interface evolution and large-scale features are resolved more accurately, though finer details remain underrepresented. The highest resolution, 1200 × 600 , provides a well-resolved interface shape and sharper gradients, ensuring accurate representation of vorticity deposition and instability growth.
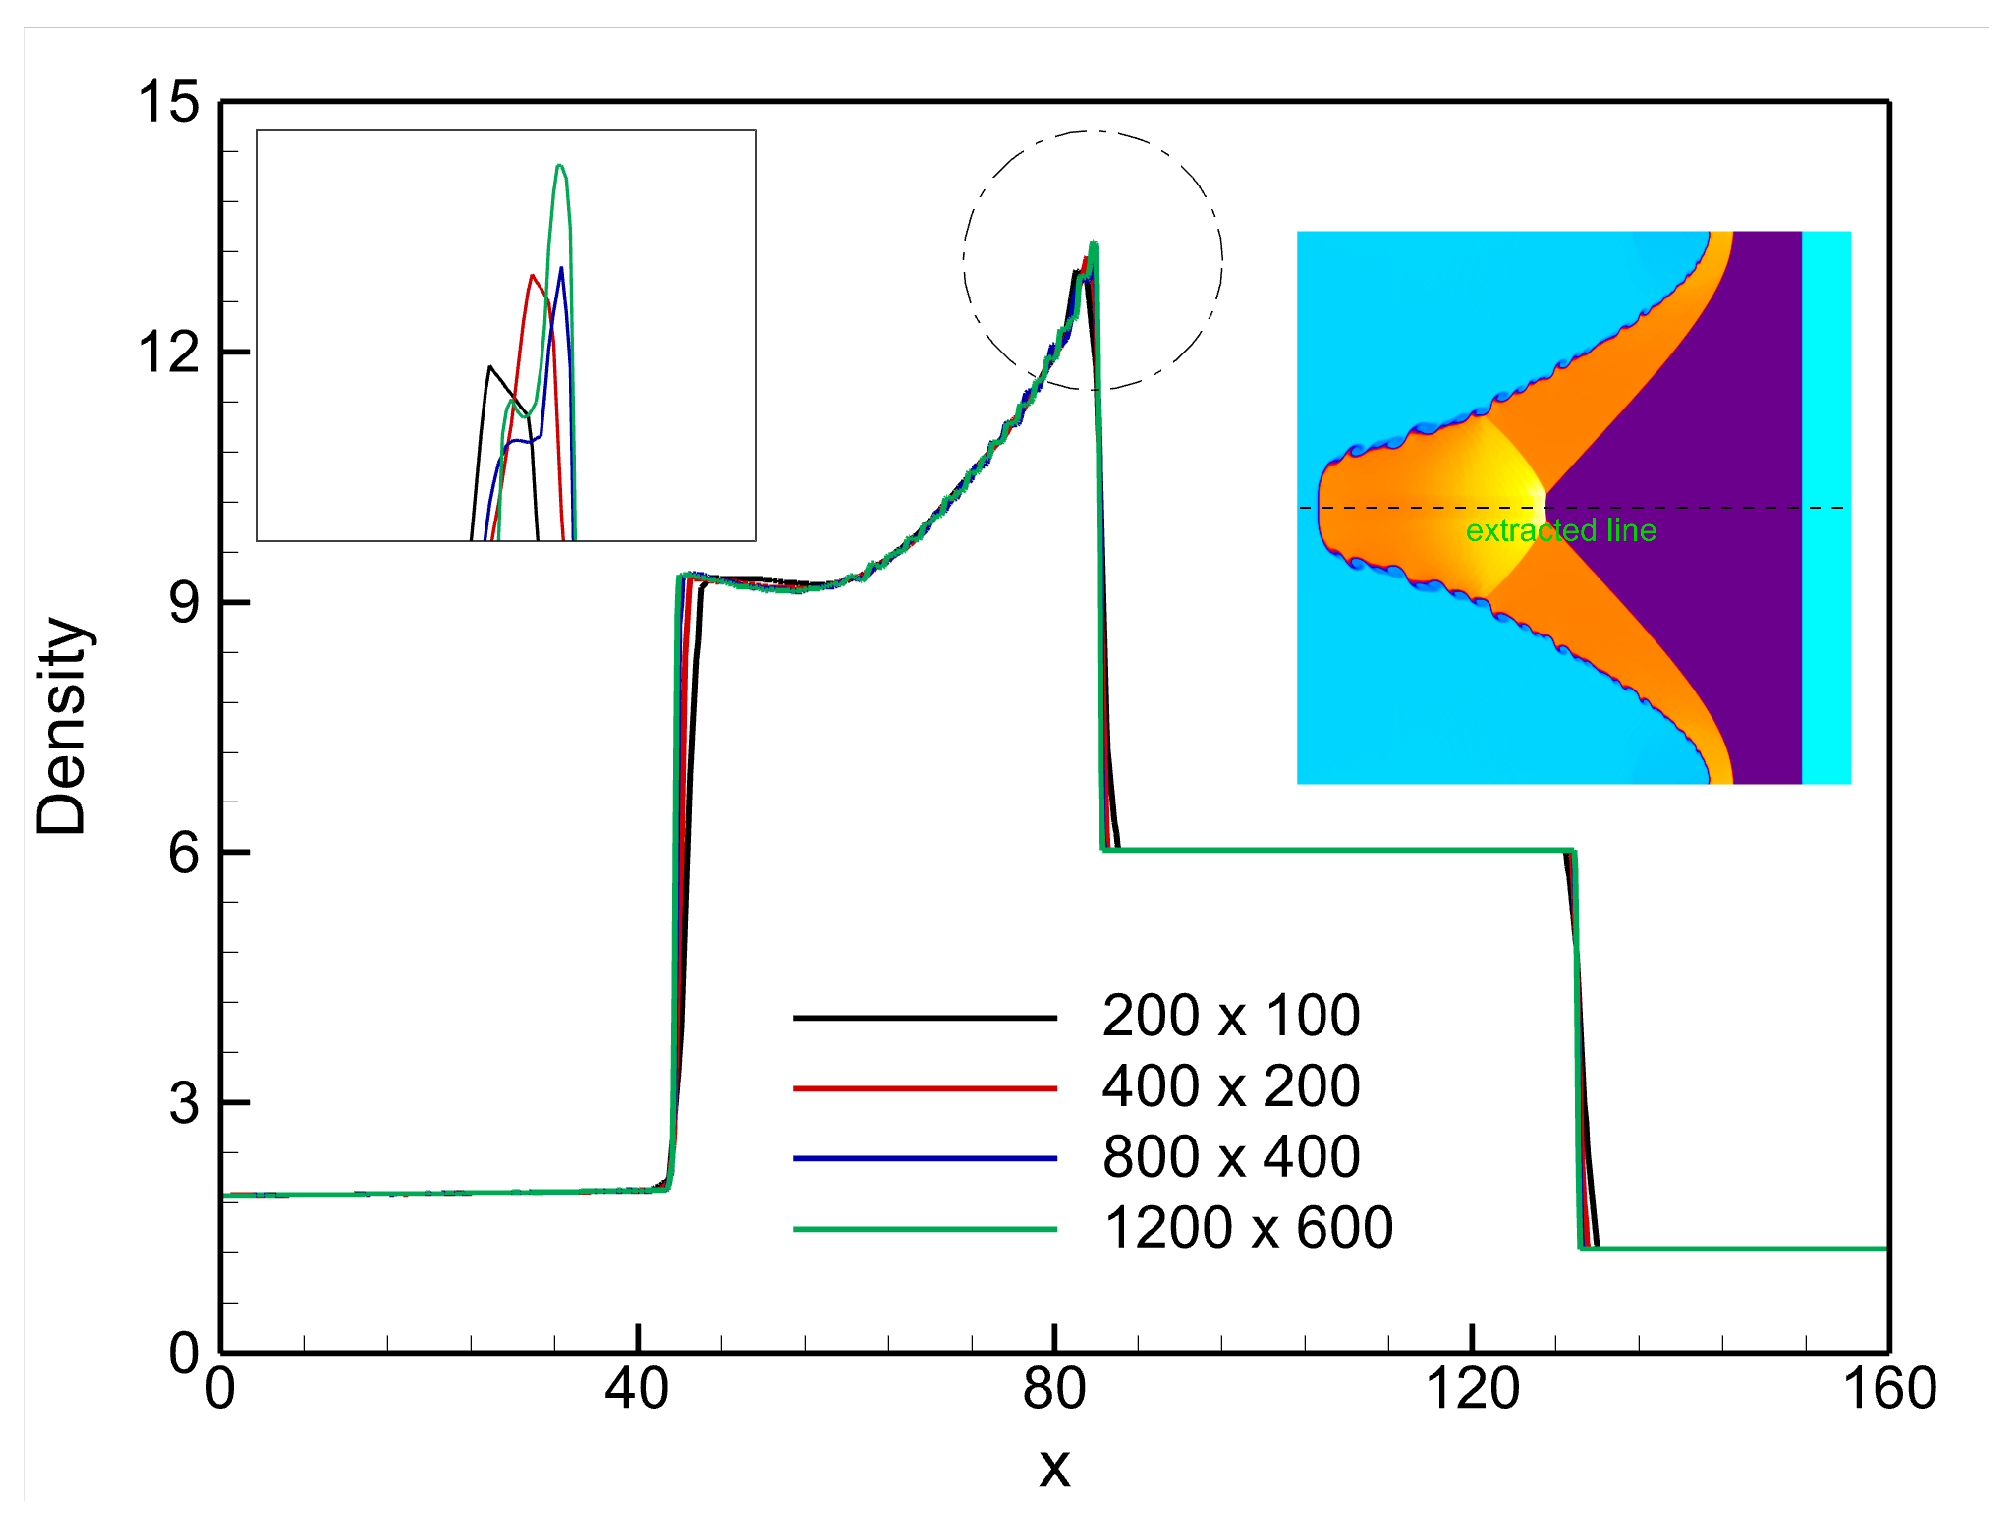
Furthermore, Figure 5 shows the density profiles along the centerline ( y = 50 mm ) at τ = 25 for a shock-driven single-mode stratified heavy fluid layer with Atwood number A = 0.72 , computed with four mesh resolutions. At coarse resolutions ( N x × N y = 200 × 100 and 400 × 200 ), the density distribution is poorly resolved, with noticeable deviations near the shock front and interface. Increasing the resolution to N x × N y = 800 × 400 significantly improves the profile accuracy, though small differences remain. The finest grid, N x × N y = 1200 × 600 , captures the sharp density gradients and shock–interface interactions most accurately, while showing close agreement with the 800 × 400 case, indicating grid convergence. Based on this assessment, the resolution N x × N y = 1200 × 600 was chosen for all subsequent simulations, as it provides reliable accuracy with acceptable computational cost.

4.2. Interface Development and Instability Structures

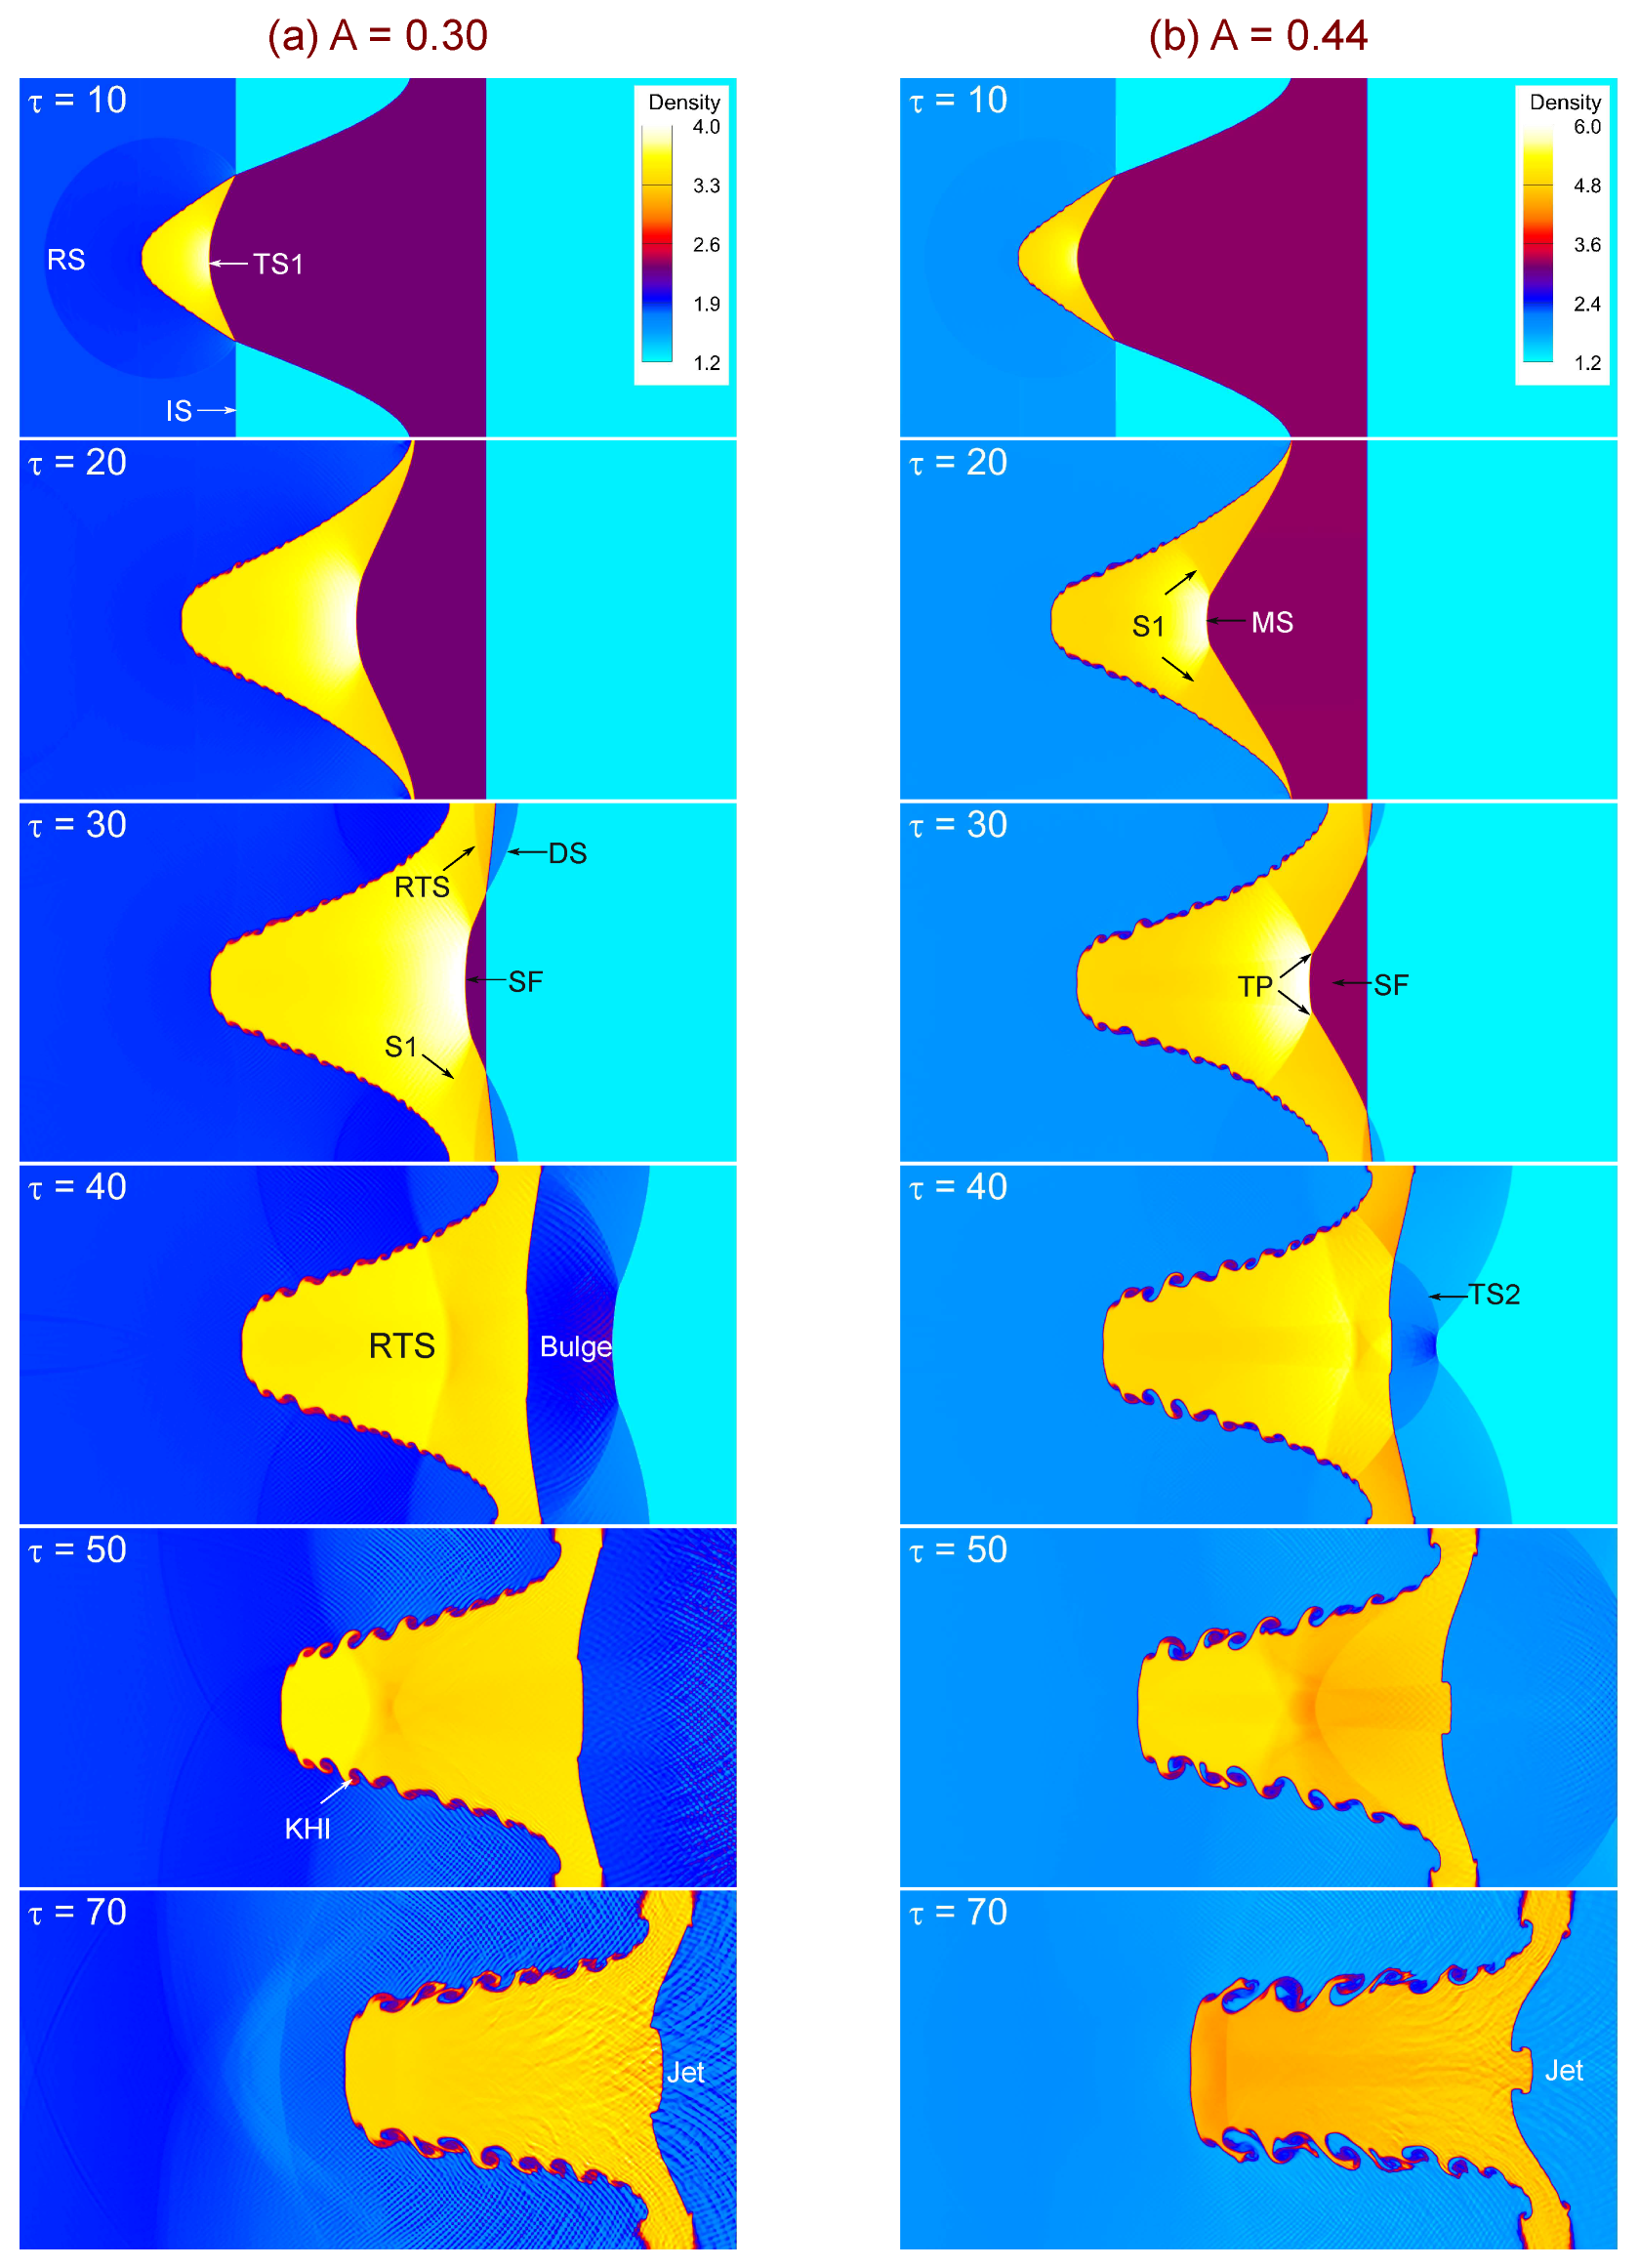
Figure 6, Figure 7 and Figure 8 collectively illustrate the temporal evolution of shock-driven single-mode stratified heavy fluid layers at progressively increasing Atwood numbers, ranging from A = 0.30 to A = 0.72 . Immediately after shock impact, the interaction between the incident shock and the perturbed interface generates a transmitted shock (TS) propagating into the heavy fluid and a reflected shock (RS) traveling into the light fluid. The misalignment of pressure and density gradients across the perturbed interface deposits baroclinic vorticity, which drives the subsequent growth and deformation of the interface. For the lower Atwood numbers ( A = 0.30 and A = 0.44 , Figure 6), the density contrast is modest, resulting in weaker vorticity deposition and relatively smooth interface evolution. At A = 0.30 , the perturbation amplitude grows slowly, and roll-ups along with Kelvin–Helmholtz (KH) shear layers emerge only at later times. In contrast, at A = 0.44 , the stronger density gradient amplifies the baroclinic torque, producing more pronounced roll-ups, bulges, and early onset of secondary instabilities, which accelerate the transition toward the nonlinear regime.
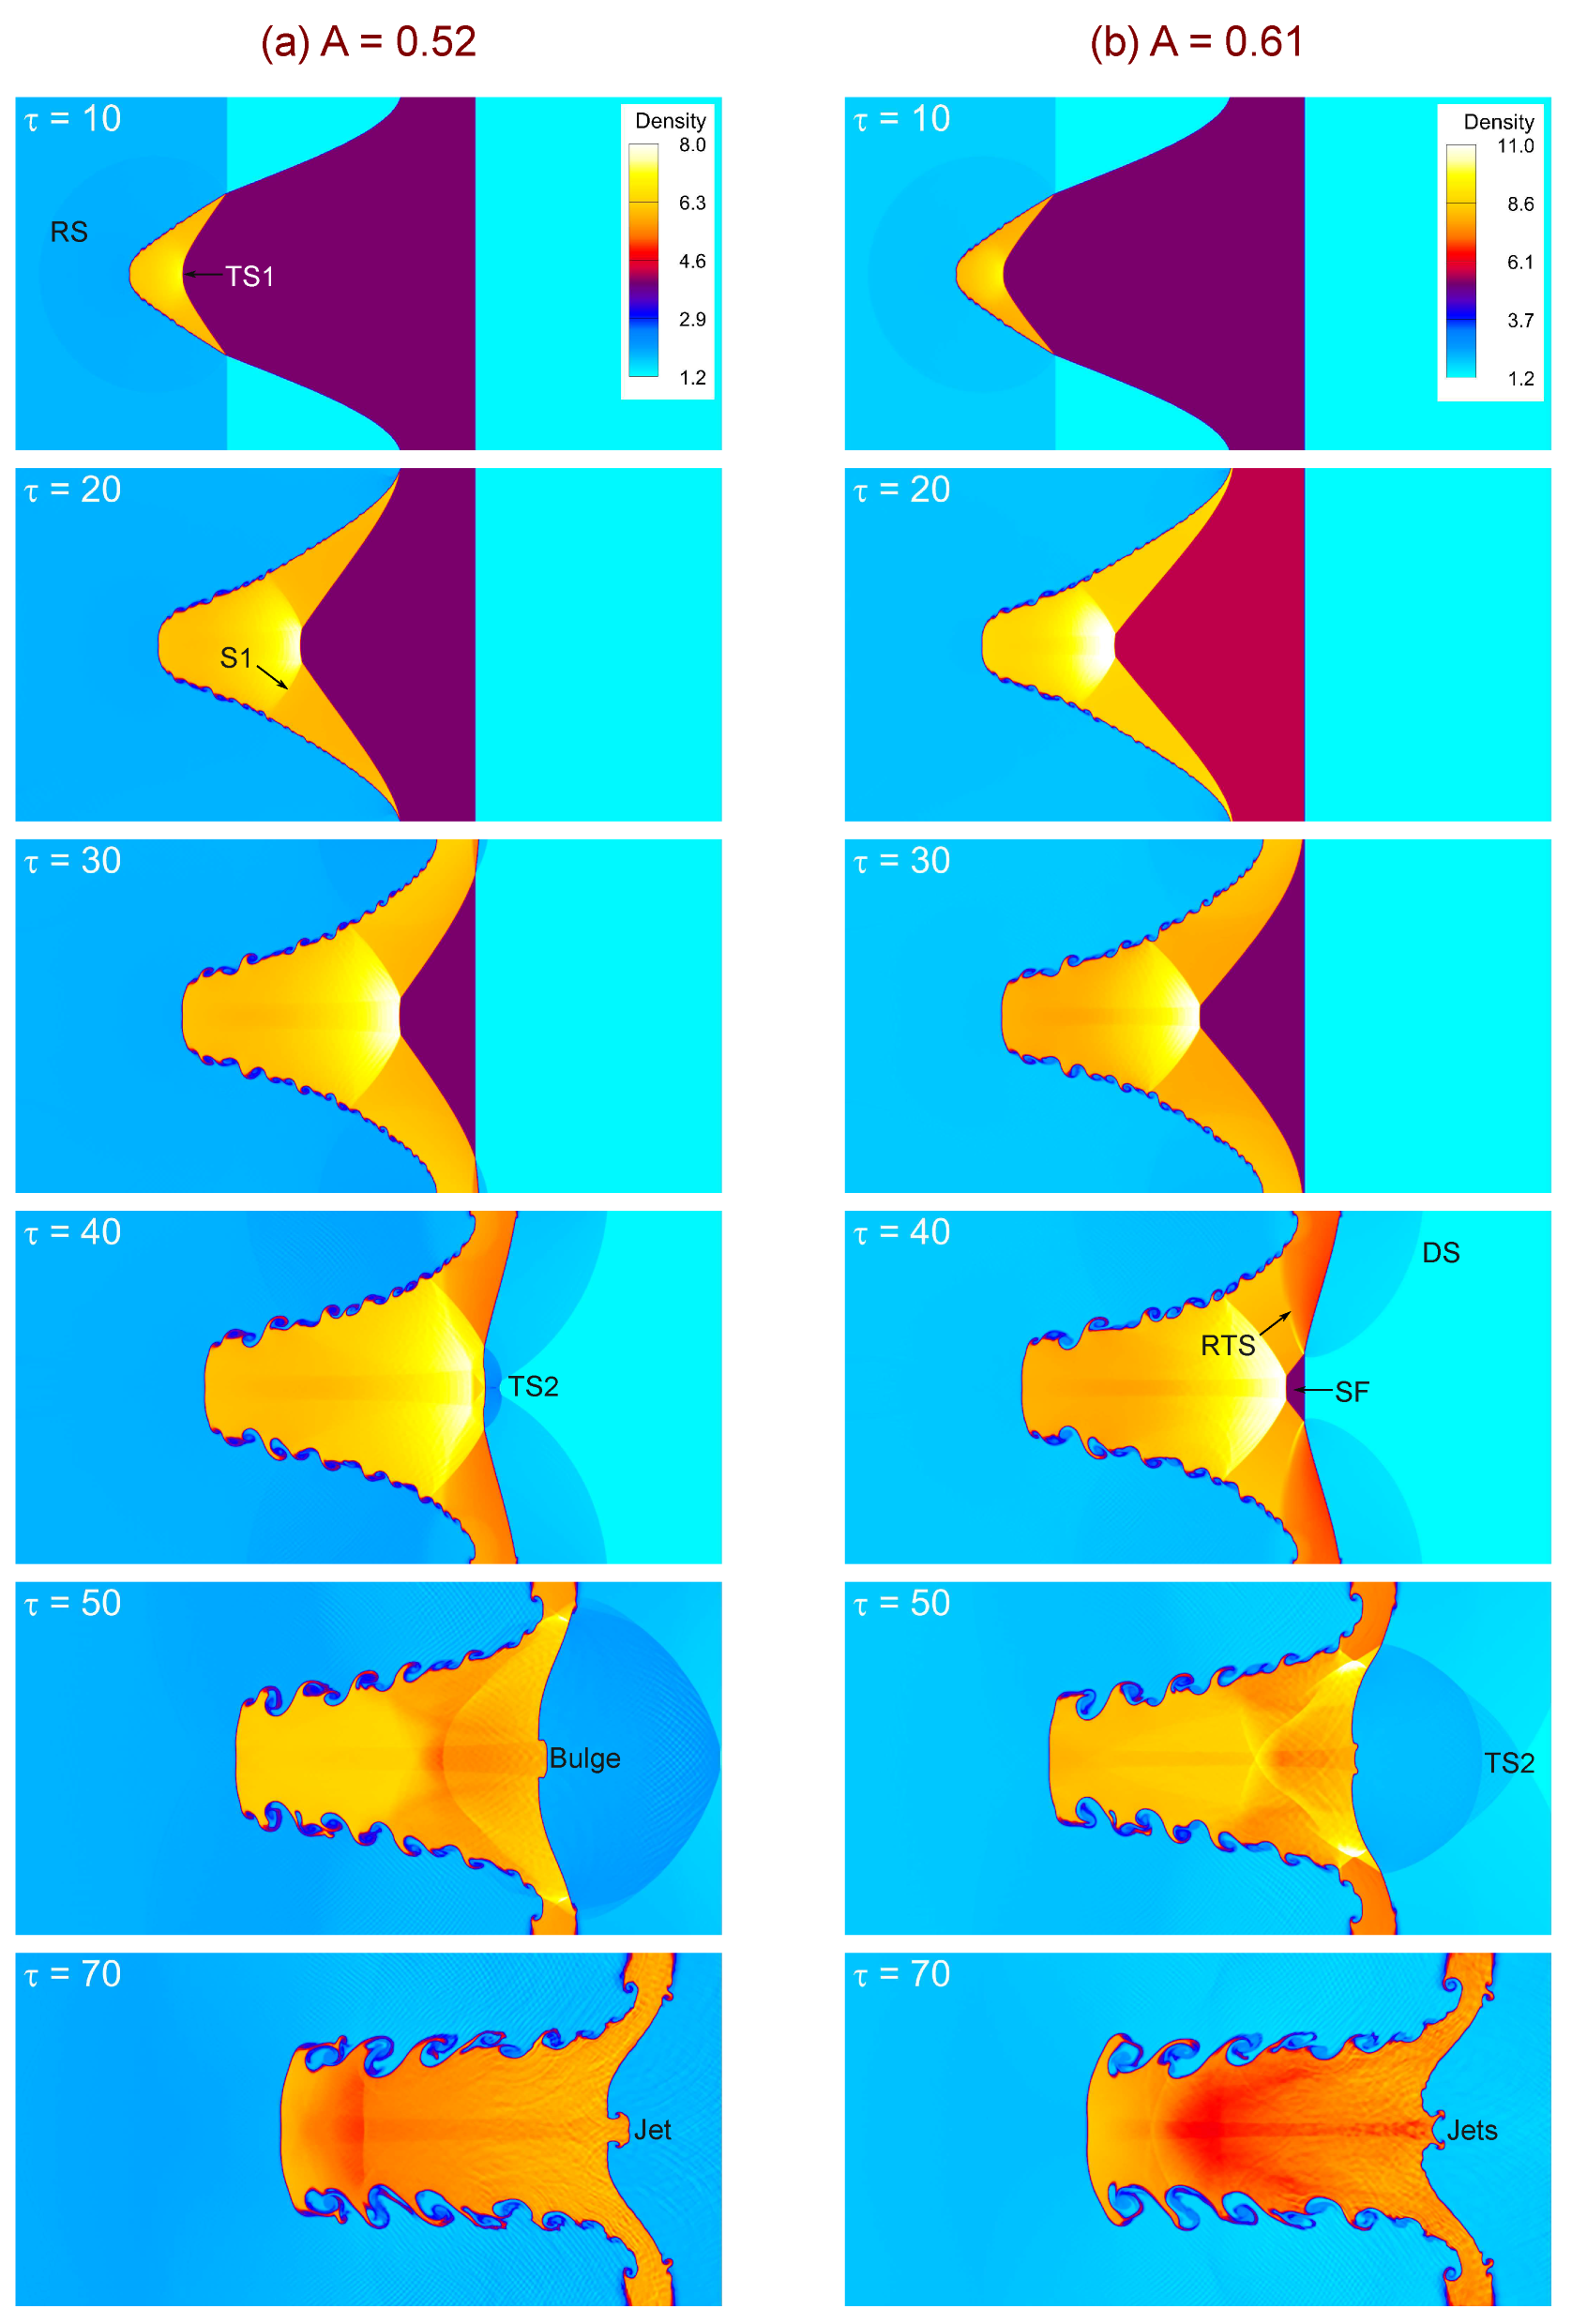
At intermediate Atwood numbers ( A = 0.52 and A = 0.61 , Figure 7), the instability dynamics become more vigorous. For A = 0.52 , the interface exhibits steady amplitude growth, with clear bulging and roll-up structures appearing by τ = 40 , accompanied by secondary transmitted shocks (TS2) and small-scale KH vortices. For A = 0.61 , the density contrast further intensifies vorticity deposition, resulting in faster perturbation growth, stronger roll-ups, and earlier development of shear-layer vortices. At later times, large bulges transform into jet-like structures and multiple small-scale vortices, signifying enhanced mixing and energy transfer. At the highest Atwood numbers considered ( A = 0.68 and A = 0.72 , Figure 8), the interface undergoes the most vigorous evolution. Already by τ = 20 –30, strong baroclinic vorticity accelerates perturbation growth, with transmitted and reflected shocks interacting with the interface to further amplify deformation. For A = 0.68 , bulges, KH roll-ups, and jets dominate the late-time morphology, while for A = 0.72 , the instability develops even more violently. The higher density gradient triggers earlier onset of secondary instabilities, rapid roll-up of the interface, and stronger jet penetration, accompanied by extensive small-scale vortical structures that promote intense mixing. Taken together, Figure 6, Figure 7 and Figure 8 demonstrate the systematic influence of the Atwood number on RMI dynamics. As A increases, baroclinic vorticity deposition strengthens, leading to faster perturbation growth, earlier nonlinear transition, and more complex interface structures. Low A values yield smoother, coherent evolution, whereas high A values favor rapid roll-ups, jet formation, and enhanced small-scale mixing.
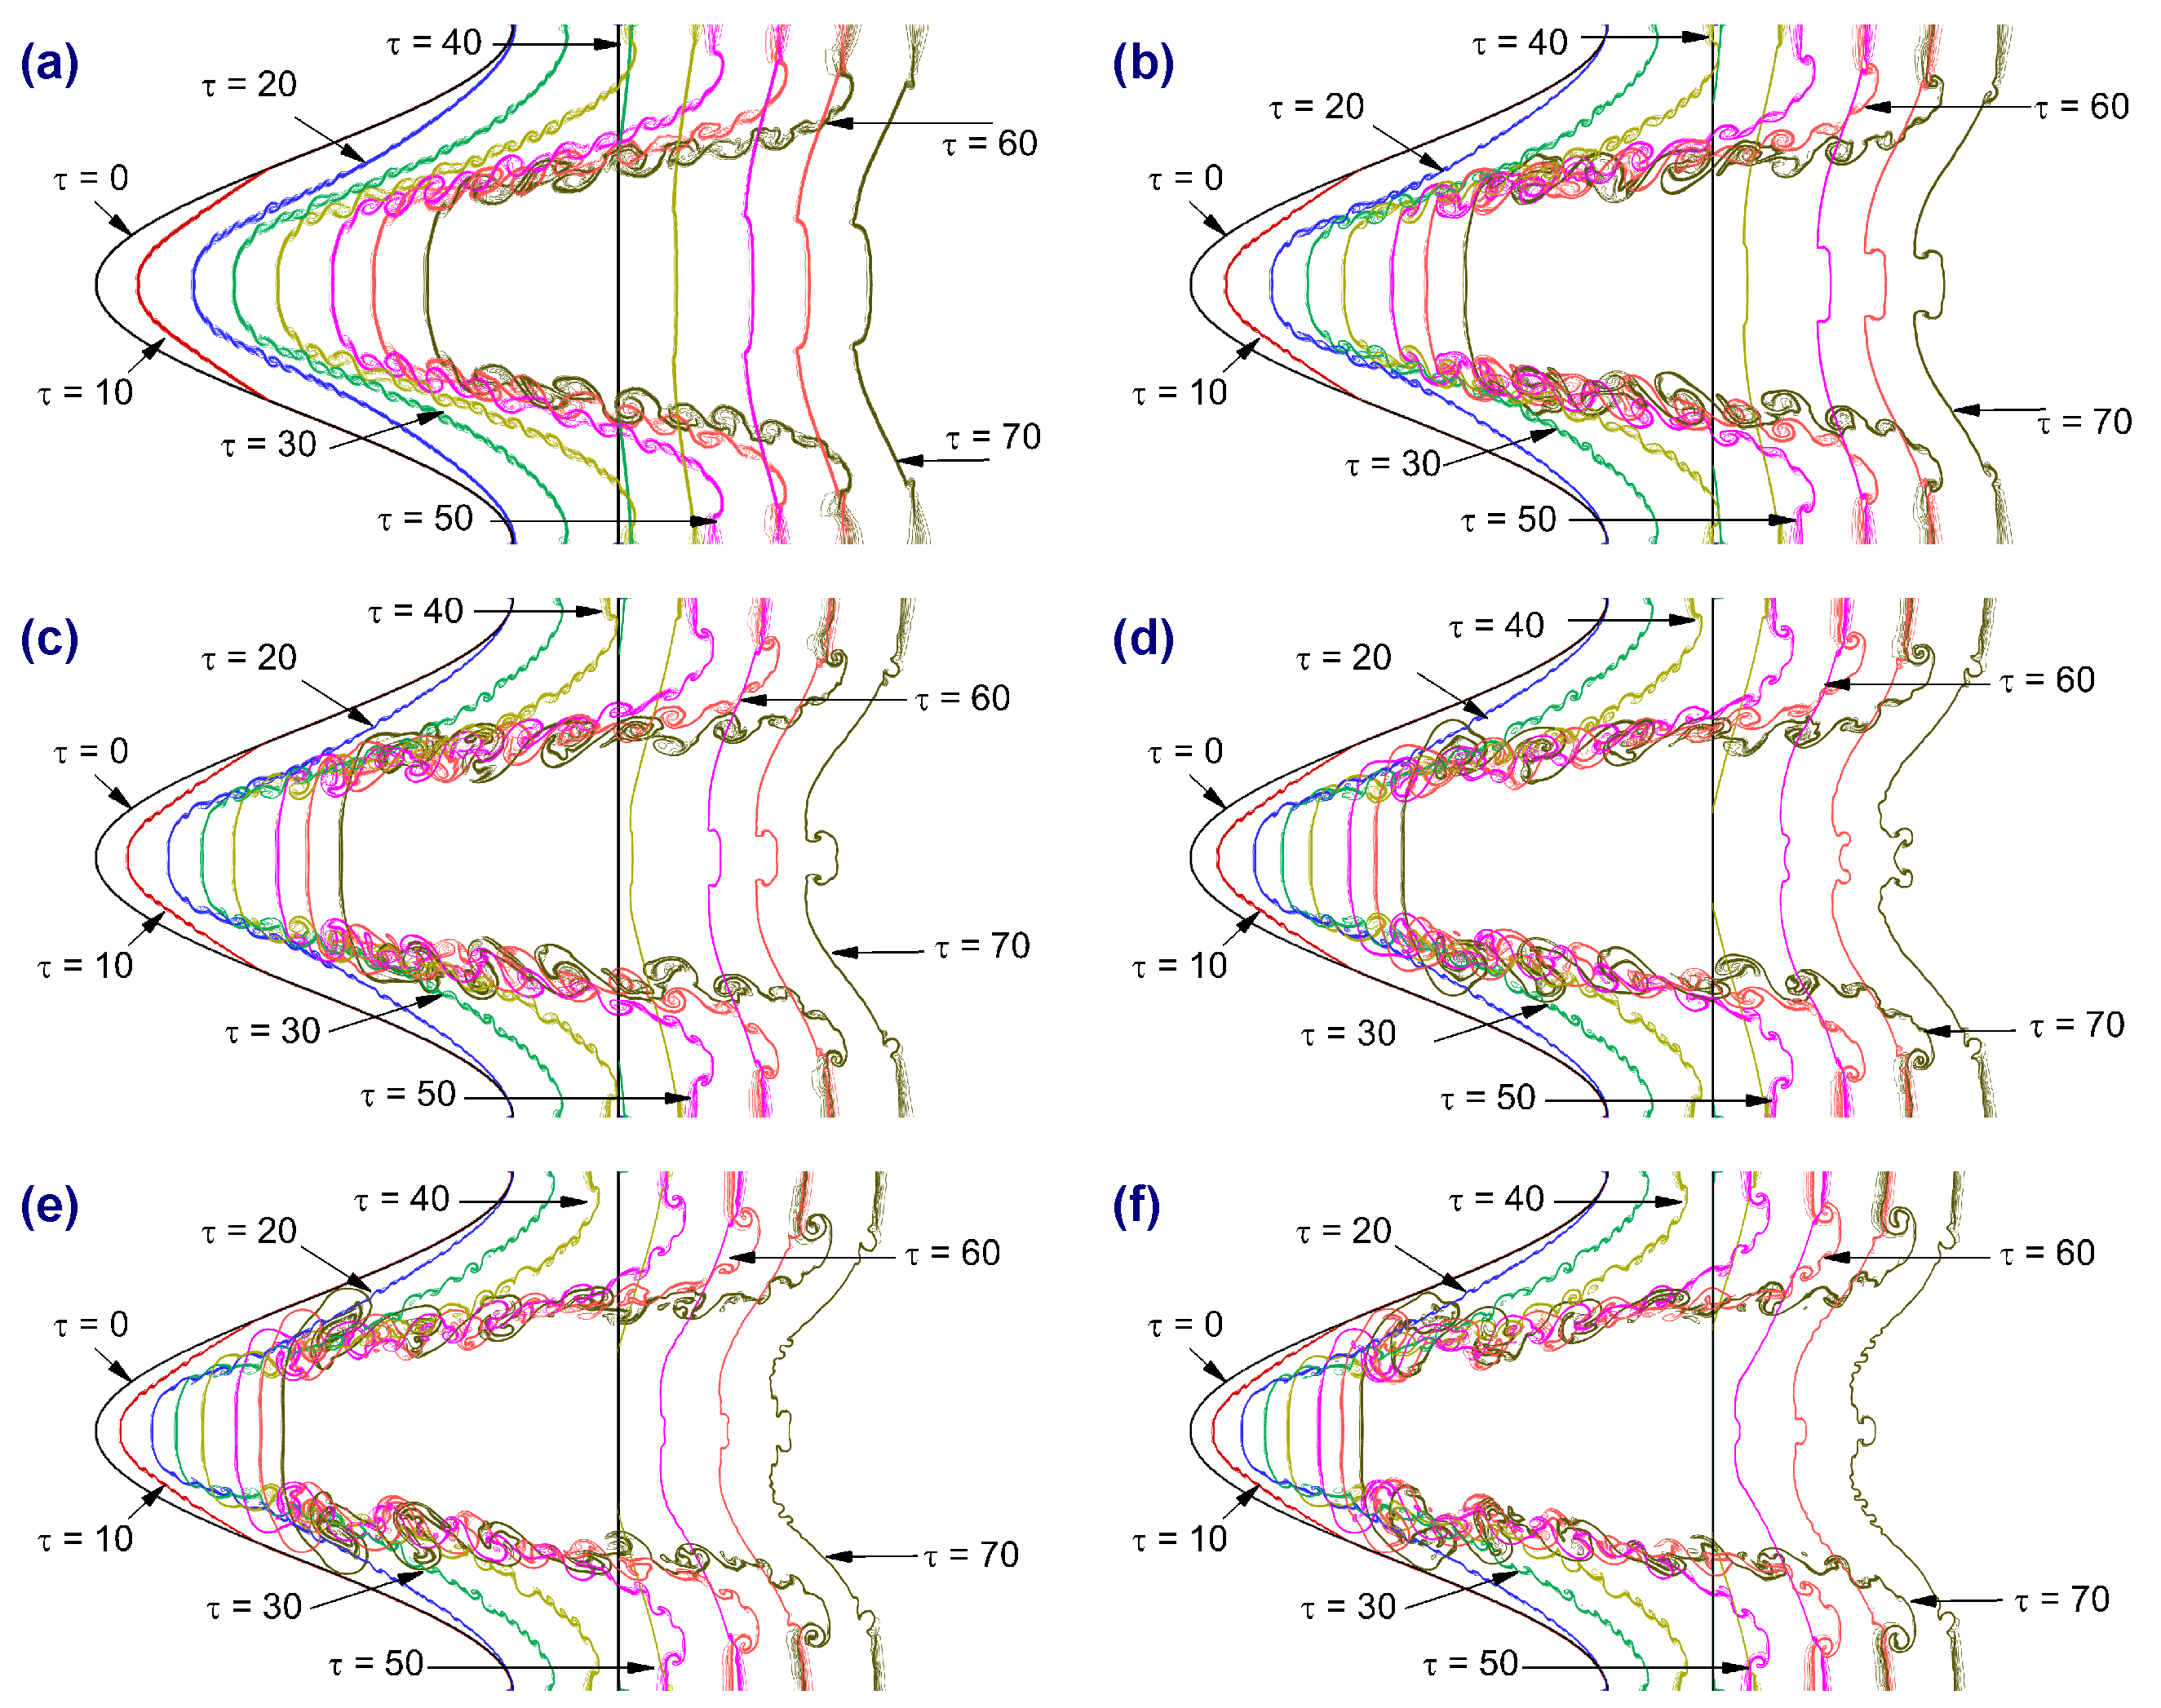
Figure 9 illustrates the effect of the Atwood number on the temporal evolution of interface deformation in shock-driven single-mode stratified heavy fluid layers. The interface positions are plotted at successive normalized times ( τ = 0 –70) for Atwood numbers ranging from A = 0.30 to A = 0.72 . For the lowest Atwood number ( A = 0.30 ), the perturbation amplitude grows slowly, and the interface remains relatively smooth and coherent throughout the evolution. The roll-ups and secondary instabilities develop gradually, with limited nonlinear distortion at later times. As the Atwood number increases to A = 0.44 and A = 0.52 , the interface exhibits stronger deformation and earlier onset of roll-ups, indicating enhanced baroclinic vorticity deposition due to the larger density contrast. At A = 0.61 and A = 0.68 , the deformation becomes more vigorous. The interface undergoes pronounced bulging and roll-up structures, while Kelvin–Helmholtz instabilities along the shear layers introduce small-scale vortices that accelerate the transition into the nonlinear regime. By τ = 70 , jet-like protrusions and strong asymmetries dominate the interface morphology. At the highest Atwood number considered ( A = 0.72 ), the instability is most intense. The perturbation amplitude grows rapidly, and the interface develops large bulges, strong roll-ups, and multiple small-scale structures at earlier times compared to the lower A cases. This highlights the sensitivity of RMI growth to Atwood number: as A increases, baroclinic vorticity deposition strengthens, leading to faster perturbation amplification, earlier nonlinear transition, and enhanced mixing efficiency.
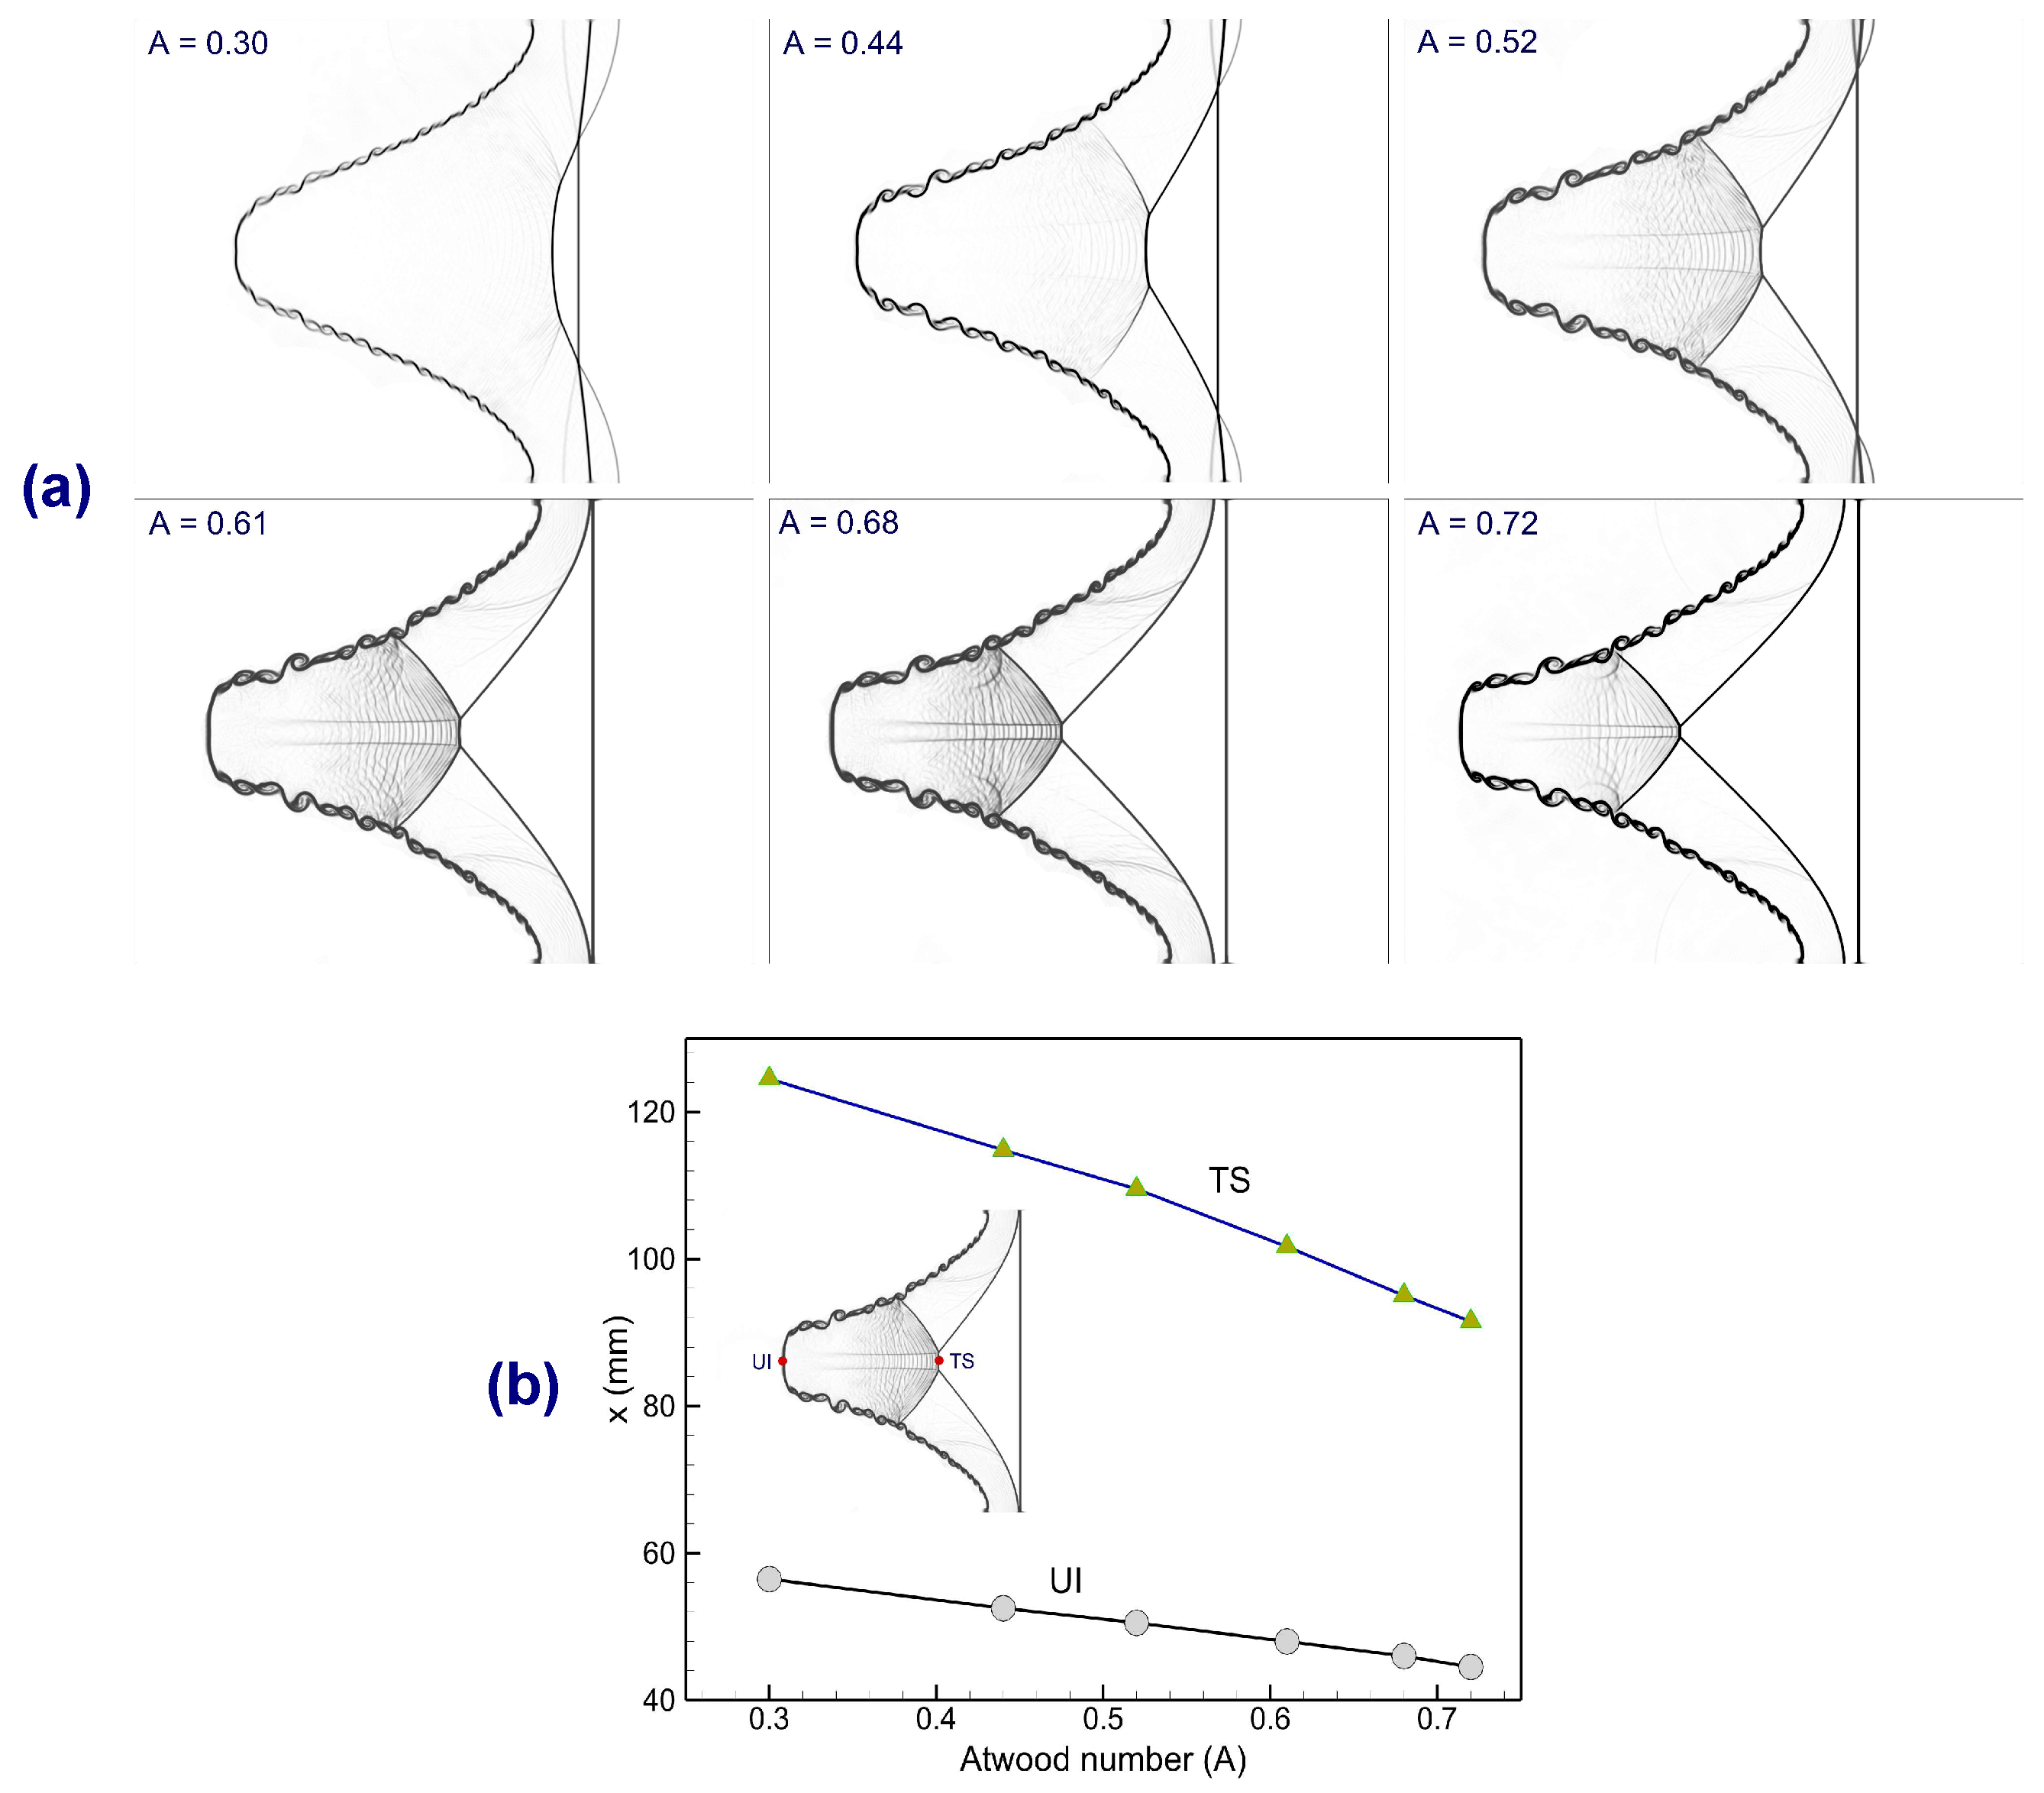
Figure 10 examines the effect of the Atwood number on the shock–interface dynamics at τ = 30 . Figure 10a shows numerical schlieren images for different Atwood numbers ( A = 0.30 0.72 ), while Figure 10b presents the trajectories of the transmitted shock (TS) and the upstream interface (UI) as a function of A. As the Atwood number increases, the transmitted shock penetrates more slowly into the heavy fluid layer due to the larger density contrast, which increases the impedance mismatch at the interface. Consequently, the position of the TS shifts backward with increasing A, as clearly indicated in Figure 10b. Simultaneously, the upstream interface exhibits stronger deformation and roll-up at higher A, reflecting the enhanced baroclinic vorticity deposition caused by the stronger density gradient. At lower Atwood numbers ( A = 0.30 and 0.44 ), the transmitted shock propagates further downstream, and the interface remains relatively smoother, with weaker roll-ups. At intermediate values ( A = 0.52 and 0.61 ), stronger distortions appear, and the transmitted shock begins to lag. For the highest Atwood numbers ( A = 0.68 and 0.72 ), the transmitted shock is significantly slowed, and the interface exhibits pronounced bulges, KH roll-ups, and localized jet-like features. The inset in Figure 10b highlights the relative locations of the TS and UI extracted from the schlieren field, emphasizing the increasing separation between the transmitted shock and the distorted interface with increasing A. This systematic dependence confirms that higher Atwood numbers not only intensify interface instability but also alter the shock propagation characteristics by amplifying the interaction between the shock and the evolving interface.

4.3. Shock-Driven Vorticity Generation and Transport

The evolution of vorticity in a compressible flow can be described by the vorticity transport equation, obtained by taking the curl of the momentum equation. For a two-dimensional flow, the z-component of vorticity ω = ( × u ) z satisfies
D ω D t = ( ω · ) u ω ( · u ) + 1 ρ 2 ρ × p ,
where D D t = t + u · is the material derivative. The terms on the right-hand side represent, respectively, vortex stretching and tilting, dilatation effects due to compressibility, and baroclinic vorticity generation.
In shock-driven flows, the baroclinic term
1 ρ 2 ρ × p
dominates vorticity production. It arises from the misalignment between pressure and density gradients at the perturbed interface when the shock passes through it. This mechanism deposits circulation at the interface, initiating the RMI.
Figure 11 schematically illustrates the mechanism of vorticity generation in shock-driven single-mode stratified heavy fluid layers. Before the shock arrives (pre-shock state), the interface is perturbed but remains aligned with the pressure field; thus, the gradients of density ( ρ ) and pressure ( p ) are largely parallel, and no baroclinic torque is generated. When the incident shock impinges on the interface (post-shock state), the pressure gradient p imposed by the shock becomes misaligned with the density gradient ρ at the perturbed interface. This misalignment gives rise to a finite cross product ρ × p , which acts as a baroclinic torque in the vorticity transport equation. As a result, circulation is deposited along the interface, producing localized vorticity patches with alternating signs. These baroclinically generated vortical structures are then advected and stretched along the interface, forming shear layers that subsequently roll up into vortex pairs. This marks the onset of the RMI. With time, the continuous interaction between the deposited vorticity and the evolving interface amplifies the perturbation, leading to nonlinear roll-ups, KH instabilities, and enhanced mixing.
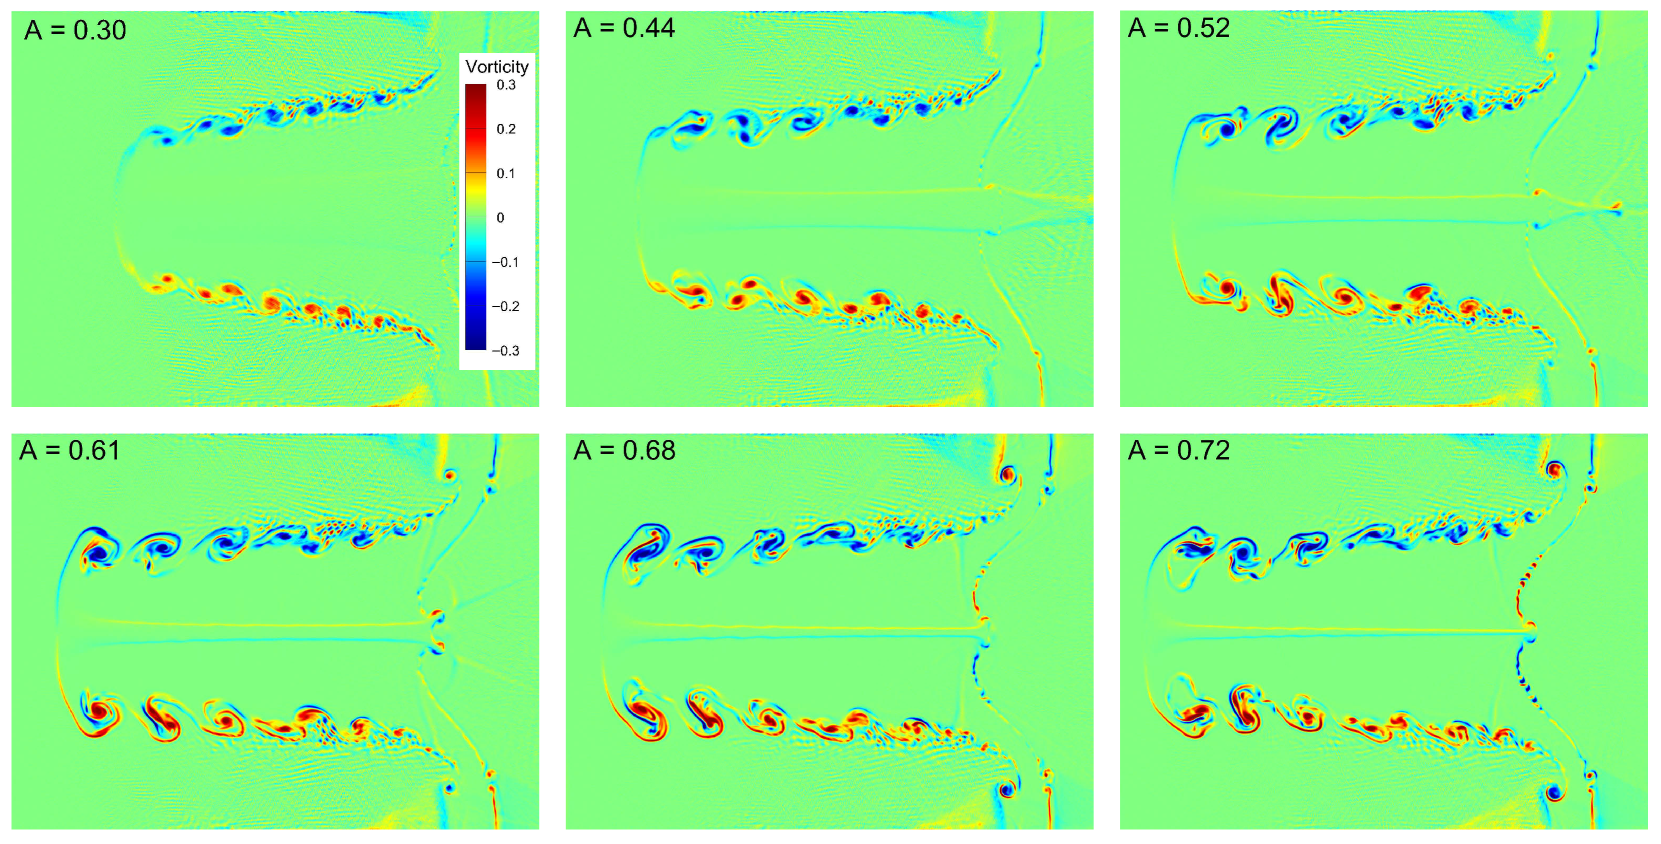
Figure 12 shows the vorticity distribution at τ = 70 for shock-driven single-mode stratified heavy fluid layers at different Atwood numbers, ranging from A = 0.30 to A = 0.72 . These distributions provide direct evidence of the role of baroclinic torque in generating and amplifying vorticity during RMI. For the lowest Atwood number ( A = 0.30 ), the vorticity field is weak, and the interface develops relatively smooth roll-ups with limited secondary structures. The circulation deposited at the interface is insufficient to drive strong nonlinear interactions, resulting in more coherent and large-scale vortices. As A increases to 0.44 and 0.52 , the baroclinic vorticity deposition strengthens due to the higher density contrast. This leads to more intense roll-ups, larger vortex cores, and the onset of small-scale structures along the interface. At these intermediate Atwood numbers, the balance between large coherent structures and emerging fine-scale vortices characterizes the transitional nonlinear regime. For higher Atwood numbers ( A = 0.61 , 0.68 , and 0.72 ), the vorticity field becomes significantly more complex. Stronger shear layers and Kelvin–Helmholtz instabilities develop along the interface, producing fine-scale vortices that interact, merge, and break down into turbulent-like structures. Jet-like protrusions and secondary vortex shedding are also evident, demonstrating enhanced transport and redistribution of vorticity across the domain. In summary, the vorticity dynamics are strongly governed by the Atwood number. A higher A amplifies baroclinic vorticity generation, hastens the transition to the nonlinear regime, and promotes the development of small-scale vortical structures, thereby enhancing mixing and facilitating the energy cascade in shock-driven flows.
The vorticity transport equation for compressible inviscid flows (Equation (12)) contains two principal source terms relevant to shock–interface interactions: the dilatational contribution, ω ( · u ) , and the baroclinic torque, 1 ρ 2 ρ × p . While the dilatational term reflects compressibility effects associated with local expansion and compression of fluid elements, the baroclinic term provides the dominant source of vorticity production in RMI. To quantify the evolution of these contributions, spatially integrated measures are defined over the computational domain D:
ω dil ( t ) = D | ω ( · u ) | d x d y ,
ω baro ( t ) = D 1 ρ 2 ρ × p d x d y ,
where ω dil and ω bar denote the global strength of dilatational and baroclinic vorticity contributions, respectively.
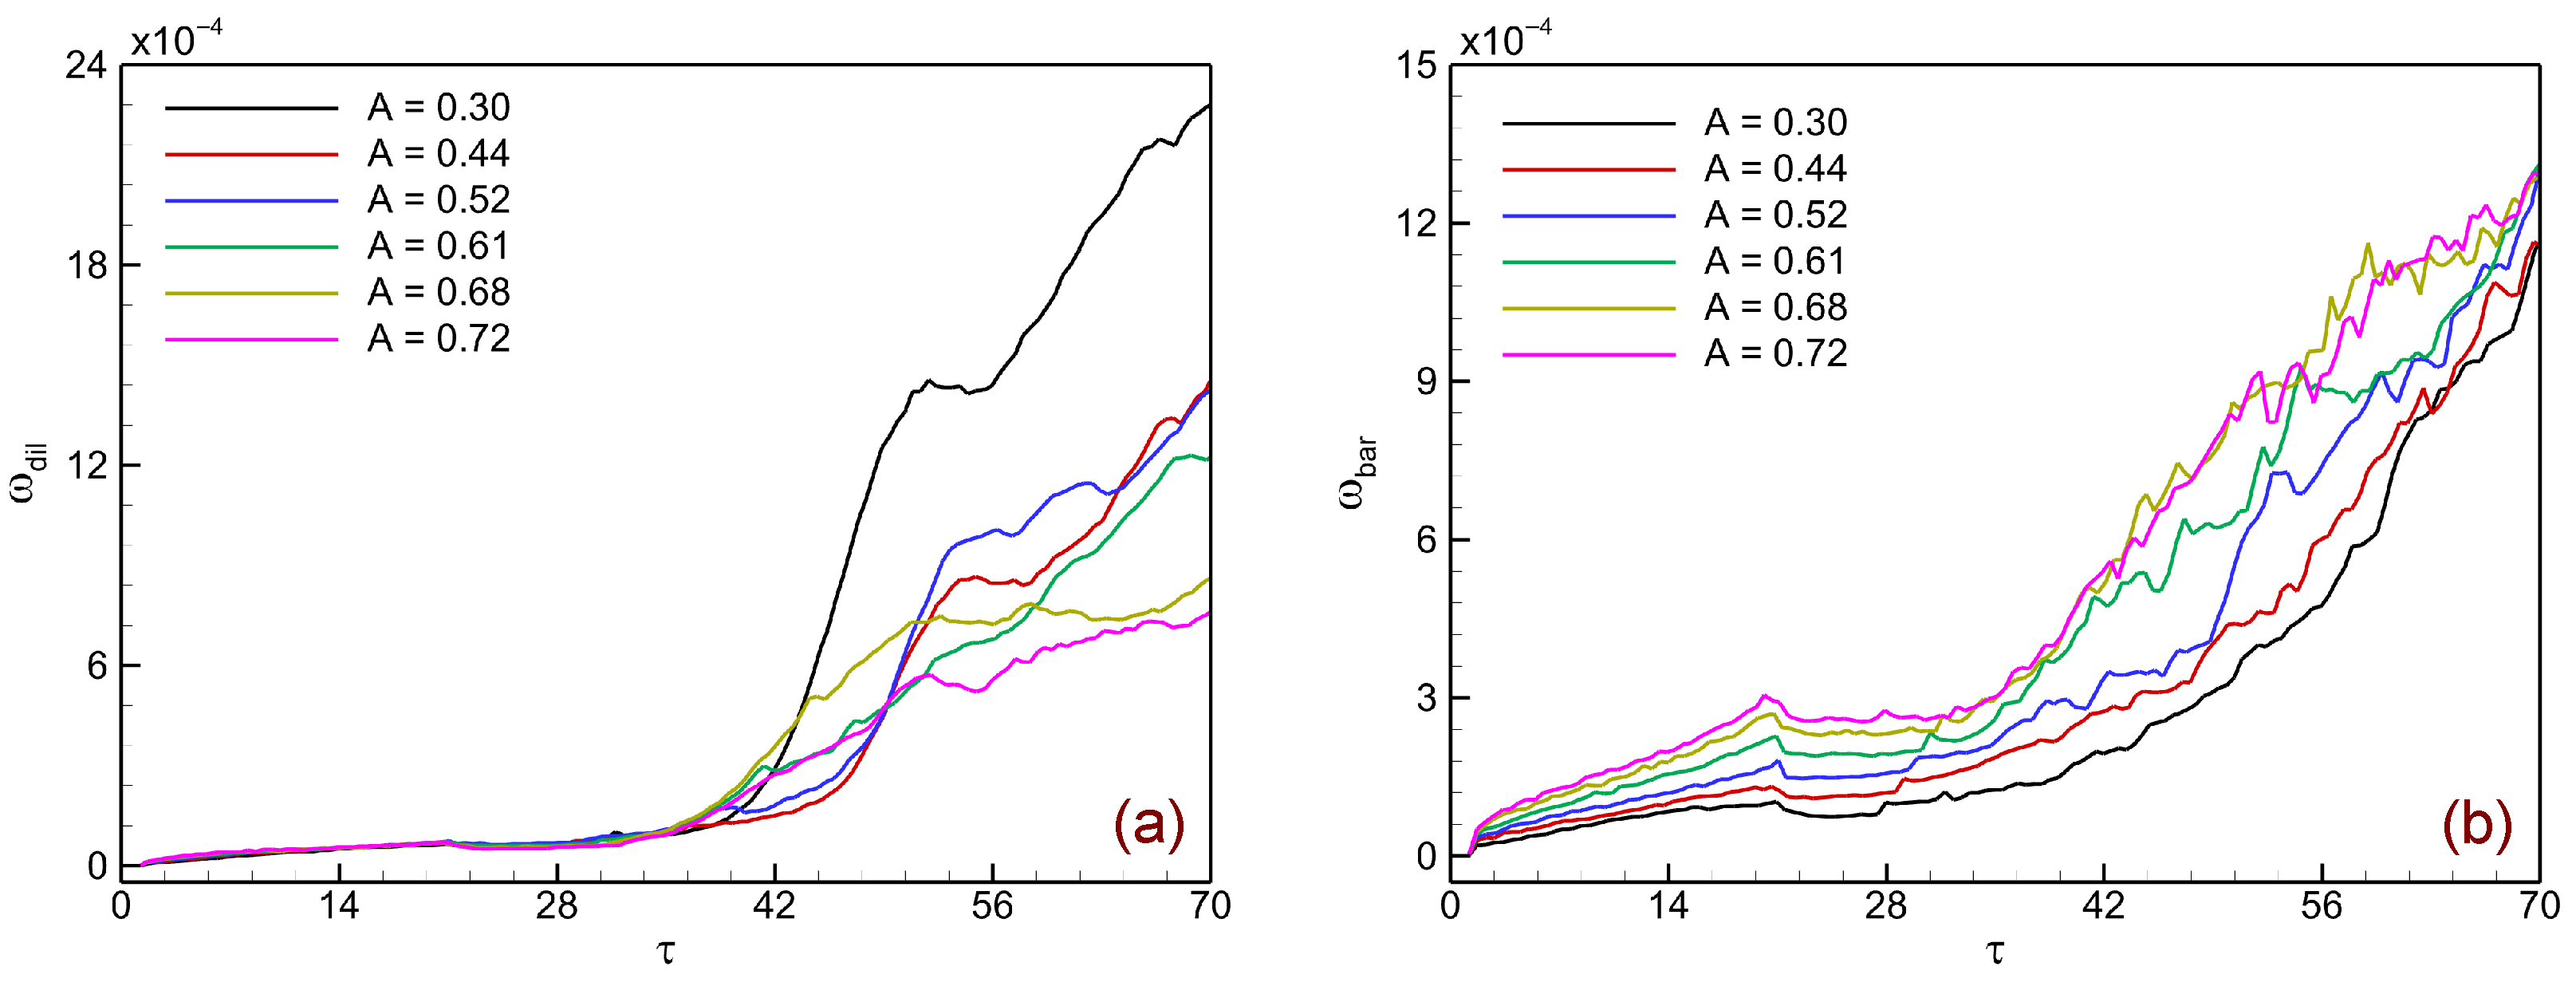
Figure 13 presents the temporal evolution of the spatially integrated contributions of dilatational and baroclinic vorticity in shock-driven single-mode stratified heavy fluid layers at different Atwood numbers. Figure 13a shows the dilatational vorticity ω d i l , which remains relatively small across all Atwood numbers. Its contribution grows slowly in the early stages ( τ < 30 ) and only becomes noticeable at later times ( τ > 40 ), primarily due to local compression and expansion effects caused by secondary shock interactions. Even at its peak, however, the dilatational contribution is at least an order of magnitude weaker than the baroclinic source, confirming its secondary role in driving interface dynamics. Figure 13b shows the baroclinic vorticity ω b a r o , which dominates the overall vorticity budget. Right after shock impact, ω b a r o grows sharply as a result of strong misalignment between the pressure and density gradients across the perturbed interface. Its growth continues as the transmitted and reflected shocks interact with the interface, reinforcing the vorticity field. The results also show a clear dependence on Atwood number: as A increases, the baroclinic contribution systematically intensifies, reflecting the enhanced density gradient and stronger shock–interface coupling. The comparison between Figure 13a,b highlight that baroclinic torque is the primary mechanism for vorticity generation in RMI, while dilatational effects act as a minor correction. Moreover, the monotonic increase of ω b a r o with A directly links stronger density contrast to greater instability growth, more vigorous roll-ups, and enhanced mixing.
To further quantify the strength of vortical structures generated during the instability, we examine the temporal evolution of the maximum and minimum vorticity within the computational domain. These measures provide a direct indication of the intensity of circulation deposited along the perturbed interface and the subsequent development of roll-ups and small-scale vortices. Mathematically, the extrema are defined as
ω max ( t ) = max x D ω ( x , t ) , ω min ( t ) = min x D ω ( x , t ) .
where ω ( x , t ) = ( × u ) ( x , t ) is the scalar vorticity field in two dimensions, and D denotes the computational domain. In the discrete form used for numerical simulations, these are computed at each time step as
ω max ( t n ) = max i , j ω i , j ( t n ) , ω min ( t n ) = min i , j ω i , j ( t n ) .
Tracking ω max ( t ) and ω min ( t ) allows us to assess the asymmetry between positive and negative vortical regions, and to evaluate how increasing the Atwood number amplifies baroclinic circulation and accelerates the transition to nonlinear dynamics.
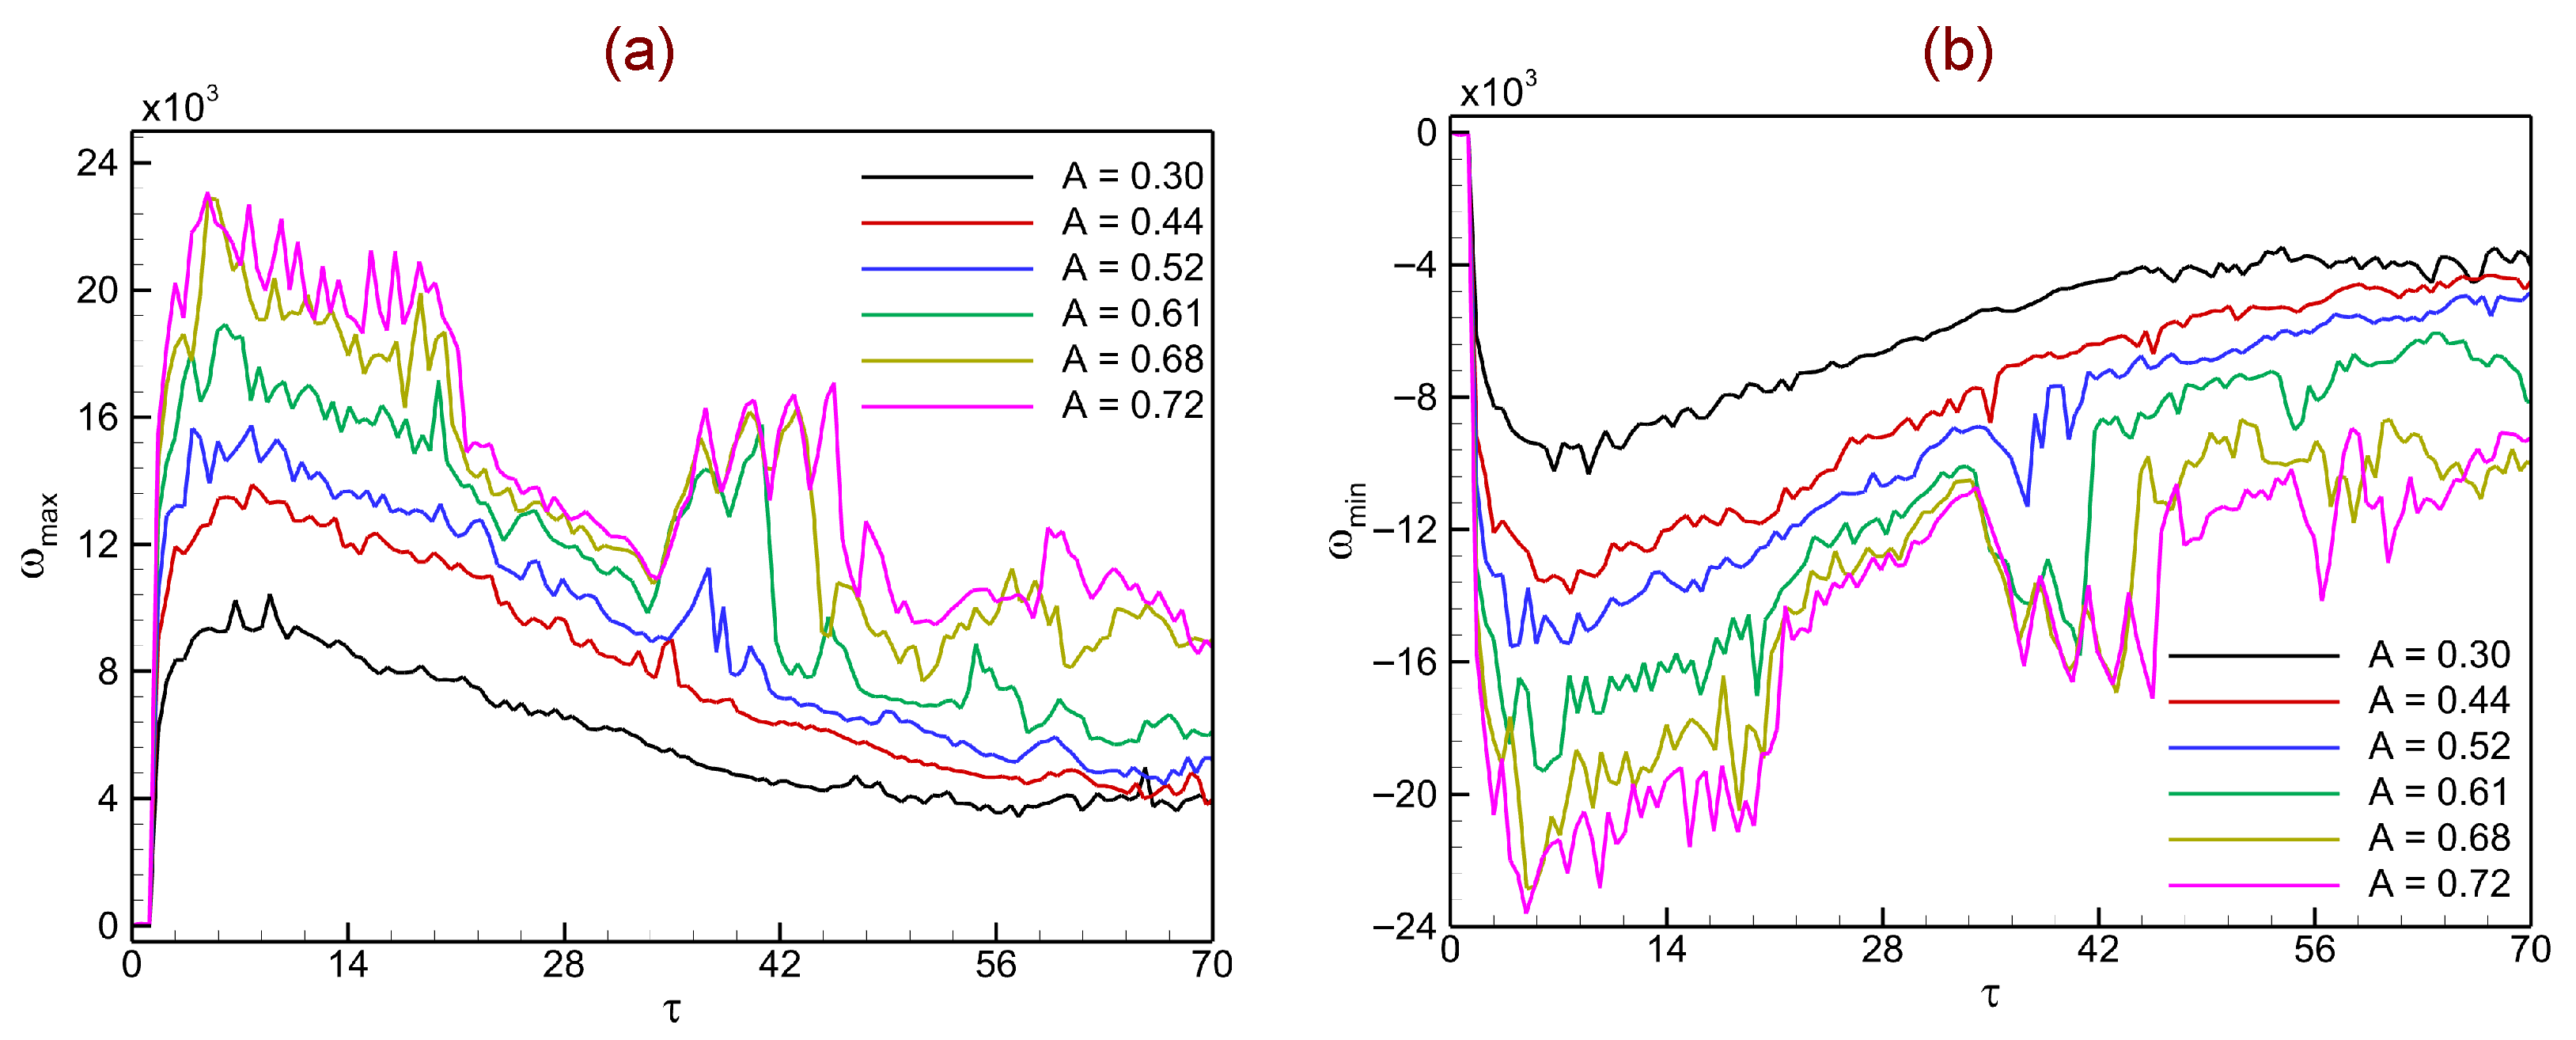
Figure 14 shows the temporal evolution of the maximum vorticity ω max ( t ) and minimum vorticity ω min ( t ) in shock-driven single-mode stratified heavy fluid layers for a range of Atwood numbers. These diagnostics quantify the extrema of circulation deposited along the interface and highlight how positive and negative vortical regions evolve during RMI. Figure 14a illustrates ω max ( t ) . Right after the shock impact ( τ < 10 ), ω max rises sharply due to strong baroclinic vorticity deposition at the interface. For higher Atwood numbers ( A = 0.61 0.72 ), this peak is considerably larger, reflecting the stronger density gradients that enhance baroclinic torque. Over time, ω max exhibits oscillations associated with secondary shock–interface interactions and vortex roll-ups. Although the peak values gradually decay due to redistribution of circulation and mixing, higher-A cases consistently maintain stronger positive vorticity levels compared with lower-A cases. Figure 14b presents ω min ( t ) , which captures the evolution of negative vorticity regions. Immediately after shock passage, ω min drops sharply, indicating the generation of strong counter-rotating vortices at the interface. Similar to ω max , the magnitude of ω min increases with the Atwood number, with the strongest negative vortices observed for A = 0.68 and A = 0.72 . As time progresses, ω min continues to fluctuate due to nonlinear vortex interactions, roll-up, and merging of small-scale structures. Together, both positive and negative vorticity extrema grow systematically with the Atwood number, confirming that higher A values intensify baroclinic circulation deposition and accelerate the onset of nonlinear roll-up. This asymmetry between ω max and ω min further reflects the directional nature of vortex formation during shock–interface interaction, with high-A cases promoting stronger mixing and more vigorous turbulent-like dynamics.
Circulation is a fundamental quantity for characterizing the strength and evolution of vortical structures in shock-driven flows. In the context of RMI, it directly measures the baroclinically generated vortices at the perturbed interface and provides insight into the balance between positive and negative rotational motions. The total circulation in the flow field is defined as the spatial integral of vorticity over the computational domain D:
Γ tot ( t ) = D ω d x d y .
For further analysis, the circulation can be decomposed into its positive and negative components, representing the contributions from counter-rotating vortical regions:
Γ pos ( t ) = D , ω > 0 ω d x d y , Γ neg ( t ) = D , ω < 0 ω d x d y .
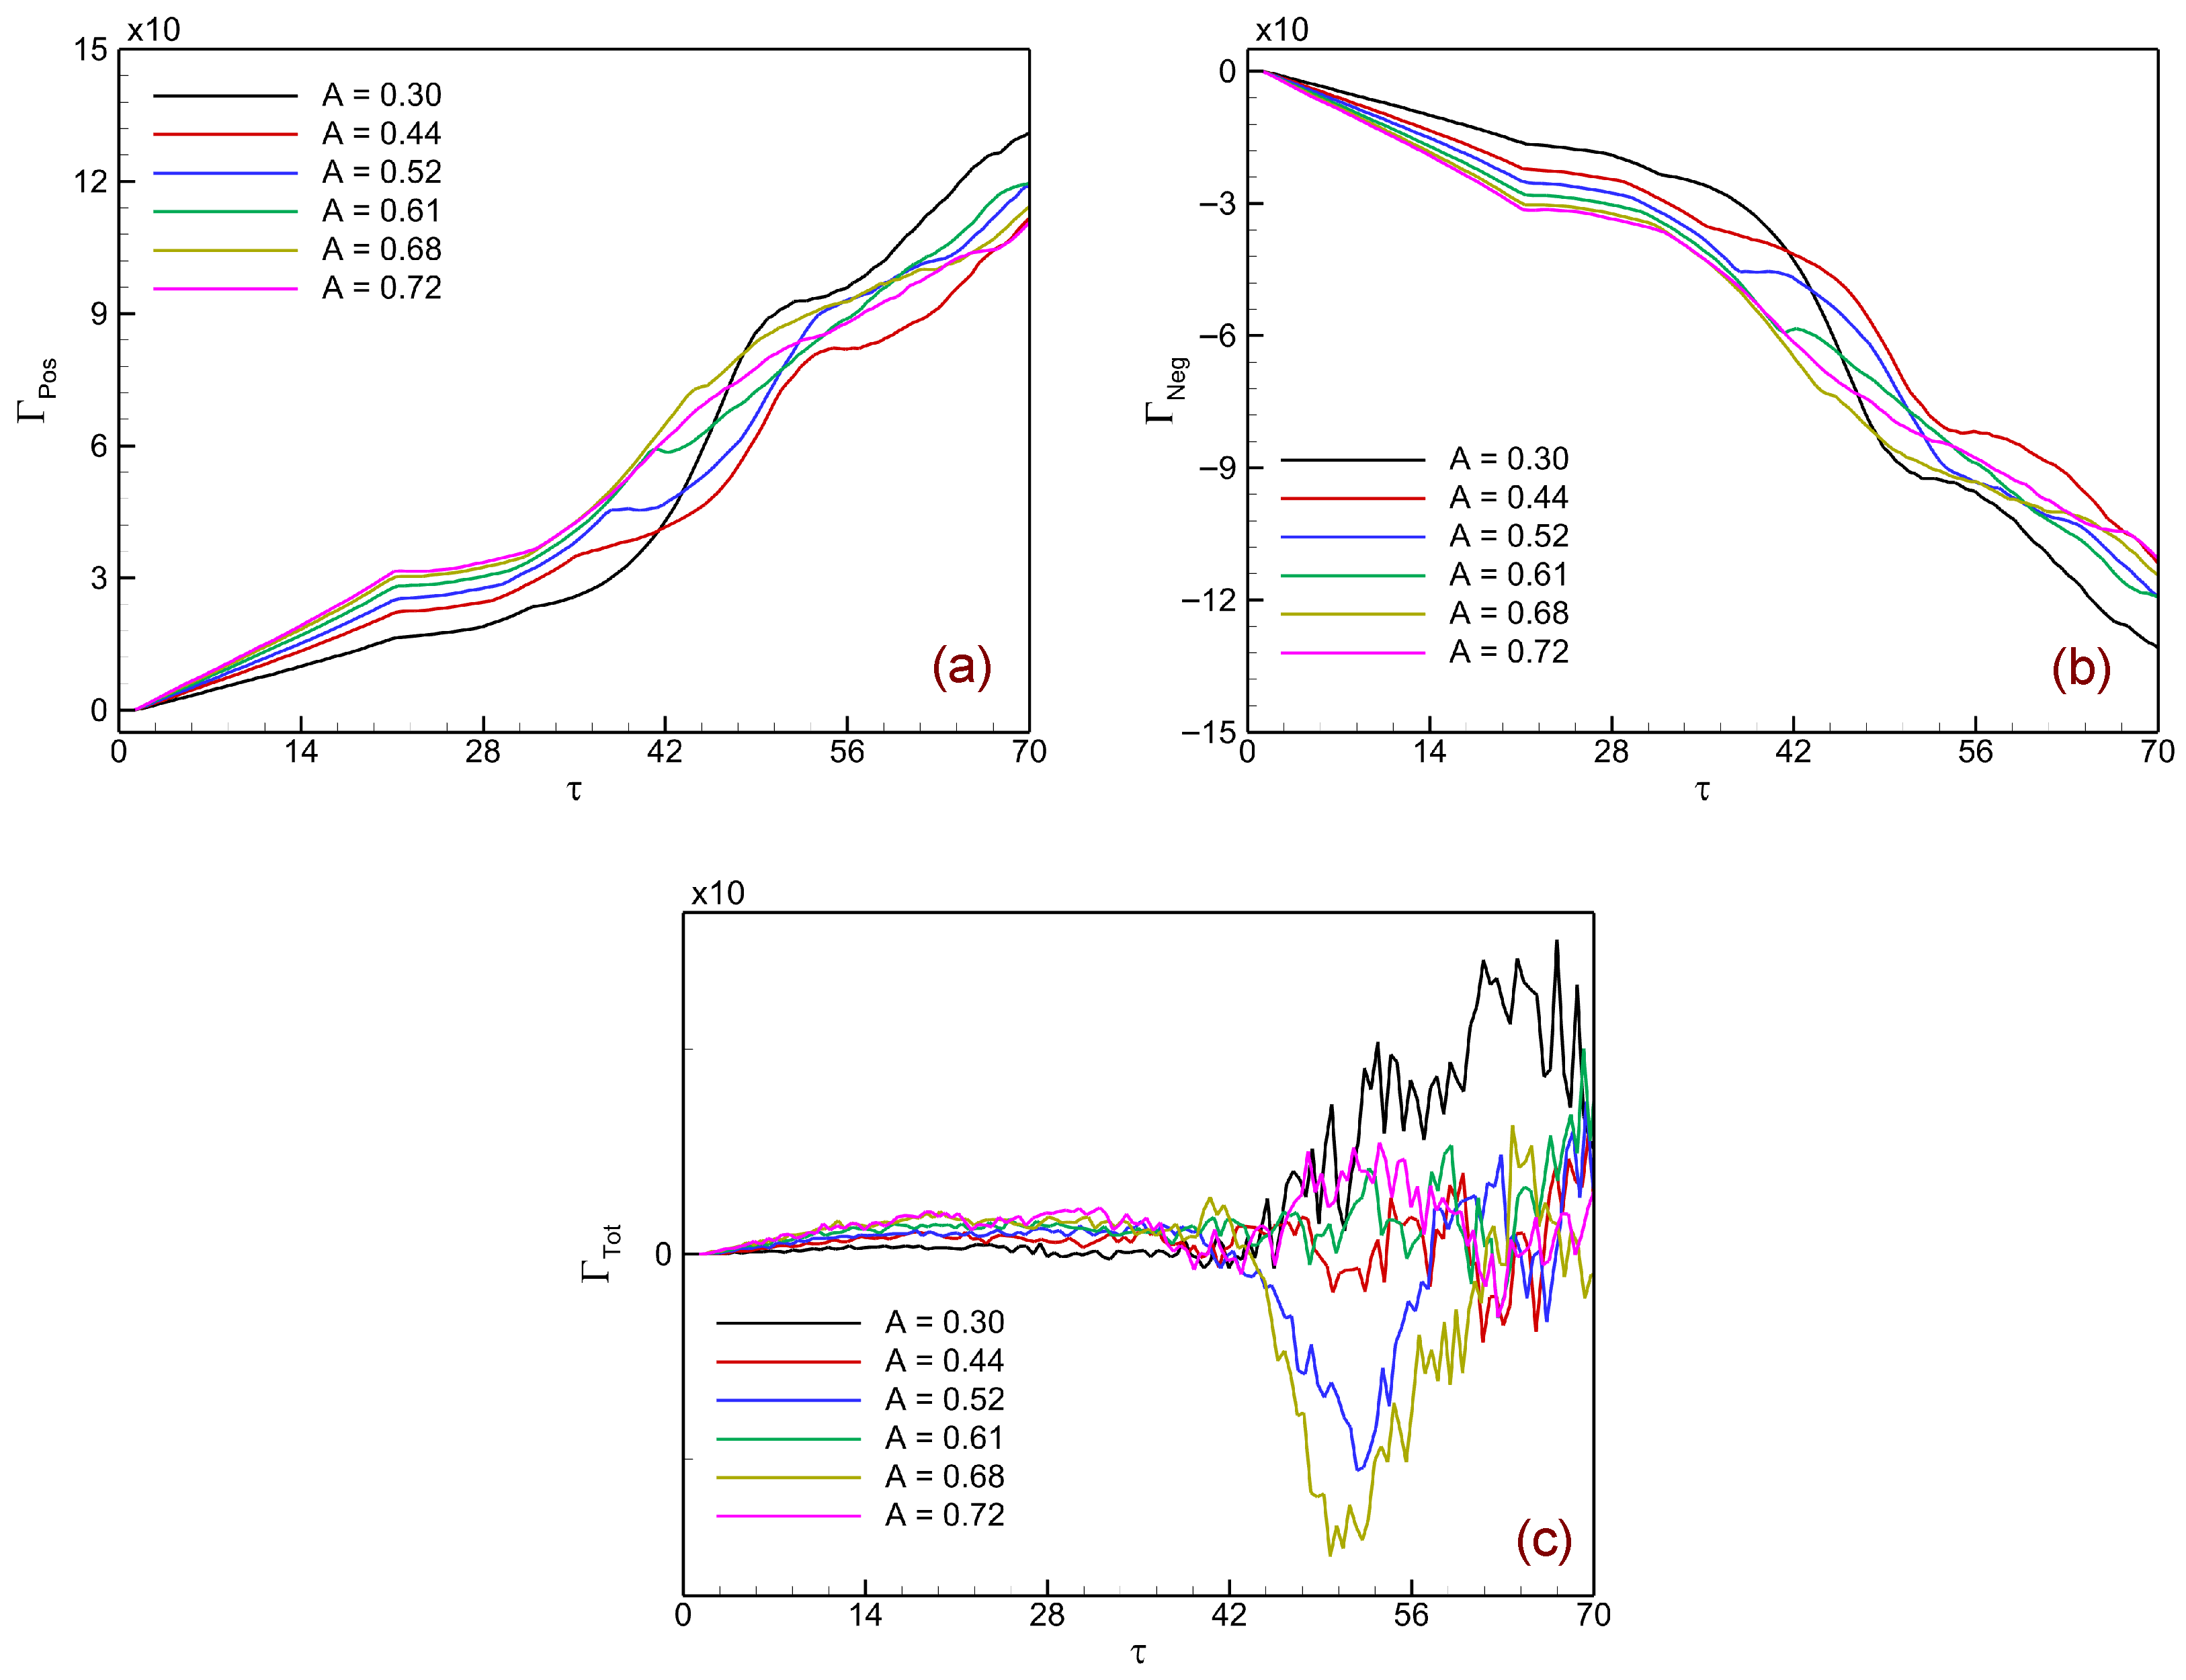
These diagnostics provide a quantitative measure of the circulation deposited along the perturbed interface through baroclinic torque. While Γ pos and Γ neg capture the evolution of positive and negative vortices generated at the interface, their sum yields the net circulation Γ ( t ) .
Figure 15 illustrates the influence of the Atwood number on the temporal evolution of circulation in shock-driven single-mode stratified heavy fluid layers, separated into positive circulation Γ pos , negative circulation Γ neg , and the net total circulation Γ tot . Figure 15a shows the growth of Γ pos ( t ) , which represents the contribution from regions of positive vorticity. After shock impact, Γ pos increases steadily due to baroclinic deposition of circulation at the interface. Higher Atwood numbers ( A = 0.61 0.72 ) exhibit systematically larger values, reflecting stronger density gradients and enhanced baroclinic torque. Figure 15b presents Γ neg ( t ) , which corresponds to the negative vorticity regions. Similar to the positive component, the magnitude of Γ neg grows with the Atwood number, reaching increasingly negative values as A increases. This indicates stronger counter-rotating vortices generated along the interface at higher density contrasts. Figure 15c shows the net total circulation Γ tot ( t ) . At early times, the positive and negative contributions nearly balance, keeping Γ tot close to zero. However, as the instability progresses into the nonlinear stage, asymmetry between the positive and negative vortical regions emerges, leading to fluctuations in Γ tot . These deviations are more pronounced at higher Atwood numbers, where stronger secondary instabilities and vortex roll-ups introduce localized imbalance in circulation deposition.

4.4. Enstrophy and Kinetic Energy Dynamics

Enstrophy and kinetic energy are fundamental diagnostics for characterizing the evolution of shock-driven instabilities. While enstrophy quantifies the amplification of vortical structures generated through baroclinic torque, kinetic energy reflects the redistribution of bulk flow energy into interface deformation and small-scale motions.
For a two-dimensional flow, enstrophy is obtained by integrating the squared vorticity over the computational domain D
Ω ( t ) = D ω 2 ( x , y , t ) d x d y ,
which serves as a measure of the overall strength of vortical activity in the flow field.
The total kinetic energy in the domain is defined as
E k ( t ) = D 1 2 ρ ( x , y , t ) u 2 ( x , y , t ) + v 2 ( x , y , t ) d x d y ,
providing a measure of the bulk flow energy and its transfer into smaller-scale structures during the nonlinear RMI development.
Figure 16 illustrates the temporal evolution of enstrophy Ω ( t ) and kinetic energy E k ( t ) in shock-driven single-mode stratified heavy fluid layers for different Atwood numbers. These diagnostics provide insight into the development of vortical structures and the redistribution of energy during RMI. In Figure 16a, enstrophy Ω exhibits a sharp rise immediately after shock impact, driven by intense baroclinic vorticity deposition along the perturbed interface. The subsequent growth reflects the amplification of vortical structures, roll-up of shear layers, and the emergence of secondary instabilities. At lower Atwood numbers ( A = 0.30 and 0.44 ), enstrophy growth is relatively weak and saturates at modest levels, indicating smoother interface evolution with limited nonlinear roll-up. By contrast, at higher Atwood numbers ( A = 0.61 0.72 ), Ω exhibits significantly larger values, reflecting the stronger density gradients that intensify vorticity generation and promote complex small-scale vortical interactions. The oscillations observed in the time histories correspond to secondary shock–interface interactions and vortex pairing events, which periodically enhance and redistribute enstrophy. In Figure 16b, E k grows steadily in the early stages ( τ < 40 ) across all Atwood numbers as the shock deposits momentum into the fluid layer and drives bulk motion. After this initial growth, E k tends to plateau, indicating a transfer of energy from large-scale interface deformation into smaller-scale vortical and mixing structures. The results reveal only a weak dependence of kinetic energy on the Atwood number compared to enstrophy. While higher-A cases reach slightly larger peak values of E k , the overall similarity of the curves suggests that the primary role of the Atwood number is not in setting the global energy level, but rather in controlling how that energy is redistributed into vortical motions, as captured by the enstrophy dynamics.

4.5. Interface Characteristics and Growth

This section presents the evolution of interface characteristics and growth in shock-driven single-mode stratified heavy fluid layers. The analysis focuses on interface trajectories, normalized length, and perturbation amplitude to assess how baroclinic vorticity deposition and shock interactions influence deformation and instability growth. These diagnostics provide direct measures of the Atwood number effects, capturing both large-scale displacement of the interface and the emergence of small-scale structures that enhance mixing.
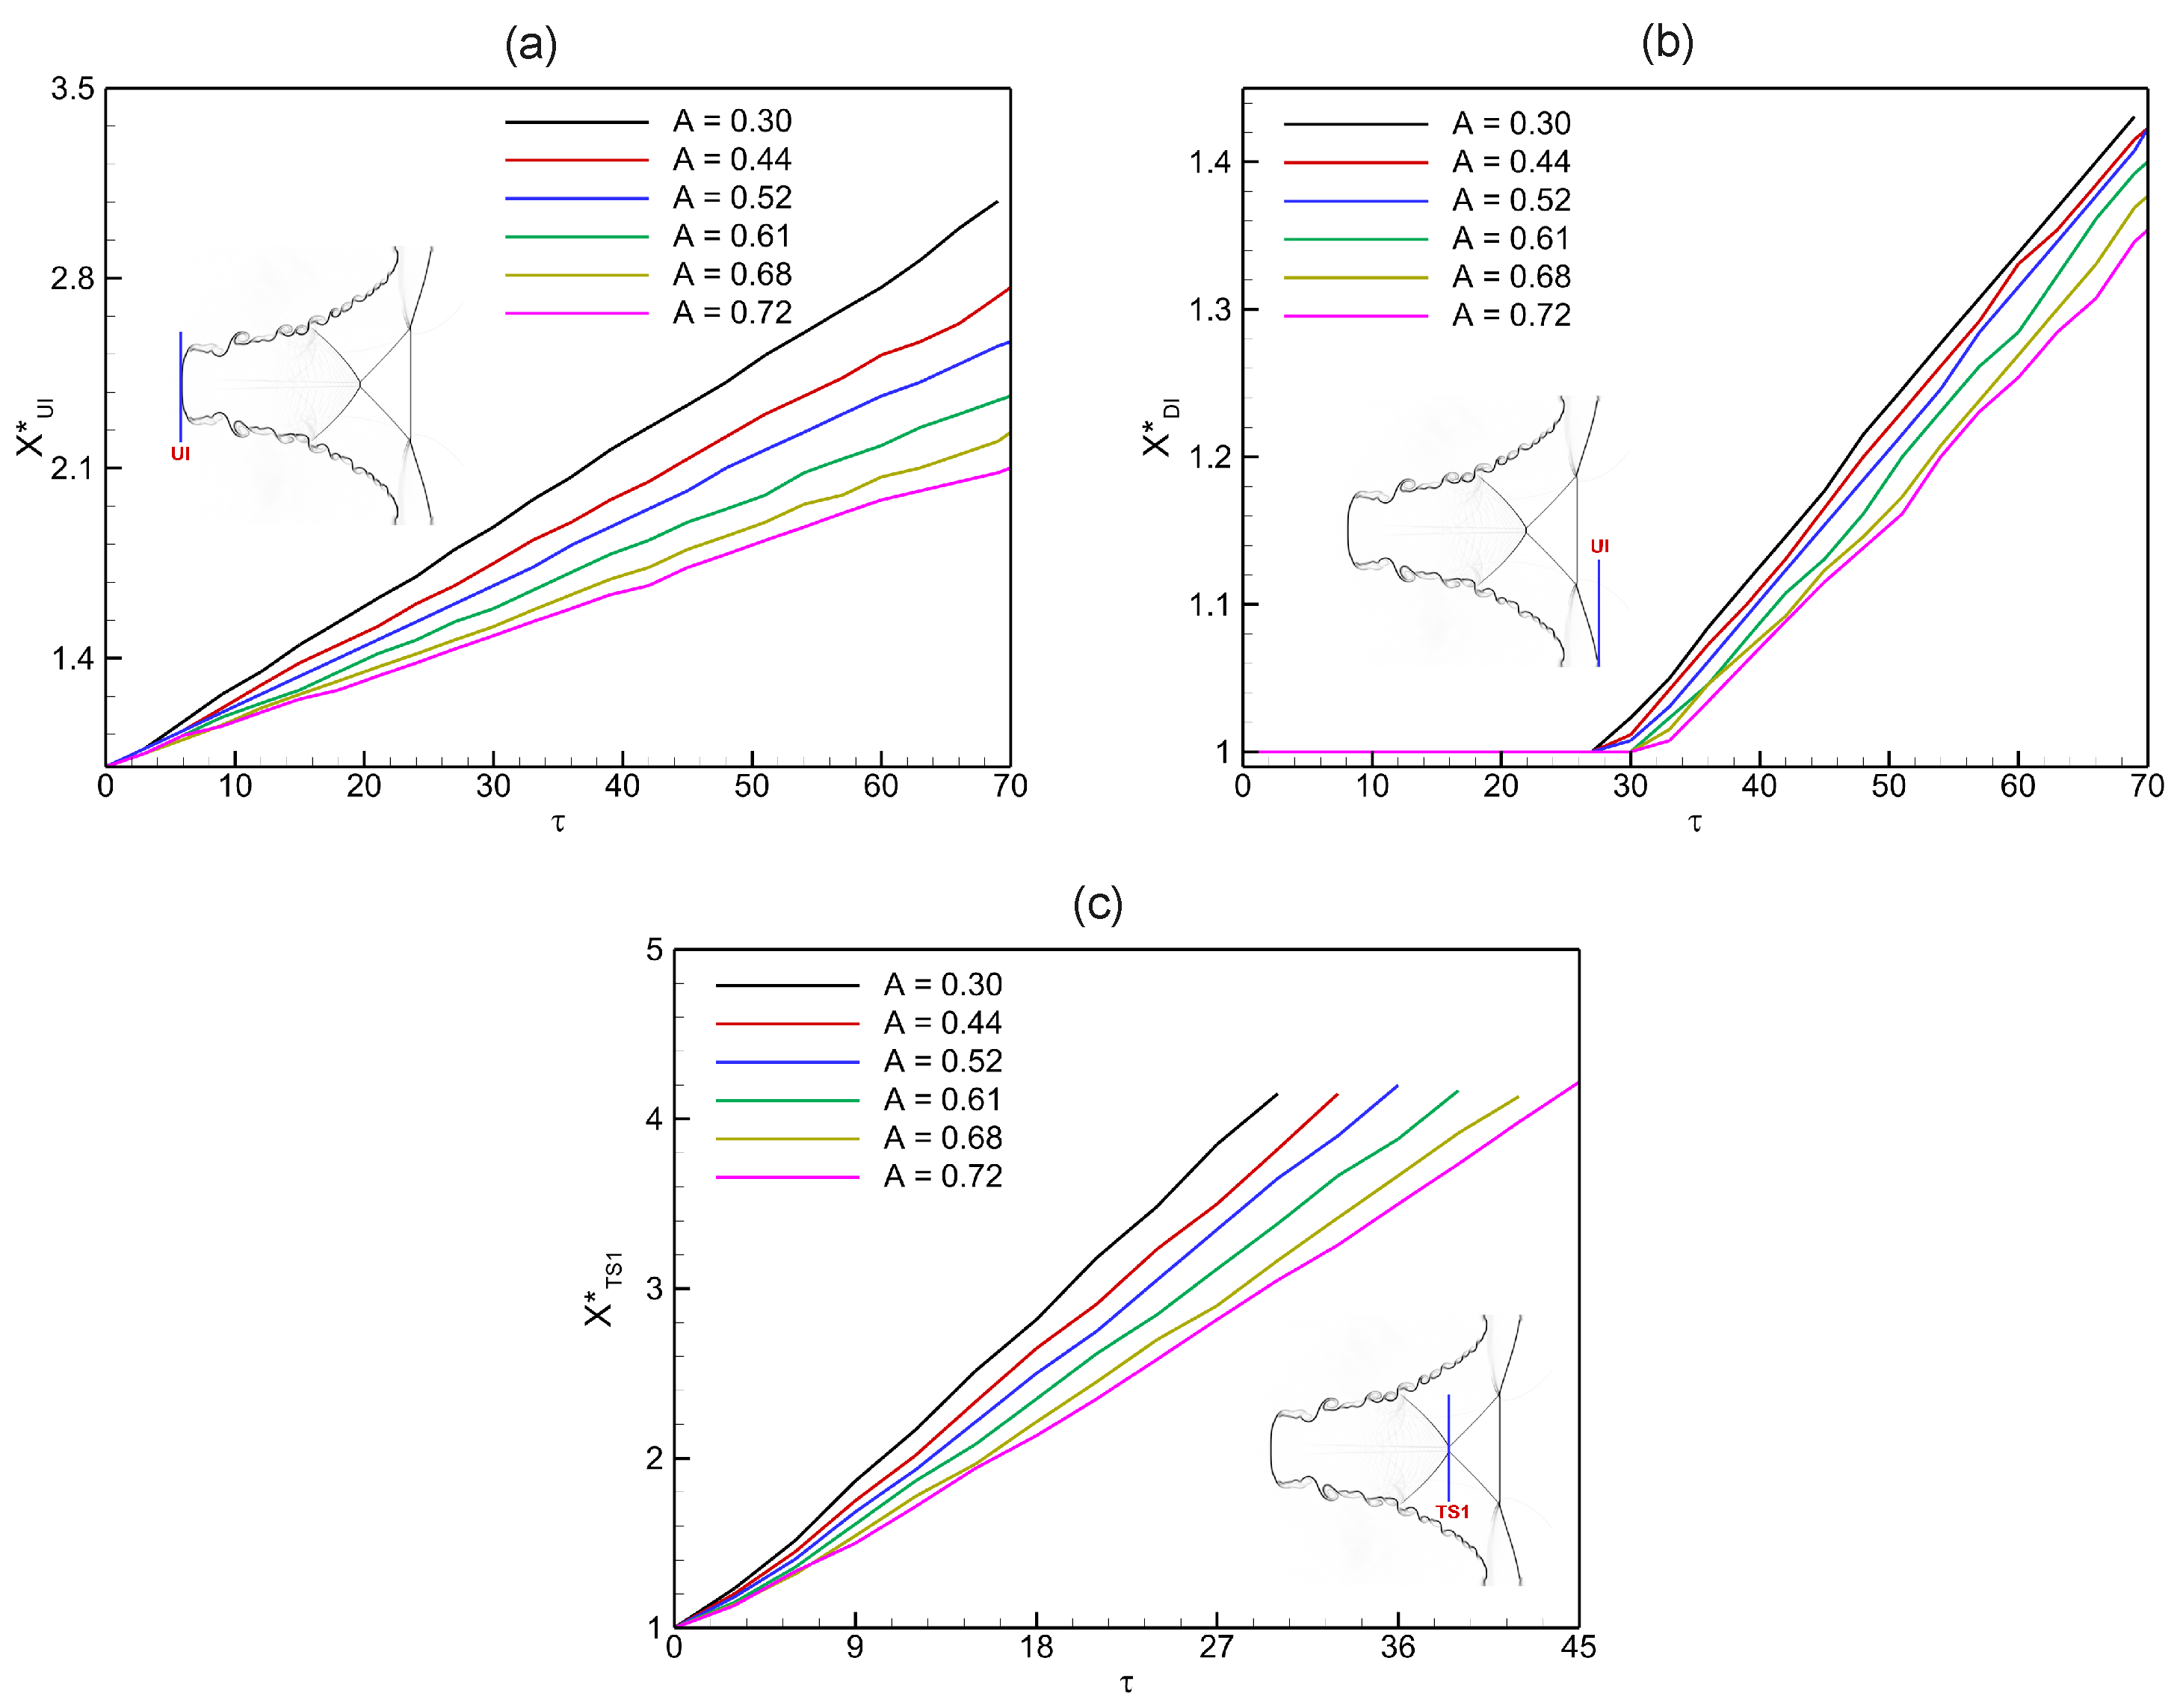
Figure 17 shows the influence of the Atwood number on the temporal evolution of interface trajectories in shock-driven single-mode stratified heavy fluid layers. Three normalized quantities are examined: the upstream interface position ( X U I * ), the downstream interface position ( X D I * ), and the transmitted shock position ( X T S 1 * ). Figure 17a depicts the normalized upstream interface trajectory X U I * . Following the incident shock impact, the upstream interface moves steadily in the positive x-direction due to the momentum imparted by the shock. The growth rate increases systematically with Atwood number, as larger density contrasts enhance baroclinic circulation deposition and accelerate interface displacement. High-A cases ( A = 0.68 , A = 0.72 ) show noticeably faster progression compared to low-A cases. Figure 17b shows the normalized downstream interface trajectory X D I * . The displacement of the downstream interface occurs at a slower rate than that of the upstream side, reflecting asymmetry in interface response due to shock refraction and density contrast. With increasing Atwood number, the downstream motion becomes more pronounced, consistent with the stronger interface deformation and amplified instability growth. Figure 17c illustrates the normalized trajectory of the transmitted shock X T S 1 * . The transmitted shock penetrates deeper into the heavy fluid layer as time progresses, but its propagation speed decreases with increasing Atwood number. This behavior arises from the larger density ratio across the interface, which increases the impedance mismatch and slows the transmitted shock.
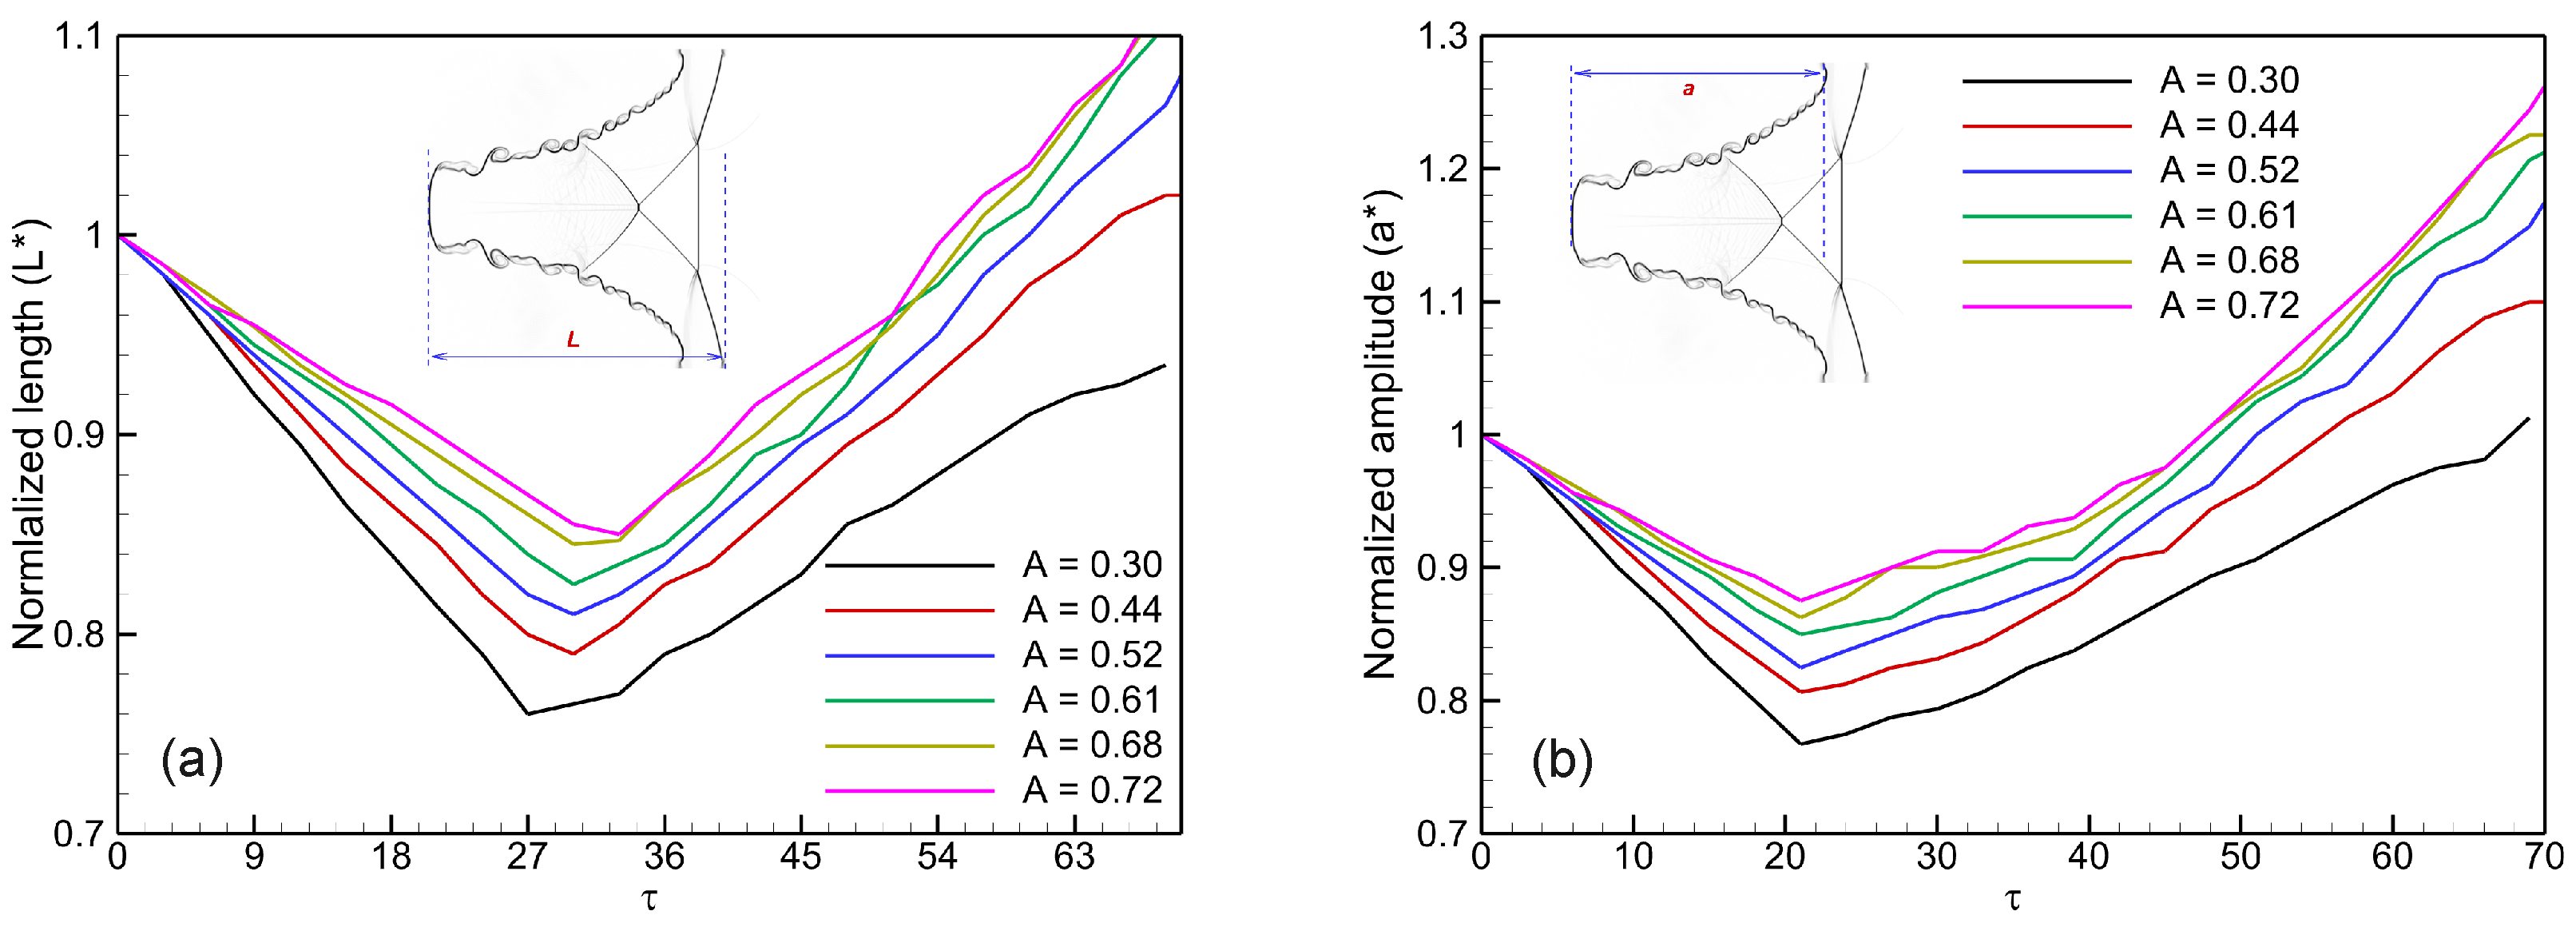
Figure 18 illustrates the effect of the Atwood number on the temporal evolution of interface morphology, quantified in terms of normalized interface length ( L * ) and normalized perturbation amplitude ( a * ). These diagnostics provide complementary measures of interface deformation and growth during the RMI. Figure 18a shows the evolution of the normalized interface length L * . Immediately after shock passage, L * decreases, reflecting the initial compression of the interface by the incident shock. As time progresses, L * begins to increase due to baroclinic vorticity deposition and the roll-up of shear layers, which enhance interface wrinkling and extend the interface surface area. The rate of increase becomes stronger with higher Atwood numbers ( A = 0.61 0.72 ), demonstrating that stronger density contrasts promote more vigorous deformation and generation of small-scale structures. In contrast, lower-A cases show a more modest increase in L * , consistent with smoother interface evolution. Figure 18b presents the evolution of the normalized perturbation amplitude a * . Similar to L * , the amplitude initially decreases due to shock compression, before recovering and growing rapidly during the nonlinear phase of instability development. The recovery and subsequent growth of a * are strongly dependent on Atwood number: higher-A cases show faster amplitude growth and reach larger values, while lower-A cases remain subdued. This behavior reflects the enhanced baroclinic torque at higher density contrasts, which accelerates the transition from linear to nonlinear interface evolution.

5. Concluding Remarks

This study presented a detailed numerical investigation of Richtmyer–Meshkov instability (RMI) in shock-driven single-mode stratified heavy fluid layers, with emphasis on the influence of the Atwood number on interface dynamics, vorticity generation, and mixing. High-order modal discontinuous Galerkin simulations were performed across a range of Atwood numbers ( A = 0.30 0.72 ), providing a systematic assessment of flow features and instability development.
The results demonstrate that increasing the Atwood number strongly enhances baroclinic vorticity deposition at the perturbed interface, thereby accelerating interface growth and the transition to nonlinear dynamics. At lower A, interface evolution remains smooth and coherent, with delayed onset of roll-ups and secondary instabilities. By contrast, higher A cases exhibit vigorous interface deformation, rapid amplitude growth, and the emergence of Kelvin–Helmholtz vortices and small-scale structures, which promote mixing. Diagnostic measures including vorticity extrema, circulation, enstrophy, kinetic energy, and interface-based metrics (length and amplitude) consistently highlighted the sensitivity of instability dynamics to the Atwood number. While kinetic energy displayed relatively weak dependence on A, enstrophy, circulation, and interface morphology showed systematic amplification with increasing density contrast.
Future work will extend this framework to multi-mode perturbations, three-dimensional configurations, and variable Mach number effects, in order to further elucidate the interplay between shock strength, density contrast, and interface complexity.

Author Contributions

Conceptualization, S.S.; software, S.S.; validation, S.S.; formal analysis, S.S.A. and S.S.; investigation, S.S.A., S.S. and N.A.A.; writing—original draft, S.S.A., S.S. and N.A.A.; visualization, S.S.A. and S.S.; funding acquisition, S.S.A. All authors have read and agreed to the published version of the manuscript.

Funding

This work was funded by the Deanship of Graduate Studies and Scientific Research at Jouf University under Grant No. (DGSSR-2025-FC-01034).

Data Availability Statement

The data presented in this study are available on request from the corresponding author because our numerical results were obtained using an in-house high-order numerical solver, which is still under active development and not yet publicly released.

Conflicts of Interest

The authors declare no conflicts of interest.

References

  1. Zhou, Y. Hydrodynamic Instabilities and Turbulence: Rayleigh–Taylor, Richtmyer–Meshkov, and Kelvin–Helmholtz Mixing; Cambridge University Press: Cambridge, UK, 2024. [Google Scholar]
  2. Zhou, Y. Rayleigh–Taylor and Richtmyer–Meshkov instability induced flow, turbulence, and mixing-I. Phys. Rep. 2017, 720, 1–136. [Google Scholar]
  3. Zhou, Y. Rayleigh–Taylor and Richtmyer–Meshkov instability induced flow, turbulence, and mixing-II. Phys. Rep. 2017, 723, 1–160. [Google Scholar] [CrossRef]
  4. Lindl, J.D.; McCrory, R.L.; Campbell, E.M. Progress toward ignition and burn propagation in inertial confinement fusion. Phys. Today 1992, 45, 32–40. [Google Scholar] [CrossRef]
  5. Lindl, J.; Landen, O.; Edwards, J.; Moses, E.; Team, N. Review of the national ignition campaign 2009–2012. Phys. Plasmas 2014, 21, 020501. [Google Scholar] [CrossRef]
  6. Arnett, W.D.; Bahcall, J.N.; Kirshner, R.P.; Woosley, S.E. Supernova 1987A. Ann. Rev. Astron. Astrophys. 1989, 2, 629–700. [Google Scholar] [CrossRef]
  7. Kuranz, C.C.; Park, H.S.; Huntington, C.M.; Miles, A.R.; Remington, B.A.; Plewa, T.; Trantham, M.R.; Robey, H.F.; Shvarts, D.; Shimony, A.; et al. How high energy fluxes may affect Rayleigh–Taylor instability growth in young supernova remnants. Nat. Commun. 2018, 9, 1564. [Google Scholar] [CrossRef]
  8. Yang, J.; Kubota, T.; Zukoski, E.E. Applications of shock-induced mixing to supersonic combustion. AIAA J. 1993, 31, 854–862. [Google Scholar] [CrossRef]
  9. Zhou, Y.; Williams, R.J.; Ramaprabhu, P.; Groom, M.; Thornber, B.; Hillier, A.; Mostert, W.; Rollin, B.; Balachandar, S.; Powell, P.D.; et al. Rayleigh–Taylor and Richtmyer-Meshkov instabilities: A journey through scales. Phys. D Nonlinear Phenom. 2021, 423, 132838. [Google Scholar] [CrossRef]
  10. Richtmyer, R.D. Taylor instability in shock acceleration of compressible fluids. Commun. Pure. Appl. Math. 1960, 13, 297–319. [Google Scholar] [CrossRef]
  11. Meshkov, E.E. Instability of the interface of two gases accelerated by a shock wave. Fluid Dyn. 1969, 4, 101. [Google Scholar] [CrossRef]
  12. Rayleigh, L. Investigation of the character of the equilibrium of an incompressible heavy fluid of variable density. Proc. Lond. Math. Soc. 1882, 14, 170–177. [Google Scholar] [CrossRef]
  13. Taylor, G.I. The instability of liquid surfaces when accelerated in a direction perpendicular to their planes. I. Proc. R. Soc. Lond. A 1950, 201, 192–196. [Google Scholar]
  14. Balasubramanian, S.; Orlicz, G.C.; Prestridge, K.P.; Balakuma, B.J. Experimental study of initial condition dependence on Richtmyer-Meshkov instability in the presence of reshock. Phys. Fluids 2012, 24, 034103. [Google Scholar] [CrossRef]
  15. Singh, S. Role of Atwood number on flow morphology of a planar shock-accelerated square bubble: A numerical study. Phys. Fluids 2020, 32, 126112. [Google Scholar] [CrossRef]
  16. Bansal, S.; Kumar, A.; Saini, A.; Negi, A.S.; Singh, S. Exploring the Atwood number impact on shock-driven hydrodynamic instability at pentagonal interface using discontinuous Galerkin simulations. Phys. D Nonlinear Phenom. 2024, 467, 134276. [Google Scholar]
  17. Sadot, O.; Erez, L.; Alon, U.; Oron, D.; Levin, L.A.; Erez, G.; Ben-Dor, G.; Shvarts, D. Study of nonlinear evolution of single-mode and two-bubble interaction under Richtmyer-Meshkov instability. Phys. Rev. Lett. 1998, 80, 1654. [Google Scholar] [CrossRef]
  18. Vandenboomgaerde, M.; Souffland, D.; Mariani, C.; Biamino, L.; Jourdan, G.; Houas, L. An experimental and numerical investigation of the dependency on the initial conditions of the Richtmyer-Meshkov instability. Phys. Fluids 2014, 26, 024109. [Google Scholar] [CrossRef]
  19. Nishihara, K.; Wouchuk, J.G.; Matsuoka, C.; Ishizaki, R.; Zhakhovsky, V.V. Richtmyer–Meshkov instability: Theory of linear and nonlinear evolution. Philos. Transact. A Math. Phys. Eng. Sci. 2010, 368, 1769–1807. [Google Scholar] [CrossRef]
  20. Fraley, G. Rayleigh–Taylor stability for a normal shock wave–density discontinuity interaction. Phys. Fluids 1986, 29, 376–386. [Google Scholar] [CrossRef]
  21. Mikaelian, K.O. Growth rate of the Richtmyer-Meshkov instability at shocked interfaces. Phys. Rev. Lett. 1993, 71, 2903–2906. [Google Scholar] [CrossRef]
  22. Mikaelian, K.O. Richtmyer–Meshkov instability of arbitrary shapes. Phys. Fluids 2005, 17, 034101. [Google Scholar] [CrossRef]
  23. Luo, T.; Wang, J. Effects of Atwood number and stratification parameter on compressible multi-mode Rayleigh–Taylor instability. Phys. Fluids 2021, 33, 115111. [Google Scholar] [CrossRef]
  24. Thornber, B.; Drikakis, D.; Youngs, D.; Williams, R. Growth of a Richtmyer-Meshkov turbulent layer after reshock. Phys. Fluids 2011, 23, 095107. [Google Scholar] [CrossRef]
  25. Tritschler, V.K.; Olson, B.J.; Lele, S.K.; Hickel, S.; Hu, X.Y.; Adams, N.A. On the Richtmyer–Meshkov instability evolving from a deterministic multimode planar interface. J. Fluid Mech. 2014, 755, 429–462. [Google Scholar] [CrossRef]
  26. Thornber, B.; Drikakis, D.; Youngs, D.L.; Williams, R.J.R. The influence of initial conditions on turbulent mixing due to Richtmyer–Meshkov instability. J. Fluid Mech. 2010, 654, 99–139. [Google Scholar] [CrossRef]
  27. Lombardini, M.; Pullin, D.I.; Meiron, D.I. Transition to turbulence in shock-driven mixing: A Mach number study. J. Fluid Mech. 2012, 690, 203–226. [Google Scholar] [CrossRef]
  28. Mohaghar, M.; Carter, J.; Pathikonda, G.; Ranjan, D. The transition to turbulence in shock-driven mixing: Effects of Mach number and initial conditions. J. Fluid Mech. 2016, 871, 595–635. [Google Scholar] [CrossRef]
  29. Probyn, M.G.; Williams, R.J.R.; Thornber, B.; Drikakis, D.; Youngs, D.L. 2D single-mode Richtmyer–Meshkov instability. Phys. D Nonlinear Phenom. 2021, 418, 132827. [Google Scholar] [CrossRef]
  30. Mikaelian, K.O. Time evolution of density perturbations in accelerating stratified fluids. Phys. Rev. A 1983, 28, 1637–1646. [Google Scholar] [CrossRef]
  31. Jacobs, J.W.; Jenkins, D.G.; Klein, D.L.; Benjamin, R.F. Nonlinear growth of the shock-accelerated instability of a thin fluid layer. J. Fluid Mech. 1995, 295, 23–42. [Google Scholar] [CrossRef]
  32. Desjardins, T.R.; Stefano, C.A.D.; Day, T.; Schmidt, D.; Merritt, E.C.; Doss, F.W.; Flippo, K.A.; Cardenas, T.; DeVolder, B.; Donovan, P.; et al. A platform for thin-layer Richtmyer-Meshkov at OMEGA and the NIF. High Energy Density Phys. 2019, 33, 100705. [Google Scholar] [CrossRef]
  33. Ott, E. Nonlinear evolution of the Rayleigh–Taylor instability of a thin layer. Phys. Rev. Lett. 1972, 29, 1429. [Google Scholar] [CrossRef]
  34. Mikaelian, K.O. Richtmyer-Meshkov instabilities in stratified fluids. Phys. Rev. A 1985, 31, 410–419. [Google Scholar] [CrossRef]
  35. Mikaelian, K.O. Rayleigh-Taylor and Richtmyer-Meshkov instabilities in multilayer fluids with surface tension. Phys. Rev. A 1990, 42, 7211. [Google Scholar] [CrossRef]
  36. Mikaelian, K.O. Rayleigh–Taylor and Richtmyer–Meshkov instabilities in finite-thickness fluid layers. Phys. Fluids 1995, 7, 888–890. [Google Scholar] [CrossRef]
  37. Mikaelian, K.O. Numerical simulations of Richtmyer–Meshkov instabilities in finite-thickness fluid layers. Phys. Fluids 1996, 8, 1269–1292. [Google Scholar] [CrossRef]
  38. Jacobs, J.W.; Klein, D.L.; Jenkins, D.G.; Benjamin, R.F. Instability growth patterns of a shock-accelerated thin fluid layer. Phys. Rev. Lett. 1993, 70, 583–586. [Google Scholar] [CrossRef]
  39. Liu, W.; Li, X.; Yu, C.; Fu, Y.; Wang, P.; Wang, L.; Ye, W. Theoretical study on finite-thickness effect on harmonics in Richtmyer-Meshkov instability for arbitrary Atwood numbers. Phys. Plasmas 2018, 25, 122103. [Google Scholar] [CrossRef]
  40. Liang, Y.; Luo, X. On shock-induced heavy-fluid-layer evolution. J. Fluid Mech. 2021, 920, A131. [Google Scholar] [CrossRef]
  41. Liang, Y.; Luo, X. Review on hydrodynamic instabilities of a shocked gas layer. Sci. China Phys. Mech. Astron. 2023, 66, 104701. [Google Scholar] [CrossRef]
  42. Li, L.; Jin, T.; Zou, L.; Luo, K.; Fan, J. Numerical study of Richtmyer-Meshkov instability in finite thickness fluid layers with reshock. Phys. Rev. E 2024, 109, 055105. [Google Scholar] [CrossRef]
  43. Guo, X.; Cong, Z.; Si, T.; Luo, X. On Richtmyer–Meshkov finger collisions in a light fluid layer under reshock conditions. J. Fluid Mech. 2024, 1000, A87. [Google Scholar] [CrossRef]
  44. Singh, S. Numerical Simulations of Shock-driven Heavy Fluid Layer. J. Graph. Era Univ. 2025, 13, 75–90. [Google Scholar] [CrossRef]
  45. Msmali, A.H.; Singh, S.; Meetei, M.Z. Single-Mode Richtmyer–Meshkov Instability in Light Fluid Layer: Insights from Numerical Simulations. Axioms 2025, 14, 473. [Google Scholar]
  46. Kundu, A.; De, S. High resolution numerical simulation of a shock-accelerated refrigerant-22 bubble. Comput. Fluids 2019, 193, 104289. [Google Scholar] [CrossRef]
  47. Marquina, A.; Mulet, P. A flux-split algorithm applied to conservative models for multicomponent compressible flows. J. Comput. Phys. 2003, 185, 120–138. [Google Scholar] [CrossRef]
  48. Singh, S. Investigation of aspect ratio effects on flow characteristics and vorticity generation in shock-induced rectangular bubble. Eur. J.-Mech.-B/Fluids 2023, 101, 131–148. [Google Scholar]
  49. Alsaeed, S.S.; Singh, S. Modal Discontinuous Galerkin Simulations of Richtmyer–Meshkov Instability at Backward-Triangular Bubbles: Insights and Analysis. Mathematics 2024, 12, 2005. [Google Scholar]
  50. Johnsen, E.; Colonius, T. Implementation of WENO schemes in compressible multicomponent flow problems. J. Comput. Phys. 2006, 219, 715–732. [Google Scholar] [CrossRef]
  51. Cockburn, B.; Shu, C.-W. The Runge–Kutta discontinuous Galerkin method for conservation laws V: Multidimensional systems. J. Comput. Phys. 1998, 141, 199–224. [Google Scholar]
  52. Gottlieb, S.; Shu, C.-W.; Tadmor, E. Strong stability-preserving high-order time discretization methods. Siam Rev. 2001, 43, 89–112. [Google Scholar] [CrossRef]
  53. Krivodonova, L.; Xin, J.; Remacle, J.F.; Chevaugeon, N.; Flaherty, J.E. Shock detection and limiting with discontinuous Galerkin methods for hyperbolic conservation laws. Appl. Numer. Math. 2004, 48, 323–338. [Google Scholar] [CrossRef]
  54. Luo, X.; Dong, P.; Si, T.; Zhai, Z. The Richtmyer–Meshkov instability of a ‘V’shaped air/SF6 interface. J. Fluid Mech. 2016, 802, 186–202. [Google Scholar] [CrossRef]
  55. Haas, J.F.; Sturtevant, B. Interaction of weak shock waves with cylindrical and spherical gas inhomogeneities. J. Fluid Mech. 1987, 181, 41–76. [Google Scholar] [CrossRef]
  56. Quirk, J.J.; Karni, S. On the dynamics of a shock-bubble interaction. J. Fluid Mech. 1996, 318, 129–163. [Google Scholar] [CrossRef]
Figure 1. Initial configuration of the two-dimensional shock-driven single-mode stratified heavy fluid layer. A planar shock wave propagates from left to right and interacts with a heavy gas layer of thickness d, bounded by an upstream sinusoidal interface I 1 with initial amplitude a 0 and wavelength λ , and a downstream planar interface I 2 . The shocked region, heavy gas layer (Gas b), and surrounding light gas (Gas a) are indicated.
Mathematics 13 03032 g001
Figure 2. Comparison of (a) numerical schlieren images and (b) the temporal evolution of the upstream interface displacement D s , between the experiment “Reproduced with permission from [54], Cambridge University Press, 2016” and the present results for a shocked V-shaped air/ SF 6 interface at M s = 1.2 .
Mathematics 13 03032 g002
Figure 3. Schlieren comparison of the experimental data [55], reference computation [56], and present DG simulation of a shock-driven heavy cylindrical interface at successive times (55–247 μ s).
Mathematics 13 03032 g003
Figure 4. Density contours at τ = 25 for a shock-driven single-mode stratified heavy fluid layer ( A = 0.72 ), obtained with four mesh resolutions: (a) N x × N y = 200 × 100 , (b) N x × N y = 400 × 200 , (c) N x × N y = 800 × 400 , and (d) N x × N y = 1200 × 600 .
Mathematics 13 03032 g004
Figure 5. Density profiles along the centerline ( y = 50 mm ) at τ = 25 for a shock-driven single-mode stratified heavy fluid layer ( A = 0.72 ), obtained using four mesh resolutions: N x × N y = 200 × 100 , 400 × 200 , 800 × 400 , and 1200 × 600 .
Mathematics 13 03032 g005
Figure 6. Time evolution of shock-driven single-mode stratified heavy fluid layers at two different Atwood numbers: (a) A = 0.30 , and (b) A = 0.44 .
Mathematics 13 03032 g006
Figure 7. Time evolution of shock-driven single-mode stratified heavy fluid layers at two different Atwood numbers: (a) A = 0.52 , and (b) A = 0.61 .
Mathematics 13 03032 g007
Figure 8. Time evolution of shock-driven single-mode stratified heavy fluid layers at two different Atwood numbers: (a) A = 0.68 , and (b) A = 0.72 .
Mathematics 13 03032 g008
Figure 9. Influence of Atwood number on the temporal evolution of interface deformation in shock-driven single-mode stratified heavy fluid layers: (a) A = 0.30 , (b) A = 0.44 , (c) A = 0.52 , (d) A = 0.61 , (e) A = 0.68 , and (f) A = 0.72 .
Mathematics 13 03032 g009
Figure 10. Influence of Atwood number on shock-driven single-mode stratified heavy fluid layers at τ = 30 : (a) numerical schlieren images for different Atwood numbers (A = 0.30, 0.44, 0.52, 0.61, 0.68, 0.72), and (b) trajectories of the transmitted shock (TS) and upstream interface (UI) as a function of A. The inset in (b) highlights the relative positions of TS and UI extracted from the schlieren field.
Mathematics 13 03032 g010
Figure 11. Schematic illustration of vorticity generation in shock-driven single-mode stratified heavy fluid layers. The sequence shows the pre-shock state, the post-shock misalignment of pressure and density gradients ( ρ × p ) , and the subsequent formation of baroclinically induced vortical structures along the interface.
Mathematics 13 03032 g011
Figure 12. Influence of Atwood number on vorticity distribution in shock-driven single-mode stratified heavy fluid layers at τ = 70 .
Mathematics 13 03032 g012
Figure 13. Influence of Atwood number on the spatially integrated vorticity source terms in shock-driven single-mode stratified heavy fluid layers: (a) dilatation ( ω d i l ) , and (b) baroclinic ( ω b a r o ) vorticity.
Mathematics 13 03032 g013
Figure 14. Influence of Atwood number on the spatially integrated vorticity diagnostics in shock-driven single-mode stratified heavy fluid layers: (a) vorticity maximum ( ω m a x ) , and (b) vorticity minimum ( ω m i n ) .
Mathematics 13 03032 g014
Figure 15. Influence of Atwood number on the spatially integrated circulation diagnostics in shock-driven single-mode stratified heavy fluid layers: (a) positive circulation ( Γ P o s ) , and (b) negative circulation ( Γ N e g ) , and (c) total circulation ( Γ T o t ) .
Mathematics 13 03032 g015
Figure 16. Influence of Atwood number on the spatially integrated flow diagnostics in shock-driven single-mode stratified heavy fluid layers: (a) enstrophy ( Ω ) , and (b) kinetic energy ( E k ) .
Mathematics 13 03032 g016
Figure 17. Influence of Atwood number on the interface trajectories of shock-driven single-mode stratified heavy fluid layers: (a) normalized upstream interface ( X UI ) , (b) normalized downstream interface ( X DI ) , and (c) normalized transmitted shock wave position ( X TS 1 ) .
Mathematics 13 03032 g017
Figure 18. Influence of Atwood number on the interface evolution in shock-driven single-mode stratified heavy fluid layers: (a) normalized interface length ( L ) , and (b) normalized perturbation amplitude ( a ) .
Mathematics 13 03032 g018
Table 1. Material attributes of tested gas for the numerical simulations.
Gas a ρ a γ a Gas b ρ b γ b A
69 % Kr + 31 % Air 2.711.55 67 % SF 6 + 33 % Air 4.961.120.30
71 % He + 29 % Air 0.461.56 4 % He + 31 % Air 1.141.410.44
71 % He + 29 % Air 0.461.56 54 % Ar + 46 % Air 1.421.510.52
69 % Ar + 31 % Air 1.491.55 85 % SF 6 + 15 % Air 5.221.100.61
100 % Air 1.181.40 91 % SF 6 + 9 % Air 5.511.090.68
66 % He + 34 % Air 0.511.54 84 % Kr + 16 % Air 3.051.600.72
Disclaimer/Publisher’s Note: The statements, opinions and data contained in all publications are solely those of the individual author(s) and contributor(s) and not of MDPI and/or the editor(s). MDPI and/or the editor(s) disclaim responsibility for any injury to people or property resulting from any ideas, methods, instructions or products referred to in the content.