1. Introduction
In the field of medicine, the diagnosis of patients’ medical conditions can be made by detecting the quantity of three types of blood cells (red blood cells, white blood cells and platelets) [
1] in the human bloodstream. For example, an excessive number of erythrocytes may indicate vascular obstruction, while a deficiency may suggest anemia. The quantity of leukocytes can provide indications of bacterial invasion [
2]. Diagnosing acute myeloid leukemia and related neoplasms in adults is challenging [
3], due to the need for integrating clinical, morphological, immunophenotypic, cytogenetic, and molecular genetic data.
Traditional blood cell detection methods often rely on manual inspection by professionals using microscopes and other devices [
4], which is both labor-intensive and resource-demanding. Traditional image processing methods, including thresholding, edge detection, and morphological operations, are commonly employed in blood cell identification. Nevertheless, these approaches often struggle with variations in erythrocyte morphology and the presence of overlapping or clustered cells, resulting in suboptimal performance.
In contrast, machine learning-based approaches, particularly deep learning methods, have shown superior accuracy in erythrocyte recognition, even in the presence of challenging cell image features.
One notable study investigated the YOLO-Dense [
5], which integrates dense connections into the YOLO architecture. This adjustment enhanced detection precision, reaching an mAP@50 of 86%, where accuracy is determined by over 50% intersection between predicted and ground truth bounding boxes. The YOLO-Dense model demonstrated superior performance compared to the Faster R-CNN, underscoring the advantages of deep learning techniques in tackling the complexities associated with blood cell identification tasks.
Meanwhile, data augmentation methods have been widely applied in the field of medical imaging. Chlap et al. [
6] explores the application of deep learning in identifying medical conditions from images and discusses the potential for augmenting medical datasets using biologically informed methods. And Generative Adversarial Networks (GANs) [
7] was used for generating synthetic medical images that respect biological constraints, improving CNN performance in liver lesion classification. Akhil et al. [
8] discusses the use of deep convolutional adversarial networks (DCGANs) for synthesizing medical images with realistic biological features, contributing to the advancement of data augmentation strategies in medical imaging.
Based on the background outlined above, we propose the YOLO-BC (YOLOv8 for Blood Cell) algorithm. It is an enhanced version of the existing YOLOv8 architecture, specifically designed for blood cell detection. This improvement is achieved by incorporating an Efficient Multi-Scale Attention (EMSA) and Omni-Dimensional Dynamic Convolution (ODConv) into the backbone section. YOLO-BC demonstrates superior performance over YOLOv8, achieving a higher F1-score and outperforming YOLOv8 in both mAP@50 and mAP@50:95. The proposed YOLO-BC algorithm addresses important issues such as overlapping blood cells and enhances accuracy in detecting small cells, highlighting its potential applicability and generalizability across various blood cell detection scenarios.
There are three main contributions of this study:
- (1)
Dataset Augmentation for Blood Cell Variations: To mitigate the issue of limited cell samples and variability in cell shapes, a small-scale blood cell dataset is augmented using advanced digital image processing techniques, including image flipping, scaling, and brightness adjustment. This augmentation effectively expands the dataset, enriching the detection scenario and bringing it closer to real-world conditions.
- (2)
Integration of EMSA: An EMSA mechanism is introduced within the specific C2f module of YOLOv8, where it enhances feature maps by incorporating attention mechanisms across multiple scales. This allows the network to focus on critical regions of interest, improving detection accuracy for diverse blood cell types, especially in challenging scenarios with occluded or overlapping cells.
- (3)
ODConv for small cells: The conventional convolution module of YOLOv8 is replaced with an ODConv submodule, which adaptively combines convolution kernels across multiple dimensions. This modification improves the model’s ability to represent features from various blood cell types, enhancing its performance in identifying and differentiating small and irregularly shaped blood cells.
2. Related Works
In recent years, significant advancements have been made in the field of blood cell recognition. Since the introduction of LeNet [
9], a series of influential architectures and technologies have emerged, driving progress in this domain. A major breakthrough occurred in the 2012 ImageNet image classification challenge [
10], with the introduction of deep convolutional neural networks (CNNs), which significantly improved image recognition performance. In the 2014 ImageNet competition, VGGNet [
10] advanced the field further by employing smaller convolutional kernels and deeper network layers, thereby enhancing both feature extraction and overall performance. The 2015 ImageNet competition introduced ResNet [
11], which incorporated residual connections to address critical issues such as vanishing gradients and model degradation, enabling the training of much deeper networks without sacrificing performance.
Specifically, for the task of medical cell counting, researchers have proposed a series of deep learning network architectures. Faster R-CNN [
12] introduces a region proposal network (RPN) and ROI pooling layer, combining object localization and classification. Recent advancements in medical imaging have seen transformer-based models gaining traction due to their superior performance over traditional CNNs in various detection tasks. For instance, Swin Transformer has been applied in the retinal vessel segmentation [
13] and demonstrated state-of-the-art results, outperforming CNN-based methods in terms of accuracy and robustness. Another significant study by Zhu et al. [
14] utilized a Vision Transformer (ViT) for lung cancer detection, where the model outperformed CNNs in terms of sensitivity and specificity, particularly in challenging low-resolution images. Moreover, Dosovitskiy et al. [
15] proposed a hybrid model combining transformers and CNNs. And it showed significant improvement in detecting anomalies in chest X-rays, with a notable reduction in false positives compared to traditional methods.
YOLO is renowned for its real-time inference speed [
16], transforming the object detection task into a regression problem to predict object positions and categories simultaneously. Firstly, YOLOv3 adopted the Darknet-53 backbone, enhancing feature extraction and refined object classification and localization accuracy. Then, YOLOv4 emphasized efficiency, introducing the CSPDarknet53 backbone, SPP (Spatial Pyramid Pooling), and PANet (Path Aggregation Network). Critically, YOLOv5 offered improvements in model training, including auto-learning anchor boxes, model pruning, and advanced data augmentation techniques. The YOLOv6 and YOLOv7 further optimized performance. YOLOv6 focused on computational efficiency, while YOLOv7 introduced advanced networks like dynamic convolution and hybrid task attention, improving both speed and accuracy in complex detection scenarios.
However, detecting small and overlapping cells in medical images remains a challenge [
17], as highlighted by Shakarami et al. They found that YOLOv3-based methods failed to consistently detect small-sized cells in histopathology slides due to spatial resolution limitations in deeper layers of the network. The performance of YOLO-based cell detectors is heavily influenced by the dataset used for training. Medical image datasets are often small, highly specialized, and difficult to annotate, which may lead to overfitting and poor generalization. Nair et al. [
18] emphasize the need for larger and diverse datasets to improve the generalization of models. Their study on YOLOv4 for cell detection in histopathology images showed that model performance improves significantly with the inclusion of more annotated samples, especially when incorporating a variety of cellular types and pathological conditions. Furthermore, the complexity of medical image annotation, where cells must be identified with high precision, poses challenges for both training and validation of model.
And data augmentation methods and semi-supervised learning approaches have been suggested to overcome these limitations, as explored by Yang et al. [
19] in their hybrid YOLO-based method that utilizes synthetic image generation to expand dataset sizes. To further improve the detection performance of small cells, Shao et al. [
20] proposed an attention-based YOLO network. This attention mechanism enables the model to focus on relevant regions of the image, enhancing detection accuracy for cells that may otherwise be overlooked in complex medical images. YOLO-Dense introduces Dense connections in YOLO [
21], achieving better detection performance compared to Faster R-CNN with an mAP@50 score of 86%.
Due to the limited size of medical cell image datasets, data augmentation techniques are frequently employed to expand the variability of training samples. Transformations such as mirror flipping, rotation, scaling, and translation can be applied using affine transformation methods, which significantly diversify the set of available cell images. These augmentations not only enhance the range of training data but also contribute to improving the model’s robustness and its ability to generalize across various real-world scenarios. By artificially expanding the dataset, these techniques help mitigate overfitting and improve the model’s performance on unseen data.
In this study, we conduct an in-depth investigation of various object detection algorithms for blood cell recognition and counting, with a particular focus on the explainability and clinical applicability of our proposed model. We propose an improved YOLO-BC algorithm based on YOLOv8, incorporating Efficient Multi-scale Attention (EMSA) and Omni-dimensional Dynamic Convolution (ODConv) models. These innovations not only enhance the model’s performance but also contribute to its interpretability, which is crucial for clinical adoption. The BCCD (Blood Cell Count and Detection) dataset [
21] is selected for experiments, with data augmentation tricks applied to enhance the dataset. In addition to performance metrics such as precision, recall, mAP, and F1 score, we emphasize the importance of transparent model predictions for clinical settings. To this end, we detail the impact of EMSA and ODConv on model explainability, providing insights into how these components aid in understanding the detection process.
3. Methods
3.1. The Design of YOLO-BC Detection Pipeline
In terms of blood cell detection and counting, the YOLO-BC should be designed to automatically identify and count different types of blood cells in blood images, such as red blood cells, white blood cells, and platelets.
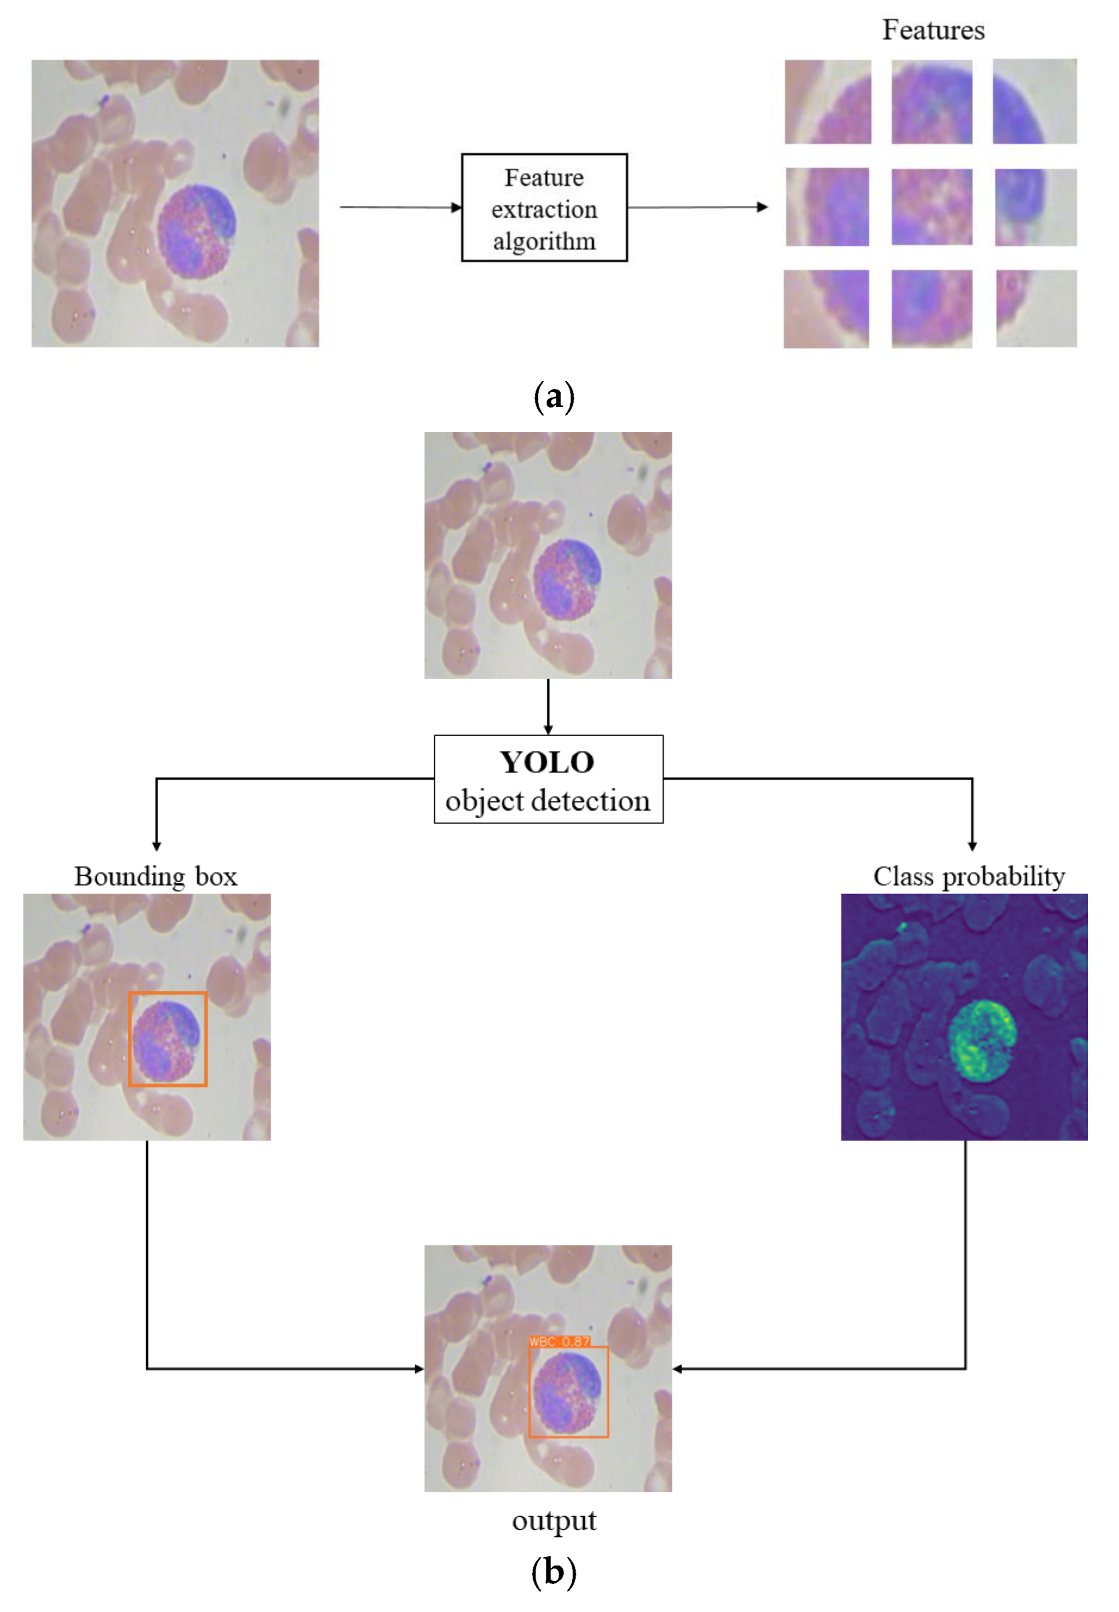
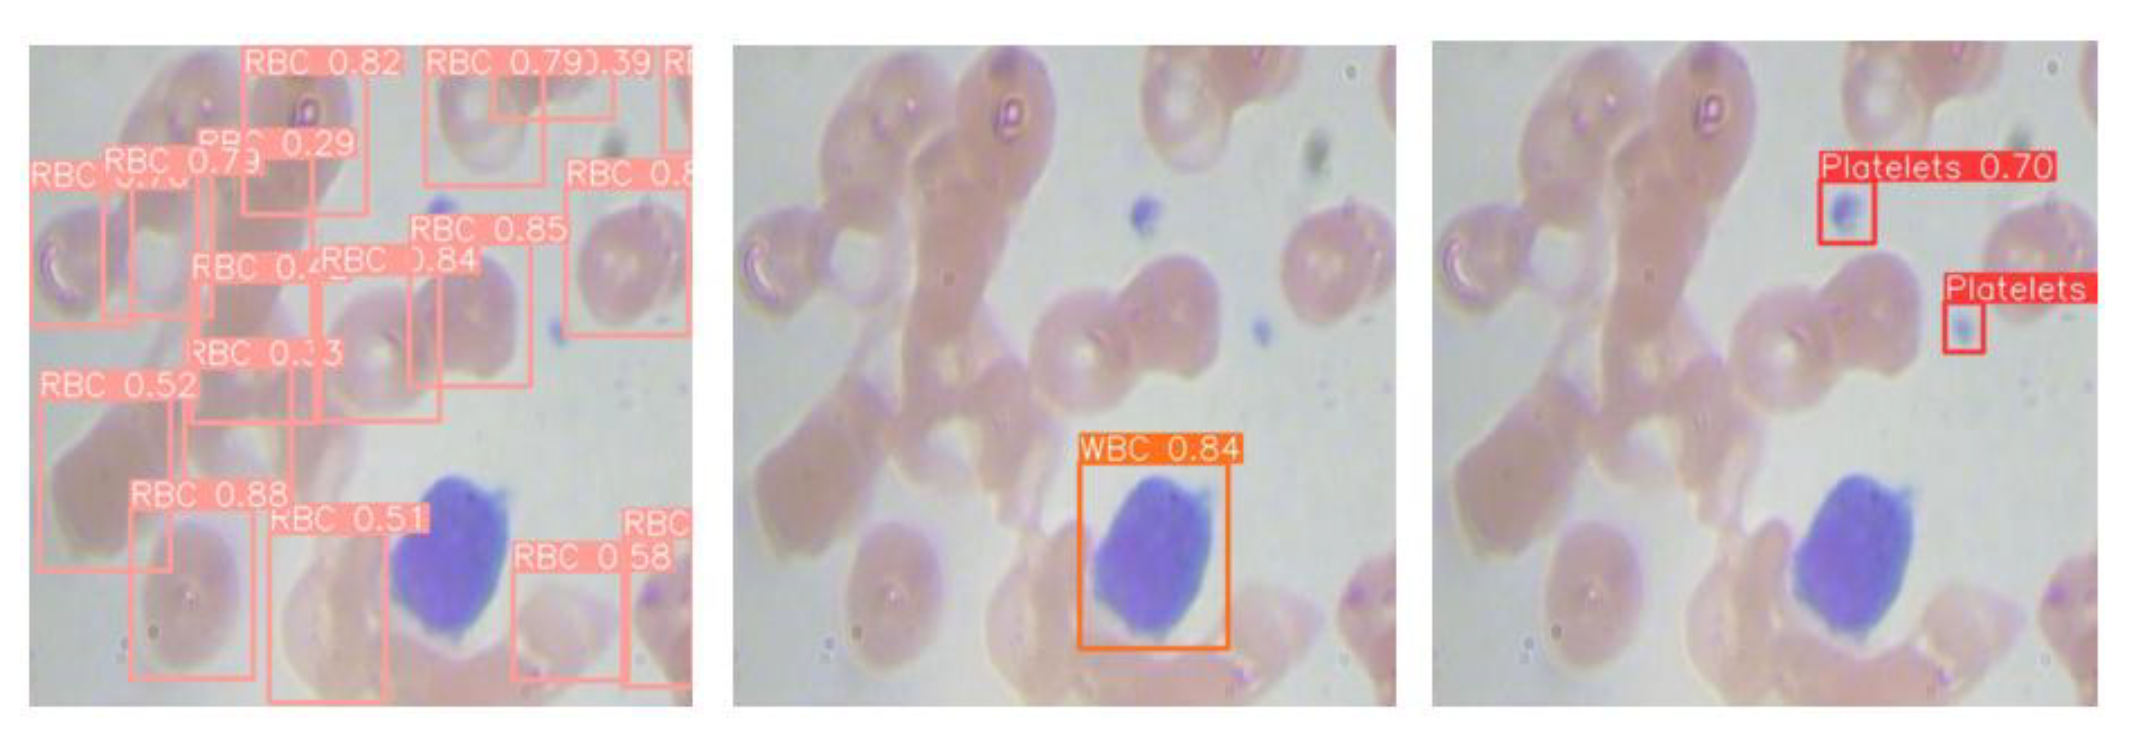
YOLO-BC employs a convolutional neural network (CNN) for feature extraction and object detection, partitioning the image into grids and predicting candidate object bounding boxes along with their corresponding classes in each grid (refer to
Figure 1a). This design allows YOLO-BC to deliver rapid detection and high accuracy, effectively handling large datasets of blood cell images.
As illustrated in
Figure 1b, taking white blood cell detection as an example, the YOLO-BC algorithm generates bounding boxes along with the corresponding classification probabilities for the detected objects, thereby enabling the identification of various blood cell types. This design is crucial for enhancing the practical application of YOLO-BC in medical diagnostics.
Conventional medical diagnostics typically depend on manual visual assessment and analysis. In contrast, incorporating YOLO-BC for automated blood cell detection presents a promising method for offering clinicians a rapid and dependable diagnostic tool for conditions related to blood cells.
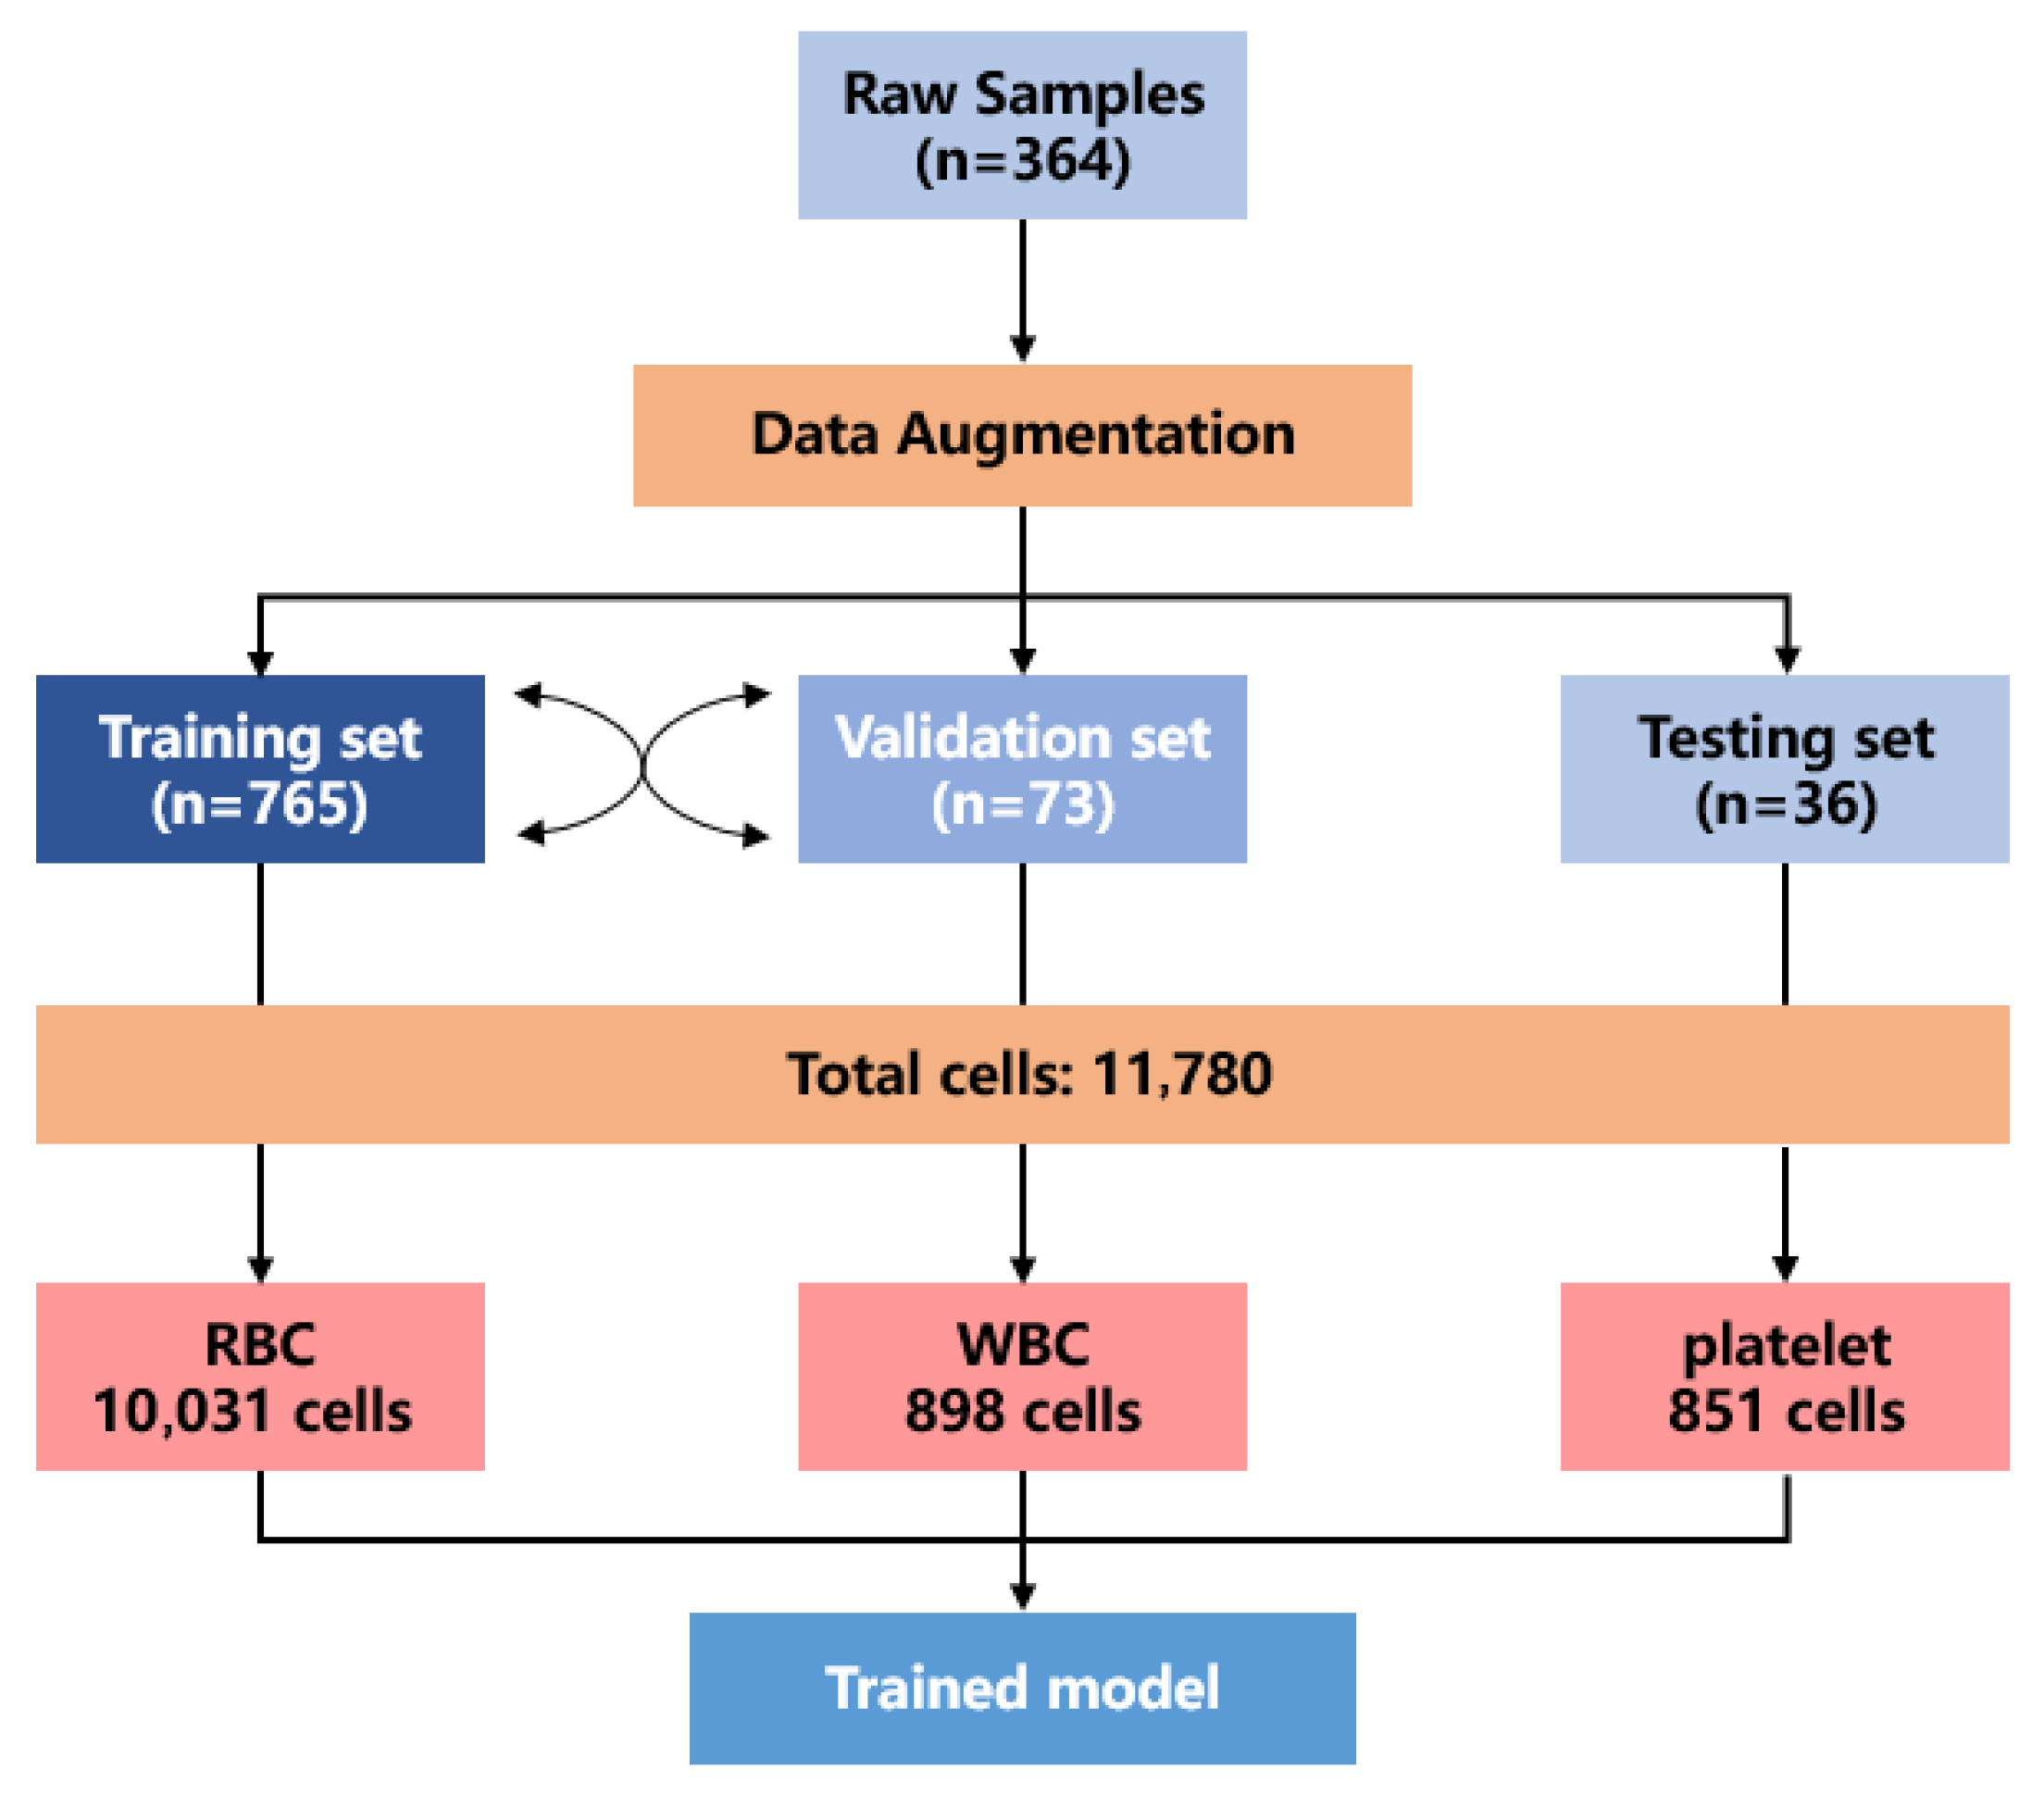
This study designed the training framework and model architecture for the YOLOv8-BC model, as illustrated in
Figure 2. The initial dataset contained only 364 image samples, which are captured using a regular light microscope, with a resolution of 640
480. Firstly, the test set is separated, and data augmentation is applied to the training and validation sets.
Through data augmentation, a more comprehensive blood cell dataset is generated, ensuring a broader representation of the blood cell detection scenario. The final dataset includes a training set (765 images), a validation set (73 images), and a test set (36 images). Although the number of test images is limited, each image contains a large number of blood cells, providing a relatively rich sample size.
In total, the dataset encompassed 11,789 individual blood cell samples, comprising 10,031 red blood cells, 898 white blood cells, and 851 platelets. After training on this augmented dataset, the YOLOv8-BC model is developed.
In the context of analyzing microscope images, medical professionals typically need to examine and assess a substantial number of blood samples to detect potential abnormalities. Traditionally, this process needs significant manual effort and time. However, with the implementation of the YOLO-BC pipeline, which incorporates advanced visual detection software, clinicians can simply input microscope images into the system. The embedded software autonomously detects and localizes blood cells within the images, providing rapid and precise diagnostic insights. This automated approach significantly enhances the efficiency and accuracy of blood cell analysis, supporting timely and reliable clinical decision-making.
3.2. YOLO-BC Algorithm
Based on the YOLOv8 model [
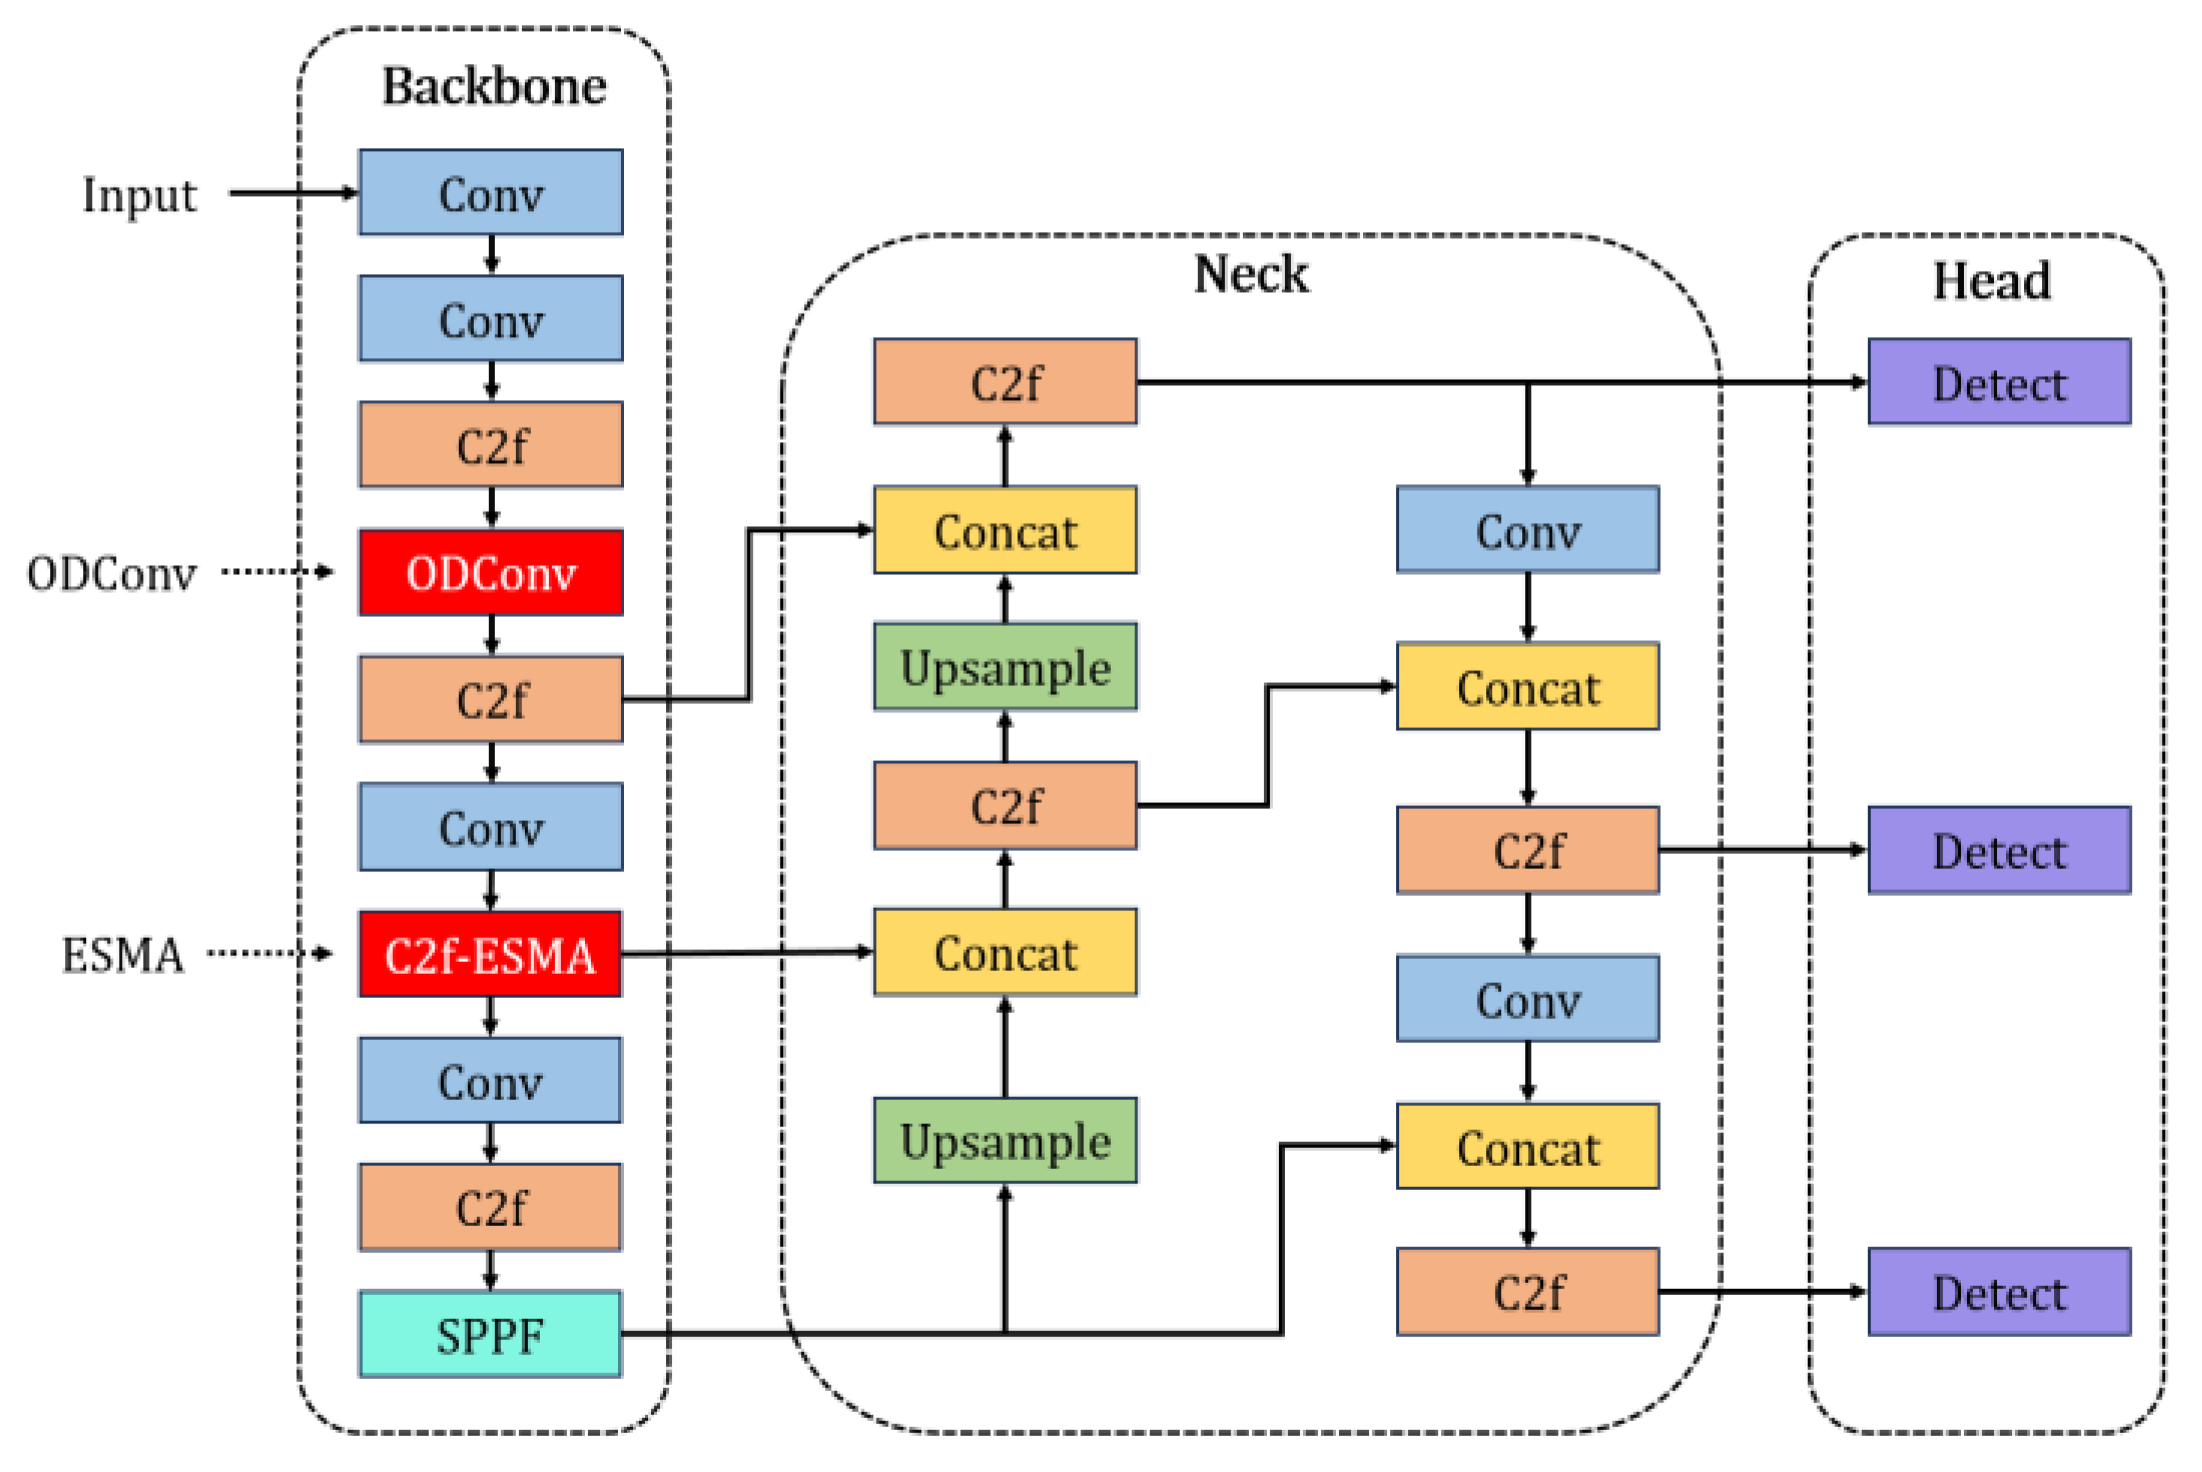
22], incorporating the aforementioned EMSA and ODConv, this study designed and implemented an improved network architecture called YOLO-BC (YOLOv8 for Blood Cell), as illustrated in the
Figure 3 below.
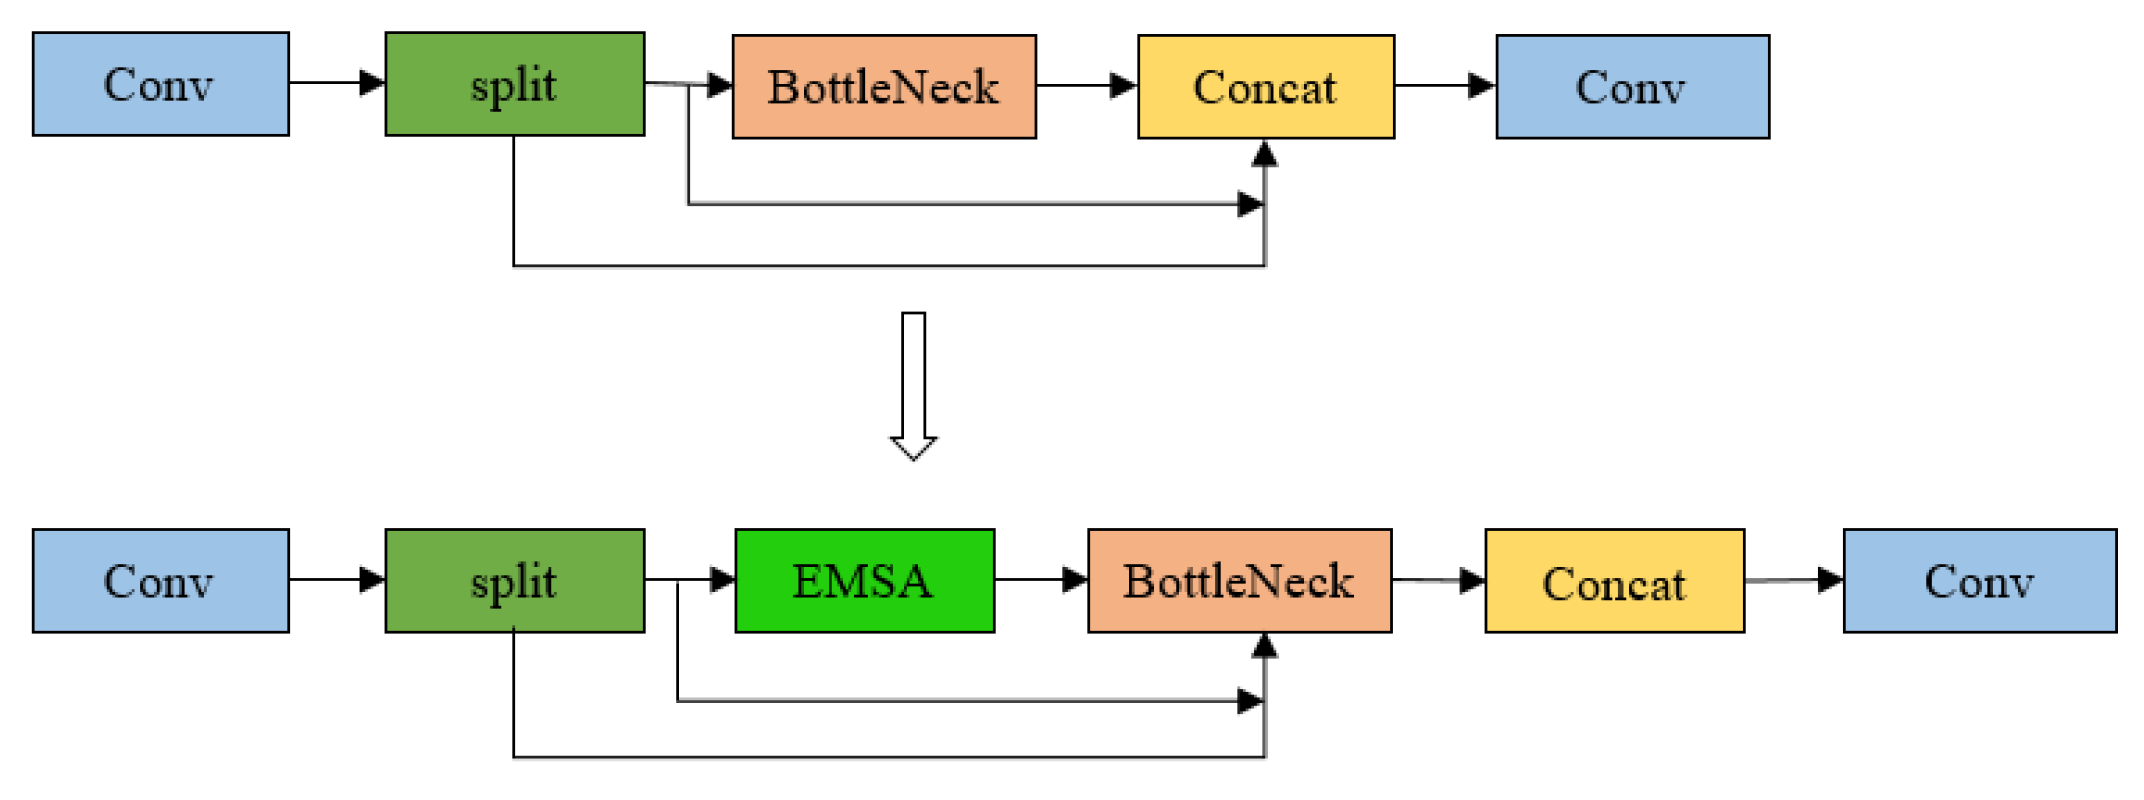
In this study, we introduce several novel modifications to the YOLOv8 architecture with the goal of enhancing feature aggregation and detection accuracy. The Efficient Multi-Scale Attention (EMSA) module is strategically integrated at the end of the C2f (Faster CSP Bottleneck with 2 Convolutions) block, which connects to the second concatenation layer in the neck section. This positioning allows the EMSA module to optimize the aggregation of multi-scale feature information, significantly improving the network’s capability to capture and process features across varying resolutions. Additionally, the third convolutional layer in the backbone is substituted with the Omni-Dimensional Dynamic Convolution (ODConv) module, which enhances the network’s ability to extract target-specific features. This modification further refines the detection performance, enabling more accurate identification of objects in complex scenarios. These architectural improvements collectively strengthen the overall efficiency and effectiveness of the YOLOv8 model in feature extraction and detection tasks.
In blood cell imagery, occlusion and overlapping among cells present significant challenges for object detection. To address these issues, an attention mechanism is introduced in
Figure 3, aimed at mitigating the limitations of YOLOv8 in blood cell detection, including problems such as redundant counting in overlapping cells and reduced accuracy in detecting smaller blood cells.
3.3. Efficient Multi-Scale Attention
The Efficient Multi-Scale Attention (EMSA) mechanism [
23] is an innovative attention module that has recently garnered significant attention in the literature. Its core principle is to reduce computational complexity while maintaining crucial information across each channel.
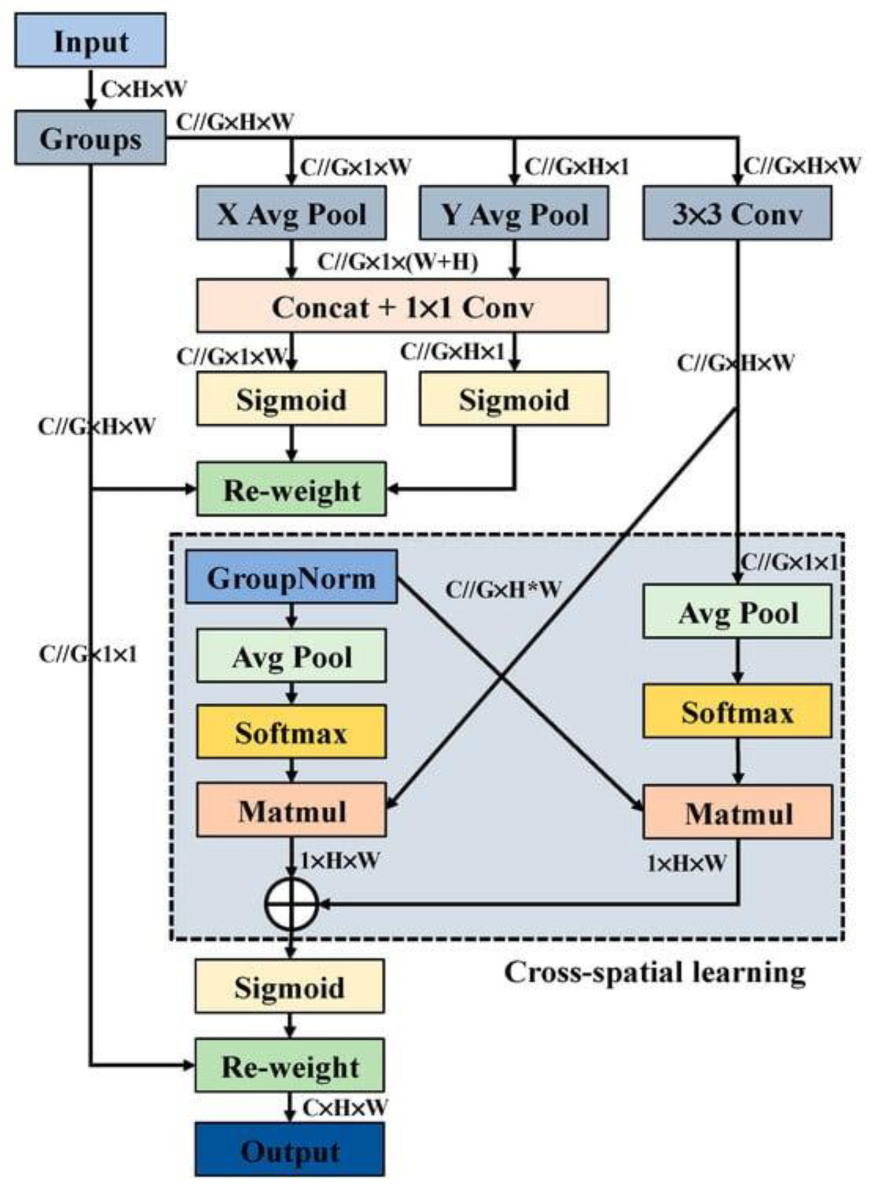
The EMSA mechanism achieves this by reshaping a subset of the channels into the batch dimension, which allows for more efficient processing of channel information, as illustrated in
Figure 4.
By partitioning the channel dimension into multiple sub-features, the module ensures a balanced distribution of spatial semantic features across each feature group. Assume that the input feature map is X, there are m samples in total, each sample has
features, and the feature map is divided into G groups. For each group g, calculate the mean
and variance
of the features within the group, defined as [
23]:
Intuitively, and represent the height and width of the feature map respectively; G is number of feature map groups.
Then, it normalizes the features
within the group as:
where ε is a small positive number to prevent the denominator from being zero. Finally, the normalized feature Y is restored to its original shape. This grouping improves the expression capability of different blood cells’ pixel features and reduces computational costs, enhancing model efficiency.
The EMSA mechanism is designed to encode global context information while dynamically adjusting the channel weights across each parallel branch, thereby enhancing the calibration of channel significance. Leveraging the advantages of the innovative EMSA architecture, the C2f module of YOLOv8 is optimized by incorporating a multi-scale attention mechanism. This addition effectively addresses the variances in pixel-level features across distinct blood cell types, with particular emphasis on small and challenging targets such as platelets. Furthermore, the backbone P4/16 layer is adapted post-C2f to improve the model’s ability to process these fine-grained features, ultimately boosting the network’s performance in detecting small blood cell categories. This modification enhances the overall feature extraction and detection capability, especially in scenarios involving subtle or difficult-to-detect objects.
Additionally, the EMSA mechanism leverages cross-dimensional interactions to aggregate output features from two parallel branches, enhancing the model’s ability to capture fine-grained pairwise relationships at the pixel level. This interaction is particularly beneficial for blood cell detection, as it allows for a deeper understanding of the spatial correlations between different regions within the image. By improving feature consistency and precision, the EMSA mechanism strengthens the model’s capability to represent complex patterns with greater efficacy. Within the network architecture, the EMSA module is strategically positioned before the bottleneck module (
Figure 5), ensuring that the enriched feature representation is processed before any dimensionality reduction takes place. This design choice further optimizes the model’s performance by preserving detailed spatial information.
3.4. Omni-Dimensional Dynamic Convolution
ODConv (Omni-Dimensional Dynamic Convolution) [
24] is an advanced dynamic convolution method that extends and builds upon the CondConv framework. It incorporates the dynamics of multiple dimensions, such as the spatial domain, input channels, and output channels, to enhance model performance through parallel strategies and multi-dimensional attention mechanisms. This enables ODConv to learn complementary attention features, thereby improving feature representation.
The core concept behind ODConv is to decompose the standard convolution operation into multiple sub-operations and introduce dynamic weights to optimize feature representation. By leveraging matrix decomposition [
25], ODConv utilizes a decomposition strategy for the convolutional kernel by representing it as the product of two low-rank matrices. This decomposition significantly reduces the number of parameters and the computational complexity associated with traditional convolutional operations. As a result, the YOLOv8 will become more computationally efficient while maintaining high performance. This reduction in parameter space is particularly advantageous for blood cell detection tasks, where it facilitates faster inference and more efficient use of resources, ultimately enhancing the overall model performance without sacrificing accuracy.
ODConv is designed as a modular, plug-and-play component, allowing for seamless integration into the existing YOLOv8 architecture. It effectively addresses the issue of suboptimal detection performance, particularly in the detection of red blood cells (RBCs), by selectively replacing specific convolution modules within YOLOv8. Furthermore, this work introduces an enhanced iteration of ODConv, referred to as ODConv v2, which incorporates several key improvements to elevate its functionality. Notably, a batch normalization layer [
26] is added after the convolution operation to improve feature stability and training efficiency, while the SiLU activation function is employed to provide enhanced non-linearity and better gradient flow.
In addition, several enhancements are implemented within the convolutional module at the P3/8 pixel level of the YOLOv8 architecture. These adjustments encompass changes to the spatial resolution as well as modifications to the input and output channel dimensions, all of which contribute to the optimization of the model’s overall performance. By fine-tuning these parameters, the model is able to better capture hierarchical features at varying scales, thereby improving its efficiency and accuracy. The experimental results presented in this study are based on the integration of ODConv v2 within the YOLO-BC framework, ensuring that the outcomes reflect the improved model architecture and its enhanced capabilities.
3.5. Dataset
Data augmentation is performed on the original BCCD dataset [
21], thereby improving the model’s ability to generalize over unseen data. Each image has a 50% probability of being horizontally flipped. This transformation aids the model in learning to recognize objects from different perspectives, enhancing its ability to generalize and potentially improving detection performance. Similarly, each image has a 50% chance of undergoing a vertical flip.
This data augmentation approach is particularly beneficial in scenarios where objects may appear in inverted or varied vertical orientations, which is a common occurrence in real-world imaging environments. To further enhance the model’s robustness, a random cropping technique is applied to a subset of images, with the cropping percentage ranging from 0% to 15%. This makes the model to focus on diverse regions within the images, thereby promoting better spatial understanding and improving generalization. Additionally, the exposure levels of the images are adjusted within a range of −20% to +20%, simulating variations in lighting conditions and further enhancing the model’s ability to generalize across different environmental factors of blood samples. The dataset consists of a total of 874 clinical blood cell images, with 765 images allocated to the training set, 73 to the validation set, and 36 to the test set. This careful partitioning ensures a well-balanced distribution of images for model training and evaluation, optimizing performance across all stages of the learning process.
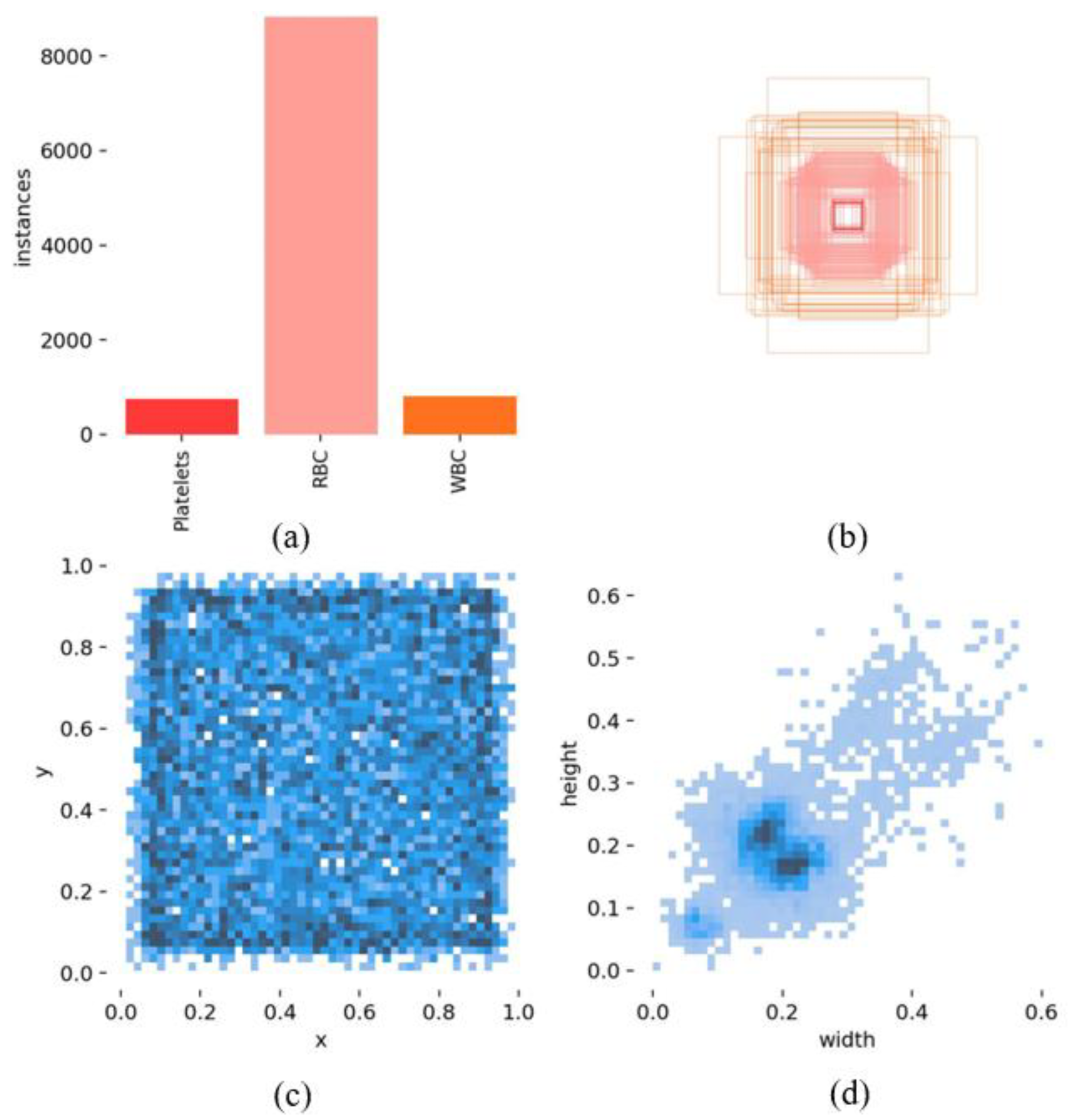
As is shown in
Figure 6, within the BCCD dataset used for training, there are a total of 739 platelet instances, 8814 red blood cell instances, and 789 white blood cell instances (
Figure 6a). Furthermore, normalized statistics were computed for the positions of the detection bounding boxes, scaling their coordinates to a range between 0 and 1. Analysis reveals that the dimensions (length and width) of the detection boxes are predominantly concentrated around the 0.2 mark. In this context, the x- and y-axes in
Figure 6c represent the relative positions of the detection boxes within the blood cell dataset, with values being unitless, while the width and height axes in
Figure 6d illustrate the relative sizes of the bounding boxes. These normalized statistics provide a more consistent and scalable representation of object locations and dimensions, improving model performance.
Label correlograms are an effective tool for identifying spatial patterns or correlations within blood cell object annotations, particularly in datasets containing multiple classes and scales. This technique enables the detection of instances where certain classes exhibit significant co-occurrence within an image, or where specific classes are more frequently observed at particular scales. The following figure shows a label correlation plot for a blood cell dataset, visualized in the xywh space (
Figure 7). This plot illustrates the relationships between the x, y coordinates, as well as the width and height variables of the detection bounding boxes for each label. Additionally, the size distribution of the blood cell dataset is relatively well-balanced, making it more conducive to training robust models. This balanced distribution of object sizes ensures that the model learns to detect cells of varying dimensions, enhancing its performance across different scenarios.
3.6. Statistics
In this study, detection performance was evaluated using several metrics, including accuracy (Precision), recall rate (Recall), F1 score (F1), mean average precision (mAP) [
27,
28], number of parameters (Params), computational complexity (FLOPs), and frames per second (FPS) [
29]. Below is a detailed introduction of these metrics along with their corresponding formulas:
Precision measures the ratio of true positives (TP) among the instances predicted as positive by the model, i.e., the proportion of correctly identified blood cells out of all the detected instances. In a medical context, high precision is crucial to minimize the number of false positives (FP), ensuring that the model does not incorrectly identify healthy cells as abnormal, which could lead to unnecessary treatments or interventions. The formula for precision is [
27]:
In Formula (3), TP represents the number of true positives and FP represents the number of false positives.
- (2)
Recall
Recall, on the other hand, measures the ability of the model to identify all relevant instances (i.e., all the positive cases), reflecting the proportion of true positives detected out of all actual positive samples. In the context of medical imaging, recall is particularly important as it ensures that the model does not miss any actual abnormalities, which is critical for early detection and prevention of diseases. However, an overly high recall may increase false positives, which is a trade-off that must be balanced. Its formula is:
In Formula (4), TP represents the number of true positives, and FN represents the number of false negatives.
- (3)
F1 score
The F1-score combines precision and recall into a single metric, providing a balance between the two. It is especially useful when there is an imbalance between the precision and recall, which is often the case in medical applications where both false positives and false negatives can have significant consequences. The F1-score highlights cases where the model is struggling to maintain both high precision and recall simultaneously. Its formula is:
- (4)
mAP@50 and mAP@50-95
The Mean Average Precision (mAP) is commonly used to evaluate object detection models, including those in medical imaging tasks like blood cell detection. mAP measures the overall accuracy of the model by averaging the precision at different recall levels, providing insight into both the model’s ability to detect true positives and the trade-offs in its decision threshold.
Specifically, this study uses mAP at two different IoU (Intersection over Union) thresholds: mAP@50 and mAP@50-95, which provide different levels of sensitivity for detection. Higher mAP values indicate better model performance in detecting blood cells with high precision. The formula for mAP is:
In Formula (6), n represents the number of object categories, and represents the Average Precision of the i-th category, where mAP@50 and mAP@50-90 are the mAP values, with the threshold of IoU is set to 0.5 and 0.5–0.95 respectively.
4. Experiments and Results
4.1. Experimental Environment
The experiment was conducted using the pytorch 2.0.0 training framework [
30] on a linux operating system environment with an NVDIA GeForce RTX 3090 graphics card with 24 GB of memory [
31]. This study uses the default YOLOv8 hyperparameters, which are well-tuned for a wide range of tasks.
The model training parameters were set to 100 epochs, and the optimizer used Adam with an initial learning rate of 0.01 and a momentum of 0.937. The object confidence threshold for detection is set to 0.001 for validation and testing, which is also the default confidence adopted by YOLOv8. And the confidence threshold in the visualization is set to 0.25.
4.2. Model Training
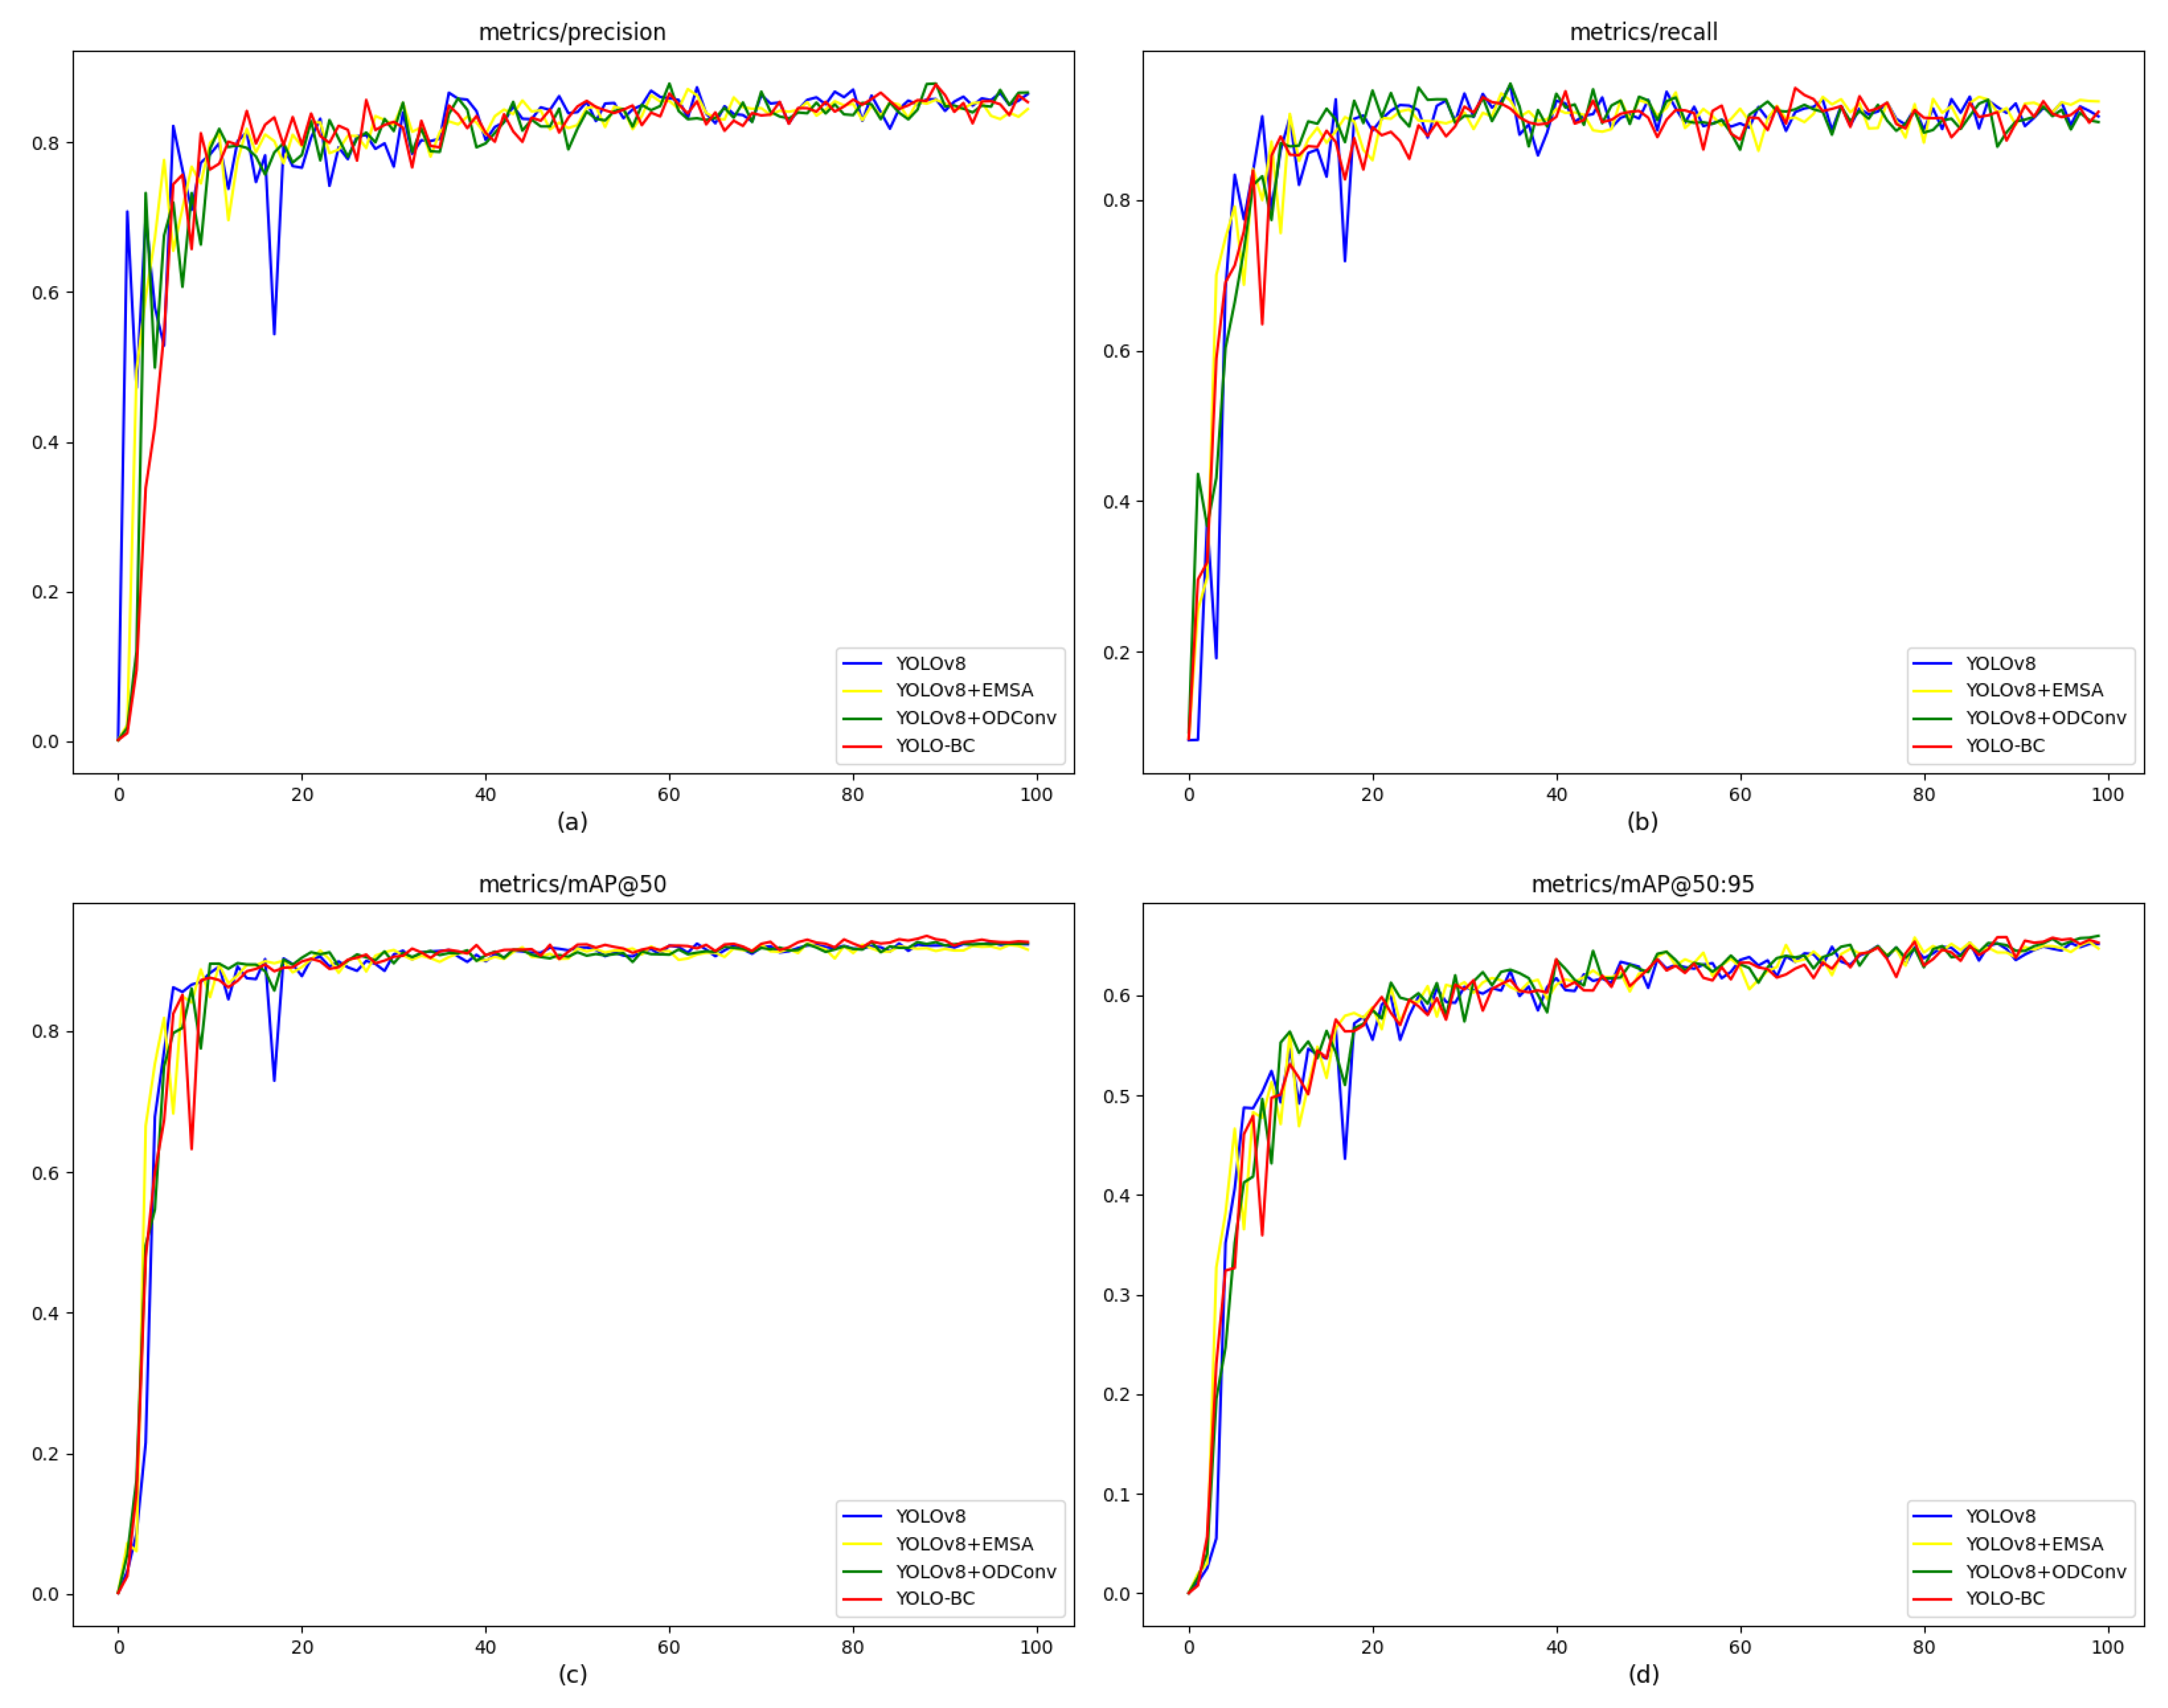
The training process of the improved model is shown in the
Figure 8 below, where the x-axis represents the number of epoches and the y-axis represents the corresponding indicator value. The YOLO-BC model params, Flops and FPS are 3,072,484, 8.3 G and 22.4 frame/s respectively.
For comparison, the YOLO-BC model uses the default YOLOv8 hyperparameters, with a batch size of 16 and 100 epochs. At the end of the training, all performance indicators [
32] of the model converge, with an mAP@50 of 0.927 and an mAP@50:95 of 0.653 on the training dataset. Considering the different blood cell types, the recall rates for WBC, RBC, and Platelets are 99.9%, 79.2%, and 87.5%, respectively, with mAP50 values of 0.994, 0.834, and 0.873 for the three categories. This indicates that none of the categories exhibit significantly low accuracy.
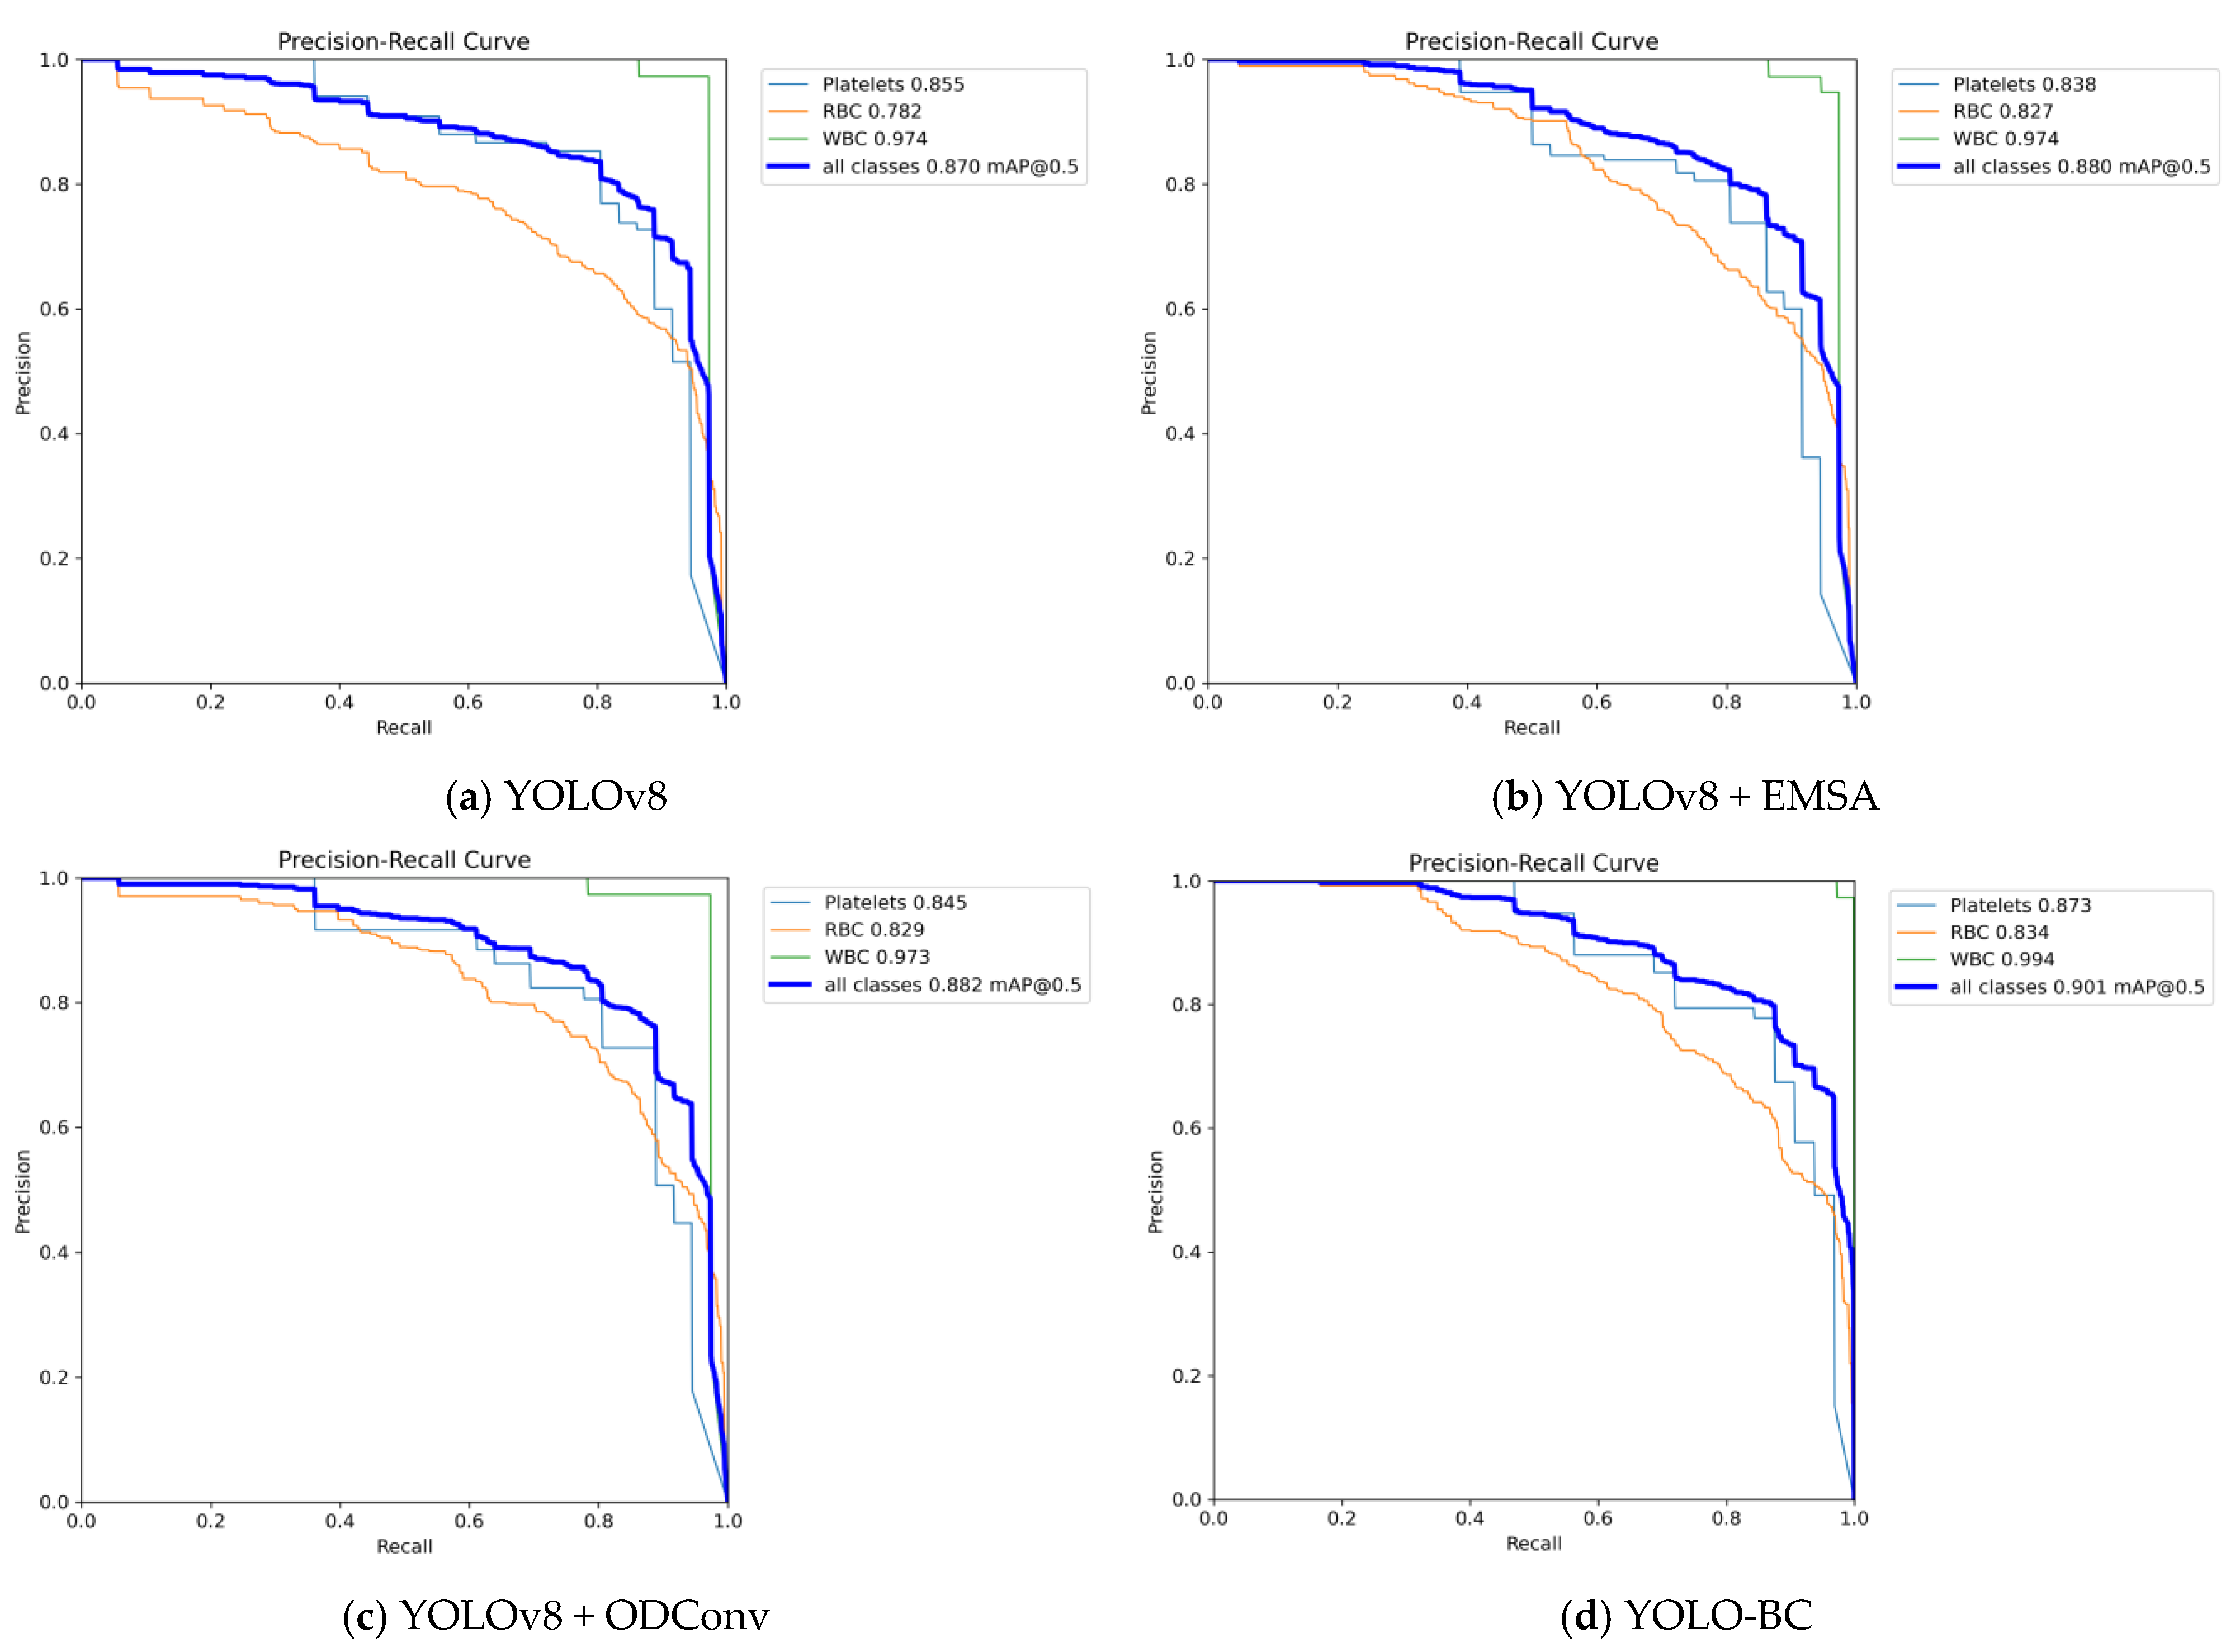
The results reveal that when the IoU threshold is set to 0.5, the YOLO-BC model exhibits a modest improvement over YOLOv8 on the blood cell training dataset (see
Figure 9, panels (b), (c), and (d) compared to (a)). However, as the IoU threshold increases, the model demonstrates a marked improvement in mean Average Precision (mAP), although the absolute value remains comparatively lower. Furthermore, both recall and precision metrics show varying levels of enhancement.
However, the true performance of the blood cell detection model must be evaluated on a test set to accurately assess the robustness of the YOLO-BC model. The experimental results from the training set serve as a reference for tracking improvements in the model.
4.3. Ablation Environment
An ablation experiment on test dataset was designed to validate the effectiveness of the proposed YOLO-BC model. The experimental results are shown in
Table 1. The detection accuracy of YOLO-BC, as measured by mAP@50 and mAP@50:95, reached 0.901 and 0.62 respectively.
While the YOLOv8 model achieves 20.6 FPS, the integration of ODConv increases the FPS to 25.9, but the final YOLO-BC model reports a lower FPS of 22.4. This FPS trade-off can be attributed primarily to the addition of the EMSA. While ODConv contributes to an increase in FPS by optimizing convolution operations through dynamic weight adjustments, EMSA introduces additional computational complexity due to its multi-dimensional attention. This mechanism, while improving feature representation, requires more computations, particularly in terms of multi-scale feature interactions, which ultimately results in a slight reduction in FPS in the YOLO-BC model (22.4 FPS). However, this trade-off is justified by the significant performance gains in other key metrics, particularly in mAP, which is the most critical metric for blood cell detection. The improvements in accuracy and robustness achieved through EMSA, alongside the dynamic convolution capabilities of ODConv, result in a more accurate and efficient detection system despite the minor FPS reduction.
These values were the highest among several models, highlighting the significant advantages of the improved model (
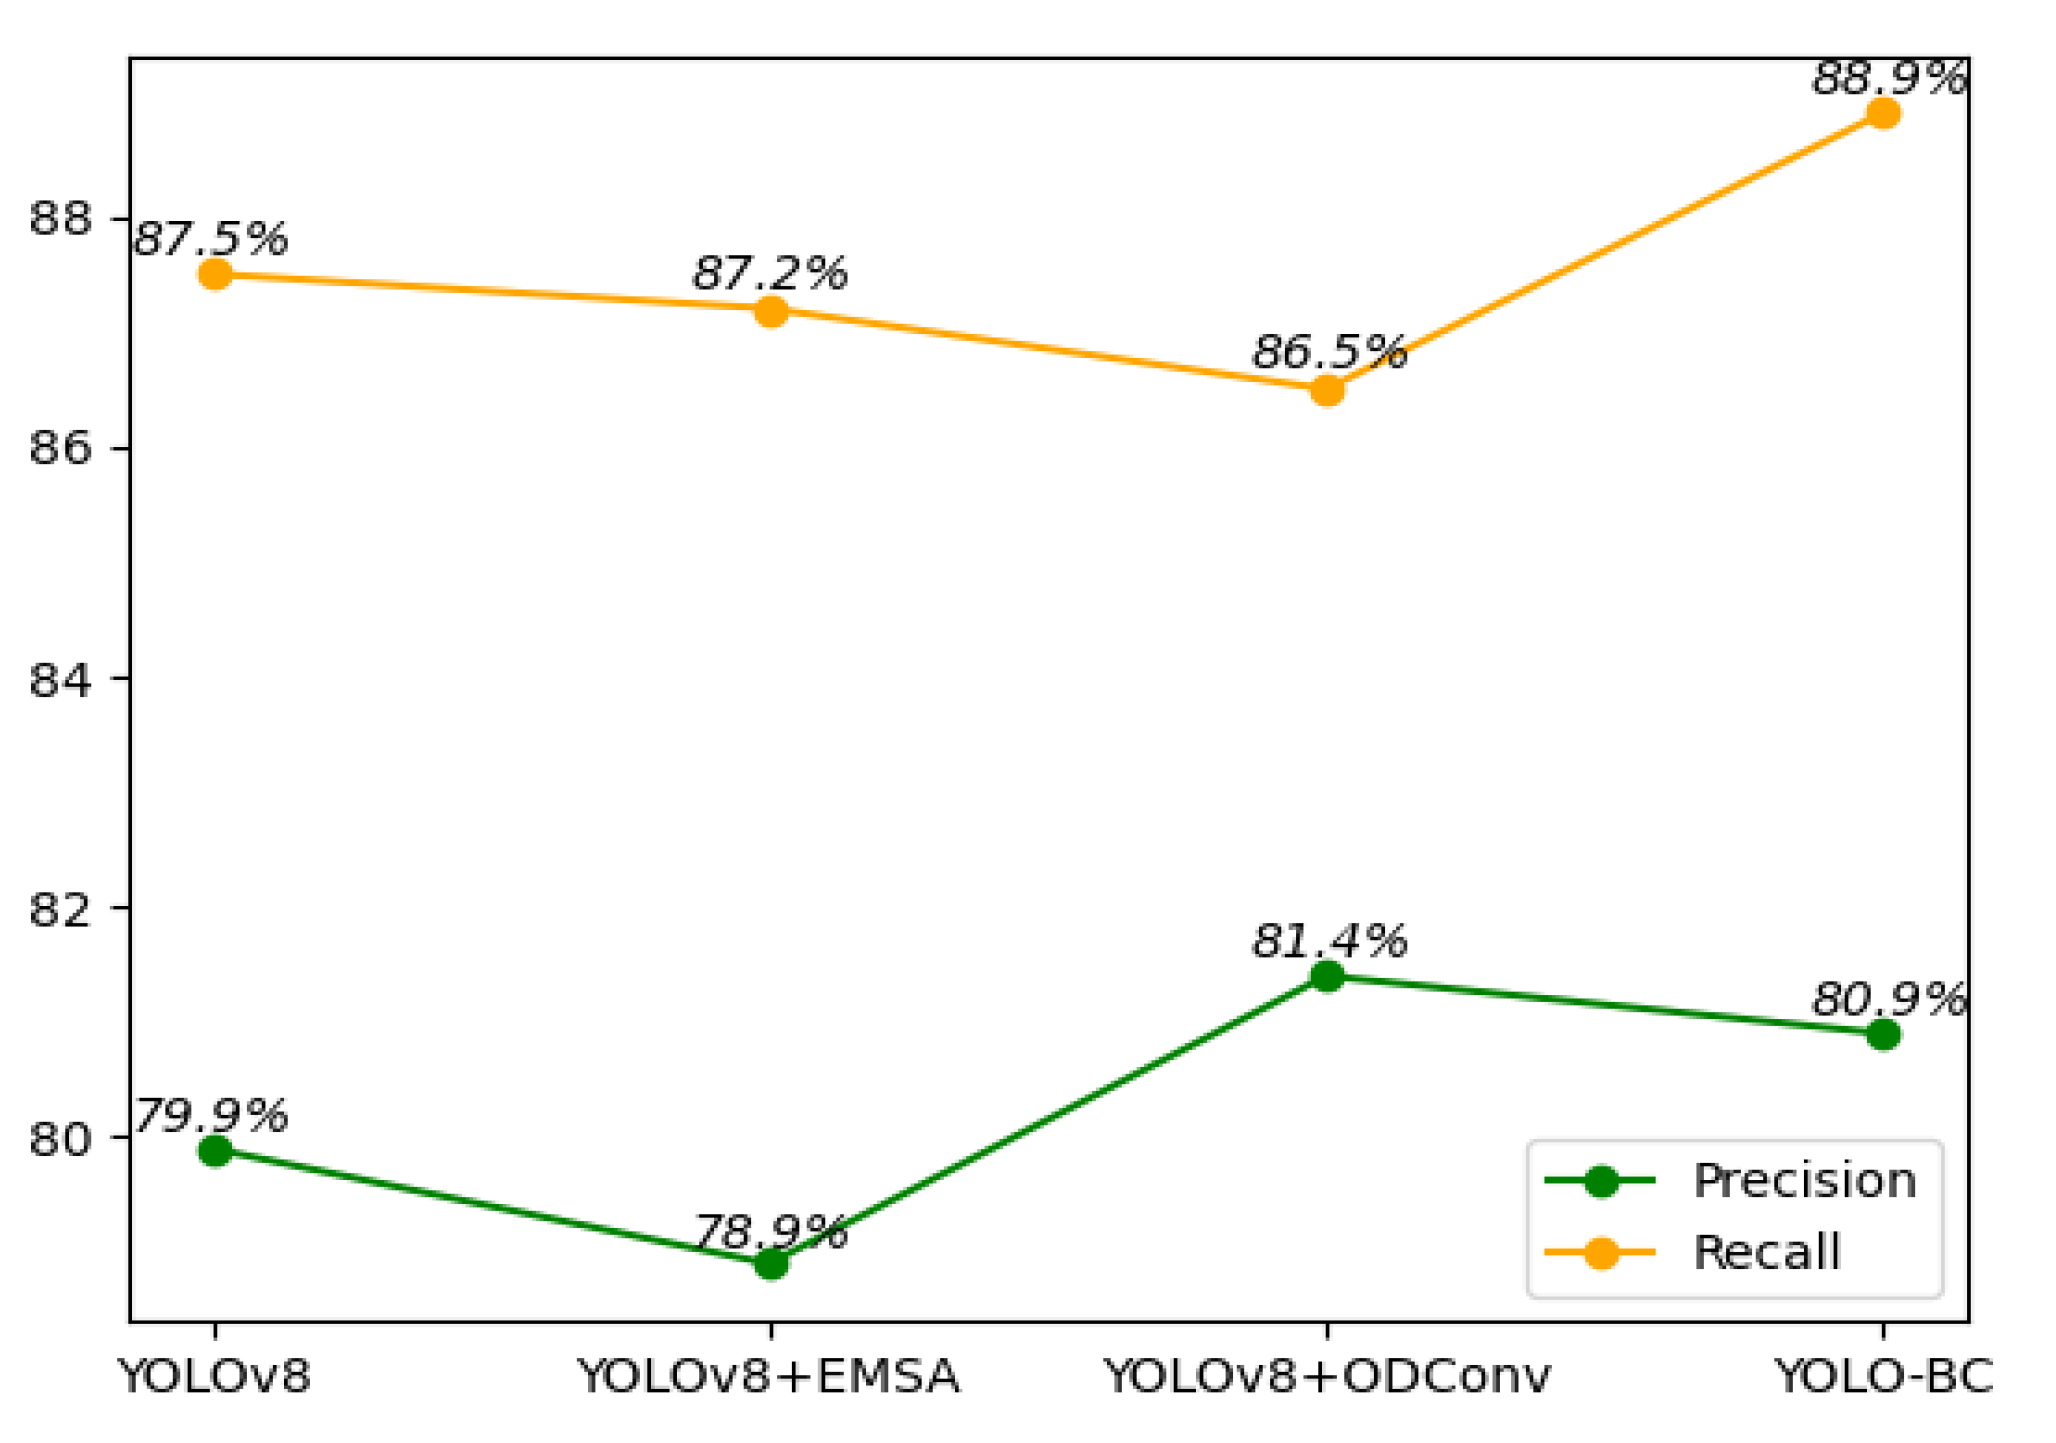
Table 1). From the Precision-Recall comparison (
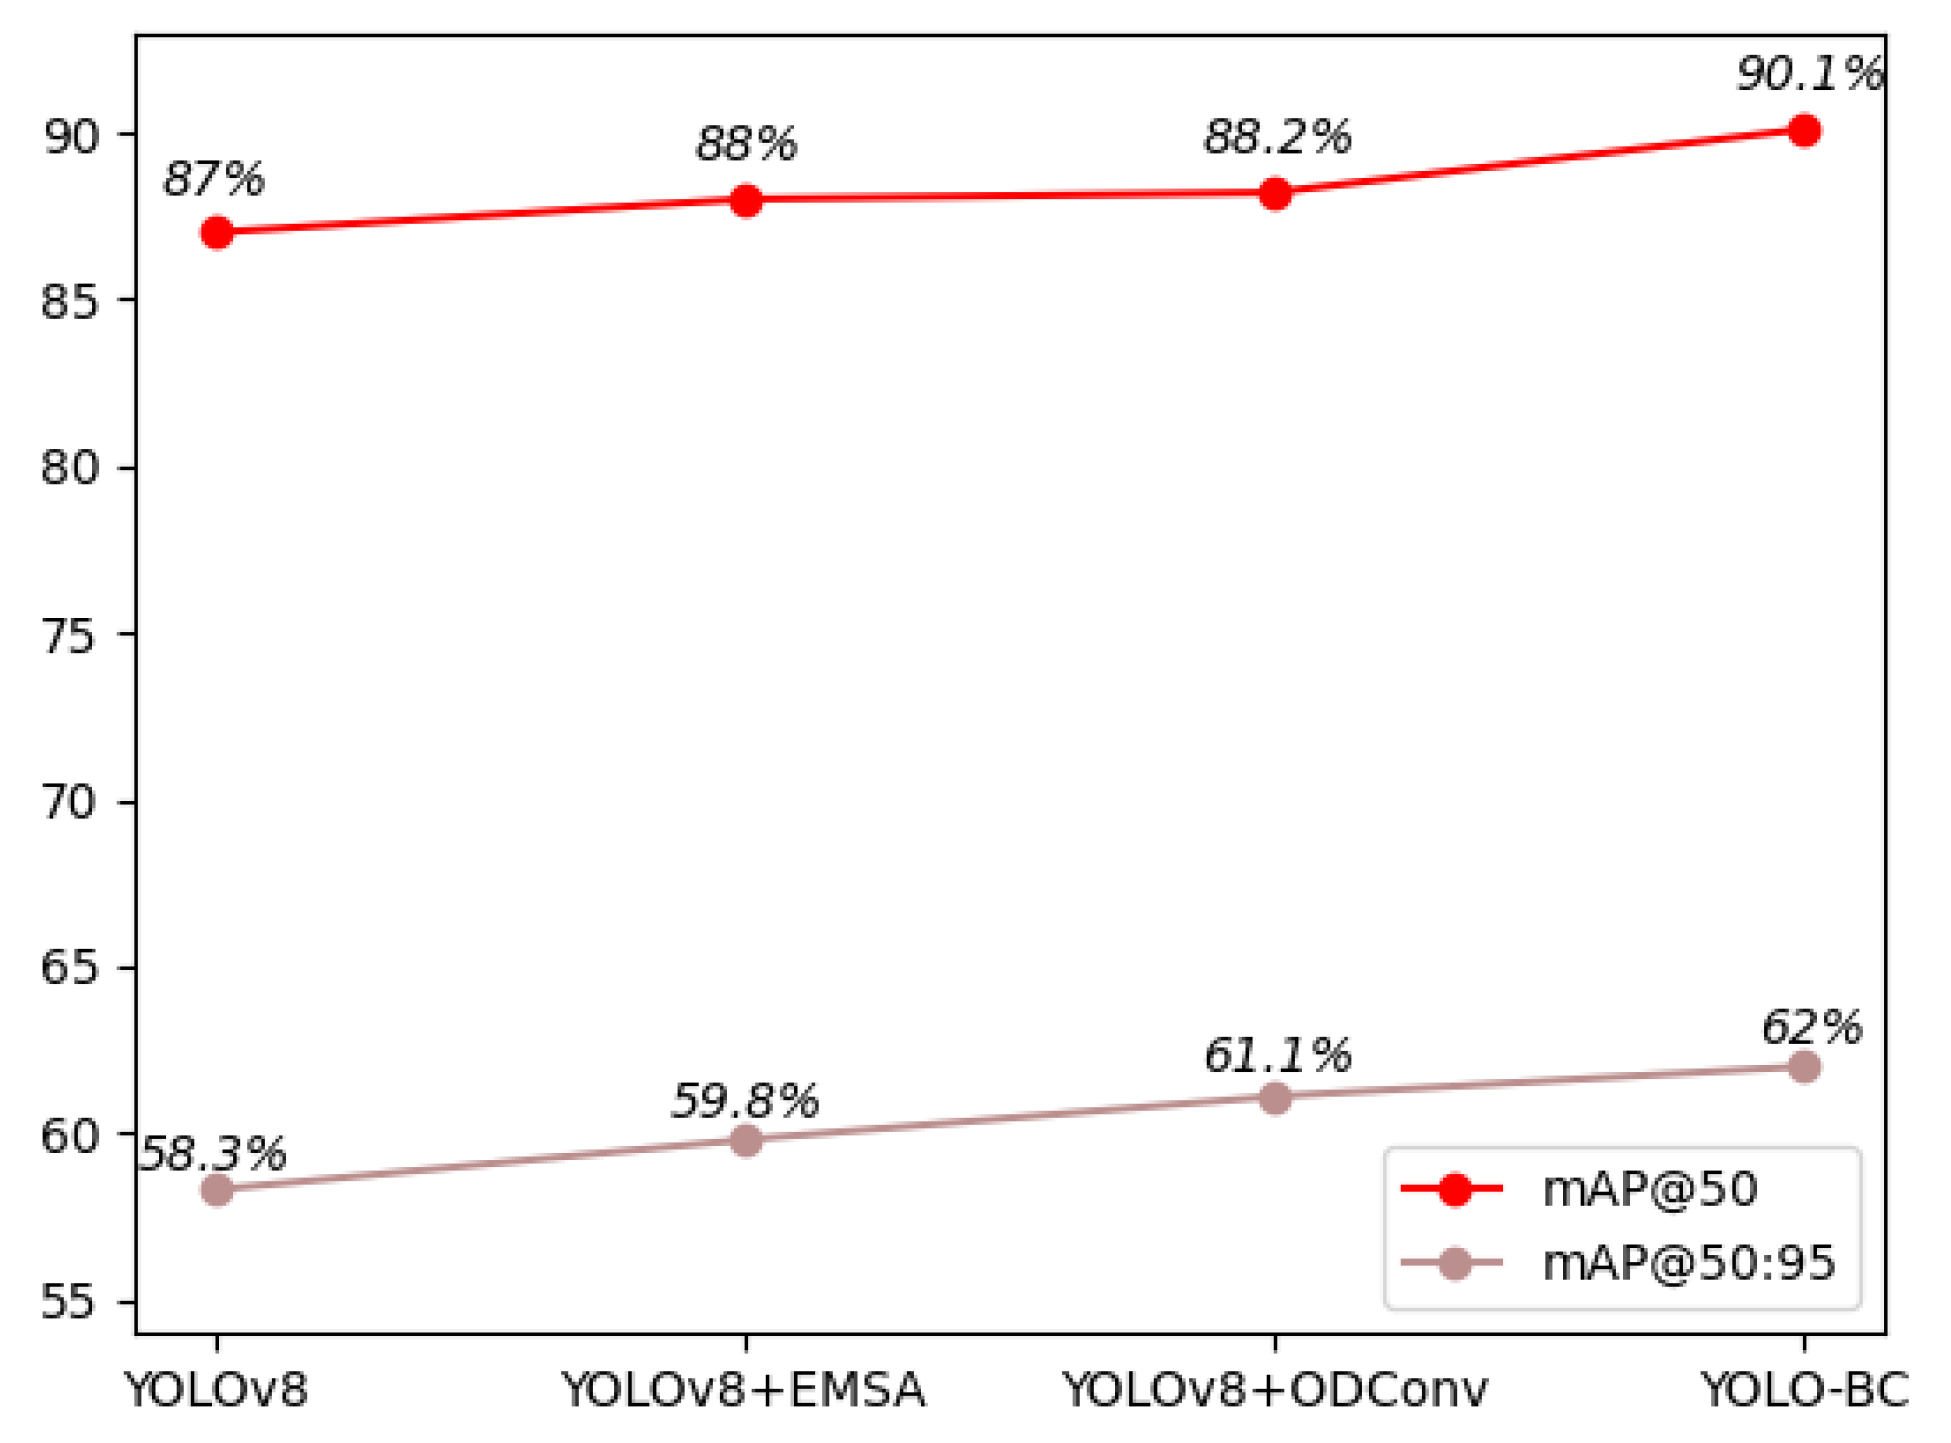
Figure 10), the YOLOv8 + ODConv model performs slightly better in Precision, while YOLOv8 + EMSA exhibits a marginally lower Recall. When assessing the mean Average Precision (mAP), which serves as the primary evaluation metric for blood cell object detection, the YOLO-BC model surpassed all competing approaches, achieving the highest scores for both mAP@50 and mAP@50:95. The results of ablation studies further validate the contribution of the two key enhancements—EMSA and ODConv. These experiments, as depicted in
Figure 11, underscore the substantial impact of these modifications on the model’s performance, demonstrating their effectiveness in improving detection accuracy.
When compared to the baseline YOLOv8 model, the integration of the EMSA and ODConv modules has resulted in a substantial enhancement in the core performance metric, mAP@50. Specifically, the improvements are evident across various blood cell types. For platelets, the mAP@50 has increased from 0.855 to 0.873, while the mAP for Red Blood Cells (RBCs) has risen from 0.782 to 0.834. Additionally, the mAP for White Blood Cells (WBCs) has seen a remarkable increase from 0.974 to 0.994 (as shown in
Figure 12). Consequently, the final YOLO-BC model achieves a mAP@50 of 0.901, an increase from the original 0.87 achieved by YOLOv8, demonstrating a significant improvement in detection accuracy. These enhancements highlight the effectiveness of the EMSA and ODConv modules in refining the model’s ability to capture and classify different blood cell types with higher precision.
Subsequently, this study employes the RMSE metric to perform a statistical analysis of the counting errors for each blood cell type. The YOLO-BC demonstrates a significantly lower RMSE for RBC compared to the baseline, indicating improved performance in RBC count prediction. The RMSE values are 10.91 and 12.04 for the final and baseline models, respectively, with a difference of approximately 1.13. This reduction suggests that the final model enhances RBC prediction accuracy, contributing to a significant improvement in overall performance, especially in tasks where RBC counting is crucial.
And RMSE for WBC shows no difference between the final and baseline models, both having a value of 0.17. Given the small RMSE, both models exhibit high accuracy in predicting WBC counts, and the prediction error has negligible impact on overall model performance. Finally, The RMSE for Platelets prediction is reduced from 0.83 in the baseline model to 0.73 in the YOLO-BC, indicating a slight improvement in the final model’s platelet prediction accuracy. Though the difference is modest, it represents a step forward in prediction performance for this category.
The final model’s total RMSE is about 1.14 lower than that of the baseline, indicating a notable improvement in overall prediction accuracy. This improvement is primarily driven by the reduction in RBC RMSE, which has a significant contribution to the total error. The YOLO-BC’s optimization in RBC prediction notably enhances the overall performance.
4.4. Comparison Experiment
In order to further improve the superiority of the YOLO-BC model, this study selected different versions of mainstream object detection models, including SSD [
33,
34], Faster-RCNN [
35,
36], YOLOv5 [
37,
38,
39], RT-DETR [
40], GroundingDINO [
41], for comparative experiments. The results are shown in
Table 2, where the dataset splits, input resolution, and training epochs used for all models are the same.
As is shown in
Table 2, YOLO-BC achieves the highest F1 score (85%) and mAP@50 (90.1%), which indicates a better overall performance in blood cell object detection in all.
Furthermore, it has the highest precision (80.9%) and recall (89%) among all the models, which demonstrates its excellent ability to both detect and identify objects accurately. The GFLOPs of YOLO-BC (8.3) are nearly identical to that of YOLOv8 (8.1), yet it outperforms YOLOv8 with a 3.1% improvement in mAP@0.5. This shows that YOLO-BC significantly enhances object detection accuracy by incorporating innovative modules such as EMSA and ODConv, while the computational cost remains almost unchanged.
4.5. Visualization
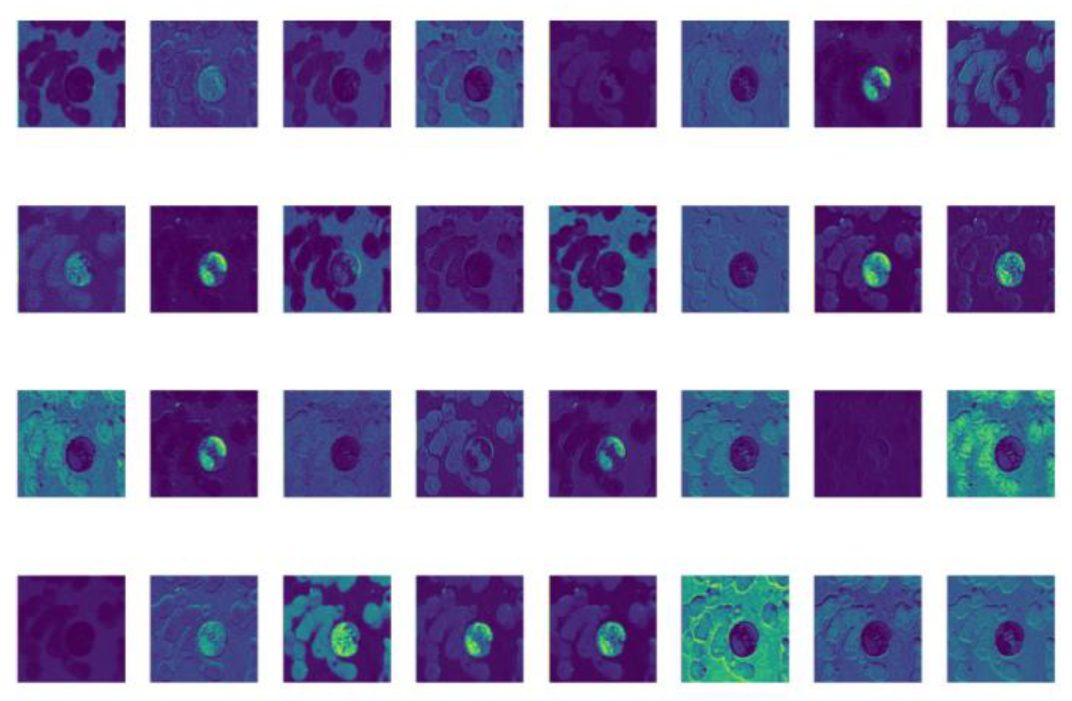
After completing the ablation experiment and comparison experiment, the feature map visualization [
42,
43] is conducted on YOLO-BC detection for blood cells. And the feature map visualization refers to the visual display of the intermediate layer feature map of the neural network [
44] during the inference process, so as to better understand the working principle of the model and the learned features.
As shown in
Figure 13, YOLO-BC effectively extracts the pixel-level features of various types of blood cells and clearly delineates the contours of different blood cell categories. However, YOLO-BC still requires further processing of these features to accurately detect and classify the blood cells. By leveraging a multi-layer neural network architecture, YOLO-BC is able to thoroughly learn and capture the intricate pixel characteristics of blood cells, thereby improving detection and classification performance.
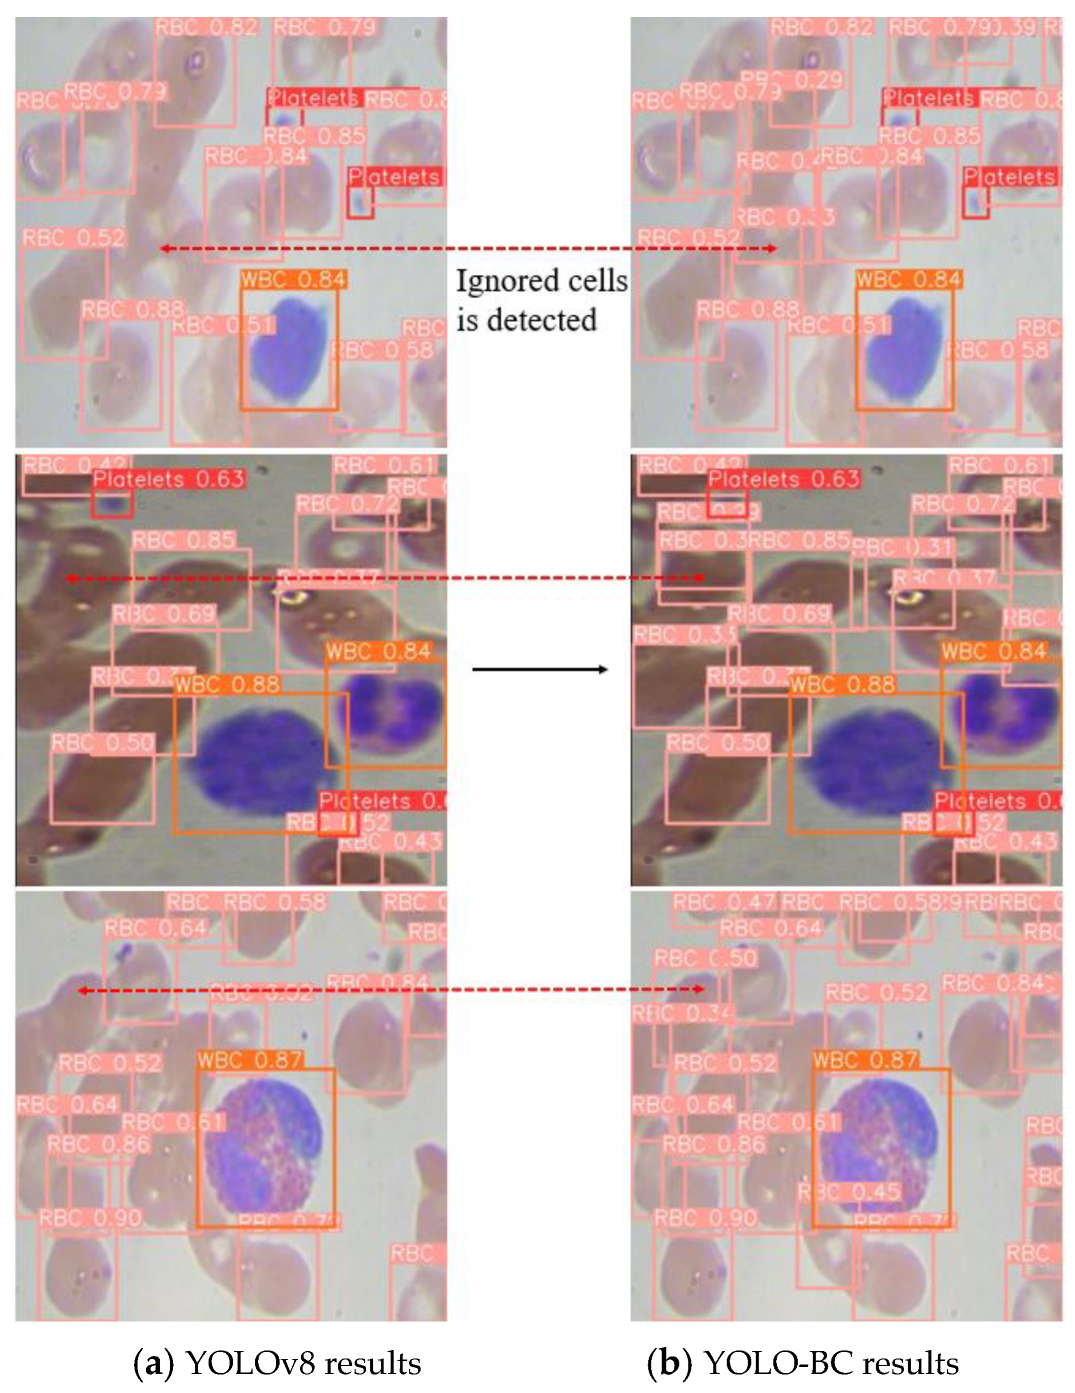
To provide a more intuitive evaluation of the proposed algorithm’s performance, we present the detection results of both YOLOv8 and YOLO-BC on the test dataset (
Figure 14).
It is evident that YOLOv8 demonstrates lower confidence when detecting RBCs in the same region, leading to a significant degradation in RBC counting accuracy, particularly at the positions marked by the dotted lines at both ends (
Figure 14). In contrast, the improved YOLO-BC model achieves precise detection and accurate counting of the same blood cell targets. This clearly demonstrates that YOLO-BC is more effective at localizing and recognizing blood cells with higher precision.
Taking into account the practical requirements of medical professionals for blood cell diagnostics, the YOLO-BC algorithm provides the flexibility to tailor its functionality to specific needs. For instance, in cases where only the detection and quantification of red blood cells (RBCs) is necessary for diagnosing conditions related to RBC abnormalities [
45,
46,
47], the algorithm allows users to adjust the category label to exclusively detect and count RBCs, as shown in
Figure 15. This customization feature enables medical personnel to concentrate solely on the blood cell type of interest, minimizing visual distractions that may arise from the simultaneous detection of other cell types. Consequently, this targeted detection capability enhances the efficiency of the diagnostic process by streamlining the focus on relevant cellular features.
And it is noteworthy that YOLO-BC can also detect small targets such as platelets more accurately, indicating that the model has certain scalability in general cell diagnosis and has the potential to detect small objects in microfluidic images.
4.6. The 5-Fold Cross Validation
To eliminate the impact of data imbalance and bias from small dataset partitioning on result evaluation, we employe 5-fold cross-validation during the training process, as shown in the
Table 3. It can be observed that the weight averaging performance obtained through 5-fold cross-validation is no weaker than the YOLO-BC model built in the previous sections, especially in the core indicator mAP.
At the same time, this also eliminates the risk of model overfitting, when YOLO-BC is applied to more blood cell detection scenarios.
4.7. Generalization Validation
To validate the generalization and robustness of the proposed YOLO-BC model, this study selects the BCDv4 (blood cell detection version4) dataset from Roboflow AI platform, for further experimentation.
In the ablation experiment conducted on the new BCDv4 testing dataset, the YOLO-BC model proves notable advantages after improvements, as is shown in
Table 4. YOLO-BC achieves the highest performance with a Precision of 92.7%, Recall of 90.6%, and a mAP@50 of 0.939, surpassing all other models in terms of both mAP@50 and overall detection accuracy. It also strikes an optimal balance between computational efficiency and performance, with 3,062,116 parameters and 8.0 GFLOPs, offering a competitive FPS of 6.48.
Then, in the comparison experiments on the BCDv4 dataset, the YOLO-BC model proves clear superiority in terms of both detection accuracy and computational efficiency. As is shown in
Table 5, the YOLO-BC achieves a Precision of 92.7%, Recall of 90.6%, and a mAP@0.5 of 0.939, outperforming other models in terms of mAP@0.5 while maintaining a low computational cost with only 8.0 GFLOPs. With fewer GFLOPs, YOLO-BC provides a competitive FPS of 6.48, significantly outperforming more computationally expensive models like Faster-RCNN (134.0 GFLOPs) and RT-DETR (103.4 GFLOPs) in terms of real-time performance.
While models such as YOLOv5 and YOLOv8 provide strong performance with high precision, YOLO-BC stands out with a balanced trade-off of accuracy and efficiency, surpassing YOLOv8 baseline in both mAP@0.5 and FPS. The model’s efficiency with fewer GFLOPs and higher FPS, positions YOLO-BC as a good choice for real-time, high-performance applications in medical imaging fields.
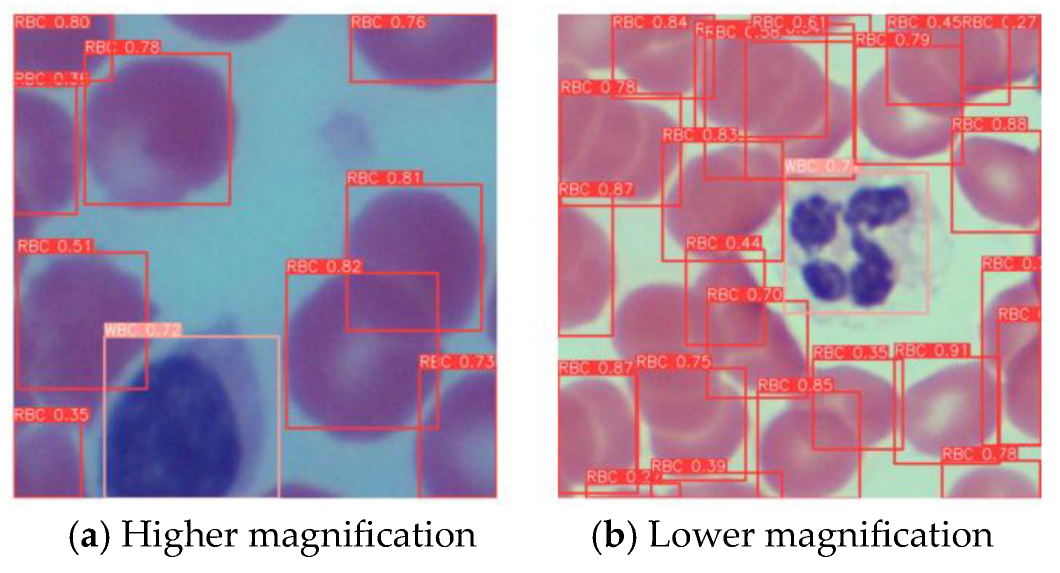
As shown in the
Figure 16, with different microscope magnification settings, YOLO-BC can still stably detect blood cells and distinguish their types.
4.8. Deployment on Edge Computing Device
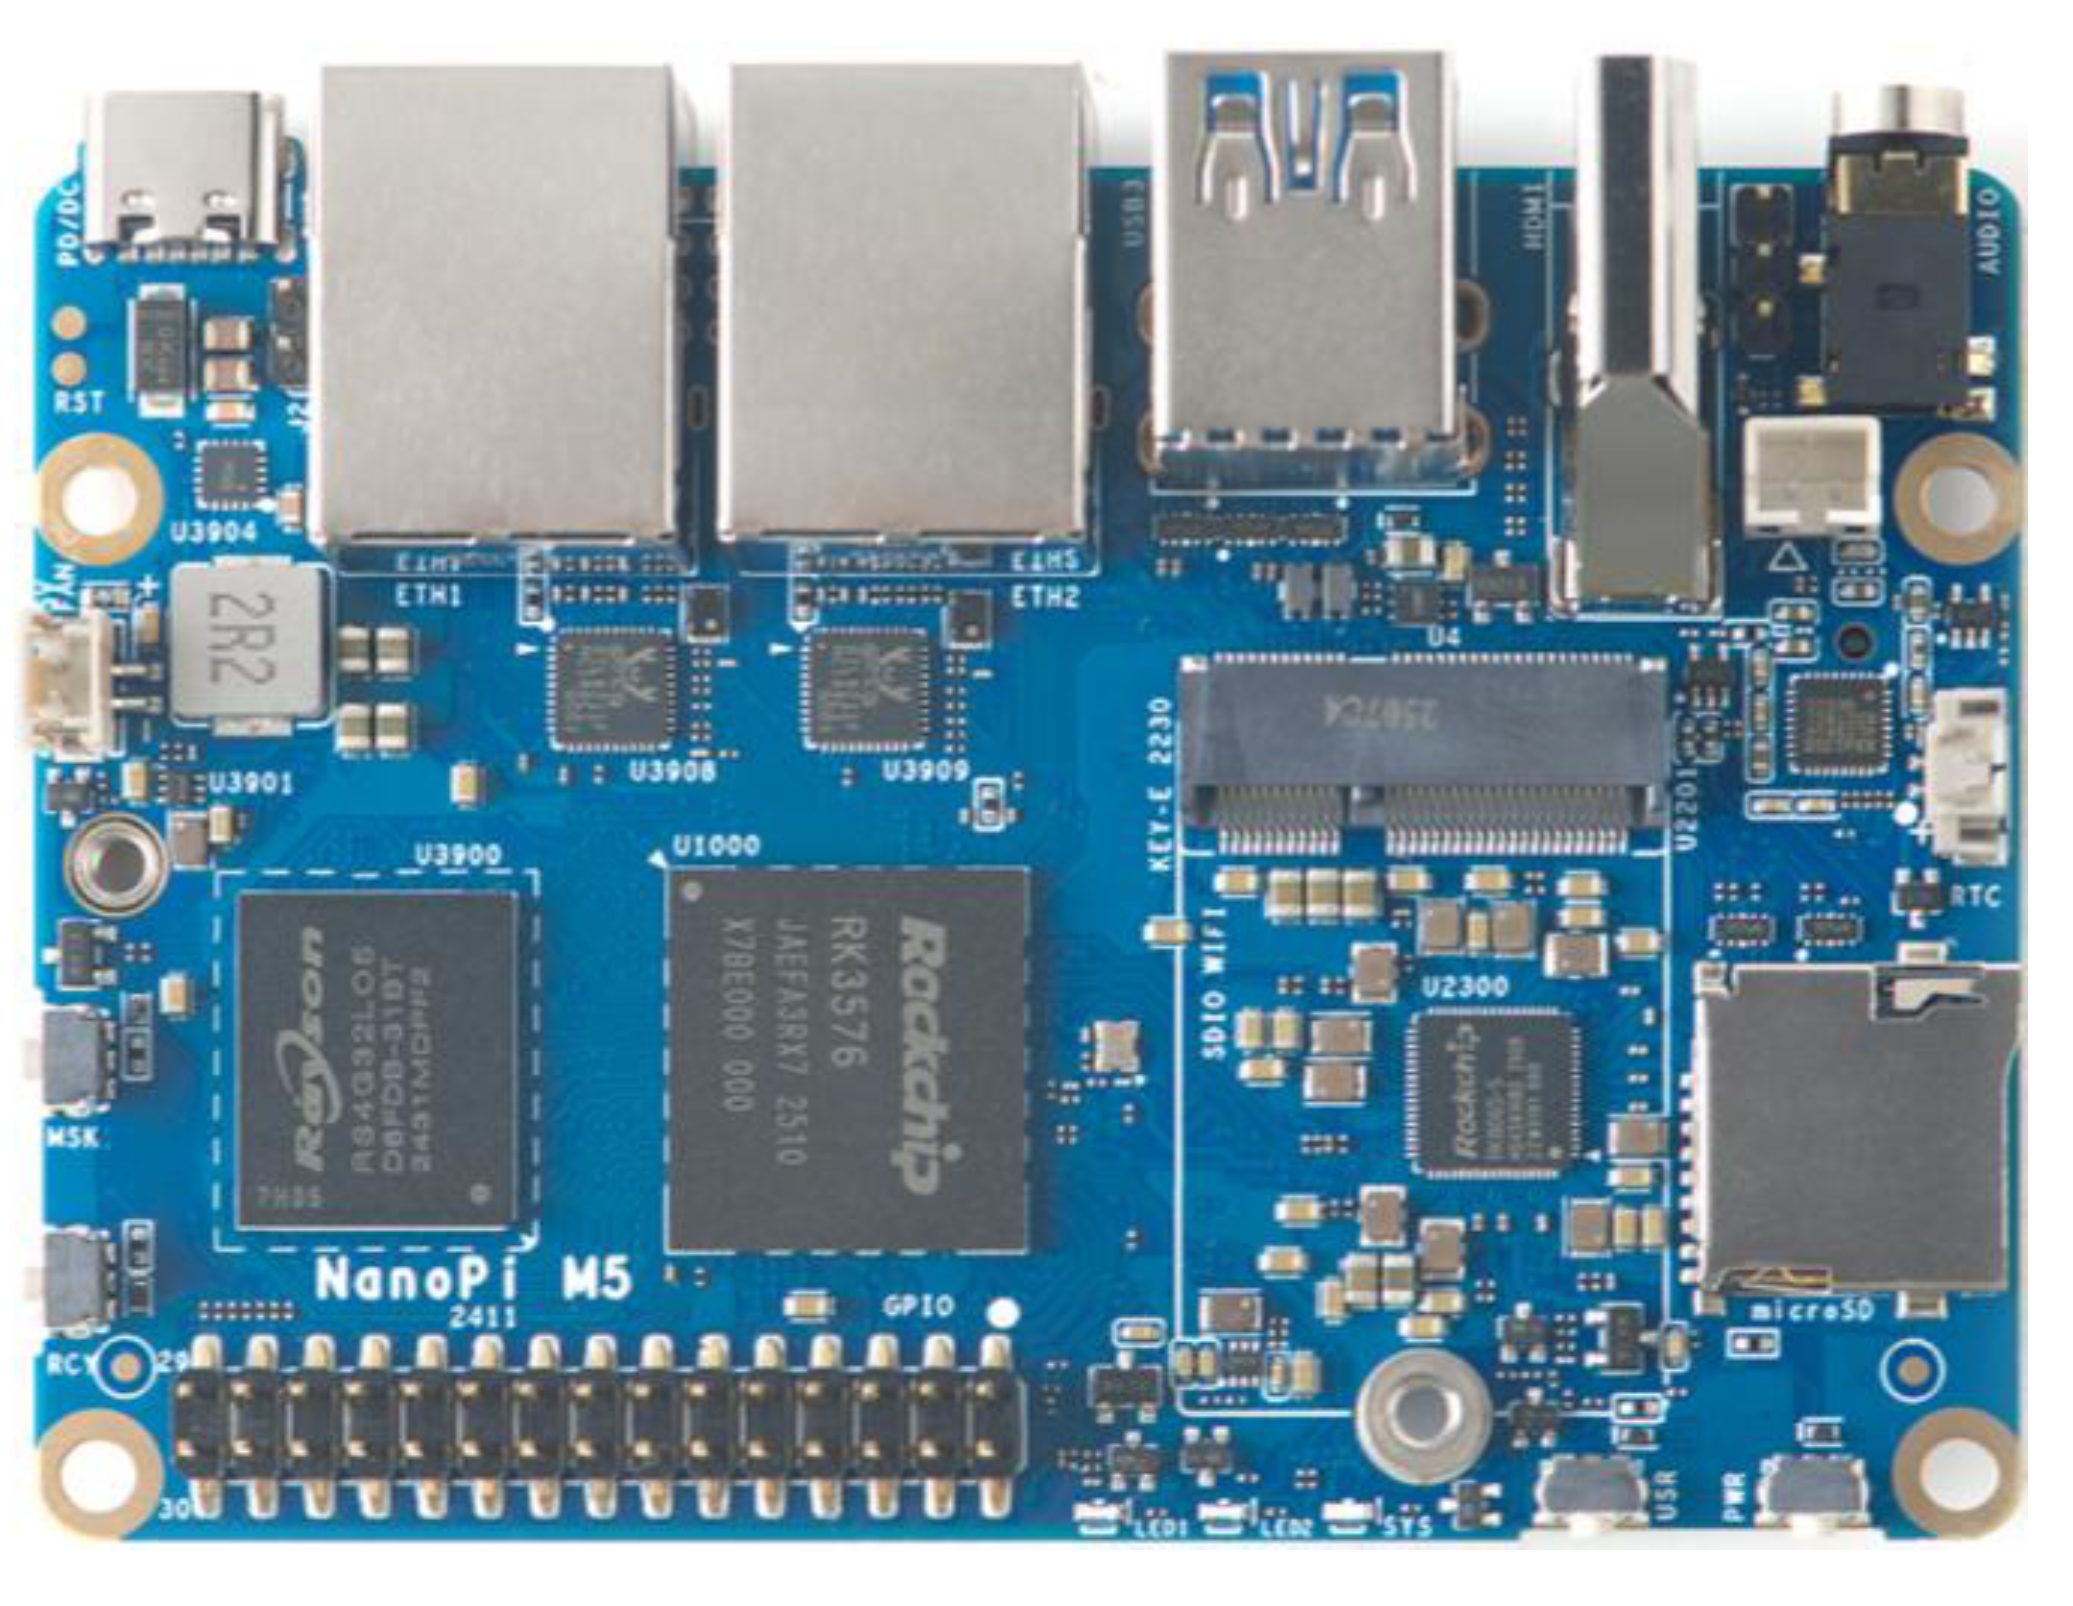
Considering practical clinical applications, this study selects the RK3576 edge device produced by Rockchip for deploying the YOLO-BC model. The RK3576 supports an octa-core CPU (4× Cortex-A72 + 4× Cortex-A53), a 6TOPS NPU (Neural Processing Unit) for AI computations, and a Mali-G52 MC3 GPU, making it capable of handling AI-intensive and graphics-intensive applications. And we use the NanoPi M5 edge computing device with RK3576 chip, for the whole deployment, as is shown in
Figure 17.
The experimental results show an average inference time of 35.658 ms, with a total memory usage of only 12.28 MB. These findings indicate that the lightweight YOLO-BC exhibits significant lightweight advantages, showcasing its potential for deployment on various small-scale medical devices for blood cell detection. With the low price of the RKNN-3576 hardware, it further facilitates the broader adoption and practical application of the YOLO-BC model in clinical diagnostics.
5. Conclusions
In this work, we present an enhanced method for blood cell image detection and counting, referred to as YOLO-BC, which is built upon the YOLOv8 architecture. To improve feature representation, we use the EMSA module prior to the bottleneck layer of the backbone, enabling the model to better capture spatial relationships between features across different regions of the image. Furthermore, we replace the P3/8 pixel convolutional module with the ODConv module, strategically enhancing the model’s ability to leverage multi-dimensional contextual information for more robust feature extraction. Experimental results indicate that the revised architecture leads to a substantial enhancement in detection performance, achieving a mean Average Precision of 0.901 at an Intersection over Union (IoU) threshold of 50% (mAP@50), and a mAP of 0.62 across a range of IoU thresholds (mAP@50:95). These outcomes confirm the efficacy of the proposed approach in improving the precision of blood cell detection.
YOLO-BC effectively resolves pixel-level discrepancies between three blood cell categories, surpassing the constraints of conventional counting techniques. Through the integration of the EMSA and ODConv submodules, the model addresses prevalent issues such as missed detections, false positives, and redundant counting, especially in intricate scenarios. These advancements considerably improve the model’s accuracy and reliability, particularly in blood cell detection and quantification tasks on scenarios, enhancing its overall robustness.
By comparing SSD, Faster R-CNN, YOLOv5, YOLOv8, RT-DETR, and Ground DIDO, YOLO-BC achieves the highest F1 score (85%) and mAP@50 (90.1%), demonstrating superior overall performance in object detection. Furthermore, it exhibits the highest precision (80.9%) and recall (89%) among all the models, highlighting its exceptional capability in both detecting and accurately identifying objects. Then, a 5-fold cross-validation is condacuted, thereby eliminating the risk of overfitting and bias from small dataset partitioning. The validation on the subsequent BCDv4 dataset also demonstrates the generalization ability of YOLO-BC. Therefore, YOLO-BC offers significant advantages in terms of accuracy compared to other widely used models, positioning it as a promising choice for object detection applications.
Finally, deployment experiments on the RK3576 edge computing device proves that YOLO-BC achieves a inference speed at the millimeter scale for single blood cell image, while utilizing only approximately 12 MB of memory. Its low computational cost makes it highly favorable for real-time hospital workflow integration. In future work, data augmentation methods [
48,
49,
50], implementation of lightweight models [
51,
52], and fine-tuning of the model will be pursued. Data augmentation can improve the shortcomings of incomplete coverage of scenes with a small number of samples, and the lighter YOLO-BC model will have faster inference speed, greatly speeding up the diagnosis of blood cells by medical workers, and is also convenient for deployment on some portable medical devices.
