Abstract
Hepatitis C virus (HCV) remains a critical public health concern globally, including in Bangladesh. In this study, we employed a mathematical modeling framework to analyze the national dynamics of HCV infections and associated mortality in Bangladesh. Utilizing surveillance data from the Directorate General of Health Services, we examined the epidemiological trajectory of HCV and assessed the impact of various intervention strategies. The Next Generation Matrix approach was employed to derive basic reproduction numbers, and the model was calibrated with observed HCV incidence data to estimate some model parameter values. We conducted sensitivity analysis to assess how variations in model parameters affect HCV prevalence, revealing that transmission rates of both drug-susceptible and drug-resistant strains have the greatest impact. Additionally, bifurcation analysis was performed to examine parameter thresholds and assess the stability of the system. We then used the model to estimate the impacts of various intervention policies on reducing HCV cases and deaths. Among single interventions, increased effective treatment for drug-susceptible cases proved to be the most rapid and effective strategy for reducing the total number of both drug-susceptible and drug-resistant HCV cases, as well as mortality. Additionally, our results imply that combining interventions increases their overall effectiveness, achieving substantial reductions in cases and deaths with relatively modest investment. However, complete eradication of HCV in Bangladesh would require significantly greater resources.
Keywords:
Hepatitis C virus; mathematical modeling; sensitivity and bifurcation analysis; interventions; Bangladesh MSC:
34Do6; 65L07; 93B45
1. Introduction
Hepatitis C virus (HCV) infection is a major global public health concern and a significant cause of death, morbidity, and indirect economic loss. HCV is a bloodborne pathogen that, if left untreated, can lead to advanced liver diseases, including cirrhosis, hepatocellular carcinoma (HCC), and liver failure [1]. People who inject drugs (PWID) are among the highest-risk group for HCV infection and represent an important target for prevention efforts [1]. Globally, HCC accounts for 75–85% of primary liver cancer, while intrahepatic cholangiocarcinoma (ICC) accounts for 10–15% [2]. HCV is responsible for more than 350,000 deaths annually and contributes to approximately 25% of HCC and 27% of cirrhosis cases worldwide [3]. Notably, men experience two- to threefold higher incidence and mortality rates compared with women [4].
The Asia-Pacific region has the highest HCV prevalence and contributes disproportionately to liver cancer-related mortality worldwide [5,6,7]. In Bangladesh, HCV is responsible for 30% of cirrhosis cases and 17% of HCC cases, with incidence increasing particularly in urban populations such as Dhaka [8]. Transmission of HCV in Bangladesh is primarily associated with unsafe medical practices, intravenous injections, the work of barbers, and the piercing of bodies [9]. More than 70% of reported HCV cases occur in men, with most chronic infections affecting individuals aged 30–50 years [10]. HCC is the third most important cause of cancer-induced mortality in Bangladesh, accounting for more than 20,000 deaths annually [11].
HCV genetic diversity poses a major challenge for vaccine and therapeutic development, as circulating genotypes vary geographically. Globally, genotypes 1, 2, and 3 are most prevalent [12,13,14,15,16]. Although direct-acting antivirals (DAAs) have revolutionized treatment and achieve sustained virologic response in more than 90% of patients, access in Bangladesh remains largely restricted to the private sector due to inadequate health insurance coverage [13,17]. The World Health Organization (WHO) has set ambitious goals to reduce HCV-related mortality by 65% and an 80% reduction in prevalence by 2030. Achieving these targets requires coordinated efforts in both treatment and prevention [17].
Chronic HCV infection is the consequence of failure of the host adaptive immune response to eradicate the virus, leading to T cell dysfunction, impaired cytokine production, and apoptosis of virus-specific immune cells [18,19,20,21,22,23,24,25,26,27]. While antiviral treatments, including interferon-based regimens and DAAs, can achieve long-term virologic response, the absence of an effective vaccine underscores the importance of harm-reduction strategies to prevent transmission [28,29,30].
Mathematical modeling has become an essential tool for understanding HCV transmission dynamics, predicting disease spread, evaluating intervention strategies, and guiding public health policy [31,32,33,34,35,36]. Modeling has been used to simulate HCV evolution, assess treatment outcome, and evaluate vaccination and harm-reduction policy, thereby optimizing control strategies [35,37,38,39,40]. They allow policymakers to assess the effectiveness and cost-effectiveness of screening, treatment scale-up, and harm-reduction programs while also identifying optimal strategies for high-risk groups such as PWID [41]. Importantly, modeling supports global elimination goals by projecting the impact of interventions needed to achieve the WHO’s 2030 targets. In addition, it provides a safe and cost-effective platform for scenario testing, guiding resource allocation, and optimizing treatment regimens to minimize resistance and relapse.
In this study, we develop a mathematical model to analyze HCV transmission dynamics and evaluate the potential effect of vaccination and antiviral treatment in Bangladesh. The model aims to inform strategies for inhibiting viral replication, minimizing infection-related complications, and informing evidence-based interventions to control HCV at the national level.
2. Methods and Materials
We adapted a previously published two-strain HCV transmission dynamic model [42], which incorporates both drug-susceptible and drug-resistant infections, and extended it to include a double-dose vaccination strategy. The model consists of the following compartments: susceptible individuals, , who are healthy but at risk of infection; infected individuals with drug-susceptible HCV, , representing those initially infected and actively transmitting the drug-sensitive strain; infected individuals with drug-resistant HCV, , who are at higher risk of treatment failure and contribute to the persistence of resistant strains; and recovered individuals, , who have cleared the infection either through treatment or natural recovery. Further, the people who obtained the first dose of the vaccine, termed V1(t), remain susceptible to the sickness, whereas the people who received the second round of vaccination, labeled V2(t), are no longer at risk of getting sick (see Figure 1). However, in our model, we considered the total population size to be constant and homogeneously mixed. As a result, each person in a compartment has the same infectiousness, disease susceptibility, and frequency of transmission as every other person. This ignores the social behaviors of children and older adults, which are known to be significant risk factors in the spread of HCV.
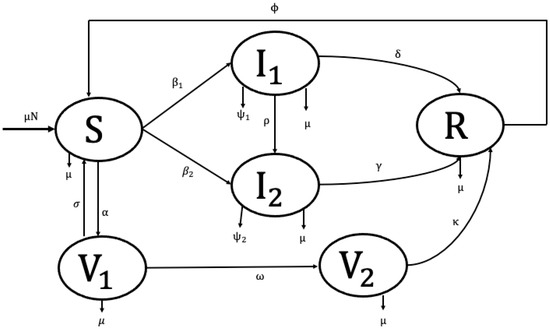
Figure 1.
Model for Hepatitis C distribution and immunization.
The arbitrary per capita rate, , represents the natural birth and mortality processes occurring in each compartment. Transitions from the susceptible class to the drug-susceptible strain occur at a constant rate . In addition, individuals move from the susceptible class to the drug-resistant strain at constant rates . The drug-susceptible infected population also moves to the drug-resistant infected compartment at a rate , representing the acquisition of resistance. Biologically, this reflects the process whereby an individual initially classified as drug-susceptible develops resistance during treatment or follow-up, which constitutes the primary pathway through which drug resistance emerges within the population. The drug-susceptible and drug-resistant infected population experience disease-related death at rates of and respectively. The drug-susceptible and drug-resistant infected populations () and () move to the recovered compartment due to the treatment/recovery at constant rates of and , respectively. Individuals receive their first vaccine dose () at rate, progress to the second dose () at rate , and may revert from the first-dose class () to the susceptible class () at rate . The second dose vaccinated people move to the recovery compartment at a rate . The recovery people move to the susceptible compartment at a rate due to the rate of loss of immunity.
Here, according to the proposed model, we have the following nonlinear ODEs:
and
With the following positive initial conditions:
The positivity and boundedness of the solution (for all ) of the proposed model (1)–(6) with the initial conditions (8) can be easily performed.
3. Model Analysis
3.1. Positivity and Boundness Analysis
Positive Invariance
Here, we investigate the nonnegative condition of the dynamic variable for all . To demonstrate the nonnegativity, we assert the following theorem.
Theorem 1.
If the solution set of the proposed model satisfy the condition and subject to the initial condition (8) for all
, then the model (1)–(6) is positive invariant and attracting within .
Proof.
We choose the first equation (1) of our proposed model which can be written as follows:
where .
Integrating (9), we get the following expression:
Hence the proof. □
3.2. Positive Invariance for All Variables
Here, we perform positive invariances for all variables. From the second equation of our model, we obtain the following:
Solving the above equation, we obtain the following expression:
Which reveals that is non-negative for all , where is the initial value (at ). Similarly, we can deduce that the solution trajectories for the rest of the dynamic variables of the system remain positive for all and they are as follows:
3.2.1. Boundedness
In this section, we analyze models (1)–(6) to determine the biologically feasible solution set. The following theorem assures that the solutions of the system are bounded in the set with the non-negative conditions.
Theorem 2.
The feasible solution set of the system (1)–(6), subjected to the initial conditions (8), which initiate in are uniformly bounded in ,
where is the positively invariant region.
Proof.
Using the non-negative initial conditions of (8) in the system (1)–(6), it is observed that each of the dynamical variables remains non-negative (Theorem 1). So, adding each of the equations of the system (1)–(6), we obtain the total population size, which satisfies in the absence of death case owing to drug-susceptible and drug-resistant HCV individuals [41], then we get the following:
Integrating the above equation, we have the following:
Accordingly, given the assumption of a constant total population size, it follows that all feasible solutions of the dynamical variables —are bounded within a positively invariant region. □
3.2.2. Disease Free Equilibrium and Basic Reproduction Number
This section identifies the disease-free equilibrium (DFE) points of our proposed model (1)–(6). The disease-free equilibrium occurs when the basic reproduction numbers are less than 1, and the infection dies out.
To find the DFE from our proposed model (1)–(6), we assume that the disease compartments are zero, i.e., I1 = I2 = 0. This implies that the other compartments (S, V1, V2) are not infected by the disease. So, at the infection-free steady-state I1 = I2 = R = 0. Therefore, the DFE can be written as follows:
The quantity of supplementary occurrences that are expected to result from spreading a single virus among a group of people that is fully susceptible is referred to as the model’s basic reproduction number. More people contract the infection and commence acting consistently anytime the basic rate of reproduction rises above 1. Once more, because reproduction’s fundamental quantity is smaller than one, the overall population that contains contaminated individuals is generally likely to be zero.
The model is made up of four uninfected cases and along with two infected states and. In this situation, the model consists of six unique states, even though the total population remains unchanged. At the free steady diseases, we have and . Therefore, do not convey the concept alongside state variables ().
We have the following system:
Our framework ODE (10) and (11) serves as the subsystem for infections. It solely specifies the generation of new infections and adjustments to the status of existing infections. Let be defined as , with T indicating the transpose. We now aim to represent the subsystem in the following manner:
The matrix F denotes the transmission matrix, while V signifies the transition matrix. We derived these two matrices from Equations (10) and (11) by differentiating the transmission events from one another’s process. When we label the affected states with indices and belong to the set , the rate at which a specific state j produces individuals in the infected state i of the system, we obtain the following:
Then, the inverse of is as follows:
The largest eigenvalues of the matrix are the basic reproduction numbers. The basic reproduction numbers are as follows:
and
The basic reproduction number refers to the expected number of secondary cases generated by a single infected individual in a population that is entirely susceptible. When both basic reproduction numbers and are greater than one, each case leads to more than one new infection, allowing the disease to spread and persist within the population. Conversely, when and are less than one, the number of infected individuals will decline over time, and the disease will eventually die out.
3.2.3. Endemic Equilibrium Points
Here, we evaluate three endemic equilibrium points such as drug-susceptible strain endemic equilibrium, drug-resistant strain endemic equilibrium and co-existent endemic equilibrium points, each of which holds significant implications for our understanding of the system.
For the drug-susceptible endemic equilibrium, we consider the infected compartment (I2) is zero i.e., I2 = R = 0 and I1 ≠ 0. Thus, the mathematical expression for the drug-susceptible endemic equilibrium is given bellow:
For the drug-resistant strain endemic equilibrium, we consider the primary infected compartment (I1) is zero i.e., I1 = R = 0 and I2 ≠ 0. Thus, the mathematical expression for the drug-resistant strain endemic equilibrium is given bellow:
For the co-existent endemic equilibrium, we consider all disease dynamic variables to be non-zero, i.e., S* ≠ V1* ≠ V2* ≠ I1* ≠ ≠ I2* ≠ R* ≠ 0. Hence the mathematical expression of the disease–endemic equilibrium point is as follows:
Equation (13) indicates that, when the disease is present and continues to spread within the community, the system attains a disease–endemic equilibrium point is as follows:
4. Results and Discussion
Numerical simulations were carried out in MATLAB programming language version 2021 by formulating the model equations as a system of ODEs and solving them with the built-in solver ode45. Parameter estimation was performed by fitting the model outputs to available epidemiological data using least-squares minimization, and the estimated values were then applied in subsequent analyses. Sensitivity analysis was conducted by varying key parameters to assess their influence on the basic reproduction number and equilibrium levels. Bifurcation analysis is used to explore how the qualitative behavior of our system changes as one or more parameters are varied. Furthermore, scenario analyses were carried out to evaluate the potential effects of alternative intervention strategies, such as changes in vaccination or treatment rates. All computations and visualizations were performed in MATLAB.
4.1. Parameter Estimation
A critical factor influencing the spread of HCV is human-to-human transmission; thus, the transmission rate represents a key parameter for outbreak dynamics. To estimate this and related parameters, we analyzed HCV incidence data in Bangladesh from 2005 to 2015 [42]. Figure 2 illustrates the observed HCV incidence rates (red circle) alongside the model-fitted curve (solid blue line), with a 95% confidence interval (CI) represented by green-shaded boundaries. This graphical representation highlights the close alignment between observed data and the fitted model, providing evidence for the robustness and reliability of the parameter estimation approach.
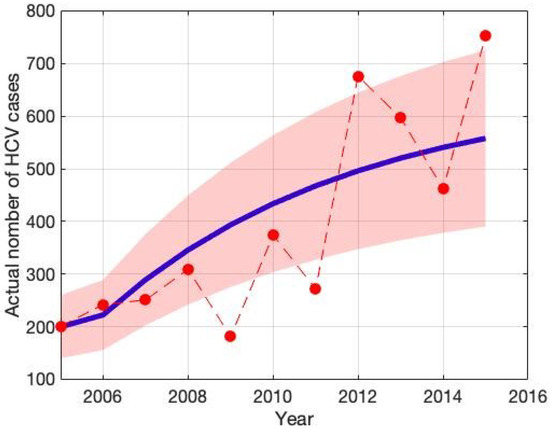
Figure 2.
The red dot indicates hepatitis C (HCV) incidence data in Bangladesh, while the solid blue curve shows the best fit, and the green-shaded area represents the 95% confidence interval (CI).
These parameters were obtained by adapting the model to established instances of infection in Bangladesh in order to guarantee accuracy. As shown in Table 1, the values of the remaining parameters were gathered from reliable literature sources. This all-encompassing method improves the model’s fidelity and makes it possible to make better-informed decisions on public health measures. The least-squares method is used to estimate model parameters. It is defined as , where is the measured number of people who are infected and is the simulation’s remedy that describes the number of contaminated humans over time t employing a parameter estimation set x [41]. Its goal is to minimize the average of squared variances between the actual and anticipated values. We can guarantee reliable parameter estimates and precise modeling of the infection processes in Bangladesh by using this strict methodology.

Table 1.
Illustration and approximation of the model components.
We assume the initial condition for the state variables in the following way: and .
4.2. Sensitivity Analysis
Sensitivity analysis is a critical tool to identify the most influential parameters affecting model outcomes [31]. In this study, we conducted a sensitivity analysis to determine which parameters have the greatest impact on the model outputs. This process highlights the key drivers of infection dynamics and offers valuable insights for effective outbreak control. We employ Latin Hypercube Sampling (LHS), a robust and efficient sampling-based technique, combined with Partial Rank Correlation Coefficient (PRCC) analysis, a global sensitivity method [31]. PRCC specifically assesses the monotonic relationships between input parameters and model outputs by analyzing residuals from linear regression models. This residual-based approach is particularly well-suited for nonlinear systems, allowing for a more reliable evaluation of parameter influence.
Figure 3 and Figure 4 present the results of the sensitivity analysis of the basic reproduction number () using Latin Hypercube Sampling (LHS) and Partial Rank Correlation Coefficients (PRCC). This analysis evaluates the impact of key epidemiological parameters on . The PRCC results were further visualized using a violin plot (Figure 3). Each parameter was ranked based on its relative impact on The result of these analyses indicates that the transmission rate () exhibits the highest PRCC value (+0.262), indicating a strong positive influence on . Two primary visual outputs were generated: the PRCC violin plot (Figure 3) and the residuals plot (Figure 4). The residual plot in Figure 4 illustrates the partial dependency between each parameter and while accounting for the correlations with other variables. Each subplot displays the correlation between the residuals of the ranked input parameter (y-axis) and the residuals of the ranked values (x-axis). The red regression line in each subplot indicates the strength and direction of the partial correlation, where the slope reflects whether the parameter positively or negatively influences . Parameters with positive slopes—such as and —are identified as transmission-enhancing factors, while those with negative slopes—such as and—act as transmission-suppressing factors.
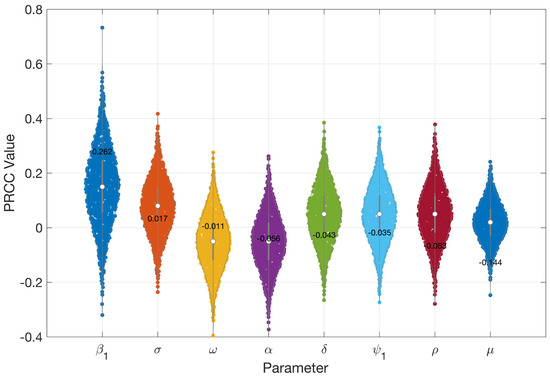
Figure 3.
PRCC values indicating how sensitive is to important epidemiological parameters.
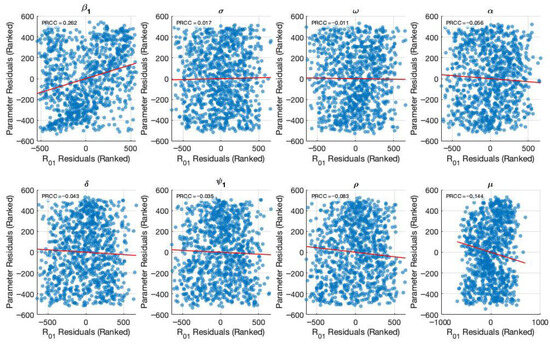
Figure 4.
Generate partial residual plots to show the relationship between ranked parameter values and after controlling other parameters.
Figure 5 and Figure 6 present the results of the sensitivity analysis of the basic reproduction number () using Latin Hypercube Sampling (LHS) and Partial Rank Correlation Coefficients (PRCC). This analysis evaluates the impact of key epidemiological parameters on . The PRCC results were further visualized using a violin plot (Figure 5). Each parameter was ranked based on its relative impact on The result of these analyses indicates that the transmission rate () exhibits the highest PRCC value (+0.111), indicating a strong positive influence on . Two primary visual outputs were generated: the PRCC violin plot (Figure 5) and the residuals plot (Figure 6). The residuals plot in Figure 6 illustrates the partial dependency between each parameter and while accounting for the correlations with other variables. Each subplot displays the correlation between the residuals of the ranked input parameter (y-axis) and the residuals of the ranked values (x-axis). The red regression line in each subplot indicates the strength and direction of the partial correlation, where the slope reflects whether the parameter positively or negatively influences . Parameters with positive slopes—such as and —are identified as transmission-enhancing factors, while those with negative slopes—such as and—act as transmission-suppressing factors.
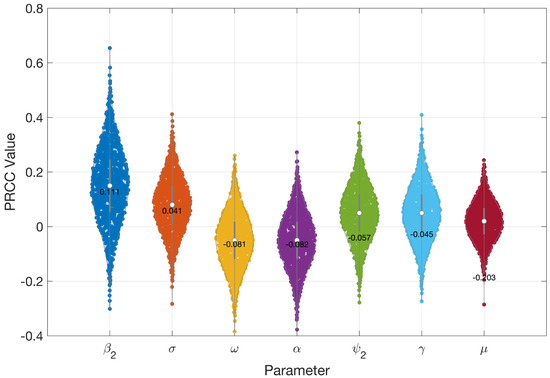
Figure 5.
PRCC values indicating how sensitive is to important epidemiological parameters.
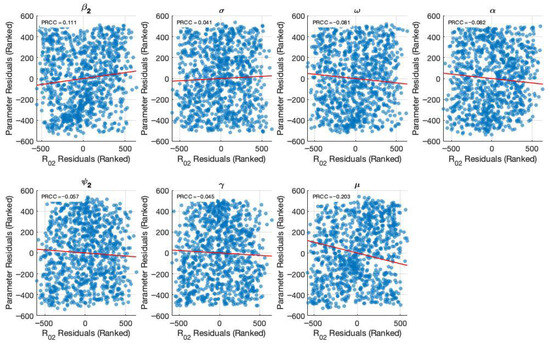
Figure 6.
Generated partial residual plots showing the relationship between ranked parameter values and after controlling other parameters.
4.3. Bifurcation Analysis
Bifurcation analysis is carried out to investigate the influence of changes in transmission parameters on the qualitative behavior of the HCV transmission model. The analysis indicates that the system undergoes a forward bifurcation and that reducing the transmission rates below the critical threshold ensures disease elimination. Nevertheless, when the threshold is exceeded, the disease-free equilibrium becomes unstable, and a stable endemic equilibrium emerges.
Theorem 3.
The HCV model presented by Equations (1)–(6) undergoes a forward bifurcation at when , if the bifurcation coefficients a and b satisfy and .
Proof.
Let the state variables be renamed as follows: . Then the system (1)–(6) is written as follows:
where
The basic reproduction numbers are , , with overall threshold R0 = max {R01, R02}. □
The bifurcation parameter is chosen as . Solving for from the condition gives the following:
where the susceptible population is as follows:
At the disease-free equilibrium (DFE), and the DFE is with
The Jacobian matrix of the system evaluated at with is as follows:
At , the Jacobian of the system at has a simple zero eigenvalue with all of the other eigenvalues having negative real parts by applying the technique [43]. The corresponding eigenvectors are then found as per the Castillo-Chávez & Song methodology. The right eigenvector satisfies relations between the following components:
With normalization, and , and the left eigenvector is .
The bifurcation coefficients are as follows:
Hence, the system experiences a forward bifurcation at .
Theorem 4.
The HCV model presented by Equations (1)–(6) undergoes a forward bifurcation at when , if the bifurcation coefficients and satisfy and .
Proof.
By the same argument, the threshold value is . At this value, the Jacobian at the DFE again has a simple zero eigenvalue. The respective eigenvectors can be similarly formed, and bifurcation coefficients are provided to fulfill and . Hence, the system undergoes a forward bifurcation at . For , the DFE is locally asymptotically stable with no endemic equilibrium, but when , the DFE loses stability, and a unique endemic equilibrium emerges. □
After determining the partial derivatives of the system and substituting the parameter values and eigenvectors, it is verified that the HCV model experiences a forward bifurcation at the critical values or . The moment either threshold condition is reached, the disease-free equilibrium will be unstable and a stable endemic equilibrium will arise (see Figure 7 and Figure 8). Here, the bifurcation parameters are and transmission rates of the susceptible population, with the constraint or .
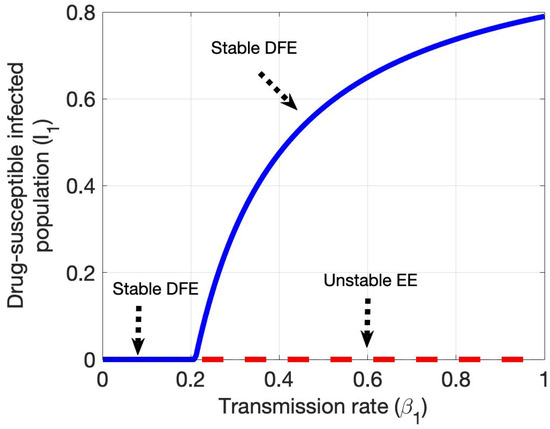
Figure 7.
Shows forward bifurcation in the plane drug-susceptible HCV-infected population and transmission rate .
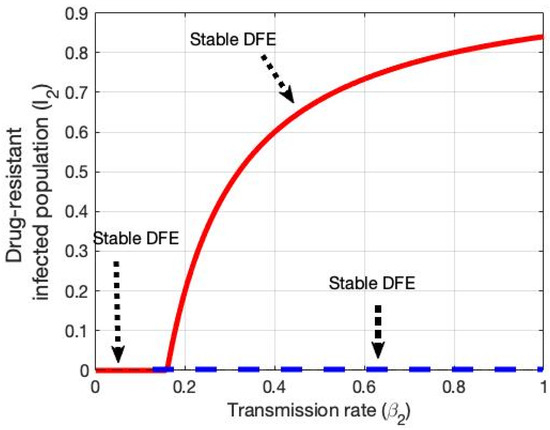
Figure 8.
Shows forward bifurcation in the plane drug-resistant HCV-infected population and transmission rate .
Bifurcation analysis here highlights how the qualitative dynamics of the system change with variations in the basic reproduction numbers. When both and , the system is stable in a disease-free equilibrium, such that HCV infections will eventually disappear. Conversely, if either or , the system has an endemic steady state, and the disease is sustained within the community. These results highlight the need to maintain both reproduction numbers below unity in order to eliminate HCV, since rates greater than one for either pathway will sustain ongoing transmission.
4.4. Scenario Analysis
For the scenario analysis, we developed five possible intervention options to investigate Bangladesh’s HCV structure. These situations are detailed in Table 2 and Table 3. We examined the effects of these reactions from 2022 to 2039 by parameterizing them in accordance with our suggested model framework. Bangladesh is among the front-runners in the vaccination program, offering unfettered access for HCV-positive individuals; however, as we have demonstrated, Bangladesh will continue to find it difficult to reach the WHO HCV fatality target. The growing chronic HCV population contributed to the escalating course of mortality due to liver disease prior to the vaccine era, which is a crucial element in evaluating the viability of fatality goals, with 2022 serving as the base year. A 65% decrease in the death rate from HCV liver disease would only be possible in the most optimistic treatment scenario, which only includes individuals with chronic HCV. Therefore, this study emphasizes the necessity of intervention scenarios for lessening Bangladesh’s burden of HCV incidences and fatalities.
Table 2.
A hypothetical single intervention strategy was implemented in our proposed HCV model for Bangladesh, covering the period from 2022 to 2039.
Table 3.
A hypothetical combination intervention strategy applied in our proposed HCV model for Bangladesh, covering the period from 2022 to 2029.
During the years 2022–2039, Scenario 1 mimics the programming condition continuing. Five different intervention strategies were employed throughout this period: increasing the first and second dose vaccinations; enhancing the rate of therapy for drug-susceptible and drug-resistant cases; and finally, decreasing the amplification rate of HCV. We executed these as individual interventions and assessed them against the baseline data (refer to Table 2) to examine the effect of each intervention on cases of drug-susceptible and drug-resistant HCV. In this scenario, the vaccination rates for the first and second doses rose from 64% and 80% to 100%, respectively. Furthermore, the treatment rate for drug-susceptible and drug-resistant HCV improved from 20% and 70% to 100%, respectively. Finally, the amplification rate decreased from around 0.035 (baseline) to 0.00001.
The results from scenario 1 are presented in Figure 9 and Table 2. In scenario 1, we found that among the five single intervention strategies, treating drug-susceptible HCV cases was the most effective in reducing the overall number of HCV cases, outperforming the other individual interventions (see Figure 9(c1,c2) and Table 2). In addition, increasing the first-dose vaccination rate reduces the total number of HCV cases and a small number of deaths (see Figure 9(a1,a2) and Table 2) more than the other interventions, including the second-dose vaccination rate, treatment for drug-resistant HCV cases, and decreased amplification rate. Hence, treatment for drug-susceptible HCV cases is the preferred single-intervention strategy. First-dose vaccination intervention is another option, followed by the amplification rate.
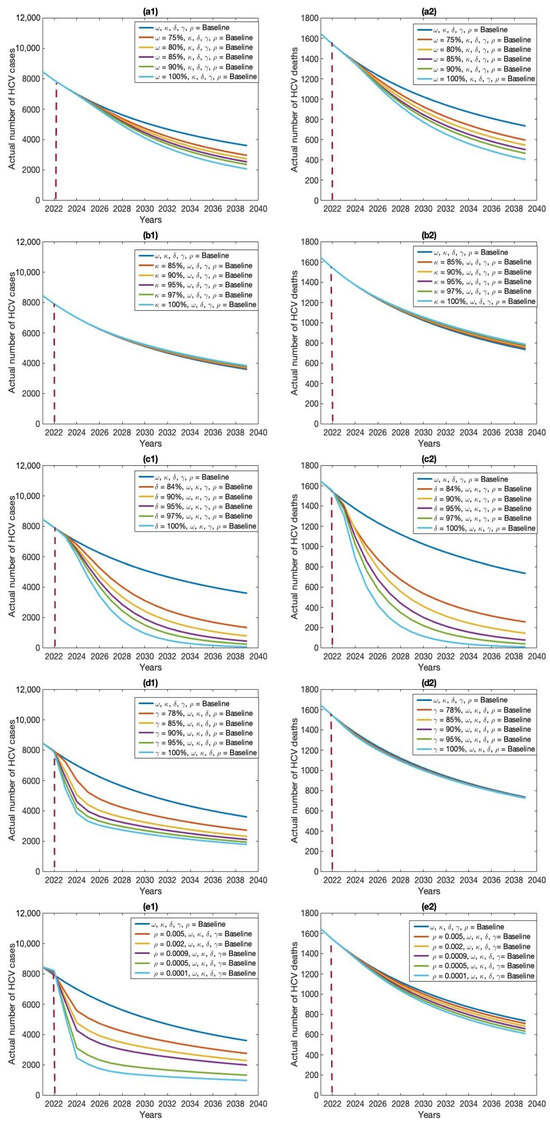
Figure 9.
Effects of five individual intervention strategies on HCV cases (a1–e1) and deaths (a2–e2): (a) first-dose vaccination, (b) second-dose vaccination, (c) treatment of drug-susceptible cases, (d) treatment of drug-resistant cases, and (e) amplification rate.
The baseline control strategy incorporates a combination of baseline values for five potential interventions: vaccination rates for the first and second doses (64% and 80%), treatment rates for drug-susceptible and drug-resistant HCV cases (20% and 70%), and an amplification rate of 0.035. The analysis indicated that, under the current baseline control strategy in Bangladesh, HCV cases are likely to persist within the population.
The modest investment strategy 1, comprising a blend of first and second doses of vaccination (64% and 80%), treatment rates for drug-susceptible and drug-resistant HCV cases (20% and 70%), and an amplification rate of 0.035, saw an improvement from the baseline rates of 64%, 80%, 20%, 70%, and 0.035 to 75%, 85%, 84%, 78%, and 0.005, respectively. As anticipated, this strategy led to a decrease in the quantity of HCV cases in Bangladesh. It was noted that a small investment strategy 1 proved more successful than the standard approach, resulting in a significant decrease in the quantity of HCV cases in Bangladesh (refer to Table 3 and Figure 10, Figure 11, Figure 12 and Figure 13).
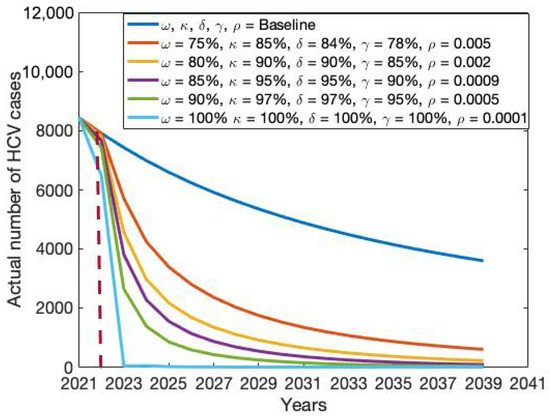
Figure 10.
Impact of combination intervention policy on the actual number of HCV cases.
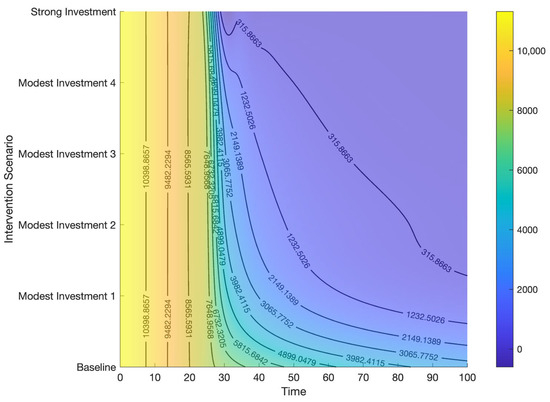
Figure 11.
Contour plot representing the effects of combined control strategies on HCV cases.
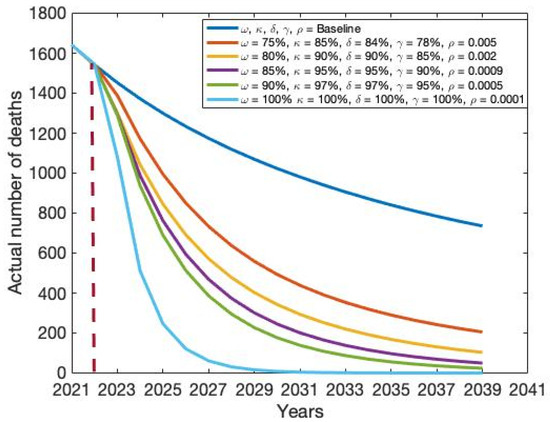
Figure 12.
Impact of combination intervention policy on the actual number of HCV-related deaths.
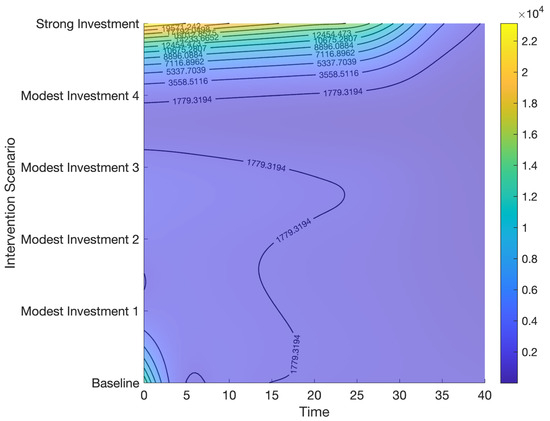
Figure 13.
Contour plot representing the effects of combined control strategies on HCV deaths.
Modest investment strategy 2 encompasses a combination of the five potential interventions, progressing from baseline to 80%, 90%, 90%, 85%, and 0.002, respectively. Findings from this strategy indicate its superior effectiveness compared to the modest investment strategy 1 in diminishing both the total number of HCV cases and deaths in Bangladesh (refer to Table 3 and Figure 10, Figure 11, Figure 12 and Figure 13). Modest investment strategy 3 entails a blend of the five potential interventions, advancing from baseline to 85%, 95%, 95%, 90%, and 0.0009, respectively. Outcomes from this strategy demonstrate its greater efficacy compared to the modest investment strategy 2 in reducing the number of HCV cases and deaths in Bangladesh (refer to Table 3 and Figure 10, Figure 11, Figure 12 and Figure 13). Modest investment strategy 4 involves a combination of the five potential interventions, advancing from baseline to 90%, 97%, 97%, 95%, and 0.0005, respectively. Results from this strategy highlight its superior effectiveness compared to modest investment strategy 3 in reducing both the number of HCV cases and deaths in Bangladesh (refer to Table 3 and Figure 10, Figure 11, Figure 12 and Figure 13).
Finally, over an 18-year period, a resilient and consistent investment strategy encompasses the treatment of drug-susceptible and drug-resistant HCV infections, along with a substantial expansion of first and second dose vaccinations, and an amplification rate progressing from baseline to 100%, 100%, 100%, and 0.00001, respectively. Our analysis suggests that the most effective course of action for achieving HCV elimination in Bangladesh lies in a robust and continuous investment plan. However, alternative scenarios outlined in Table 3 could be considered based on the availability of funds.
Recently, the Bangladesh government has been increasingly using mathematical models to guide preventative plans and resource allocation as attention turns to meeting the WHO’s HCV eradication goals. Bangladesh is a leader in the vaccination program, providing unrestricted access to those with HCV. However, as our findings indicate, the country will still face challenges meeting the WHO’s HCV mortality reduction goal. Important details regarding the kind, degree, and targeting of interventions needed to meet WHO elimination targets can be obtained using dynamic HCV transmission models. The growing HCV population contributed to the escalating course of mortality due to liver disease before the vaccine era, which is a crucial element in evaluating the viability of mortality targets. While the mechanism of HCV transmission and epidemiology in Bangladesh is not fully comprehended, the authorities of Bangladesh have started several types of intervention initiatives to eradicate HCV. Although HCV control in Bangladesh has progressed remarkably well, including first and second-dose vaccination, treatment for HCV patients who are drug-resistant or drug-susceptible, and the development of instructions, additional work is needed.
In this study, we adapted a compartmentalized structure integrating pharmacological control strategies to capture the biological dynamics of HCV infection. To assess how different regulating tactics affected the progression of the disease, analytical studies of the HCV transmission model were carried out numerically. The results from the five single prevention strategies on HCV incidences and mortality are depicted in Figure 9. Compared with each single-intervention strategy, increasing treatment for drug-susceptible HCV cases was discovered to be the most successful single-intervention method for lowering both HCV cases and associated deaths. Additionally, while the first-dose vaccination rate was effective in reducing HCV cases, its impact on mortality was relatively minor.
Furthermore, our results indicate that the intermediate scenario will not enable the WHO HCV occurrence and therapeutic coverage targets to be met by 2039. Both findings emphasize how difficult it is to sustain or increase treatment rates to the high levels needed to meet WHO HCV eradication targets. Therefore, in our study, we explored the efficacy of concurrently implementing combined intervention policies. We found that a modest investment strategy 3 (i.e., first and second doses of vaccination at 85% 95% concurrently, treatment for drug-susceptible and drug-resistant HCV cases at 95% and 90%, respectively, and an amplification rate of 0.0009) was adequate to substantially reduce HCV cases and deaths. Whereas a robust, long-term investment (i.e., vaccinations in the initial and subsequent dosages 100%, 100% concurrently, treatment in situations involving HCV that are 100% and 100% drug-resistant, respectively, and an amplification rate of 0.0001) is required to eradicate HCV cases in Bangladesh [44,45].
This study has shown that, with the present treatment options, it will be extremely difficult to fulfill the WHO’s HCV elimination goals in Bangladesh. Considering that COVID-19 reduced HCV therapy and detection, significantly delaying the goal of elimination, this is especially worrisome [46]. Adopting tactics that have been shown to improve treatment outcomes will also be crucial, such as care coordination or patient navigation [47,48,49] and integrating HCV care into pharmaceutical therapy environments [50,51,52]. To attain the goals set by the WHO to eradicate viral hepatitis, there must be a significant rise in treatment uptake, which can only be achieved by scaling up evidence-based initiatives to enhance HCV screening and care. The results of this study are crucial for informing target-setting and facilitating the creation of workable plans and activities that will enable the achievement of the WHO’s national and worldwide viral hepatitis elimination targets. This information holds relevance for the development of both national and global strategies for combating viral hepatitis C.
It is crucial to reiterate that there is currently no empirical evidence demonstrating that treating an individual’s HCV infection can directly lead to population-level prevention. Thus far, only theoretical modeling studies have provided evidence of treatment’s potential as a preventive measure. The process of producing empirical proof of therapy as a preventive measure is underway in a number of ongoing experiments. Information, however, indicates that the frequency of long-term HCV among drug injectors may have exceeded that of the general population (47% among drug-dependent individuals or those who inject now, VS. 38% overall. This is conservative and may understate the actual number of individuals who consume large amounts of alcohol.
Additionally, the model does not account for virus-clearing individuals becoming infected again. Rather, the individuals who have recovered from the virus will re-enter the vulnerable group and have a similar danger of HCV recurrence as they did with their first HCV. Once more, this should be taken cautiously because HCV reinfection is typically less common than the original infection. Updating the treatment and gathering more data on various model parameters will necessitate more iterations of the HCV eradication process and target feasibility. To completely eradicate hepatitis C, however, legislative adjustments are required to greatly improve Hepatitis C prevention, evaluation, and care. Additionally, public health advocacy is needed to increase awareness among impacted communities and medical professionals. Medical professionals, especially primary care physicians, will require specialized training in the identification and management of HCV. Increased testing and counseling should be focused on priority populations with increased HCV prevalence, such as individuals with HIV, diabetics, adults over 40, and hemodialysis patients.
5. Conclusions
In summary, our study indicates that maintaining the current level of therapy uptake, as observed in 2020, will pose significant challenges in achieving the WHO’s HCV elimination targets. Our analysis suggests that both vaccination and treatment uptake must increase by 100% to meet the 2030 goals. With global momentum toward eradicating hepatitis C as a public health threat, countries are seeking guidance on strategies to achieve the ambitious WHO objectives of reducing HCV incidence by 80% and mortality by 65% by 2030. Previous epidemic modeling studies have shown that widespread antiviral therapy can markedly reduce prevalence and incidence, even when reinfection risks were considered. Consistent with these findings, our results highlight that the combined expansion of antiviral therapy and vaccination offers the most effective pathway to reducing the national burden of HCV. While our analysis could not incorporate every possible factor, these elements will be explored in future work. Moving forward, strong collaboration among government, medical associations, and the private sector is imperative to ensure universal access to advanced antiviral therapies and healthcare services. Neither prohibitive costs nor insufficient political commitment should be allowed to hinder progress. Bangladesh has the potential to eradicate HCV, but this will require sustained, decisive commitment across political and social institutions. Currently, treatment approaches often prioritize patients with advanced liver disease, but further empirical research is needed to assess whether scaling up therapy among high-risk groups can reduce transmission at the population level. Finally, to strengthen the global public health response, epidemic modeling should be integrated with economic evaluations to determine the most effective, cost-efficient, and sustainable strategies for HCV elimination.
Supplementary Materials
The following supporting information can be downloaded at https://www.mdpi.com/article/10.3390/math13183009/s1.
Author Contributions
M.A.K.: methodology, conceptual, software, formal analysis, data curation, writing—original draft, writing—review and editing, investigation, visualization, validation, resources, project administration, supervision. S.K.T.: conceptual, methodology, investigation, writing—original draft, visualization, validation, software. S.S.: methodology, conceptual, investigation, visualization, writing—review and editing, project administration, supervision. All authors have read and agreed to the published version of the manuscript.
Funding
There was no specific grant or financing from public, private, or nonprofit organizations for this work.
Institutional Review Board Statement
This study is based on aggregated HCV surveillance data in Bangladesh taken from the Ministry of Health. No confidential information included because analyses were performed at the aggregate level. Therefore, no ethical approval is required.
Informed Consent Statement
Not applicable.
Data Availability Statement
The original contributions presented in this study are included in the article/Supplementary Material. Further inquiries can be directed to the corresponding author.
Acknowledgments
Sarker is the recipient of an Australian Research Council Discovery Early Career Researcher Award (grant number DE200100367) funded by the Australian Government. The Australian Government had no role in study design, data collection and analysis, decision to publish, or preparation of the manuscript.
Conflicts of Interest
The authors state that none of their known financial conflicts or interpersonal connections could have influenced the work that was published in this paper.
References
- Shepard, C.W.; Finelli, L.; Alter, M.J. Global epidemiology of hepatitis C virus infection. Lancet Infect. Dis. 2005, 5, 558–567. [Google Scholar] [CrossRef]
- Valery, P.C.; Laversanne, M.; Clark, P.J.; Petrick, J.L.; McGlynn, K.A.; Bray, F. Projections of primary liver cancer to 2030 in 30 countries worldwide. Hepatology 2018, 67, 600–611. [Google Scholar] [CrossRef]
- Perz, J.F.; Armstrong, G.L.; Farrington, L.A.; Hutin, Y.J.; Bell, B.P. The contributions of hepatitis B virus and hepatitis C virus infections to cirrhosis and primary liver cancer worldwide. J. Hepatol. 2006, 45, 529–538. [Google Scholar] [CrossRef] [PubMed]
- Bray, F.; Ferlay, J.; Soerjomataram, I.; Siegel, R.L.; Torre, L.A.; Jemal, A. Global cancer statistics 2018: GLOBOCAN estimates of incidence and mortality worldwide for 36 cancers in 185 countries. CA A Cancer J. Clin. 2018, 68, 394–424. [Google Scholar] [CrossRef] [PubMed]
- Wait, S.; Kell, E.; Hamid, S.; Muljono, D.H.; Sollano, J.; Mohamed, R.; Shah, S.; Mahtab, M.A.; Abbas, Z.; Johnston, J.; et al. Hepatitis B and hepatitis C in southeast and southern Asia: Challenges for governments. Lancet Gastroenterol. Hepatol. 2016, 1, 248–255. [Google Scholar] [CrossRef] [PubMed]
- Stewart, B.W.; Wild, C. World Cancer Report 2014; International Agency for Research on Cancer: Lyon, France, 2014; p. 630. [Google Scholar]
- Liu, Y.; Liu, L. Changes in the Epidemiology of Hepatocellular Carcinoma in Asia. Cancers 2022, 14, 4473. [Google Scholar] [CrossRef]
- IEDCR; ICDDRB. National HIV Serological Surveillance 2011, Bangladesh: 9th Round Technical Report; National AIDS/STD Program (NASP), Directorate General of Health Services, Ministry of Health and Family Welfare, Government of the People’s Republic of Bangladesh: Dhaka, Bangladesh, 2011. [Google Scholar]
- Yee, L.J.; Weiss, H.L.; Langner, R.G.; Herrera, J.; A Kaslow, R.; van Leeuwen, D.J. Risk factors for acquisition of hepatitis C virus infection: A case series and potential implications for disease surveillance. BMC Infect. Dis. 2001, 1, 8. [Google Scholar] [CrossRef]
- Lapa, D.; Garbuglia, A.R.; Capobianchi, M.R.; Del Porto, P. Hepatitis C virus genetic variability, human immune response, and genome polymorphisms: Which is the interplay? Cells 2019, 8, 305. [Google Scholar] [CrossRef]
- Al-Mahtab, M. Past, Present, and Future of Viral Hepatitis in Bangladesh. Euroasian J. Hepato-Gastroenterol. 2016, 6, 43–44. [Google Scholar] [CrossRef]
- Abedin, M.F.; Hoque, M.M.; Islam, A.S.M.S.; Chowdhury, M.F.I.; Das, D.C.; Begum, S.A.; Mamun, A.A.; Mahtab, M.A.; Rahman, S.; Saha, A.K. Chronic liver disease is one of the leading causes of death in Bangladesh: Experience by death audit from a tertiary hospital. Euroasian J. Hepato-Gastroenterol. 2014, 4, 14–17. [Google Scholar] [CrossRef]
- Cuypers, L.; Li, G.; Libin, P.; Piampongsant, S.; Vandamme, A.-M.; Theys, K. Genetic diversity and selective pressure in hepatitis C virus genotypes 1–6: Significance for direct-acting antiviral treatment and drug resistance. Viruses 2015, 7, 5018–5039. [Google Scholar] [CrossRef] [PubMed]
- Islam, M.J.; Habib, M.A.; Jamiruddin, M.R.; Ahmed, F.; Hossain, A. Prevalence of Hepatitis C Virus Genotypes in Bangladesh. In Proceedings of the 13th Annual Scientific Conference ICDDRB Dhaka, Dhaka, Bangladesh, 14–17 March 2011. [Google Scholar]
- Petruzziello, A.; Marigliano, S.; Loquercio, G.; Cozzolino, A.; Cacciapuoti, C. Global epidemiology of hepatitis C virus infection: An up-date of the distribution and circulation of hepatitis C virus genotypes. World J. Gastroenterol. 2016, 22, 7824–7840. [Google Scholar] [CrossRef] [PubMed]
- Petruzziello, A.; Sabatino, R.; Loquercio, G.; Guzzo, A.; Di Capua, L.; Labonia, F.; Cozzolino, A.; Azzaro, R.; Botti, G.; Khudyakov, Y.E. Nine-year distribution pattern of hepatitis C virus (HCV) genotypes in Southern Italy. PLoS ONE 2019, 14, e0212033. [Google Scholar] [CrossRef] [PubMed]
- Messina, J.P.; Humphreys, I.; Flaxman, A.; Brown, A.; Cooke, G.S.; Pybus, O.G.; Barnes, E. Global distribution and prevalence of hepatitis C virus genotypes. Hepatology 2015, 61, 77–87. [Google Scholar] [CrossRef]
- WHO. Global Health Sector Strategy on Viral Hepatitis 2016–2021; World Health Organization: Geneva, Switzerland, 2016. [Google Scholar]
- Rehermann, B. Pathogenesis of chronic viral hepatitis: Differential roles of T cells and NK cells. Nat. Med. 2013, 19, 859–868. [Google Scholar] [CrossRef]
- Hajarizadeh, B.; Grebely, J.; Dore, G.J. Epidemiology and natural history of HCV infection. Nat. Rev. Gastroenterol. Hepatol. 2013, 10, 553–562. [Google Scholar] [CrossRef]
- Larrubia, J.R.; Moreno-Cubero, E.; Lokhande, M.U.; García-Garzón, S.; Lázaro, A.; Miquel, J.; Perna, C.; Sanz-de-Villalobos, E. Adaptive immune response during hepatitis C virus infection. World J. Gastroenterol. 2014, 20, 3418–3430. [Google Scholar] [CrossRef]
- Wedemeyer, H.; He, X.-S.; Nascimbeni, M.; Davis, A.R.; Greenberg, H.B.; Hoofnagle, J.H.; Liang, T.J.; Alter, H.; Rehermann, B. Impaired effector function of hepatitis C virus-specific CD8+ T cells in chronic hepatitis C virus infection. J. Immunol. 2002, 169, 3447–3458. [Google Scholar] [CrossRef]
- Larrubia, J.R.; Benito-Martínez, S.; Miquel, J.; Calvino, M.; Sanz-de-Villalobos, E.; González-Praetorius, A.; Albertos, S.; García-Garzón, S.; Lokhande, M.; Parra-Cid, T. Bim-mediated apoptosis and PD-1/PD-L1 pathway impair reactivity of PD1(+)/CD127(−) HCV-specific CD8(+) cells targeting the virus in chronic hepatitis C virus infection. Cell Immunol. 2011, 269, 104–114. [Google Scholar] [CrossRef]
- Penna, A.; Pilli, M.; Zerbini, A.; Orlandini, A.; Mezzadri, S.; Sacchelli, L.; Missale, G.; Ferrari, C. Dysfunction and functional restoration of HCV-specific CD8 responses in chronic hepatitis C virus infection. Hepatology 2007, 45, 588–601. [Google Scholar] [CrossRef]
- Bengsch, B.; Seigel, B.; Ruhl, M.; Timm, J.; Kuntz, M.; Blum, H.E.; Pircher, H.; Thimme, R.; Walker, C.M. Coexpression of PD-1, 2B4, CD160 and KLRG1 on exhausted HCV-specific CD8+ T cells is linked to antigen recognition and T cell differentiation. PLOS Pathog. 2010, 6, e1000947. [Google Scholar]
- Wood, N.A.; La Linn, M.; Bowen, D.G.; Kowdley, K.; McCaughan, G.; Trautwein, C. Exhausted or just sleeping: Awakening virus-specific responses in chronic hepatitis C virus infection. Hepatology 2011, 54, 1879–1882. [Google Scholar] [CrossRef]
- Larrubia, J.R.; Lokhande, M.U.; García-Garzón, S.; Miquel, J.; González-Praetorius, A.; Parra-Cid, T.; Sanz-de-Villalobos, E. Persistent hepatitis C virus (HCV) infection impairs HCV-specific cytotoxic T cell reactivity through Mcl-1/Bim imbalance due to CD127 down-regulation. J. Viral. Hepat. 2013, 20, 85–94. [Google Scholar]
- Radziewicz, H.; Ibegbu, C.C.; Hon, H.; Osborn, M.K.; Obideen, K.; Wehbi, M.; Freeman, G.J.; Lennox, J.L.; Workowski, K.A.; Hanson, H.L. Impaired hepatitis C virus (HCV)-specific effector CD8+ T cells undergo massive apoptosis in the peripheral blood during acute HCV infection and in the liver during the chronic phase of infection. J. Virol. 2008, 82, 9808–9822. [Google Scholar]
- European Association for the Study of the Liver. EASL recommendations on treatment of hepatitis C 2014. J. Hepatol. 2014, 61, 373–395. [Google Scholar] [CrossRef]
- Au, J.S.; Pockros, P.J. Novel therapeutic approaches for hepatitis C. Clin. Pharmacol. Ther. 2014, 95, 78–88. [Google Scholar] [CrossRef] [PubMed]
- Gibbert, K.; Schlaak, J.F.; Yang, D.; Dittmer, U. IFN-α subtypes: Distinct biological activities in anti-viral therapy. Br. J. Pharmacol. 2013, 168, 1048–1058. [Google Scholar] [PubMed]
- Kuddus, A.; McBryde, E.S.; Adekunle, A.I.; White, L.J.; Meehan, M.T. Mathematical analysis of a two-strain disease model with amplification. Chaos Solitons Fractals 2021, 143, 110594. [Google Scholar]
- Yang, Y.; Li, J.; Ma, Z.; Liu, L. Global stability of two models with incomplete treatment for tuberculosis. Chaos Solitons Fractals 2010, 43, 79–85. [Google Scholar]
- Trauer, J.M.; Denholm, J.T.; McBryde, E.S. Construction of a mathematical model for tuberculosis transmission in highly endemic regions of the Asia-Pacific. J. Theor. Biol. 2014, 358, 74–84. [Google Scholar] [CrossRef]
- Kuddus, A.; Mohiuddin, M.; Rahman, A. Mathematical analysis of a measles transmission dynamics model in Bangladesh with double dose vaccination. Sci. Rep. 2021, 11, 16571. [Google Scholar] [CrossRef] [PubMed]
- Tilahun, G.T.; Demie, S.; Eyob, A. Stochastic model of measles transmission dynamics with double dose vaccination. Infect. Dis. Model. 2020, 5, 478–494. [Google Scholar] [CrossRef] [PubMed]
- Sadki, M.; Danane, J.; Allali, K. Hepatitis C virus fractional-order model: Mathematical analysis. Model. Earth Syst. Environ. 2022, 9, 1695–1707. [Google Scholar] [CrossRef] [PubMed]
- Zitzmann, C.; Kaderali, L.; Perelson, A.S.; Miller-Jensen, K. Mathematical modeling of hepatitis C RNA replication, exosome secretion and virus release. PLOS Comput. Biol. 2020, 16, e1008421. [Google Scholar] [CrossRef]
- Chatterjee, A.N.; Roy, P.K. Anti-viral drug treatment along with immune activator IL-2: A control-based mathematical approach for HIV infection. Int. J. Control. 2012, 85, 220–237. [Google Scholar] [CrossRef]
- Chatterjee, A.N.; Singh, M.K.; Kumar, B. The effect of immune responses in HCV disease progression. Eng. Math. Lett. 2019, 2019, 1. [Google Scholar] [CrossRef]
- Nowak, M.A.; Bangham, C.R.M. Population dynamics of immune responses to persistent viruses. Science 1996, 272, 74–79. [Google Scholar] [CrossRef]
- Kuddus, M.A.; McBryde, E.S.; Adekunle, A.I.; White, L.J.; Meehan, M.T. Two-strain HCV vaccination model with optimal control in Bangladesh. Eur. Phys. J. Plus. 2024, 139, 5502. [Google Scholar] [CrossRef]
- Government of the people’s republic of Bangladesh. Ministry of health and family welfare. Health Bulletin 2017. Mohakhali, Dhaka 1212. Available online: https://old.dghs.gov.bd/index.php/en/home/4364-health-bulletin-2017 (accessed on 12 November 2024).
- Athithan, S.; Ghosh, M. Stability analysis and optimal control of a malaria model with larvivorous fish as biological control agent. Appl. Math. Inform. Sci. 2015, 9, 1893. [Google Scholar]
- Hirsch, A.A.; Lawrence, R.H.; Kern, E.; Falck-Ytter, Y.; Shumaker, D.T.; Watts, B. Implementation and evaluation of a multicomponent quality improvement intervention to improve efficiency of hepatitis C screening and diagnosis. Jt. Comm. J. Qual. Patient Saf. 2014, 40, 351–357. [Google Scholar] [CrossRef] [PubMed]
- Abe, C.M.; Aguwa, M.; Zhao, M.; Sullivan, J.; Porsa, E.; Nijhawan, A.E. Hepatitis C Virus Infection in the Dallas County Jail: Implications for Screening, Prevention, and Linkage to Care. Public Health Rep. 2019, 134, 626–633. [Google Scholar] [CrossRef] [PubMed]
- Rahman, T.; Sultana, R.; Chowdhury, S.R. Seropositivity and pattern of viral hepatitis in clinically suspected cases of hepatitis in Dhaka city. Bangladesh Med. Res. Counc. Bull. 2007, 33, 103–106. [Google Scholar] [CrossRef][Green Version]
- Averhoff, F.; Lazarus, J.V.; Sergeenko, D.; Colombo, M.; Gamkrelidze, A.; Tsertsvadze, T.; Butsashvili, M.; Metreveli, D.; Sharvadze, L.; Hellard, M.; et al. Excellence in viral hepatitis elimination—Lessons from Georgia. J. Hepatol. 2019, 71, 645–647. [Google Scholar] [CrossRef] [PubMed]
- Deming, R.; Ford, M.M.; Moore, M.S.; Lim, S.; Perumalswami, P.; Weiss, J.; Wyatt, B.; Shukla, S.; Litwin, A.; Reynoso, S.; et al. Evaluation of a hepatitis C clinical care coordination programme’s effect on treatment initiation and cure: A surveillance-based propensity score matching approach. J. Viral Hepat. 2018, 25, 1236–1243. [Google Scholar] [CrossRef] [PubMed]
- Ford, M.M.; Johnson, N.; Desai, P.; Rude, E.; Laraque, F. From Care to Cure: Demonstrating a Model of Clinical Patient Navigation for Hepatitis C Care and Treatment in High-Need Patients. Clin. Infect. Dis. 2017, 64, 685–691. [Google Scholar] [CrossRef]
- Hsiang, J.C.; Sinnaswami, P.; Lee, M.Y.; Zhang, M.M.; Quek, K.E.; Tan, K.H.; Wong, Y.M.; Thurairajah, P.H. Point-of-care hepatitis C screening with direct access referral to improve linkage of care among people with substance misuse: A pilot randomised study. Singapore Med. J. 2020, 1, 20. [Google Scholar] [PubMed]
- Cassell, M.; Ashby, F.; Hutchinson, J.; Sathyanarayana, V.; Kapur, K.; Stone, B. Improved Linkage to Hepatitis C Assessment and Treatment within Community Drug Services Through Combined Hepatitis C and Opiate Substitution Treatment Prescription Appointments; The International Network on Hepatitis in Substance Users (INHSU); Le Westin: Montréal, QC, Canada, 2019. [Google Scholar]
Disclaimer/Publisher’s Note: The statements, opinions and data contained in all publications are solely those of the individual author(s) and contributor(s) and not of MDPI and/or the editor(s). MDPI and/or the editor(s) disclaim responsibility for any injury to people or property resulting from any ideas, methods, instructions or products referred to in the content. |
© 2025 by the authors. Licensee MDPI, Basel, Switzerland. This article is an open access article distributed under the terms and conditions of the Creative Commons Attribution (CC BY) license (https://creativecommons.org/licenses/by/4.0/).