Abstract
This paper develops a dynamic information-theoretic network framework to quantify systemic risk in China’s maritime–commodity nexus with a focus on the Yangtze River Basin using eight monthly indicators, CCFI, CBCFI, BDI, YRCFI, GAUP, MPCT, CPUS, and ASMC. We resample, impute, standardize, and difference series to achieve stationary time series. Nonlinear interdependencies are estimated via KSG mutual information (MI) within sliding windows; networks are filtered using the Planar Maximally Filtered Graph (PMFG) with bootstrap edge validation (95th percentile) and benchmarked against the MST. Average MI indicates moderate yet heterogeneous dependence (about 0.13–0.17), revealing a container/port core (CCFI–YRCFI–MPCT), a bulk/energy spine (BDI–CPUS), and commodity bridges via GAUP. Dynamic PMFG metrics show a generally resilient but episodically vulnerable structure: density and compactness decline in turbulence. Stress tests demonstrate high redundancy to diffuse link failures (connectivity largely intact until ∼70–80% edge removal) but pronounced sensitivity of diffusion capacity to targeted multi-node outages. Early-warning indicators based on entropy rate and percolation threshold Z-scores flag recurring windows of elevated fragility; change point detection evaluation of both metrics isolates clustered regime shifts (2015–2016, 2018–2019, 2021–2022, and late 2023–2024). A Systemic Importance Index (SII) combining average centrality and removal impact ranks MPCT and CCFI as most critical, followed by BDI, with GAUP/CPUS mid-peripheral and ASMC peripheral. The findings imply that safeguarding port throughput and stabilizing container freight conditions deliver the greatest resilience gains, while monitoring bulk/energy linkages is essential when macro shocks synchronize across markets.
Keywords:
systemic risk; information theory; complex networks; resilience; early warning; China maritime sector MSC:
05C82; 94A17; 62M10; 62F40; 60K35; 90B10; 62P20
1. Introduction
Network theory offers a powerful framework for studying complex systems exposed to external shocks and systemic risk. Leveraging these tools, we analyze maritime transport, which underpins the modern global economy and carries approximately 80% of world trade by volume and over 70% by value [1]. Beyond its logistical function, the sector serves as a critical barometer of economic health, influencing trade patterns, commodity prices, and financial markets [2]. Within this system, China occupies a particularly central role: its ports handle a substantial proportion of global container traffic, accounting for roughly 30% of total throughput in 2022, and its maritime infrastructure supports over 85% of the nation’s trade volume [3]. The Yangtze River Basin, as a major artery in this network, links inland production hubs to international markets, making it an indispensable component of China’s maritime economy [4].
Given the scale and centrality of China’s maritime sector, systemic risk in this domain has global implications [5]. Systemic risk refers to the potential for localized disruptions to propagate through interdependent subsystems, triggering large-scale instability [6]. In maritime transport, such risks can arise from freight rate volatility, commodity price shocks, port congestion, operational bottlenecks, and financial distress among shipping firms [7]. These disruptions may cascade across the global trade network, affecting commodity markets, inflation dynamics, and the stability of associated financial systems [8]. The COVID-19 pandemic, recent geopolitical tensions, and fuel price volatility have highlighted the vulnerability of maritime networks to shocks that are both endogenous and exogenous in origin [9]. Post-2020 disruptions exposed structural weaknesses in global shipping and port systems, reshaping the economics of trade logistics and demonstrating how container trade, vessel deployment, and port performance mediated pandemic-era shocks and recovery phases [10]. Within this context, China’s port system remains central to global supply chains, acting as both a throughput hub and a transmitter of shocks.
While previous research has examined specific risk channels, such as the relationship between freight rates and commodity prices [11] or the impact of port congestion on supply chain performance [12], there remains a critical gap in understanding the latent interdependencies among diverse market, commodity, and operational indicators. The maritime sector operates as a tightly coupled nonlinear system where structural dependencies evolve over time [13]. Ignoring these temporal and cross-sectoral linkages risks underestimating fragility, particularly under stress scenarios.
This study addresses this gap by developing a unified framework to analyze the structural and dynamic interconnections between key maritime and commodity indicators in China’s maritime sector. Eight core variables are examined: the China Containerized Freight Index (CCFI), China Coastal Bulk Freight Index (CBCFI), Baltic Dry Index (BDI), Yangtze River Container Freight Index (YRCFI), global aluminum prices (GAUP), major ports’ container throughput (MPCT), US Central Appalachia coal prices (CPUS), and the aggregate market performance of 14 listed Chinese shipping firms (ASMC). These variables capture interlinked dimensions of freight market dynamics, commodity price fluctuations, port activity, and financial performance.
The methodological approach integrates information-theoretic measures and complex network theory. Mutual information (MI) is employed to capture nonlinear dependencies between stationary, standardized versions of the eight time series [14,15]. A sliding-window analysis generates dynamic MI matrices, which are subsequently filtered using the Planar Maximally Filtered Graph (PMFG) to retain the most structurally informative edges while preserving network planarity [16,17]. The Minimum Spanning Tree (MST) serves as a benchmark for identifying the strongest backbone connections. Network evolution is tracked via global metrics such as average degree, clustering coefficient, average path length, and degree entropy, while edge persistence analysis reveals the stability of specific connections over time [18].
Robustness is assessed through two perturbation regimes: random edge failures and targeted multi-node removals. The percolation threshold and entropy rate of random walks are used to quantify degradation of connectivity and information transfer capacity under stress. The primary objectives of this research are threefold: (i) to quantify the interdependencies among freight, commodity, and port performance indicators in China’s maritime sector; (ii) to identify stable and transient network structures that influence systemic risk; and (iii) to evaluate the sector’s robustness to structural perturbations. In doing so, this study contributes an integrated, empirically validated framework for systemic risk assessment in maritime transport, offering insights for policymakers, port authorities, and industry stakeholders seeking to strengthen the resilience of critical trade infrastructure.
Micro-level safety analytics have long applied Bayesian networks (BNs) to model accident causes and consequences, from inland waterways to global datasets [19,20,21,22,23]. These efforts highlight influential risk factors such as ship type, voyage segment, and operating conditions, while extensions integrate machine learning and soft set-based methods to uncover predictive patterns and trigger–consequence chains [24,25]. At the systemic level, inland waterway transport has been cast as a complex network where resilience can be quantified via percolation-based reliability analysis [26,27].
Macro-level research emphasizes the pass-through of maritime cost shocks to domestic inflation, demonstrating that supply chain frictions exert a measurable influence on global prices [28,29,30]. Network studies of liner services and ports identify critical nodes whose impairment can induce cascading disruptions, with hazard-informed stress testing showing how exogenous shocks such as cyclones alter global flows [31,32,33,34,35,36]. These findings align with evidence that shipping costs and supply chain pressures carry systemic importance for inflation dynamics and global trade [37,38].
Information-theoretic methods and topology-preserving filters have emerged as powerful tools for identifying dependence structures in noisy, non-Gaussian data. The Kraskov–Stögbauer–Grassberger (KSG) estimator provides a robust nonparametric approach to MI estimation [39], while the PMFG retains informative edges under planar constraints, complementing MST approaches in delineating market backbones [40]. Recent surveys in economics and finance underscore the importance of robust filtering and change point detection in monitoring evolving systems [41,42,43]. These approaches are increasingly applied in maritime analytics, bridging market-layer dependencies with network resilience assessment [44].
Compared to existing studies, our framework advances both methodologically and empirically. Earlier works on maritime systemic risk have often relied on linear correlation or regression-based approaches to capture relationships between freight rates, commodity prices, and port congestion [11,12,13]. Maritime financial systemic risk studies frequently employ tail dependence metrics such as CoVaR, CoVaR, and Marginal Expected Shortfall [45,46,47], but these do not capture evolving nonlinear interdependencies. Network-based analyses of trade and shipping [31,33,34] have identified critical nodes, yet they rarely integrate nonlinear dependence estimation with robust filtering and early-warning diagnostics. Table 1 summarizes these differences and highlights how the present study contributes beyond existing work.

Table 1.
Comparison of this study with related works on systemic risk and maritime analytics.
The methodological and application contributions of this study are as follows. On the methodological side, we integrate three strands into a unified systemic risk assessment framework: (i) information-theoretic dependence estimation using mutual information, enhanced by robustness checks against alternative estimators; (ii) topology-preserving filtering of dynamic networks via the Planar Maximally Filtered Graph (PMFG) combined with bootstrap edge validation; and (iii) early-warning diagnostics based on entropy rate and percolation threshold Z-scores, which extend standard resilience measures by capturing dynamic fragility and regime shifts.
On the applied side, we provide a comprehensive systemic risk analysis of China’s maritime–commodity nexus, a domain with global macroeconomic implications. The framework uncovers persistent structural features, such as the container/port core and bulk/energy spine, and quantifies their vulnerabilities through stress tests. We further introduce a Systemic Importance Index (SII) that ranks nodes by combining centrality with removal impacts, offering a practical prioritization tool for policymakers and industry stakeholders. By linking empirical findings to real disruptions (e.g., COVID-19 port closures and the 2021–2022 energy crisis), this study contributes actionable insights for resilience governance in global trade networks.
The remainder of this paper is organized as follows: Section 2 presents the methodology, including data, network modeling, and stress testing; Section 3 reports empirical findings on network structures and resilience metrics; Section 4 discusses robustness tests and economic implications; and Section 5 concludes with policy relevance and future research directions.
2. Methodology
2.1. PMFG Construction and Validation
Let denote the N-dimensional multivariate time series over . All series were resampled to a common monthly frequency and missing observations were imputed via a hybrid scheme: primary imputation used a Kalman filter based on a local level structural time series model, and residual gaps were filled using an ARIMA process. Each series was standardized according to
with and denoting the sample mean and standard deviation of .
Weak stationarity was assessed via the Augmented Dickey–Fuller (ADF) and Kwiatkowski–Phillips–Schmidt–Shin (KPSS) tests. Seven of the eight variables exhibited unit root behavior in at least one test; these were rendered stationary by first-order differencing:
after which all variables satisfied both ADF and KPSS criteria. The resulting stationary, standardized series formed the input for dependency estimation.
Statistical dependencies were measured using mutual information (MI), an information-theoretic quantity that captures both linear and nonlinear associations. In contrast to Pearson correlation, which detects only linear dependence, MI quantifies the reduction in uncertainty of one variable given knowledge of another. Estimation was performed with the Kraskov–Stögbauer–Grassberger (KSG) k-nearest neighbor estimator, which provides a nonparametric method that does not require distributional assumptions and is effective for high-dimensional, nonlinear time series. These statistical dependencies were quantified using the Kraskov-Stögbauer-Grassberger (KSG) k-nearest neighbor estimator of mutual information (MI):
where denotes the joint probability density and are the marginals. A sliding window of fixed width w produced a sequence of MI matrices for , with symmetric and . For each window , the full weighted graph with edge weights was filtered to preserve the most informative structure. Because the complete graph is dense and includes many weak or spurious connections, filtering procedures from complex network theory were employed. The Minimum Spanning Tree (MST) retains the strongest edges that ensure connectivity without cycles, yielding a minimal but interpretable backbone. The Planar Maximally Filtered Graph (PMFG) preserves additional significant edges while imposing a planarity constraint, which ensures computational tractability and facilitates the identification of structural motifs such as cliques and cycles. Together, the MST and PMFG provide complementary sparse representations of the dependency structure. First, the Planar Maximally Filtered Graph (PMFG) was constructed by iteratively adding edges in descending order of MI while preserving planarity (genus ). As a sparsity benchmark, the Minimum Spanning Tree (MST) was computed as
Statistical validation was implemented by generating B surrogate datasets under the null hypothesis of independence, estimating for each, and retaining only edges with
where denotes the empirical 95th percentile.
The PMFG sequence was characterized using dynamic graph metrics: average degree , clustering coefficient , average shortest path length , and degree entropy:
with being the empirical degree distribution at time . Edge persistence was quantified as
where is the total number of windows.
Robustness was analyzed through perturbation experiments. Random edge failures and targeted removals of high-centrality nodes mimic stochastic disruptions and adversarial attacks, respectively. Changes in global connectivity, percolation thresholds, and entropy rate under these perturbations provide quantitative indicators of network fragility. Stress testing extends this analysis by applying exogenous shocks to the underlying time series, reconstructing the perturbed dependency networks, and evaluating changes in centrality and entropy relative to the baseline. This integrated framework links information-theoretic dependency estimation with complex network robustness analysis, enabling a systematic assessment of the system vulnerability. Robustness analysis considered two perturbation classes. In random edge failure, a fraction of edges were removed uniformly at random, and the percolation threshold was defined as the smallest p for which the size of the largest connected component dropped below for a fixed . In targeted multi-node removal, nodes with the highest centrality were eliminated, and the resulting changes in connectivity and information flow were assessed via the entropy rate of a random walk:
where and is the stationary distribution of . Temporal variations in and topological metrics under perturbations were interpreted as indicators of systemic fragility.
2.2. Dynamic Network Metrics
The filtered MI network evolves over time and is analyzed using dynamic topological metrics. Centrality measures identify key structural influencers. For each node , we compute the following.
Betweenness centrality:
where is the number of shortest paths between nodes s and t, and counts those passing through .
Eigenvector centrality:
where A is the weighted adjacency matrix and is the largest eigenvalue.
Closeness centrality:
with denoting the shortest path length.
Community structure is uncovered via modularity optimization using the Louvain method. To quantify systemic complexity, we compute the Shannon entropy of node degree distribution:
where is the empirical probability of degree k. Additionally, we monitor changes in percolation thresholds and entropy rate to detect structural fragility.
Let denote the time-varying network at window , and let denote the average degree:
We define the percolation threshold as
To complement this, we compute the entropy rate of a random walk on the graph:
where is the stationary distribution of the transition matrix . A decline in reflects reduced information propagation capacity and increased structural bottlenecks.
2.3. Integrated Stress Testing
Stress testing integrates the generative scenarios with the MI-based network. For a given shock vector , the perturbed network is reconstructed and its topology compared to the baseline network G. The impact is quantified by the change in key metrics:
across all nodes. A Monte Carlo ensemble of 100 simulations is used to compute empirical confidence intervals for each network metric under stress.
To assess predictive robustness, deviations between baseline and perturbed forecasts are measured:
Temporal evolution of these deviations indicates the system’s sensitivity to different types and intensities of shocks. The most fragile nodes are those whose centrality scores exhibit large and consistent responses across multiple scenario classes. The whole process of risk assessment procedures is summarized in Algorithm A1 (Appendix A).
3. Results
We examine eight maritime, commodity, and financial indicators, the China Containerized Freight Index (CCFI), the China Coastal Bulk Freight Index (CBCFI), the Baltic Dry Index (BDI), the Yangtze River Container Freight Index (YRCFI), global aluminum prices as reflected in the London Metal Exchange spot market (GAUP), major ports’ container throughput (MPCT), the U.S. Central Appalachia coal price (CPUS), and the aggregate performance of fourteen publicly listed Chinese shipping companies (ASMC; see Appendix A for details on its construction), over the period 2014–2024. Data are obtained from the Ministry of Commerce of the People’s Republic of China, publicly available datasets, and Investing.com. We focus on these eight indicators because they capture the principal transmission channels in the maritime–commodity nexus: container freight (CCFI and YRCFI), coastal and bulk freight (CBCFI and BDI), commodity prices (GAUP and CPUS), port throughput (MPCT), and sectoral equity performance (ASMC). Together, they represent the operational, price, and financial dimensions most directly linked to systemic risk in maritime transport.
Broader sets of variables, such as international financial indices, exchange rates, or more granular domestic logistics indicators, were considered. However, these alternatives typically lack consistent monthly coverage over the 2014–2024 horizon, are highly collinear with our chosen measures, or do not add sufficient domain complementarity. We therefore prioritized indicators that jointly offer (i) broad domain coverage, (ii) consistent temporal resolution, and (iii) minimal redundancy. This balance ensures an interpretable yet comprehensive framework for capturing systemic dynamics.
To ensure that preprocessing choices (resampling, imputation, standardization, and differencing) did not unduly influence the results, we performed extensive sensitivity analyses. Alternative imputation methods (linear interpolation and state-space smoothing), different scaling approaches (Z-score vs. min–max), and alternative stationarity treatments (higher-order differencing or HP detrending) were tested. Across all variations, the mutual information matrices, filtered network structures (PMFG/MST), centrality measures, and Systemic Importance Index rankings remained qualitatively consistent. This robustness check confirms that our findings are not artifacts of the specific preprocessing procedures.
Series were temporally resampled to a common monthly frequency and imputed using a hybrid approach that combines Kalman filtering (local level structural time series) with ARIMA(1,1,0) as a fallback. Each series was standardized,
and tested for weak stationarity using the Augmented Dickey–Fuller (ADF, unit root null) and KPSS (stationarity null) tests. Seven of eight variables showed non-stationarity in at least one test; applying first differences rendered all variables stationary under both tests. Table 2 summarizes pre- and post-transformation outcomes. Figure 1 illustrates the effect of differencing for representative series (CCFI, BDI, and GAUP).
Table 2.
Stationarity test results before and after differencing.
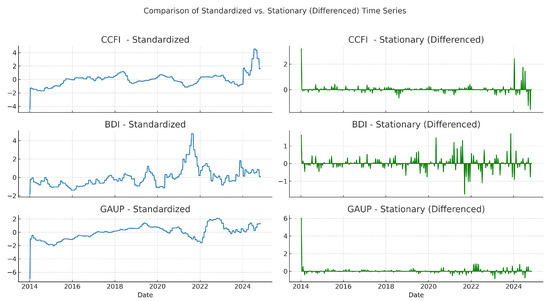
Figure 1.
Effect of stationarity adjustment for selected series (CCFI, BDI, and GAUP). Left: standardized but non-stationary; Right: first-differenced, stationary.
As shown in Figure 2, the average mutual information (MI) matrix aggregated across sliding windows indicates moderate but heterogeneous nonlinear dependencies (approx. 0.13–0.17). The strongest pair is CCFI–YRCFI (MI ), consistent with tight co-movement in container freight. BDI exhibits broad coupling, especially with CPUS (≈) and MPCT (≈), linking bulk shipping activity to energy prices and port throughput. GAUP shows mid-tier ties to container metrics (CCFI–GAUP and YRCFI–GAUP ) but weaker dependence with CPUS (≈). CBCFI is moderately connected overall (e.g., CBCFI–MPCT ) but less tightly with YRCFI (≈) and ASMC (≈). ASMC is peripheral on average, aside from MPCT (≈) and a modest CCFI link (≈). Overall, the matrix reveals a container-centric substructure (CCFI–YRCFI–MPCT), a bulk/energy channel (BDI–CPUS), and commodity bridges via GAUP and MPCT, motivating topology-preserving filtering to retain informative links.
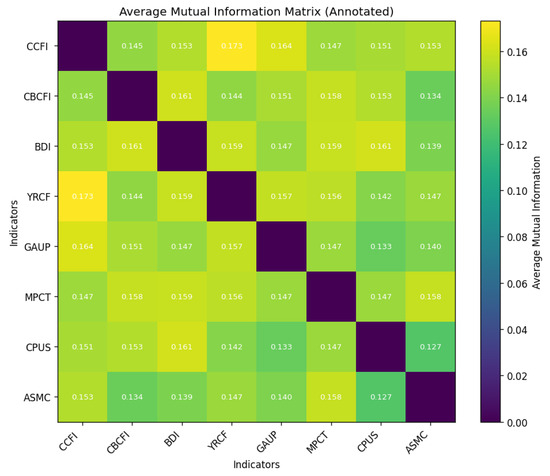
Figure 2.
Average mutual information (MI) across all sliding windows with in-cell annotations.
To clarify the structural backbone, we compare the full MI graph, the Planar Maximally Filtered Graph (PMFG), and the Minimum Spanning Tree (MST) for a representative window (Figure 3). The full graph is dense, with prominent maritime links (MPCT–CBCFI and YRCFI–CCFI) and commodity–maritime ties (BDI–MPCT and GAUP–MPCT). The PMFG retains a planar backbone of high-MI edges, preserving stable cross-domain pathways (e.g., BDI–CPUS and MPCT–GAUP) while eliminating weaker redundancies. The MST provides a minimal skeleton that highlights the strongest single-path connections and places commodity nodes at the periphery, useful for tracing primary transmission routes.
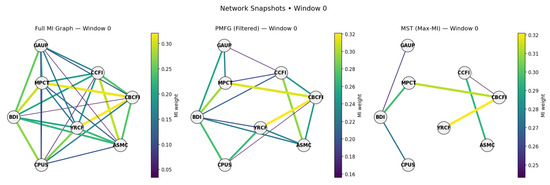
Figure 3.
Network snapshots (representative window): full MI graph (left), PMFG (middle), and MST (right).
Global PMFG metrics indicate a resilient but episodically vulnerable structure (Figure 4). Average degree typically ranges within 3.5–4.5, with occasional drops signaling temporary fragmentation. The clustering coefficient remains around 0.3–0.5, indicating persistent local cohesion. Degree entropy is comparatively flat, suggesting stable heterogeneity in node connectivity. Spikes in average path length occur when key edges are lost and the network becomes less compact—periods that coincide with the regime shift analysis below.
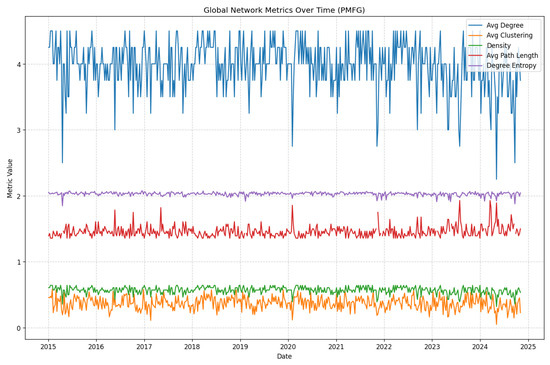
Figure 4.
Global PMFG metrics over time: average degree, clustering, path length, and degree entropy.
Figure 5 and Figure 6 provide a dynamic perspective on how centrality evolves over time within the PMFG network. Figure 5 shows the eigenvector centrality of MPCT, CCFI, and BDI, highlighting their roles as recurrently dominant hubs in different phases. For instance, CCFI shows sharp increases in eigenvector centrality during 2015–2016 and 2020–2021, reflecting its amplified role in global container dynamics during trade tensions and the pandemic shock. Figure 6 presents betweenness centrality, which captures nodes acting as bridges. Spikes in BDI’s betweenness around 2016–2017 and 2021 indicate its role as a conduit for systemic stress, while MPCT intermittently emerges as a key broker of connectivity. Therefore, these time series reveal that systemic importance is not static but shifts in line with macroeconomic regimes and disruptions, strengthening the interpretation of the network’s fragility and resilience over time.
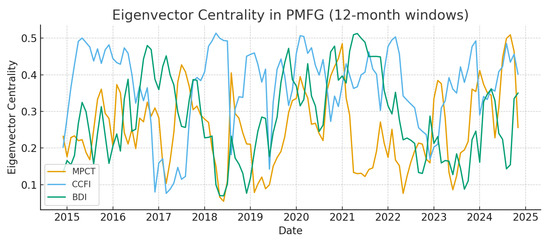
Figure 5.
Evolution of eigenvector centrality in the PMFG network (12-month rolling windows).
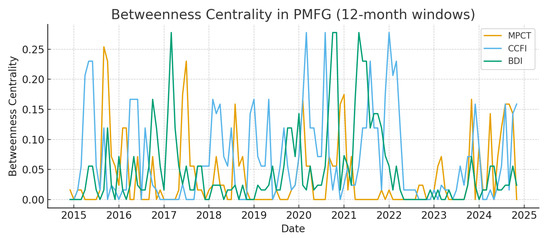
Figure 6.
Evolution of betweenness centrality in the PMFG network (12-month rolling windows).
While visual inspection suggests temporary declines in density and cohesion during turbulent years, it is important to test whether these changes reflect systematic structural breaks or short-lived fluctuations. To evaluate this, we conducted Mann–Whitney U tests comparing turbulent years (2015–2016, 2020–2021, and 2022–2023) with calmer periods. As shown in Table 3, global metrics such as average degree, clustering, and path length remain statistically stable across regimes ( in all cases). This stability indicates that the maritime–commodity network maintains a consistent baseline of redundancy and cohesion, even during crises. At the same time, this finding highlights the limits of global averages as early-warning tools: while they suggest structural steadiness, localized shifts in centrality and fragility indices (e.g., entropy rate and percolation threshold measures) are more sensitive to regime transitions and provide sharper insights into systemic vulnerabilities.
Table 3.
Comparison of PMFG global metrics between turbulent and calm periods (Mann–Whitney U test).
The edge persistence heatmap (Figure 7) quantifies how often each connection is statistically significant across windows. High-persistence maritime links such as CBCFI–CCFI (0.73), CCFI–YRCFI (0.73), and CBCFI–BDI (0.73) indicate a stable shipping freight core. Cross-domain edges (e.g., CCFI–GAUP = 0.65; YRCFI–MPCT = 0.69) show mixed stability, while some commodity pairs (CPUS–GAUP = 0.58; CPUS–ASMC = 0.56) are more regime-dependent. The pattern is consistent with a robust, modular shipping subnetwork with adaptive bridges to commodities and equities.
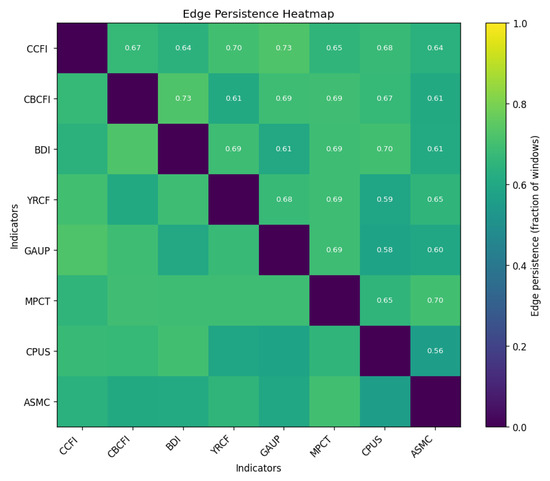
Figure 7.
Edge persistence across all windows (fraction of windows in which an edge is significant).
Table 4 shows CCFI’s mutual information (MI) links with other indicators under different filtering schemes. Results show that while the 95th percentile cutoff retains only the strongest CCFI–GAUP link, the 90th percentile retains the same set, whereas significance-based pruning additionally retains mid-tier links such as CCFI–MPCT and CCFI–CPUS. This comparison demonstrates that our 95th percentile rule provides a conservative filtering strategy that emphasizes robustness, while alternative schemes yield denser but potentially noisier networks.
Table 4.
Comparison of CCFI’s mutual information (MI) links under alternative filtering schemes.
These results confirm that the 95th percentile threshold yields a parsimonious backbone that prioritizes highly significant dependencies, consistent with the study focus on robust systemic risk structures.
Stress tests reveal distinct resilience profiles. Under random edge failures, entropy rate declines smoothly with removal fraction, while connectivity remains high until a late, sharp drop (critical percolation at 70–80% removal), indicating substantial redundancy in links (Figure 8). Under multi-node removal, entropy rate reacts immediately even for small k, highlighting the outsized role of individual hubs for information flow; connectivity degrades materially only beyond , implying a still-functional backbone despite targeted losses (Figure 9). Overall, the system is robust to diffuse link failures but more sensitive to targeted node outages in terms of diffusion capacity.
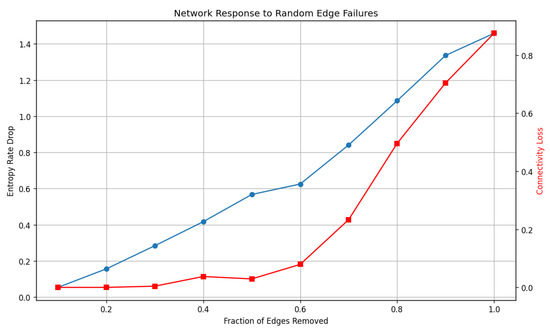
Figure 8.
Response to random edge failures: entropy rate drop and connectivity loss vs. removal fraction.
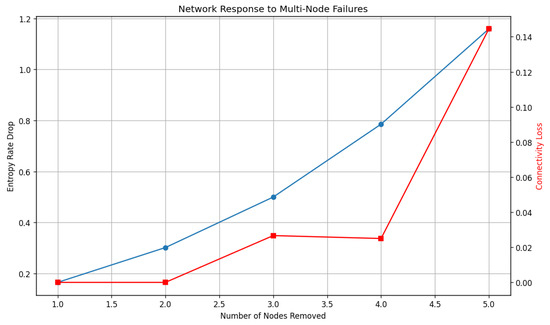
Figure 9.
Response to multi-node failures: entropy rate drop and connectivity loss vs. number of nodes removed.
We detect structural reconfigurations using penalty-based PELT on the entropy rate and percolation threshold of the PMFG sequence (PELT with rbf cost and data-driven penalty; larger penalties yield fewer regimes). Both series show multiple breaks (Figure 10 and Figure 11) that cluster in 2015–2016, 2018–2019, 2021–2022, and late 2023–2024. The co-occurrence across metrics indicates system-level topology shifts: phases with lower and altered align with the temporary losses in density and compactness observed in the global metrics.
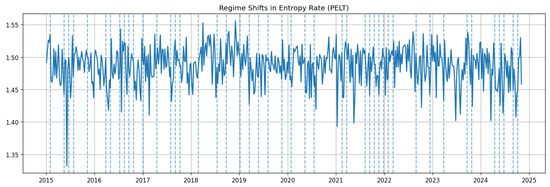
Figure 10.
PELT-detected regime shifts in entropy rate ; dashed lines mark estimated change points.
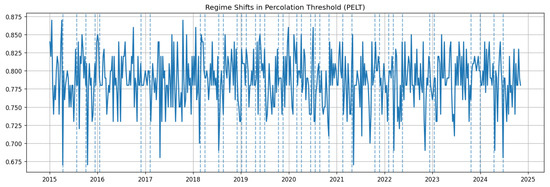
Figure 11.
PELT-detected regime shifts in percolation threshold ; dashed lines mark estimated change points.
We construct a Systemic Importance Index (SII) that combines time-averaged centralities (betweenness and eigenvector) with average impact under single-node removal (entropy rate drop and connectivity loss), each min–max-normalized and equally weighted:
Across methods, three consistent features emerge. First, a persistent container/port core (CCFI–YRCFI–MPCT) anchors the network, with bulk/energy interdependencies (BDI–CPUS) forming a secondary spine and GAUP acting as a commodity bridge. Second, topology evolves through episodic regimes in which entropy rate falls and percolation properties shift, coinciding with temporary losses in density and compactness. Third, the system is robust to diffuse link failures but more sensitive to targeted node outages: MPCT and CCFI are the most system-critical nodes by SII, with BDI close behind. These results provide prioritized levers for monitoring and stress preparedness in the maritime–commodity nexus.
As presented in Table 5 and Figure 12, SII ranking derived from the network analysis is also robust to alternative methodological specifications. Across different dependence estimators (KSG mutual information with varying k, distance correlation, and copula-based MI) and alternative filtering thresholds, the same core nodes consistently emerge as systemically important: the container/port cluster (CCFI, YRCFI, and MPCT) and the bulk/energy spine (BDI and CPUS). As demonstrated in the robustness checks, varying estimator parameters had negligible effects on the relative ordering of SII scores. This stability suggests that the observed hierarchy of systemic importance reflects structural features of the maritime–commodity system, rather than artifacts of estimator choice or network construction.
Table 5.
Systemic Importance Index (SII) and components (time averages across windows; SII is unitless).
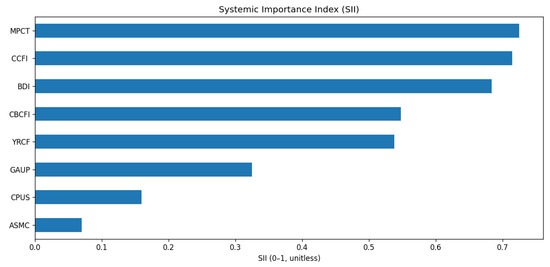
Figure 12.
Systemic Importance Index (SII) by variable. MPCT and CCFI dominate, followed by BDI; GAUP/CPUS are mid-peripheral bridges and ASMC is peripheral.
4. Discussion
4.1. Robustness of Nonlinear Dependence Estimation
To assess the sensitivity of our network construction to the choice of dependence estimator, we conducted two robustness checks. First, we varied the k parameter in the KSG mutual information estimator () and observed negligible changes in global network metrics (average degree , clustering C, and average path length L) and the ranking of systemic importance (SII) of key nodes. Second, we compared KSG MI with alternative dependence measures: distance correlation and copula-based mutual information. Table 6 reports a numeric comparison. Across all methods, the container/port core (CCFI, YRCFI, and MPCT) and bulk/energy spine (BDI and CPUS) consistently emerge as the most central and systemically important, supporting the robustness of our results to the choice of nonlinear dependence estimation.
Table 6.
Comparison of network and systemic importance metrics under different dependence estimation methods. Metrics are averaged across sliding windows.
The Systemic Importance Index (SII) ranking derived from the network analysis is also robust to alternative methodological specifications. Across different dependence estimators (KSG mutual information with varying k, distance correlation, and and copula-based MI) and alternative filtering thresholds, the same core nodes consistently emerge as systemically important: the container/port cluster (CCFI, YRCFI, and MPCT) and the bulk/energy spine (BDI and CPUS). As demonstrated in the robustness checks, varying estimator parameters had negligible effects on the relative ordering of SII scores. This stability suggests that the observed hierarchy of systemic importance reflects structural features of the maritime–commodity system, rather than artifacts of estimator choice or network construction.
The findings of this study present a detailed, multi-dimensional view of the structure and dynamics of China’s maritime–commodity system—a system that is not only extensive and complex in its physical and operational dimensions but also highly sensitive to external changes due to its economic interlinkages with global commodity and energy markets. Network analysis reveals that the system relies on a small but highly influential set of key hubs that govern the flows of transportation, prices, and logistics capacity. This structural concentration means that in periods of stability, the network can handle large volumes of transactions with high efficiency, but during shocks or rapid transitions, the very same focal points can become critical vulnerabilities.
4.2. Benchmarking Against Tail Risk Measures
To benchmark the entropy- and percolation-based systemic stress indicators, we compare them with established tail dependence measures: Marginal Expected Shortfall (MES) and CoVaR. These approaches capture conditional downside risk and tail spillovers, offering a useful contrast with network-based fragility diagnostics.
The Marginal Expected Shortfall (MES) at the 5% quantile was computed for each indicator and normalized to a scale for comparability. Results show that commodity prices (GAUP) dominate with the highest relative MES, while container (CCFI), bulk (BDI), and port throughput (MPCT) indicators exhibit smaller but non-negligible tail risks. Equity returns (ASMC) record the lowest MES, consistent with their downstream and reactive position in the network.
The ΔCoVaR measure quantifies the marginal contribution of each indicator to systemic stress in the equity market. Negative values indicate that distress in the conditioning variable amplifies left-tail risk in ASMC. Results show that CCFI (), BDI (), MPCT (), and GAUP () contribute most strongly to downside spillovers, consistent with their central roles in the network structure. In contrast, CBCFI (), YRCFI (), and CPUS () exhibit weaker or countercyclical contributions. Table 7 summarizes these results alongside the Systemic Importance Index (SII) from the network analysis. Both frameworks consistently identify container freight (CCFI), bulk freight (BDI), and port throughput (MPCT) as the most systemically relevant channels. However, the network-based entropy and percolation diagnostics extend beyond static tail risk by capturing evolving fragility, regime shifts, and early-warning signals.
Table 7.
Comparison of normalized MES (5% tail), CoVaR (ASMC conditional), and Systemic Importance Index (SII).
Therefore, the comparison demonstrates strong complementarity: MES and CoVaR quantify conditional downside spillovers in specific markets, while entropy- and percolation-based indicators track systemic fragility and regime-dependent vulnerability, thereby offering a forward-looking dimension for stress monitoring in the maritime–commodity nexus.
4.3. Predictive Evaluation of Early-Warning Indicators
To assess whether the proposed entropy ate and percolation threshold Z-scores provide predictive content beyond retrospective description, we conducted a backtesting exercise using a 12-month rolling window across the full sample (131 months, 2014–2024). Crisis periods were defined as the bottom decile of entropy (indicating reduced diffusion capacity) or the top decile of percolation threshold (indicating fragile connectivity). A signal was generated whenever either Z-score fell below .
The evaluation compared predicted signals against observed crisis and non-crisis windows (Table 8). Out of 13 crisis episodes, 8 were correctly anticipated (hit rate ), while 5 were missed. Importantly, false alarms were very limited (three cases, ≈2.5% of tranquil periods). The indicators correctly stayed silent in 115 out of 118 non-crisis periods, yielding a true negative rate of ≈97.5%.
Table 8.
Backtesting performance of entropy rate and percolation threshold Z-scores as early-warning indicators (12-month rolling window).
Therefore, the entropy rate and percolation threshold Z-scores demonstrate practical predictive power: they identify the majority of stress regimes while rarely producing false alarms. This balance suggests they are effective early-warning tools, even though some crises remain undetected.
4.4. Structural Shifts and Vulnerabilities
Alongside this core is the bulk/energy spine of the network, formed primarily by the strong link between the BDI and coal prices (CPUS). As a global dry bulk shipping index, the BDI not only reflects changes in the supply–demand balance for vessel capacity but is also highly sensitive to activity in energy-intensive industries. Simultaneous increases in BDI and CPUS are clear signals of rising demand in sectors such as steel, power generation, and cement—industries that directly influence energy demand. This situation is often accompanied by constraints in shipping capacity, which can significantly raise input costs for industrial and manufacturing sectors. The role of intermediate indices like GAUP (aluminum prices) is also significant: their linkage with container indices shows that fluctuations in raw material prices and transportation costs often occur in tandem and under certain conditions can reinforce each other’s effects, especially when transport bottlenecks and commodity price shocks happen simultaneously, amplifying volatility in global manufacturing output.
In contrast to these two pivotal pillars, the shipping equity market, represented by ASMC, holds a peripheral role in the mutual information network structure. This market tends to react to existing operational and pricing changes rather than drive them. This characteristic suggests that equity market data may be better suited as a downstream confirmation indicator of prevailing conditions. At the same time, operational indices (such as MPCT) and price indices (like CCFI and BDI) are more appropriate for proactive monitoring and forecasting.
Analysis of the network’s structural dynamics—using measures such as the entropy rate and percolation threshold—shows that the system does not evolve gradually but instead shifts abruptly from one regime to another. Such regime jumps occurred in 2015–2016, 2018–2019, 2021–2022, and late 2023–2024, aligning with major macroeconomic phases: economic slowdown and exchange rate adjustments, escalating international trade tensions, pandemic-induced disruptions and subsequent reopening, and energy/logistics shocks. A common feature of these periods was a temporary drop in the network’s average degree and an increase in average path length, indicating a less compact, less redundant network structure and reduced resilience.
As seen in Figure 13 and Figure 14, early-warning indicators add further depth to these findings. A drop in the entropy Z-score below signals a reduction in diversity and increased synchronization of market movements—a hallmark of stress periods when correlations rise and diversification breaks down. A decline in the percolation Z-score indicates that the network’s connectivity backbone becomes easier to fragment, with fewer edge removals needed to break it apart, reflecting increased chokepoint risk in logistics. Notably, percolation warnings occur more frequently than entropy warnings, implying that even when diversity recovers, the system’s structural cohesion often remains compromised. When both indicators breach thresholds simultaneously, the system enters a high-risk state in which even minor shocks can cascade into large-scale disruptions.
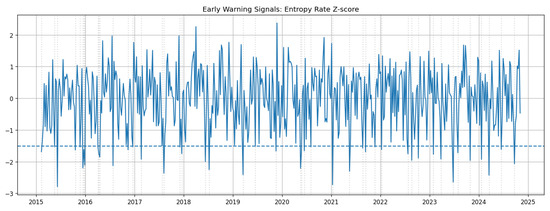
Figure 13.
Early warning signal based on the entropy rate Z-score of the PMFG network. Downward excursions below (dashed) indicate reduced diffusion capacity and adaptive diversity.
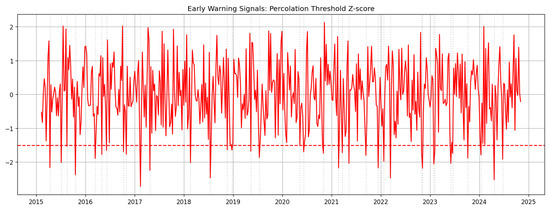
Figure 14.
Early warning signal based on the percolation threshold Z-score. Downward breaches below (dashed) indicate a connectivity backbone that becomes easier to fragment under edge removal.
Stress test results further clarify the system’s resilience profile. The network remains largely intact under random edge removals until very high removal rates (around 70–80%), reflecting real-world redundancy in the form of multiple carriers, routes, and counterparties. However, targeted removal of just a few key hubs causes steep declines in the entropy rate, revealing the high concentration of diffusion capacity in a small number of nodes. This critical node problem has direct implications for risk management, as the closure of a major port, a sudden spike in container rates, or disruption of a key bulk corridor can sharply reduce flexibility across the entire system—even if most routes remain open. These results emphasize that understanding the dynamics of China’s maritime–commodity system requires a simultaneous focus on network structure, operational and price indicators, and regime transitions. Such an integrated approach not only aids in identifying vulnerabilities and designing resilience-enhancing policies but also provides the foundation for developing early-warning tools and managing future shocks across the global supply chain. It is worth noting that the qualitative patterns observed in the stress tests align closely with real-world disruptions. During the COVID-19 pandemic, for instance, the temporary closure of major Chinese ports such as Shanghai and Ningbo caused sharp losses in diffusion capacity despite the global maritime system largely remaining connected—mirroring the model’s finding that targeted node outages are disproportionately damaging compared to diffuse link failures. Likewise, the 2021–2022 energy crisis underscored the vulnerability of bulk and energy corridors, consistent with the systemic importance of the BDI–CPUS spine in our network. These parallels suggest that the framework not only captures theoretical fragilities but also reflects practical vulnerabilities, offering policymakers guidance on where monitoring and contingency planning can deliver the greatest resilience gains.
5. Conclusions
This paper set out to measure and interpret systemic risk in China’s maritime–commodity nexus using a dynamic information-theoretic network framework. Drawing on eight monthly indicators spanning freight markets, port activity, commodities, and listed shipping equities, we combined sliding-window mutual information (MI) with topology-preserving filtering (PMFG), bootstrap edge validation, and robustness analysis. The approach was designed to recover nonlinear and time-varying dependencies while retaining redundant pathways that matter for propagation and resilience.
The empirical structure that emerges is economically intuitive and statistically consistent. Average MI levels are moderate yet heterogeneous, revealing a persistent container/port core—anchored by CCFI, YRCFI, and MPCT—and a complementary bulk/energy spine centered on BDI and CPUS, with GAUP acting as a commodity bridge and ASMC remaining peripheral. This configuration links price formation in container and bulk freight to the real economy through capacity utilization at major ports and the energy-intensive production cycle.
Network dynamics show that cohesion and diffusion capacity are not constant but instead fluctuate in identifiable phases. Global PMFG metrics point to a generally robust system with episodic drops in density and compactness, visible as declines in average degree and spikes in average path length. These fluctuations align with periods when edges thin out in cross-domain channels, leaving the container/port core to carry a larger share of information flow and, by implication, operational risk.
Two complementary diagnostics sharpen the time dimension of risk. First, early-warning indicators based on the entropy rate and percolation threshold Z-scores flag windows when diffusion capacity becomes unusually concentrated and the connectivity backbone is easier to fragment. Second, PELT change point detection on these same metrics identifies clustered regime shifts (2015–2016, 2018–2019, 2021–2022, and late 2023–2024). The co-occurrence of Z-score breaches and structural breaks implies that fragility tends to arrive in bursts—consistent with synchronized macro shocks or sudden logistical constraints that move multiple markets together.
Stress testing clarifies what kinds of shocks the system can absorb. Under random edge failures, connectivity remains high until very large fractions of links are removed (roughly 70–80%), indicating substantial redundancy in transactional or routing options under normal conditions. In contrast, targeted multi-node outages cause immediate losses in entropy rate even for small k, demonstrating that a handful of hubs concentrate diffusion capacity. Economically, this is the critical node problem: disruptions at major ports or sharp shifts in container pricing can curtail flexibility system-wide even when many alternative links remain available.
To translate topology into priorities, we aggregated centrality and impact into a Systemic Importance Index (SII). MPCT and CCFI are consistently the most critical nodes, followed by BDI; GAUP and CPUS are mid-peripheral bridges, and ASMC is peripheral in information flow terms. This ranking provides an operational hierarchy for risk governance: protecting throughput (MPCT) and stabilizing container rate formation (CCFI) deliver the largest resilience gains, while monitoring the bulk/energy channel (BDI–CPUS) is essential when industrial demand and energy prices move in tandem.
The economic implications are immediate. Tight container markets and constrained port throughput raise trade logistics costs, amplify inventory cycles, and, with lags, pressure tradable inflation. Strength in the bulk/energy spine signals capacity tightness in heavy industry and higher transport input costs, with potential spillovers to manufacturing margins. Because equities (ASMC) are downstream in the network, they are better interpreted as validators of conditions revealed earlier in operational and price indicators, rather than as early movers.
For policy and management, the evidence supports a consensus trigger approach to surveillance and response. Simultaneous breaches in entropy- and percolation-based Z-scores should activate intensified monitoring and targeted stress scenarios focused on MPCT and CCFI. On the operations side, surge capacity, dynamic berth allocation, hinterland smoothing, and contract design or hedging around container rates are the most direct levers to dampen propagation. On the market side, closer coordination of bunker fuel, coal, and ore logistics mitigates the risk that energy shocks and freight tightness reinforce each other.
The maritime–commodity system exhibits a robust yet regime-prone architecture organized around a small set of critical hubs. By integrating information-theoretic dependence, topology-aware filtering, dynamic diagnostics, and impact-based ranking, the framework provides a practical blueprint for early warning, prioritized monitoring, and stress preparedness. Strengthening capacity and price stability at the container/port core—while surveilling the bulk/energy spine—offers the greatest leverage for enhancing systemic resilience in China’s maritime transport network. Future research could extend this framework by integrating macroeconomic indicators—such as GDP growth, exchange rates, inflation, and PMI—to capture broader demand, policy, and financial linkages and by applying advanced machine learning and deep learning techniques, including graph neural networks and attention-based temporal models, to enhance predictive power and early-warning capability.
Author Contributions
Conceptualization, A.S.K.; data curation, A.S.K. and C.W.; formal analysis, L.X., A.S.K., H.C. and C.W.; funding acquisition, L.X.; investigation, A.S.K. and H.C.; methodology, L.X. and A.S.K.; project administration, A.S.K.; resources, A.S.K., H.C. and C.W.; software, A.S.K., H.C. and C.W.; supervision, L.X. and H.C.; validation, A.S.K., H.C. and C.W.; visualization, A.S.K. and C.W.; writing—original draft, L.X. and A.S.K.; writing—review and editing, A.S.K. All authors have read and agreed to the published version of the manuscript.
Funding
This research was funded by the Water Transport Economics Research Center, Yibin, Sichuan Province, China (grant number 412-SYJJ2024A03).
Data Availability Statement
The raw data supporting the conclusions of this article will be made available by the authors on request.
Conflicts of Interest
The authors declare no conflicts of interest.
Appendix A
Appendix Market Capitalization-Weighted Index Construction
Let denote the price of stock i at time t, and let be the market capitalization of stock i at the base time . We first define the weight of stock i in the index as follows:
where N is the total number of stocks in the index.
The market cap-weighted index value at time t is then computed as the weighted sum of the stock prices:
If desired, the index can be scaled to start at a base value by applying
In this construction, the following hold:
- The weights are fixed over time and determined by the initial market capitalizations.
- Missing price data is handled by forward-filling and back-filling from available observations.
- The index directly reflects changes in constituent prices proportionally to their market value in the base period.
The table lists 14 Chinese shipping, port, and related logistics companies along with their stock tickers. These companies were included in constructing a market cap-weighted stock index, where each company’s influence on the index is proportional to its market capitalization. The accompanying chart shows the historical performance of this index from around 2013 to 2025, reflecting aggregated price movements of these companies over time.

Figure A1.
Historical performance of the market cap-weighted stock index of selected Chinese shipping and port companies, showing aggregated market trends from 2014 to 2024.
Figure A1.
Historical performance of the market cap-weighted stock index of selected Chinese shipping and port companies, showing aggregated market trends from 2014 to 2024.

| Algorithm A1: Dynamic PMFG construction, validation, and robustness. |
 |
Table A1.
Constituent companies and their stock tickers used in constructing the market cap-weighted stock index for the Chinese shipping and port sector.
Table A1.
Constituent companies and their stock tickers used in constructing the market cap-weighted stock index for the Chinese shipping and port sector.
| No. | Ticker | Company Name |
|---|---|---|
| 1 | 601866.SS | COSCO SHIPPING Development Co., Ltd. |
| 2 | 601919.SS | COSCO SHIPPING Holdings Co., Ltd. |
| 3 | 600026.SS | COSCO SHIPPING Energy Transportation Co., Ltd. |
| 4 | 601872.SS | China Merchants Energy Shipping Co., Ltd. |
| 5 | 600279.SS | Chongqing Port Co., Ltd. |
| 6 | 600751.SS | HNA Technology Co., Ltd. |
| 7 | 601008.SS | Jiangsu Lianyungang Port Co., Ltd. |
| 8 | 600717.SS | Tianjin Port Holdings Co., Ltd. |
| 9 | 601018.SS | Ningbo Zhoushan Port Company Limited |
| 10 | 601798.SS | Lanpec Technologies Limited |
| 11 | 601000.SS | TangShan Port Group Co., Ltd. |
| 12 | 600017.SS | Rizhao Port Co., Ltd. |
| 13 | 600190.SS | Jinzhou Port Co., Ltd. |
| 14 | 600018.SS | Shanghai International Port (Group) Co., Ltd. |
References
- Abeyratne, R. Promoting Global Trade Through Air and Maritime Transport – Some Recent Transformational ICAO and IMO Plans. Estey J. Int. Law Trade Policy 2024, 25, 68–93. [Google Scholar] [CrossRef]
- Burigana, F. Container Freight Rates, Maritime Transport Costs and Their Impact on Trade and Prices. Master’s Thesis, Università Ca’Foscari Venezia, Venice, Italy, 2022. [Google Scholar]
- Xu, X.; Huang, X.; Wang, L. Empty container repositioning problem using a reinforcement learning framework with multi-weight adaptive reward function. Marit. Policy Manag. 2024, 51, 1742–1763. [Google Scholar] [CrossRef]
- Ye, S.; Qi, X.; Xu, Y. Analyzing the relative efficiency of China’s Yangtze River port system. Marit. Econ. Logist. 2020, 22, 640–660. [Google Scholar] [CrossRef]
- Chen, S.; Meng, B.; Qiu, B.; Kuang, H. Dynamic effects of maritime risk on macroeconomic and global maritime economic activity. Transp. Policy 2025, 167, 246–263. [Google Scholar] [CrossRef]
- Renn, O.; Laubichler, M.; Lucas, K.; Kröger, W.; Schanze, J.; Scholz, R.W.; Schweizer, P.J. Systemic risks from different perspectives. Risk Anal. 2022, 42, 1902–1920. [Google Scholar] [CrossRef]
- Notteboom, T.; Pallis, T.; Rodrigue, J.P. Disruptions and resilience in global container shipping and ports: The COVID-19 pandemic versus the 2008–2009 financial crisis. Marit. Econ. Logist. 2021, 23, 179–210. [Google Scholar] [CrossRef]
- Singh, V.K.; Kumar, P. Beyond volatility: Systemic resilience and risk mitigation in interconnected commodity markets. Energy Econ. 2024, 140, 107953. [Google Scholar] [CrossRef]
- Yang, S.; Fu, Y. Interconnectedness among supply chain disruptions, energy crisis, and oil market volatility on economic resilience. Energy Econ. 2025, 143, 108290. [Google Scholar] [CrossRef]
- UNCTAD. Review of Maritime Transport 2023: Towards a Green and Just Transition; United Nations iLibrary: Tokyo, Japan, 2023. [Google Scholar] [CrossRef]
- Koritarov, T.D.; Dimitrakiev, R.D. Analyzing the Interplay Between International Commodity Prices and Maritime Freight Rates. Int. J. Innov. Sci. Res. Technol. 2025, 10, 35–40. [Google Scholar] [CrossRef]
- Gui, D.; Wang, H.; Yu, M. Risk Assessment of Port Congestion Risk during the COVID-19 Pandemic. J. Mar. Sci. Eng. 2022, 10, 150. [Google Scholar] [CrossRef]
- Monios, J.; Wilmsmeier, G. Deep adaptation to climate change in the maritime transport sector–a new paradigm for maritime economics? Marit. Policy Manag. 2020, 47, 853–872. [Google Scholar] [CrossRef]
- Khoojine, A.S.; Han, D. Network analysis of the Chinese stock market during the turbulence of 2015–2016 using log-returns, volumes, and mutual information. Phys. A Stat. Mech. Its Appl. 2019, 523, 1091–1109. [Google Scholar] [CrossRef]
- Khoojine, A.S.; Dong, H. Topological Structure of Stock Market Networks during Financial Turbulence: Non-Linear Approach. Univers. J. Account. Financ. 2019, 7, 106–121. [Google Scholar] [CrossRef]
- Khoojine, A.S.; Han, D. Stock price network autoregressive model with application to stock market turbulence. Eur. Phys. J. B 2020, 93, 133. [Google Scholar] [CrossRef]
- Cheng, L.; Shadabfar, M.; Sioofy Khoojine, A. A State-of-the-Art Review of Probabilistic Portfolio Management for Future Stock Markets. Mathematics 2023, 11, 1148. [Google Scholar] [CrossRef]
- Xiao, L.; Sioofy Khoojine, A. Dynamic Anomaly Detection in the Chinese Energy Market During Financial Turbulence Using Ratio Mutual Information and Crude Oil Price Movements. Energies 2024, 17, 5852. [Google Scholar] [CrossRef]
- Zhang, D.; Yan, X.; Yang, Z.; Wall, A.; Wang, J. Incorporation of formal safety assessment and Bayesian network in navigational risk estimation of the Yangtze River. Reliab. Eng. Syst. Saf. 2013, 118, 93–105. [Google Scholar] [CrossRef]
- Wu, B.; Wang, Y.; Zong, L.; Soares, C.G.; Yan, X. Modelling the collision risk in the Yangtze River using Bayesian networks. In Proceedings of the 2017 4th International Conference on Transportation Information and Safety (ICTIS), Banff, AB, Canada, 8–10 August 2017; pp. 503–509. [Google Scholar] [CrossRef]
- Wang, L.; Yang, Z. Bayesian network modelling and analysis of accident severity in waterborne transportation: A case study in China. Reliab. Eng. Syst. Saf. 2018, 180, 277–289. [Google Scholar] [CrossRef]
- Fan, S.; Yang, Z.; Blanco-Davis, E.; Zhang, J.; Yan, X. Analysis of maritime transport accidents using Bayesian networks. Proc. Inst. Mech. Eng. Part O J. Risk Reliab. 2020, 234, 439–454. [Google Scholar] [CrossRef]
- Li, H.; Ren, X.; Yang, Z. Data-driven Bayesian network for risk analysis of global maritime accidents. Reliab. Eng. Syst. Saf. 2023, 230, 108938. [Google Scholar] [CrossRef]
- Feng, Y.; Wang, H.; Xia, G.; Cao, W.; Li, T.; Wang, X.; Liu, Z. A machine learning-based data-driven method for risk analysis of marine accidents. J. Mar. Eng. Technol. 2024, 24, 147–158. [Google Scholar] [CrossRef]
- Jia, X.; Zhang, D. Prediction of maritime logistics service risks applying soft set based association rule: An early warning model. Reliab. Eng. Syst. Saf. 2021, 207, 107339. [Google Scholar] [CrossRef]
- Han, D.; Sui, Z.; Xiao, C.; Wen, Y. Reliability of Inland Water Transportation Complex Network Based on Percolation Theory: An Empirical Analysis in the Yangtze River. J. Mar. Sci. Eng. 2024, 12, 2361. [Google Scholar] [CrossRef]
- Zhao, X.; Yuan, H.; Yu, Q. Autonomous Vessels in the Yangtze River: A Study on the Maritime Accidents Using Data-Driven Bayesian Networks. Sustainability 2021, 13, 9985. [Google Scholar] [CrossRef]
- Carrière-Swallow, Y.; Deb, P.; Furceri, D.; Jiménez, D.; Ostry, J.D. Shipping Costs and Inflation. J. Int. Money Financ. 2023, 130, 102771. [Google Scholar] [CrossRef]
- Dionysopoulos, L.; Marra, M.; Urquhart, A. Central bank digital currencies: A critical review. Int. Rev. Financ. Anal. 2024, 91, 103031. [Google Scholar] [CrossRef]
- Anderl, C.; Caporale, G.M. Shipping cost uncertainty, endogenous regime switching and the global drivers of inflation. Int. Econ. 2024, 178, 100500. [Google Scholar] [CrossRef]
- LaRock, T.; Xu, M.; Eliassi-Rad, T. A path-based approach to analyzing the global liner shipping network. EPJ Data Sci. 2022, 11, 18. [Google Scholar] [CrossRef]
- Xu, M.; Zhu, Y.; Liu, K.; Ng, A.K.Y. Assessing resilience of global liner shipping network to tropical cyclones. Transp. Res. Part D Transp. Environ. 2024, 131, 104189. [Google Scholar] [CrossRef]
- Verschuur, J.; Green, M.; Hall, J.W. Ports’ criticality in international trade and global supply-chains. Nat. Commun. 2022, 13, 264. [Google Scholar] [CrossRef]
- Verschuur, J.; Koks, E.E.; Li, S.; Hall, J.W. Multi-hazard risk to global port infrastructure and resulting trade and logistics losses. Commun. Earth Environ. 2023, 4, 5. [Google Scholar] [CrossRef]
- Liao, P.; Lu, W.; Yan, M. Identification and Assessment of Critical Waterways in Water Network Areas from a Community Detection Perspective. Water 2025, 17, 1529. [Google Scholar] [CrossRef]
- Rouz, O.F.; Vafa, H.S.; Khoojine, A.S.; Amiri, S.P. Interconnectedness of systemic risk in the Chinese economy: The Granger causality and CISS indicator approach. Risk Manag. 2024, 26, 9. [Google Scholar] [CrossRef]
- Park, K.; Kim, H.; Cha, J. An Exploratory Study on the Development of a Crisis Index: Focusing on South Korea’s Petroleum Industry. Energies 2023, 16, 5346. [Google Scholar] [CrossRef]
- di Giovanni, J.; Kalemli-Özcan, Ş.; Silva, A.; Yıldırım, M.A. Global Supply Chain Pressures, International Trade, and Inflation; Staff Report 1024, Federal Reserve Bank of New York; National Bureau of Economic Research: Cambridge, MA, USA, 2022. [Google Scholar] [CrossRef]
- Kraskov, A.; Stögbauer, H.; Grassberger, P. Estimating mutual information. Phys. Rev. E 2004, 69, 066138. [Google Scholar] [CrossRef] [PubMed]
- Tumminello, M.; Aste, T.; Matteo, T.D.; Mantegna, R.N. A tool for filtering information in complex systems. Proc. Natl. Acad. Sci. USA 2005, 102, 10421–10426. [Google Scholar] [CrossRef] [PubMed]
- Sioofy Khoojine, A.; Shadabfar, M.; Edrisi Tabriz, Y. A Mutual Information-Based Network Autoregressive Model for Crude Oil Price Forecasting Using Open-High-Low-Close Prices. Mathematics 2022, 10, 3172. [Google Scholar] [CrossRef]
- Khoojine, A.S.; Feng, Z.; Shadabfar, M.; Khoojine, N.S. Analyzing volatility patterns in the Chinese stock market using partial mutual information-based distances. Eur. Phys. J. B 2023, 96, 165. [Google Scholar] [CrossRef]
- Truong, C.; Oudre, L.; Vayatis, N. Selective review of offline change point detection methods. Signal Process. 2020, 167, 107299. [Google Scholar] [CrossRef]
- Chinazzi, M.; Fagiolo, G. Systemic risk, contagion, and financial networks: A survey. In Contagion, and Financial Networks: A Survey (3 June 2015); SSRN: Rochester, NY, USA, 2015. [Google Scholar]
- Zou, Y.; Xu, J.; Chen, Y. Volatility, correlation and risk spillover effect between freight rates in BCI and BPI markets: Evidence from static and dynamic GARCH-Copula and dynamic CoVaR models. PLoS ONE 2025, 20, e0315167. [Google Scholar] [CrossRef]
- Sun, X.; Liu, C.; Wang, J.; Li, J. Assessing the extreme risk spillovers of international commodities on maritime markets: A GARCH-Copula-CoVaR approach. Int. Rev. Financ. Anal. 2020, 68, 101453. [Google Scholar] [CrossRef]
- Nurmaryadi, E.; Hanggraeni, D. Measurement of Expected Shortfall, Correlation and Simulation of Stock Return in The Transportation Sector in Asia’s Emerging Stock Exchanges Before and After The COVID-19 Pandemic. Quant. Econ. Manag. Stud. 2023, 4, 904–924. [Google Scholar]


Disclaimer/Publisher’s Note: The statements, opinions and data contained in all publications are solely those of the individual author(s) and contributor(s) and not of MDPI and/or the editor(s). MDPI and/or the editor(s) disclaim responsibility for any injury to people or property resulting from any ideas, methods, instructions or products referred to in the content. |
© 2025 by the authors. Licensee MDPI, Basel, Switzerland. This article is an open access article distributed under the terms and conditions of the Creative Commons Attribution (CC BY) license (https://creativecommons.org/licenses/by/4.0/).