Article

A New Topp–Leone Odd Weibull Flexible-G Family of Distributions with Applications

by
Fastel Chipepa
1,
Mahmoud M. Abdelwahab
2,
Wellington Fredrick Charumbira
1,3 and
Mustafa M. Hasaballah
4,*
1
Department of Mathematics and Statistical Sciences, Botswana International University of Science and Technology, Private Bag 0016, Palapye, Botswana
2
Department of Mathematics and Statistics, Faculty of Science, Imam Mohammad Ibn Saud Islamic University (IMSIU), Riyadh 11432, Saudi Arabia
3
Department of Applied Mathematics and Statistics, Midlands State University, Private Bag 9055, Gweru, Zimbabwe
4
Department of Basic Sciences, Marg Higher Institute of Engineering and Modern Technology, Cairo 11721, Egypt
*
Author to whom correspondence should be addressed.
Mathematics 2025, 13(17), 2866; https://doi.org/10.3390/math13172866
Submission received: 24 July 2025 / Revised: 21 August 2025 / Accepted: 2 September 2025 / Published: 5 September 2025
(This article belongs to the Section D1: Probability and Statistics)

Abstract

The acceptance of generalized distributions has significantly improved over the past two decades. In this paper, we introduce a new generalized distribution: Topp–Leone odd Weibull flexible-G family of distributions (FoD). The new FoD is a combination of two FOD; the Topp–Leone-G and odd Weibull-flexible-G families. The proposed FoD possesses more flexibility compared to the two individual FoD when considered separately. Some selected statistical properties of this new model are derived. Three special cases from the proposed family are considered. The new model exhibits symmetry and long or short tails, and it also addresses various levels of kurtosis. Monte Carlo simulation studies were conducted to verify the consistency of the maximum likelihood estimators. Two real data examples were used as illustrations on the flexibility of the new model in comparison to other competing models. The developed model proved to perform better than all the selected competing models.

1. Introduction

1.1. Background

The main objective of distribution theory is the development and application of new distributions to diverse fields of research. Many distributions and families of distributions have been developed and received attention from researchers in the fields of sports science, survival and reliability studies, engineering, economics, insurance, agriculture, and environmental science, among others. Generalized distributions have become more acceptable over the last three decades compared to classical distributions. Generalized distributions often result in extra parameters that cater for either skewness or kurtosis or both. Some generators do not add extra parameters to existing models but rather transform the distribution into a new distribution, for example, the half logistic generator, which is a sub-model of the exponentiated half logistic generator by Cordeiro et al. [1] and flexible-G generator by Tahir et al. [2].
One of the most prominent distribution with wider applications in life testing and reliability studies is the Topp–Leone distribution by Topp and Leone [3]. This distribution has a bathtub failure rate, which makes it more useful in lifetime analysis. The Topp–Leone distribution has a limitation whereby it is defined on a bounded interval (0,1). Al-Shomrani et al. [4] generalized the Topp–Leone distribution and proposed the Topp–Leone-G (TL-G) FoD using the T-X generator by Alzaatreh et al. [5] with the cumulative distribution function (cdf): Equations were checked and they are OK
F T L G ( z ; b , ν ̲ ) = 1 G ¯ 2 ( z ; ν ̲ ) b
and probability density function (pdf):
f T L G ( z ; b , ν ̲ ) = 2 b g ( z ; ν ̲ ) G ¯ ( z ; ν ̲ ) 1 G ¯ 2 ( z ; ν ̲ ) b 1 ,
for b > 0 , and parent parameter vector ν ̲ . The TL-G FoD broke the limitation of boundedness of the domain of the Topp–Leone distribution since it allows the incorporation of any baseline distribution and thus overcoming this limitation. Several researchers generalized other distributions using the TL-G FoD; these include Topp–Leone-generated families by Rezaei et al. [6], the Topp–Leone Odd Log-Logistic family by Brito et al. [7], Topp–Leone Burr-XII distribution by Reyad and Othman [8], the transmuted Topp–Leone-G by Yousof et al. [9], the exponentiated generalized Topp Leone-G family by Reyad et al. [10], and the DUS Topp–Leone-G Family by Ekemezie et al. [11], among others. These generalizations possess some desirable properties and have proven to be of utility in data modelling.
Tahir et al. [2] developed the new flexible generalized (F-G) FoD whose cdf and pdf are given by
F F G ( z ; ν ̲ ) = 1 G ¯ ( z ; ν ̲ ) G ( z ; ν ̲ )
and pdf
f F G ( z ; ν ̲ ) = g ( z ; ν ̲ ) G ¯ ( z ; ν ̲ ) G ( z ; ν ̲ ) G ( z ; ν ̲ ) G ¯ ( z ; ν ̲ ) log G ¯ ( z ; ν ̲ ) ,
for a parent parameter vector ν ̲ . The proposed distribution does not come from the generalization of any parent distribution, just as how the exponentiated-generalized-G by Cordeiro et al. [12], Lehmann alternative types 1 and 2 by Gupta et al. [13], Marshall–Olkin-G by Marshall and Olkin [14], and transmuted-G by Shaw and Buckley [15] were developed. Models generated from the F-G FoD do not have identifiability problems since the generator does not add any extra parameter. Ferreira and Cordeiro [16] used the F-G generator to further generalize the generalized gamma distribution, and the resultant model demonstrated more flexibility than the parent model.
Furthermore, Cordeiro et al. [17] developed a new odd Weibull flexible-G (WF-G) FoD using the F-G generator. Their new distribution generalizes the Weibull-G FoD by Bourguignon et al. [18]. The cdf and pdf of the WF-G FoD are given by
F W F G ( z ; α , ν ̲ ) = 1 exp G ¯ ( z ; ν ̲ ) G ( z ; ν ̲ ) 1 α
and
f W F G ( z ; α , ν ̲ ) = α g ( z ; ν ̲ ) G ¯ ( z ; ν ̲ ) G ( z ; ν ̲ ) G ( z ; ν ̲ ) G ¯ ( z ; ν ̲ ) log G ¯ ( z ; ν ̲ ) × G ¯ ( z ; ν ̲ ) G ( z ; ν ̲ ) 1 α 1 exp G ¯ ( z ; ν ̲ ) G ( z ; ν ̲ ) 1 α ,
for α > 0 , and parent parameter vector ν ̲ . The WF-G distribution was applied to heavily skewed datasets and the distribution has some interesting features in the pdf, like bimodality.

1.2. Motivational Example: Failure Time Data

The dataset used is from engineering research pertaining to appliance lifespan. It represents time to failure for 60 electrical appliances (see Lawless [19] for details). This dataset is used in engineering applications to analyze the lifespan of appliances. Descriptive statistics are shown in Table 1. Figure 1 represents the histogram and box-plot for this dataset. The plots in Figure 1 confirms that the data are skewed to the right and the box-plot detects some outlying values. From the exploratory analysis results, we hypothesize the Topp–Leone odd Weibull flexible-G (TL-OWF-G) as a suitable candidate to model this dataset. The proposed model adds an extra parameter to the WF-G FoD, which enhances modeling capabilities of the proposed distribution. The resultant models when the baseline distributions are specified are not overparameterized and demonstrated more flexibility in data modeling compared to other models with more parameters, as demonstrated in Section 6.
The remainder of this paper is arranged as follows: Section 2 introduces the new model and some statistical properties. We present in Section 3 three special models from the new FoD. Maximum Likelihood estimation (MLE) and Monte Carlo simulation study are presented in Section 4. Two real data applications are presented in Section 6 followed by conclusions in Section 7.

2. The New Family and Properties

We present the new Topp–Leone odd Weibull flexible-G (TL-OWF-G) FoD and some statistical properties in this section. In this paper, we add an extra parameter to the WF-G distribution using the TL-G generator. The motivation is to improve on the flexibility of the WF-G and the TL-G families as shown in Section 6, where the new distribution fits the selected datasets better than the prior families and other competing models.

2.1. Topp–Leone Odd Weibull Flexible-G Family

If we consider Equation (5) as the baseline distribution in Equation (3), we obtain the Topp–Leone odd Weibull flexible-G (TL-OWF-G), whose cdf is
F T L O W F G ( z ; b , α , ν ̲ ) = 1 exp 2 G ¯ ( z ; ν ̲ ) G ( z ; ν ̲ ) 1 α b
and pdf
f T L O W F G ( z ; b , α , ν ̲ ) = 2 α b g ( z ; ν ̲ ) G ¯ ( z ; ν ̲ ) G ( z ; ν ̲ ) G ( z ; ν ̲ ) G ¯ ( z ; ν ̲ ) log G ¯ ( z ; ν ̲ ) × G ¯ ( z ; ν ̲ ) G ( z ; ν ̲ ) 1 α 1 exp 2 G ¯ ( z ; ν ̲ ) G ( z ; ν ̲ ) 1 α × 1 exp 2 G ¯ ( z ; ν ̲ ) G ( z ; ν ̲ ) 1 α b 1 ,
for b , α > 0 , and parent parameter vector ν ̲ .

2.2. Properties

The quantile function of the TL-OWF-G FoD is defined as F 1 ( u ) = Q ( u ) for 0 u 1 . We invert Equation (7) using the following procedure:
u = 1 exp 2 G ¯ ( z ; ν ̲ ) G ( z ; ν ̲ ) 1 α b 1 u 1 / b = exp 2 G ¯ ( z ; ν ̲ ) G ( z ; ν ̲ ) 1 α ln ( 1 u 1 / b ) = 2 G ¯ ( z ; ν ̲ ) G ( z ; ν ̲ ) 1 α ln ( 1 u 1 / b ) 2 1 / α + 1 = G ¯ ( z ; ν ̲ ) G ( z ; ν ̲ )
(i)
Set s = ln ( 1 u 1 / b ) 2 1 / α + 1 .
(ii)
Solve for s, using the Newton Raphson algorithm, the non-linear equation G ¯ ( z ; ν ̲ ) G ( z ; ν ̲ ) = s .
We present in Table 2 quantile values when G ( z ; ν ̲ ) in Equation (9) is the Weibull distribution.
To obtain the linear representation of the new FoD, we will first express Equation (7) as a series expansion and then differentiate the result to obtain the linear representation of the pdf. Using the generalized binomial expansion and the result e x = q = 0 ( x ) q q ! , we get
F ( z ; b , α , ν ̲ ) = p , q = 0 ( 1 ) p ( 2 p ) q q ! p b G ¯ ( z ; ν ̲ ) G ( z ; ν ̲ ) 1 α q .
For 0 z < 1 , we state the convergent power series (PS) defined as
ρ ( z ) = ( 1 z ) z 1 = z 2 j = 0 ϕ j z j ,
where ϕ 0 = 1 , ϕ 1 = 1 2 , ϕ 2 = 5 6 , ϕ 3 = 3 4 , etc. Using a PS raised to a positive power (Apostol, 1974, p. 239 [20]), we have
G ¯ ( z ; ν ̲ ) G ( z ; ν ̲ ) 1 α q = G 2 ( z ; ν ̲ ) j = 0 ϕ j G j ( z ; ν ̲ ) α q =   G 2 α q ( z ; ν ̲ ) j = 0 β j ( α q ) G j ( z ; ν ̲ ) ,
where
β j = β α q = 1 , j = 0 1 j m = 0 j 1 [ j α q m ( α q + 1 ) ] ϕ m β j m , j > 0
yields
F ( z ; b , α , ν ̲ ) = j , p , q = 0 ( 1 ) p ( 2 p ) q q ! p b β α q G 2 α q + j ( z ; ν ̲ ) .
Through differentiation of Equation (10), we get
f ( z ; b , α , ν ̲ ) = j , p , q = 0 ( 1 ) p ( 2 p ) q q ! p b β α q ( 2 α q + j ) g ( z ; ν ̲ ) G 2 α q + j 1 ( z ; ν ̲ ) = j , p , q = 0 π j , p , q g 2 α q + j ( z ; ν ̲ ) ,
where
π j , p , q = ( 1 ) p ( 2 p ) q q ! ( 2 α q + j ) p b β α q
and g 2 α q + j ( z ; ν ̲ ) = ( 2 α q + j ) g ( z ; ν ̲ ) G 2 α q + j 1 ( z ; ν ̲ ) is an exponentiated-G (Exp-G) with parameter ( 2 α q + j ) . Many researchers have focused on the properties of the Exp-G and they are well documented. Equation (11) allows us to obtain the properties of the TL-OWF-G family of distributions. Let X 2 α q + j E x p G ( 2 α q + j ; ν ̲ ) , then the raw moments of TL-OWF-G FoD are derived from Equation (11) as
μ = E ( Z n ) = j , p , q = 0 π j , p , q E ( X 2 α q + j n ) .
The incomplete moment of Z is derived in the same manner. The moment-generating function (mgf) has the form
M Z ( t ) = j , p , q = 0 π j , p , q M 2 α q + j ( t ) ,
where M 2 α q + j ( t ) is the mgf of E x p G ( 2 α q + j ; ν ̲ ) . Rényi entropy of the TL-OWF-G FoD is derived directly from Equation (11) as follows:
I R ( ω ) = ( 1 ω ) 1 log 0 f ω ( z , b , ν ̲ ) d x = ( 1 ω ) 1 log 0 j , p , q = 0 π j , p , q g 2 α q + j ( z ; ν ̲ ) ω d x .

3. Special Models

We provide three special models of the TL-OWF-G FoD when the baseline distributions are Weibull, log-logistic, and Kumaraswamy. The new special models in this section are Topp–Leone Odd Weibull flexible-Weibull (TL-OWF-W), Topp–Leone Odd Weibull flexible-log-logistic (TL-OWF-LLoG), and Topp–Leone Odd Weibull flexible-Kumaraswamy (TL-OWF-Kum). We also provide the pdf and hazard rate function (hrf) plots for the special models.

3.1. TL-OWF-W Distribution

If the baseline is Weibull with cdf G ( z ; θ ) = 1 e z θ and pdf g ( z ; θ ) = θ z θ 1 e z θ , for z > 0 and θ > 0 , we obtain a new distribution called TL-OWF-W with the cdf
F ( z ; b , α , θ ) = 1 exp 2 [ e z θ ] ( 1 + e z θ ) 1 α b
and pdf
f ( z ; b , α , θ ) = 2 α b θ z θ 1 e z θ [ e z θ ] ( 1 + e z θ ) 1 e z θ [ e z θ ] log [ e z θ ] × [ e z θ ] ( 1 + e z θ ) 1 α 1 exp 2 [ e z θ ] ( 1 + e z θ ) 1 α × 1 exp 2 [ e z θ ] ( 1 + e z θ ) 1 α b 1 ,
for b , α , θ > 0 .
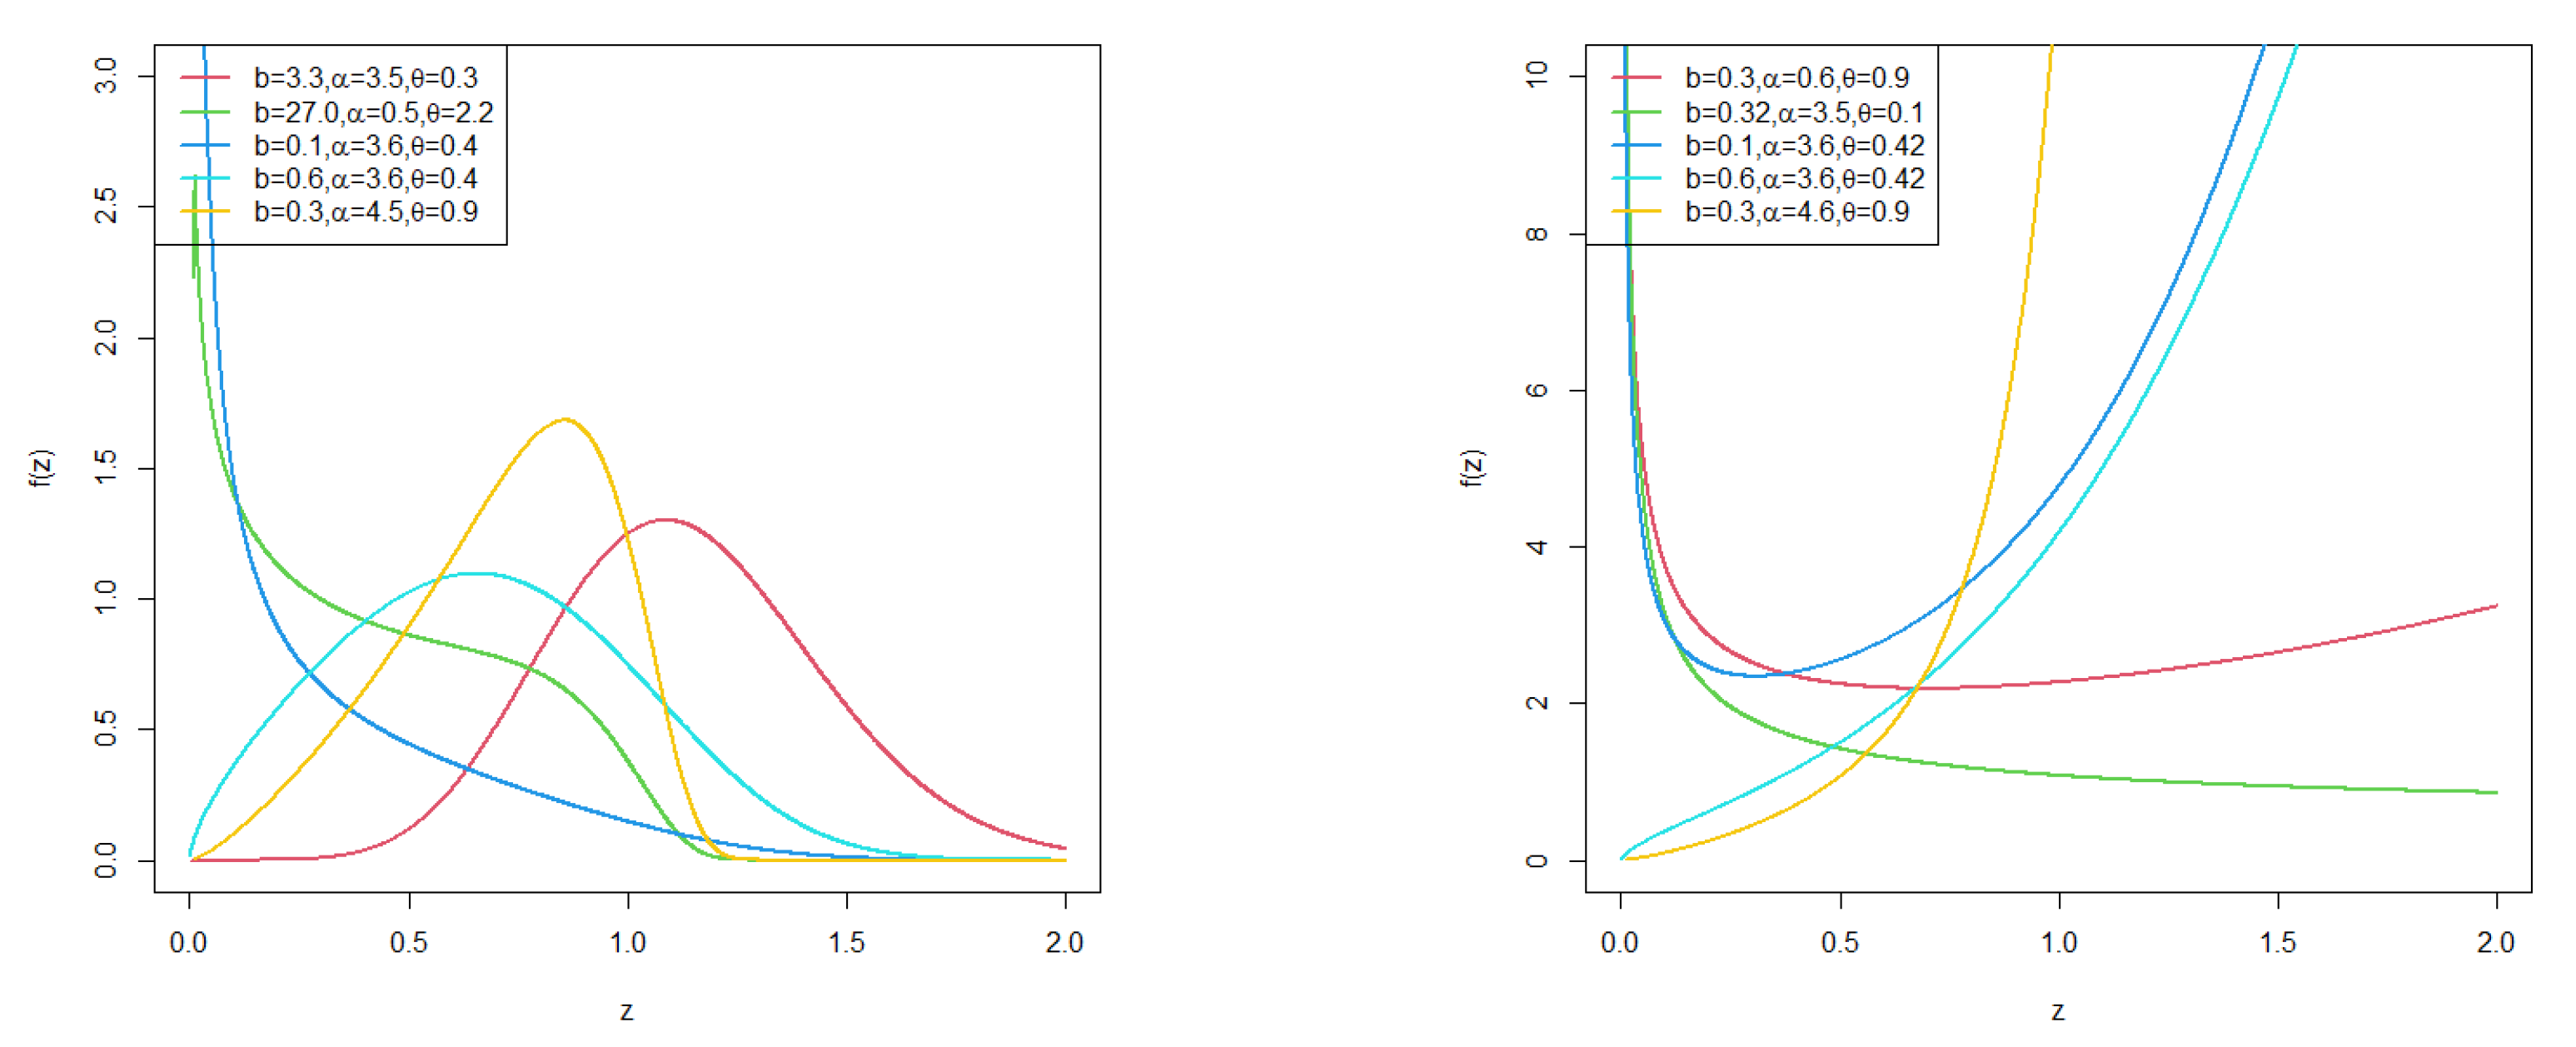
Figure 2 represents the pdf and hrf plots for the TL-OWF-W distribution. The pdf exhibits left- and right-skewed, almost symmetric, and reverse-J shapes. Graphs of hrf display monotonic and non-monotonic geometry.

3.2. TL-OWF-LLoG Distribution

If the parent distribution is log-logistic with cdf G ( z ; c ) = 1 ( 1 + z c ) 1 and pdf g ( z ; c ) = c z c 1 ( 1 + z c ) 2 , for z > 0 and c > 0 , we obtain the TL-OWF-LLoG distribution with cdf
F ( z ; b , α , c ) = 1 exp 2 [ ( 1 + z c ) 1 ] ( 1 + ( 1 + z c ) 1 ) 1 α b
and pdf
f ( z ; b , α , c ) = 2 α b c z c 1 ( 1 + z c ) 2 [ ( 1 + z c ) 1 ] ( 1 + ( 1 + z c ) 1 )                                     ×   1 ( 1 + z c ) 1 [ ( 1 + z c ) 1 ] log [ ( 1 + z c ) 1 ]                                     ×   [ ( 1 + z c ) 1 ] ( 1 + ( 1 + z c ) 1 ) 1 α 1                                     ×   exp 2 [ ( 1 + z c ) 1 ] ( 1 + ( 1 + z c ) 1 ) 1 α                                     ×   1 exp 2 [ ( 1 + z c ) 1 ] ( 1 + ( 1 + z c ) 1 ) 1 α b 1 ,
for b , α , c > 0 .
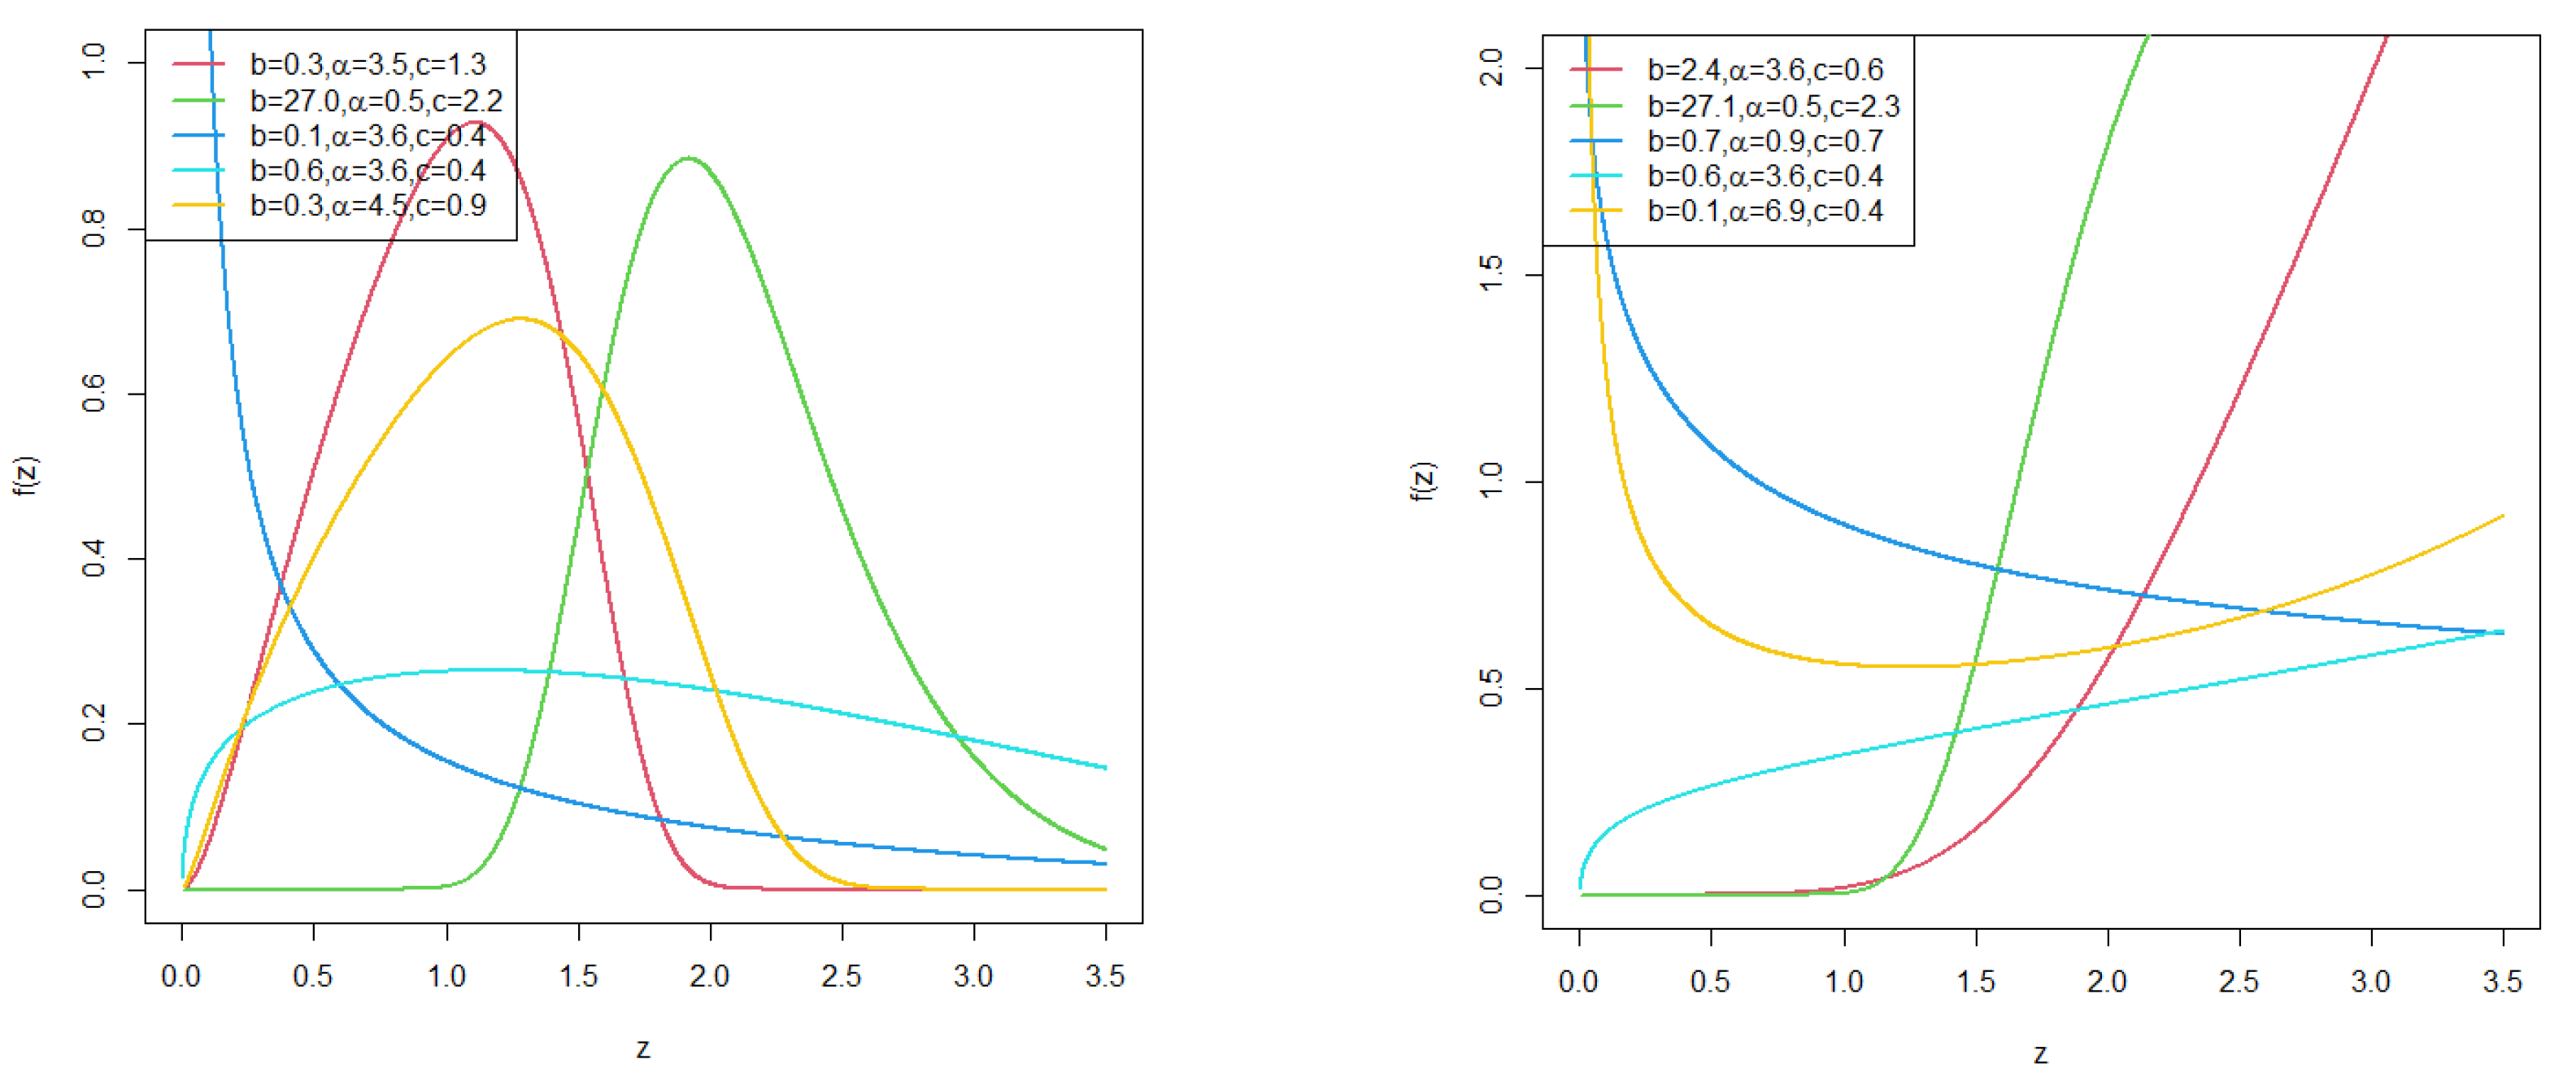
Graphs of the pdf in Figure 3 show different shapes, including left-skewed, reverse-J, and unimodal shapes. The hrf graphs display monotonic and non-monotonic shapes.

3.3. TL-OWF-Kum Distribution

If the parent distribution is Kumaraswamy with cdf G ( z ; δ , β ) = 1 ( 1 z δ ) β and pdf g ( z ; δ , β ) = δ β x δ 1 ( 1 z δ ) β 1 , for z > 0 and c > 0 , we obtain the TL-OWF-Kum distribution with cdf
F ( z ; b , α , δ , β ) = 1 exp 2 [ ( 1 z δ ) β ] ( 1 + ( 1 z δ ) β ) 1 α b
and pdf
f ( z ; b , α , δ , β ) = 2 α b β δ x δ 1 ( 1 z δ ) β 1 [ ( 1 z δ ) β ] ( 1 + ( 1 z δ ) β )                                               ×   [ ( 1 z δ ) β ] ( 1 + ( 1 z δ ) β ) 1 ( 1 z δ ) β [ ( 1 z δ ) β ] log [ ( 1 z δ ) β ]                                               ×   [ ( 1 z δ ) β ] ( 1 + ( 1 z δ ) β ) 1 α 1                                               ×   exp 2 [ ( 1 z δ ) β ] ( 1 + ( 1 z δ ) β ) 1 α                                               ×   1 exp 2 [ ( 1 z δ ) β ] ( 1 + ( 1 z δ ) β ) 1 α b 1 ,
for b , α , δ , β > 0 .
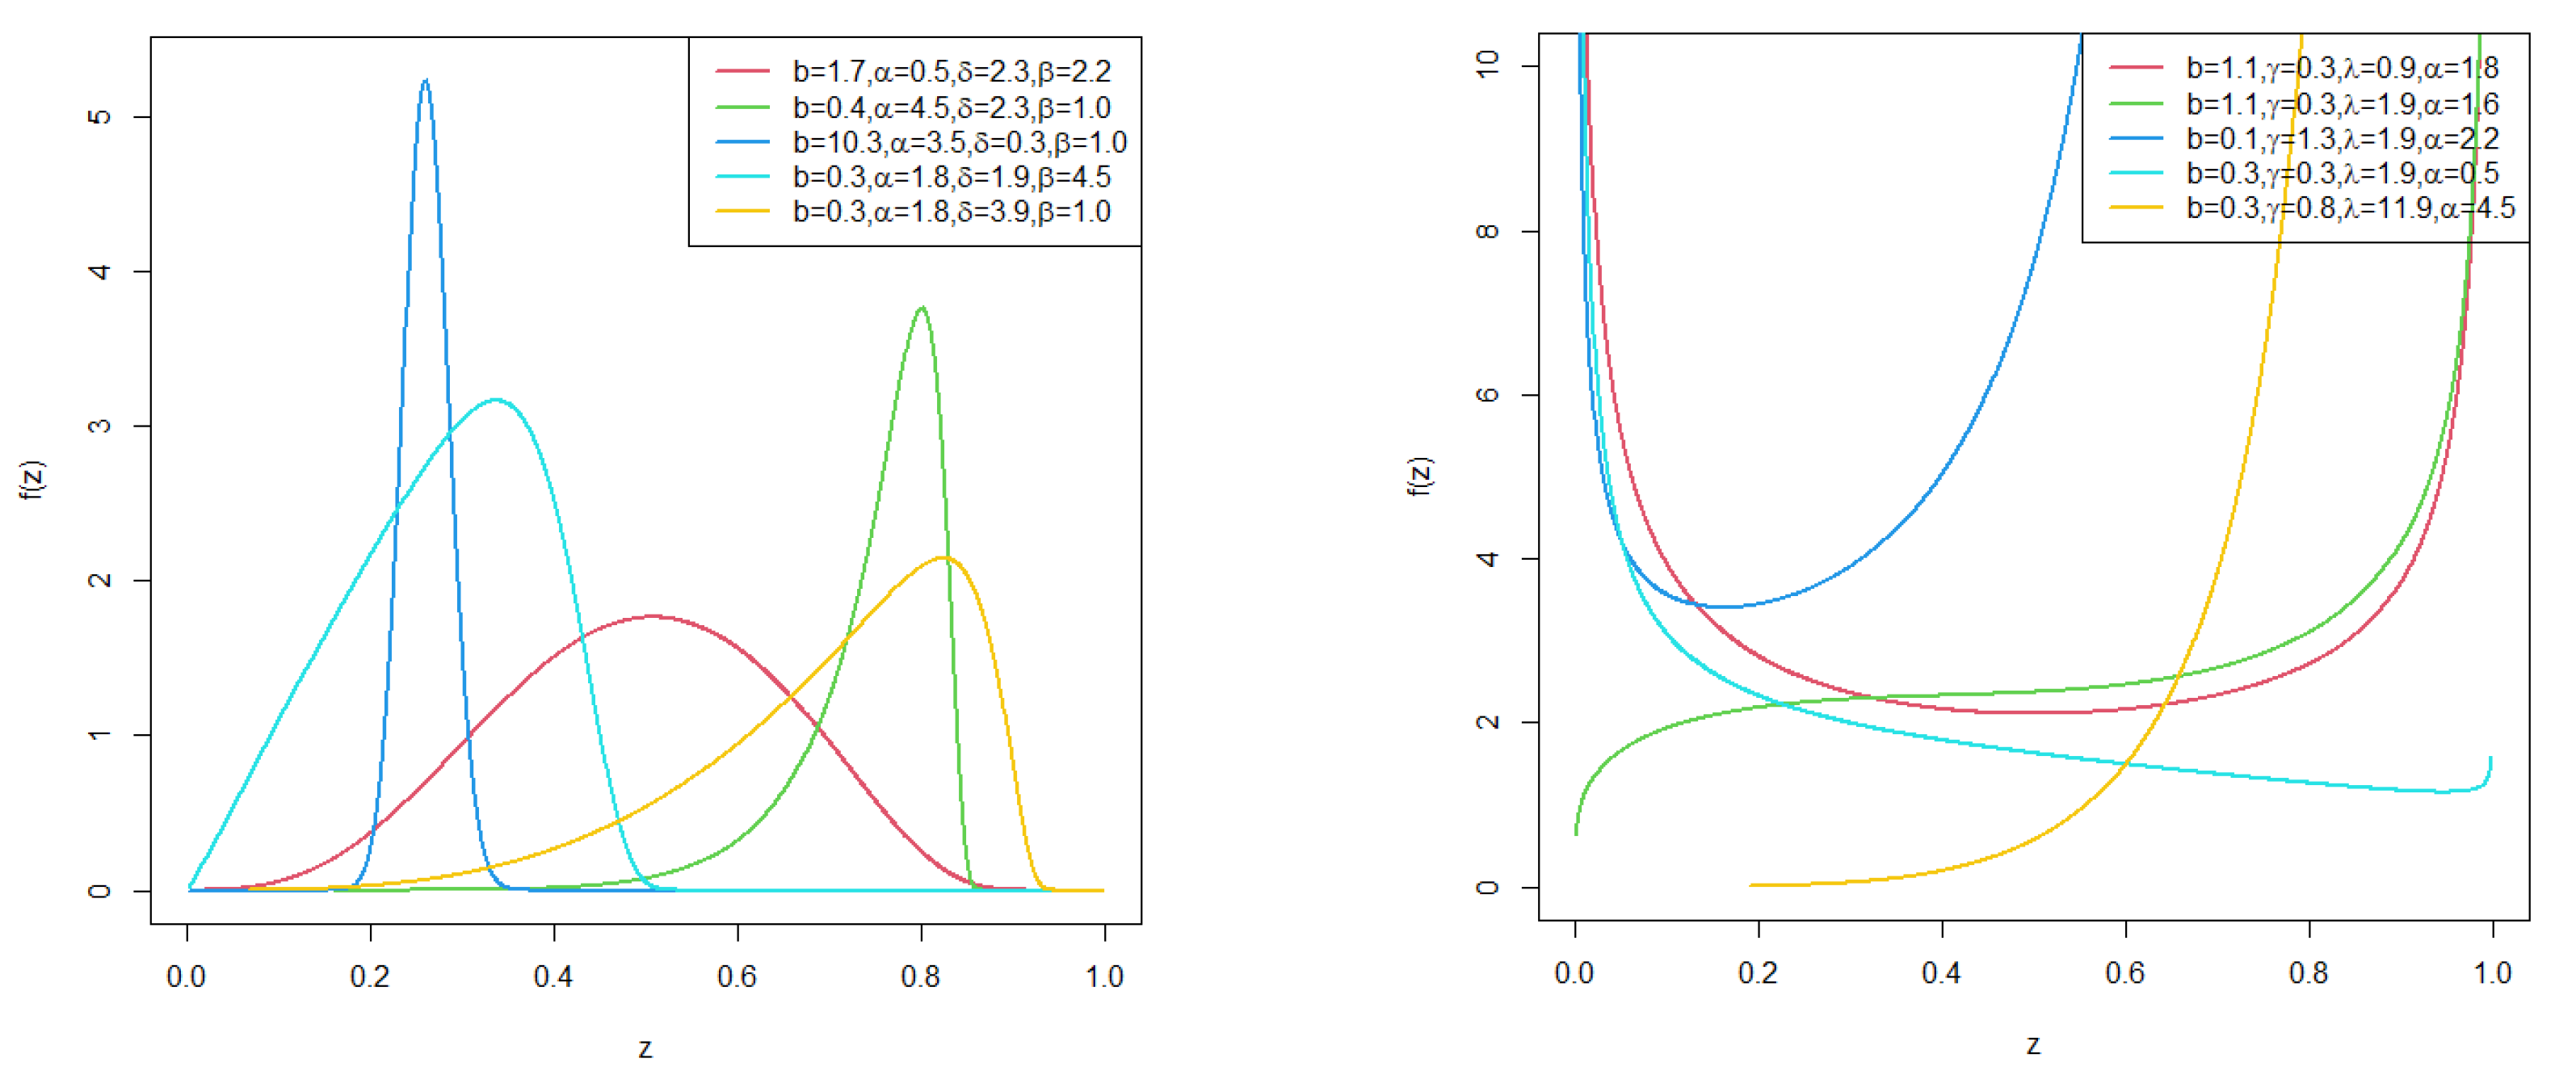
Graphs of the pdf in Figure 4 show different shapes, including left-skewed and unimodal shapes. The hrf graphs display monotonic and non-monotonic shapes.

4. Maximum Likelihood Estimation and Simulation Study

Maximum Likelihood Estimation

Let z 1 , . . . , z n be a set of observations from the TL-OWF-G distribution given by Equation (7). The total log-likelihood function for Θ = ( b , α , ν ̲ ) T is given by
= ( Θ ) = i = 1 n log ( 2 α b ) + i = 1 n log g ( z i ; ν ̲ ) i = 1 n [ G ( z i ; ν ̲ ) log G ¯ ( z i ; ν ̲ ) ]                                 +   i = 1 n log G ( z i ; ν ̲ ) G ¯ ( z i ; ν ̲ ) log G ¯ ( z i ; ν ̲ ) + ( α 1 ) i = 1 n log G ¯ ( z i ; ν ̲ ) G ( z i ; ν ̲ ) 1                                 +   ( b 1 ) i = 1 n log 1 exp 2 G ¯ ( z i ; ν ̲ ) G ( z i ; ν ̲ ) 1 α                                   2 i = 1 n G ¯ ( z i ; ν ̲ ) G ( z i ; ν ̲ ) 1 α .
The MLE estimates can be obtained by maximizing Equation (22) using the optim function in R software Version 4.1.1 and maxLik function in maxLik library (Henningsen and Toomet [21]).

5. Simulation Study

We conducted Monte Carlo simulation studies to evaluate the performance of the maximum likelihood estimators. The special model TL-OWF-W was considered for the simulation studies. The simulation studies were carried out for different sample sizes (n = 25, 50, 100, 200 and 400) for N = 3000. We computed the mean estimates, root mean square errors (RMSEs), and average bias (Abias). The maxLik function in R software and the BFGS method were utilized. RMSE and Abias for a given parameter were estimated using the formulae R M S E = i = 1 N ( b ^ b ) 2 N and A b i a s = i = 1 N b ^ N . Simulation study results are presented in Table 3 and Table 4. The results show that the estimators are consistent since RMSE and Abias decay with increasing sample size for all the selected parameter values.

6. Applications

In this section, we demonstrate the importance of the new model using a special model, TL-OWF-W. We apply the model to two datasets. We used the following goodness-of-fit (GoF) statistics to assess model performance: Bayesian Information Criterion (BIC), Akaike Information Criterion (AIC), -2loglikelihood statistic ( 2 log Ł ) , Cramér–von Mises ( W * ) , Kolmogorov–Smirnov (K-S), and Anderson–Darling Statistics ( A * ) . The p-value for the K-S statistic was also calculated. The model with smaller values of all GoF statistics is selected as the best model. We also provide graphical representations to demonstrate the GoF. The plots considered are density plots, probability–probability (PP) plots, empirical cumulative distribution function (ECDF) plots, Kaplan–Meier (K-M) survival plots, total time on test (TTT) plots, profile plots, and hrf plots.
The following competing models were used for comparison: exponentiated odd Weibull–Topp–Leone-log-logistic (EOW-TL-LLoG) distribution (Chamunorwa et al. [22]), Topp–Leone–Weibull (TL-W) distribution (Tuoyo et al. [23]), cosine Topp–Leone–Weibull (CosTL-W) distribution (Nanga et al. [24]), the exponentiated Lindley odd log-logistic Weibull (EL-OLL-W) distribution (Korkmarz et al. [25]), type I heavy-tailed-Weibull (TIHT-W) distribution (Zhao, [26]), odd Burr III-W (OBIII-W) distribution (Alizadeh et al. [27]), and the Topp–Leone exponentiated-half logistic Gompertz Weibull (TL-EHL-Gom-W) distribution (Charumbira et al. [28]).

6.1. Failure Time Data

The dataset consists of the number of cycles to failure for a group of 60 electrical appliances in a life test. The dataset was discussed by Lawless [19]. The dataset is provided in Appendix A.
The estimated variance–covariance matrix for failure time data is
3.2140 × 10 3 1.3473 × 10 5 2.1027 × 10 6 1.3473 × 10 5 5.6392 × 10 8 8.8007 × 10 9 2.1027 × 10 6 8.8007 × 10 9 8.9804 × 10 9 .
The asymptotic 95% confidence intervals are b [ 0.4045 ± 0.1112 ] , α [ 1.2249 × 10 2 ± 0.0005 ] , and θ [ 6.7739 × 10 3 ± 0.0002 ] .
Results from Table 5 show that TL-OWF-W outcompete the selected models because it has lower values of the GoF statistics and the highest p-value.
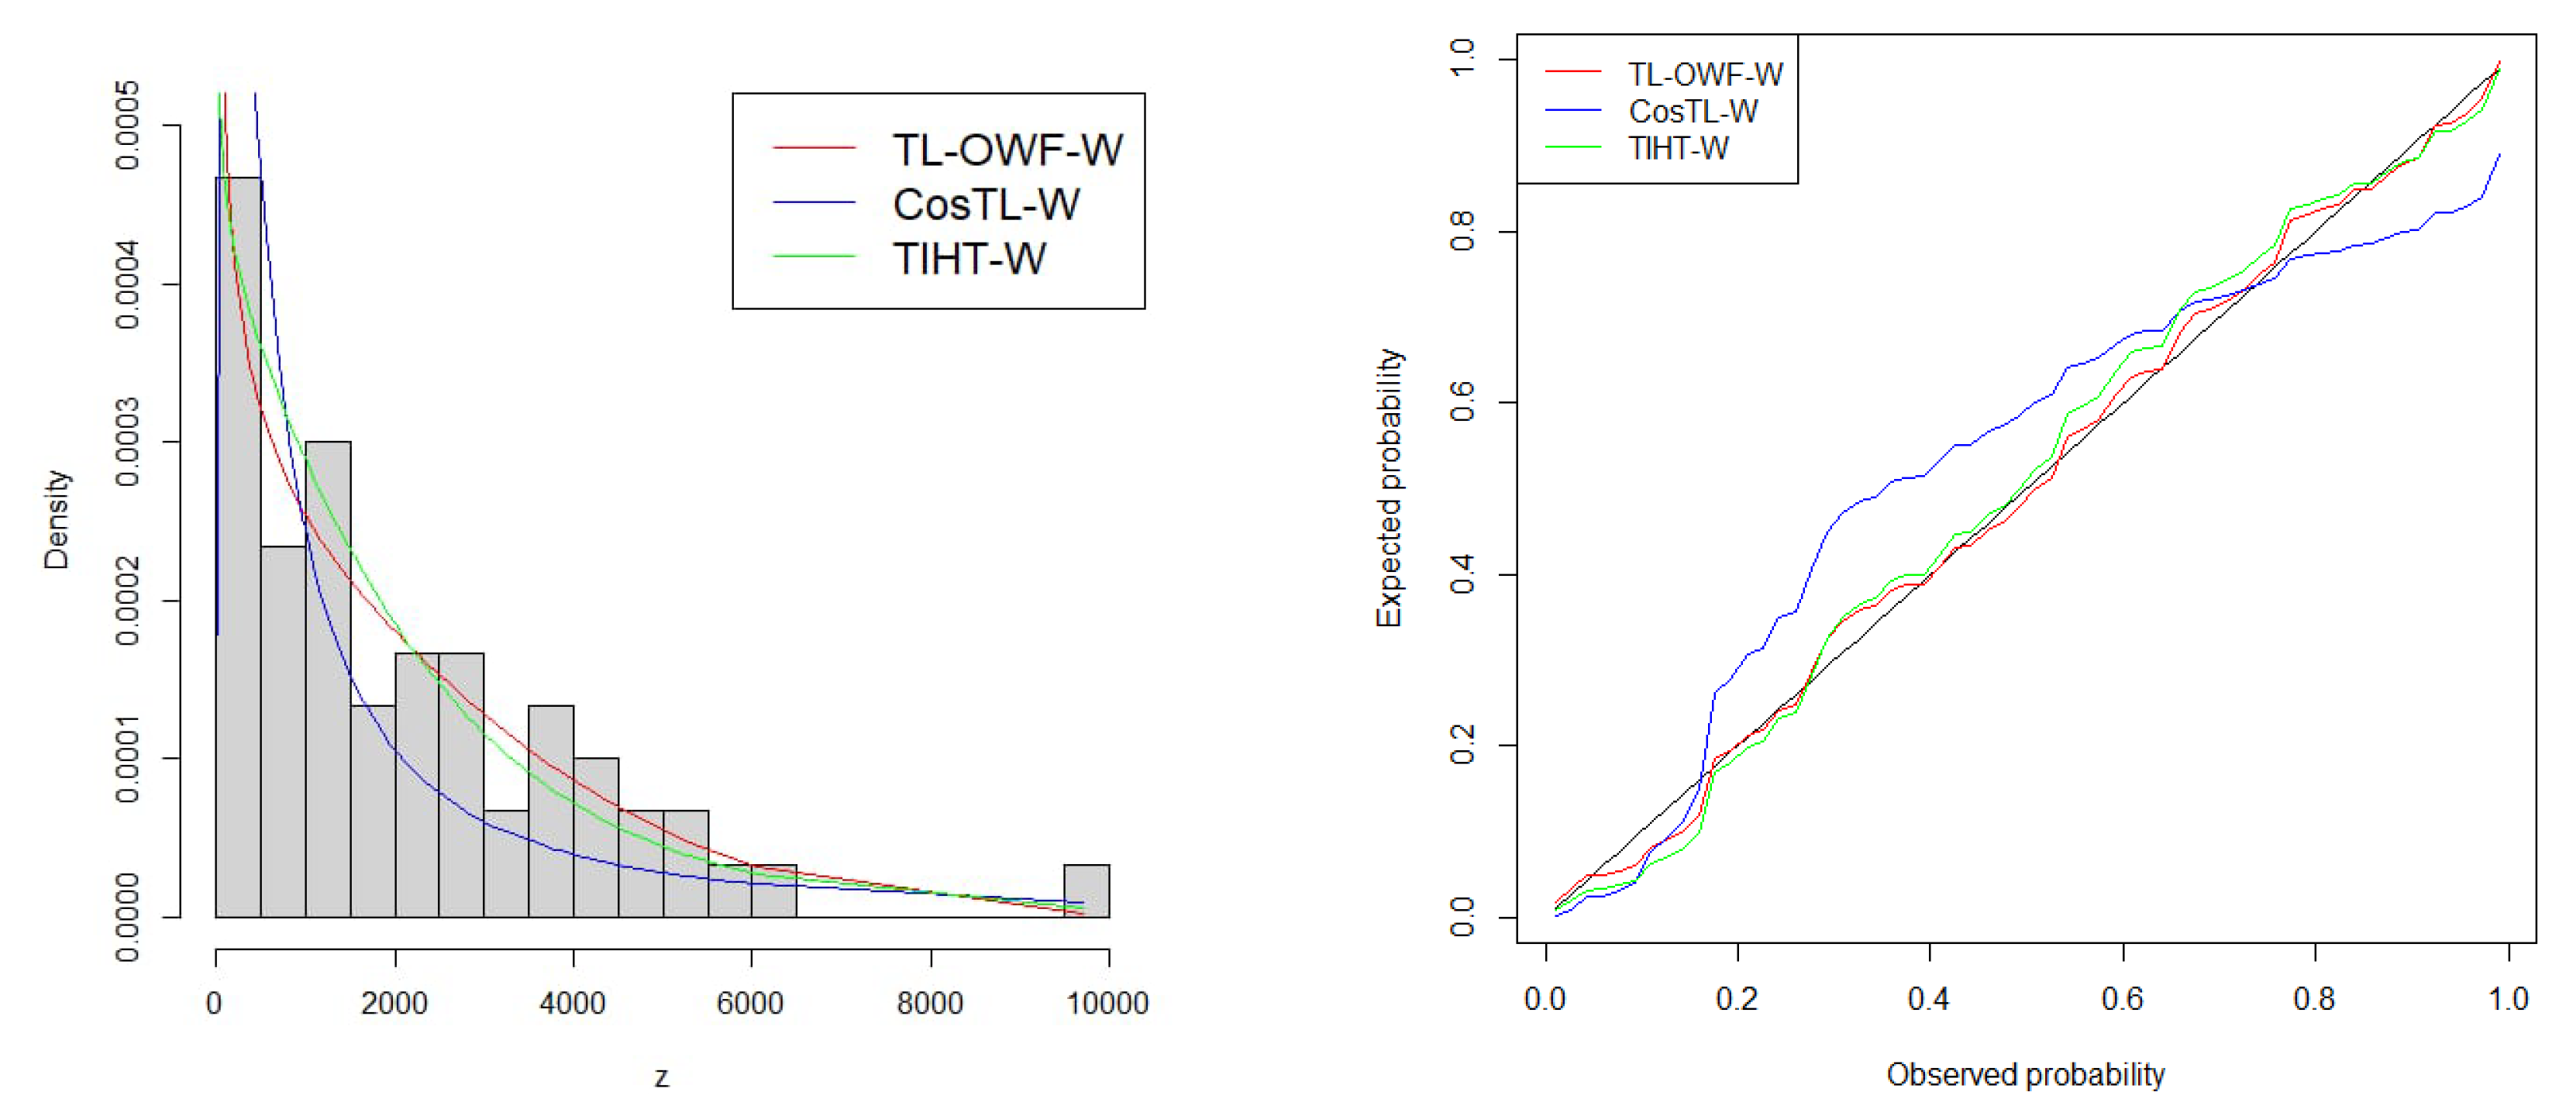
Figure 5 represents log-likelihood profile plots for the estimates b ,   α , and θ . The plots demonstrate that the parameters are identifiable for failure time data. Figure 6 shows that the fitted density plot of our proposed model aligns closely with the histogram of the data, and the PP plot follows closely to the empirical line for failure time data. This indicates that our model is a good fit.
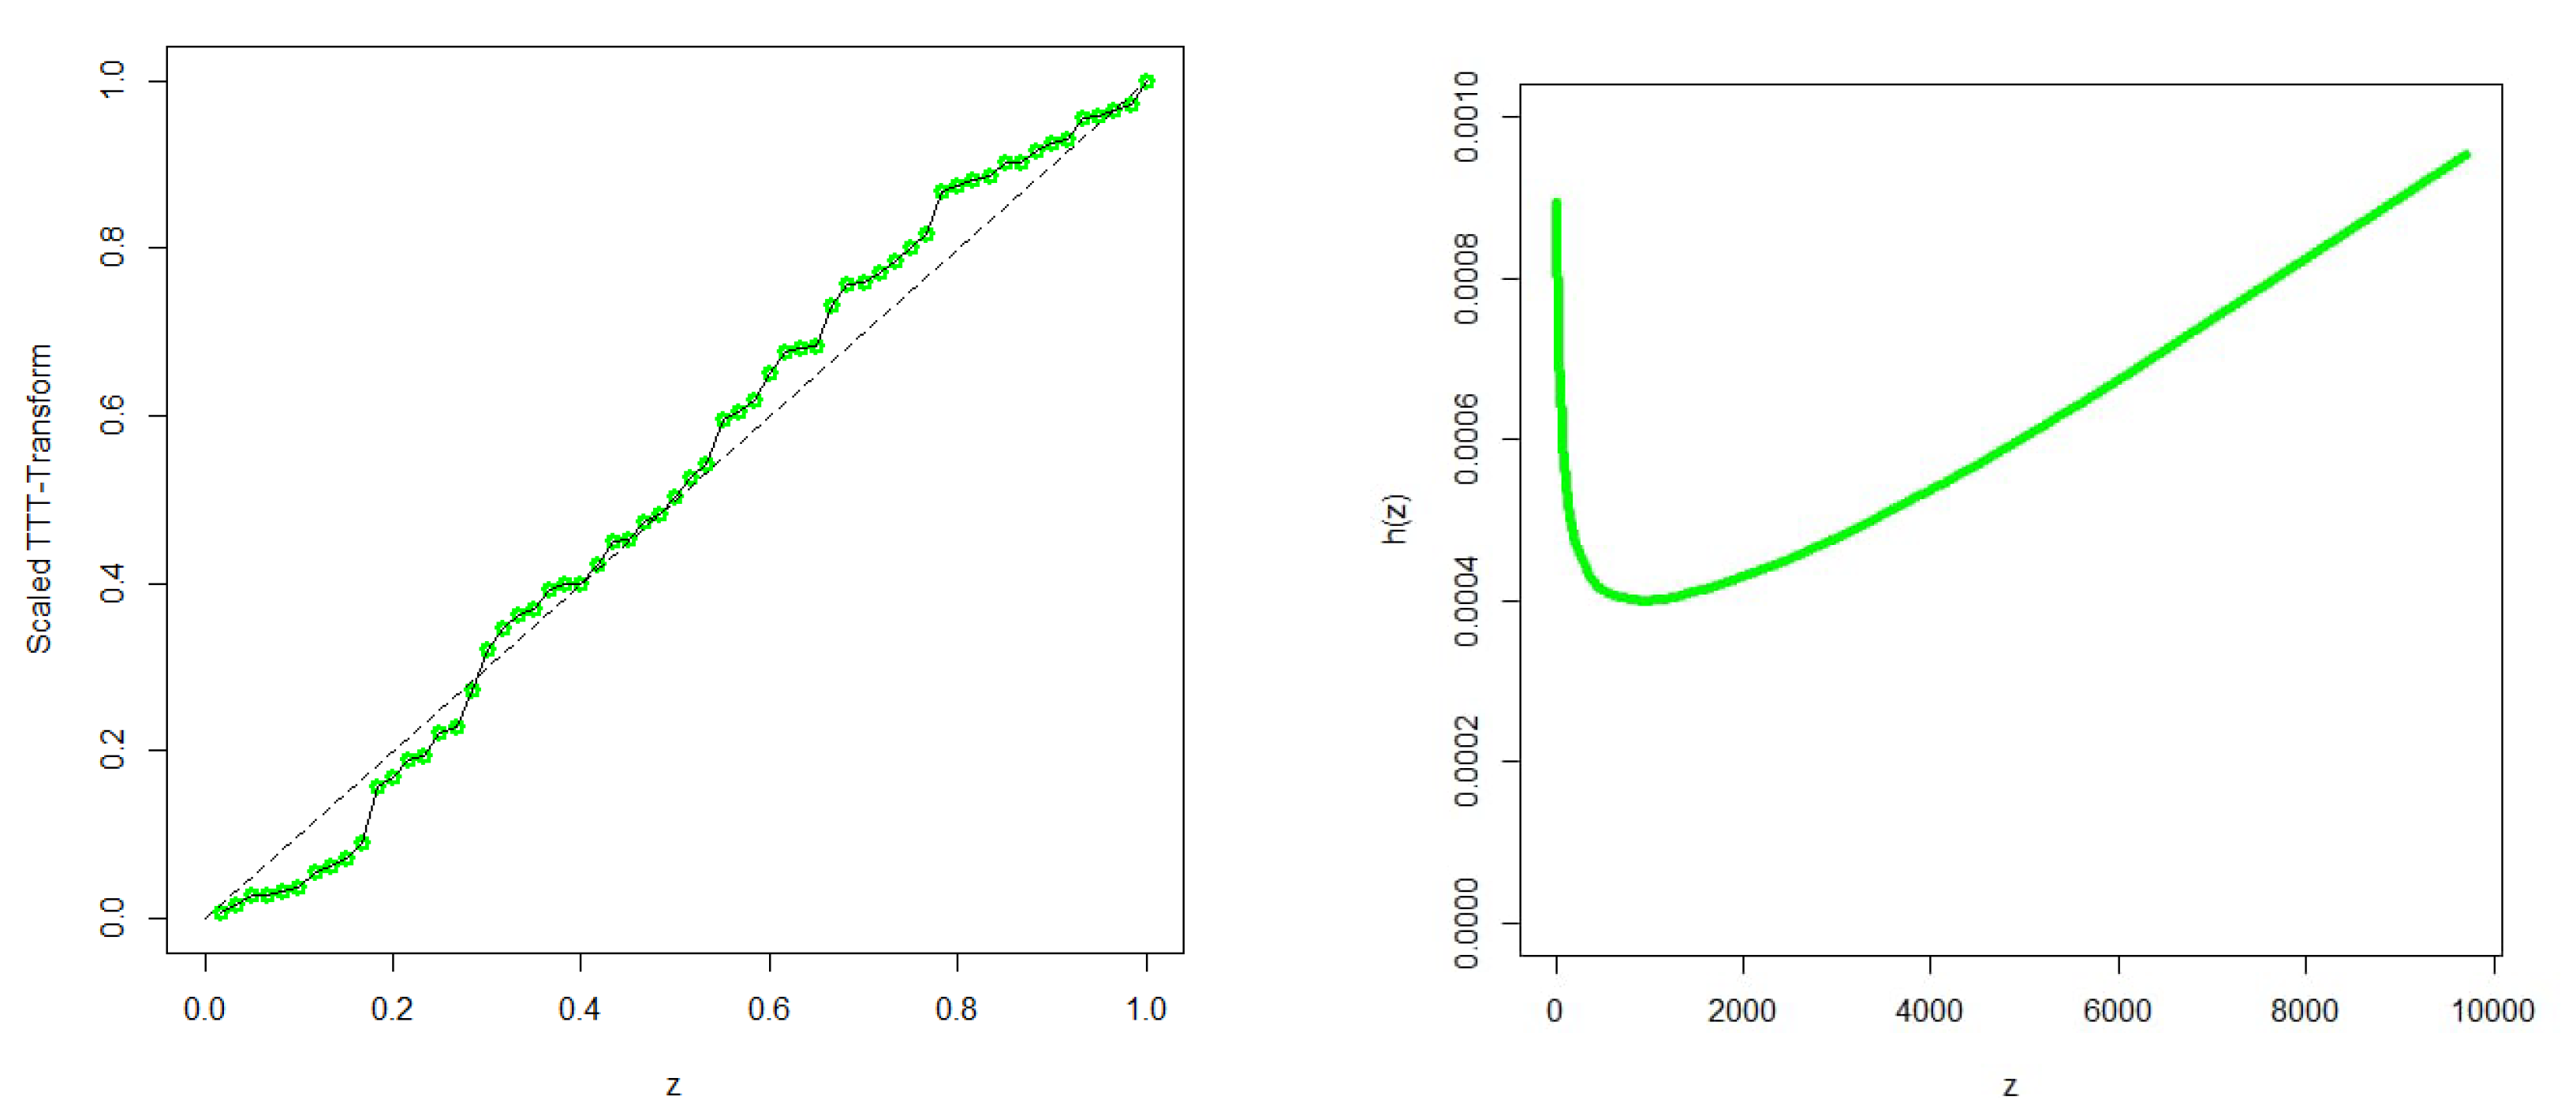
Figure 7 displays K-M survival curves and the ECDF for failure time data. Both graphs show that the TL-OWF-W fit the dataset well. TTT-scaled plot in Figure 8 suggests a bathtub hrf shape, which is correctly picked by the TL-OWF-W model.

6.2. COVID-19 Dataset

The dataset represents newly reported cases of COVID-19 in Italy for the period 13 June–12 August 2021 (see Appendix A for the observations). The estimated variance–covariance matrix for cycles to Italy’s COVID-19 data is
239.4175 0.8097 1.4508 0.8097 0.0038 0.0072 1.4508 0.0072 0.0138 .
The asymptotic 95% confidence intervals are b [ 52.2406 ± 30.3273 ] , α [ 0.1358 ± 0.1215 ] , and θ [ 0.5772 ± 0.2305 ] .
According to the GoF statistics presented in Table 6, the TL-OWF-W distribution outperforms the competing models. Therefore, we conclude that TL-OWF-W is the best-fitting model for Italy’s COVID-19 data.
The profile plots in Figure 9 show that the parameters reached their global maximum for Italy’s COVID-19 data.
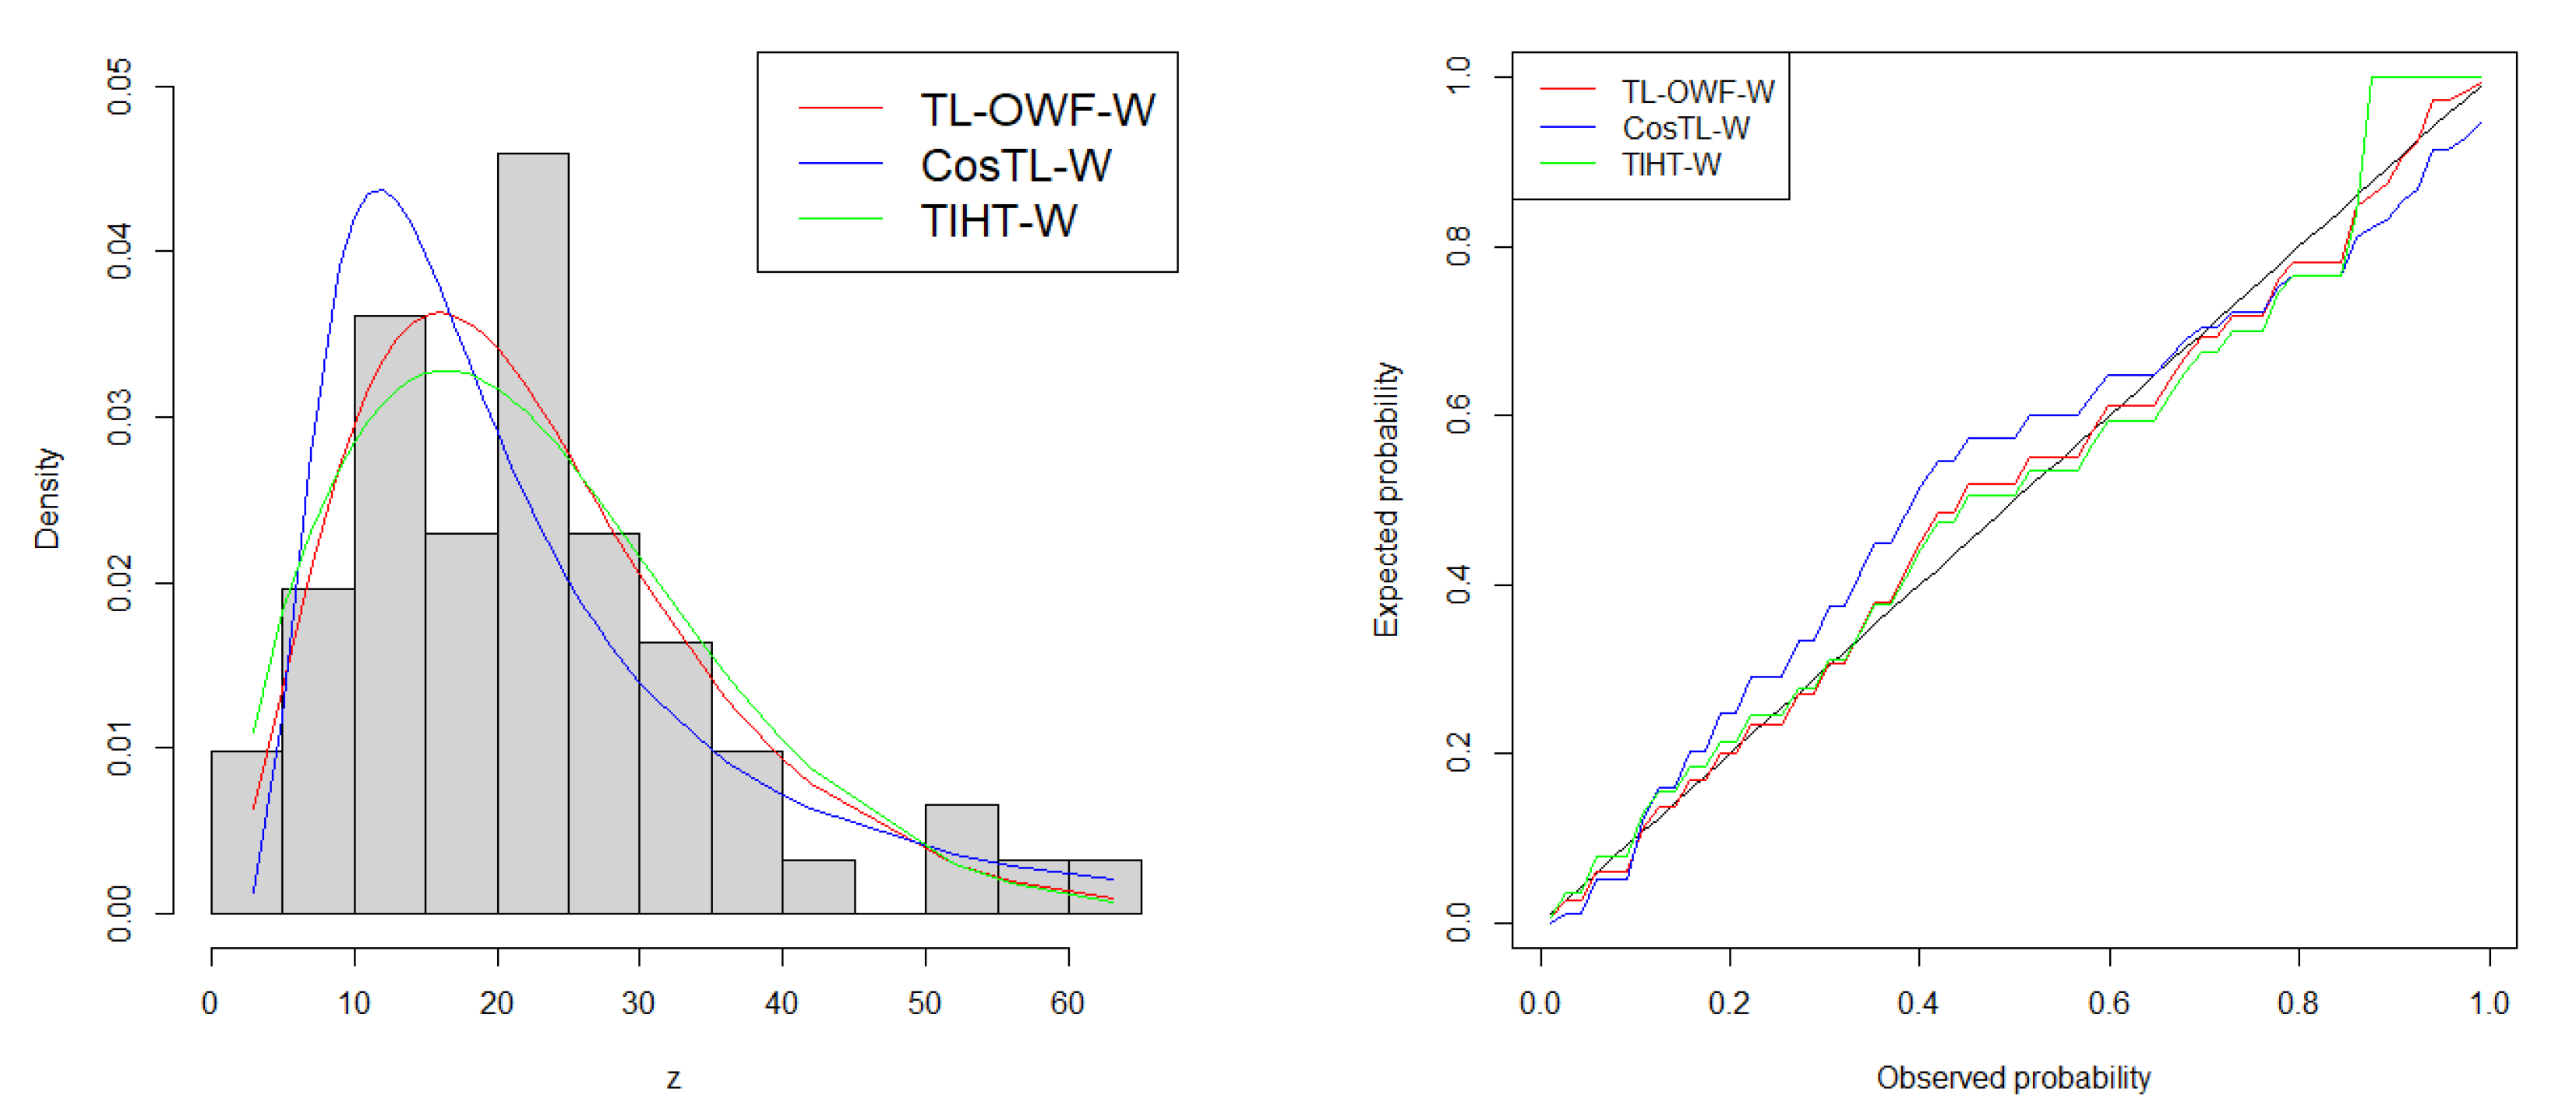
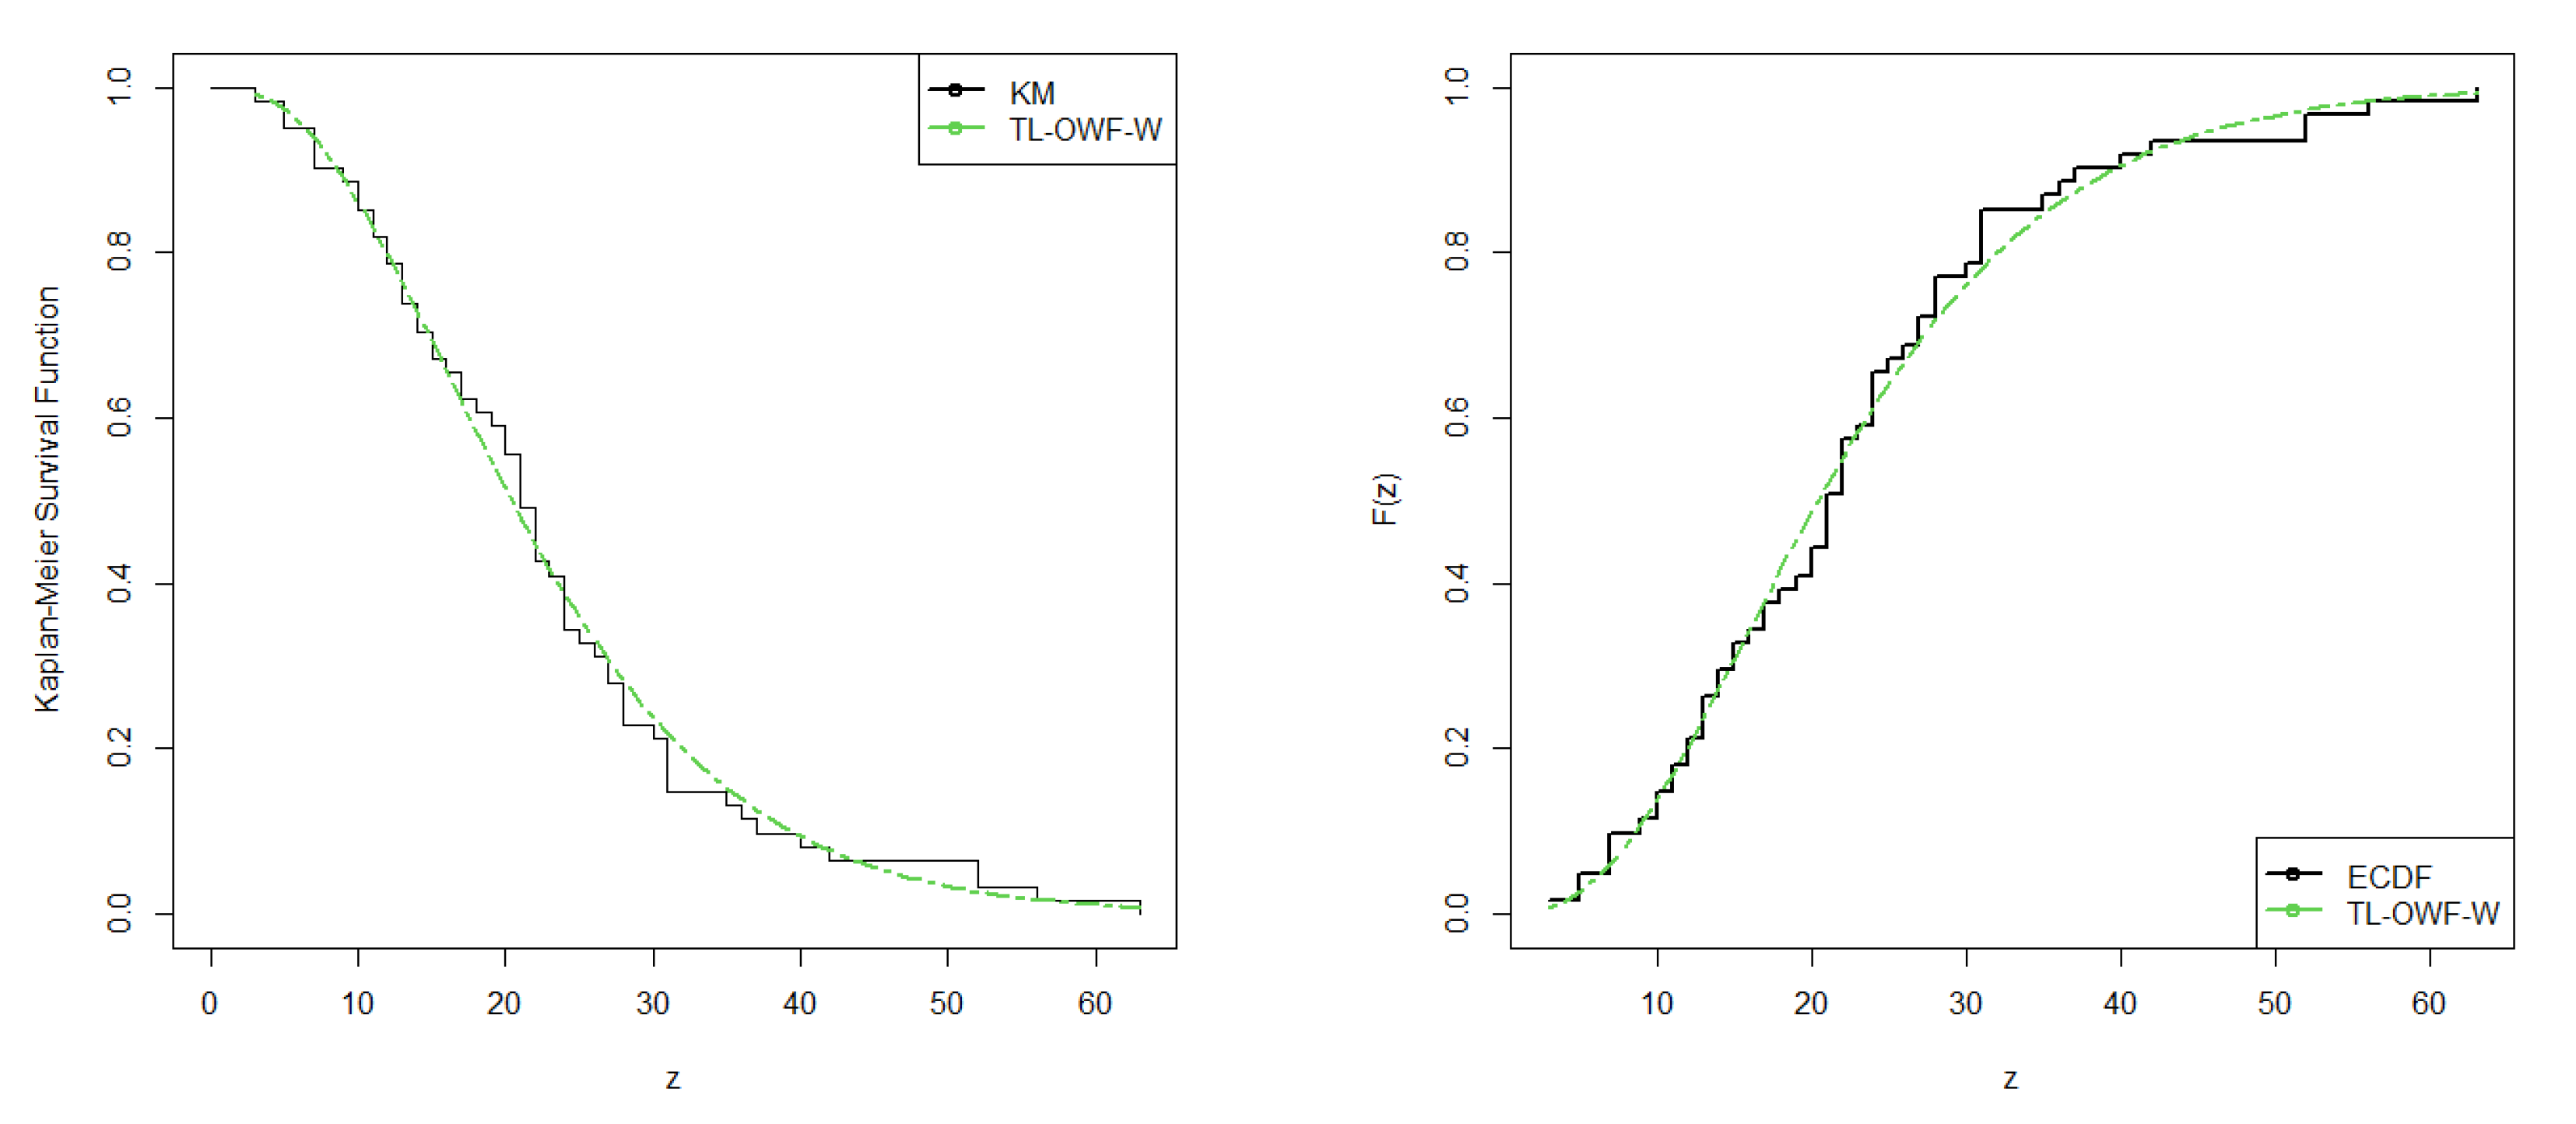
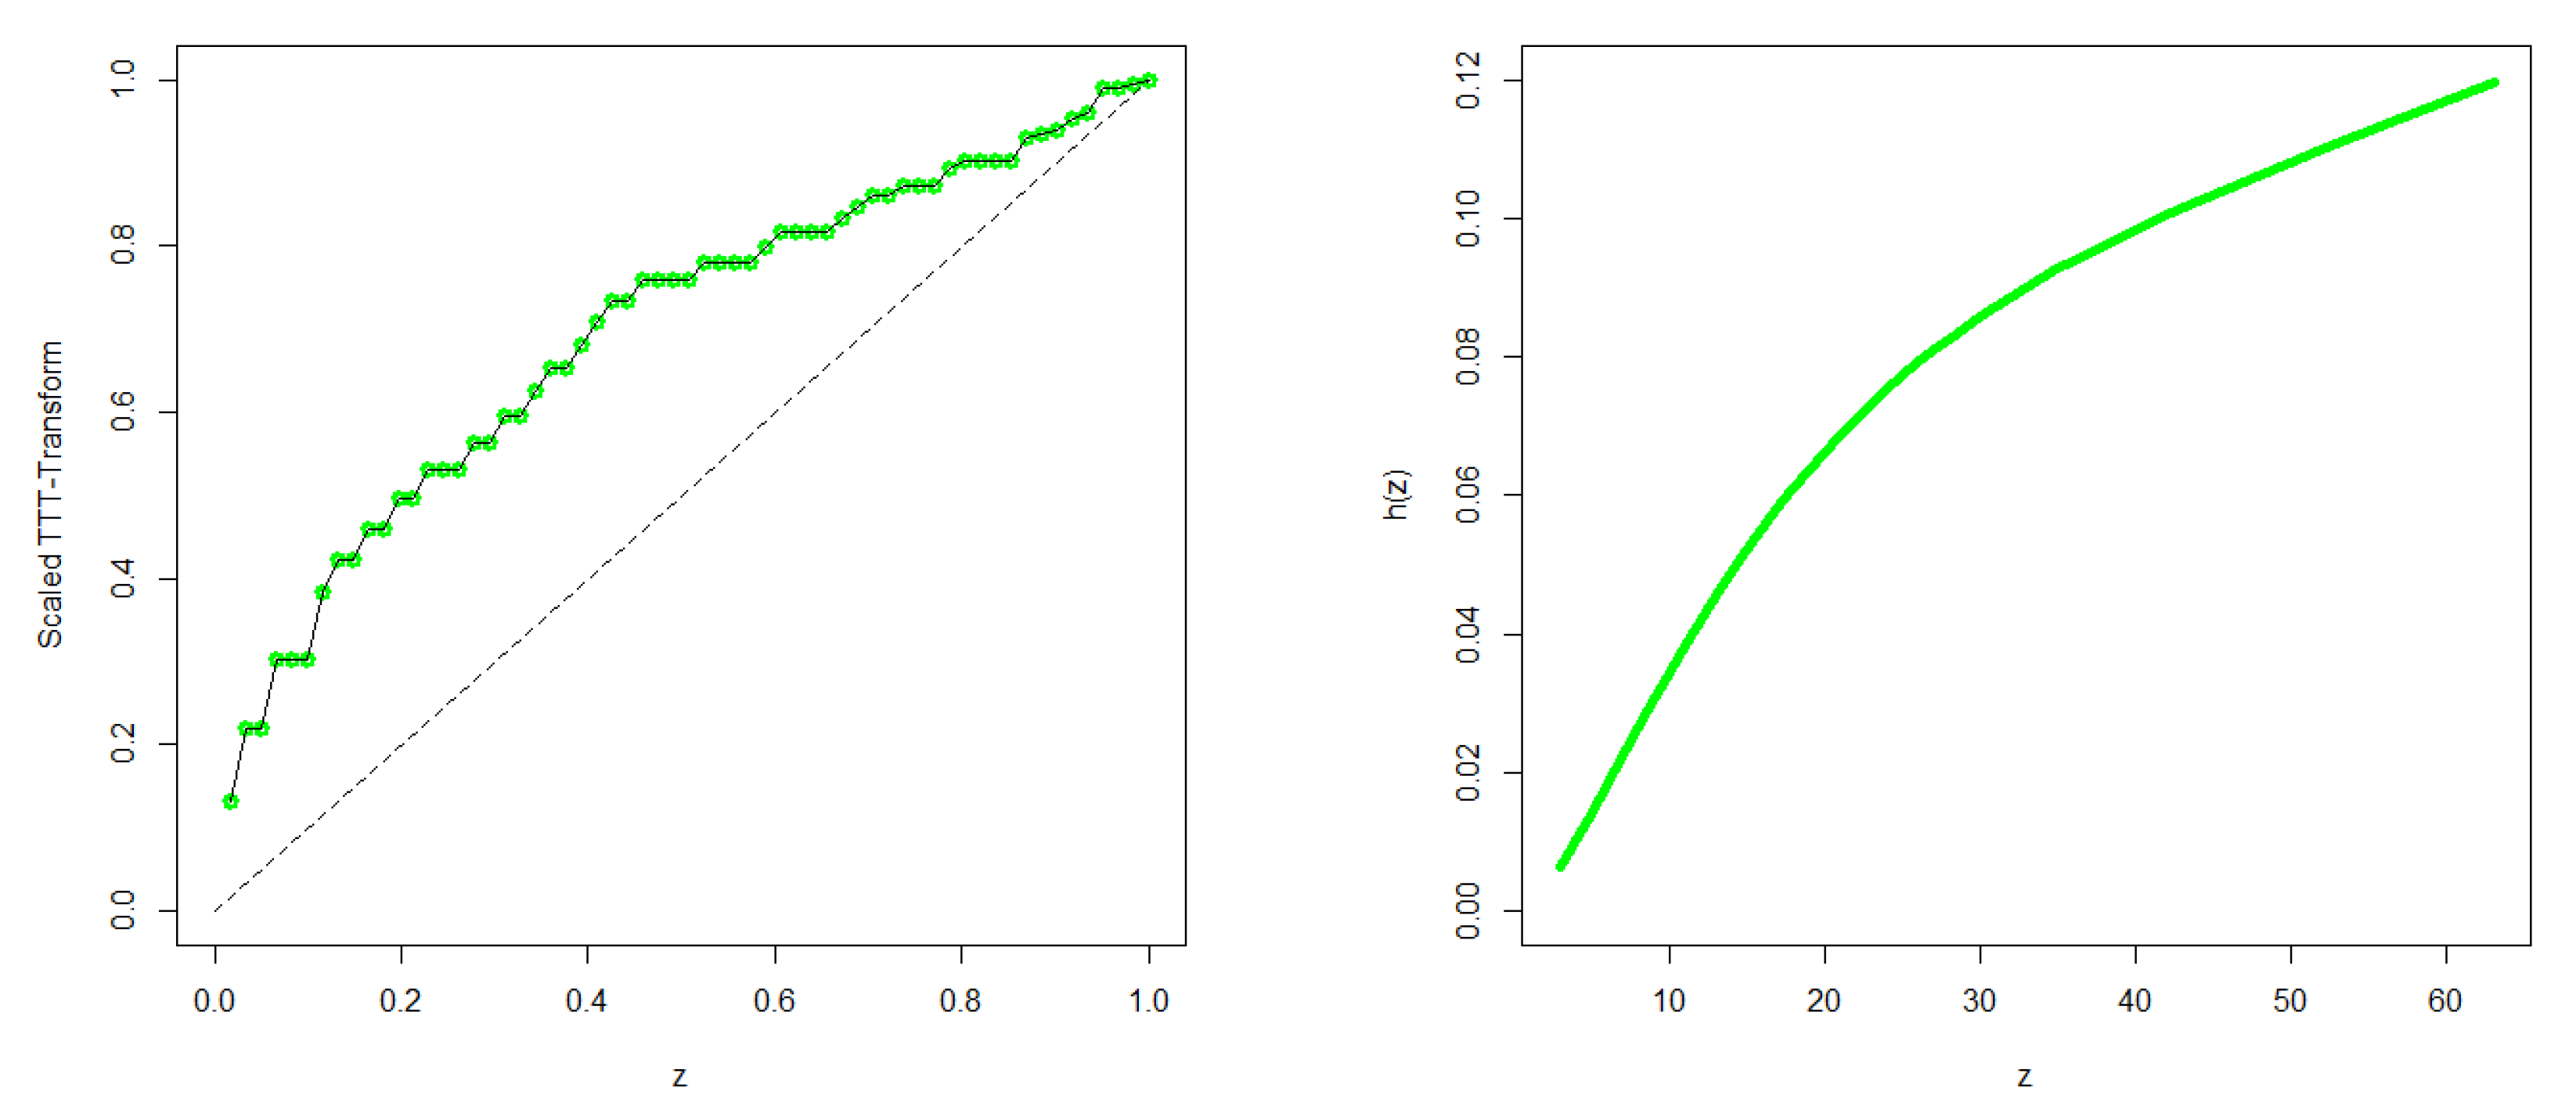
To augment the results in Table 6, we provide fitted density plots and PP plots in Figure 10. The plots demonstrate that the TL-OWF-W model offers a superior fit compared to the other models considered. Figure 11 further supports the flexibility of the TL-OWF-W model in data fitting. The dataset exhibits an increasing followed by decreasing hrf, which is accurately picked by the new model as shown in Figure 12.

7. Conclusions

We developed the Topp–Leone odd Weibull flexible-G FoD and its statistical properties. The estimators of the parameters were assessed for consistency via Monte Carlo simulation studies. The new distribution outperformed other well-established models as demonstrated through applications in two real datasets. The model has a limitation because of the absence of an analytical solution to the quantile function, which is important in the calculation of other statistical measures like skewness and kurtosis.

Author Contributions

Conceptualization, F.C. and W.F.C.; Methodology, F.C., W.F.C. and M.M.H.; Software, F.C. and W.F.C.; Validation, M.M.H.; Formal analysis, M.M.A. and M.M.H.; Investigation, M.M.A.; Data curation, M.M.A.; Writing—original draft, F.C. and W.F.C.; Writing—review & editing, M.M.H.; Visualization, M.M.H.; Funding acquisition, M.M.A. All authors have read and agreed to the published version of the manuscript.

Funding

This work was supported and funded by the Deanship of Scientific Research at Imam Mohammad Ibn Saud Islamic University (IMSIU) (grant number IMSIU-DDRSP2502).

Data Availability Statement

The original contributions presented in this study are included in the article. Further inquiries can be directed to the corresponding author.

Acknowledgments

The authors extend their appreciation to Deanship of Scientific Research at Imam Mohammad Ibn Saud Islamic University (IMSIU) for funding this work through Research Group: IMSIU-DDRSP2502.

Conflicts of Interest

The authors declare no conflicts of interest.

Appendix A

Appendix A.1. Datasets

Appendix A.1.1. Failure Time Data

The data are: 14, 34, 59, 61, 69, 80, 123, 142, 165, 210, 381, 464, 479, 556, 574, 839, 917, 969, 991, 1064, 1088, 1091, 1174, 1270, 1275, 1355, 1397, 1477, 1578, 1649, 702, 1893, 1932, 2001, 2161, 2292, 2326, 2337, 2628, 2785, 2811, 2886, 2993, 3122, 3248, 3715, 3790, 3857, 3912, 4100, 410, 4116, 4315, 4510, 4584, 5267, 5299, 5583, 6065, 9701.

Appendix A.1.2. Italy’s COVID-19 Data

The data are: 52, 26, 36, 63, 52, 37, 35, 28, 17, 21, 31, 30, 10, 56, 40, 14, 28, 42, 24, 21, 28, 22, 12, 31, 24, 14, 13, 25, 12, 7, 13, 20, 23, 9, 11, 13, 3, 7, 10, 21, 15, 17, 5, 7, 22, 24, 15, 19, 18, 16, 5, 20, 27, 21, 27, 24, 22, 11, 22, 31, 31.

References

  1. Cordeiro, G.M.; Alizadeh, M.; Ortega, E.M.M. The Exponentiated Half-Logistic Family of Distributions: Properties and Applications. J. Probab. Stat. 2014, 2014, 864396. [Google Scholar] [CrossRef]
  2. Tahir, M.H.; Hussain, M.A.; Cordeiro, G.M. A New Flexible Generalized Family for Constructing Many Families of Distributions. J. Appl. Stat. 2022, 49, 1625–1635. [Google Scholar] [CrossRef] [PubMed]
  3. Topp, C.W.; Leone, F.C. A Family of J-Shaped Frequency Functions. J. Am. Assoc. 1955, 50, 209–219. [Google Scholar] [CrossRef]
  4. Al-Shomrani, A.; Arif, O.; Shawky, A.; Hanif, S.; Shahbaz, M.Q. The Topp–Leone Family of Distributions: Some Properties and Application. Pak. J. Stat. Oper. Res. 2016, 12, 443–451. [Google Scholar] [CrossRef]
  5. Alzaatreh, A.; Lee, C.; Famoye, F. A New Method for Generating Families of Continuous Distributions. Metron 2013, 71, 63–79. [Google Scholar] [CrossRef]
  6. Rezaei, S.; Sadr, B.B.; Alizadeh, M.; Nadarajah, S. Topp–Leone Generated Family of Distributions: Properties and applications. Commun. Stat.-Theory Methods 2017, 46, 2893–2909. [Google Scholar] [CrossRef]
  7. Brito, E.; Cordeiro, G.M.; Yousof, H.M.; Alizadeh, M.; Silva, G.O. The Topp–Leone Odd Log-Logistic Family of Distributions. J. Stat. Comput. Simul. 2017, 87, 3040–3058. [Google Scholar] [CrossRef]
  8. Reyad, H.M.; Othman, S.A. The Topp–Leone Burr-XII Distribution: Properties and Applications. Br. J. Math. Comput. Sci. 2017, 21, 1–15. [Google Scholar] [CrossRef]
  9. Yousof, H.M.; Alizadeh, M.; Jahansshahi, S.M.A.; Ramires, T.G.; Ghosh, I.; Hamedani, G.G. The Transmuted Topp–Leone G Family of Distributions: Theory, Characterizations and Applications. J. Data Sci. 2017, 15, 723–740. [Google Scholar] [CrossRef]
  10. Reyad, H.M.; Alizadeh, M.; Jamal, F.; Othman, S.; Hamedani, G.G. The Exponentiated Generalized Topp Leone-G Family of Distributions: Properties and Applications. Pak. J. Stat. Oper. Res. 2019, XV, 1–24. [Google Scholar] [CrossRef]
  11. Ekemezie, D.N.; Anyiam, K.E.; Kayid, M.; Balogun, O.S.; Obulezi, J.O. DUS Topp–Leone-G Family of Distributions: Baseline Extension, Properties, Estimation, Simulation and Useful Applications. Entropy 2024, 26, 973. [Google Scholar] [CrossRef] [PubMed]
  12. Cordeiro, G.M.; Ortega, E.M.M.; Cunha, D.C.C. The Exponentiated Generalized Class of Distributions. J. Data Sci. 2013, 11, 1–27. [Google Scholar] [CrossRef]
  13. Gupta, R.C.; Gupta, P.L.; Gupta, R.D. Modeling Failure Time Data by Lehman Alternatives. Commun. Stat. Theory Methods 1999, 27, 887–904. [Google Scholar] [CrossRef]
  14. Marshall, A.W.; Olkin, I. A New Method for Adding Parameters to a Family of Distributions With Application to the Exponential and Weibull Families. Biometrika 1997, 84, 641–652. [Google Scholar] [CrossRef]
  15. Shaw, W.T.; Buckley, I.R. The Alchemy of Probability Distributions: Beyond Gram-Charlier Expansions, and a Skew-Kurtotic-Normal Distribution from a Rank Transmutation Map. 2007. Available online: https://ideas.repec.org/s/arx/papers.html (accessed on 1 September 2025).
  16. Ferreira, A.A.; Cordeiro, G.M. The Flexible Generalized Gamma Distribution With Applications to COVID-19 Data. Rev. Colomb. Estadística-Appl. Stat. 2024, 47, 453–473. [Google Scholar] [CrossRef]
  17. Cordeiro, G.M.; Biazatti, E.C.; Ortega, E.M.M.; De Lima, M.D.S.; De Santana, L.H. The Weibull Flexible Generalized Family of Bimodal Distributions: Properties, Simulation, Regression Models, and Applications. Chil. J. Stat. 2024, 15, 27–43. [Google Scholar] [CrossRef]
  18. Bourguignon, M.; Silva, R.B.; Cordeiro, G.M. The Weibull-G Family of Probability Distributions. J. Data Sci. 2014, 12, 53–68. [Google Scholar] [CrossRef]
  19. Lawless, J.F. Statistical Models and Methods for Lifetime Data, 2nd ed.; John Wiley and Sons: New York, NY, USA, 2003. [Google Scholar]
  20. Apostol, T.M. 1974. Mathematical Analysis, Reading, Mass; Addison-Wesley: London, ON, Canada, 1974. [Google Scholar]
  21. Henningsen, A.; Toomet, O. maxLik: A Package for Maximum Likelihood Estimation in R. Comput. Stat. 2011, 26, 443–458. [Google Scholar] [CrossRef]
  22. Chamunorwa, S.; Oluyede, B.; Makubate, B.; Chipepa, F. The Exponentiated Odd Weibull-Topp–Leone-G Family of Distributions: Model, Properties and Applications. Pak. J. Stat. 2021, 37, 143–158. [Google Scholar]
  23. Tuoyo, D.O.; Opone, F.C.; Ekhosuehi, N. The Topp–Leone Weibull Distribution: Its Propertis and Application. Earthline J. Math. Sci. 2021, 7, 381–401. [Google Scholar] [CrossRef]
  24. Nanga, S.; Nasiru, S.; Dioggban, J. Cosine Topp–Leone Family of Distributions: Properties and Regression. Res. Math. 2023, 10, 2208935. [Google Scholar] [CrossRef]
  25. Korkmaz, M.C.; Yousof, H.M.; Hamedani, G.G. The Exponential Lindley Odd Log-Logistic-G Family: Properties, Characterizations and Applications. J. Stat. Theory Appl. 2018, 17, 554–571. [Google Scholar] [CrossRef]
  26. Zhao, W.; Khosa, S.K.; Ahmad, Z.; Aslam, M.; Afify, A.Z. Type-I Heavy-Tailed Family with Applications in Medicine, Engineering and Insurance. PLoS ONE 2020, 15, 63–79. [Google Scholar] [CrossRef] [PubMed]
  27. Alizadeh, M.; Cordeiro, G.M.; Nascimento, A.D.C.; Lima, M.C.S.; Ortega, E.M.M. Odd-Burr Generalized Family of Distributions with Some Applications. J. Stat. Simul. 2017, 87, 367–389. [Google Scholar] [CrossRef]
  28. Charumbira, W.F.; Oluyede, B.; Chipepa, F. The New Topp–Leone Exponentiated Half Logistic-Gompertz-G Family of Distributions with Applications. Stat. Optim. Inf. Comput. 2025, 14, 486–515. [Google Scholar] [CrossRef]
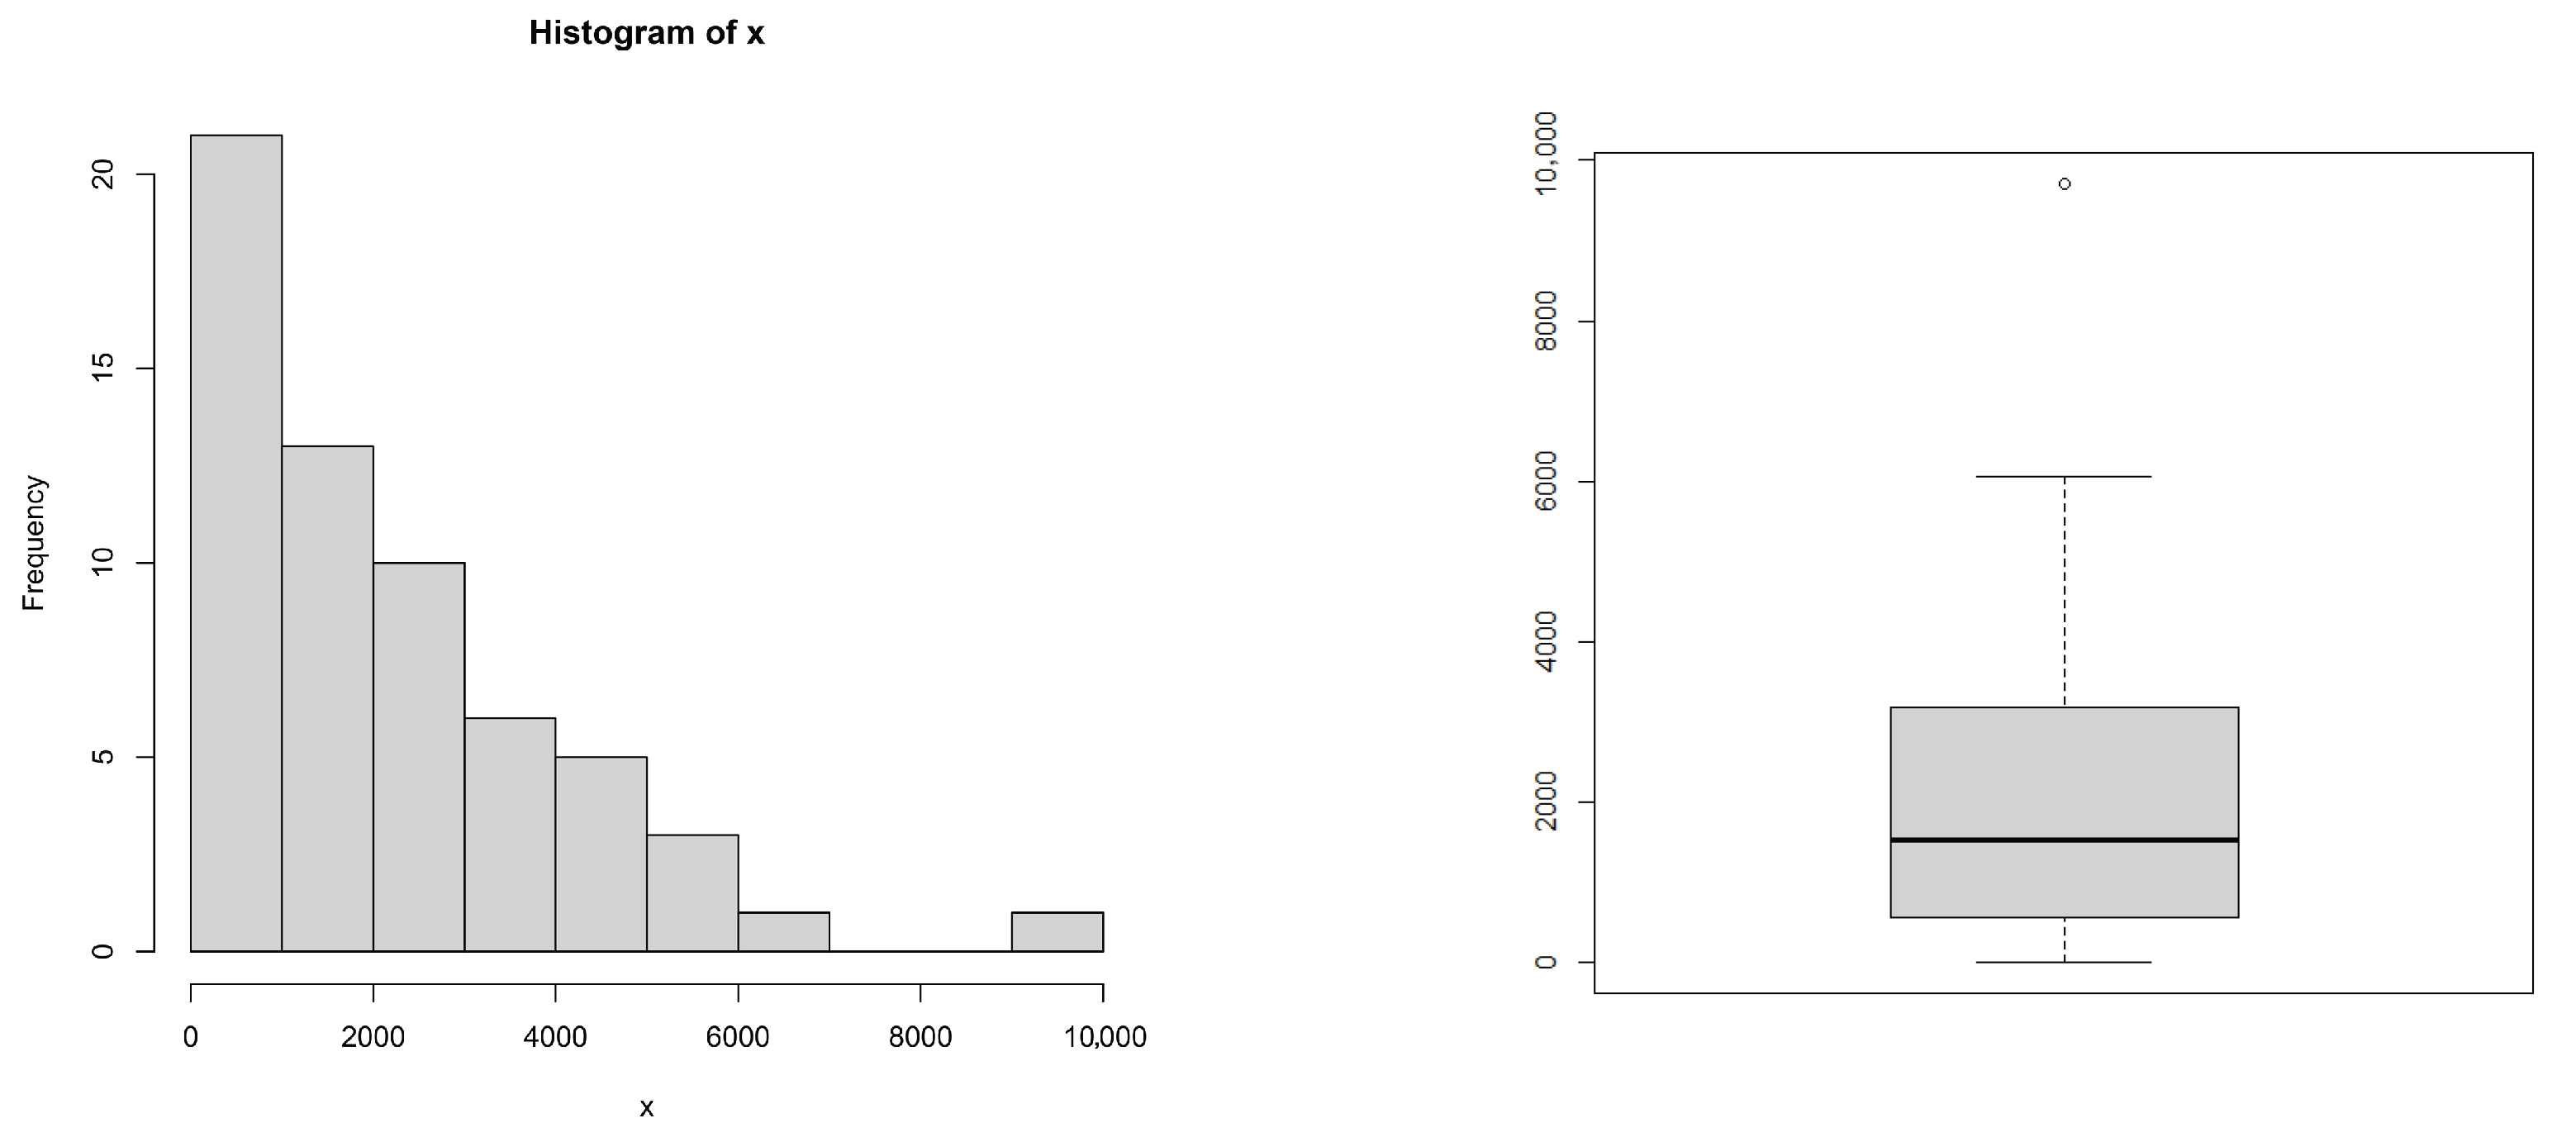
Figure 1. Histogram and box-plot for failure time data.
Mathematics 13 02866 g001
Figure 2. Graphs of the pdfs and hrfs for the TL-OWF-W distribution.
Mathematics 13 02866 g002
Figure 3. Graphs of the pdfs and hrfs for the TL-OWF-LLoG distribution.
Mathematics 13 02866 g003
Figure 4. Graphs of the pdfs and hrfs for the TL-OWF-Kum distribution.
Mathematics 13 02866 g004
Figure 5. Profile log-likelihood for b ,   α , and θ for failure time data.
Mathematics 13 02866 g005
Figure 6. Fitted pdf and pp plots for failure time dataset.
Mathematics 13 02866 g006
Figure 7. K-M survival and ECDF plots for failure time dataset.
Mathematics 13 02866 g007
Figure 8. Fitted TTT-scaled plot and hrf plots for failure time data.
Mathematics 13 02866 g008
Figure 9. Profile log-likelihood for b ,   α , and θ for COVID-19 dataset.
Mathematics 13 02866 g009
Figure 10. Fitted densities and PP plots for COVID-19 dataset.
Mathematics 13 02866 g010
Figure 11. Fitted K-M survival and ECDF plots for COVID-19 dataset.
Mathematics 13 02866 g011
Figure 12. Fitted TTT-scaled plot and hrf plot for COVID-19 dataset.
Mathematics 13 02866 g012
Table 1. Descriptive statistics for failure time data.
MinimumMaximumMeanMedianSDSkewnessKurtosis
14.09701.02114.81527.51925.151.302.21
Table 2. Quantile values for TL-OWF-W distribution.
u(1.5,1.5,0.1)(0.5,1,0.5)(1.5,0.5,1.5)(0.5,1.5,0.9)(1.1,1.1,0.3)
0.10.00180.00280.3160.09890.0194
0.20.01140.01310.4360.18440.0576
0.30.03670.03430.52860.27610.1136
0.40.09090.0720.60860.37890.1909
0.50.19770.13550.6820.49780.2958
0.60.40440.24110.75280.63990.4397
0.70.81850.42020.82460.81730.6449
0.81.73940.74540.90281.05570.9625
0.94.43181.45211.00061.43061.5591
Table 3. Simulation results for TL-OWF-W distribution.
(1,1,1) (1,1,0.5)
Paramater n MeanRMSEAbiasMeanRMSEAbias
b252.46954.24551.46952.34623.83201.3462
501.99712.97840.99711.95413.23340.9541
1001.68852.14000.68851.67462.08140.6746
2001.46531.54080.46531.52161.64700.5216
4001.22170.98780.22171.13370.93590.1337
α 251.06600.60040.06601.06730.59940.0673
501.01960.44220.01961.01580.42860.0158
1000.98750.3435−0.01250.98710.3437−0.0129
2000.99040.2747−0.00960.98340.2846−0.0166
4001.00400.21010.00401.02320.21120.0232
θ 252.34672.57291.34671.21891.35670.7189
501.84621.79270.84620.99780.98880.4978
1001.64091.49900.64090.82870.74960.3287
2001.43611.14940.43610.72870.59360.2287
4001.33380.90870.33380.70670.47690.2067
(0.5,0.5,0.9) (0.5,0.5,1.1)
Paramater n MeanRMSEAbiasMeanRMSEAbias
b251.39102.43970.89101.62032.59321.1203
501.01871.57170.51871.22571.82900.7257
1000.78610.94160.28611.13481.49510.6348
2000.78130.92830.28130.83450.89070.3345
4000.54760.28220.04760.62080.38210.1208
α 250.50580.30510.00580.50760.32710.0676
500.52790.20520.02790.48700.1995−0.0613
1000.52130.15460.02130.48390.1511−0.0161
2000.53280.12020.03280.50730.10530.0073
4000.53310.07560.03310.52100.07530.0021
θ 251.19570.80360.29571.37010.97750.2701
501.01910.58150.11911.15140.68080.0951
1001.00540.50030.10541.00830.5731−0.0917
2000.93530.41860.03531.02320.4662−0.0768
4000.97550.37430.07551.07000.3738−0.0300
Table 4. Simulation results for TL-OWF-W distribution.
(0.5,0.9,0.5) (0.5,0.9,0.9)
Paramater n MeanRMSEAbiasMeanRMSEAbias
b251.45833.11300.95831.86253.48891.3625
500.68731.60040.18731.31022.31830.8102
1000.55521.25470.05521.00501.43380.5050
2000.40530.6547−0.05470.84681.05220.3468
4000.45020.0609−0.04980.62710.54290.1271
α 250.99380.53320.19380.91870.51320.0387
501.00510.36070.10510.89980.3524−0.0302
1000.98710.27340.08710.87710.2595−0.0229
2001.07240.23540.07240.87910.2038−0.0209
4001.01020.14290.01020.90400.13820.0040
θ 250.89690.72280.39691.32581.12470.4258
500.84010.55580.35011.13960.79600.2396
1000.89080.54880.34901.03180.64720.1318
2000.84860.47880.34860.98470.53930.0847
4000.51250.03350.01250.99710.42870.0971
(0.5,0.5,1) (0.5,1.0,0.9)
Paramater n MeanRMSEAbiasMeanRMSEAbias
b251.40792.28280.90791.65343.17371.1534
501.18541.84700.68541.16062.04690.6606
1000.95581.21720.45580.98541.42780.4854
2000.80590.86610.30590.85421.10240.3542
4000.59330.38170.09330.62350.56900.1235
α 250.48700.3185−0.01301.06230.54020.0623
500.50520.22240.00521.01080.37810.0108
1000.50450.14980.00450.98120.2879−0.0107
2000.51630.11460.00360.97920.2314−0.0106
4000.53160.08180.00321.00630.15740.0063
θ 251.31130.86690.31131.38521.18020.4852
501.10820.64290.10821.21110.85770.3111
1001.00530.52260.00531.08510.68760.1851
2000.94930.4174−0.05071.01800.57050.1180
4001.02470.36840.02471.02400.45790.1240
Table 5. Failure time data: Estimates and GoF statistics.
Estimates Statistics
Distribution b α θ −2log(L) AIC CAIC BIC W * A * K−S p-Value
TL-OWF-W0.40451.2249 × 10 2 6.7739 × 10 3 1035.82701041.82701042.25501048.11000.02200.20220.0480.9974
(5.6736 × 10 2 )(2.3747 × 10 4 )(9.4765 × 10 5 )
b α
TL-W1.1951 × 10 2 0.1366 1064.33901068.33901068.54901072.52700.47702.78350.17350.0476
(25.0670)(6.7652 × 10 3 )
b θ
CosTL-W59.59130.1319 1065.87101069.87101070.08101074.06000.49892.90150.17160.0516
(12.0503)(0.0068)
α θ γ
TIHT-W0.90610.69680.0017 1038.22301044.22301044.65101050.50600.06040.44670.06930.9163
(0.1364)(0.3324)(0.0026)
β k α
OBIII-W0.04816.04310.518921 1043.76001049.76001050.18801056.0430.07550.57990.06810.9255
(0.0404)(1.5194)(0.0969)
α b β c
EOW-TL-LLoG0.203746.35454.25720.23131036.14901044.14901044.87601052.5260.05670.39580.08930.6918
(0.0798)(0.0194)(1.3416)(0.0051)
b γ α β
TL-EHL-Gom-W3.0060 × 10 4 0.35893.8490 × 10 2 9.4391 × 10 2 1062.09701070.09701070.82401078.47400.44522.61600.17060.0537
(6.0992 × 10 8 )(0.3353)(9.6480 × 10 3 )(2.9173 × 10 2 )
β λ θ γ
EL-OLL-W5.35981.0072 × 10 4 6.08440.89411037.86801045.86801046.59501054.24500.05630.41980.06800.9262
(1.4388 × 10 3 )(1.7684 × 10 5 )(1.2674 × 10 3 )(9.6488 × 10 2 )
Table 6. COVID-19 dataset: Parameter estimates and GoF statistics.
Estimates Statistics
Distribution b α θ −2log(L) AIC CAIC BIC W * A * K−S p-Value
TL-OWF-W52.24060.13580.5772 468.9215474.9215475.3425481.25410.04330.26290.07570.8757
(15.4731)(0.0620)(0.1176)
b α
TL-W1.1951 × 10 02 0.1366 1064.33901068.33901068.54901072.52700.47702.78350.17350.04762
(25.0670)(6.7652 × 10 03 )
b θ
CosTL-W64.49540.3190 480.2325484.2325484.4394488.45430.21361.22690.13620.2075
(13.3887)(0.0163)
α θ γ
TIHT-W1.83700.00251.0819 469.0900475.0900475.5111481.42272.064211.19370.13120.2449
(0.1971)(0.0022)(0.5944)
β k α
OBIII-W0.21729.80070.8269 469.4335475.4335475.8545481.76610.0420.24500.08370.7867
(0.1438)(3.75)(0.1680)
α b β c
EOW-TL-LLoG1.288924.59391.29060.5252469.4652477.4652478.1795485.90870.05910.34010.09890.5895
(0.7040)(12.4521)(0.4312)(0.0914)
b γ α β
TL-EHL-Gom-W3.5953 × 10 4 0.35773.6141 × 10 2 0.2268477.4705485.4705486.1847493.91400.17661.00810.13450.2196
(3.0615 × 10 9 )(0.3809)(1.0098 × 10 2 )(7.9494 × 10 2 )
β λ θ γ
EL-OLL-W1.7323 × 10 8 2.4672 × 10 2 2.40421.9037470.5295478.5295479.2438486.9730.05260.37380.08860.724
(0.70660)(4.1880 × 10 3 )(2.2550 × 10 5 )(0.18324)
Disclaimer/Publisher’s Note: The statements, opinions and data contained in all publications are solely those of the individual author(s) and contributor(s) and not of MDPI and/or the editor(s). MDPI and/or the editor(s) disclaim responsibility for any injury to people or property resulting from any ideas, methods, instructions or products referred to in the content.