1. Introduction
Day-Ahead Markets (DAM) of electricity are markets in which, on each day, prices for the 24 h of the next day form at once in an auction, usually held at midday. The data obtained from these markets are organized and presented in a discrete hourly time sequence, but actually the 24 prices of each day share the same information. Accurate encoding and synthetic generation of these time series is important not only as a response to a theoretical challenge, but also for the practical purposes of short term price risk management and derivative pricing. The most important features of the hourly price sequences are night/day seasonality, casual sudden upward spikes appearing only at daytime, downward spikes appearing at night time, spike clustering, and long memory with respect to previous days. From a modeling point of view, all of this is very hard to model accurately, and can mean nonlinearity and multi-scale analysis. Modeling is not forecasting, but since good quality forecasting is based on good modeling, developing good models can help quality forecasting, and this topic is worth research for this reason too.
Different research communities have developed different DAM price modeling methods, discussed and neatly classified some time ago in Ref. [
1], especially dedicated to forecasting. Interestingly, in Ref. [
1] it is also noted that a large part of papers and models in this research area can be mainly attributed to just two cultures, that of econometricians/statisticians and that of engineers/computational intelligence (CI) people. This bipartition seems to be still valid nowadays. DAM econometricians tend to use discrete time stochastic autoregressions (after due model identification) for point forecasting, and quantile regressions for probabilistic forecasting [
2]. DAM engineering/CI people prefer to work with machine learning methods, in some cases of the probabilistic type [
3,
4].
Noticeably, writing models directly as distributions [
5,
6] and not as stochastic equations (like it is done in econometrics), allows for direct and stable sampling of scenario trajectories for a very large set of situations. Hence, probabilistic modeling as a background for probabilistic DAM forecasting has been appearing more and more frequently in the CI community in recent years, like for example the NBEATSx model [
7,
8] applied to DAM data, or the normalizing flows approach [
9,
10,
11]. In addition, there exist machine learning probabilistic models that were never tested on DAM price forecasting. For example, the Temporal Fusion Transformer [
12] can do probabilistic forecasting characterized by learning temporal relationships at different scales, emphasizing the importance of combining probabilistic accuracy with interpretability. DeepAR [
13] is able to predict multivariate Gaussian distributions (in its DeepVAR form). Noticeably, these deep models often use the depth dimension for trying to capture multi-scale details (along the day time coordinate and along hours of the same day), at the expense of requiring a very large number of parameters. All these models allow for both forecasting and scenario generation. In any case, this ‘two-cultures paradigm’ finding, earlier discussed in Ref. [
14] for a broader context, is stimulating in itself because it can orientate further research.
As said, the main advantage of modeling directly by probability distributions is the possibility of scenario generation. For this reason, at their inception, machine learning probabilistic models were called ‘generative’ (in contrast to the ‘discriminative’ standard econometrics models based on stochastic equations). Nowadays, the word generative has entered everyday use in relation to large language models (LLMs) and chatbots. That word sense is the same as that used in this paper: LLMs do model corpora of documents in a probabilistic way, and, when they are triggered by a prompt, they ‘emit’ a stochastic sequence of words coherent with the properties of the modeled corpus. This scenario generation feature of LLMs is so important that it is changing our language. Thus, one can actually think of this linguistic property as a direct analog of DAM scenario generation. Indeed, among the first language models developed, there were the hidden Markov models (HMMs) [
15], which will be discussed in the rest of the paper in relation to generation of coherent DAM price dynamics. Notice that in the case of language modeling, the relationship between modeling and forecasting becomes very subtle and would deserve an accurate discussion (think of the suggestive definition of LLMs as ‘stochastic parrots’ proposed in Ref. [
16]). In analogy, in this paper, probabilistic forecasting will be discussed only in passing, just as a possible interesting task for the proposed models, but, for reasons of space, it will not be considered central to our discussion, which is mainly aimed at showing the DAM generation aspect of the proposed mathematical method, and at elucidating the double econometric/CI nature of the proposed models. The starting idea of this paper is that of picking up a time series that is very difficult to model (a DAM series), and showing that one can build up a satisfactory generative model, very specific to this series, but very effective to the task. One important feature of this kind of probabilistic modeling will be that it is based on latent variables, which can be directly interpreted as peeping into internal states of the electricity market, thus extracting very interesting hidden but useful information from it.
Building on these grounds, this paper, taking the stance of econometrics but still making use of ‘old style’, shallow probabilistic machine learning, will discuss the use of the Vector Mixture (VM) and Vector Hidden Markov Mixture (VHMM) family of models in the context of DAM prices modeling and scenario generation, with just some hints at how these models can be used for forecasting. It will study the behavior of these models on a freely downloadable specific DAM prices data set from the DAM of Alberta in Canada. All market data used in this paper are available from the AESO web site
http://www.aeso.ca/ (accessed on 11 January 2024) via the link
http://ets.aeso.ca/ (accessed on on 11 January 2024). In the basic Gaussian form in which it will be presented in this paper, the VM/VHMM approach works with stochastic variables with support on the full real line, so that this approach can be directly applied to series which allow for both negative and positive values. Yet, since in the paper the approach will be tested on one year of prices from the Alberta DAM (
values), which are positive and capped, logprices will be used everywhere instead of prices. Estimation of VM/VHMM models relies on sophisticated and efficient algorithms like the Expectation–Maximization, Baum–Welch and Viterbi algorithms. Some software packages exist to facilitate estimation. The two very good open source free Matlab packages
BNT and
pmtk3 were used for many of the computations of this paper. As an alternative, one can also use
pomegranate [
17], a package written in Python.
The presented VM/VHMM approach will be discussed from four perspectives. First, from the two-culture paradigm. Second, from the generative vs. discriminative view on models (which implies an extensive discussion of generative/probabilistic modeling). Third, from the practical ability of these models of extracting relevant features from the DAM specific data, and of generate synthetic time series very similar to the original data. Fourth, from the impact of time on generative modeling. In brief, these very simple models will be shown to be able to learn latent price regimes from historical data in a highly structured and unsupervised fashion, enabling the generation of realistic market scenarios, while maintaining straightforward econometrics-like explainability.
The idea of using HMM on electricity prices data is not new in itself. This approach is, however, usually aimed at price forecasting (which we do not do; we simply propose scenario generation, and in the text we will explain why we do not think that forecasting DAM prices with HMMs is a good idea). Available papers from the literature that apply HMMs to DAM electricity prices will be listed below. In addition, once this approach is selected, attaching different distributions with a continuous support to different states is natural. This can also lead to the idea of directly attaching mixtures to the states, like we do, although we propose an advanced type of mixture, hierarchical mixtures, never used before on DAM data. One can go even beyond that, and attach vector mixtures to the states. Even the dataset we chose has been already explored with HMM-based models. However, all HMM papers we know miss one main point in using DAM data, from Alberta or from other DAMs. As said, the 24 DAM prices are set daily, with all 24 at once, hence same-day prices share the same information. Trying to apply an HMM model to the scalar hourly sequence of prices staggered in a row of hourly values introduces spurious causality, breaks down infra-day coherency, and cannot be used in a real trading situation, since for forecasting tomorrow’s hour 6, you will need the price of tomorrow’s hour 5, which you do not have today. This leads us to propose a vector hierarchical mixtures HMM approach to model in a probabilistic way DAM data. This approach should be able to ’speak DAM language’, that is, doing scenario generation. We also noticed that the papers we collected don’t take into account the questions about interesting mathematical problems, which the use of this technique poses. We thus tried to formalize these questions in terms of dynamical modeling mathematics in relation to current mathematical research. We also found it interesting (but also maybe obvious) to notice that interest in HMM-based models applied to DAM data began at the beginning of the year 2000 with the advent of DAMs, and faded in just a few years. Actually, the interest in DAM prices grew very strongly, but newer machine learning techniques, especially deep learning, took over in the meantime, making HMMs sort of obsolete. However, considering HMM-related techniques too old or obsolete is, in our opinion, wrong because this approach still has many ideas to suggest even deep learning methodologies. The reason for that will be part of the discussions of this paper. Finally, why in the end is it useful to ‘learn speaking DAM’? Probabilistic modeling means learning the structure of uncertainty present in the data. Energy Finance is very much about uncertainty management. This is made by means of scenario analysis, derivative pricing, correlation quantification, anticipative control for optimal portfolio composition, and probabilistic forecasting, which are all techniques that require joint probabilistic information about data. The more accurate is the representation of uncertainty, the better comes out energy risk management performance. If this representation includes also some analytic aspects, that is even better.
In the literature, the related oldest paper we found is an IEEE proceedings by Zhang et al. from 2010 [
18]. A 4-states HMM is used to forecast hourly prices by the use of four distributions, none of them a mixture. No mathematical discussion is carried out. It is not clear which dataset was used. A preprint from 2015 by Wu et al. [
19] works on forecasting prices of the Alberta DAM. It is interesting to notice that the paper opens with a short discussion about previous experiences of other groups on switching Markov models and clustering on European prices. In this HMM paper they work with hand-preprocessed discrete distributions, hence with symbolic HMMs. There is more attention to the mathematics of the problem, but no advancement of the techniques. We found a proceedings from 2016 by Dimoulkas et al. [
20], working with HMM and Nordpool balancing market data on forecasting. Noticeably, the balancing market has statistical features very different from the wild price dynamics of the Alberta DAM. Interestingly for us, they work with a mixture of Gaussians attached to each state, like those we start with. It is an application paper, without theory. We found a full paper by Apergis et al. from 2019 in the Energy Economics journal [
21], working on a parent research line, that of semi-Markov models, applied to Australian electricity prices. They work with scalar sequences of weekly volume weighted average spot prices, which is a choice more sensible than working on hourly prices. Their aim, as much as is sensible and similar to one of our aims, is that of studying the inner working of the market by means of the dynamics of the hidden coordinates. We also found a very recent conference paper by Duttilo et al. from 2025 [
22] applied to forecasting Italian DAM prices, based on a standard HMM, but using non-standard generalized normal distribution components (but not mixtures), on daily (not hourly) returns, a quite sensible target. Based on that, we think that we can say that our proposal adds some new possibly interesting issues to the study of DAM prices with HMM-based models, to the specific literature on Alberta DAM prices dynamics, and to the literature on HMM-based models itself.
The plan of the paper is as follows:
After this Introduction,
Section 2, will define suitable notation and review usual vector autoregression modeling to prepare the discussion on VMs and VHMMs for DAM prices. The difference between the discriminative approach (stochastic equations) and the purely probabilistic generative approach to time series modeling will be highlighted in this discussion.
Section 3, starting from a simplified time structure for the models, will introduce VMs as machine learning dynamical mixture systems uncorrelated in inter-day dynamics but correlated in infra-day dynamics, and will discuss their inherent capacity of doing clustering in a hierarchical way. In passing, this section will discuss how their structure can be thought as similar to that of deep learning. Stochastic equations formalism will be contrasted with purely probabilistic formalism. This is a core theoretical section of the paper.
Section 4, after discussing the very complex features of the chosen time series, will show how the proposed VM models perform on DAM data, especially in terms of the features that they can automatically extract, and in terms of the synthetic series that they can generate.
Section 5, based on the uncorrelated structures illustrated in
Section 3, will discuss VHMMs as models fully correlated in both infra-day and inter-day dynamics, and their relationship to their HMM backbone.
Section 6 will show the behavior of VHMMs when applied to Alberta DAM data, their remarkable scenario generation ability and their special ability of accurately modeling and mimicking price spike clustering, due to time inclusion in their structure. This is a core practical section of the paper.
Section 7 will conclude.
3. Uncorrelated Generative Vector Models: Mixtures, Clustering and Complex Patterns
In this section the core block of the proposed generative modeling approach for DAM data is discussed. Vector Gaussian mixtures are introduced and related to their ability of automatically clustering and self-organizing data. Then, these mixtures are themselves used to build mixtures of mixtures, showing how hierarchical structure emerges from this construction. This will prepare the discussion of the next section, where this setup will be used to explore DAM data, and generate complex price sequences that look very much similar to original data.
3.1. Mixtures and Clustering
By Equation (
10), the generative/discriminative VAR(0) model is defined in distribution as
. Estimation of this model on the data set
means estimating a multivariate Gaussian distribution with mean vector
of coordinates
and symmetric covariance matrix
of coordinates
. Parameter estimation is made by maximizing the likelihood
L obtained multiplying Equation (
10)
N times, or maximizing the associated loglikelihood LL (which thus becomes a sum). The parameters can be thus be obtained analytically from the data, and since the problem is convex this solution is unique. Once
has been estimated, estimated ‘hourly’ univariate marginals
and ‘bi-hourly’ bivariate marginals
can be analytically obtained by partial integration of the distribution. In addition, for a generic market day, i.e., a vector
,
and
can define a distance measure
in a 24 dimensions space from
to the center
of the Gaussian of Equation (
10) as
where the superscript
indicates the inverse and the superscript ′ indicates the transpose.
is called Mahalanobis distance [
34]. This measure will be used later.
The VAR(0) model can become a new and more complex stochastic chain after replacing its driving Gaussian distribution with a driving ‘Gaussian mixture’ of a given number of ‘components’, making it a Vector Mixture VM.
An
S-component VM is thus a generative dynamic model defined in distribution as a linear combination of Gaussians,
where
is an abbreviated notation for
[
35]. The
S extra parameters
subject to
are called mixing parameters or weights. Continuous distributions must integrate to 1, and discrete distributions must sum to 1. Integrating Equation (
15) along
gives
, which by definition sum to 1. Hence the r.h.s. of Equation (
15) is a sound distribution.
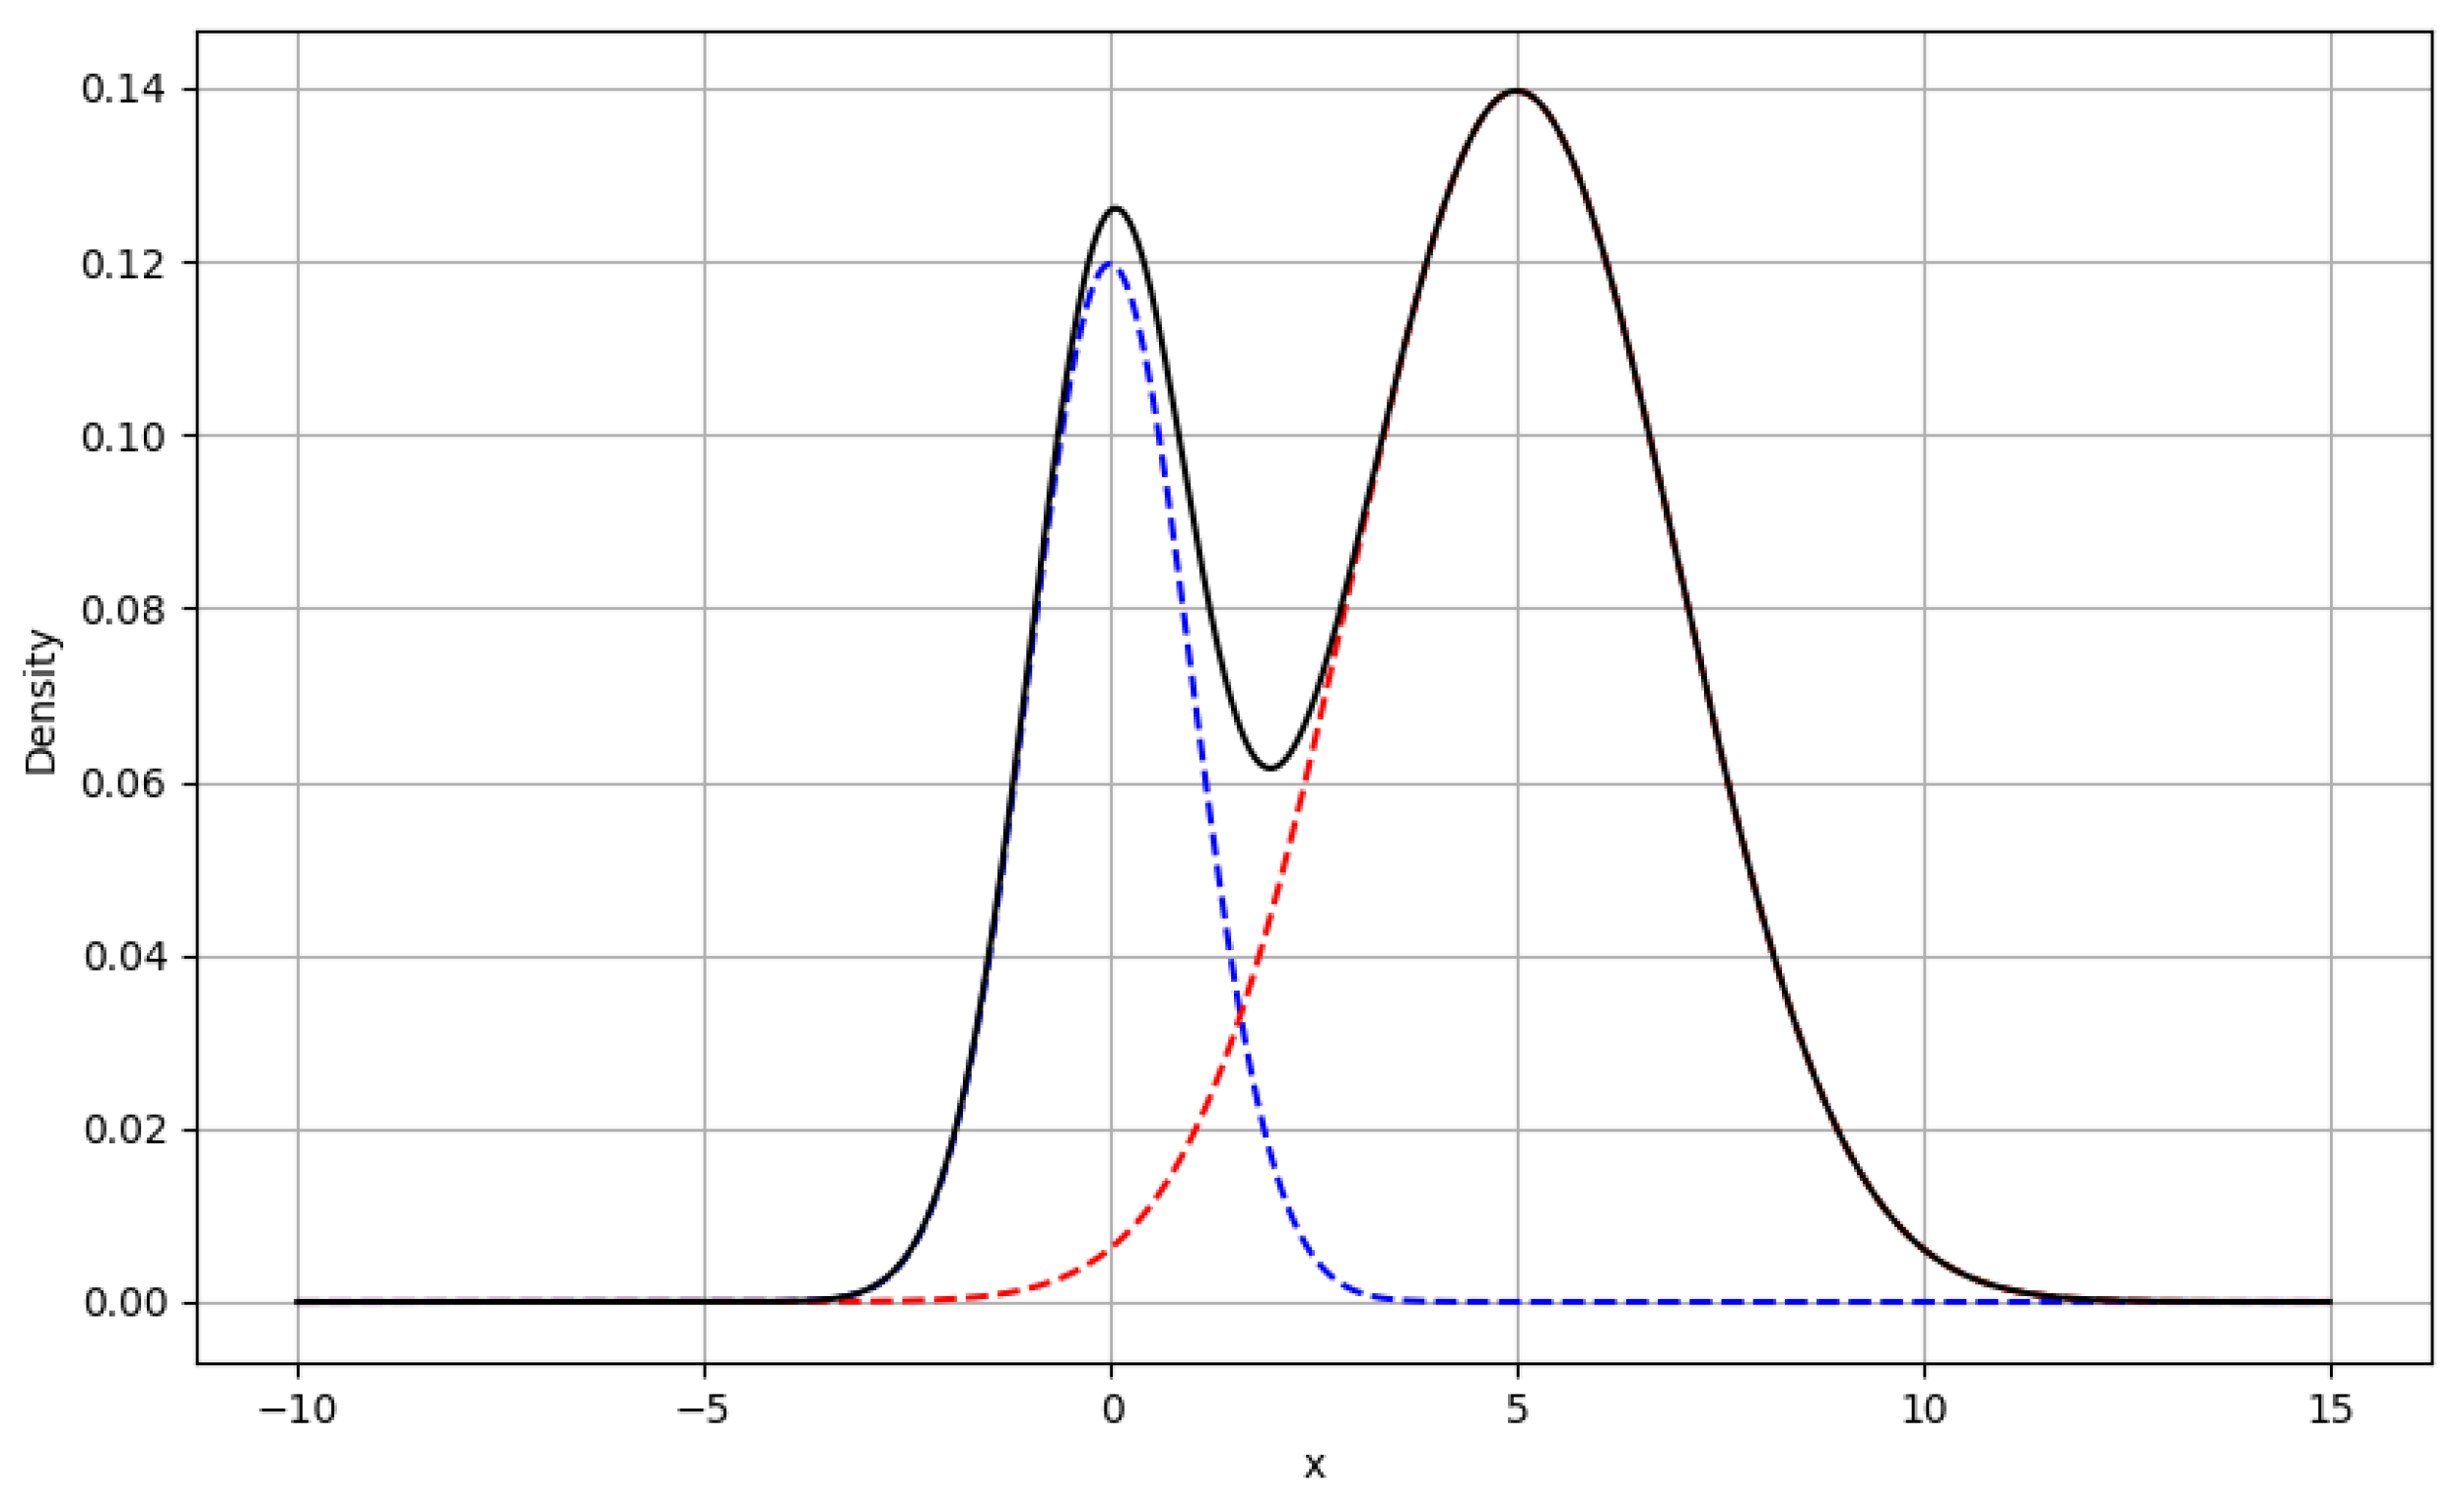
Figure 2 shows an example with
,
and
, a model of type
Like the VAR(0), the VM is a probabilistic generative model, of 0-lag type, uncorrelated in the sense that it generates an interday independent dynamics, unlimited with respect to maximum attainable sequence length. In Equation (
15) the
subscript is there to remark its dynamic nature, since mixture models are not commonly used for stochastic chain modeling, except possibly in GARCH modeling (see for example [
36]). A VAR(0) model can thus be seen as a one-component
VM. For
the distribution in Equation (
15) is multi-modal (in
Figure 2 there are two distinct peaks, which are the mode of the Gaussians), and maximization of the LL can be made in a numeric way only, either by Montecarlo sampling or by the Expectation–Maximization (EM) algorithm [
6,
37]. When estimating a model, since EM can get stuck into local minima, multiple EM runs have to be run from varied initial conditions in order to be sure to have reached the global minimum.
Means and covariances of the
S-component VM can be computed in an analytic way from means and covariances of the components. For example, in the
case in the vector notation the mean is
and in coordinates the covariance is
Hourly variance
is obtained for
in terms of component hourly variances
and
as
The mixture hourly variance is thus the weighted sum of component variances plus a correction term which is similar to covariance in the case of a weighted sum of two gaussian variables. Based on the component variances, in analogy with the distance defined in Equation (
14) a number
S of Mahalanobis distances
can be now associated to each data vector
. In Equation (
15) the weights can be interpreted as probabilities of a discrete hidden variable
s, i.e., as a distribution
over
s.
All of this is important because an estimated VM implicitly clusters data, in as many Gaussians as appear in the model, in a probabilistic way.
In machine learning, clustering, i.e., unsupervised classification of vector data points called evidences into a predefined number
K of classes, can be made in either a deterministic or a probabilistic way. Deterministic clustering is obtained using algorithms like K-means [
38], based on the notion of distance between two vectors. K-means generates
K optimal vectors called centroids and partitions the evidences into
K groups such that each evidence is classified as belonging only to the group (cluster) corresponding to the nearest centroid in a yes/not way. Here ‘near’ is used in the sense of a chosen distance measure, often called linkage. In this paper, for the K-means analysis used in the Figures the Euclidean distance linkage is used.
Probabilistic clustering into
clusters can in turn be obtained using
S-component mixtures in the following way, which is called the EM algorithm. In a first step the estimation of a S-component mixture on all evidences
finds the best placement of means and covariances of
S component distributions, in addition to
S weights
, seen as unconditional probabilities
. Here best is intended in terms of maximum likelihood. The component means are vectors that can be interpreted as centroids, the covariances can be interpreted as parts of distance measures from the centroids, in the Mahalanobis linkage sense of Equation (
14). In a second step, centroids are kept fixed. Conditional probabilities
of individual data points (our daily vectors), technically called ‘responsibilities’, are then computed by means of a Bayesian-like inference approach which uses a single-point likelihood. In this way, to each evidence a probability
of belonging to one of the clusters is associated, a member relationship which is softer than the yes/not membership given by K-means. For this reason, K-means clustering is called hard clustering, and probabilistic clustering is called soft clustering.
It is very important to notice that s, which started as a component index, is now interpreted as a latent or hidden state, on which the model can find itself, which a probability that can be computed once the model is fitted on data.
Being a product of mixtures, an uncorrelated VM model can do soft clustering in a intrinsic way, partitioning the data without supervision and automatically incorporating this feature in the generative vector model. In addition, as time goes on (d grows), the system finds itself exploring the hidden state set available to the mixture. For example, when , a generated trajectory could correspond to the state sequence . Notice that these outcomes can never become explicit data, they cannot be observed, they can only be inferred. This is what makes of a VM a latent variable model.
3.2. Mixtures of Mixtures, and Hierarchical Regime Switching Models
Hence, in a dynamical setting, independent copies of the mixture variable s can be associated with the days, thus forming a (scalar) stochastic chain ancillary to . In the example above, a realization of this chain could be .
This suggests a further and deeper interpretation of a VM, which will lead to a hierarchical extension of VMs themselves, with an attached econometric interpretation, and which will make them deep.
Consider as an example the
model. Each draw at day
d from the two-component VM can be seen as a hierarchical two-step (i.e., doubly stochastic) process, which consists of the following sequence. At first, flip a Bernoulli coin represented by the scalar stochastic variable
with support
and probabilities
. Then, draw from (only) one of the two stochastic variables
,
, specifically from the one which
i corresponds to the outcome of the Bernoulli flip. The variables
are chosen independent from each other and distributed as
. If
is the support of
, the VM can thus be seen as the stochastic nonlinear time series
a vector Gaussian regime switching model in the time coordinate
d, where the regimes 1 and 2 are formally autoregressions without lags, i.e., of VAR(0) form. A path of length
N generated by this model consists of a sequence of
N hierarchical sampling acts from Equation (
19), which is called ancestor sampling. In Equation (
19) the r.h.s. variables
,
,
are daily innovations (i.e., noise generators) and the l.h.s. variables
,
are system dynamic variables. Even though the value of
is hidden and unobserved, it does have an effect on the outcome of observed
because of Equation (
19). Notice that if the regimes had
, for example
like the VAR(1) model of Equation (
3), the model would have been discriminative and not generative. It would have had a probabilistic structure based on the conditional distribution
, like most regime switching models used in the literature [
24]. Yet, it would not be capable of performing soft clustering.
Generative modeling requires at first to choose the joint distribution. The hierarchical structure interpretation of the basic VM (a simple mixture), Equation (
19), implies that in this case the generative modeling joint distribution is chosen as the product of factors of the type
From Equation (
20) the marginal distribution of the observable variables
can be obtained by summation
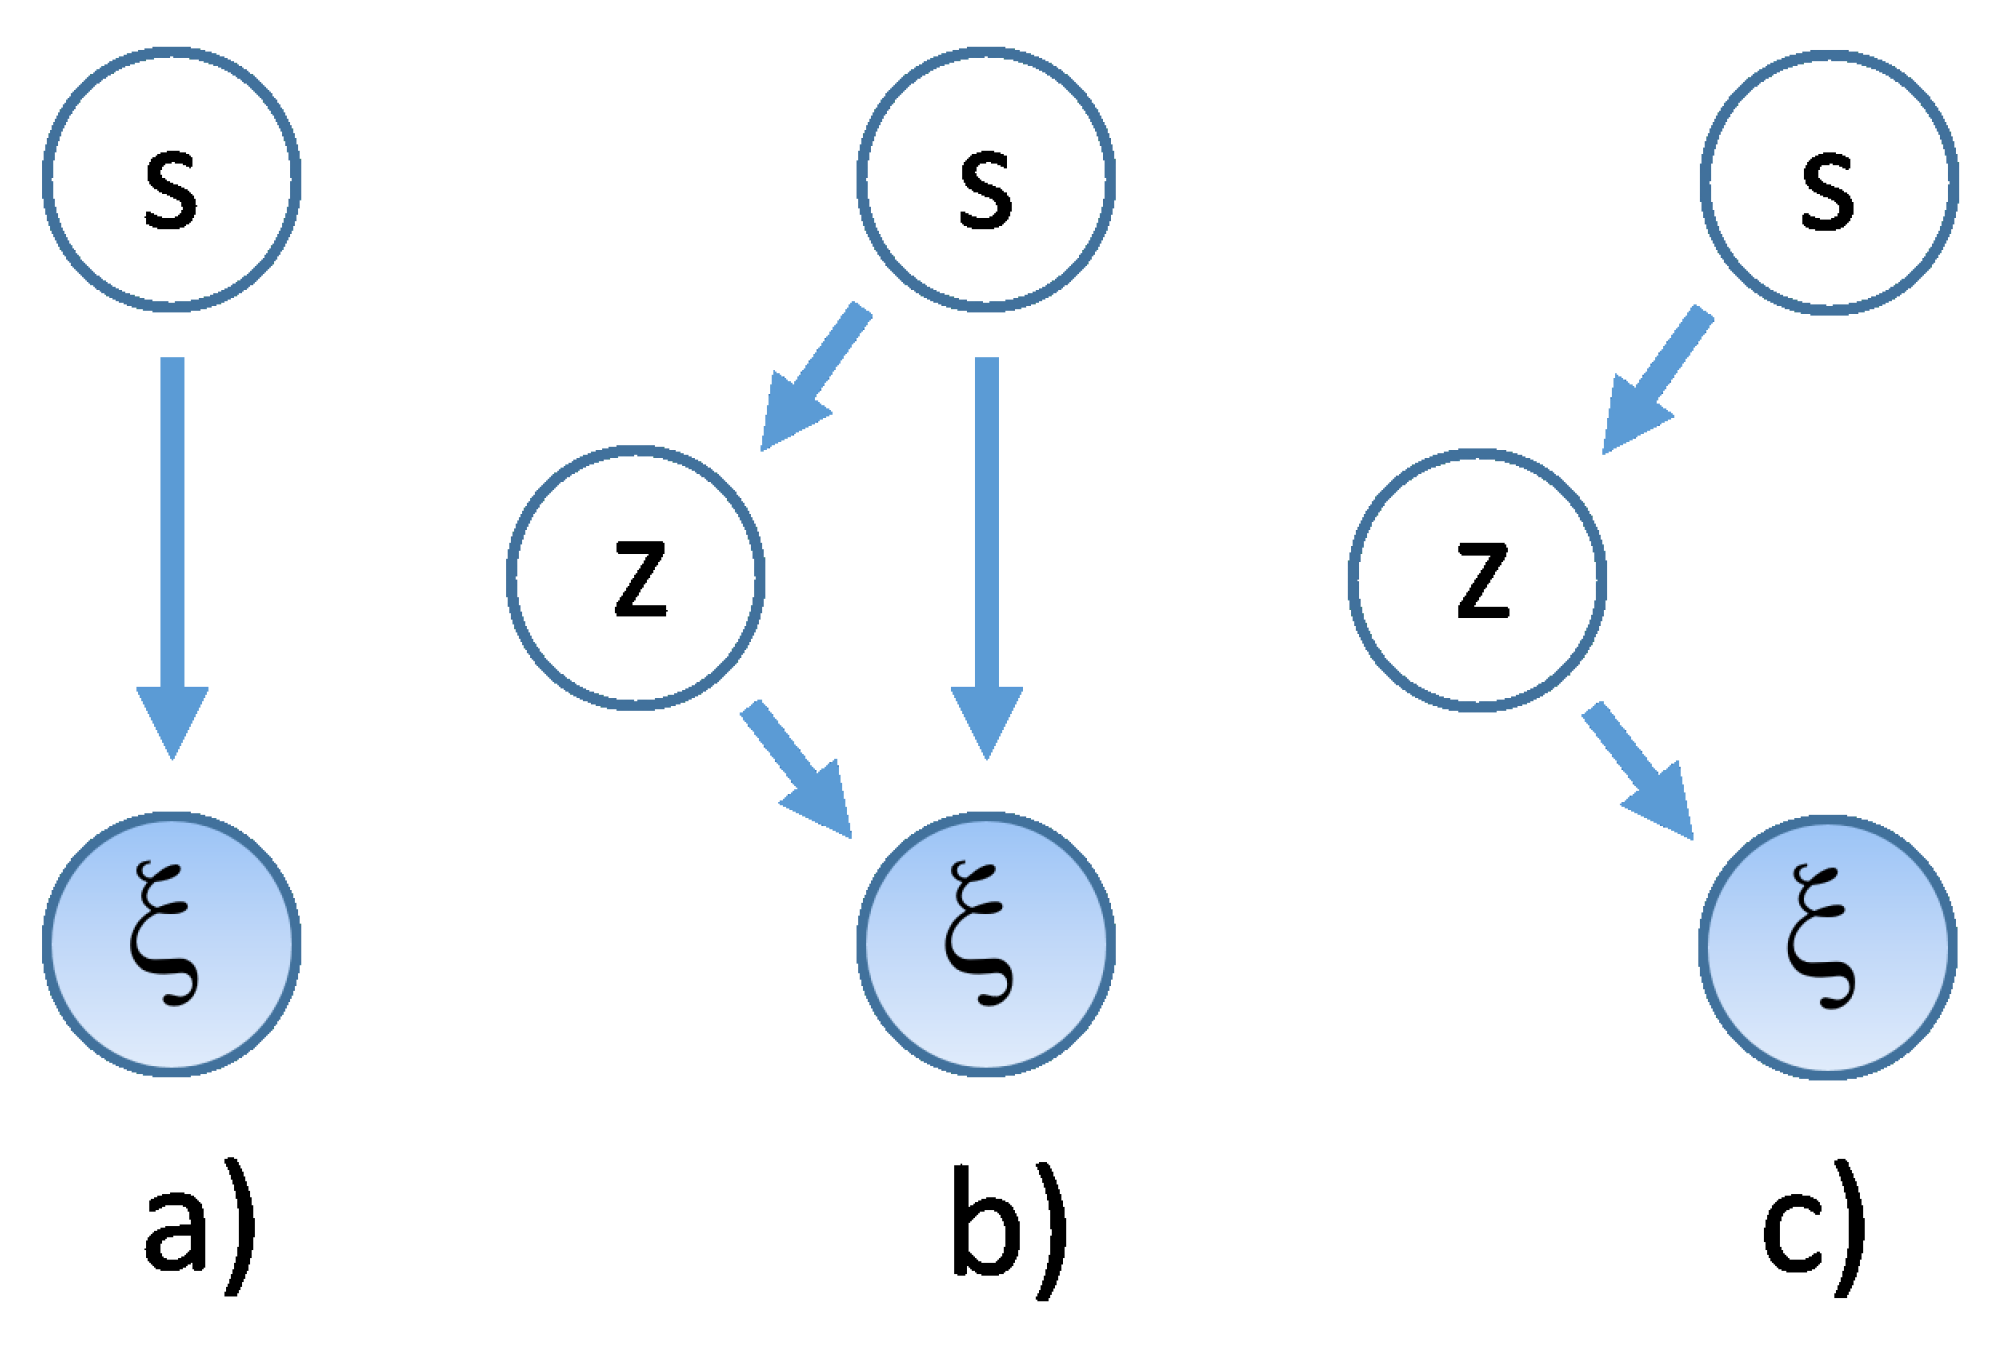
A graphic representation of this interpretation of our VM model is shown in
Figure 3, where model probabilistic dependency structure is shown in such a way that the dynamic stochastic variables, like those appearing on the l.h.s. of Equation (
19), are encircled in shaded (observable type) and unshaded (unobservable type) circles, and linked by an arrow that goes from the conditioning to the conditioned variable. This structure is typical of Bayes Networks [
6]. Specifically, in panel (a) of
Figure 3 the model of Equation (
19) is shown.
It will be now shown that models like that in
Figure 3a can be made deeper, like those
Figure 3b,c, and that this form is also necessary for a parsimonious form of modeling in VHMMs to be discussed in
Section 5. Define the depth of a dynamic VM as the number
J of hidden variable layers plus one, counting in the
layer as the first of the hierarchy. A deep VM can be defined as a VM with
, i.e., with more than two layers in all, in contrast with the shallow (using machine learning terminology) VM of Equation (
19). A deep VM is a hierarchical VM, that can be also used to detect cluster-within-clusters structures.
As an example, a
VM can be defined in the following way. For a given day
d, let
and
to be again two scalar stochastic variables with
S-valued integer support
,
and same distribution
. Let
to be
S new scalar stochastic variables, all with same
M-valued integer support
,
, and with time-independent distributions
. Consider the following VM obtained for
and
:
where
In Equation (
22) the second layer variables
are thus described by conditional distributions
. This is a regime switching chain which switches among four different VAR(0) autoregressions. Seen the model as a cascade chain, at time
, a Bernoulli coin
is flipped at first. This first flip assigns a value to
. After this flip, one out of a set of two other Bernoulli coins is flipped in turn, either
or
, its choice being conditional on the first coin outcome. This second flip assigns a value to
. Finally, one Gaussian out of four is chosen conditional on the outcomes of both the first and the second flip. Momentarily dropping for clarity the subscript
from the dynamic variables and reversing to mixture notation, the observable sector of this partially hidden hierarchical system is expressed in distribution as a (marginal) distribution in
, with a double sum on hidden component sub-distribution indexes
The number of components used in Equation (
24) is
, and this can be immediately read out from the symbol for the components
. The Gaussians are here conditioned on both second and third hierarchical layer
i and
j indices. See panel (b) of
Figure 3 for a graphical description. Intermediate layer information about the discrete distributions
can be collected in a
matrix
which supplements the piece of information contained in
. In Equation (
25) the rows sum to 1 in order to preserve the probabilistic structure. In this notation Equation (
24) becomes
Notice also that this hierarchical structure is more flexible than writing the same system as a shallow flip of an
faces dice because it fully exposes all possible conditionalities present in the chain, better represents hierarchical clustering, and allows for asymmetries–like having one cluster with two subclusters inside and another cluster without internal subclusters. In addition to the structure of Equation (
22), another more compact
hierarchical structure, a useful special case of Equation (
22), is
with the same
f as in Equation (
23). This system has distribution (in the simplified notation)
or, for
,
where
and
, and where now the Gaussians are conditioned to the next layer only. See panel (c) of
Figure 3 for a graphical description. This chain can also model a situation in which two different mixtures of the same pair of Gaussians are drawn. In this case, each state
corresponds to a bimodal distribution
, unlike the shallow model. This structure, which is a three-layer two-component regime switching dynamics from an econometric point of view, will be specifically used later when discussing hidden Markov mixtures.
Finally, consider the two columns (a) and (c) of the further graphic representation of these structures shown in
Figure 4. In
Figure 4, column (a), a flat
VM is displayed on the top. Depending on the activated state, two different Gaussians can be activated, and emit in consequence. This structure corresponds to the simple regime switching model represented in
Figure 3a, and to the stochastic equation Equation (
19).
However, it is the third (rightmost) column c) of the Figure which is the best suited to show how these hierarchical systems are indeed mixtures of mixtures. Matrix
in the Figure gathers information about the composed weights of this structure. Consider the following symbolic example, based on Equation (
26), of a
‘deep’ system, where different rows correspond to three different Gaussians:
The two columns of the matrix
represent the two states of a latent
s, the rows represent available Gaussians
, and the rows of
W (conditional probabilities) sum to 1. This system consists of a mixture of the two mixtures
and, however, when flattened, this becomes the linear combination of Gaussians
It is easy to check that the summed integral on this structure returns 1.
This combination of three Gaussians originating from states can be used to study data where features could be nested within other structures, due to the underlaying doubly-stochastic structure. It is the shape and the constraints of W which make it different from a ‘shallow’ system with states. This twin interpretation, in both econometric ( layers) and probabilitstic machine learning ( mixtures) terms of the same system, it is hoped to display how the two cultures can look from different perspectives at the same model.
This Figure will be commented further and in a deeper way in the next sections about correlated dynamics.
3.3. VMs and Forecasting
With VMs, a possible point forecast at day
d can be obtained by the use of estimated means. For example, in the case of the model of Equation (
22), using the indexed symbol
for the vector mean of the conditional Gaussian
,
for its estimate, and
for the forecast value, from Equation (
26) one obtains
Once estimated, this 24 h-ahead point forecast cannot go beyond forecasting the same hourly profile
at any day. Hence, point forecasting of DAM (logarithmic) data with these uncorrelated generative model, independently on how complicated they are, is very bad. For example, for S = 2.
In passing, notice that Equation (
31) can also be used to form makeshift daily errors of the type
As for forecasting, there is a hidden advantage, however. In addition to point forecasting, deep VMs can of course do deep volatility forecasting, through combinations of conditional covariances
, and more complete probabilistic forecasting like quantile or other risk measure forecasting. In the case of a shallow two-component model, the volatility forecast has the form of Equation (
17).
6. Correlated Models on Data
Correlated deep models like the untied and the tied VHMMs overcome the structural limit that prevents uncorrelated VMs to generate series with autocorrelation longer than 24 h. In order to discuss this feature in relation to Alberta data, two technical results [
43] are first needed.
First, if the Markov chain under the VHMM is irreducible, aperiodic and positive recurrent, as usually estimated matrices
A with small
S ensure, then
Recalling Equation (
41), Equation (
46) means that after some time
n the columns of the square matrix
, seen as vectors, become all equal to the same column vector
. Second, at the same conditions and at stationarity, if
counts the number of times a state
has been visited up to time
n, then
i.e., the components of the limit vector
give the percent of time the state
j is occupied during the dynamics.
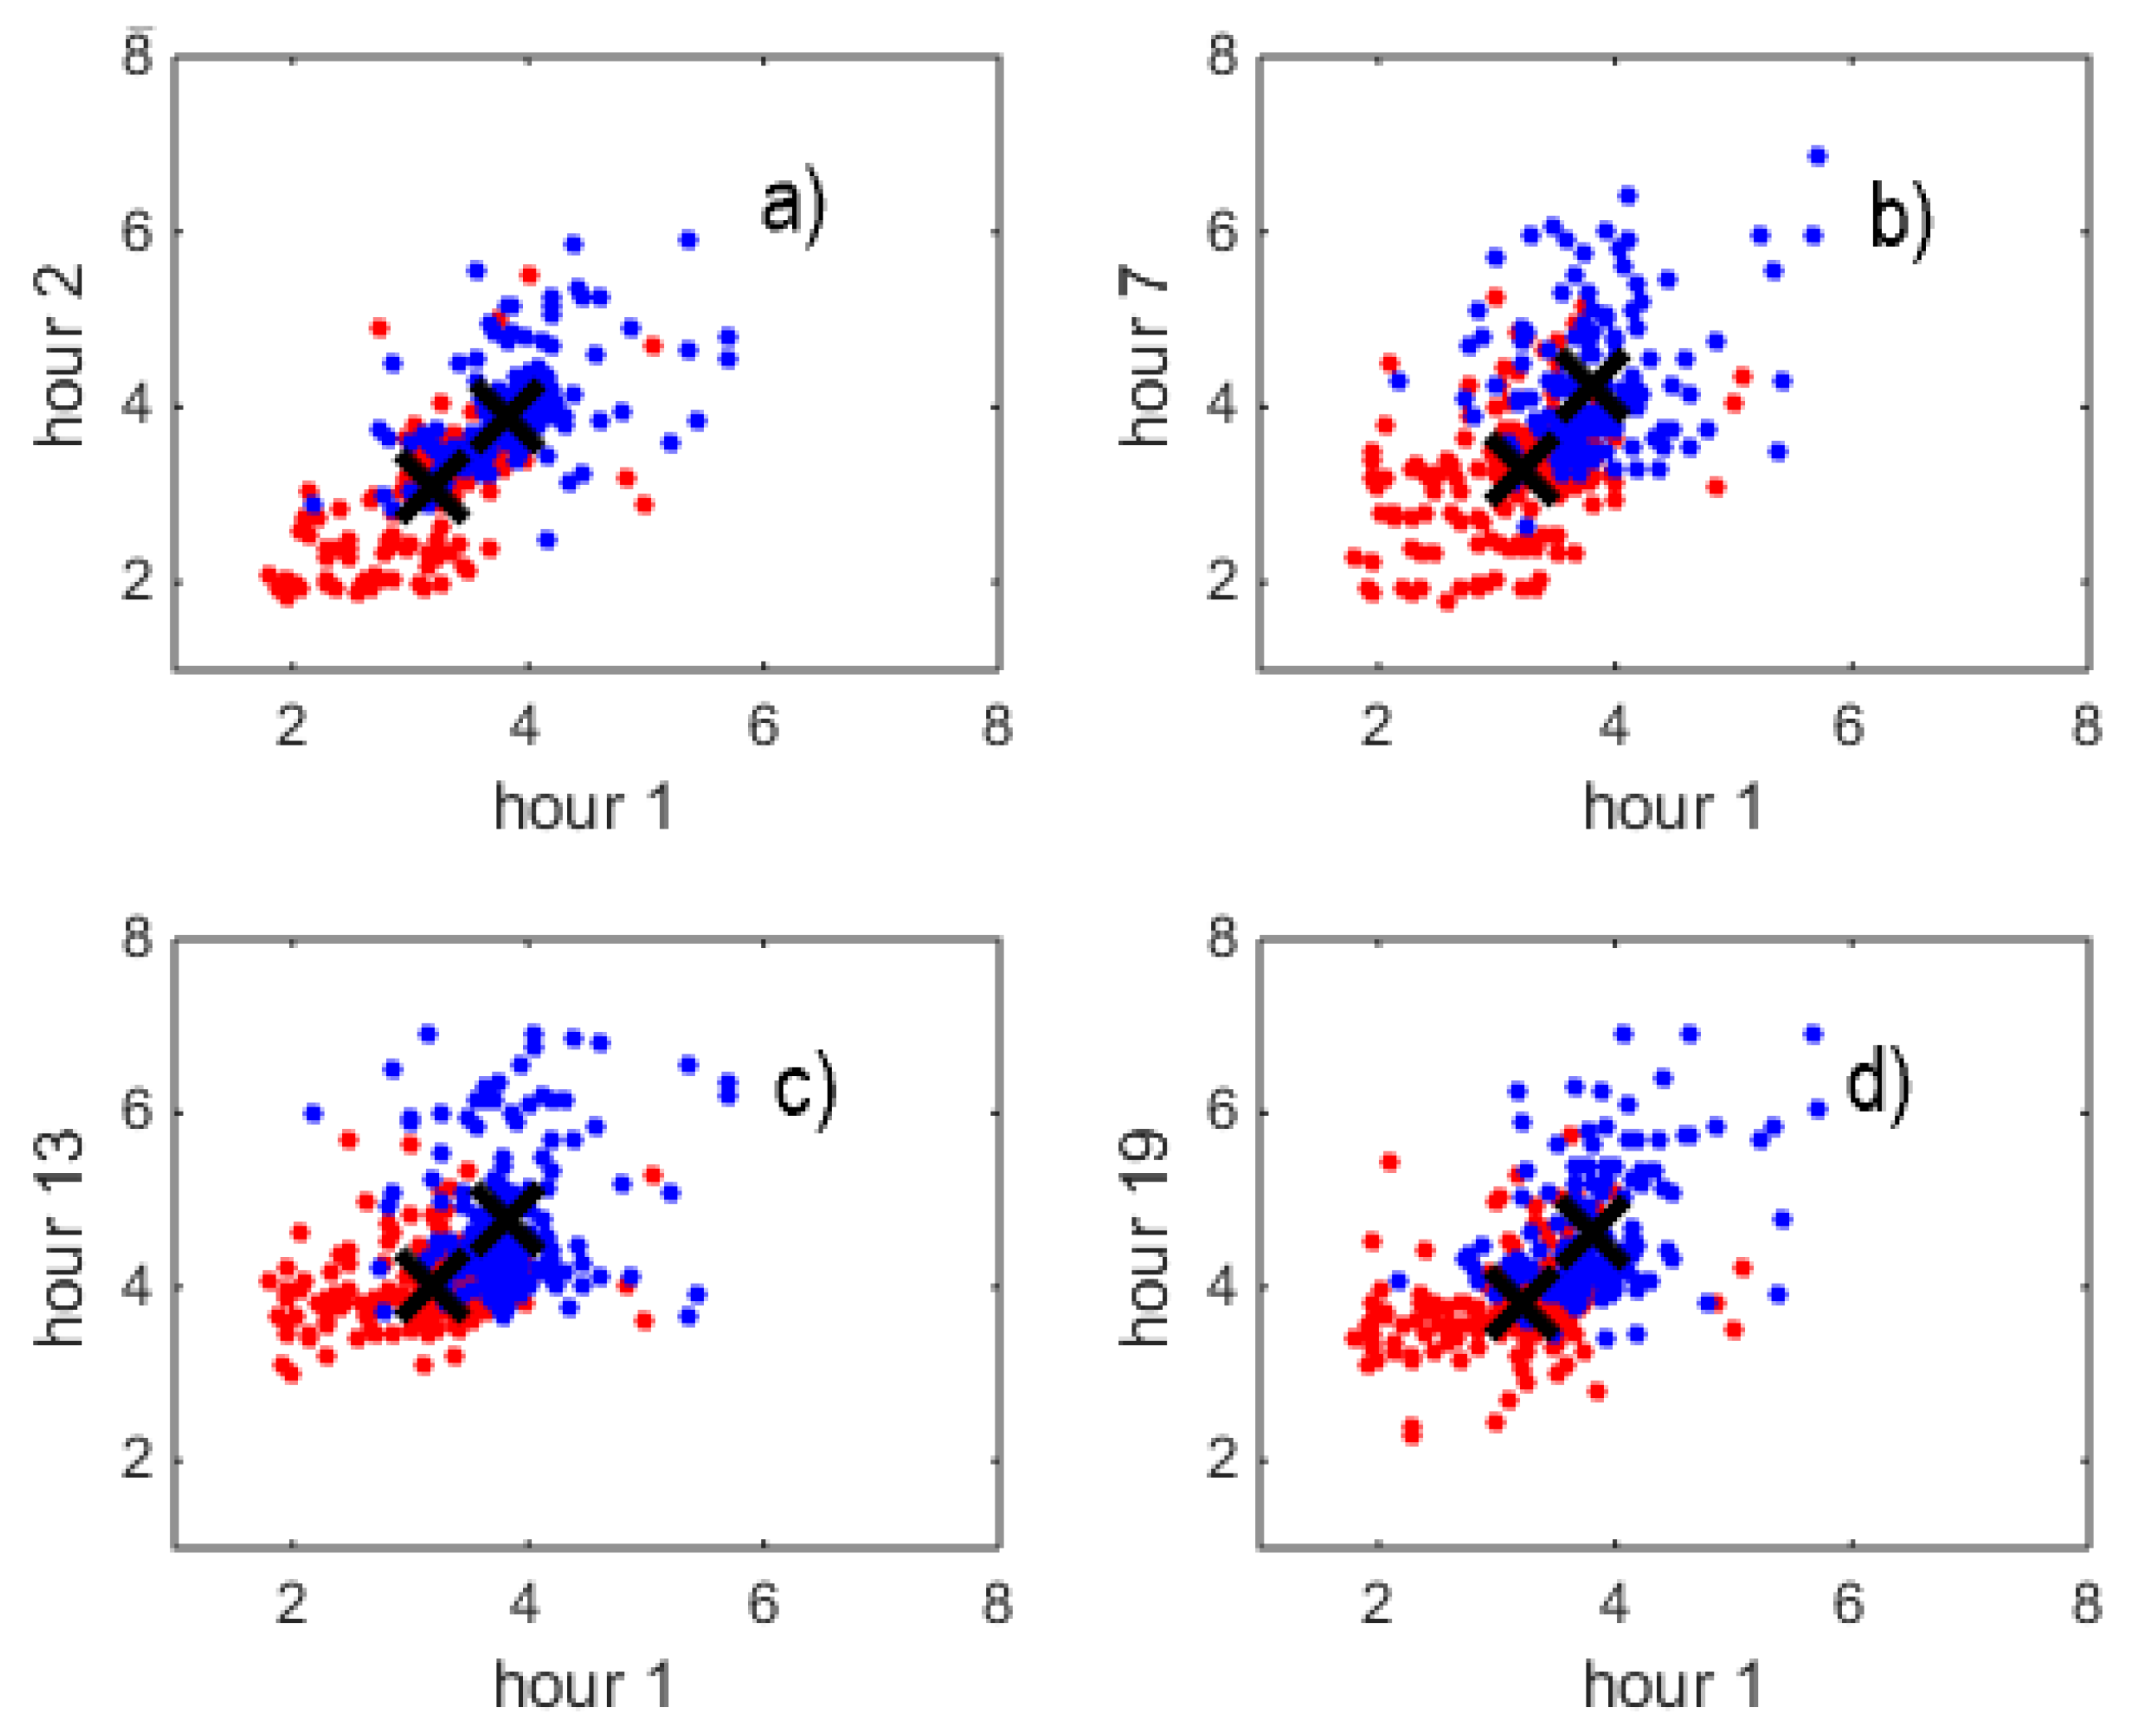
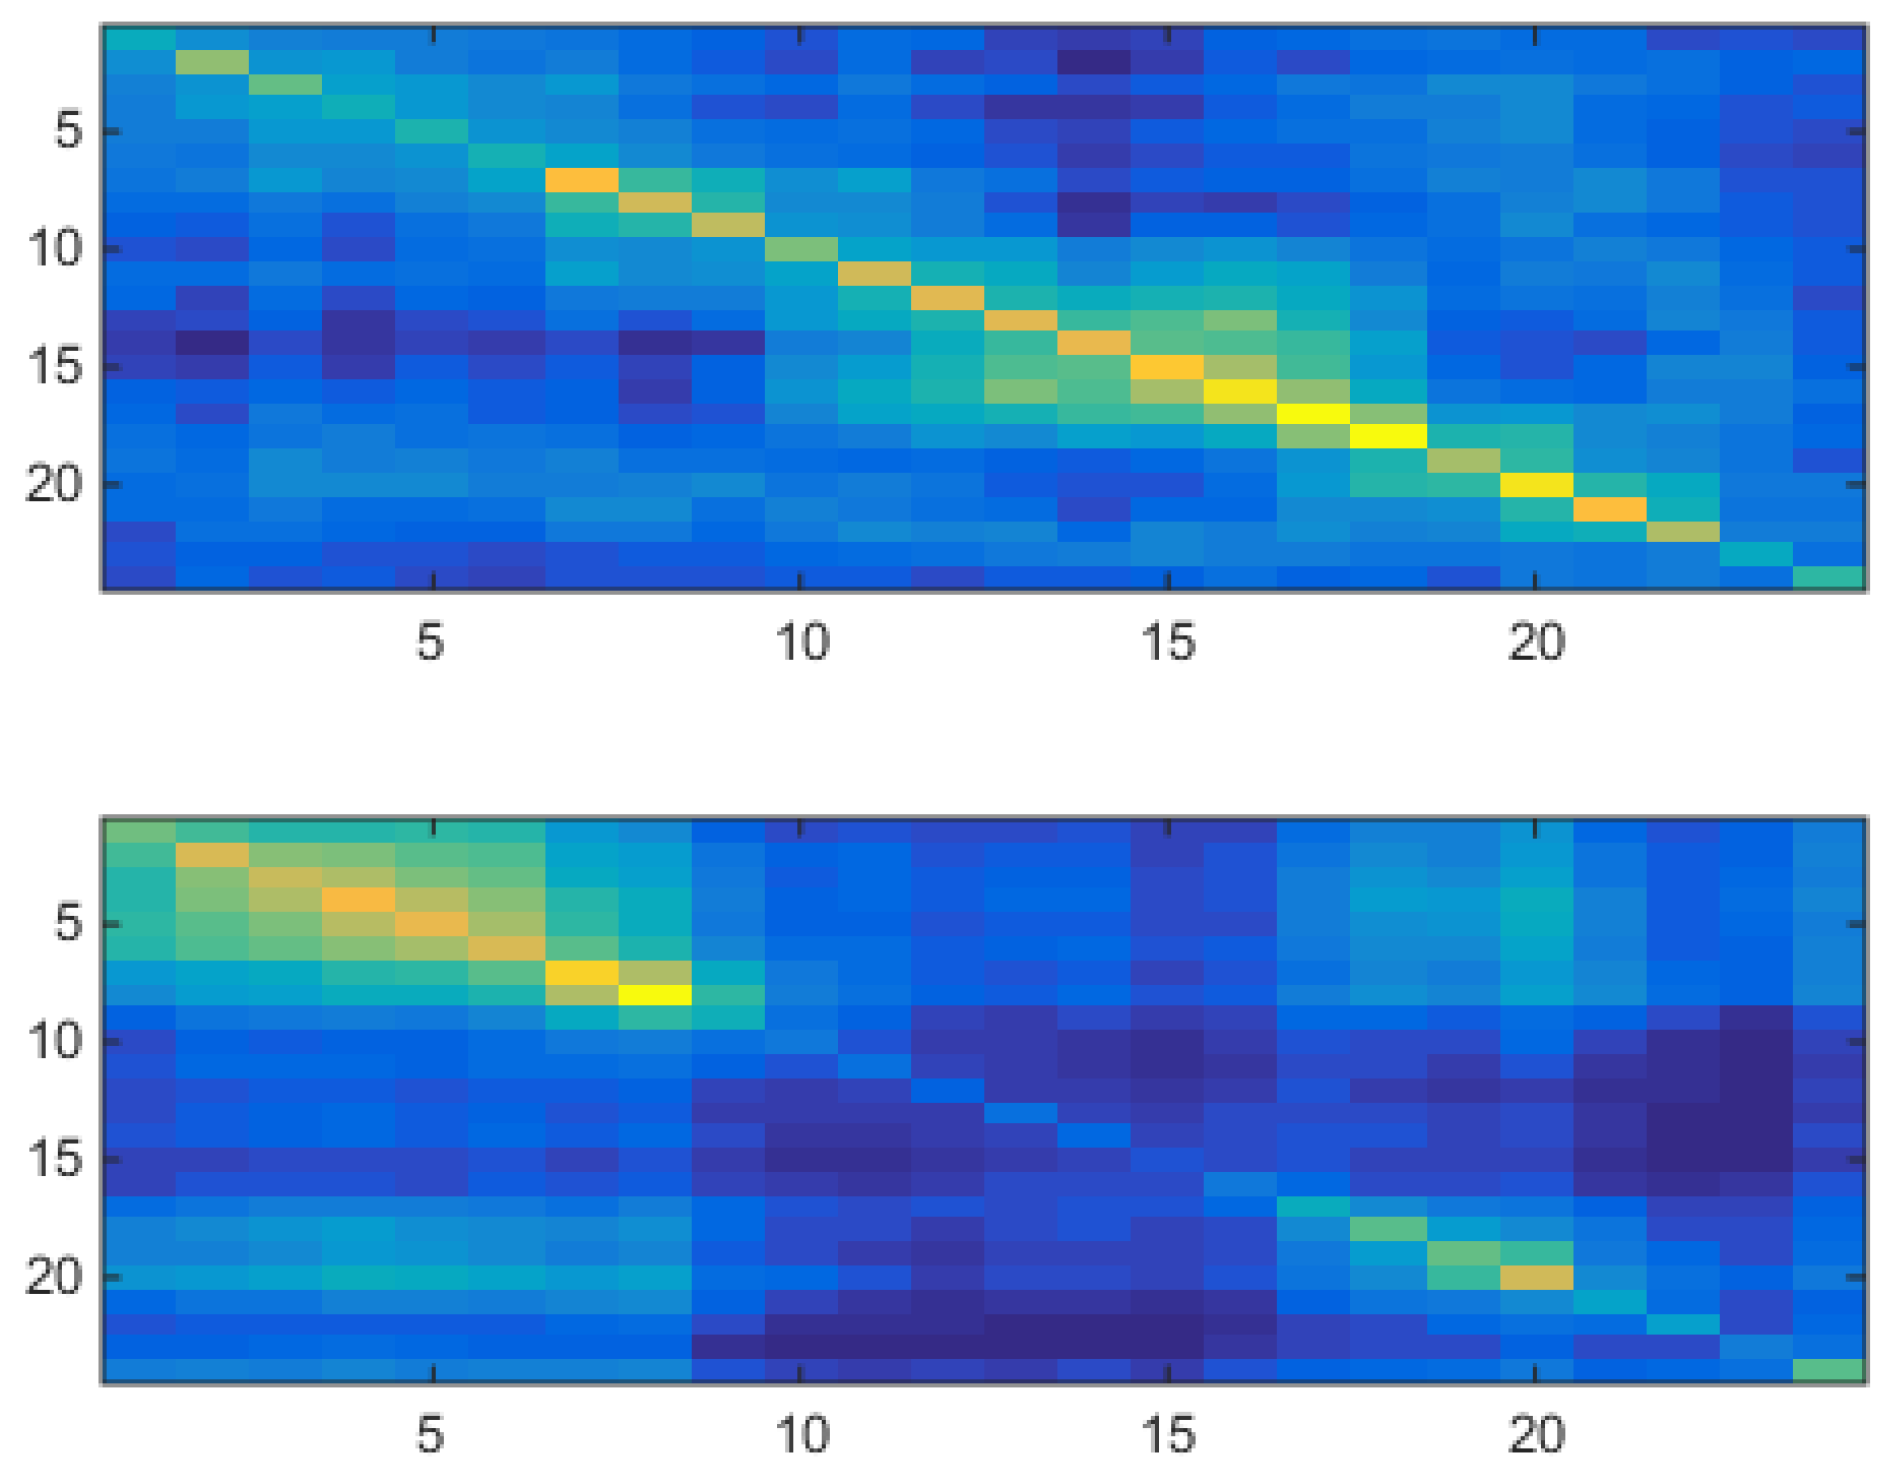
Figure 18 shows for a two-component
tied VHMM the two estimated covariance matrices of the model, to be compared with
Figure 12 for which a two-component uncorrelated shallow VM model was used.
The upper panel of
Figure 18 has an analog in the upper panel of
Figure 12. Both covariances have their highest values along their diagonal, very low values off-diagonal, and high values concentrated in the daily part. The lower panel of
Figure 18 has an analog in the lower panel of
Figure 12. Both covariances have their highest values along their diagonal, very low values off-diagonal, and high values concentrated in the night part. Namely, the correlated VHMM extracts the same structure as that extracted by the uncorrelated VM, i.e., a night/day structure.
Besides covariances and means, another estimated quantity is
(weights of each hidden state value are along rows). This means that, from the point of view of the tied model, each market day contains the possibility of being both night- or day-like, but in general each day is very biased towards being mainly day-like or mainly night-like. The last piece of information is contained in the estimated
(columns sum to one). After about
days
reaches stationarity becoming
As Equation (
46) indicates, this gives
, which means, in accordance with Equation (
47), that the system tends to spend about two thirds of its time on the first of the two states, in an asymmetric way.
Once this information is encoded in the system, i.e., the parameters
are known by estimation, a yearly synthetic series (
) can be generated, which will contain the extracted features. The series is obtained by ancestor sampling, i.e., first by generating a dynamics for the hidden variables
using the first line of Equation (
27) with
(to be compared with Equation (
23)), then for each time
d by cascading through the two-level hierarchy of the last lines of Equation (
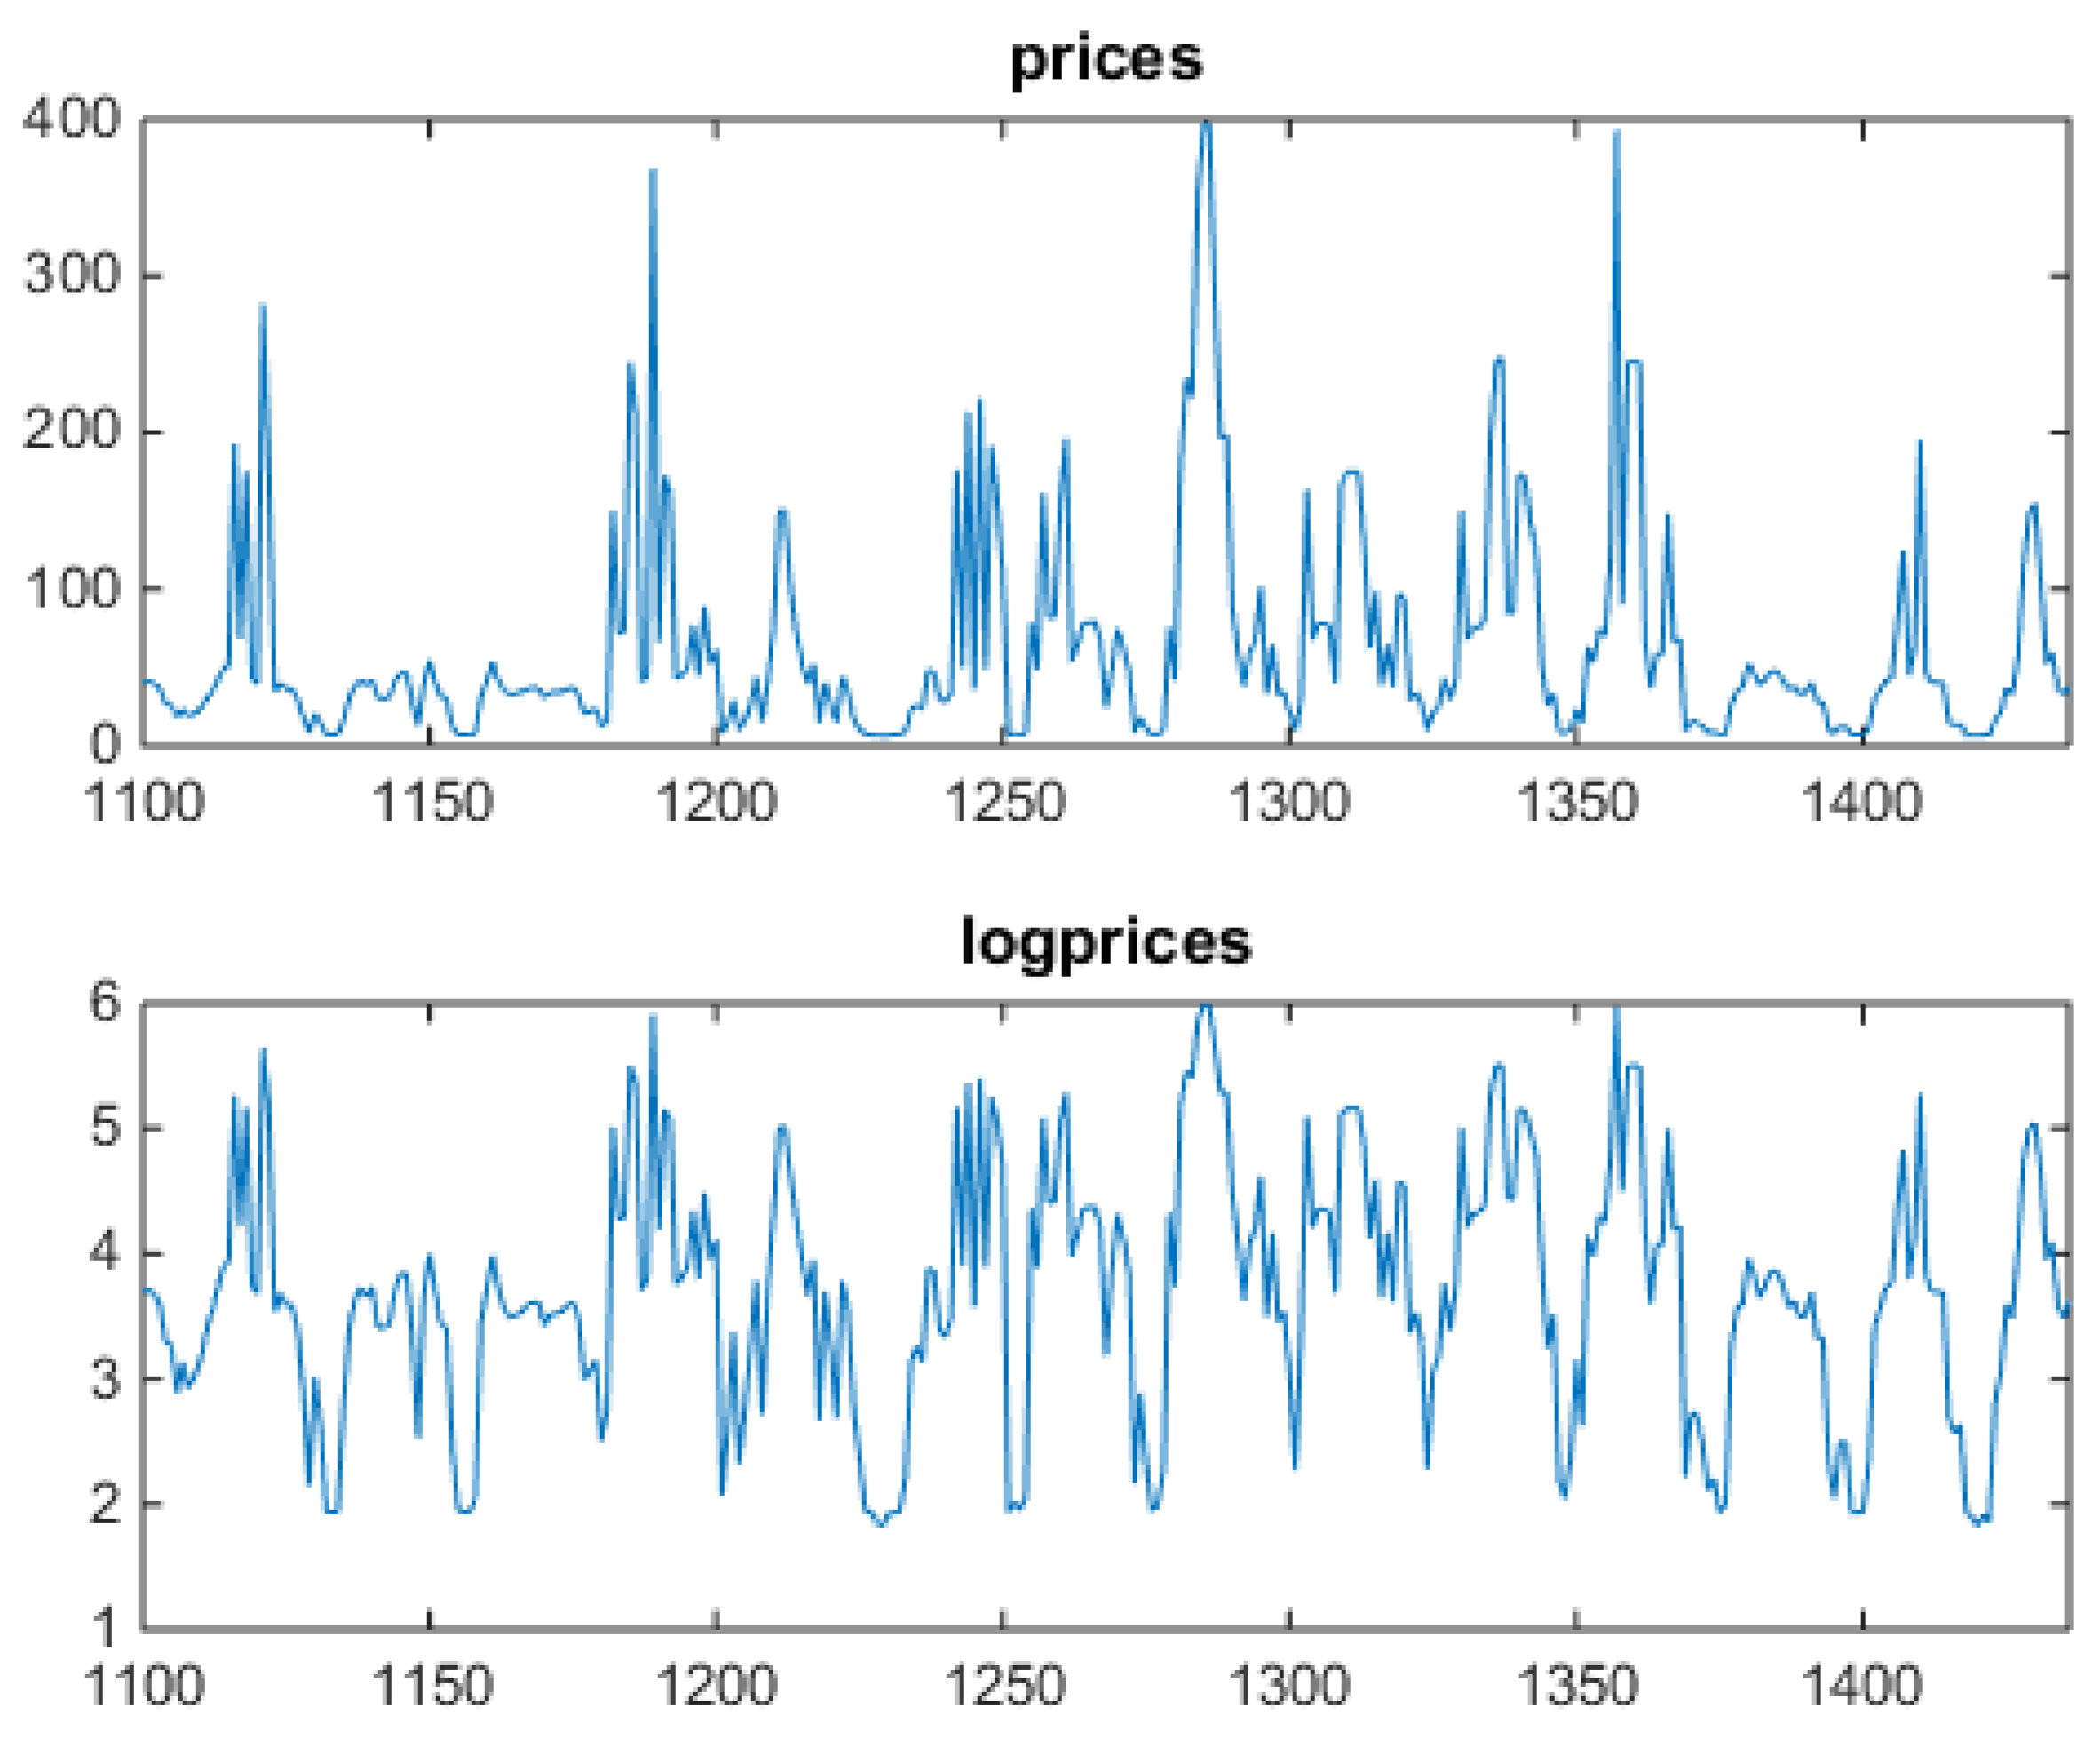
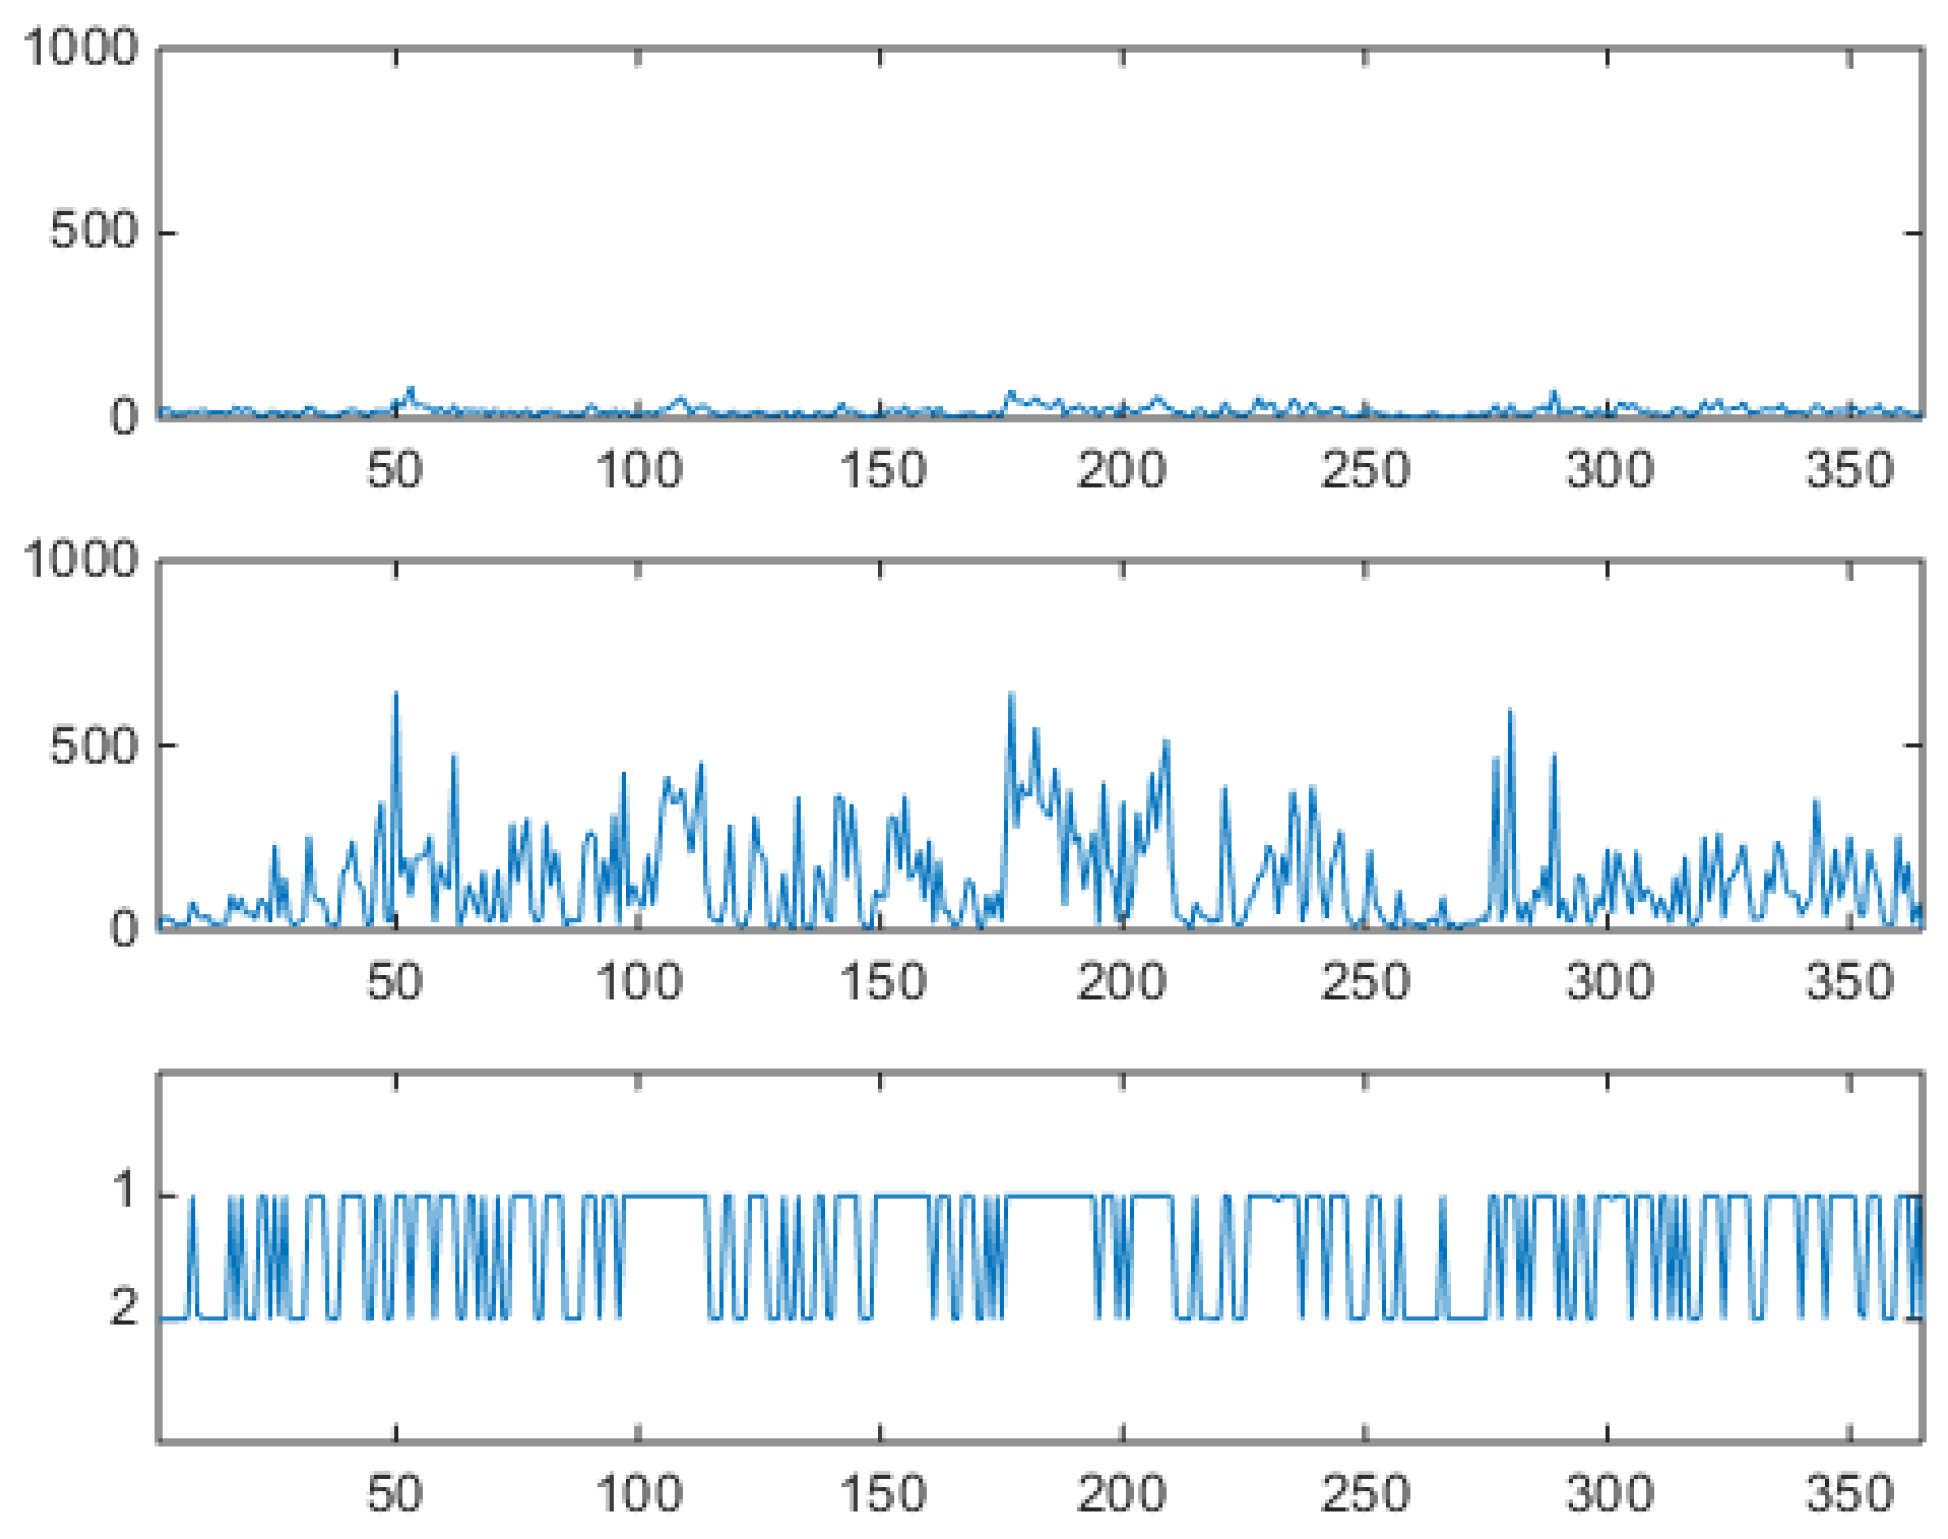
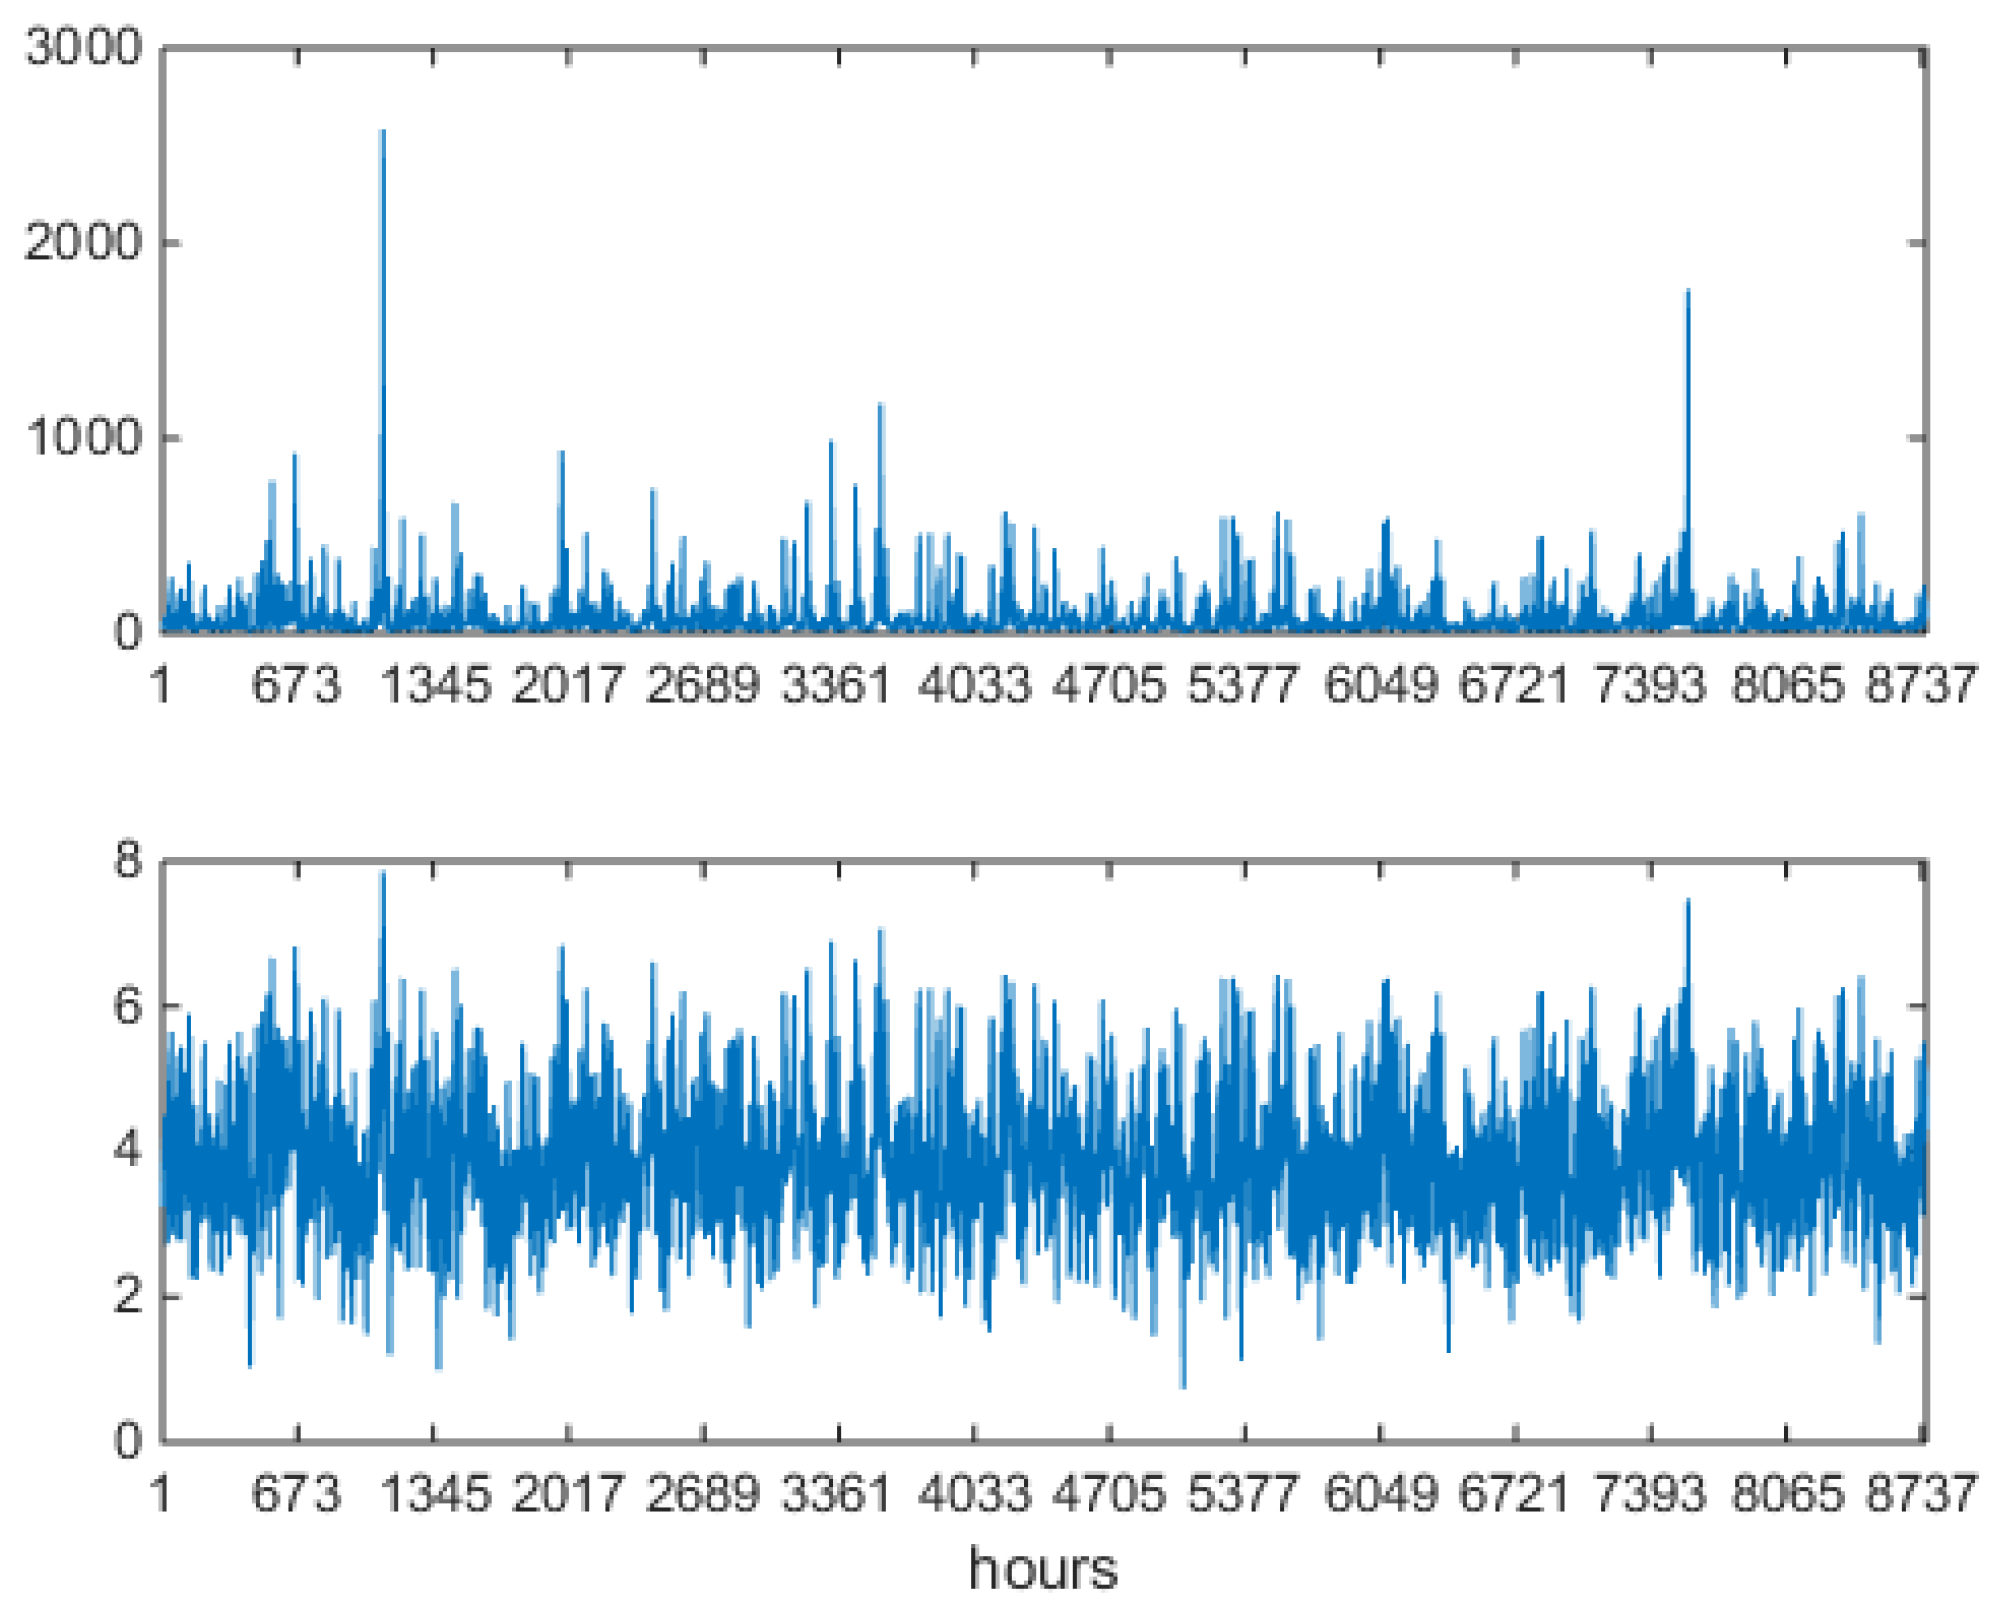
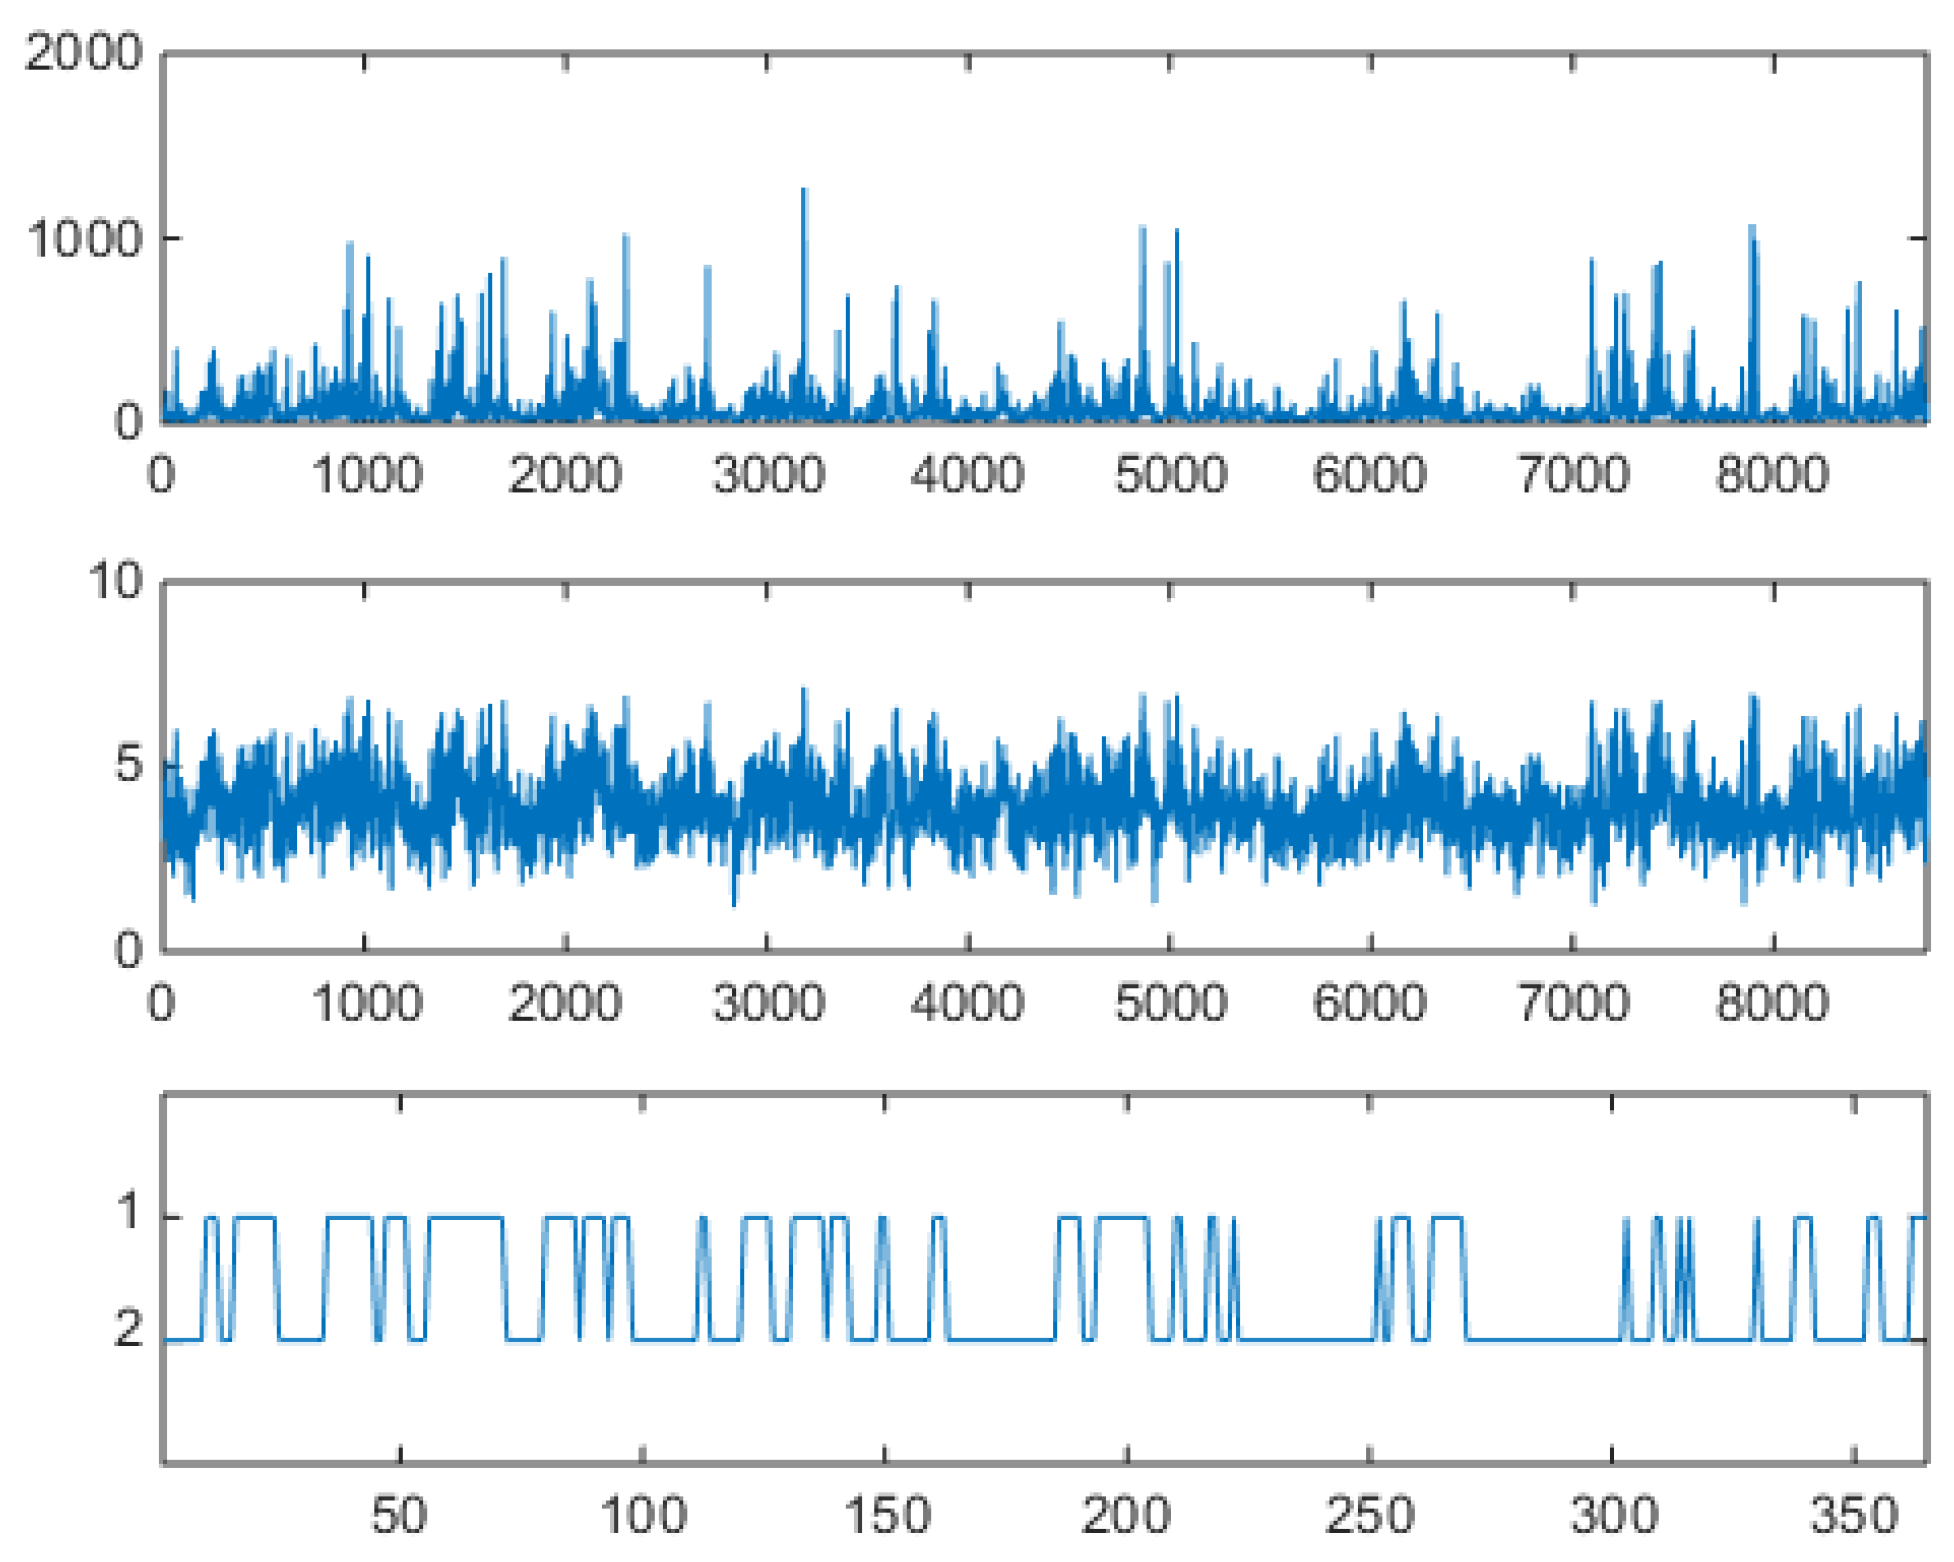
27) down to one of the two components. The obtained emissions (i.e., logprices and prices), organized in a hourly sequence, are shown in upper and middle panels of
Figure 19, to be compared both with
Figure 15 obtained with the shallow
VM and with the original series in
Figure 5.
The hourly series shows spikes and antispikes, but now spikes and antispikes appear in clusters of a given width. This behavior was not possible for the uncorrelated VM. The VHMM mechanism for spike clustering can be evaluated by looking at the lower panel of
Figure 19 where the daily sample dynamics
is shown in relation with the hourly logprice dynamics. Spiky, day-type market days are generated mostly when
. Look for example at the three spike clusters respectively centered at day 200, beginning at day 250, and beginning at day 300. Between day 200 and 250, and between day 250 and 300 night-type market days are mostly generated with
. Once in a spiky state, the system tends to remain in that state. Incidentally, notice that the lower panel of
Figure 19 is not a reconstruction of the hidden dynamics because when the generative model is used for synthetic series generation the sequence
is known and it is actually not hidden. It should also be noticed that the VHMM logprice generation mechanism is slightly different from the VM case for a further reason too. In the VM case, the relative frequency of spiky and not spiky components is directly controlled by the ratio of the two component weights. In the VHMM case each state supports a mixture of both components. The estimation creates two oppositely balanced mixtures, one mainly day-typed, the other mainly night-typed. The expected permanence time on the
state, given by
(i.e., by
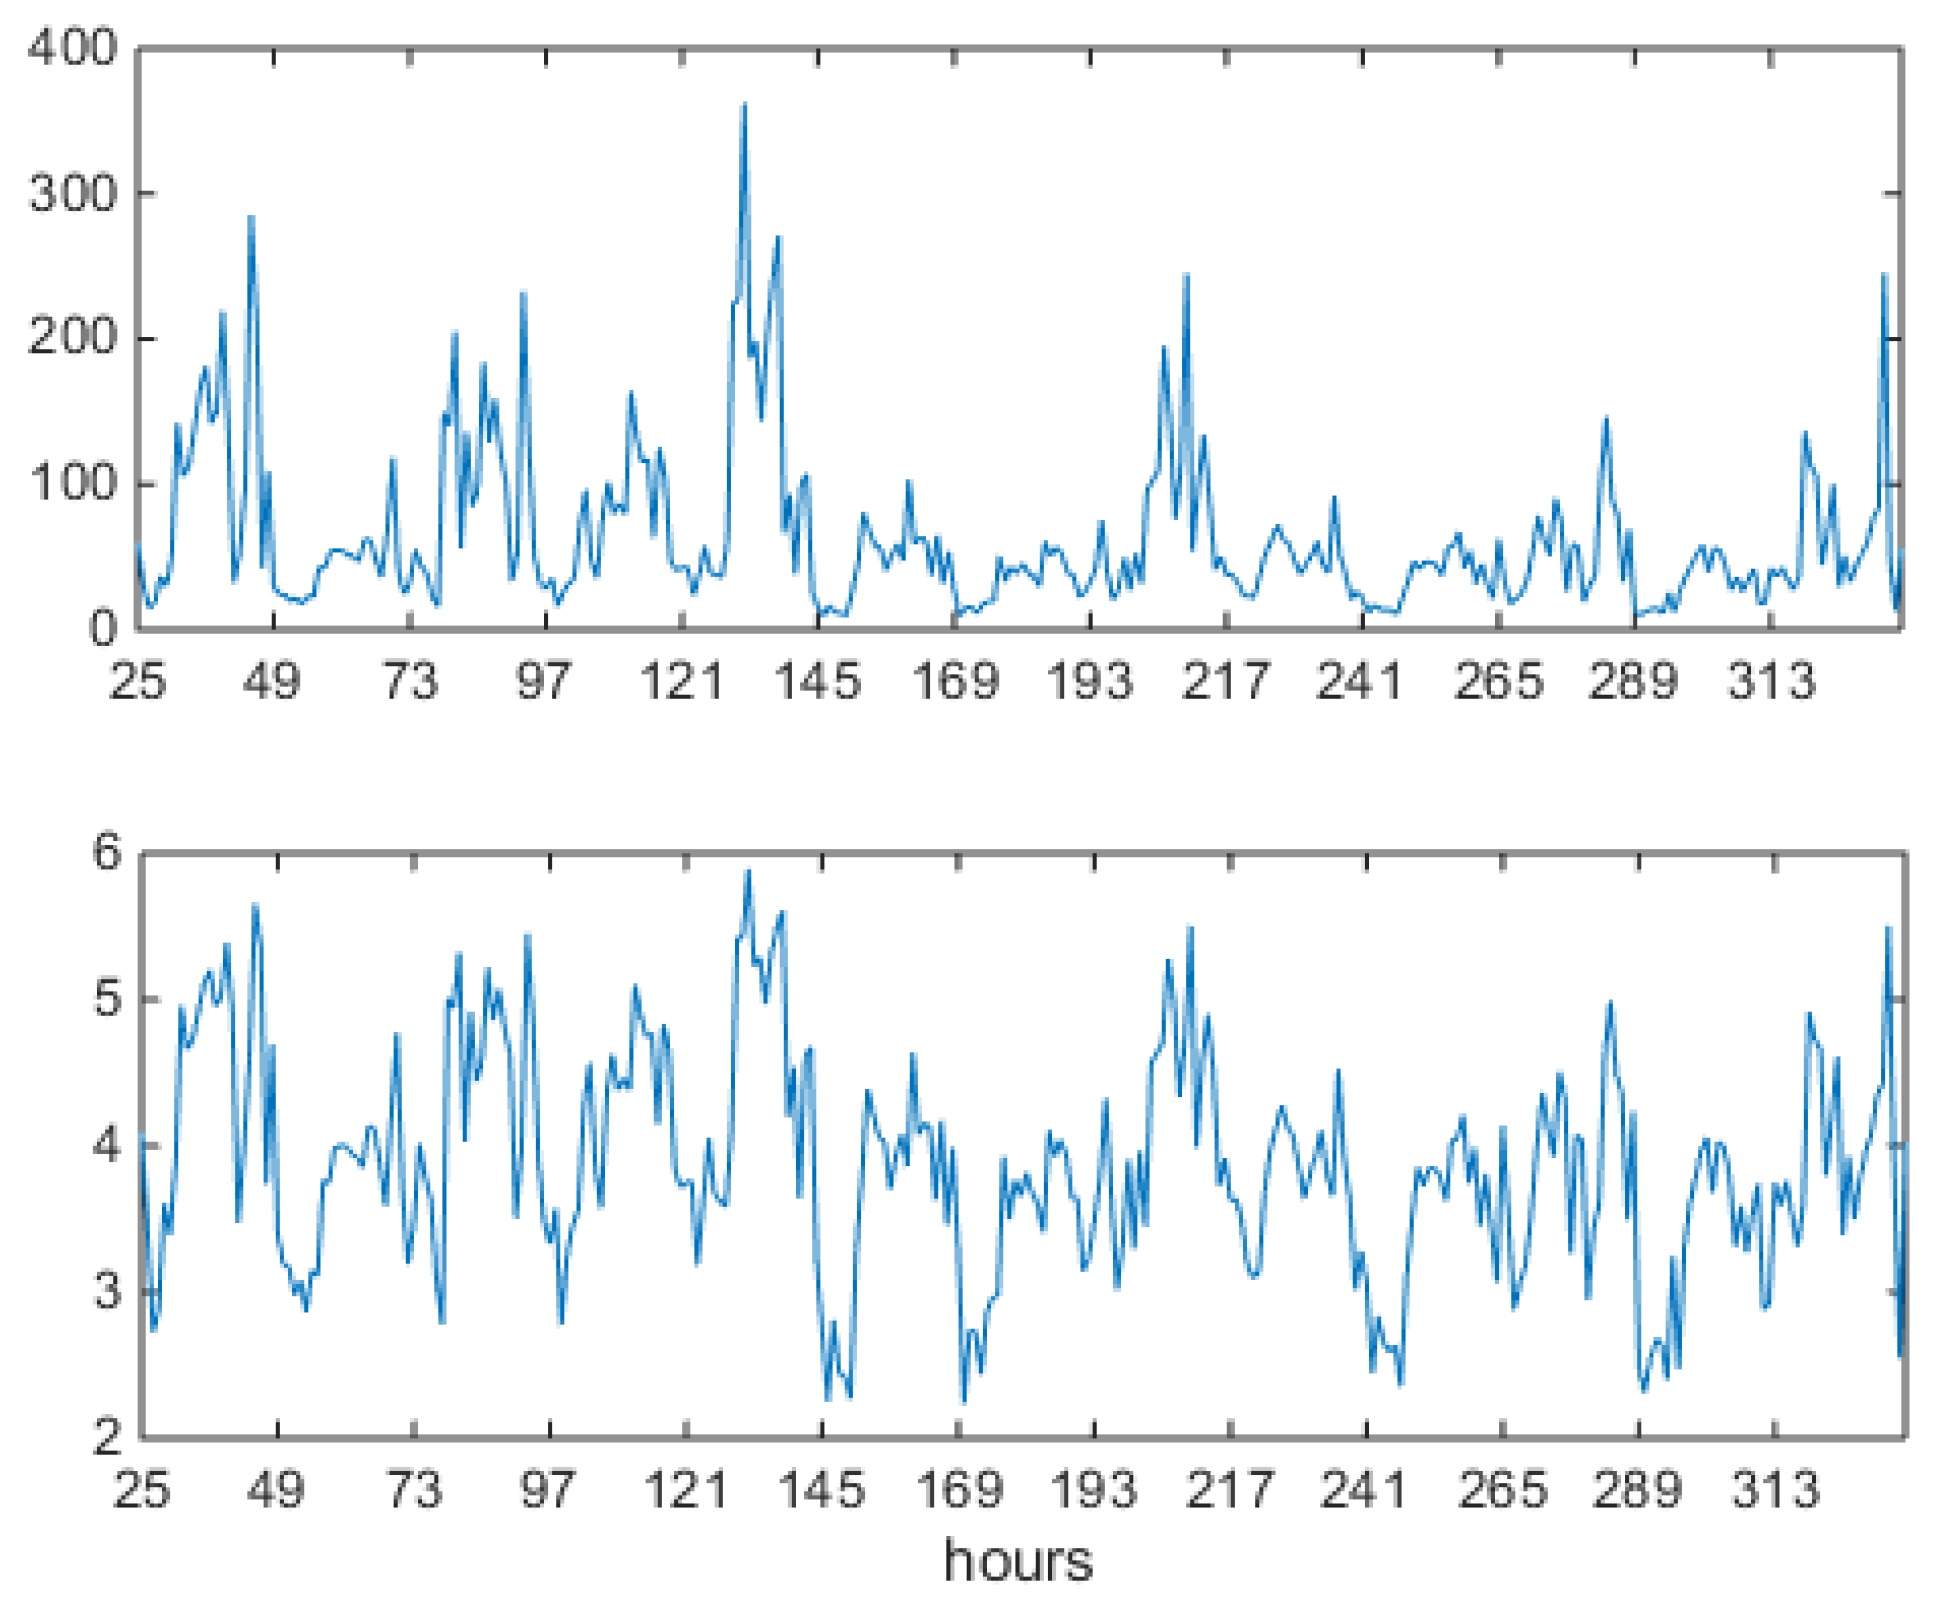
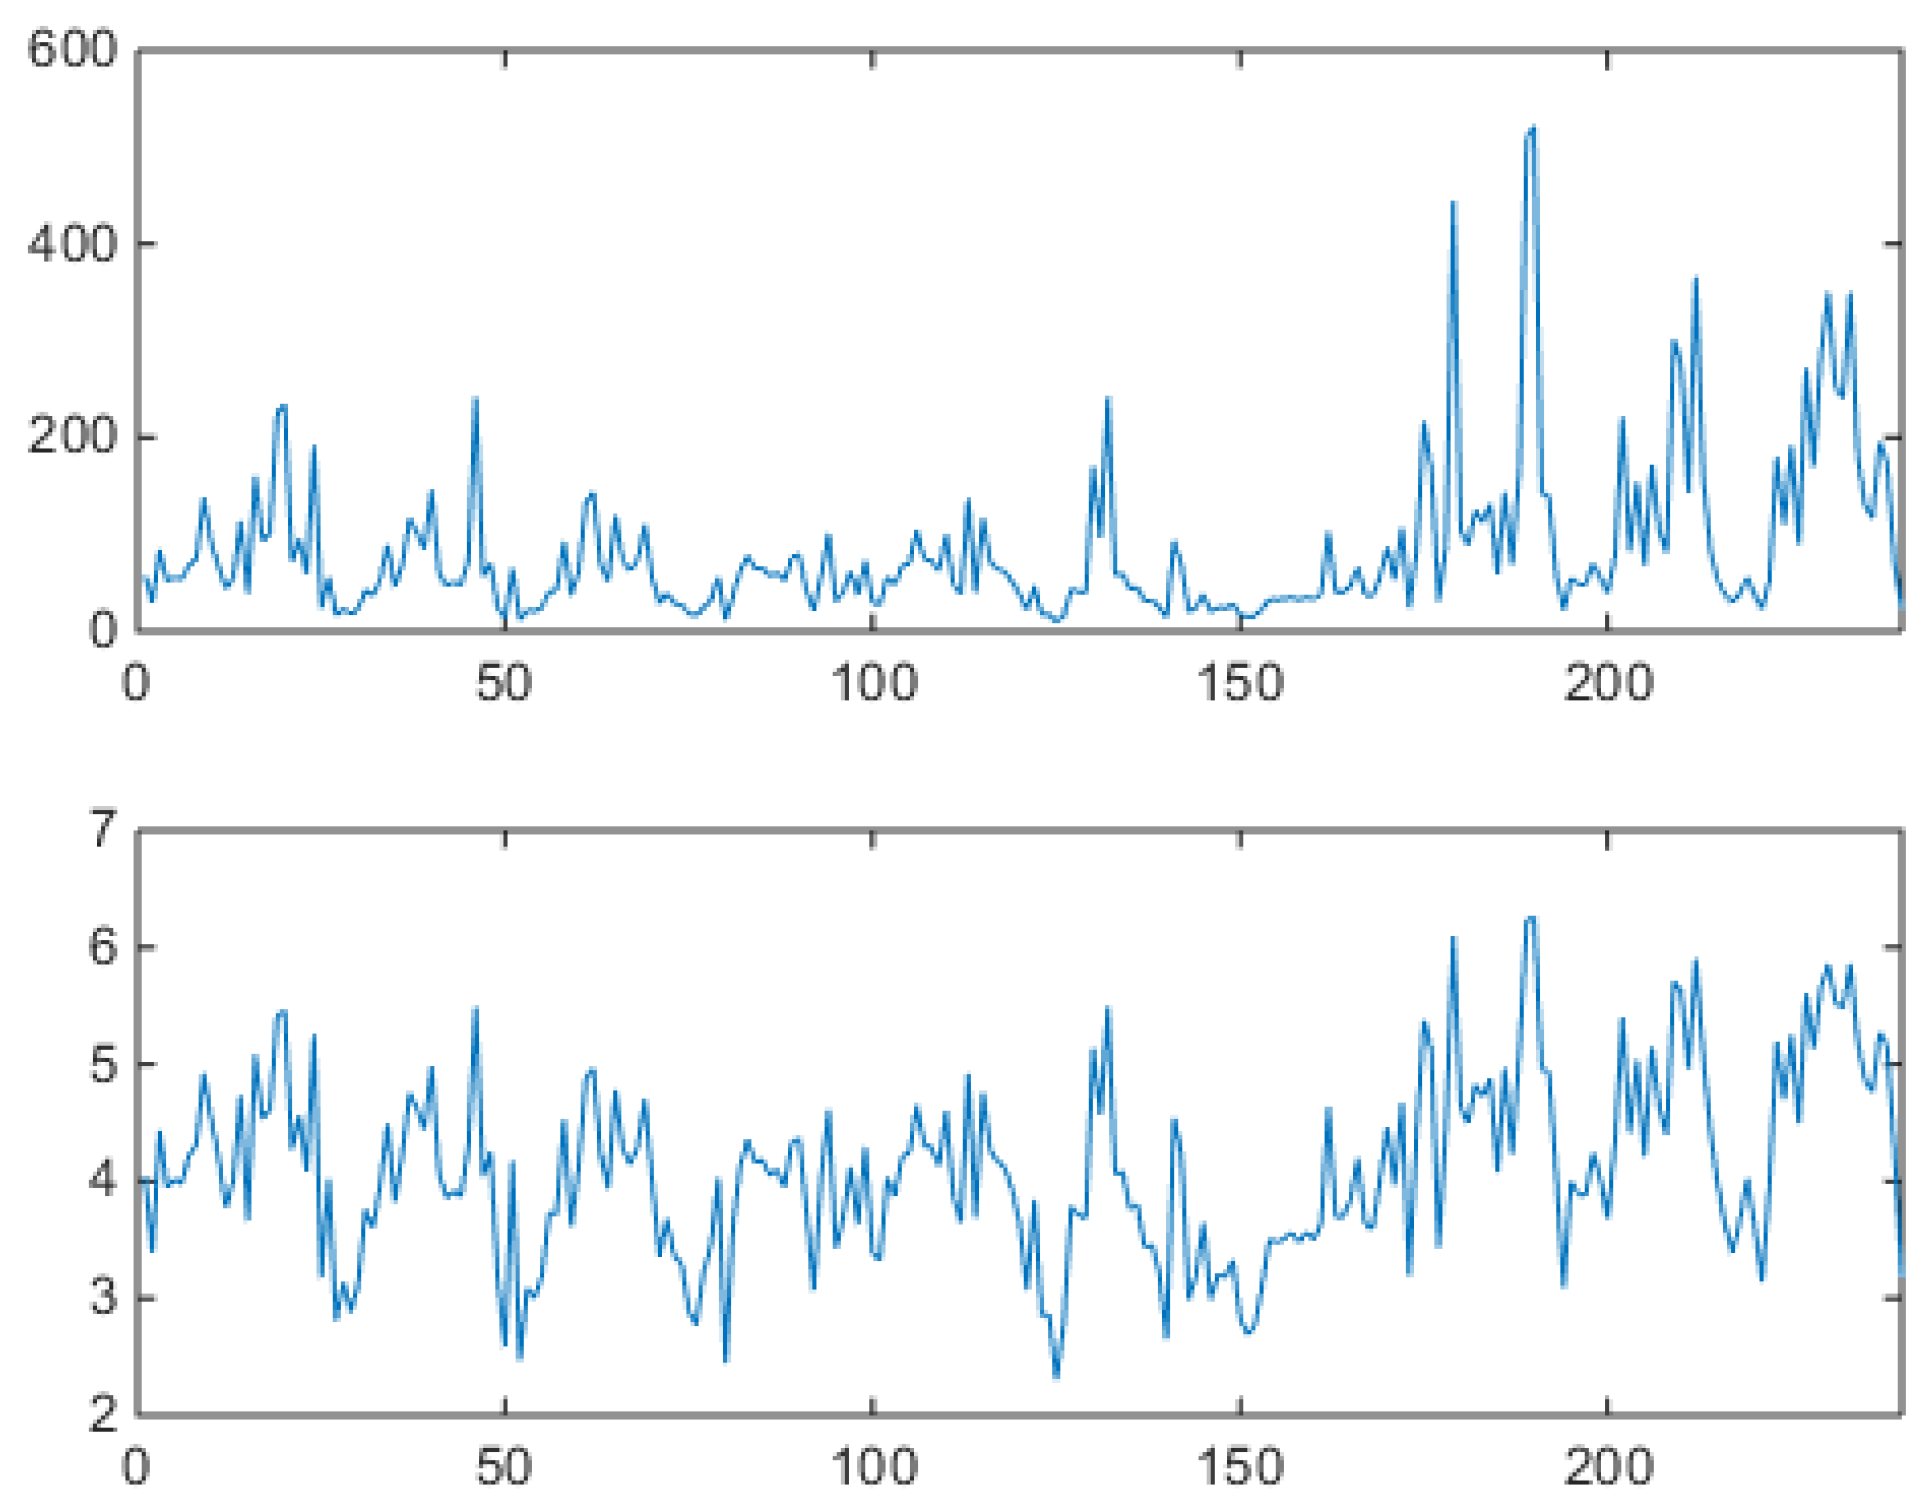
), controls the width of the spike clusters. A blowup of the sequence of synthetically generated hours is shown in
Figure 20, to be compared with the VM results in
Figure 15 and the original data in
Figure 6.
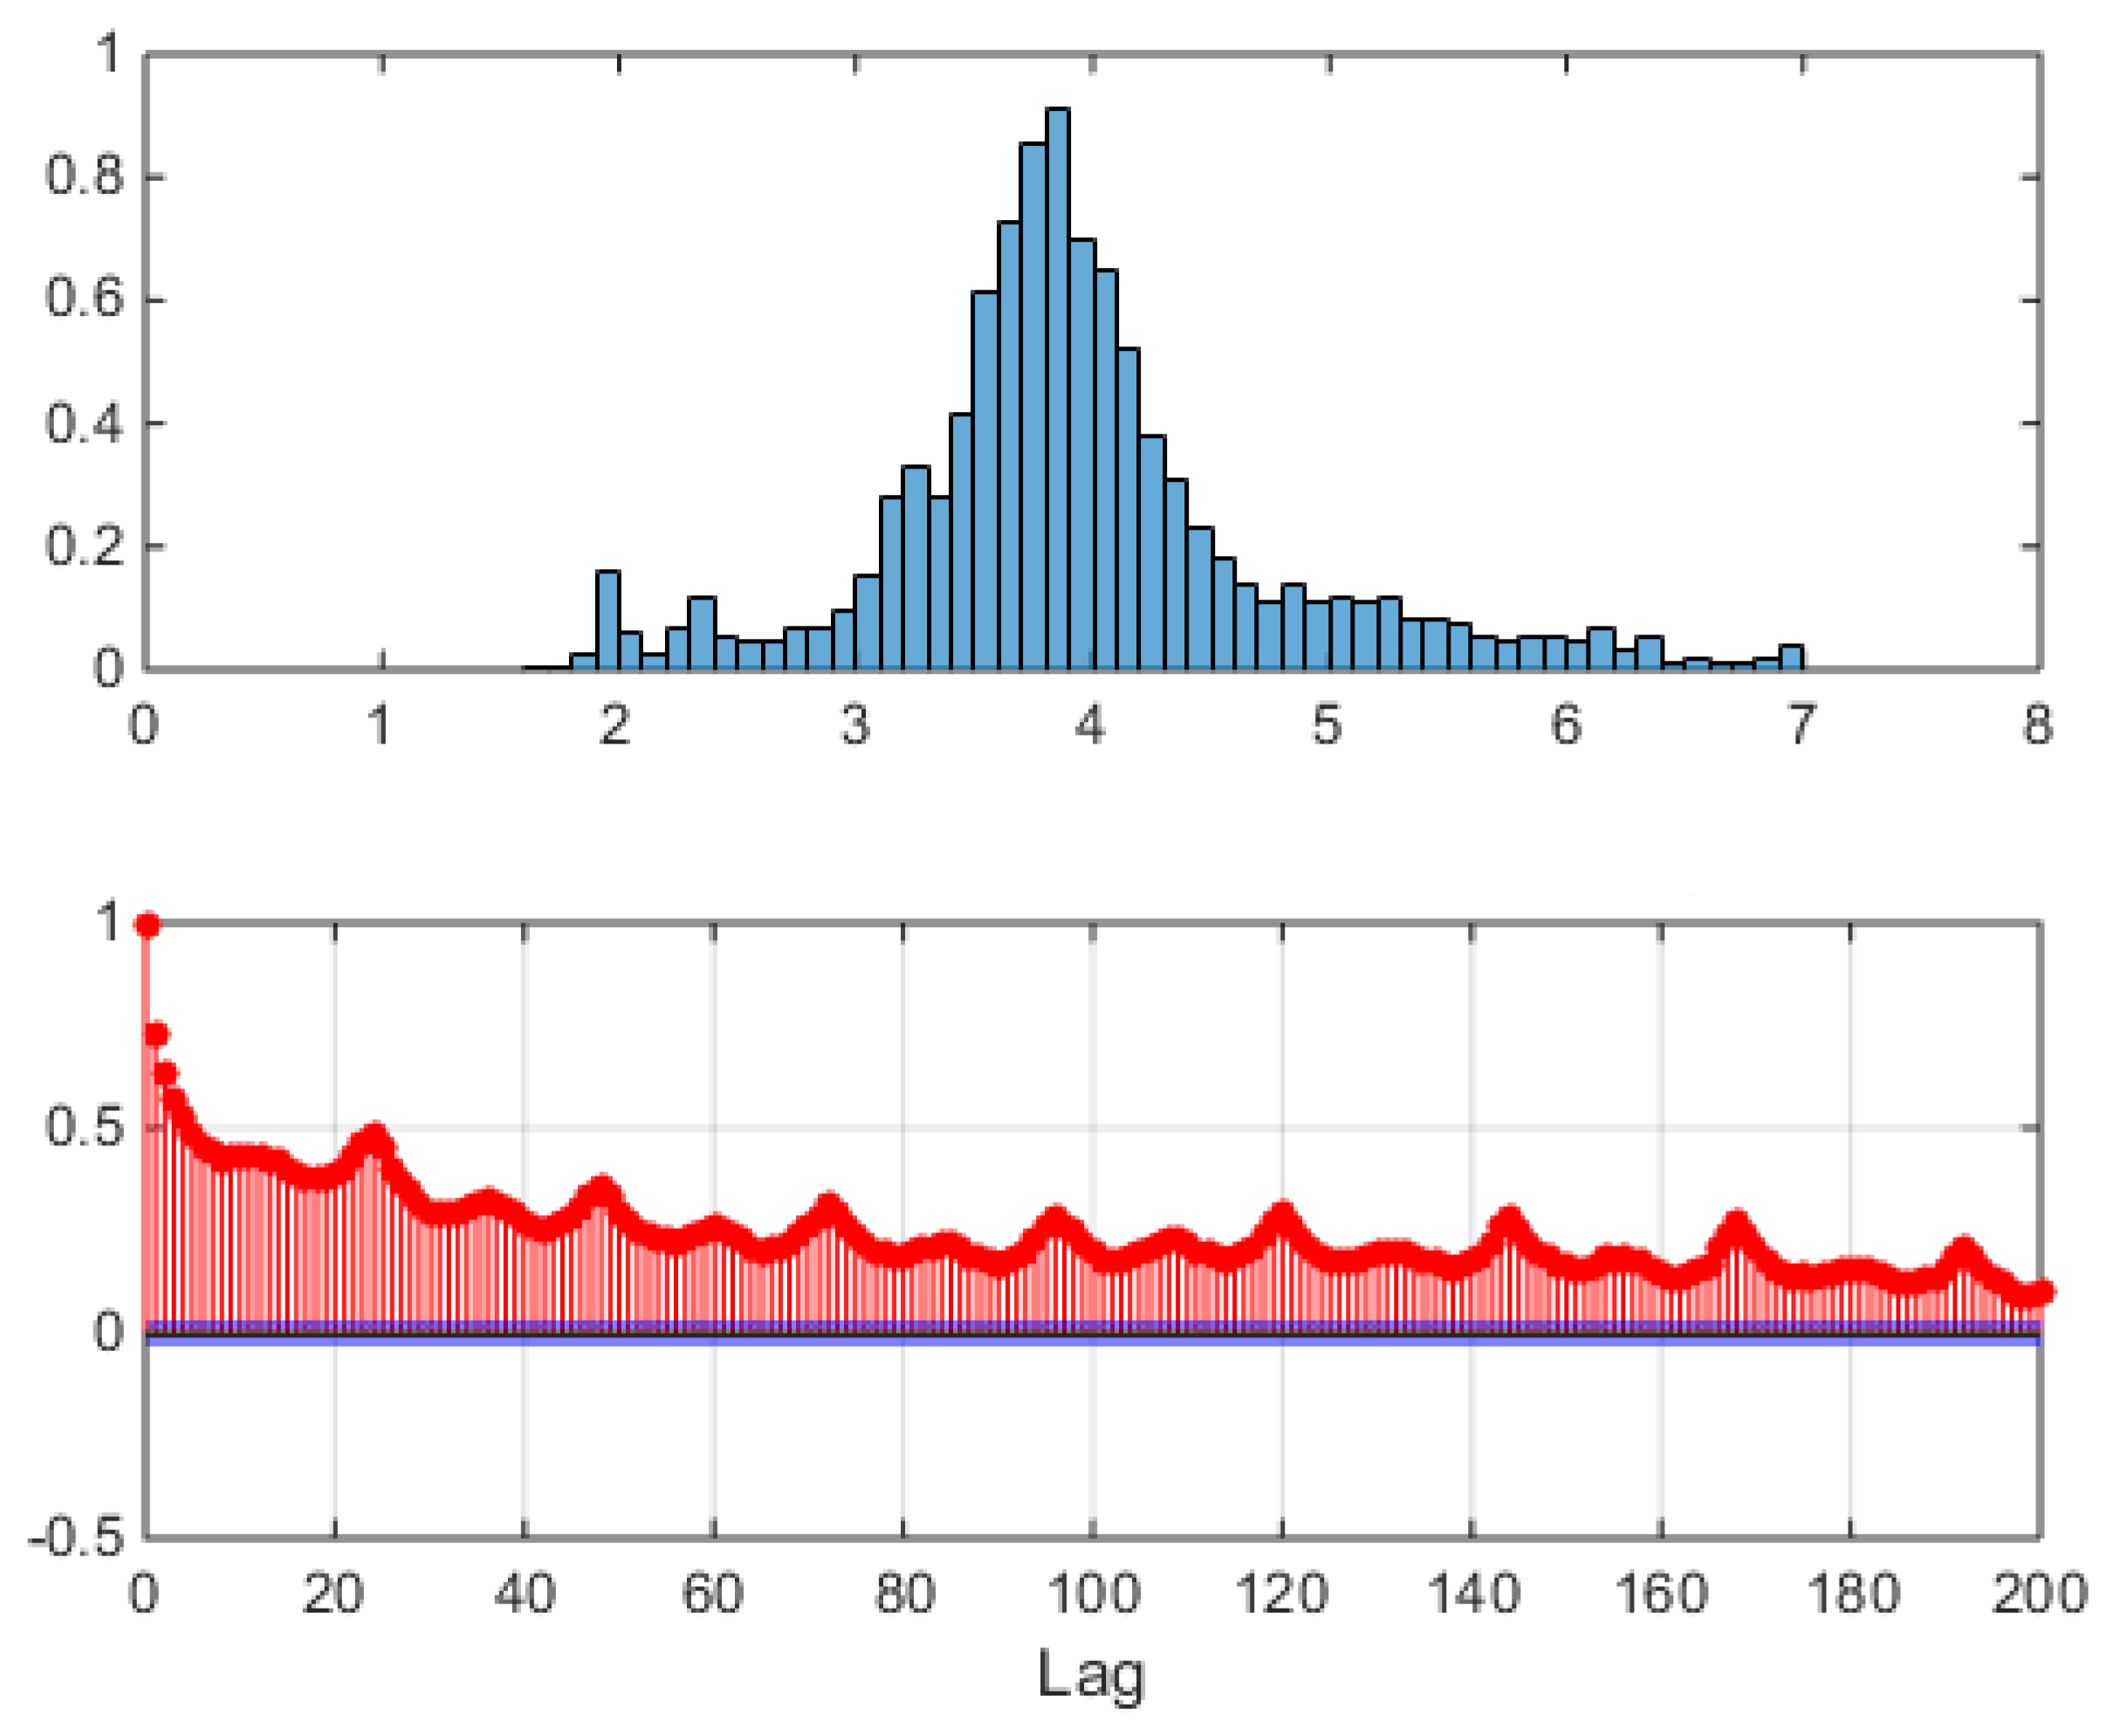
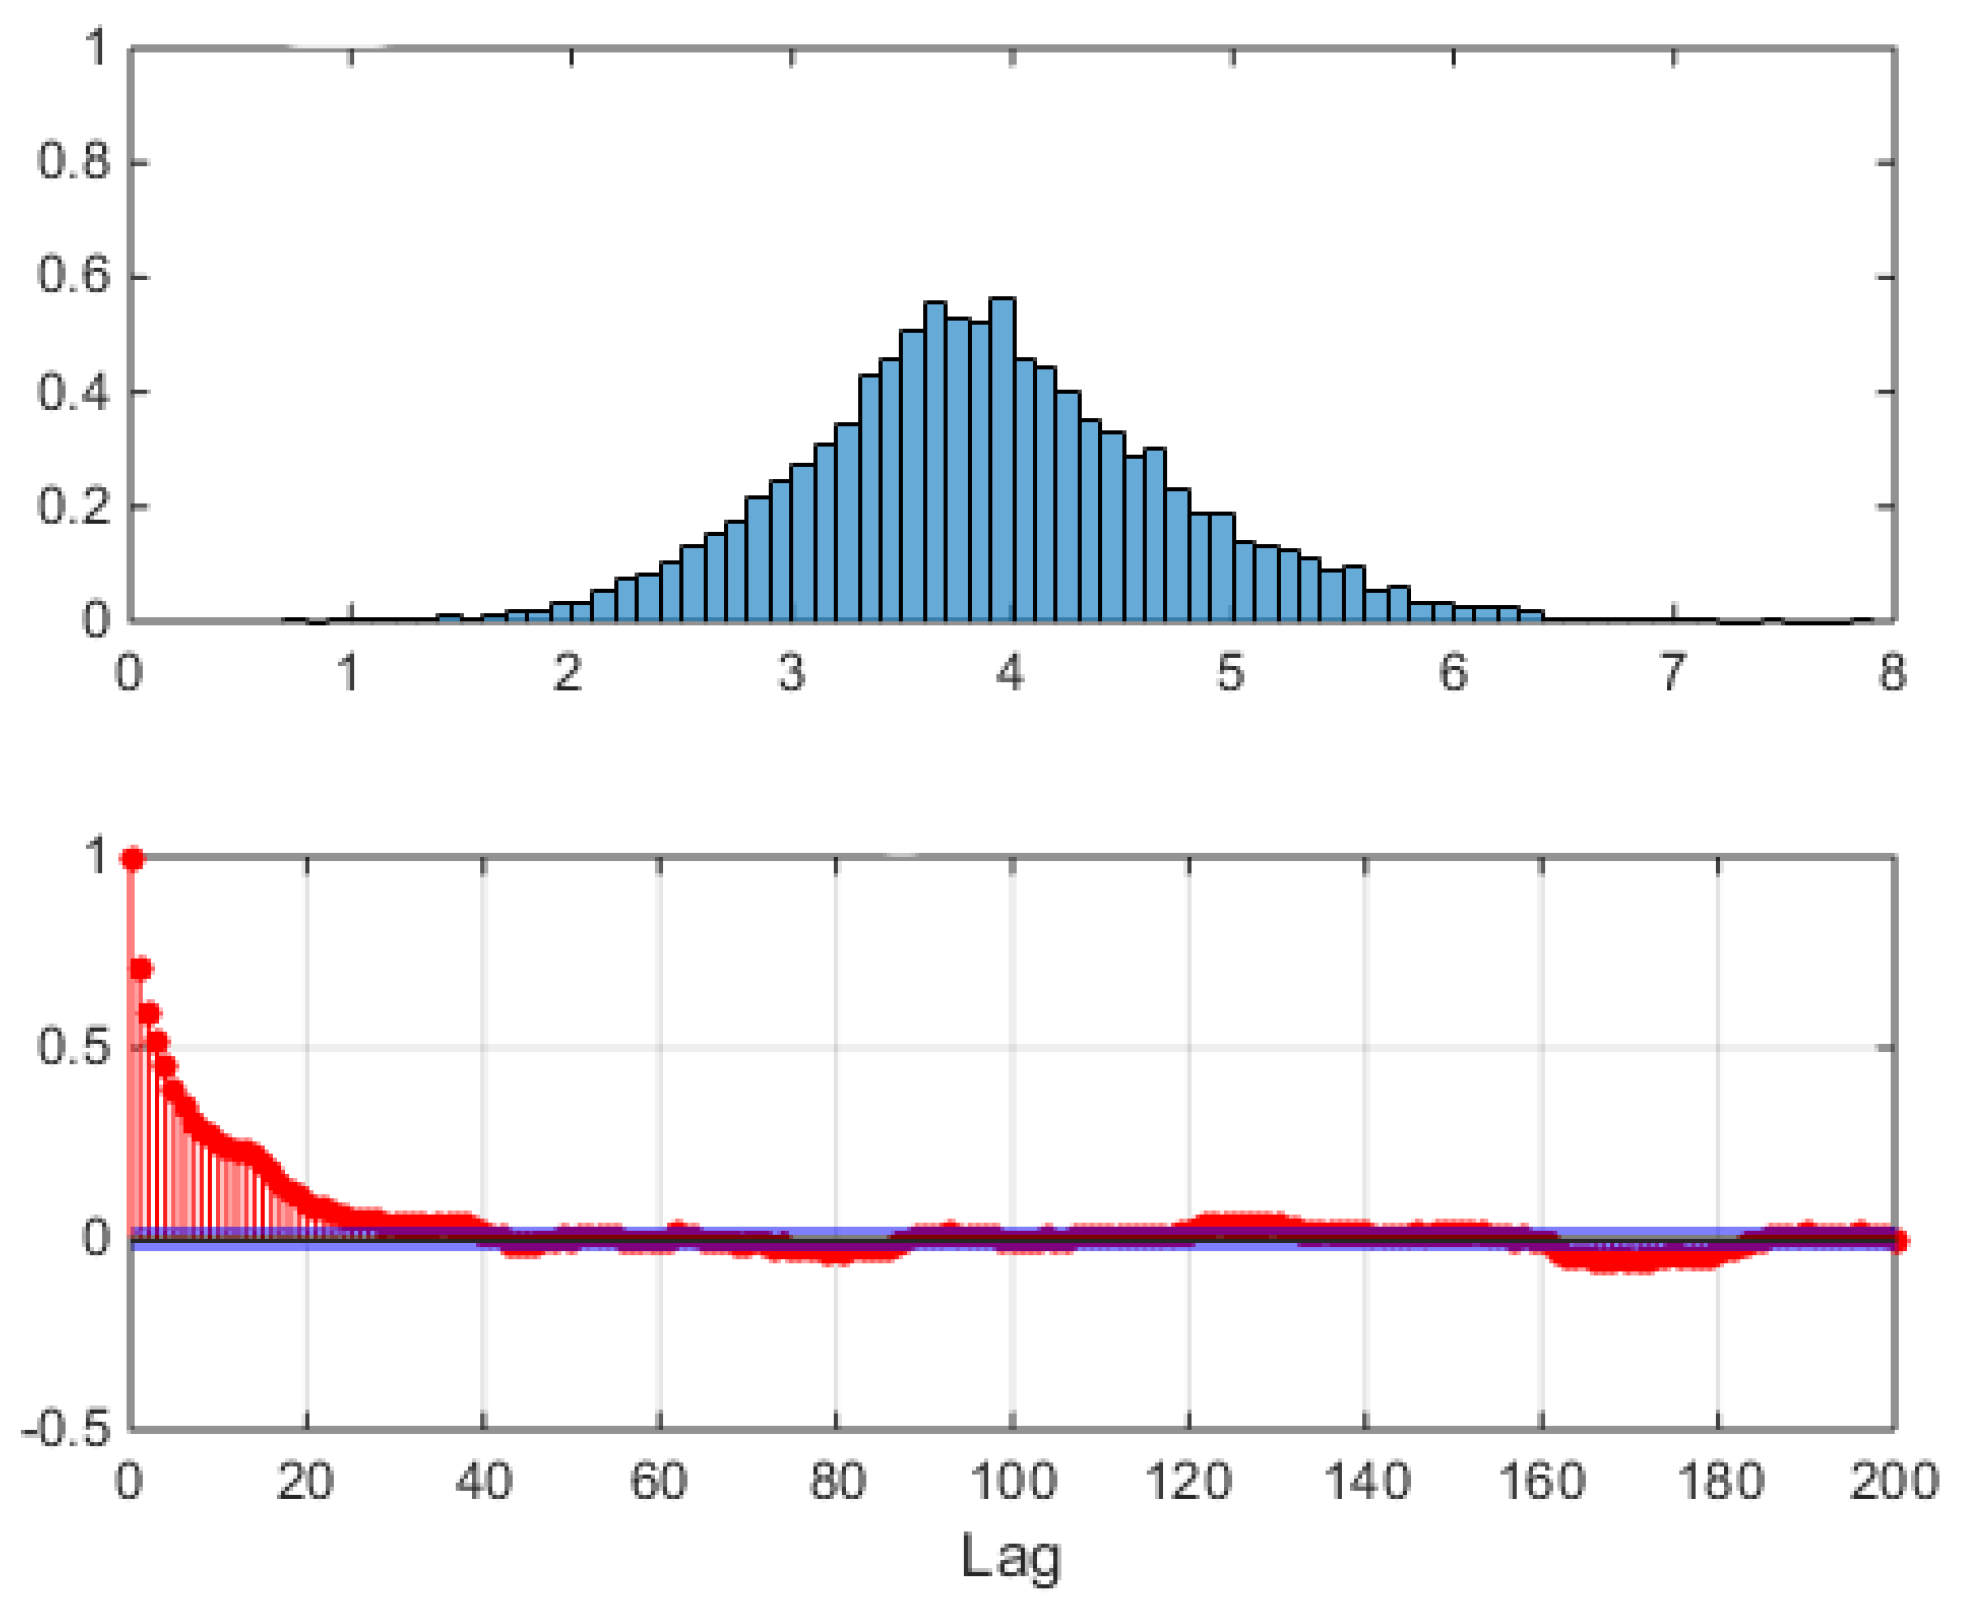
The aggregated, unconditional logprice sample distribution of all hours is shown in the upper panel of
Figure 21, where left and right thick tails remind the asymmetrically contributing spikes and antispikes, whose balance depends now not only on static weight coefficients but also on the type of the dynamics that
is able to generate.
In the lower panel of
Figure 21, the sample preprocessed correlation function is shown, obtained subtracting Equation (
33) from the hourly data, as in
Figure 17 (VM) and
Figure 7 (market data). Now the sample autocorrelation for the sample trajectory of
Figure 19 extends itself to hour 48, i.e., to 2 days, due to the interday memory mechanism. Not all generated trajectories will of course have this property, each trajectory being just a sample from the joint distribution of the model, which has peaks (high probability regions) and tails (low probability regions). An example of this varied behavior is shown in
Figure 22, where sample autocorrelation was computed on three different draws. The lag 1 effect is always possible, but it is not realized in all three samples, as can be seen in the lower panel of
Figure 22.
These results were discussed using machine learning terminology, but they could have been discussed using switching 0-lag autoregressions terminology as well.
As to probabilistic forecasting, these models must be improved. They are in a sense too much ‘rigid’. They use most of their parameters to to excellent featurization and structure extraction (think of the covariance structure), but they relay on statistical means only to do point forecasting. An example of a tight VHMM model out-of-sample forecasting quality can be seen in
Figure 23, where (makeshift) forecast errors aggregated over the 24 h, obtained from Equation (
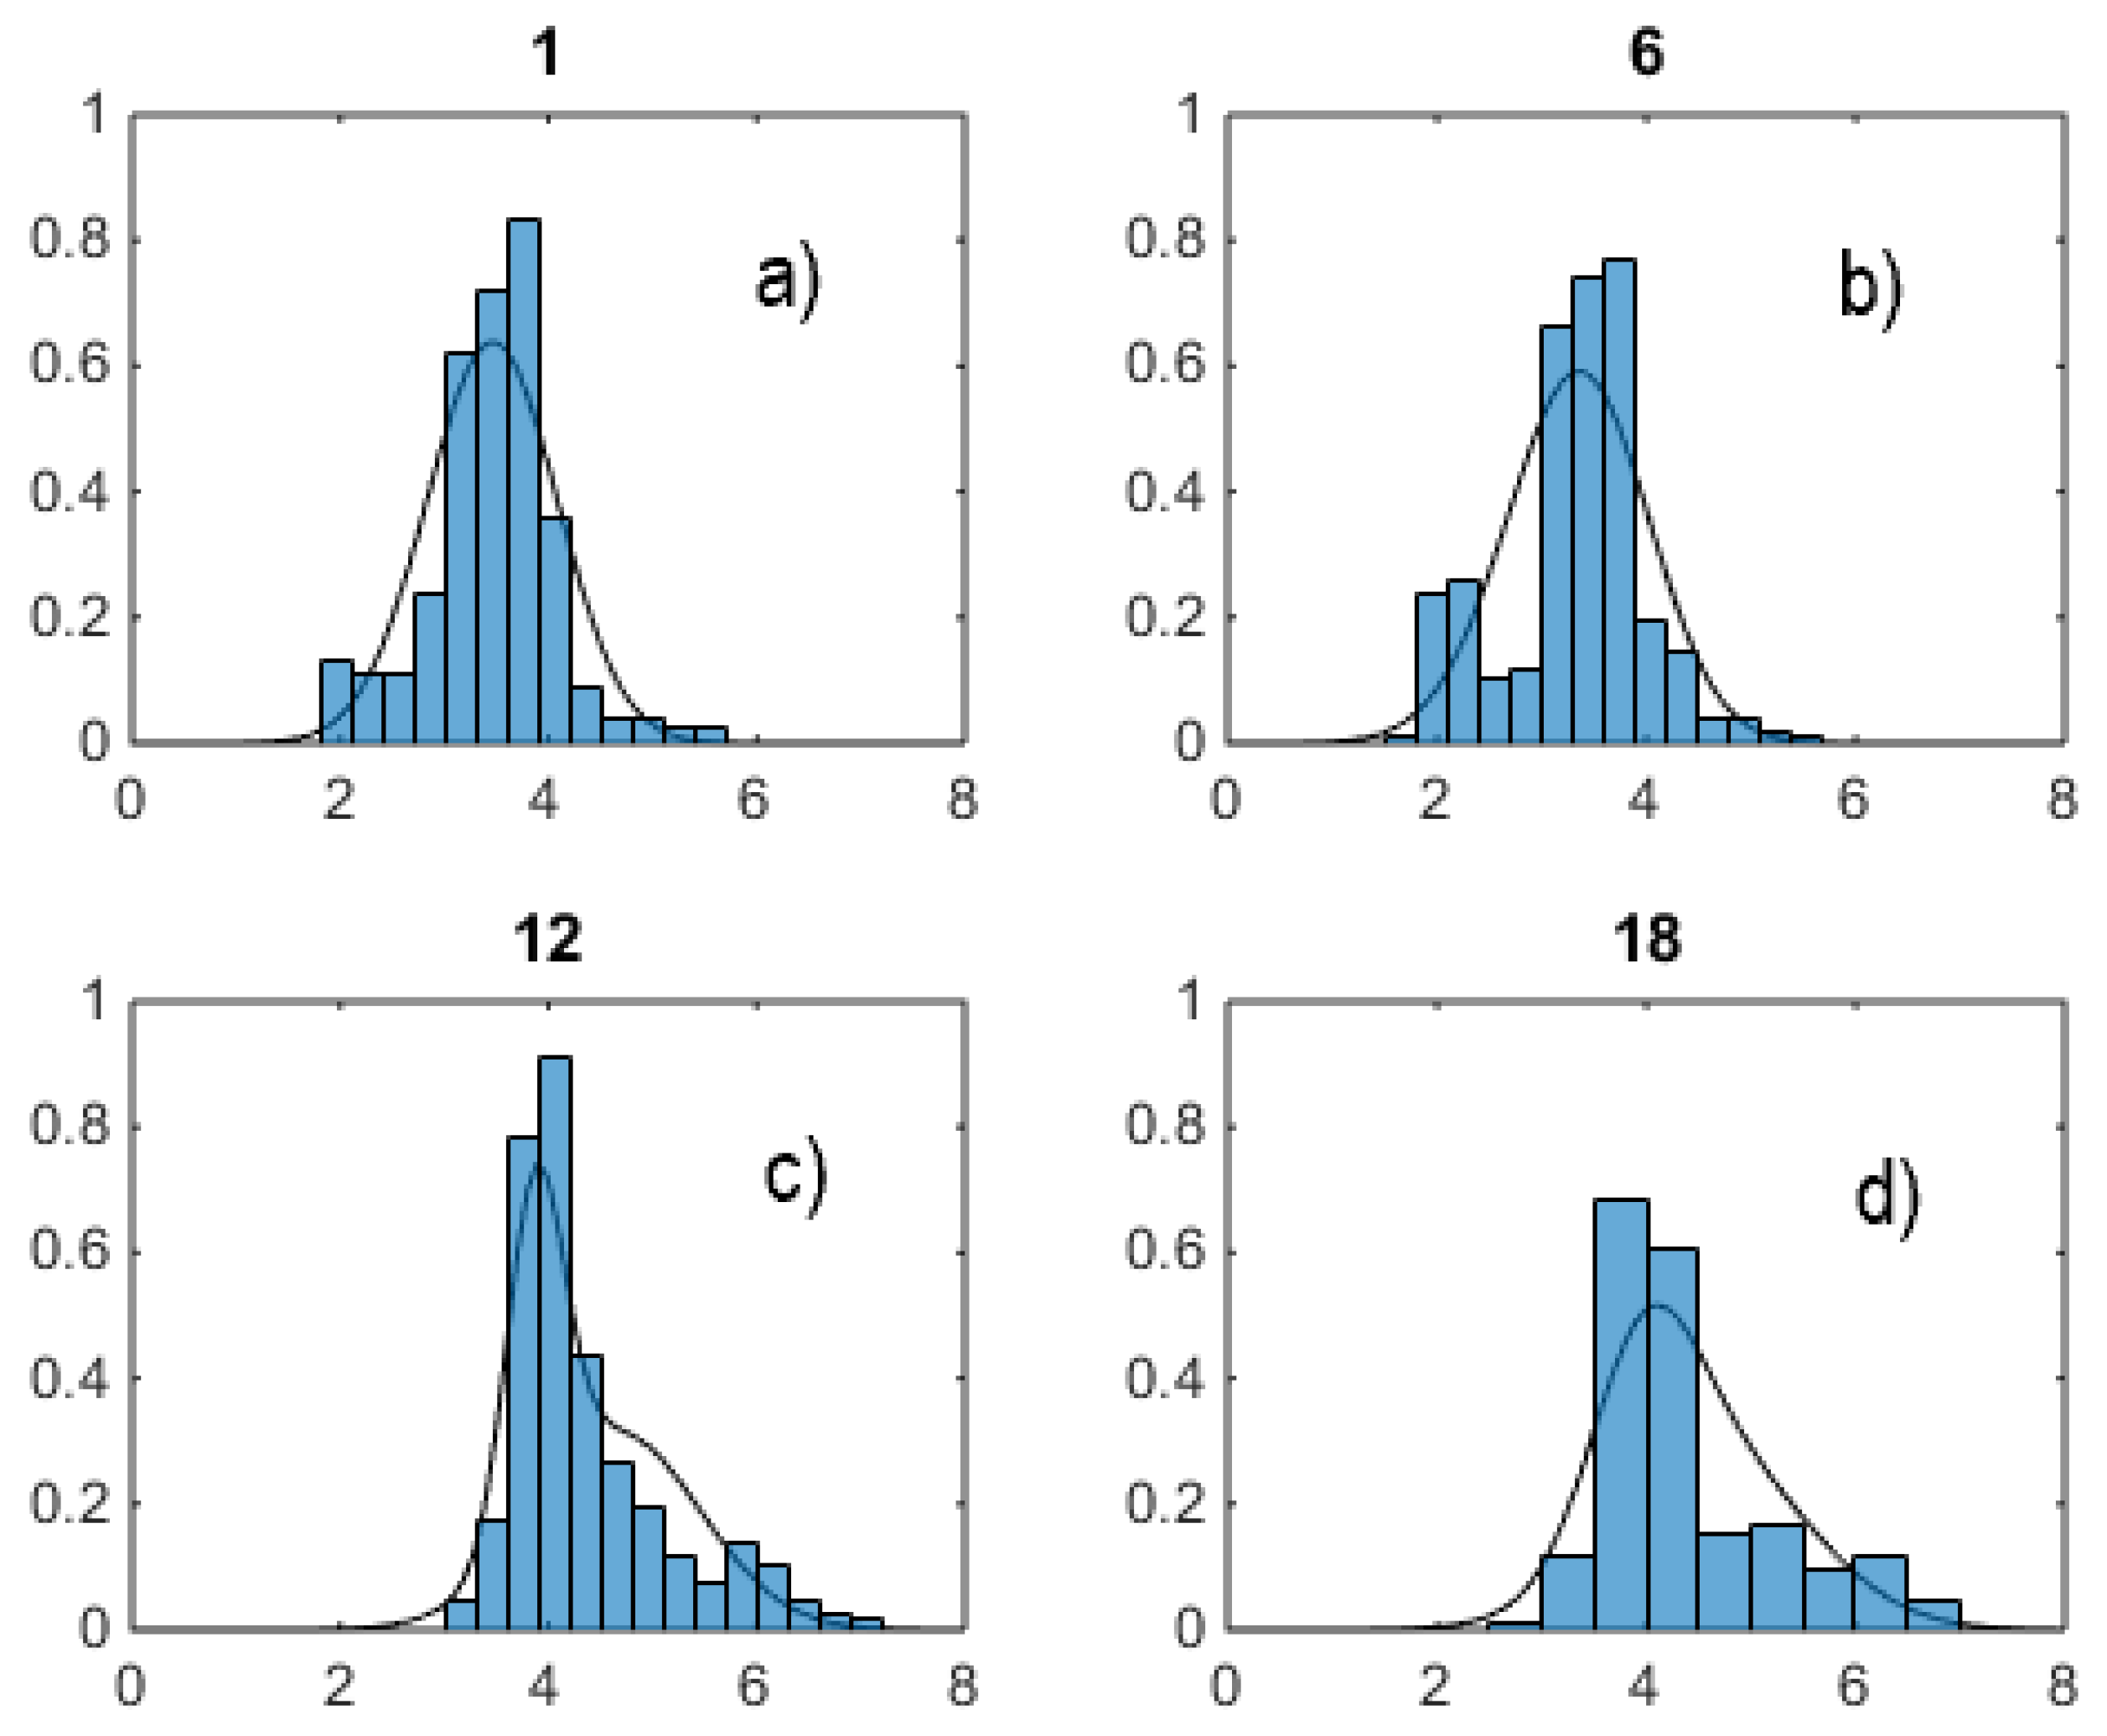
32) for the weekly two-component tied VHMM on logprices, are shown, computed on two distinct training and testing sets of equal length. In this plot, a week starting from Monday is used to forecast next Monday, for 50 weeks. In the figure, MAE stands for Mean Average Error, MAPE for Mean Absolute Percent Error, MSE for Mean Square Error, MSPE for Mean Square Percentage Error, all aggregated on the aggregated 24 h. Considering that the average hourly logprice is about 4 (this can be extracted by eye from
Figure 5), and that from the MAE plot one can estimate by eye that this MAE is about 20 so that the hourly MAE is about 1 (20/24 h), the hourly error is about one fourth of the ground truth, which is very high. In practice, this is the forecast quality that one gets form standard VAR error on a such complicated DAM time series. Forecasting is not a strong point of this kind of generative modeling. Generation it is.
7. Conclusions
As discussed so far, mixture-based models are usually approached by the econometrics and CI communities with two different formalisms, stochastic equations and purely probabilistic approaches. Hence, our proposed VM/VHMM family could misleadingly appear from these two perspectives as two different mathematical entities to the two communities. From a mathematical point of view it is not correct, and this paper has tried to reconcile these seemingly different points of view at least as to the proposed specific modeling frame, strictly linked to DAM price modeling. The VM/VHMM family is based on Gaussian mixtures and HMMs, the HMM being a very well known approach used in the last 60 years for generative purposes, and the mixture approach has been very often used
per se in practical situations [
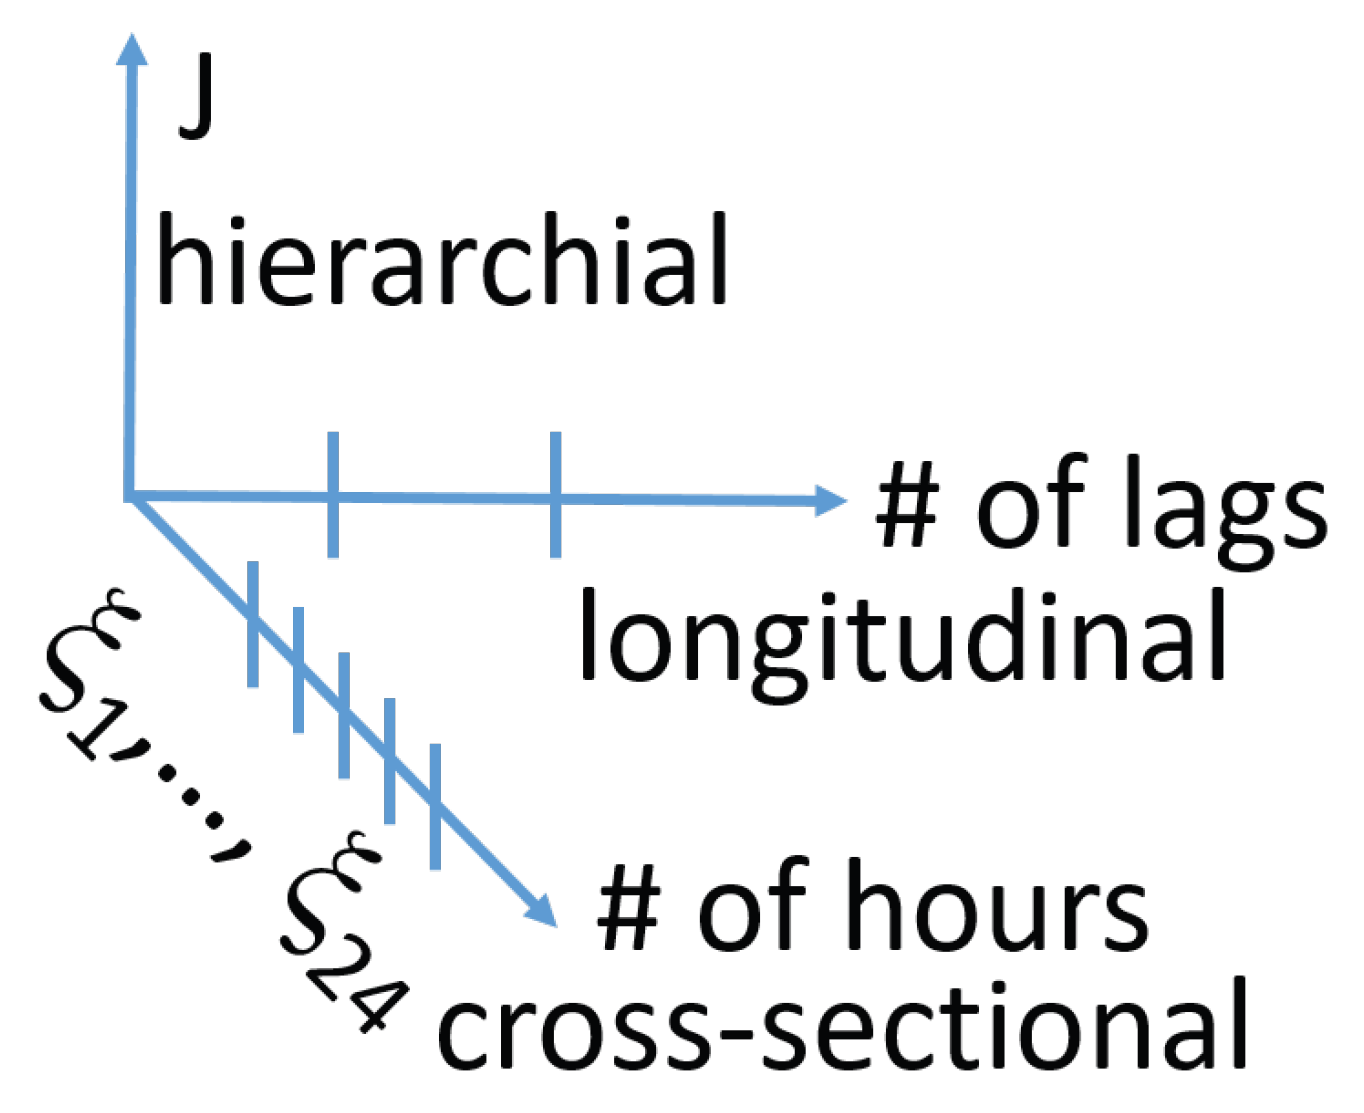
44]. In this paper, it was shown that the members of the VM probabilistic family correspond to the Gaussian regime switching 0-lag vector autoregressions of standard econometrics, studied there using a stochastic difference equations approach, and that the other generative models presented can be written as doubly stochastic dynamic equations in terms of latent variables. Actually, already at a first inspection VMs/VHMMs and regime switching autoregressions should suggest that they share some features. They are both based on latent variables, and are both intrinsically nonlinear. Moreover, it was shown that VMs/VHMMs too do exploit a ‘depth dimension’ which can be very useful for modeling important details of the data. This can now be summarized in the sketch proposed in
Figure 24, where it is depicted the ‘spatio’-temporal structure of a VHMM seen as a deep machine learning model. In the figure,
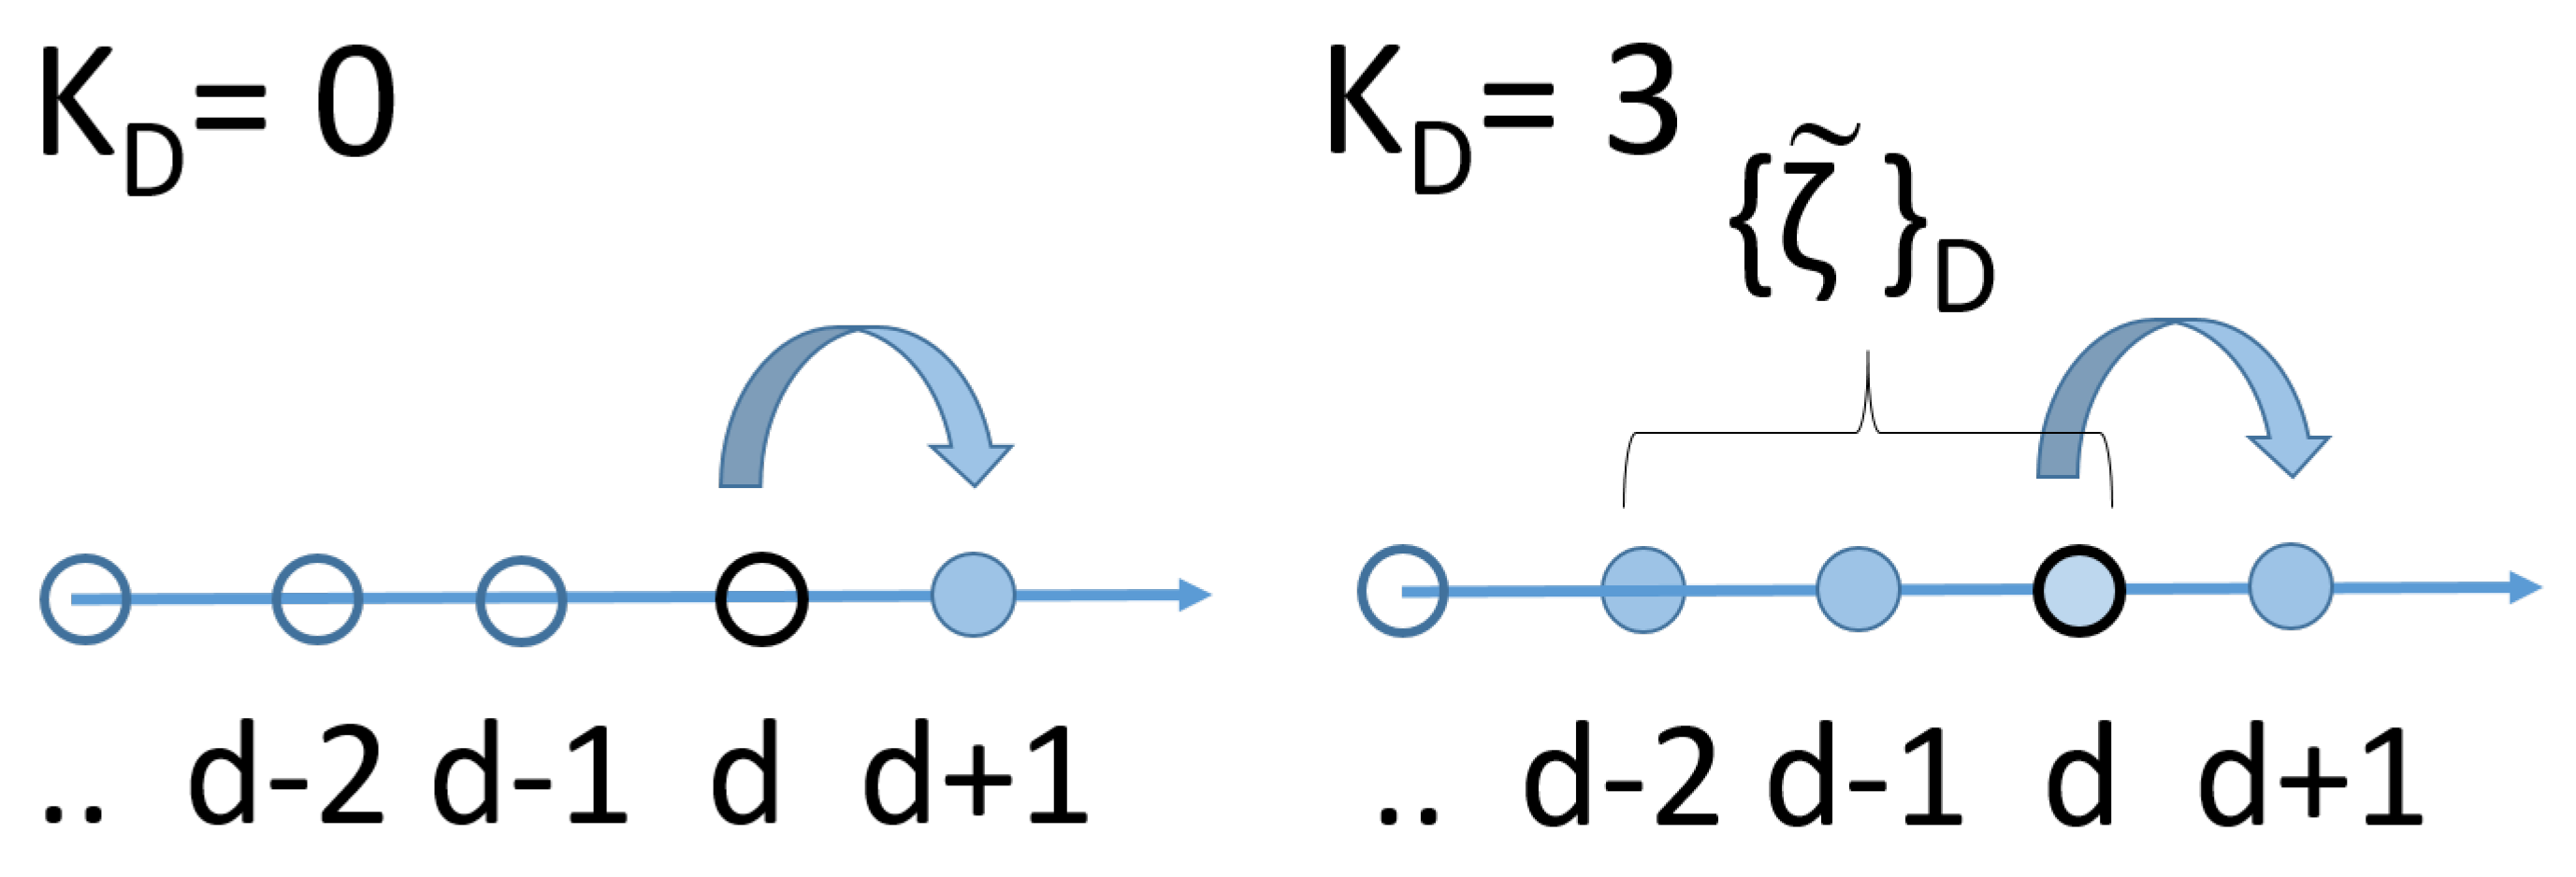
J is the model ‘depth’ indicated in the vertical axis. On the bottom axis it is shown the 24 h of the day related to the 24 components of each vector (a point) of the series dataset, on the horizontal axis the number of time lags used in a given model. As discussed, this means 0 lags for VMs, and 1 lag only for VHMMs, by contruction. This sketch thus also highlights the limits of the VHMM approach: the time memory is very limited.
It is true that, being vector models, both VM and VHMM models can remove fake memory effects from hourly time series by directly modeling them as vector series. However, as seen in the autocorrelation plots, such HMM-based modeling cannot include more than some day in the generated series. Higher order (in time) HMMs do exist, but are very hard to implement. In addition, the discussions about their forecasting ability showed that they can indeed be used as forecasters, but their quality in this capacity is for sure not excellent. This is linked to a certain rigidity with which they forecast. These two weaknesses can be overcome with more research in these directions.
Yet, these model encapsulate common useful properties of mixtures that are usually ascribed to the machine learning side only, but not usually exploited in dynamical models. For example, it was shown that because VMs and VHMMs can do unsupervised deep learning (which however current deep learning models usually do not do), they can automatically organize time series information in a hierarchical and transparent way, which for DAMs lends itself to direct market interpretation. Being VM and VHMM models generative, the synthetic series which they produce are outstanding, and automatically include many of the features and fine details present in time series, in the specific of a very complex time series like that of Alberta DAM prices. These model features could be incorporated in more advanced, deep machine learning models.
Interestingly, VMs and VHMMs have also features shared with regime switching 0-lag vector autoregressions, which usually are not liked by econometricians. Being generative models, they are fit directly as distributions, and they are not based on errors (i.e., innovations) unlike non-zero lag autoregressions and other discriminative models for time series [
45,
46], so that cross-validation, residual analysis and direct comparison with standard autoregressions is not straightforward. Moreover, being generative and based on hidden states, the way they forecast is different from usual non-zero lag autoregression forecasting. This dislike comes maybe from the culture split, and goes at detriment of research.
This paper thus shows that it can be interesting and useful to work out in detail these common properties hidden behind the two different formalisms adopted by the two communities. It can hence be also interesting to try to better understand how these common properties can be profitably used in DAM prices scenario generation and analysis when developing more sophisticated models.
Finally, one should consider that in DAM price forecasting, linear autoregressions have been always easily interpreted, whereas neural networks started out as very effective but a ‘black box’ type of tools. However, linear autoregressions are in general bad at reproducing fine details of DAM data (like big spikes or ‘fountains’ of spikes). The vector hierarchical hidden Markov mixtures discussed in this paper are on the contrary excellent at that. They are thus probably a seeding example of an intermediate class of models that are both accurate in dealing with data fine details, easy to interpret, not complex at all, sporting a very low number of parameters, and palatable for both communities. It is also hoped that this approach will lead to a more nuanced understanding of price formation dynamics through latent regime identification, while maintaining interpretability and tractability, which are two essential properties for deployment in real-world energy applications.
